 Ewelina T. Rubin
 Shu Cheng
 Amanda L. Montalbano
 Susanne Menden-Deuer
 Tatiana A. Rynearson
- Graduate School of Oceanography, The University of Rhode Island, Kingston, RI, United States
Grazing by heterotrophic protists influences plankton population dynamics, community composition, and the flux of carbon through marine planktonic food webs. To gain insight into the molecular underpinnings of grazing in dinoflagellates, a group of important heterotrophic protists, we used a RNA-Seq approach to investigate the transcriptomic response of Oxyrrhis marina under fed and starved conditions with three different phytoplankton prey (Isochrysis galbana and two strains of Heterosigma akashiwo). In response to fed and starved conditions, 1,576 transcripts were significantly differentially expressed in O. marina. Fed O. marina cells upregulated transcripts involved in the synthesis of essential fatty acids and storage carbohydrates suggesting that the predator was food satiated and excess glucose was being stored as an energy reserve. Transcripts encoding voltage-gated ion channels were also upregulated during grazing, and they are known to be involved in the detection of mechanical stimuli and the regulation of swimming behavior in several eukaryotic protists. Fed O. marina cells upregulated kinases, which can dictate cell shape changes and may be associated with phagocytosis. During starvation, upregulated O. marina transcripts included those involved in the degradation of energy-storage molecules like glucan 1,4-alpha-glycosidase and those involved in antioxidant activities and autophagy, like acid ceramidase that are associated with the digestion of polar lipids present in cell membranes. Starved O. marina also upregulated transcripts with high similarity to proton pumping proteorhodopsins suggesting that this heterotrophic protist may supplement its energy requirement during starvation with a light harvesting mechanism. Although herbivorous grazing is a pivotal transformation in the C cycle, logistical constraints limit our investigations of environmental and biological drivers. The molecular signals identified here provide new insights into the metabolic regulation of feeding and starvation in marine heterotrophic protists and can fuel hypothesis-driven research into predators’ metabolic response to prey availability.
Introduction
Grazing by unicellular eukaryotic herbivorous marine plankton (i.e., microzooplankton, heterotrophic protists) on phytoplankton constitutes the single largest loss process of primary production in the marine environment and is important in mediating plankton population dynamics and community composition, and ultimately the flow of energy and material throughout marine planktonic food webs (Tillmann, 2004; Schmoker et al., 2013; Weisse et al., 2016). Heterotrophic protists are the main consumers of marine phytoplankton biomass, consuming on average over 60% of daily phytoplankton production (Calbet and Landry, 2004). Moreover, these herbivores are important prey for larger zooplankton and thus serve as important trophic links in marine food webs (Calbet and Saiz, 2005; Campbell et al., 2009; Löder et al., 2011). The population dynamics of marine plankton are disproportionately affected by heterotrophic protists, because these predators have growth rates that can equal or exceed the growth rates of their phytoplankton prey (Hansen et al., 1997). As a result, heterotrophic protists can influence biogeochemically and ecologically significant events, such as slowing or preventing the formation of phytoplankton blooms (Sherr and Sherr, 2009) including blooms formed by harmful and toxic phytoplankton (Jeong et al., 2003; Harvey and Menden-Deuer, 2012). Despite the key importance of heterotrophic protists in marine food webs and global biogeochemical processes, considerable knowledge gaps persist in understanding the metabolic processes involved in protistan herbivory.
The feeding process of heterotrophic protists involves physiologically and metabolically complex mechanisms, including chemical and mechanical perception involved in prey selection and capture, as well as ingestion and digestion (Montagnes et al., 2008). Chemical recognition and prey selectivity are important steps in the feeding process (Roberts et al., 2011) and some of the key receptors involved in that process have been identified (Roberts et al., 2006; Hartz et al., 2008). In addition, light is thought to be involved in maintaining circadian cycles of the feeding process (Jakobsen and Strom, 2004) and enhance digestion rates (Strom, 2002). Some heterotrophic species have also been shown to have unique starvation capacities, with dinoflagellates able to survive starvation for weeks at a time (Strom, 2002; Menden-Deuer et al., 2005; Calbet et al., 2013; Anderson and Menden-Deuer, 2017).
The metabolic responses of heterotrophic protists to food availability are relatively unknown and most molecular studies have focused on examining gene content. For example, transcriptomes of the heterotrophic dinoflagellate Oxyrrhis marina revealed extensive gene redundancy, evidence of lateral gene transfer, and functional gene annotations similar to eukaryotic protists, including other dinoflagellates (Lowe et al., 2011; Lee et al., 2014). Genes potentially involved in predation, such as phagotrophy, were not identified likely because the predators were maintained on dissolved organic matter instead of prey cells. Interestingly, a comparison of gene content in a mixotrophic alga and a heterotroph (both ciliates) did not reveal significant differences in gene content in relation to trophic mode (Santoferrara et al., 2014). One study that examined differentially expressed genes and thus potential metabolic differences in feeding status focused on a mixotrophic alga either feeding on prey or photosynthesizing (Liu et al., 2015). Differentially expressed genes in that study were associated primarily with prey-derived nutrient uptake, such as iron from bacterial prey and organic nitrogen from ciliate prey.
Here we used a metatranscriptome approach (simultaneous sequencing of predator and prey transcriptomes) to examine the metabolic responses of a heterotrophic protist to feeding and starvation treatments. We conducted a set of feeding and starvation experiments followed by transcriptome analyses of metabolic changes in a heterotrophic protist fed different phytoplankton species and strains followed by starvation. We selected the marine heterotrophic dinoflagellate O. marina because it has a wide geographic distribution, consumes a broad range of prey taxa, and has been previously used as a model organism for studying feeding activities in heterotrophic protists (Montagnes et al., 2011; Roberts et al., 2011; Yang et al., 2011; Guo et al., 2013). Two prey species were selected in this study: the raphidophyte Heterosigma akashiwo and the prymnesiophyte Isochrysis galbana, to find common metabolic responses to grazing regardless of prey type. The metabolic response of the predator to different phytoplankton species, strains, and concentrations was evaluated using transcriptome-wide profiles for fed and starved O. marina cells. This approach revealed several metabolic pathways and cellular processes that were affected by prey availability, including signal transduction, biosynthesis of energy reserves, and self-digestion or autophagy during food scarcity. To our knowledge, the present study is a first to investigate the transcriptomic response of a herbivorous predator during phagotrophy on phytoplankton prey.
Materials and Methods
Plankton Cultures and Feeding Experiments
The heterotrophic dinoflagellate O. marina was grown in 0.2 μm sterile-filtered autoclaved seawater (FSW), and three phytoplankton prey types were grown in FSW enriched with F/2 nutrients without silicate (Guillard and Ryther, 1962). All cultures were kept at 15°C on a 12:12 h light:dark cycle. All plankton strains were deposited to the National Center for Marine Algae, formerly the Culture Collection of Marine Phytoplankton (CCMP) and include two strains of the raphidophyte: H. akashiwo 1 (CCMP3107) and H. akashiwo 2 (CCMP3374), and a prymnesiophyte I. galbana (CCMP1323). All cultures were xenic and grown exponentially before the start of the experiments.
Four experiments of O. marina cultures were established in triplicate 1 L polycarbonate bottles. There were three feeding treatments, one per phytoplankton prey type, and a fourth treatment representing a starved condition. The feeding treatments were established by adding between 500 and 600 ml of the predator culture so that the starting concentration of the predator was: 300, 800, and 1,000 cells ml-1 in the feeding treatments containing H. akashiwo 1, H. akashiwo 2, and I. galbana, respectively. Between 400 and 500 ml of prey was added to the same culture bottles. Aiming for saturating prey concentrations, prey types were added at different concentrations because of their cell size. The starting concentration of the larger prey species was 13,000 cells ml-1 (both strains of H. akashiwo) and 200,000 cells ml-1 for the smaller I. galbana. The starved treatment of O. marina was achieved by keeping the predator without prey for 4 days after an initial 3 day feeding period with the I. galbana prey. Similar to the I. galbana feeding treatment, the starved treatment was initiated with the addition of O. marina at 1,000 cells ml-1 and I. galbana at 200,000 cells ml-1 and incubated for 7 days total. Cell concentrations in all experimental bottles (for both the predator and prey) were determined at the beginning and end of the experiment by fixing 1 ml aliquots of each treatment bottle with 2% acid Lugol’s solution (Menden-Deuer et al., 2001). Cell concentrations were determined using a Sedgewick-Rafter counting cell and an Eclipse E800 microscope (Nikon).
After 3 days (for the feeding treatments) and 7 days (for the starved treatment), all cells (predator and prey) were harvested by vacuum filtration on 1-μm pore size filters (GE Water and Process Technologies). The same total number of cells (different volumes depending on the concentration) was harvested from each replicate, ensuring that each replicate was equally represented in the sequencing sample. There were between 3.9 and 6.6 million O. marina cells per filter depending on the treatment (Table 1). Biomass on filters was flash-frozen in liquid nitrogen and stored at -80°C until further processing.
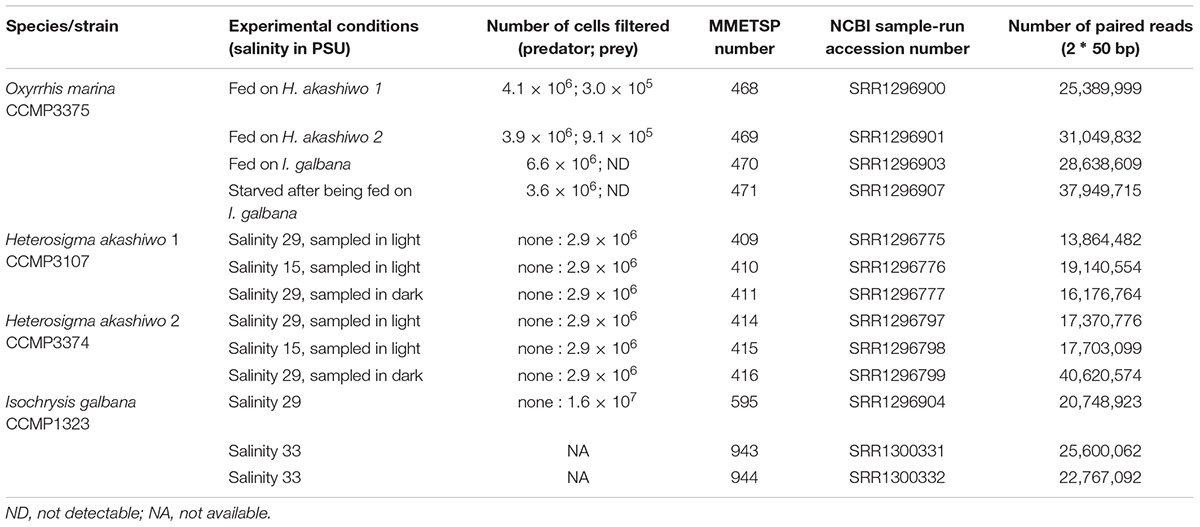
Table 1. Experimental summary including strain identification, experimental conditions, number of cells filtered, transcriptome identification numbers for both the Marine Microbial Eukaryote Transcriptome Sequencing Project (MMETSP) and the National Center for Biotechnology Information (NCBI) sequence read archive and the number of paired reads in each transcriptome.
In addition to the feeding and starved treatments, all prey types were cultivated individually without the predator. This was done so that the individual prey transcriptomes could be subtracted from the mixed predator–prey transcriptomes generated from the feeding and starved treatments. To generate robust assemblies of prey transcriptomes, all prey items were grown individually, in triplicate, at different light and salinity conditions. Cells were harvested at the mid-point of exponential growth and stored as described above (Tables 1, 2), but the actual transcriptomic response of the prey to these treatments was not a subject of this study and was not used for differential expression analysis.
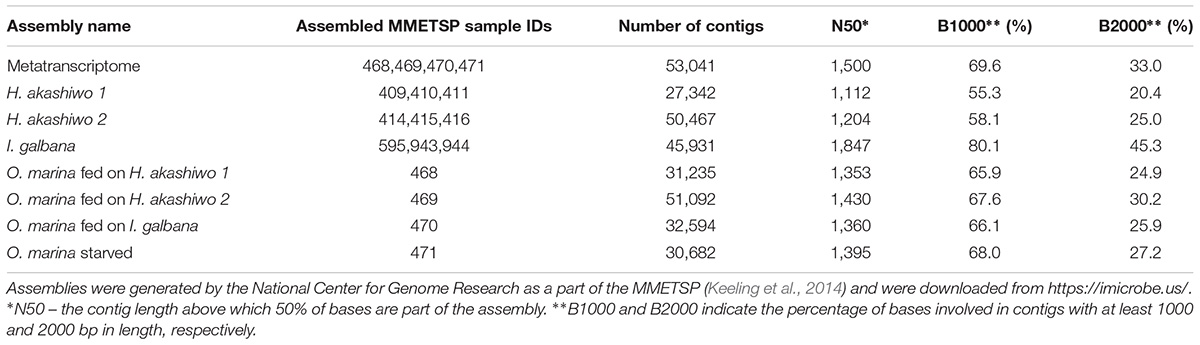
Table 2. Transcriptome assembly information.
RNA Extraction and Transcriptome Sequencing
Triplicates of each experimental treatment were pooled into one sample at the time of cell harvest. Total RNA was extracted using the RNeasy Mini Kit (Qiagen, United States) according to the manufacturer’s protocol, with the following exceptions: cells were lysed using a bead-beater homogenizer in a solution of lysis buffer and 0.5 mm zirconia/silica beads (BioSpec, United States) until the solution looked homogenous (∼1 min). Next, QIAshredder columns (Qiagen, United States) were used to remove cell debris. To remove DNA, the RNase-free DNase set (Qiagen, United States) was followed by an addition DNA-digestion using the Turbo DNA-free kit (Ambion, United States), both according to the manufacturer’s instructions. The RNA was quantified in duplicate using the Qubit Fluorometer (Invitrogen, United States). All transcriptomes (Table 1) were sequenced as part of the Marine Microbial Eukaryote Transcriptome Sequencing Project (MMETSP) using methods described in Keeling et al. (2014).
Bioinformatics Analyses
The transcriptome assemblies for the three species and strains used in the experiments were obtained from https://imicrobe.us/ (Keeling et al., 2014; Table 2). Since O. marina treatments also contained prey when harvested, the joined assembly of all O. marina treatments (hereinafter referred to as the metatranscriptome) contained transcripts from both predator and prey.
To find and remove prey transcripts, 53,041 contigs from the metatranscriptome were subjected to blastn homology searches (cutoff of the expected value or the E-value = 10-5, Altschul et al., 1990) against the contigs from the prey-only assemblies (H. akashiwo 1 assembly, H. akashiwo 2 assembly, I. galbana assembly, Table 2). Metatranscriptome contigs matching any of the prey contigs at the percent nucleotide identity ≥79.5% were considered to represent prey contigs and removed from the metatranscriptome, thus leaving behind only O. marina contigs. To determine the 79.5% nucleotide identity threshold for prey removal, highly conserved contigs from the metatranscriptome annotated as actins (23 contigs), alpha and beta-tubulins (17 contigs), elongation factors (20 contigs), and 40S ribosomal proteins (84 contigs) were subjected to a blastn search against our prey-only assemblies and the National Center for Biotechnology Information (NCBI) non-redundant nucleotide database. We found that a subset of the selected, highly conserved contigs returned blast hits with nucleotide identities between 79.5 and 100% to our prey species or to species closely related to our prey (e.g., other haptophytes Emiliania huxleyi and Prymnesium parvum). A second subset matched the contigs in our prey-only assemblies with nucleotide identities below 79.5% and at the same time returned NCBI blast hits to O. marina or species closely related to O. marina (e.g., Perkinsus marinus, Symbiodinium microadriaticum, and other dinoflagellates). Because the selected metatranscriptome contigs represented well-known protein coding sequences (such actin and tubulin genes) that are conserved across phyla, the threshold of 79.5% was assumed to be applicable to the remainder of the metatranscriptome contigs with less conserved nucleotide identity. After the removal of the prey associated contigs, the assembled, prey-free O. marina transcriptome was used in further analyse including mapping and gene expression estimates.
Raw reads for the experimental samples (O. marina – three feeding treatments and one starvation treatment) were downloaded from the NCBI’s Short Read Archive (accession number listed in Table 1) and quality trimming and filtration was accomplished using Trimmomatic using a sliding window threshold of quality score equal to 20 for every three nucleotides (Bolger et al., 2014). The high-quality reads were mapped to the assembled, prey-free O. marina transcriptome using Bowtie (Langmead et al., 2009) and transcript quantification was determined using RSEM (Li and Dewey, 2011). Differential expression (DE) was determined using the Analysis of Sequence Counts tool (ASC, Wu et al., 2010) using transcripts per million (TPM) counts which were generated by the RSEM tool. The ASC tool is a Bayesian statistical approach that was specifically developed for pooled biological replicates and RNA-Seq statistical analysis without replication (Wu et al., 2010). Functional annotation of O. marina differentially expressed transcripts was accomplished by blastx searches (Altschul et al., 1990) against NCBI’s non-redundant protein database (E-value cut off 10-5), followed by the import of blastx results into the Blast2GO software (Conesa et al., 2005) to obtain Gene Ontology (GO) (Ashburner et al., 2000) annotations, InterPro conserved protein domains (Zdobnov and Apweiler, 2001), and KEGG (Kyoto Encyclopedia of Genes and Genomes) enzyme searches (Kanehisa et al., 2016). GO enrichment analysis was carried out using the agriGO web-based tool (Du et al., 2010; Tian et al., 2017).
Results
Growth Response of O. marina to Food Availability
Oxyrrhis marina grazed all three phytoplankton prey types and exhibited positive growth, reaching between 4.0–4.7 × 10³ cells ml-1 at the time of harvest on day 3 (Figure 1A). Specific growth rates for O. marina feeding on I. galbana were 0.69 ± 0.05 d-1 and feeding on H. akashiwo 1 and H. akashiwo 2, 1.27 ± 0.02 d-1 and 0.74 ± 0.01 d-1, respectively. O. marina in the starved treatment had an average specific growth rate over the 7-day incubation period of 0.26 ± 0.02 d-1, due to an initial rapid increase in cell numbers over the first 3 days followed by 4 days of little to no growth due to starvation. In the grazing treatments, evidence of active grazing was observed in the rapid decrease of prey from between 1.28 × 10⁴ and 2 × 10⁵ cells ml-1 at the start of the experiment, to below 103 cells ml-1 after 3 days of grazing (Figure 1B). The abundance of I. galbana in the fed treatment was very low on day 3 and was not detectable using our counting methods; the concentration was conservatively estimated at <1 cell ml-1.
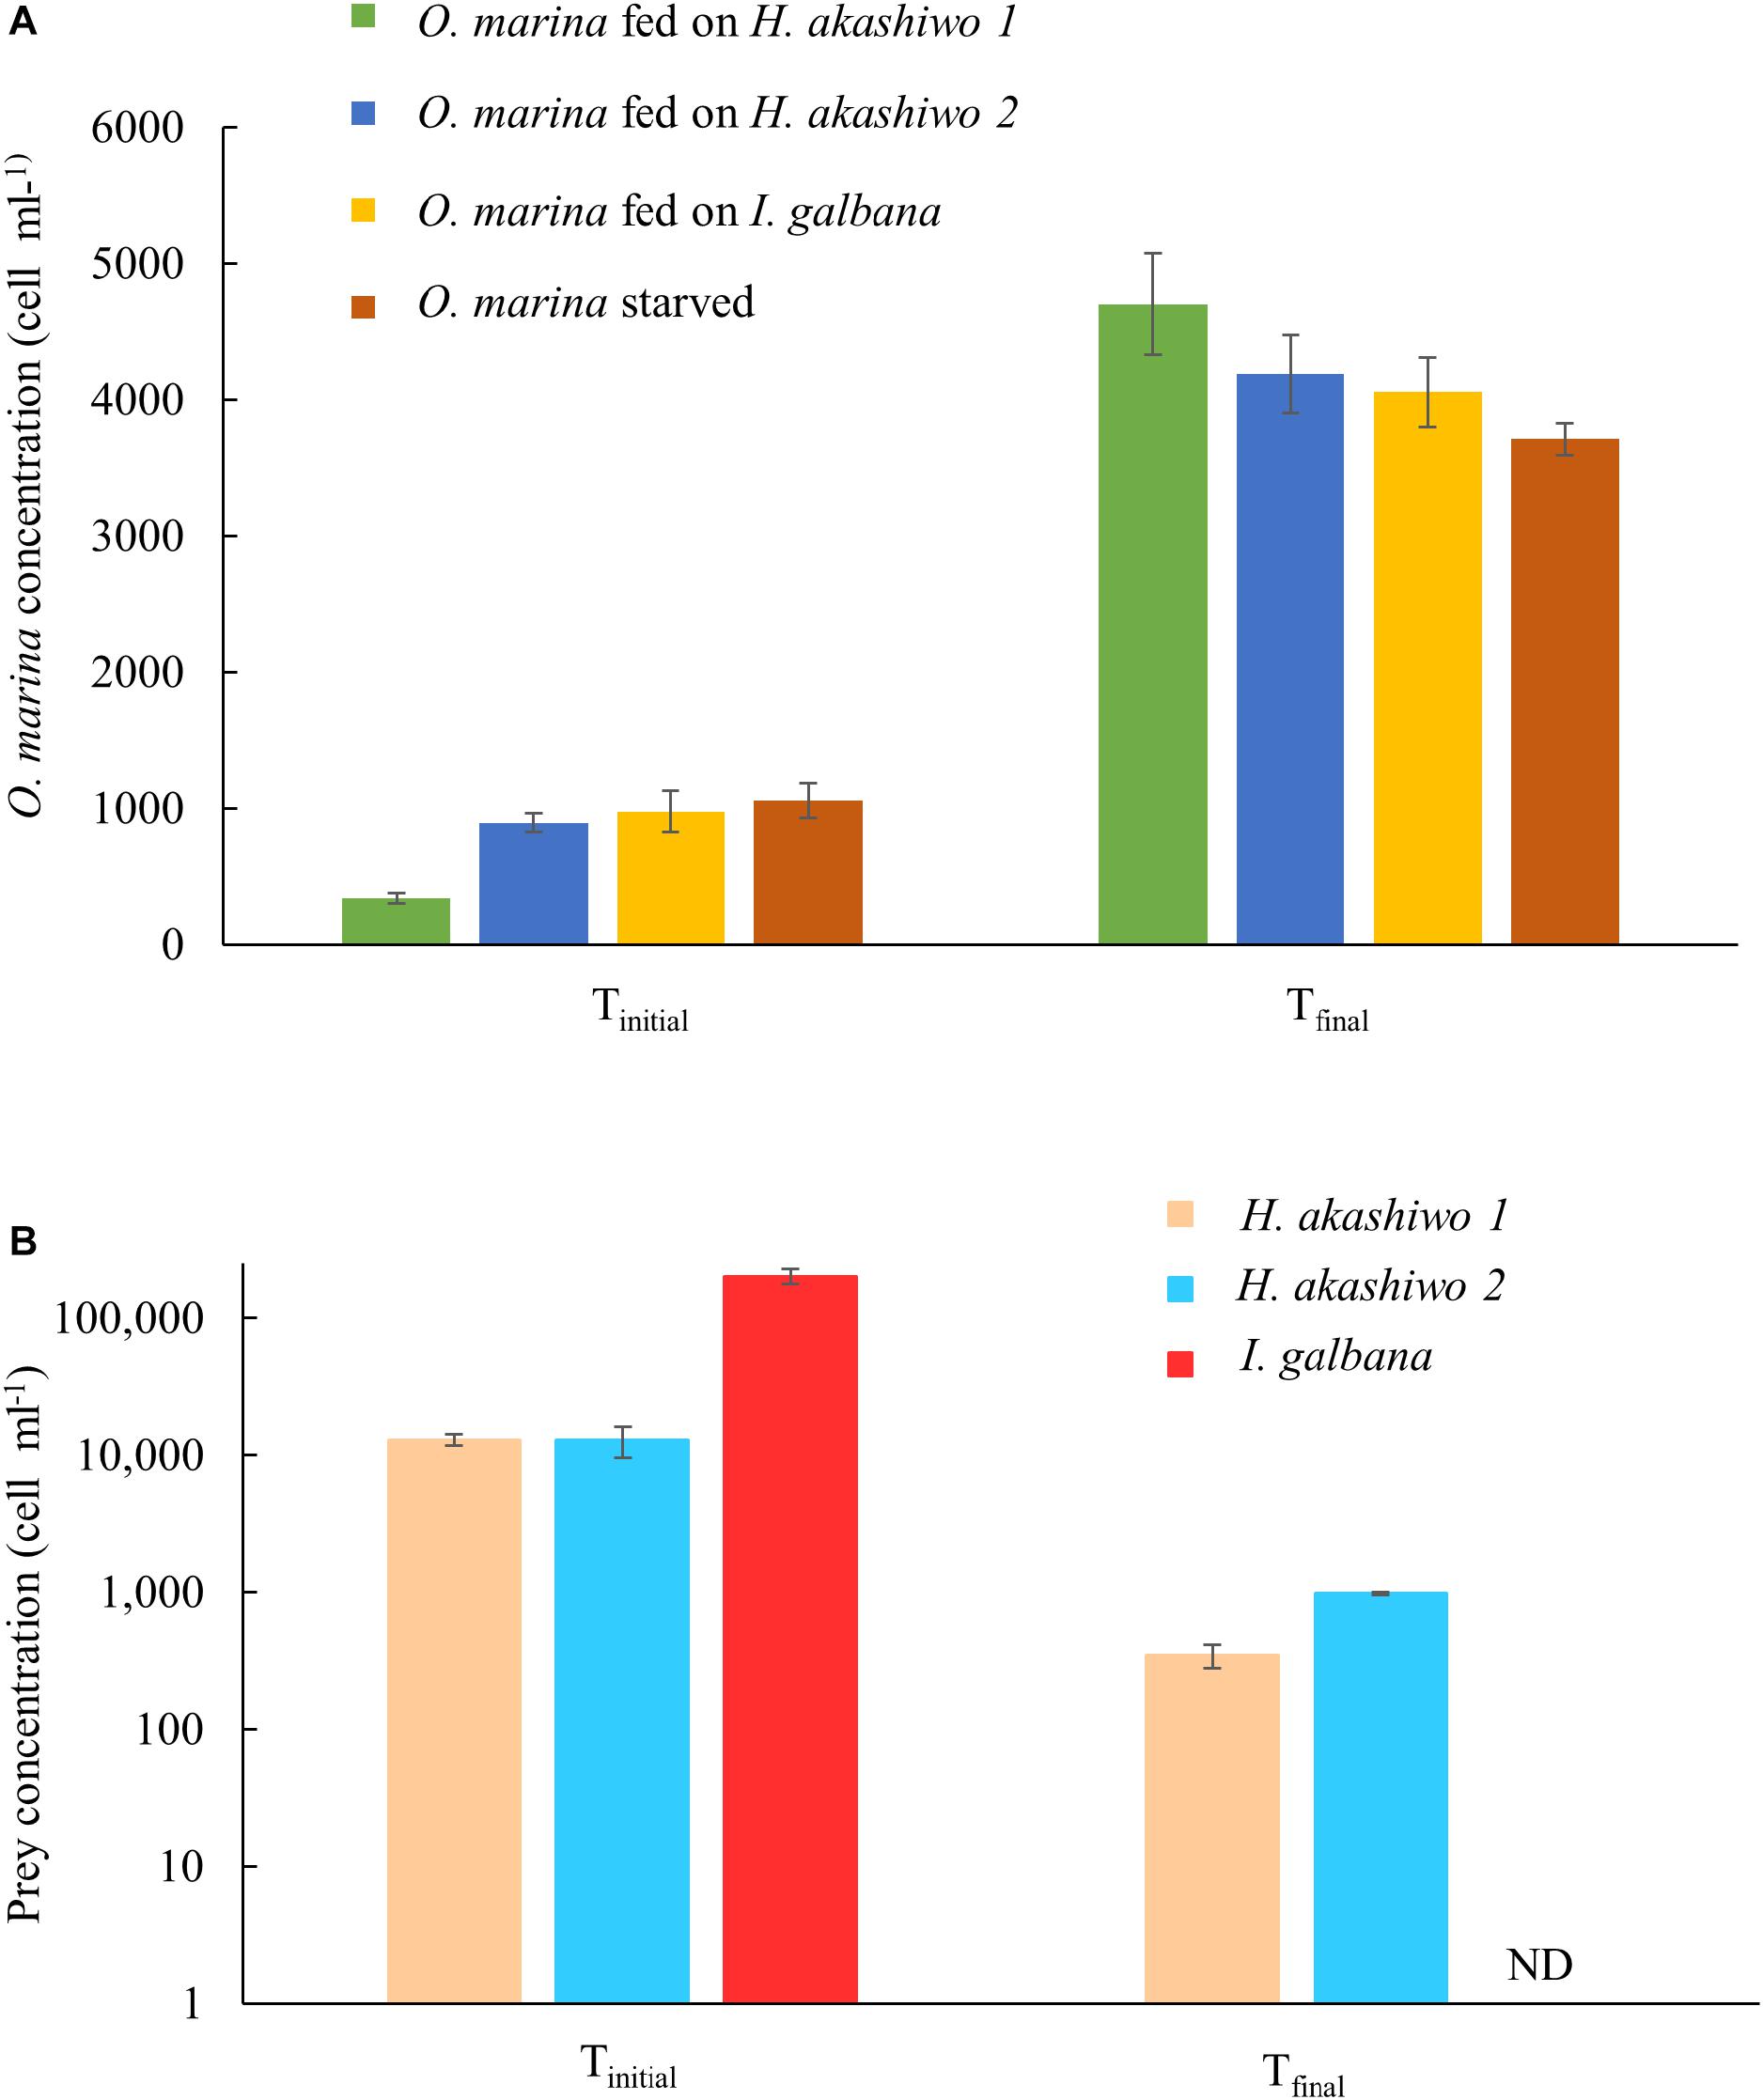
Figure 1. Predator and prey cell concentrations at the start (Tinitial) and end (Tfinal) of the experiment for the predator species O. marina (A) and the phytoplankton prey species: H. akashiwo strain 1, H. akashiwo strain 2, and I. galbana (B). Cell harvests at Tfinal occurred on day 3 for the fed treatments and day 7 for the starved treatment. ND indicates cell concentration below detection for I. galbana (<1 cell ml-1).
Removal of Prey Transcripts From the Metatranscriptome
A combined assembly was generated using all O. marina treatments (metatranscriptome, Table 2). This combined assembly was compared with the prey-only transcriptome assemblies (Table 2) using BLAST, percent identity, and hit coverage, yielding 7,488 transcripts (14% of the assembly) which were identified as homologous to sequences in the prey transcripts (Figure 2). The numbers of transcripts in the combined assembly matching prey transcripts were 5,260, 5,398, and 2,503 for H. akashiwo 1, H. akashiwo 2, and I. galbana, respectively. It should be noted that >80% of those prey-transcript matches showed nucleotide sequence identity >95% thus almost certainly belonging to the prey. More transcripts of H. akashiwo than I. galbana were found in the combined assembly (Figure 2), likely because O. marina grazed I. galbana more effectively and very few I. galbana cells remained in the harvested biomass used for the sequencing of those samples (Figure 1 and Table 1). The remaining 86% of transcripts in the combined assembly (metatranscriptome) were identified as belonging to O. marina (Figure 2). The prey-free transcripts were used for mapping and gene expression analyses.
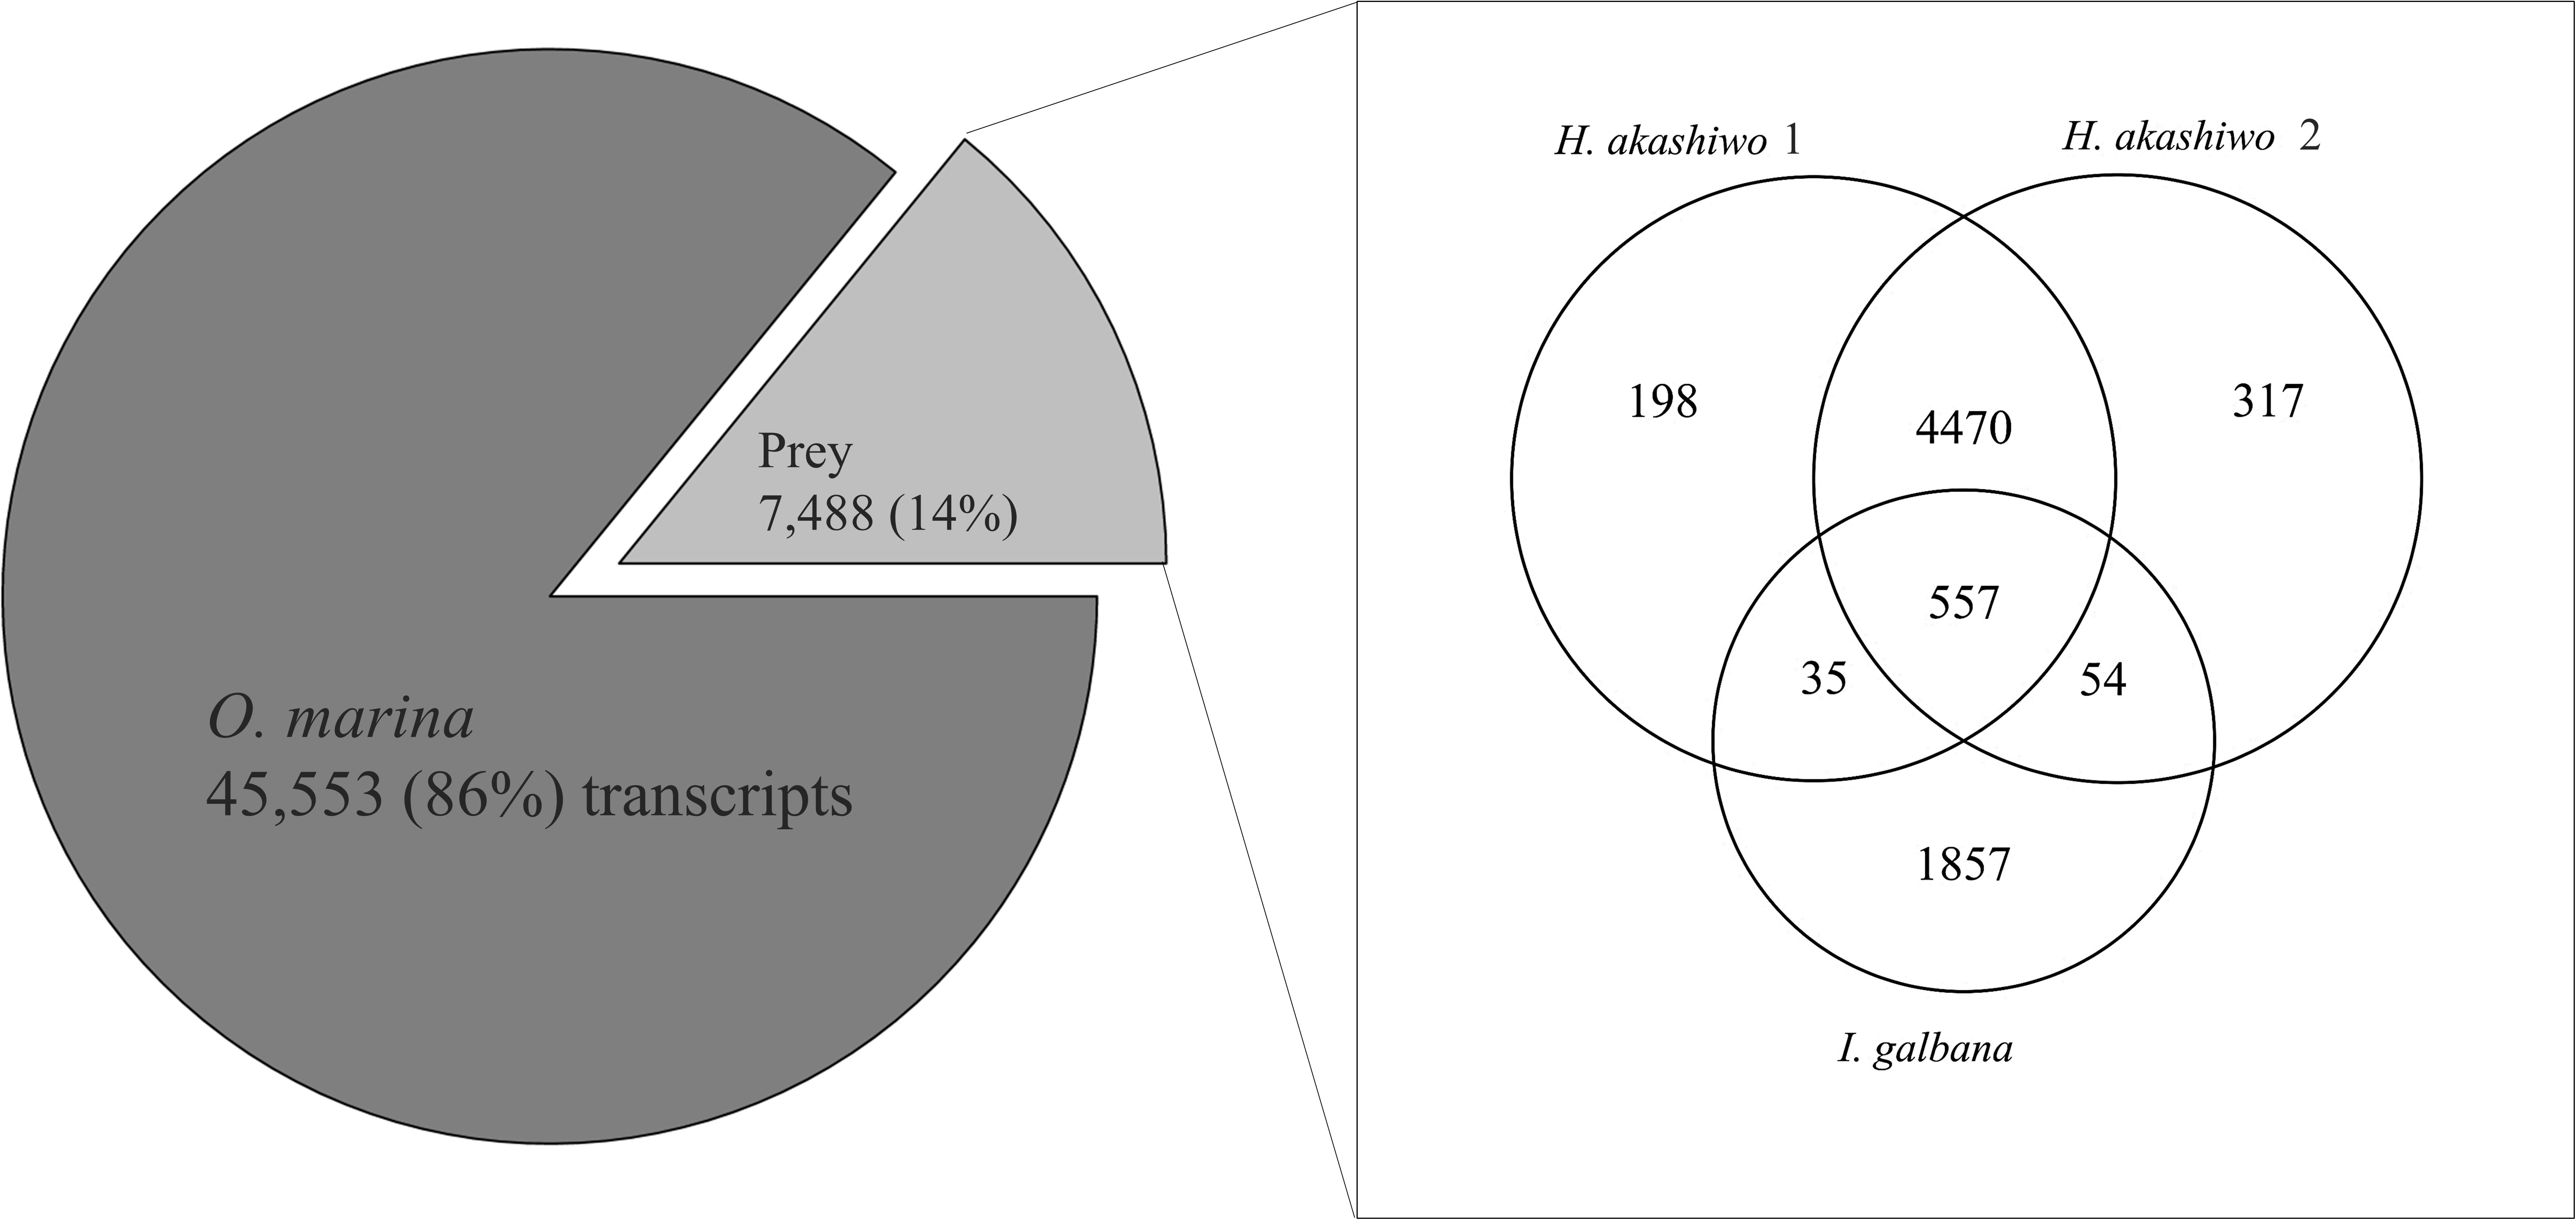
Figure 2. Results of blastn homology searches of contigs from the combined predator–prey assembly (metatranscriptome) against each of the three prey-only assemblies. A total of 7,488 contigs (14% of the assembly) in the metatranscriptome matched at least one of the prey contigs at a percent nucleotide identity ≥79.5%. The number of contigs assigned to each prey species varied (Venn diagram). The remaining 86% of the contigs were considered prey-free O. marina contigs and were used for DE analysis.
Differentially Expressed (DE) Transcripts in Response to Feeding and Starvation Conditions
Between 80 and 87% of quality-filtered reads in the O. marina single prey assemblies mapped to O. marina contigs identified in the combined assembly (Table 3). The abundance of O. marina transcripts under the starved treatment was compared to each of the three fed treatments representing the three phytoplankton prey types. Overall, 1,576 differentially expressed (DE) transcripts were identified, including 972 with higher expression in the fed O. marina cells and 604 with higher expression in the starved cells (Table 4). The 972 transcripts that were upregulated in fed O. marina cells included 39 transcripts that were upregulated in all fed treatments, regardless of prey type (Figure 3A and Supplementary File S1 – Grazing genes). Of those, 20 could be functionally annotated and included genes putatively identified as glycogen synthase, sugar epimerase, phosphoglucomutase, glycotransferase, actin, three kinases, acyl-CoA dehydrogenase, kinesin, and two transcription factors (for a complete list see Supplementary File S1 – Grazing genes).
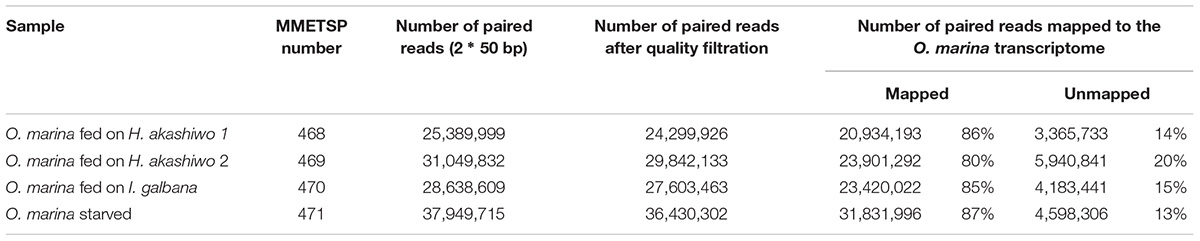
Table 3. The results of quality filtration and mapping of sequence reads to O. marina transcripts.
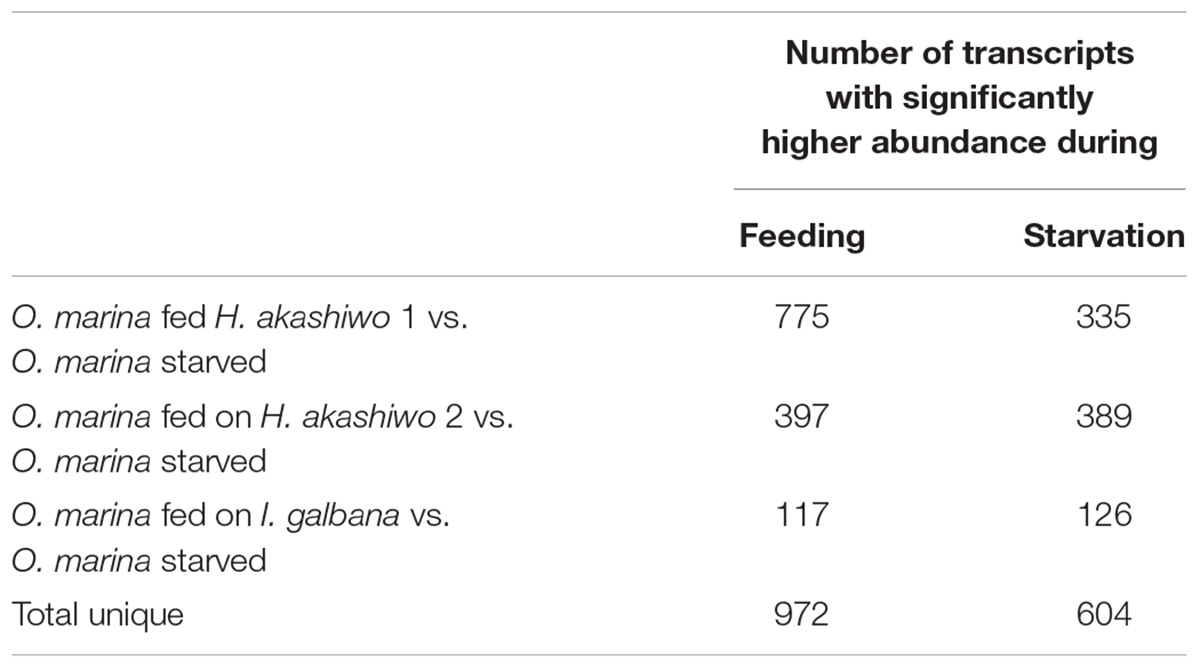
Table 4. Number of significantly differentially expressed transcripts (posterior probability ≥0.950 and fold change ≥2) in O. marina cells fed with three different prey types (two strains of H. akashiwo: H. akashiwo 1, H. akashiwo 2, and I. galbana) in comparison to O. marina cells kept in starvation for 4 days after prey depletion.
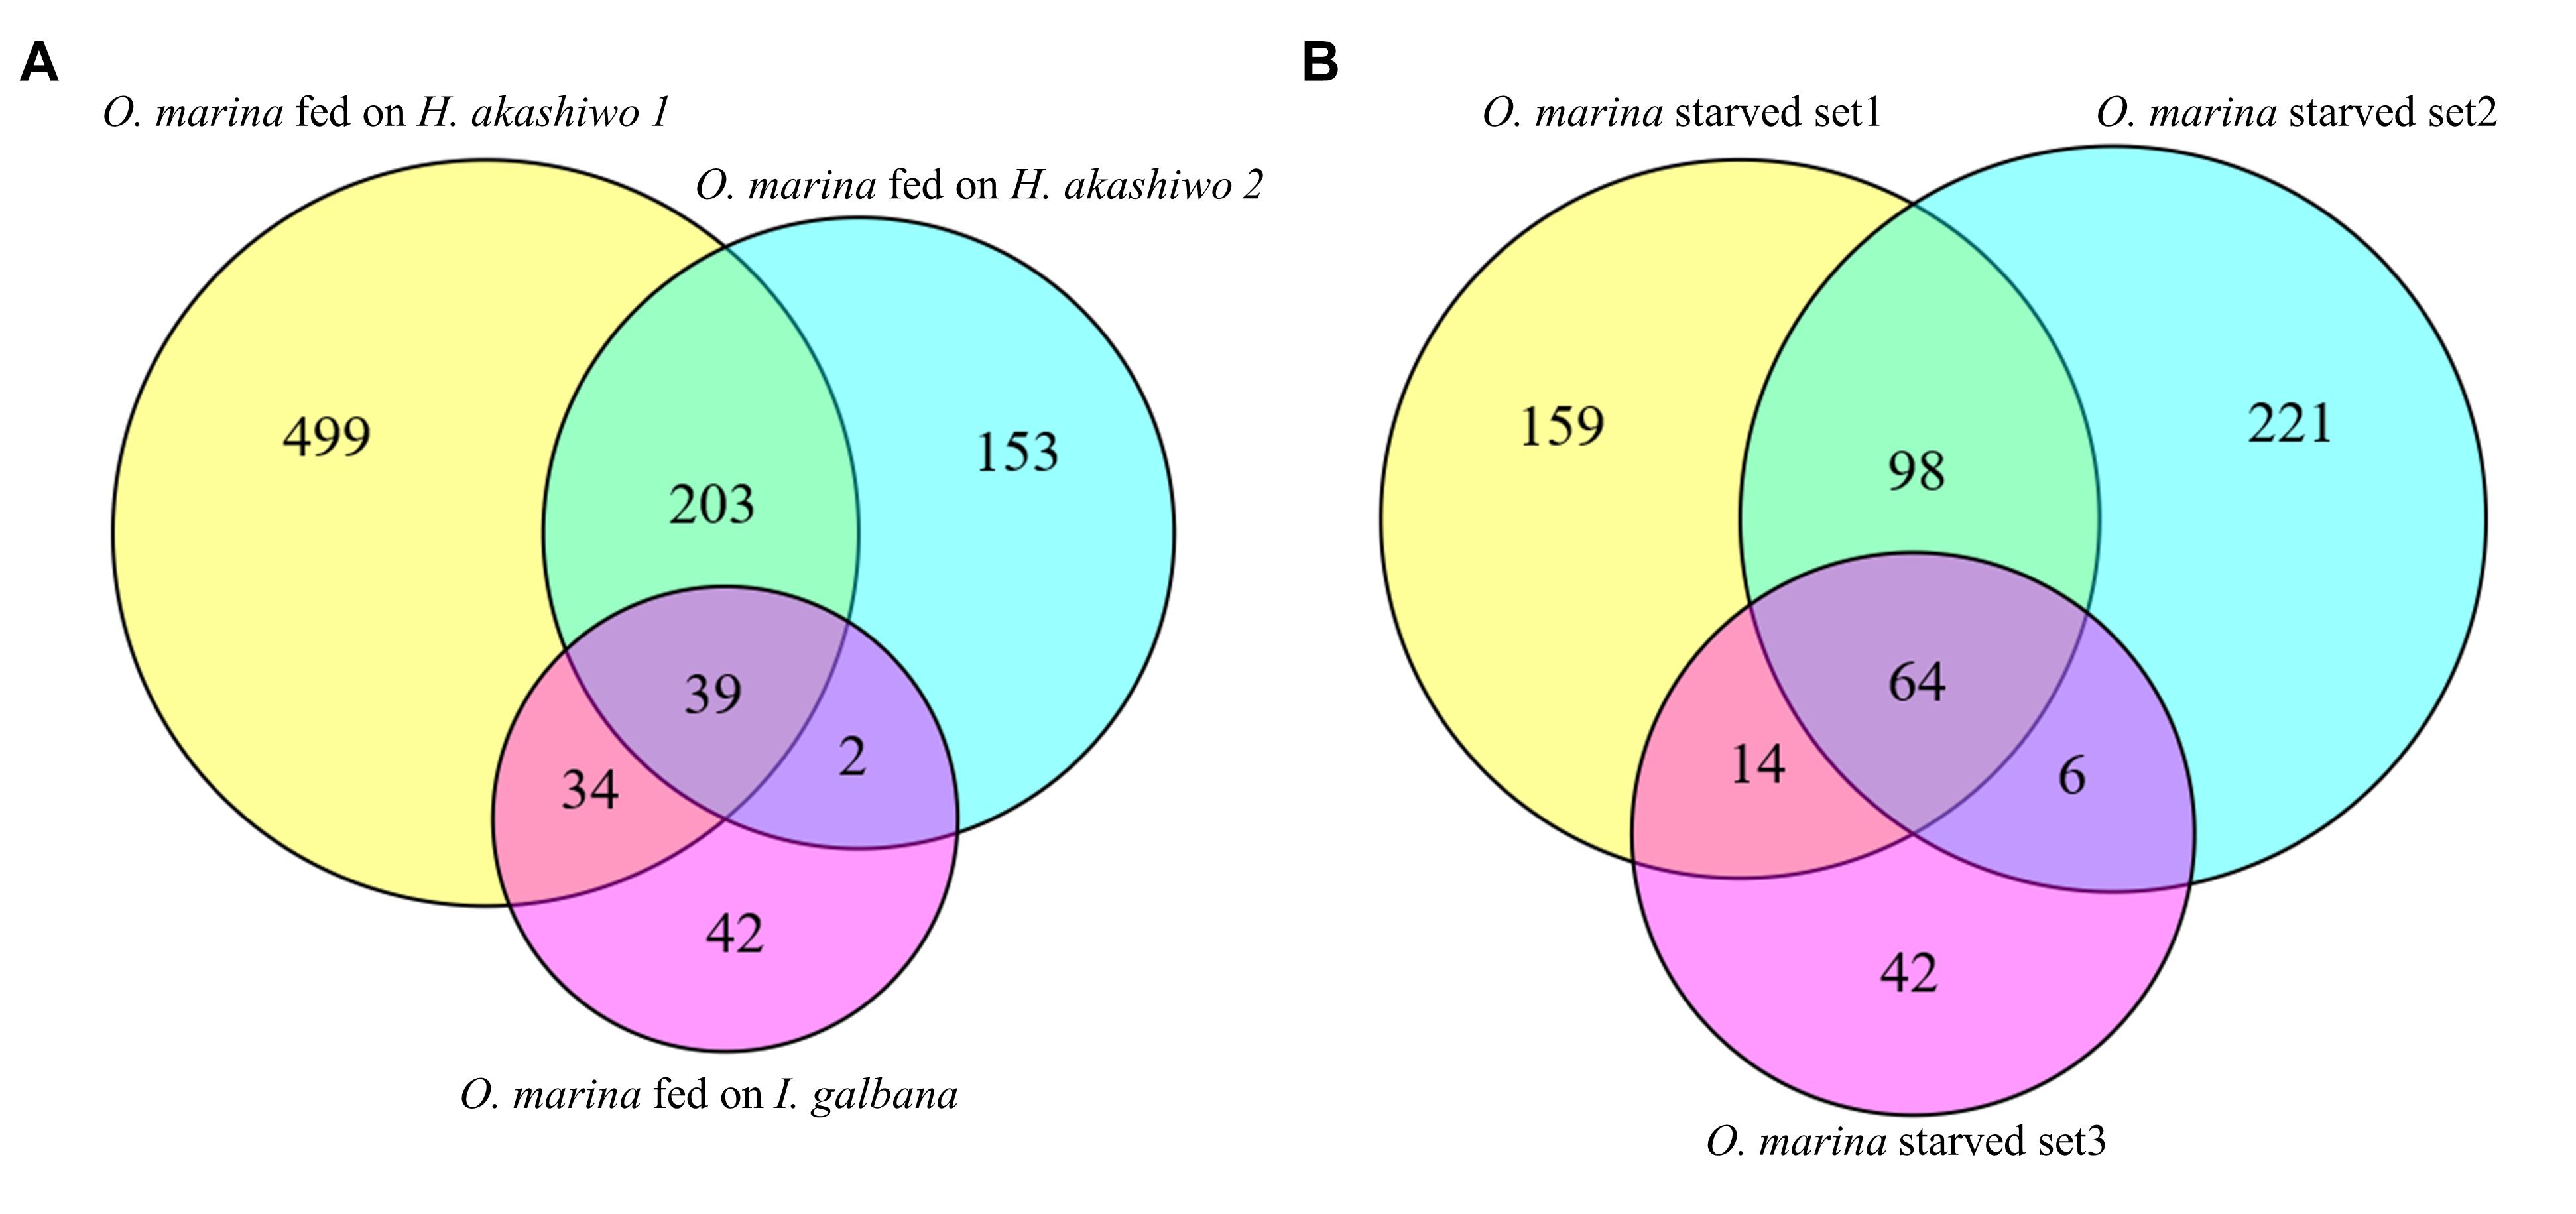
Figure 3. Transcripts found at statistically higher expression (posterior probability ≥0.950 and fold change ≥2) in (A) O. marina cells fed on three different phytoplankton prey types in comparison to starved O. marina cells and (B) starved O. marina cells in comparison to O. marina cells fed H. akashiwo 1 (starved set 1), H. akashiwo 2 (starved set 2), and I. galbana (starved set 3).
An additional 203 transcripts were upregulated when O. marina was fed H. akashiwo regardless of the strain (Figure 3A). When O. marina was feeding on H. akashiwo 1 and 2, 499 and 153 transcripts, respectively, were uniquely upregulated. In addition, there were 42 uniquely upregulated transcripts in O. marina cells when it was feeding on I. galbana.
When O. marina was starved, 604 transcripts were upregulated, including 64 transcripts that were upregulated regardless of the prey treatment selected as the control comparison (Figure 3B, complete list in Supplementary File S2). Additional starvation-induced transcripts were identified when comparing starved O. marina cells to those fed on H. akashiwo 1 (271 transcripts), H. akashiwo 2 (325 transcripts), and I. galbana (62 transcripts) (Figure 3B). A GO term, Interpro protein domain, or KEGG enzyme could be assigned to 311 transcripts in the fed treatments (32%, Supplementary File S1) and 286 transcripts in the starved treatments (52%, Supplementary File S2).
Transcripts in O. marina cells with a significantly higher expression when the predator was feeding included those encoding enzymes involved in carbohydrate and fatty acid synthesis, metabolism, and transport (Figure 4). In addition, fed O. marina cells had higher expression of transcripts encoding several ion channels responsible for the detection of mechanical stimuli, and multiple proteins involved in motility, cytoskeletal organization, cell shape, and cell division (Figure 4). Transcripts in O. marina cells with a significantly higher expression when the predator was starving included upregulation of light harvesting proteins, enzymes involved in degradation of storage molecules, and enzymes involved in autophagy and cell redox homeostasis and the stress response (Figure 5).
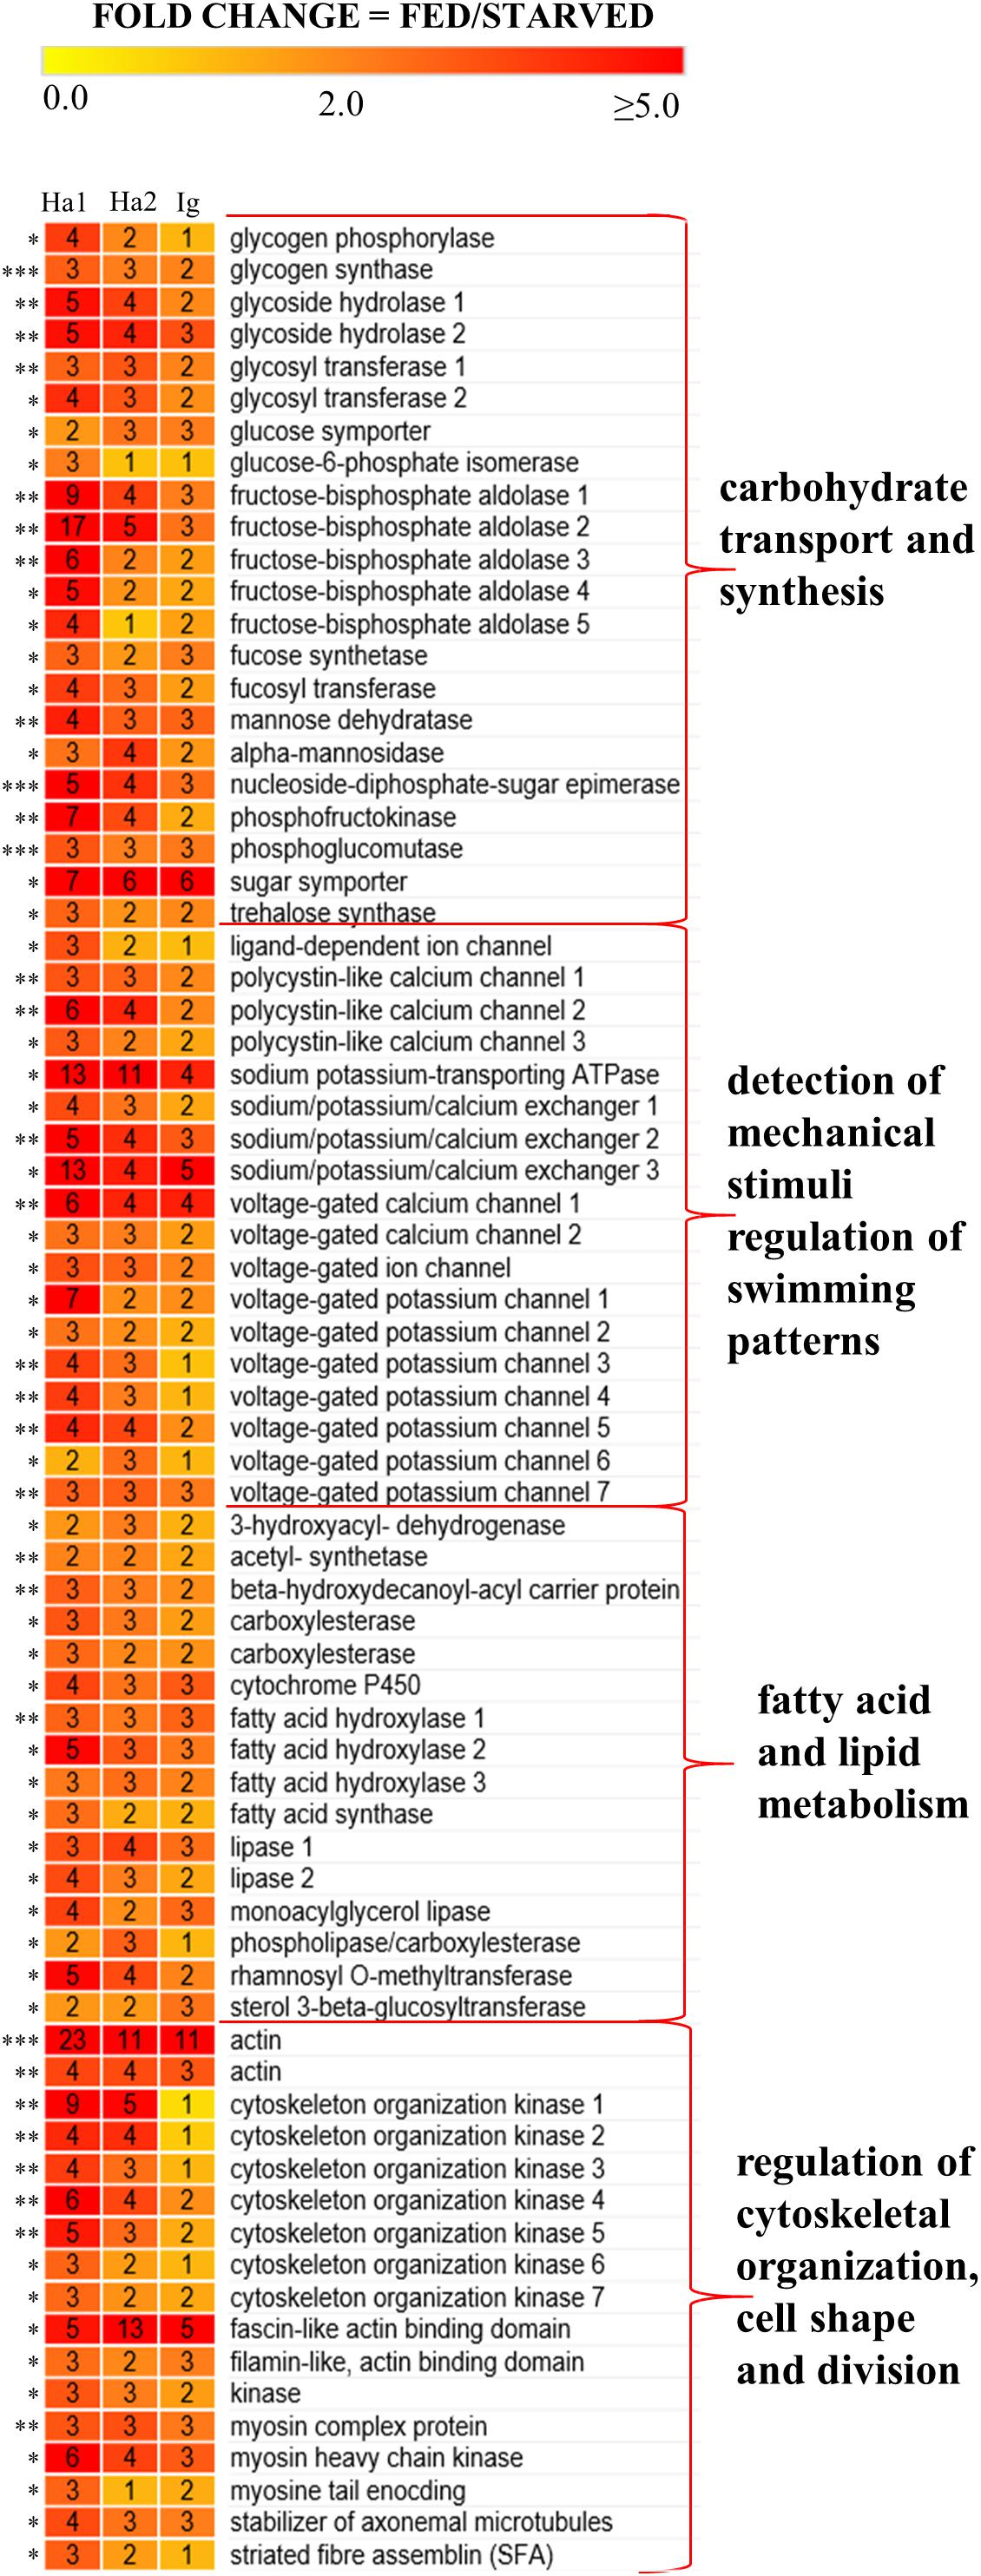
Figure 4. A heat map representing 73 transcripts that were up-regulated in O. marina cells fed on H. akashiwo 1 (Ha1), H. akashiwo 2 (Ha2), and I. galbana (Ig) compared to starved O. marina cells. Numbers inside boxes indicate fold change with each prey treatment and the number of asterisks next to each transcript indicates the number of prey that were significantly differentially expressed. Names, contig IDs, and annotations of the transcripts can be found in Supplementary Files S1, S2.
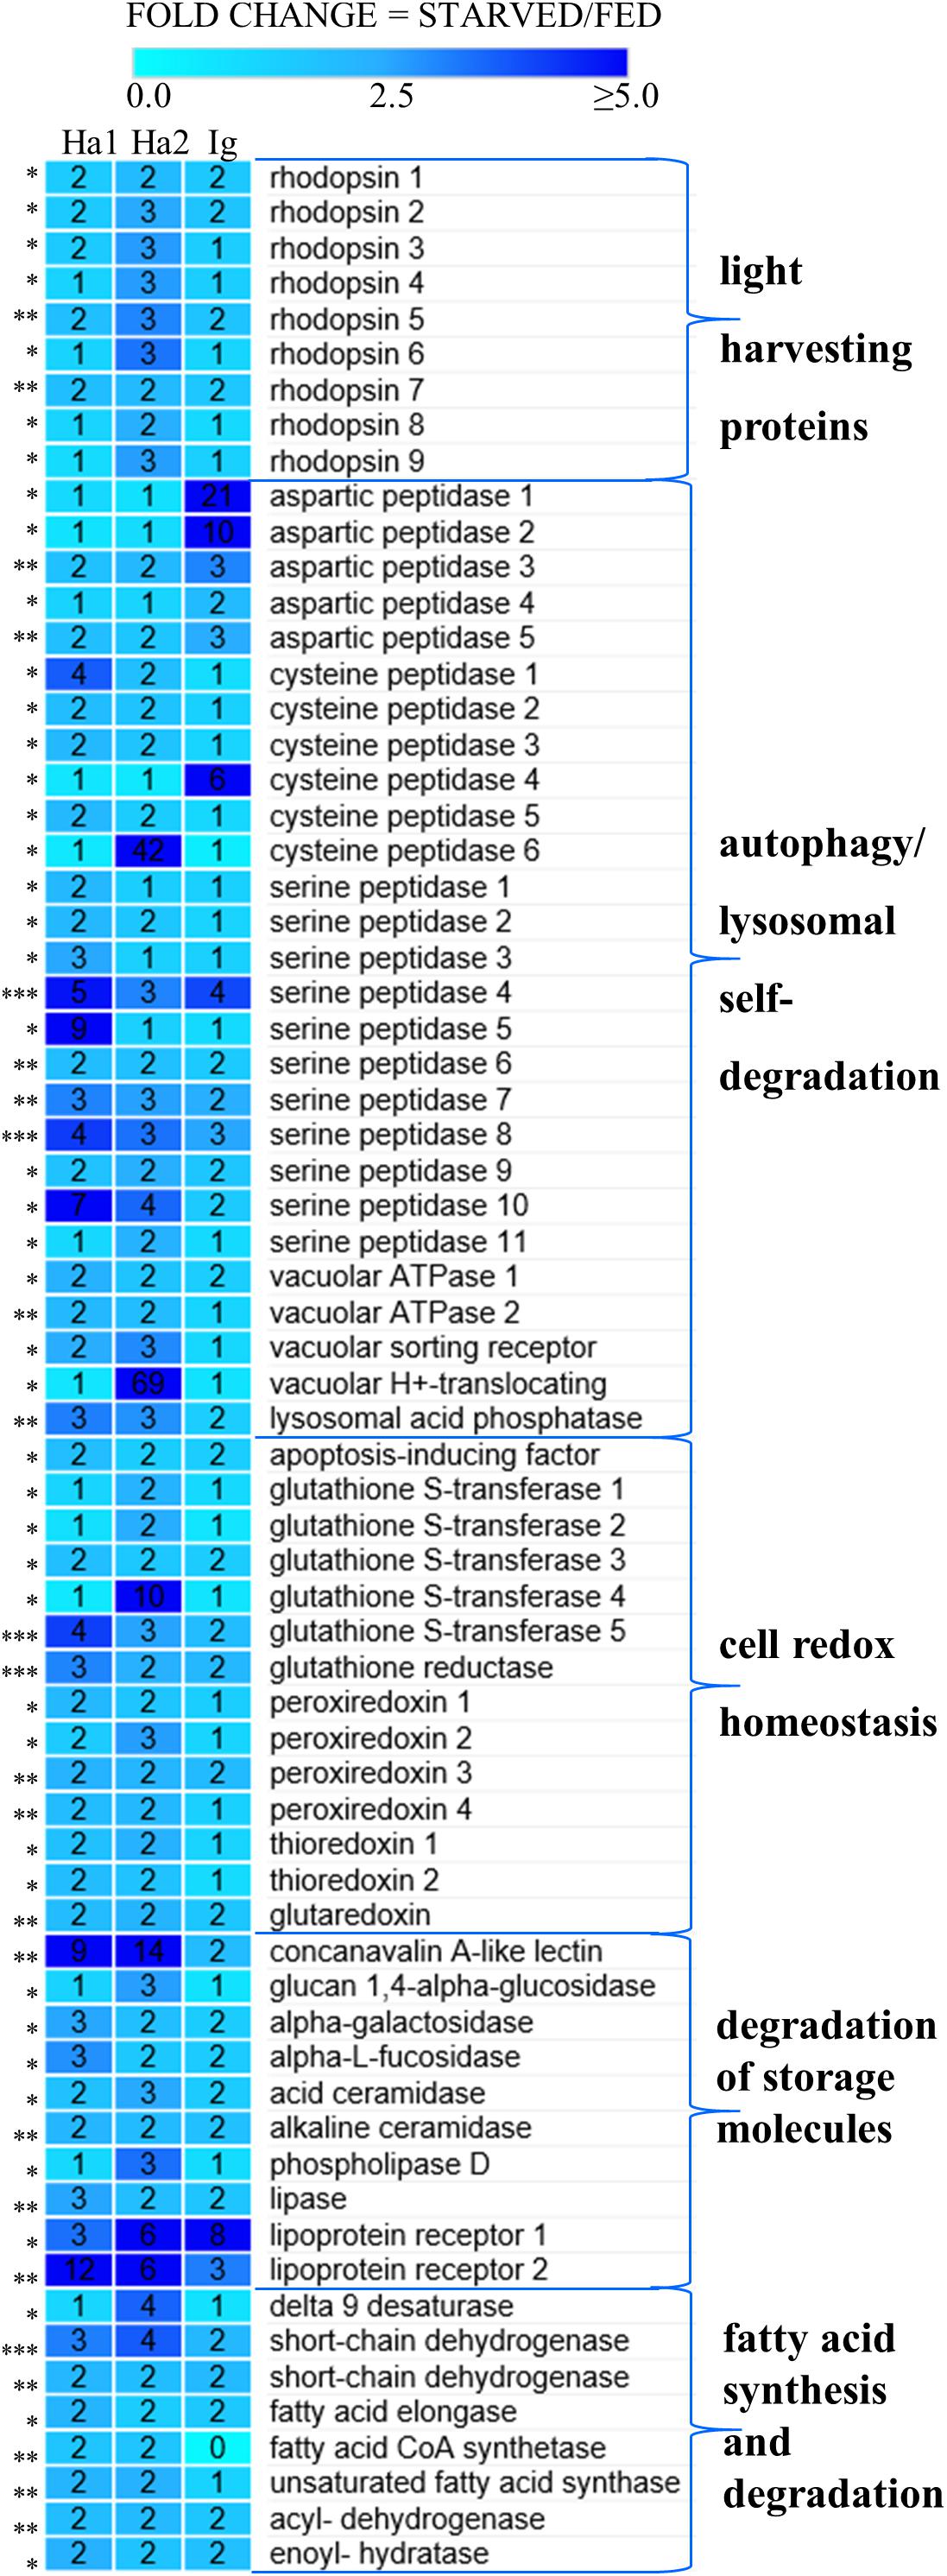
Figure 5. A heat map representing 67 transcripts that were up-regulated in starving O. marina cells compared to O. marina cells fed on H. akashiwo 1 (Ha1), H. akashiwo 2 (Ha2), I. galbana (Ig). Numbers inside boxes indicate fold change for each prey. Asterisks next to each transcript indicate the number of prey types that were significantly differentially expressed. Names, contig IDs, and annotations of the transcripts can be found in Supplementary Files S1, S2.
Examination of the most frequent protein domains (InterPro domains, Table 5) identified among DE transcripts highlighted the importance of certain enzymes and transporters in the feeding and starvation processes. Many more kinase protein domains (IPR011009, IPR000719, IPR008271) were identified among DE transcripts from the fed cells than among DE transcripts from the starved cells (Table 5). On the other hand, the rhodopsin protein domains (IPR001425), pepsinogens also known as aspartyl peptidase domains (IPR001461), and cathepsins (IPR000668) were identified among DE transcripts from the starved cells but not among DE transcripts from the fed cells (Table 5). Similarly, a majority of the ion transporter domains (IPR005821, IPR013122, IPR004481, IPR004837) were identified among DE transcripts from the fed cells but not among DE transcripts from the starved cells (Table 5).
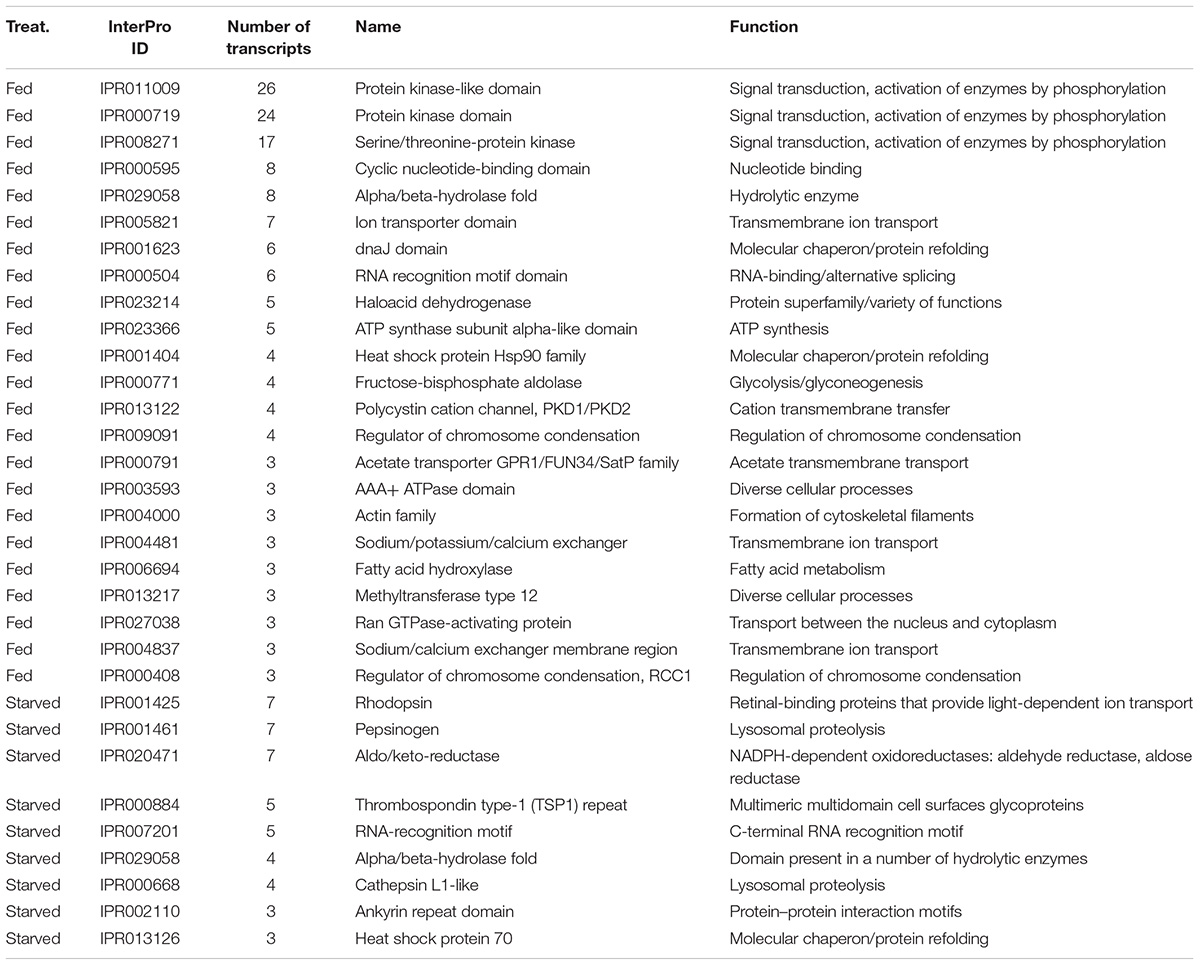
Table 5. Most frequent protein domains found among significantly differentially expressed transcripts from RNA-Seq analysis of O. marina cells in culture conditions with (fed) and without (starved) different phytoplankton prey types.
The results of GO enrichment analysis revealed that 31 GO terms related to carbohydrate metabolism were overrepresented in the fed O. marina cells. These included GO terms such as glycolysis, gluconeogenesis, monosaccharide catabolic process, hexose catabolic processes, and several other functionally related terms as well as terms describing voltage-ion channels including “divalent metal ion transport” (complete list in Table 6). The GO terms that were enriched in the starved O. marina cells included “peptidase activity” and “oxidoreductase activity” which are terms related to enzymes involved in autophagy and oxidative stress (GO:0008233, GO:0016491 in Table 6).
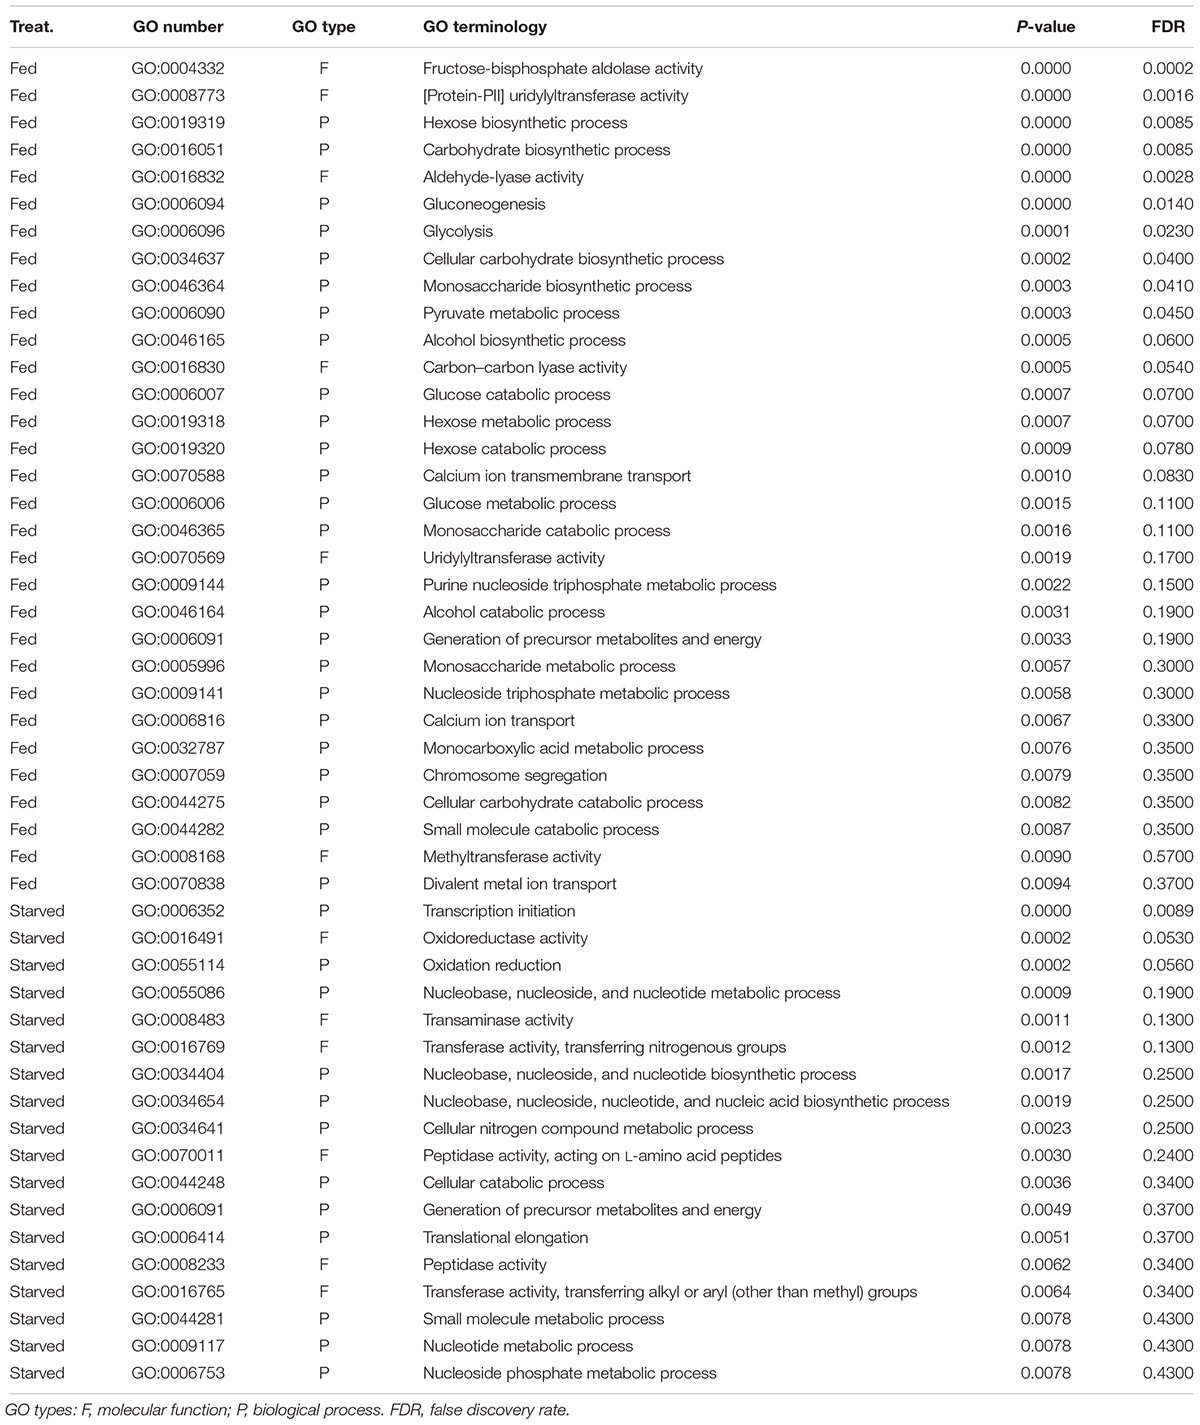
Table 6. Result of the GO enrichment analysis based on the RNA-Seq derived 1576 significantly differentially expressed transcripts found in O. marina cells subjected to two culture treatments: feeding and starvation.
The examination of predicted KEGG enzymes among the DE transcripts revealed specific enzymes involved in the metabolic processes mentioned above (Figure 6 and Supplementary Files S1 and S2). DE enzymes involved in lipid, carbohydrate, amino acid, and energy metabolism, and other enzymes were identified. Overall, a higher number of DE transcripts involved in lipid and energy metabolism (such as carbon fixation) were identified under starvation, whereas during feeding, a higher number of DE transcripts involved in carbohydrate metabolism were identified (Figure 6). In addition, a higher number of kinases were deferentially expressed during feeding, but a higher number of peptidases were differentially expressed during starvation (Figure 6).
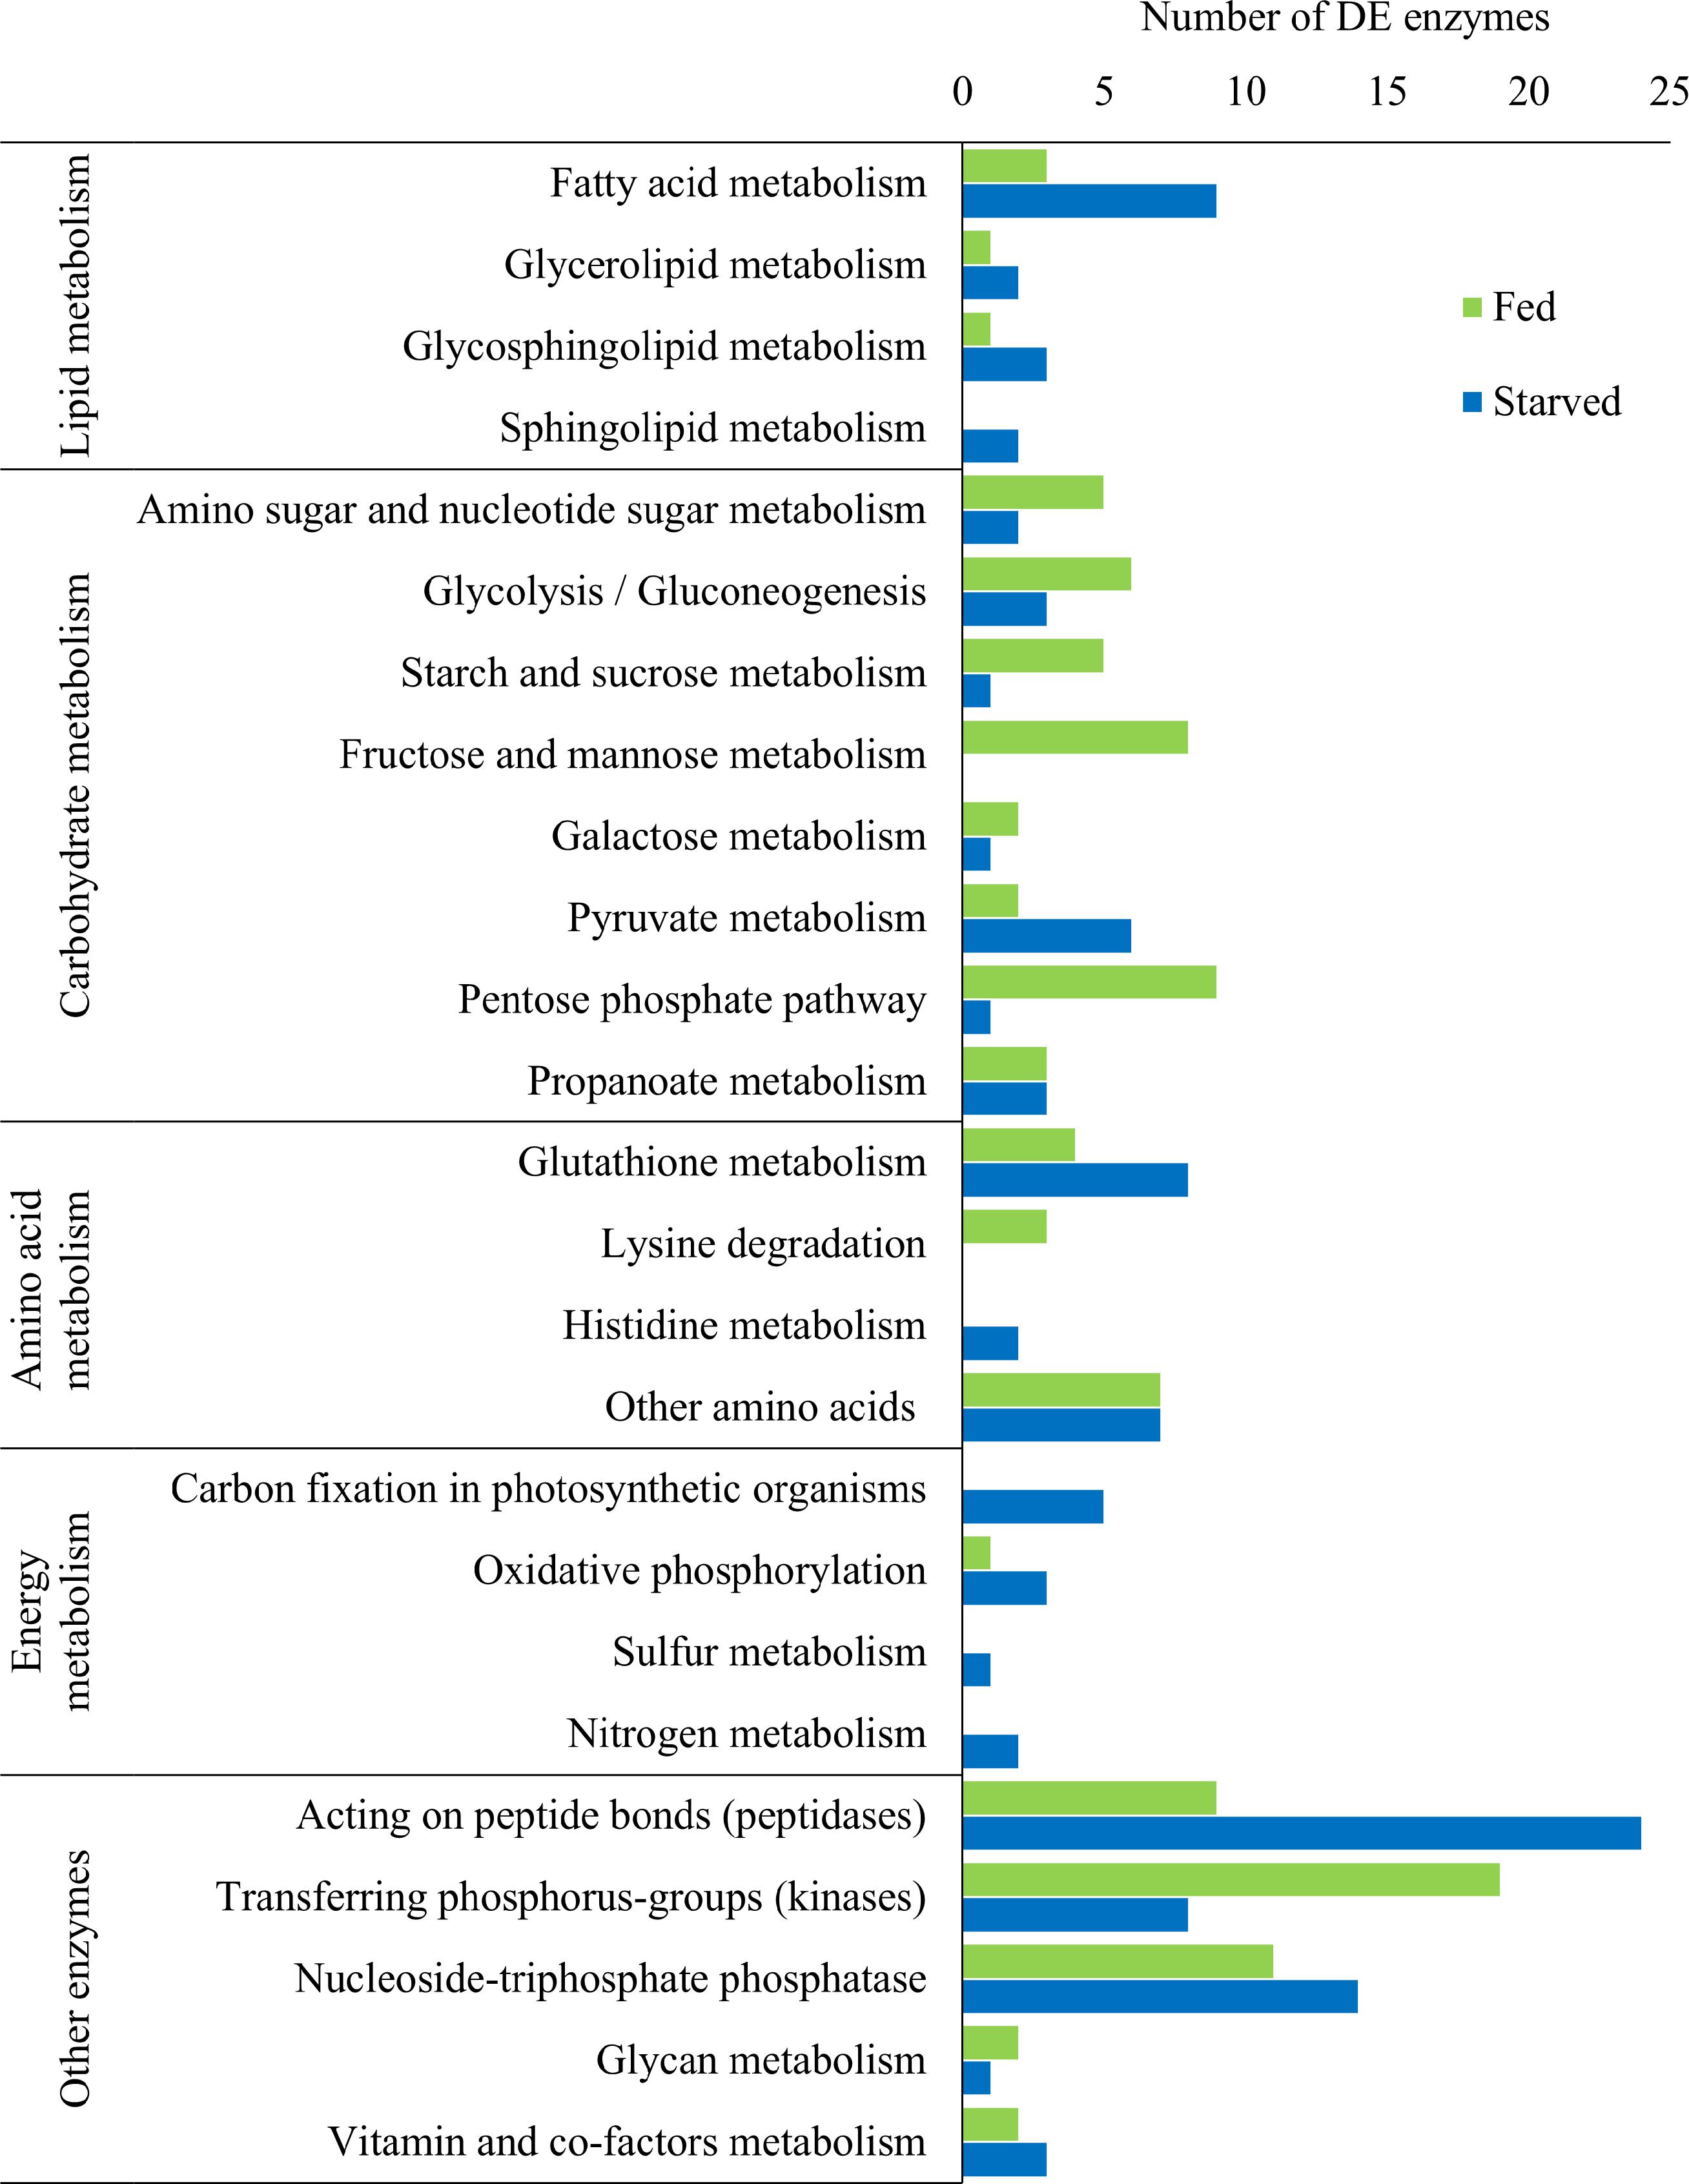
Figure 6. Number of significantly differentially expressed (DE) putative KEGG enzymes across five broad metabolic categories in O. marina cells during feeding and starvation.
Metabolic pathways for carbohydrate and lipid synthesis were examined in detail. KEGG enzymes involved in carbohydrate biosynthesis were mostly upregulated in feeding O. marina cells (Figure 7). Several enzymes of the gluconeogenesis pathway including three different fructose-bisphosphate aldolases (EC:4.1.2.13), 6-phosphofructokinase (EC:2.7.1.11), phosphohexose isomerase (EC:5.3.1.9), and phosphoglucomutase (EC:5.4.2.2) were upregulated in the fed cells. In addition, the enzyme responsible for the synthesis of glucose polymers (either starch or glycogen), the glycogen branching enzyme (EC:2.4.1.18) was upregulated in fed O. marina cells. Further, enzymes involved in the production of trehalose (EC:3.1.3.12), D-xylose (EC:3.2.1.37), and the nucleotide sugar, GDP-mannose (EC:4.2.1.47) were also upregulated during feeding. Only one enzyme in the carbohydrate metabolism pathway was found to be upregulated in the starved cells and it was a glycogen degrading enzyme, the glucan 1,4-alpha-glucosidase (gamma amylase, EC:3.2.1.3).
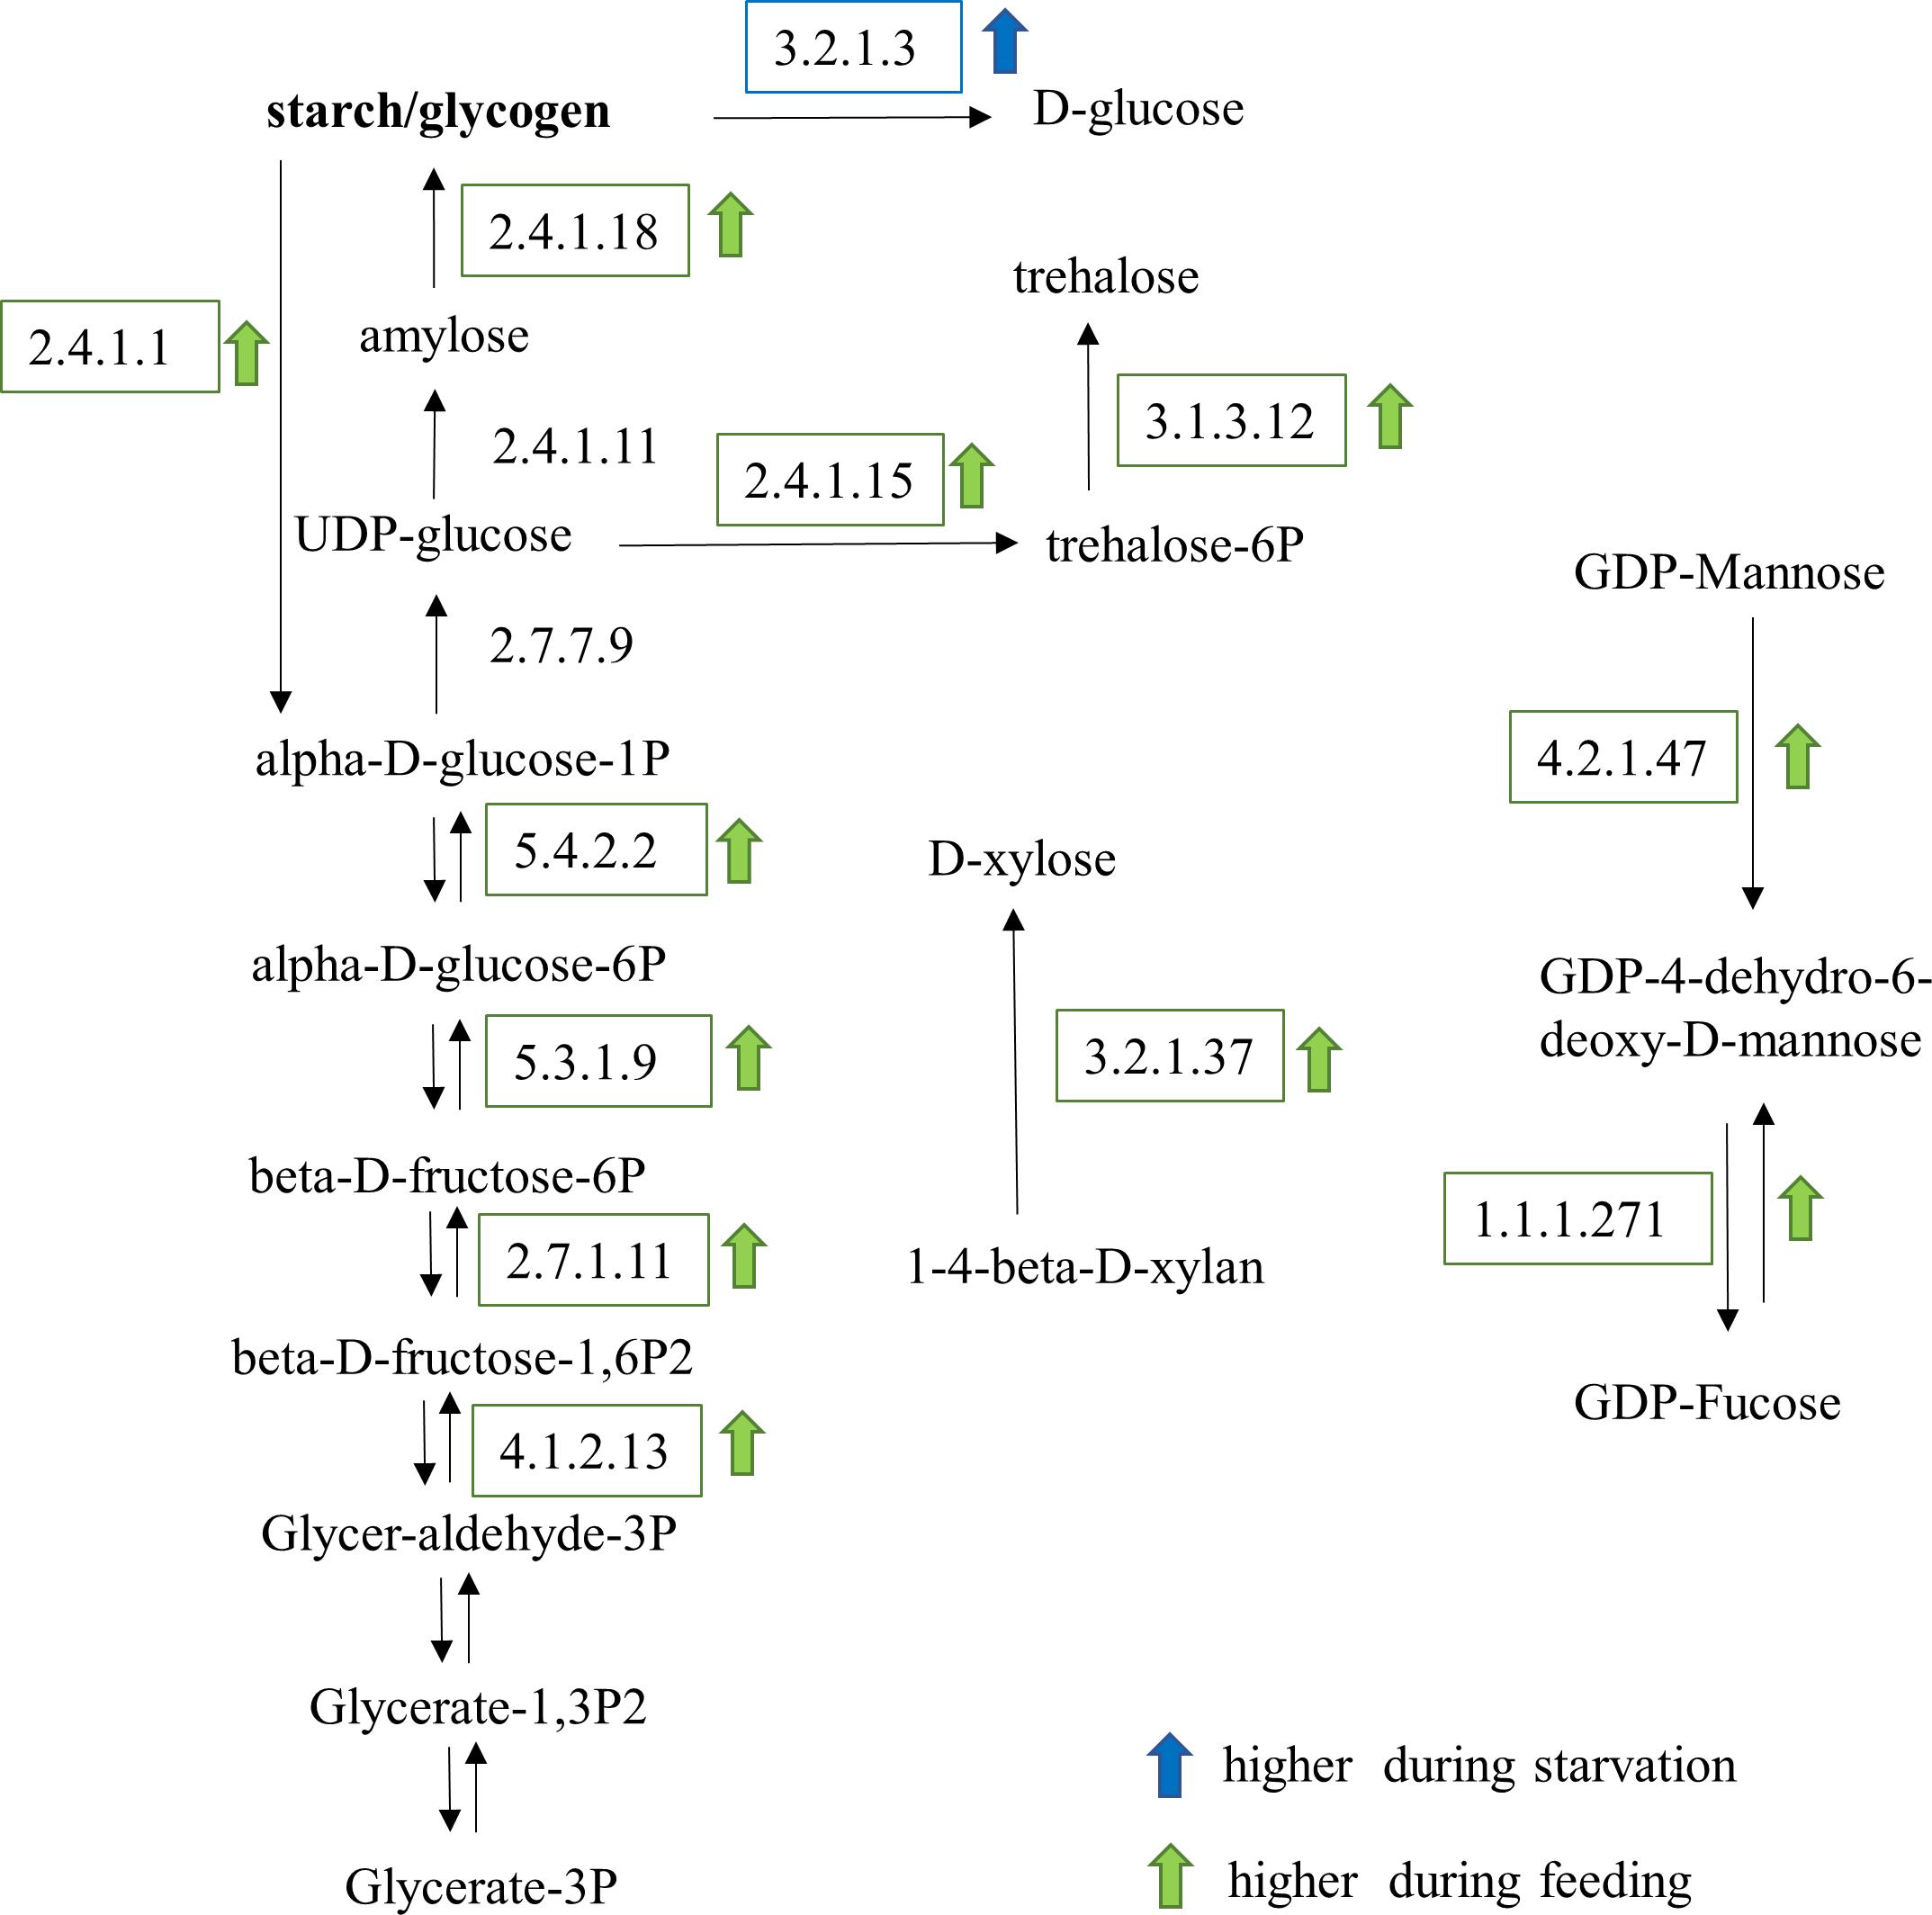
Figure 7. Carbohydrate metabolic pathways affected by the feeding and starvation state in O. marina cells. Arrows and boxes indicate significantly differentially expressed transcripts in either the fed (green) or starved (blue) treatments.
Kyoto Encyclopedia of Genes and Genomes (KEGG) enzymes involved in lipid metabolism were significantly DE during starvation (Figure 8). Specifically, two enzymes involved in the conversion of fatty acids to alcohols, the aldehyde dehydrogenase (EC:1.2.1.3) and the alcohol dehydrogenase (EC:1.1.1.1), were upregulated during starvation. The upregulation of ceramidase (EC:3.5.1.23) and alpha-galactosidase (EC:3.2.1.22) during starvation suggests degradation of sphingolipids or lipids inside the cell membranes. Further, the upregulation of the beta-ketoacyl acyl carrier protein (ACP) reductase (EC:1.1.1.100) and stearoyl-CoA 9-desaturase (EC:1.14.19.1) in starved cells suggests accumulation of oleic acid. In contrast, changes in lipid metabolism during grazing included the upregulation of the transcript encoding the monoacylglycerol lipase (EC:3.1.1.23) and two enzymes involved in fatty acid synthesis (fatty acid synthase, EC:2.3.1.85 and enoyl-[ACP] reductase, EC:1.3.1.9).
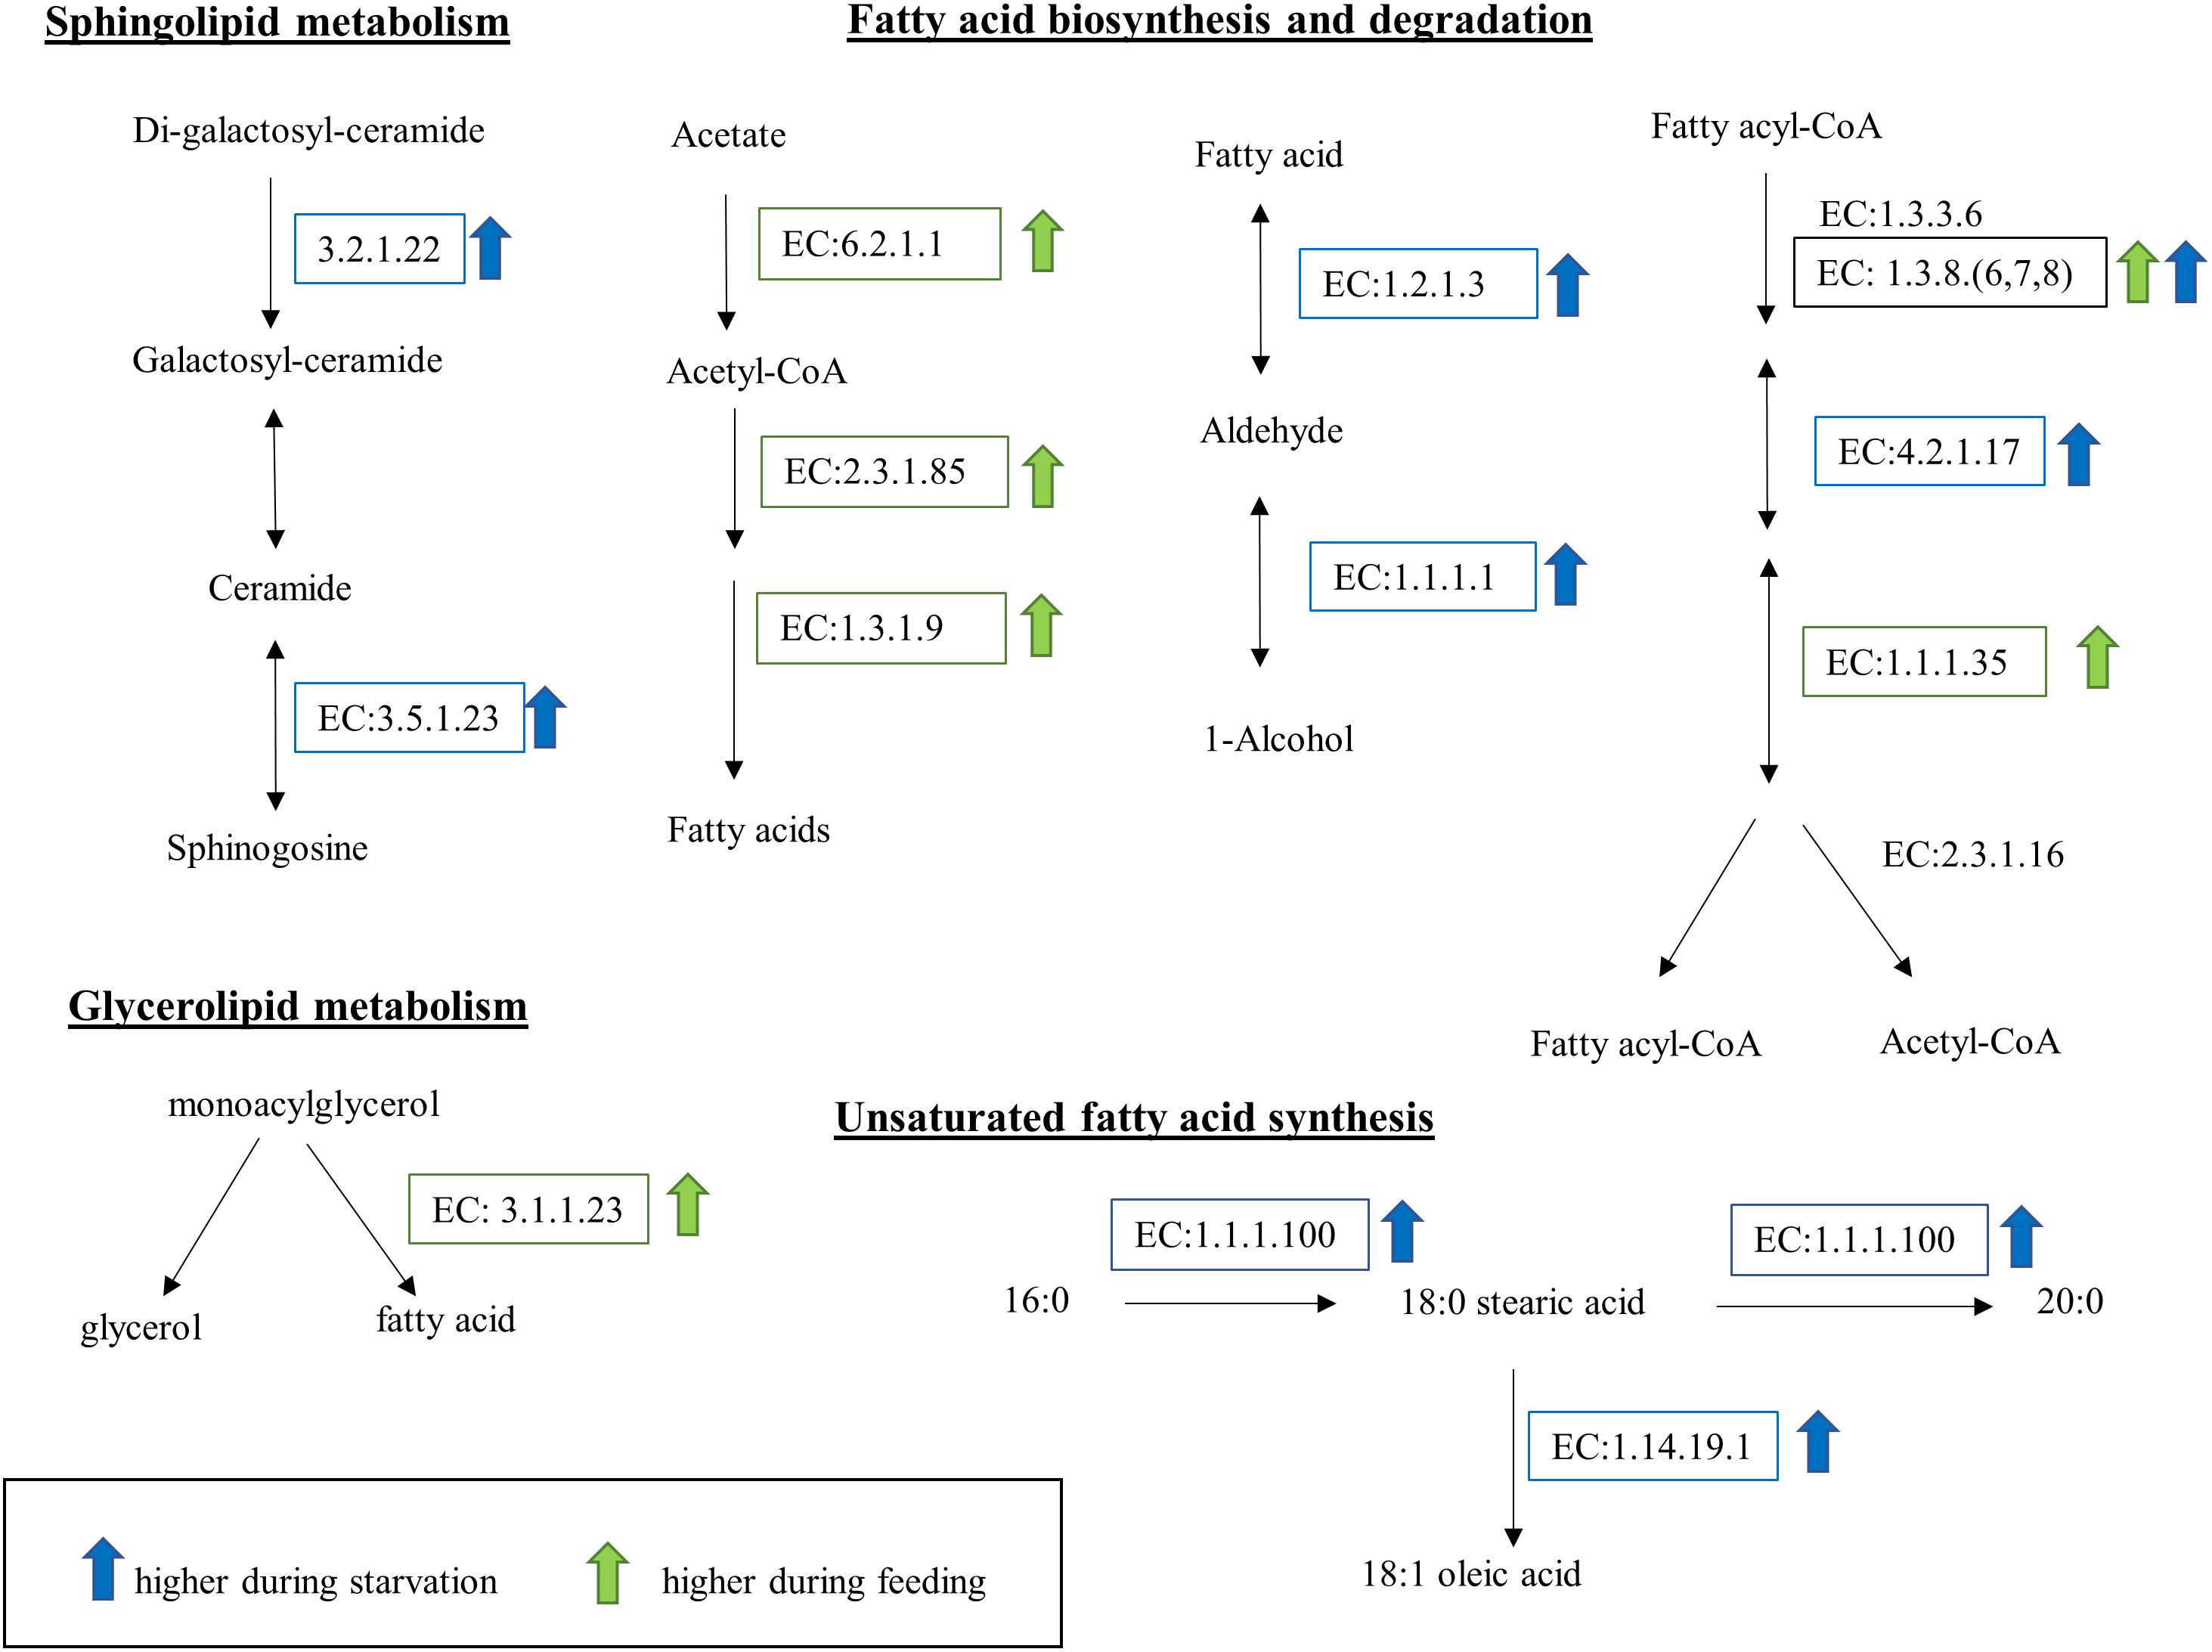
Figure 8. Lipid and fatty acid metabolic pathways affected by feeding and starvation state in O. marina cells. Arrows and boxes indicate significantly differentially expressed transcripts in either the fed (green) or starved (blue) treatments. The upregulation of EC:1.3.8(6,7,8) in both treatments reflects the expression of different transcripts with the same EC designation.
Discussion
Significant shifts in gene expression were observed between O. marina cells that were fed and starved. These data provide insights into the molecular underpinnings of the feeding and starvation processes. We found 3.4% of the transcriptome (1576 O. marina contigs) to be regulated on the transcriptional level which is in general agreement with other dinoflagellates (reviewed by Roy et al., 2018) and other eukaryotic organisms (e.g., Dyhrman et al., 2012; Bochenek et al., 2013; Liu et al., 2015). Here, the transcriptomic response of the predator feeding on high prey concentrations included 972 upregulated transcripts revealing cellular and metabolic processes indicative of active grazing. These active grazing processes included genes associated with (1) detection of mechanical stimuli and regulation of swimming patterns, (2) adjustment of cell shape and cytoskeletal re-arrangement, (3) regulation of cell division, and (4) starch and fatty acid synthesis. In response to the starvation treatment, 604 transcripts were found to have higher expression, revealing physiological changes and metabolic adjustments taking place in starving cells. The predator’s molecular response to starvation conditions included higher expression of genes associated with (1) light harvesting proteins called rhodopsins, (2) degradation of storage molecules, including fatty acids, lipids, and polysaccharides (most likely starch), (3) lysosomal self-degradation of organelles, and (4) signs of oxidative stress.
The two feeding stages contrasted here highlighted differences in growth between active feeding and starvation. Under high prey concentrations, O. marina grew at rates similar to those previously reported in other studies using the same prey species (Jeong et al., 2003). Starving cells were alive and actively swimming at the time of harvest. This behavior, coupled with previous observations of extended starvation capacity in O. marina (Anderson and Menden-Deuer, 2017), suggests that the cells were starving but not undergoing senescence.
At the end of the experiment, the active feeding treatments contained more H. akashiwo cells than I. galbana, which was below detection (<1 cell ml-1). The difference in prey abundance was reflected in the transcriptome. When the predator was feeding on H. akashiwo, there was a sevenfold higher number of significantly differentially expressed transcripts compared to when it was feeding on I. galbana. The cell concentration of the different prey types in fed treatments during harvest provides a possible explanation for the difference in upregulated transcripts between species. During the 3-day experiment, O. marina consumed I. galbana more rapidly than either H. akashiwo strain. As a result, O. marina may have adjusted its metabolism to a reduced level of prey at the time of cell harvest. In contrast, H. akashiwo was still present at the time of harvest, suggesting active feeding and growth. Given the differences observed in the number of upregulated transcripts, we have not focused on the dependence of gene regulation on prey type but instead focused on an overall description of metabolic processes related to feeding and starvation in O. marina.
Energy Acquisition and Storage During Grazing
Oxyrrhis marina has an intricate set of swimming behaviors, allowing for the search, detection, and capture of prey items (Roberts et al., 2011). We identified a set of genes that may be involved in prey detection and phagocytosis. When feeding on H. akashiwo, O. marina cells exhibited several upregulated transcripts encoding voltage-gated potassium and calcium transmembrane channels. Voltage-gated ion channels are involved in detection of mechanical stimuli and in the regulation of swimming behavior in eukaryotic protists including Paramecium (a ciliate), Chlamydomonas (a green alga), Stylonychia (a ciliate), and others (Naitoh and Eckert, 1969; Catterall, 1995; Martinac et al., 2008). It is possible that similar voltage-gated ion channels might allow O. marina to detect prey movement and regulate its swimming patterns during prey chase and capture. In contrast to high food availability treatments, during starvation none of the voltage-gated channels were upregulated possibly because there is no need for the intricate regulation of swimming, maneuvering, and prey detection during prey capture.
After prey detection and capture, O. marina uses phagocytosis to ingest its prey. It has been hypothesized that O. marina phagocytosis might coincide with an increased activity of kinases (Roberts et al., 2011), which are commonly responsible for signal transduction processes and activation of enzymes via phosphorylation. We found that a large set of kinases are in fact significantly upregulated during feeding suggesting their involvement in the regulation of cellular processes related to feeding. We also detected several highly expressed transcripts involved in the regulation of cytoskeleton organization, cell shape, and polarity during feeding. This agrees with the previous direct observation of reorganization of microtubular bands in O. marina cells during phagocytosis. The involvement of cytoskeletal changes (e.g., actin remodeling) during phagocytosis is a fundamental process of eukaryotic cells (May and Machesky, 2001; Fletcher and Mullins, 2010). The transcriptomic response revealed here allowed us to link phagocytosis to specific transcripts encoding protein components of the cytoskeleton in dinoflagellates. These phagocytosis-related transcripts could be used in future studies to examine the molecular regulation of food engulfment in dinoflagellates.
Following prey ingestion by phagocytosis, the prey is digested inside food vacuoles that become infused with digestive enzymes (Mast, 1947; Öpik and Flynn, 1989; Hausmann, 2002). Interestingly, no upregulated digestive enzymes in response to grazing were identified in this study. These enzymes, however, might be regulated on the post-transcriptional level (Roy et al., 2018) or they are in the group of transcripts that were differentially expressed but not functionally annotated. Further studies are required to address the expression of digestive enzymes.
Actively feeding O. marina cells increased the expression of genes associated with the synthesis of polysaccharides including starch. The biosynthesis of starch is well documented, and primary (short-term) energy storage of excess glucose is found in nearly all organisms across all kingdoms (Zmasek and Godzik, 2014). Storage polysaccharides are synthesized by all organisms from bacteria to animals (Ball and Morell, 2003; Zmasek and Godzik, 2014). Glycogen is found in most animals, fungi, and bacteria (including cyanobacteria and archaebacterial species), while starch is only found in photosynthetic eukaryotes including non-photosynthetic dinoflagellates (Ball and Morell, 2003). The increased expression of genes associated with polysaccharide synthesis suggests that the predator was food satiated and excess glucose was being stored as energy reserve. In particular, GO-enrichment analysis showed that out of 31 GO terms that were overrepresented in the transcripts during feeding, 14 described carbohydrate metabolic processes including glycolysis and gluconeogenesis. In addition, the key enzyme involved in the synthesis of long glucose polymerase, the starch/glycogen synthase (EC:2.4.1.18), was found to be upregulated in fed O. marina cells. This enzyme was upregulated in O. marina cells feeding on all three prey types suggesting that O. marina cells use the starch as an energy storage molecule regardless of the type of phytoplankton it feeds on. Interestingly, the glucan 1,4-alpha glycosidase (EC:3.2.1.3) that is directly involved in the degradation of starch/glycogen was upregulated in the starved O. marina cells revealing the potentially important role that the starch/glycogen molecule is playing in the alternating feeding and starvation metabolic states. Starch/glycogen are primary (short-term) energy storage molecules as their conversion to glucose requires short and simple reactions (Scialdone and Howard, 2015). Enzymes for the production of starch have been found in other dinoflagellates (Butterfield et al., 2013) indicating a common pathway for this group of protists and their common ability to store energy in carbohydrates.
Survival During Starvation: Utilization of Stored Energy Reserves and Autophagy
During starvation conditions, organisms generally utilize energy reserves such as those stored in glycogen and lipids, breaking them down using the process of autophagy (Kaur and Debnath, 2015). Here, starving O. marina upregulated enzymes putatively involved in the degradation of energy-storage molecules (polysaccharides and lipids), presumably to cope with the lack of food availability. For example, in starved O. marina, there was increased expression of a transcript encoding glucan 1,4-alpha-glycosidase (EC:3.2.1.3, aka amylase), used for the digestion of stored starch/glycogen molecules (Ball and Morell, 2003; Zmasek and Godzik, 2014). Additional enzymes, presumably responsible for the degradation of various molecules, such as an alpha-galactosidase (Weignerová et al., 2009; Katrolia et al., 2014), an acid ceramidase (Canals et al., 2011), and a lipase (Svendsen, 2000; Thakur, 2012) were also upregulated in starved cells. The upregulation of acid ceramidase (EC:3.5.1.23) suggests that the starving cells might be digesting polar lipids (sphingolipids) present in cell membranes (Futerman and Hannun, 2004). Thus, this enzyme could also be involved in autophagy or self-digestion, specifically in the digestion of organellar membranes (Kaur and Debnath, 2015).
Autophagy is a well-documented and common response to starvation among many eukaryotic organisms. It is defined as a controlled and selective self-degradation of cytoplasmic and organellar components in order to preserve minimal cellular functions (Sinai and Roepe, 2012; Kaur and Debnath, 2015). Autophagy is a type of programmed cell death that is different than apoptosis (Schwartz et al., 1993), by which nutrient limited cells can recycle cellular compounds to sustain limited cell functions (Sinai and Roepe, 2012). In the current study, the process of autophagy was indicated by upregulation of lysosomal peptidases. In addition, two vacuolar ATPases and a vacuolar hydrogen ion pyrophosphate, which ensure activation of peptidases by lysosomal acidification (Holliday, 2014), were also found at higher abundance during starvation.
The molecular signs of autophagy reported in this study agreed with the direct observations of starved O. marina cells, which become smaller in size, transparent, and sometimes deformed (Anderson and Menden-Deuer, 2017). The process of autophagy as well as the signaling pathways that control it are well-described in mammalian and yeast cells, where it co-occurs with oxidative stress and cell-redox mediation (Reggiori and Klionsky, 2002; Lee et al., 2012; Navarro-Yepes et al., 2014; Filomeni et al., 2015; Kaur and Debnath, 2015). Thus, it is possible that a higher abundance of transcripts encoding for several enzymes involved in an antioxidant activity and cell redox homeostasis, including three peroxiredoxins, two thioredoxins, and five components of the glutathione redox system, in the starved O. marina cells are also related to autophagy. Further, transcripts coding for aldo–keto reductases were up-regulated during starvation and these enzymes work in collaboration with other oxido-reducing proteins to ensure redox transformation of common metabolites (Chang et al., 2007; Barski et al., 2008; Chang and Petrash, 2008; Penning, 2015).
Starved O. marina cells also upregulated enzymes involved in unsaturated fatty acid synthesis (EC:1.1.1.100, EC:1.14.19.1). These enzymes are specifically involved in the conversion of saturated fatty acid to unsaturated fatty acids, specifically the production of oleic acid, a monounsaturated fatty acid (C18:1). Although it is counterintuitive for a starving cell to expend energy synthesizing molecules, it is possible that oleic acid is an essential fatty acid for O. marina survival. Although this hypothesis requires further testing, oleic acid concentrations in O. marina cells have been shown to increase after several days of starvation (Yoon et al., 2017), supporting our speculation.
Starving O. marina cells also showed significant increases in the expression of rhodopsins. ATP-generating light-activated rhodopsins (aka proteorhodopsins) have been documented to support metabolic activities in various archaea and bacteria (Fuhrman et al., 2008). In most eukaryotic microorganisms, rhodopsins (a chromophore-retinal binding proteins) function as a photoreceptor (Kikukawa et al., 2012). However, evidence has emerged for proteorhodopsin-mediated phototrophy in some eukaryotes. For example, Slamovits et al. (2011) showed that O. marina possesses proteorhodopsins which are located in cytoplasmic structures resembling an endomembrane system. O. marina proteorhodopsins are phylogenetically similar to both sensory and proton-pumping proteorhodopsins (Slamovits et al., 2011) and show increased expression over time when cells were incubated without prey (Guo et al., 2014). In addition, the authors found 40 distinct rhodopsin genes in the O. marina transcriptome including some that showed phylogenetic grouping to sensory rhodopsins although the majority of them belonged to the proton-pumping proteorhodopsins (Slamovits et al., 2011). Here, nine different transcripts showing the highest similarity to the proton pumping proteorhodopsins were upregulated in O. marina cell during starvation suggesting that the O. marina may be supplementing its energy requirement using this light harvesting mechanism.
Conclusion
Heterotrophic dinoflagellates must identify, capture, and digest prey in a generally dilute ocean. The data from this study provide insight into the molecular basis of feeding and response to starvation states in heterotrophic dinoflagellates. For example, voltage-gated transmembrane channels appear to be involved in the complex swimming behavior of dinoflagellates which allows them to detect, pursue, and capture prey. The active grazing process also requires a large set of enzymes involved in the signal transduction process as well as the regulation of cytoskeletal organization and cell polarity. This study also suggests that rhodopsins allow some dinoflagellates to utilize light energy during times of food scarcity. In addition, the regulated and organized process of self-digestion (autophagy) allows dinoflagellates to sustain minimum cellular functions by recycling cellular organic matter, helping to explain their ability to survive long periods of starvation (Menden-Deuer et al., 2005). Furthermore, the feeding and starvation experiments revealed that the primary short-term storage of extra glucose produced during periods of high food availability is a long polymer of glucose, mostly likely starch (Ball and Morell, 2003), which might be used during the first few days of food shortage. The results from this study are fundamental building blocks for further studies that will develop new tools for measuring protist grazing in situ, a notorious challenge. For example, the formation and digestion of starch/glycogen could be used as a tool to measure dinoflagellate response to pulses of prey in the water column. It is our hope that ultimately the molecular signals measured here can be used to provide broad-scale, high resolution measurements of grazing in marine microbial food webs and identify the environmental and biological drivers of grazing, the major loss factor of marine primary production.
Author Contributions
SM-D and TR designed the study. AM conducted the experiments. ER and SC conducted the bioinformatics analysis. ER, TR, and SM-D wrote the manuscript. All authors read and approved the final manuscript.
Funding
This research was supported by the Rhode Island Science and Technology Advisory Council (to SM-D and TR) and NASA grant 80NSSC17K0716 (to SM-D and TR) as part of the Export Processes in the Global Ocean from Remote Sensing (EXPORTS) field campaign. This research was funded in part by the Gordon and Betty Moore Foundation through Grant 2637 to the National Center for Genome Resources, where samples were sequenced and assembled. This study was conducted using the Center for Computation and Visualization, Brown University, supported in part by NSF EPSCoR research infrastructure improvement awards EPS-1004057 and OIA-1655221.
Conflict of Interest Statement
The authors declare that the research was conducted in the absence of any commercial or financial relationships that could be construed as a potential conflict of interest.
Acknowledgments
We thank B. Hurwitz for developing and maintaining the iMicrobe database.
Supplementary Material
The Supplementary Material for this article can be found online at: https://www.frontiersin.org/articles/10.3389/fmars.2019.00246/full#supplementary-material
References
Altschul, S. F., Gish, W., Miller, W., Myers, E. W., and Lipman, D. J. (1990). Basic local alignment search tool. J. Mol. Biol. 215, 403–410. doi: 10.1016/S0022-2836(05)80360-2
Anderson, S. R., and Menden-Deuer, S. (2017). Growth, grazing, and starvation survival in three heterotrophic dinoflagellate species. J. Eukaryot. Microbiol. 64, 213–225. doi: 10.1111/jeu.12353
Ashburner, M., Ball, C. A., Blake, J. A., Botstein, D., Butler, H., Cherry, J. M., et al. (2000). Gene ontology: tool for the unification of biology. Nat. Genet. 25, 25–29. doi: 10.1038/75556
Ball, S. G., and Morell, M. K. (2003). From bacterial glycogen to starch: understanding the biogenesis of plant starch granule. Annu. Rev. Plant Biol. 54, 207–233. doi: 10.1146/annurev.arplant.54.031902.134927
Barski, O. A., Tipparaju, S. M., and Bhatnagar, A. (2008). The aldo-keto reductase superfamily and its role in drug metabolism and detoxification. Drug Metab. Rev. 40, 553–624. doi: 10.1080/03602530802431439
Bochenek, M., Etherington, G. J., Koprivova, A., Mugford, S. T., Bell, T. G., Malin, G., et al. (2013). Transcriptome analysis of the sulfate deficiency response in the marine microalga Emiliania huxleyi. New Phytol. 199, 650–662. doi: 10.1111/nph.12303
Bolger, A. M., Lohse, M., and Usadel, B. (2014). Trimmomatic: a flexible trimmer for illumina sequence data. Bioinformatics 30, 2114–2120. doi: 10.1093/bioinformatics/btu170
Butterfield, E. R., Howe, C. J., and Nisbet, R. E. R. (2013). An analysis of dinoflagellate metabolism using EST data. Protist 164, 218–236. doi: 10.1016/j.protis.2012.09.001
Calbet, A., Isari, S., Martínez, R. A., Saiz, E., Garrido, S., Peters, J., et al. (2013). Adaptations to feast and famine in different strains of the marine heterotrophic dinoflagellates Gyrodinium dominans and Oxyrrhis marina. Mar. Ecol. Prog. Ser. 483, 67–84. doi: 10.3354/meps10291
Calbet, A., and Landry, M. R. (2004). Phytoplankton growth, microzooplankton grazing, and carbon cycling in marine systems. Limnol. Oceanogr. 49, 51–57. doi: 10.4319/lo.2004.49.1.0051
Calbet, A., and Saiz, E. (2005). The ciliate-copepod link in marine ecosystems. Aquat. Microb. Ecol. 38, 157–167. doi: 10.3354/ame038157
Campbell, R. G., Sherr, E. B., Ashjian, C. J., Plourde, S., Sherr, B. F., Hill, V., et al. (2009). Mesozooplankton prey preference and grazing impact in the western Arctic Ocean. Deep Sea Res. Part II 56, 1274–1289. doi: 10.1016/j.dsr2.2008.10.027
Canals, D., Perry, D. M., Jenkins, R. W., and Hannun, Y. A. (2011). Drug targeting of sphingolipid metabolism: sphingomyelinases and ceramidases: drug targeting, sphingomyelinases and ceramidases. Br. J. Pharm. Chemoth. 163, 694–712. doi: 10.1111/j.1476-5381.2011.01279.x
Catterall, W. A. (1995). Structure and function of voltage-gated ion channels. Annu. Rev. Biochem. 64, 493–531. doi: 10.1146/annurev.bi.64.070195.002425
Chang, Q., Griest, T. A., Harter, T. M., and Mark Petrash, J. (2007). Functional studies of aldo-keto reductases in Saccharomyces cerevisiae. BBA Mol. Cell Res. 1773, 321–329. doi: 10.1016/j.bbamcr.2006.10.009
Chang, Q., and Petrash, J. M. (2008). Disruption of aldo-keto reductase genes leads to elevated markers of oxidative stress and inositol auxotrophy in Saccharomyces cerevisiae. BBA Mol. Cell Res. 1783, 237–245. doi: 10.1016/j.bbamcr.2007.08.008
Conesa, A., Gotz, S., Garcia-Gomez, J. M., Terol, J., Talon, M., and Robles, M. (2005). Blast2GO: a universal tool for annotation, visualization and analysis in functional genomics research. Bioinformatics 21, 3674–3676. doi: 10.1093/bioinformatics/bti610
Du, Z., Zhou, X., Ling, Y., Zhang, Z., and Su, Z. (2010). agriGO: a GO analysis toolkit for the agricultural community. Nucleic Acids Res. 38, W64–W70. doi: 10.1093/nar/gkq310
Dyhrman, S. T., Jenkins, B. D., Rynearson, T. A., Saito, M. A., Mercier, M. L., Alexander, H., et al. (2012). The transcriptome and proteome of the diatom Thalassiosira pseudonana reveal a diverse phosphorus stress response. PLoS One 7:e33768. doi: 10.1371/journal.pone.0033768
Filomeni, G., De Zio, D., and Cecconi, F. (2015). Oxidative stress and autophagy: the clash between damage and metabolic needs. Cell Death Differ. 22, 377–388. doi: 10.1038/cdd.2014.150
Fletcher, D. A., and Mullins, R. D. (2010). Cell mechanics and the cytoskeleton. Nature 463, 485–492. doi: 10.1038/nature08908
Fuhrman, J. A., Schwalbach, M. S., and Stingl, U. (2008). Proteorhodopsins: an array of physiological roles? Nat. Rev. Microbiol. 6, 488–494. doi: 10.1038/nrmicro1893
Futerman, A. H., and Hannun, Y. A. (2004). The complex life of simple sphingolipids. EMBO Rep. 5, 777–782. doi: 10.1038/sj.embor.7400208
Guillard, R. R. L., and Ryther, J. H. (1962). Studies of marine planktonic diatoms: I. cyclotella nana (Hustedt) and detonula confervacea (Cleve) gran. Can. J. Microbiol. 8, 229–239. doi: 10.1139/m62-029
Guo, Z., Zhang, H., and Lin, S. (2014). Light-promoted rhodopsin expression and starvation survival in the marine Dinoflagellate Oxyrrhis marina. PLoS One 9:e114941. doi: 10.1371/journal.pone.0114941
Guo, Z., Zhang, H., Liu, S., and Lin, S. (2013). Biology of the marine heterotrophic Dinoflagellate Oxyrrhis marina: current status and future directions. Microorganisms 1, 33–57. doi: 10.3390/microorganisms1010033
Hansen, P. J., Bjørnsen, P. K., and Hansen, B. W. (1997). Zooplankton grazing and growth: scaling within the 2-2,000-μm body size range. Limnol. Oceanogr. 42, 687–704. doi: 10.4319/lo.1997.42.4.0687
Hartz, A. J., Sherr, B. F., and Sherr, E. B. (2008). Using inhibitors to investigate the involvement of cell signaling in predation by marine phagotrophic protists. J. Eukaryot. Microbiol. 55, 18–21. doi: 10.1111/j.1550-7408.2007.00297.x
Harvey, E. L., and Menden-Deuer, S. (2012). Predator-induced fleeing behaviors in phytoplankton: a new mechanism for harmful algal bloom formation? PLoS One 7:e46438. doi: 10.1371/journal.pone.0046438
Hausmann, K. (2002). Food acquisition, food ingestion and food digestion by protists. Jap. J. Protist. 35:11.
Holliday, L. S. (2014). Vacuolar H+ -ATPase: an essential multitasking enzyme in physiology and pathophysiology. New J. Sci. 2014, 1–21. doi: 10.1155/2014/675430
Jakobsen, H. H., and Strom, S. L. (2004). Circadian cycles in growth and feeding rates ofheterotrophic protist plankton. Limnol. Oceanogr. 49, 1915–1922. doi: 10.4319/lo.2004.49.6.1915
Jeong, H. J., Kim, J. S., Yoo, Y. D., Kim, S. T., Kim, T. H., Park, M. G., et al. (2003). Feeding by the heterotrophic Dinoflagellate Oxyrrhis marina on the red-tide raphidophyte Heterosigma akashiwo: a potential biological method to control red tides using mass-cultured grazers. J. Eukaryot. Microbiol. 50, 274–282. doi: 10.1111/j.1550-7408.2003.tb00134.x
Kanehisa, M., Sato, Y., and Morishima, K. (2016). BlastKOALA and GhostKOALA: KEGG tools for functional characterization of genome and metagenome sequences. J. Mol. Biol. 428, 726–731. doi: 10.1016/j.jmb.2015.11.006
Katrolia, P., Rajashekhara, E., Yan, Q., and Jiang, Z. (2014). Biotechnological potential of microbial α-galactosidases. Crit. Rev. Biotechnol. 34, 307–317. doi: 10.3109/07388551.2013.794124
Kaur, J., and Debnath, J. (2015). Autophagy at the crossroads of catabolism and anabolism. Nat. Rev. Mol. Cell. Biol. 16, 461–472. doi: 10.1038/nrm4024
Keeling, P. J., Burki, F., Wilcox, H. M., Allam, B., Allen, E. E., Amaral-Zettler, L. A., et al. (2014). The marine microbial eukaryote transcriptome sequencing project (MMETSP): illuminating the functional diversity of eukaryotic life in the oceans through transcriptome sequencing. PLoS Biol. 12:e1001889. doi: 10.1371/journal.pbio.1001889
Kikukawa, T., Tamogami, J., Shimono, K., Demura, M., Nara, T., and Kamo, N. (2012). “Photo-induced proton transfers of microbial rhodopsins,” in Molecular Photochemistry – Various Aspects, ed. S. Saha (InTech). doi: 10.5772/34105
Langmead, B., Trapnell, C., Pop, M., and Salzberg, S. L. (2009). Ultrafast and memory-efficient alignment of short DNA sequences to the human genome. Genome Biol. 10:R25. doi: 10.1186/gb-2009-10-3-r25
Lee, J., Giordano, S., and Zhang, J. (2012). Autophagy, mitochondria and oxidative stress: cross-talk and redox signaling. Biochem. J. 441, 523–540. doi: 10.1042/BJ20111451
Lee, R., Lai, H., Malik, S., Saldarriaga, J. F., Keeling, P. J., and Slamovits, C. H. (2014). Analysis of EST data of the marine protist Oxyrrhis marina, an emerging model for alveolate biology and evolution. BMC Genomics 15:122. doi: 10.1186/1471-2164-15-122
Li, B., and Dewey, C. N. (2011). RSEM: accurate transcript quantification from RNA-Seq data with or without a reference genome. BMC Bioinformatics 12:323. doi: 10.1186/1471-2105-12-323
Liu, Z., Jones, A. C., Campbell, V., Hambright, K. D., Heidelberg, K. B., and Caron, D. A. (2015). Gene expression in the mixotrophic prymnesiophyte, Prymnesium parvum, responds to prey availability. Front. Microbiol. 6:319. doi: 10.3389/fmicb.2015.00319
Löder, M. G. J., Meunier, C., Wiltshire, K. H., Boersma, M., and Aberle, N. (2011). The role of ciliates, heterotrophic dinoflagellates and copepods in structuring spring plankton communities at Helgoland Roads, North Sea. Mar. Biol. 158, 1551–1580. doi: 10.1007/s00227-011-1670-2
Lowe, C. D., Mello, L. V., Samatar, N., Martin, L. E., Montagnes, D. J., and Watts, P. C. (2011). The transcriptome of the novel dinoflagellate Oxyrrhis marina (Alveolata: Dinophyceae): response to salinity examined by 454 sequencing. BMC Genomics 12:519. doi: 10.1186/1471-2164-12-519
Martinac, B., Saimi, Y., and Kung, C. (2008). Ion channels in microbes. Physiol. Rev. 88, 1449–1490. doi: 10.1152/physrev.00005.2008
May, R. C., and Machesky, L. M. (2001). Phagocytosis and the actin cytoskeleton. J. Cell Sci. 114, 1061–1071.
Menden-Deuer, S., Lessard, E., and Satterberg, J. (2001). Effect of preservation on dinoflagellate and diatom cell volume, and consequences for carbon biomass predictions. Mar. Ecol. Prog. Ser. 222, 41–50. doi: 10.3354/meps222041
Menden-Deuer, S., Lessard, E., Satterberg, J., and Grünbaum, D. (2005). Growth rates and starvation survival of three species of the pallium-feeding, thecate dinoflagellate genus protoperidinium. Aquat. Microb. Ecol. 41, 145–152. doi: 10.3354/ame041145
Montagnes, D., Barbosa, A., Boenigk, J., Davidson, K., Jürgens, K., Macek, M., et al. (2008). Selective feeding behaviour of key free-living protists: avenues for continued study. Aquat. Microb. Ecol. 3, 83–98. doi: 10.3354/ame01229
Montagnes, D. J. S., Lowe, C. D., Roberts, E. C., Breckels, M. N., Boakes, D. E., Davidson, K., et al. (2011). An introduction to the special issue: Oxyrrhis marina, a model organism? J. Plankton Res. 33, 549–554. doi: 10.1093/plankt/fbq121
Naitoh, Y., and Eckert, R. (1969). Ionic mechanisms controlling behavioral responses of paramecium to mechanical stimulation. Science 164, 963–965. doi: 10.1126/science.164.3882.963
Navarro-Yepes, J., Burns, M., Anandhan, A., Khalimonchuk, O., del Razo, L. M., Quintanilla-Vega, B., et al. (2014). Oxidative stress, redox signaling, and autophagy: cell death versus survival. Antioxid. Redox. Sign. 21, 66–85. doi: 10.1089/ars.2014.5837
Öpik, H., and Flynn, K. J. (1989). The digestive process of the dinoflagellate, Oxyrrhis marina Dujardin, feeding on the chlorophyte, Dunaliella primolecta butcher: a combined study of ultrastructure and free amino acids. New Phytol. 113, 143–151. doi: 10.1111/j.1469-8137.1989.tb04700.x
Penning, T. M. (2015). The aldo-keto reductases (AKRs): overview. Chem. Biol. Interact. 234, 236–246. doi: 10.1016/j.cbi.2014.09.024
Reggiori, F., and Klionsky, D. J. (2002). Autophagy in the eukaryotic cell. Eukaryot. Cell 1, 11–21. doi: 10.1128/EC.01.1.11-21.2002
Roberts, E. C., Wootton, E. C., Davidson, K., Jeong, H. J., Lowe, C. D., and Montagnes, D. J. S. (2011). Feeding in the dinoflagellate Oxyrrhis marina: linking behaviour with mechanisms. J. Plankt. Res. 33, 603–614. doi: 10.1093/plankt/fbq118
Roberts, E. C., Zubkov, M. V., Martin-Cereceda, M., Novarino, G., and Wootton, E. C. (2006). Cell surface lectin-binding glycoconjugates on marine planktonic protists. FEMS Microbiol. Lett. 265, 202–207. doi: 10.1111/j.1574-6968.2006.00484.x
Roy, S., Jagus, R., and Morse, D. (2018). Translation and translational control in Dinoflagellates. Microorganisms 6:30. doi: 10.3390/microorganisms6020030
Santoferrara, L. F., Guida, S., Zhang, H., and McManus, G. B. (2014). De novo transcriptomes of a mixotrophic and a heterotrophic ciliate from marine plankton. PLoS One 9:e101418. doi: 10.1371/journal.pone.0101418
Schmoker, C., Hernández-León, S., and Calbet, A. (2013). Microzooplankton grazing in the oceans: impacts, data variability, knowledge gaps and future directions. J. Plankt. Res. 35, 691–706. doi: 10.1093/plankt/fbt023
Schwartz, L. M., Smith, S. W., Jones, M., and Osborne, B. A. (1993). Do all programmed cell deaths occur via apoptosis? Proc. Natl. Acad. Sci. U.S.A. 90, 980–984. doi: 10.1073/pnas.90.3.980
Scialdone, A., and Howard, M. (2015). How plants manage food reserves at night: quantitative models and open questions. Front. Plant Sci. 6:204. doi: 10.3389/fpls.2015.00204
Sherr, E., and Sherr, B. (2009). Capacity of herbivorous protists to control initiation and development of mass phytoplankton blooms. Aquat. Microb. Ecol. 57, 253–262. doi: 10.3354/ame01358
Sinai, A. P., and Roepe, P. D. (2012). Autophagy in apicomplexa: a life sustaining death mechanism? Trends Parasitol. 28, 358–364. doi: 10.1016/j.pt.2012.06.006
Slamovits, C. H., Okamoto, N., Burri, L., James, E. R., and Keeling, P. J. (2011). A bacterial proteorhodopsin proton pump in marine eukaryotes. Nat. Commun. 2:183. doi: 10.1038/ncomms1188
Strom, S. (2002). Novel interactions between phytoplankton and microzooplankton: their influence on the coupling between growth and grazing rates in the sea. Hydrobiologia 480, 41–54.
Svendsen, A. (2000). Lipase protein engineering. BBA Protein Struct. M 1543, 223–238. doi: 10.1016/S0167-4838(00)00239-9
Thakur, S. (2012). Lipases, its sources, properties and applications: a review. Int. J. Sci. Eng. Res. 3:29.
Tian, T., Liu, Y., Yan, H., You, Q., Yi, X., Du, Z., et al. (2017). agriGO v2.0: a GO analysis toolkit for the agricultural community, 2017 update. Nucleic Acids Res. 45, W122–W129. doi: 10.1093/nar/gkx382
Tillmann, U. (2004). Interactions between planktonic microalgae and protozoan grazers1. J. Eukaryot. Microbiol. 51, 156–168. doi: 10.1111/j.1550-7408.2004.tb00540.x
Weignerová, L., Simerská, P., and Křen, V. (2009). α-Galactosidases and their applications in biotransformations. Biocatal. Biotransfor. 27, 79–89. doi: 10.1080/10242420802583416
Weisse, T., Anderson, R., Arndt, H., Calbet, A., Hansen, P. J., and Montagnes, D. J. S. (2016). Functional ecology of aquatic phagotrophic protists – concepts, limitations, and perspectives. Eur. J. Protisto. 55, 50–74. doi: 10.1016/j.ejop.2016.03.003
Wu, Z., Jenkins, B. D., Rynearson, T. A., Dyhrman, S. T., Saito, M. A., Mercier, M., et al. (2010). Empirical bayes analysis of sequencing-based transcriptional profiling without replicates. BMC Bioinformatics 11:564. doi: 10.1186/1471-2105-11-564
Yang, Z., Jeong, H. J., and Montagnes, D. J. S. (2011). The role of Oxyrrhis marina as a model prey: current work and future directions. J. Plankt. Res. 33, 665–675. doi: 10.1093/plankt/fbq112
Yoon, E. Y., Park, J., Jeong, H. J., and Rho, J.-R. (2017). Fatty acid composition and docosahexaenoic acid (DHA) content of the heterotrophic dinoflagellate Oxyrrhis marina fed on dried yeast: compared with algal prey. ALGAE 32, 67–74. doi: 10.4490/algae.2017.32.3.5
Zdobnov, E. M., and Apweiler, R. (2001). InterProScan - an integration platform for the signature-recognition methods in interPro. Bioinformatics 17, 847–848. doi: 10.1093/bioinformatics/17.9.847
Keywords: microzooplankton, grazing, RNA-Seq, differential expression, starvation, transcriptome, NASA EXPoRTS
Citation: Rubin ET, Cheng S, Montalbano AL, Menden-Deuer S and Rynearson TA (2019) Transcriptomic Response to Feeding and Starvation in a Herbivorous Dinoflagellate. Front. Mar. Sci. 6:246. doi: 10.3389/fmars.2019.00246
Received: 29 January 2019; Accepted: 24 April 2019;
Published: 14 May 2019.
Edited by:
Alison Buchan, The University of Tennessee, Knoxville, United StatesReviewed by:
Javier del Campo, University of Miami, United StatesYong Jiang, Ocean University of China, China
Copyright © 2019 Rubin, Cheng, Montalbano, Menden-Deuer and Rynearson. This is an open-access article distributed under the terms of the Creative Commons Attribution License (CC BY). The use, distribution or reproduction in other forums is permitted, provided the original author(s) and the copyright owner(s) are credited and that the original publication in this journal is cited, in accordance with accepted academic practice. No use, distribution or reproduction is permitted which does not comply with these terms.
*Correspondence: Ewelina T. Rubin, ZXdlbGluYV9ydWJpbkB1cmkuZWR1
†Present address: Shu Cheng, University of Arizona Cancer Center, University of Arizona, Tucson, AZ, United States