 Eleanor Frajka-Williams1*
 Isabelle J. Ansorge2
 Johanna Baehr3Harry L. Bryden4
 Maria Paz Chidichimo5
 Stuart A. Cunningham6Gokhan Danabasoglu7
 Shenfu Dong8
 Kathleen A. Donohue9Shane Elipot10
 Patrick Heimbach11
 N. Penny Holliday1
 Rebecca Hummels12Laura C. Jackson13
 Johannes Karstensen12
 Matthias Lankhorst14
 Isabela A. Le Bras14M. Susan Lozier15Elaine L. McDonagh1
 Christopher S. Meinen8
 Herlé Mercier16Bengamin I. Moat1
 Renellys C. Perez8Christopher G. Piecuch17Monika Rhein18
 Meric A. Srokosz1
 Kevin E. Trenberth7Sheldon Bacon1
 Gael Forget19
 Gustavo Goni8Dagmar Kieke18
 Jannes Koelling14
 Tarron Lamont2,20Gerard D. McCarthy21Christian Mertens18Uwe Send14David A. Smeed1
 Sabrina Speich22Marcel van den Berg20
 Denis Volkov8
 Chris Wilson23
- 1National Oceanography Centre, Southampton, United Kingdom
- 2Department of Oceanography, University of Cape Town, Cape Town, South Africa
- 3Institute of Oceanography, CEN, Universitat Hamburg, Hamburg, Germany
- 4University of Southampton, Southampton, United Kingdom
- 5Consejo Nacional de Investigaciones Científicas y Técnicas (CONICET) and Servicio de Hidrografía Naval and UMI-IFAECI/CNRS, Buenos Aires, Argentina
- 6Scottish Association for Marine Science, Oban, Scotland
- 7National Center for Atmospheric Research, Boulder, CO, United States
- 8Atlantic Oceanographic and Meteorological Laboratory, Miami, FL, United States
- 9University of Rhode Island, Narragansett, RI, United States
- 10Rosenstiel School of Marine and Atmospheric Science, University of Miami, Coral Gables, FL, United States
- 11Jackson School of Geosciences, Oden Institute for Computational Engineering and Sciences, The University of Texas at Austin, Austin, TX, United States
- 12GEOMAR Helmholtz Centre for Ocean Research Kiel, Kiel, Germany
- 13Met Office Hadley Centre, Exeter, United Kingdom
- 14Scripps Institution of Oceanography, University of California, San Diego, La Jolla, CA, United States
- 15Nicholas School of the Environment, Duke University, Durham, NC, United States
- 16Laboratoire d'Oceanographie Physique et Spatiale, CNRS, Plouzané, France
- 17Woods Hole Oceanographic Institution, Woods Hole, MA, United States
- 18Center for Marine Environmental Sciences MARUM, Institute for Environmental Physics IUP, Bremen University, Bremen, Germany
- 19Massachusetts Institute of Technology, Cambridge, MA, United States
- 20Department of Environmental Affairs, Cape Town, South Africa
- 21ICARUS, Department of Geography, Maynooth University, Maynooth, Ireland
- 22Laboratoire de Meteorologie Dynamique, UMR 8539 Ecole Polytechnique, ENS, CNRS, Paris, France
- 23National Oceanography Centre, Liverpool, United Kingdom
The Atlantic Meridional Overturning Circulation (AMOC) extends from the Southern Ocean to the northern North Atlantic, transporting heat northwards throughout the South and North Atlantic, and sinking carbon and nutrients into the deep ocean. Climate models indicate that changes to the AMOC both herald and drive climate shifts. Intensive trans-basin AMOC observational systems have been put in place to continuously monitor meridional volume transport variability, and in some cases, heat, freshwater and carbon transport. These observational programs have been used to diagnose the magnitude and origins of transport variability, and to investigate impacts of variability on essential climate variables such as sea surface temperature, ocean heat content and coastal sea level. AMOC observing approaches vary between the different systems, ranging from trans-basin arrays (OSNAP, RAPID 26°N, 11°S, SAMBA 34.5°S) to arrays concentrating on western boundaries (e.g., RAPID WAVE, MOVE 16°N). In this paper, we outline the different approaches (aims, strengths and limitations) and summarize the key results to date. We also discuss alternate approaches for capturing AMOC variability including direct estimates (e.g., using sea level, bottom pressure, and hydrography from autonomous profiling floats), indirect estimates applying budgetary approaches, state estimates or ocean reanalyses, and proxies. Based on the existing observations and their results, and the potential of new observational and formal synthesis approaches, we make suggestions as to how to evaluate a comprehensive, future-proof observational network of the AMOC to deepen our understanding of the AMOC and its role in global climate.
1. Introduction
Solar radiation heats the Earth primarily at tropical latitudes, while radiative cooling occurs quasi-uniformly across the globe. To maintain this pattern of heat flux, the atmosphere and ocean redistribute heat from the tropics to the poles with a net poleward heat flux. In the Atlantic, however, the net heat flux is northward, even in the South Atlantic, a distinct feature captured by the Atlantic meridional overturning circulation (AMOC). A measure of the zonally and vertically accumulated flow at each latitude (to be defined below), the AMOC connects northward flowing warm waters and southward flowing cold waters across all latitudes, with the link between northward and southward waters achieved through heat loss to the atmosphere and associated watermass transformation at high latitudes (Figure 1). Away from the region of watermass transformation, these southward flowing waters are deep, isolated from atmospheric ventilation, and thus store energy and chemical compounds for hundreds of years. This property of the ocean—storing anomalies at depth—gives the ocean a longer memory than the atmosphere, with the potential to influence climate variability on long timescales.
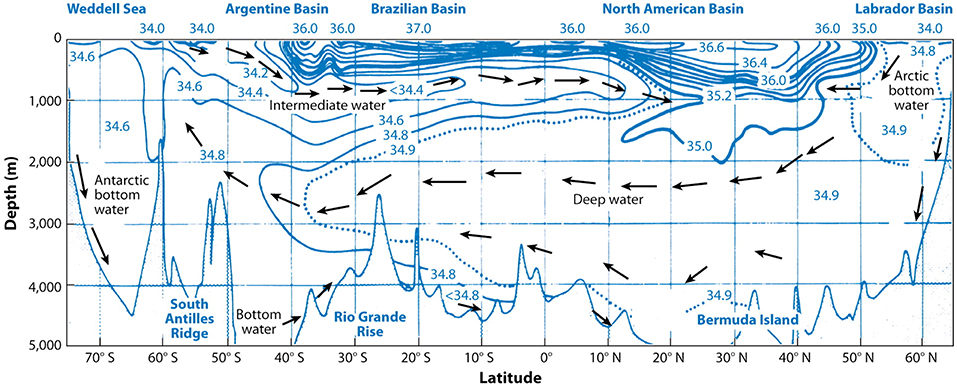
Figure 1. Meridional section of salinity in the western Atlantic. Blue contours show isolines of salinity and also outline the bottom topography. Black arrows indicate directions of ocean circulation. From Lozier (2012). Copyright permission for this figure was granted by Annual Reviews.
The influence of AMOC variations occurs on a range of timescales. On seasonal to decadal timescales, fluctuations in the AMOC in the subtropical Atlantic have been suggested to impact coastal sea level off North America (Little et al., 2017) and Atlantic sea surface temperatures (SST, Duchez et al., 2016a), with onward impacts on weather and climate. On multidecadal timescales, the AMOC has been linked to patterns of SST (Atlantic multidecadal variability) with a range of climate implications (e.g., Zhang, 2008). The AMOC also provides a means for removing carbon from the atmosphere and storing it in the deep ocean (Takahashi and Coauthors, 2009; Perez et al., 2013). For in-depth reviews of the AMOC, its variability and consequences see Lozier (2012) and Buckley and Marshall (2016).
Due to the importance of AMOC variability in the climate system, the continuously varying strength of the AMOC has been measured at several latitudes, including in the subpolar North Atlantic (since 2014), 26°N (since 2004), 16°N (since 2001) and 34.5°S (since 2009). From the 26°N array, surprisingly large variability was observed on timescales from weeks to a decade (see Srokosz and Bryden, 2015 for a review). However, at two subtropical latitudes (26°N and 16°N) AMOC fluctuations were incoherent: declining at 26°N (Smeed et al., 2014) and intensifying (Frajka-Williams et al., 2018) at 16°N over 2004–2017. Additionally, much of the variability at 26°N on seasonal to interannual timescales is dominated by wind forcing (Zhao and Johns, 2014; Pillar et al., 2016), contradicting the previous hypothesis that buoyancy forcing in subpolar regions drives AMOC variations (Kuhlbrodt et al., 2007). The OSNAP array (spanning latitudes from 53°N to 60°N) was deployed in 2014 to elucidate the relationship between buoyancy forcing and overturning. While multiple efforts toward observing the AMOC have been made in the North Atlantic, the AMOC extends across both hemispheres. An array was deployed at 34.5°S to monitor the mean and time-varying AMOC, as well as the meridional heat and freshwater transport in the South Atlantic. Numerous other data sets (e.g., ship sections, satellite, and Argo profiling float observations) have been used to characterize AMOC variability and structure over the past two decades.
In this paper, we give an overview of the present state of AMOC observations, starting with a definition of the AMOC strength (section 1.1) and history of AMOC observing (section 1.2), followed by an overview of the present-day continuous observing systems using full-height boundary mooring arrays (section 2). Section 3 discusses alternate approaches to direct measurements of the AMOC, using sea level and bottom pressure gradients, supplemented in some cases by hydrographic data. Section 4 describes inverse approaches to AMOC estimation. These three sections provide an overview of the existing state of AMOC observations. Section 5 gives a forward-looking approach to observing the AMOC, while section 6 notes gaps in the current observing approaches. Section 7 concludes.
1.1. AMOC Definition
The AMOC is commonly defined at a given latitude using a streamfunction Ψ in units of Sverdrups (1 Sv = 106 m3/s)—the zonally-integrated and vertically-accumulated meridional volume transport in depth coordinates. Absolute meridional velocities v are required across the full-depth section. For the AMOC strength determined in depth coordinates (MOCz), velocities are integrated with depth and along the section from west (xw) to east (xe) where the transport streamfunction is
While the definition is typically applied at a fixed latitude, it can be adapted for any coast-to-coast section using x as an along-section coordinate with horizontal velocities v perpendicular to the section. The strength of the overturning is defined as
where the subscript z on MOCz indicates that the integration and identification of the maximum value is performed in the z-coordinate (depth). In this way, the MOCz represents a balance between net northward (southward) flowing water above (below) the depth of maximum overturning.
At higher latitudes, there may be both northward-flowing warm water and southward-flowing cold water at the same depth. In this case, it is more useful to consider the net meridional exchange between warm (or light) and cold (or dense) water rather than shallow and deep water. To capture this, the transport streamfunction can instead be defined in density space. For the AMOC in density space, the transport through each unit area is assigned to the local density, and instead of accumulating transport-per-unit-area in depth, it is accumulated as a function of density as
where V has units of transport (Sv) and is integrated by seawater density ρ for the section. The strength of the overturning in density space is then defined as
For both MOCz and MOCρ, full-depth meridional velocities across the basin are required; the AMOC estimates described below highlight observational methods for determining velocities over large swaths of the Atlantic.
1.2. History of AMOC Observations
The AMOC has a long history of observation, including the early observations based on meridional sections of watermass properties (see review in Richardson, 2008). These early watermass sections showed patterns that required watermass formation regions at high latitudes in the northern and southern hemispheres, prompting oceanographers to propose the existence of meridional watermass transport from the regions of origin. More recent efforts concentrated on direct estimates of the meridional transport across zonal sections, applying geostrophic approaches to sections of seawater density to derive velocities. The thermal wind balance used for this approach relates the vertical shear of horizontal velocity to the horizontal gradient of density in the form
where v is meridional velocity, f the Coriolis parameter and g the acceleration due to gravity. This balance provides vertical shear of horizontal velocity, and so requires a reference velocity (either with a level-of-no-motion or level-of-known-motion) to determine absolute velocity. Meridional volume and heat transport can then be computed.
Using seawater density calculated from hydrographic sections, the MOCz strength can be computed for an individual “snapshot” of the overturning circulation. These estimates highlighted the importance of the ocean circulation for the meridional heat transport at subtropical latitudes (e.g., Bryden and Imawaki, 2001). However, hydrographic sections are repeated relatively infrequently, providing low temporal resolution of the AMOC measurement. Bryden et al. (2005) estimated the AMOC transport at 26°N from five hydrographic sections in 1957, 1981, 1992, 1998, and 2004, showing a near-monotonic decline in the strength of the overturning (solid line, Figure 2). Subsequently, the RAPID mooring array at 26°N was deployed, providing sub-monthly temporal resolution of the AMOC (Cunningham et al., 2007), confirming the idea that single-section snapshots are subject to aliasing (Wunsch and Heimbach, 2006). These data revealed that the particular months in which the hydrographic sections were made corresponded to near the peak (1957) and the trough (2004) in the seasonal cycle, thereby aliasing the results. The seasonally-corrected section-based estimates no longer support the interpretation of a monotonic AMOC decline (dashed line, Figure 2). Hydrographic sections provide deep temperature and salinity measurements, and offer snapshots of the true zonal structure of the ocean circulation, but on their own, the low temporal resolution of measurements is a critical weakness for investigating AMOC variability. This example highlights the importance of continuous measurements for the AMOC, so we now define the scope of this paper: on the continuous observation of the Atlantic overturning. With this focus, snapshots of transport estimates based on hydrographic sections are excluded.
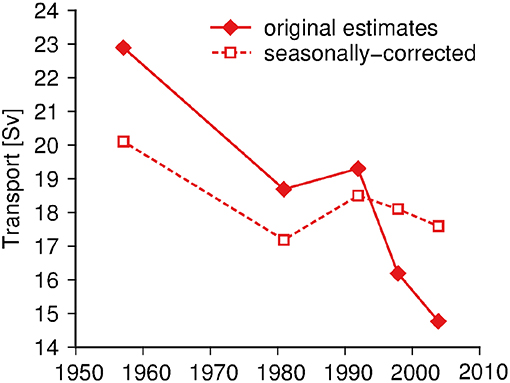
Figure 2. AMOC estimate (MOCz) from five hydrographic sections (solid), and corrected for the seasonal cycle in the AMOC (dashed). After correction for the seasonal cycle, the large, near-monotonic decrease in the AMOC strength reported by Bryden et al. (2005) was reduced to just 3 Sv of apparent change. Figure adapted from Kanzow et al. (2010).
Continuous measurements of ocean transports also have a long history in oceanography. Much of the expertise with moored arrays and measurements that led to the development of the transbasin arrays discussed in section 2 was built on existing long-term observations of western boundary currents. However, these boundary current arrays have a fundamentally different purpose to the AMOC measurements, providing one component of the AMOC rather than a basinwide transport. Again, we have learned from the early years of the RAPID 26°N observations that there is little relationship between the strength of the deep western boundary current (DWBC) and net transbasin deep transports (Meinen et al., 2013). In the Labrador Sea, the DWBC transport is also not an adequate proxy for the AMOC (Li and Lozier, 2018). As such, western boundary current arrays are also excluded from further consideration here. Details on long-standing western boundary arrays are included in the Supplementary Material, with overviews of the 53°N array (Zantopp et al., 2017), Line W at 39°N (Toole et al., 2017), the pressure-equipped inverted echo sounder (PIES) measurements of the western boundary current at 26°N (Meinen et al., 2013), and the western boundary array at 34.5°S (Meinen et al., 2017). The western boundary arrays at 11°S (Hummels et al., 2015) and the NOAC array at 47°N (Roessler et al., 2015) have recently been expanded to span the Atlantic, with AMOC estimates anticipated in the near future (see Supplementary Materials).
2. Continuous Observations of the AMOC From Observing Arrays
The standard method for making continuous observations of the AMOC is (a) to use full depth moorings to capture density profiles on either side of an ocean basin, applying thermal wind to estimate velocities across a zonal section relative to a level of no motion (e.g., McCarthy et al., 2015b; Meinen et al., 2018), (b) to combine these estimates of interior transport with direct current measurements at the boundary or boundaries and (c) with Ekman transport computed from a surface wind product. In most cases, adjustment of the reference level velocity is also made during the calculation, though the approach differs between arrays. Contrasting with the thermal wind application using hydrographic sections (section 1.2), in the moored approach it is applied over vast distances (over 1,000 km) between moored profiles of seawater density. Meridional heat and freshwater transport are further calculated using measurements of temperature and salinity across the full-depth basin (from available climatologies and float-based measurements of hydrography). Details are in Johns et al. (2011) for heat transport and McDonagh et al. (2015) for freshwater transport at 26°N, and Li et al. (2017) for OSNAP. Below, we give an overview of the observing arrays at OSNAP, 26°N, 16°N and 34.5°S (Figure 3).
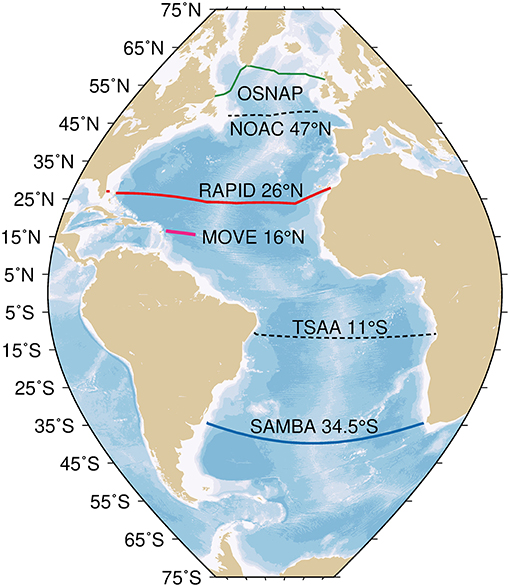
Figure 3. Observing arrays in the Atlantic with AMOC transport estimates from OSNAP (green, from 2014), NOAC 47°N (black dashed, still to be produced), RAPID 26°N (red, from 2004), MOVE 16°N (magenta, from 2000), TSAA 11°S (black dashed, still to be produced), and SAMBA 34.5°S (blue, from 2009).
2.1. OSNAP
In the subpolar North Atlantic, the circulation pattern is generally cyclonic, with several “lobes” filling out the Iceland, Irminger and Labrador basins. Transports have a strong barotropic component, so that the horizontal gyre circulation is largely full-depth. In addition, significant watermass transformation occurs along the cyclonic pathway of the water, so that there is a large “overturning” component in the horizontal circulation as water becomes denser along the path. For this reason, density coordinates are a more useful coordinate for OSNAP, though both MOCz and MOCρ are estimated.
2.1.1. Observations
In the subpolar gyre the complex bathymetry, short Rossby radius of deformation and strongly barotropic circulation requires higher horizontal resolution of observations than in the subtropical gyre. OSNAP consists of two sections: OSNAP West extends across the Labrador Sea from the Labrador shelf near 53°N to southwestern Greenland at 60°N; OSNAP East extends from southeastern Greenland at 60°N to the Scottish shelf at 57°N, crossing the Reykjanes Ridge and the Rockall plateau. The OSNAP observing system also incorporates RAFOS float deployments in the Irminger and Iceland basins and glider surveys over the Rockhall-Hatton and Iceland basins. The OSNAP observing system was fully deployed in the summer of 2014. The first full data recovery was 21 months later, in the summer of 2016. A second full recovery was successfully completed in the summer of 2018. The observing system remains in place with funding through at least 2020.
2.1.2. Methodology
The OSNAP array applies the standard approach at each section, combining them together to compute the full-width AMOC. Surface velocity derived from satellite altimetry is used as the reference velocity. Away from the mooring arrays, geostrophic velocities are calculated from gridded temperature and salinity fields constructed from Argo profiles, OSNAP gliders and moorings, and World Ocean Atlas 2013 climatology. The temporal resolution of the AMOC time series is 30 days. Temporal resolution for the property fields away from the arrays dictates this choice. See full details of the approach in Lozier et al. (2017) and of the methodology in Li et al. (2017).
2.1.3. Uncertainty and Limitations
OSNAP uses Monte Carlo simulations to provide an estimate of the statistical uncertainty on the AMOC strength (6% of the mean). A possible bias error of up to ~10% of the mean was found in Li et al. (2017) from a series of Observing System Simulation Experiments (OSSEs). The OSNAP observing system does not sample the shallow shelves off Labrador and Scotland (see Figure 2 in Li et al., 2017). In these regions, climatological monthly velocities from a high-resolution (1/12°) regional ocean general circulation model are used. Moving forward, a full analysis of potential bias error at OSNAP is planned as are improved estimates for inshore properties and velocities.
2.1.4. Results
The first set of results show that the majority of the overturning occurs north of OSNAP East, where northward flowing warm and salty Atlantic waters of subtropical origin are replaced with cooler, fresher southward flowing waters moving along the western boundaries of the Iceland and Irminger basins (Lozier et al., 2019). The contribution of overturning in the Labrador Sea (north of OSNAP West) is a factor of seven smaller than that north of OSNAP East.
2.2. RAPID 26°N
In the subtropical North Atlantic at 26°N, the circulation pattern consists of an anticyclonic subtropical gyre, a strong northward western boundary current (top 1,000 m) largely confined between Florida and the Bahamas, and southward flowing North Atlantic Deep Water (NADW, 1,000–5,000 m). Below this, there is a small amount of weakly variable northward flowing Antarctic Bottom Water (1–3 Sv, Frajka-Williams et al., 2011) west of the Mid-Atlantic Ridge (MAR). Zonal gradients and the zonal tilt of isopycnals are relatively small (compared to the subpolar gyre), so that most of the net mass and heat transport can be accurately captured in depth space (MOCz). Due to the large AMOC strength and large vertical gradients in temperature, the northward heat transport by the ocean circulation is large at this latitude.
2.2.1. Observations
The combined RAPID/MOCHA (Meridional Overturning Circulation and Heat-flux Array) observations consist of a boundary array with current meters in the west on the continental shelf and upper slope (between 77°W and 76.75°W, east of the Bahamas), and tall moorings west and east of the Mid-Atlantic Ridge or MAR (at 24°N) and along the eastern boundary (toward the Canary Islands at 28°N). Florida Current transport measured electromagnetically on an out-of-use submarine telecommunications cable are also used. The cable measurements and calibrations are part of the Western Boundary Time Series (WBTS) project, with several calibration cruises annually. The RAPID/MOCHA/WBTS observing system was fully deployed in March 2004. Data are processed and made available every ~18 months. The array remains in place with funding presently in place through at least 2020.
2.2.2. Methodology
Geostrophic velocities are initially referenced to zero at the bottom, then the barotropic or external transport is added uniformly at each longitude and depth. Net transports use the interior geostrophic, boundary and Ekman components as well as the Florida Current. See full details of the calculation in McCarthy et al. (2015b).
2.2.3. Uncertainty and Limitations
Areas inshore of the 1,000 m isobath on the eastern boundary are not instrumented, as well as deep areas east of the EB1 mooring at the base of the eastern continental slope and either side of the MAR. The surface 100 m is often unsampled, depending on the height of each subsurface mooring during each deployment. Gaps in the vertical are extrapolated, while “bottom triangles” are neglected. The residual calculation for the uniformly distributed barotropic flow (which is on the order of 10 Sv, Frajka-Williams et al., 2018) represents one of the larger areas of uncertainty in the calculation, as the choice of where to distribute the compensatory flow has some influence on the vertical structure of the overturning streamfunction.
2.2.4. Results
Over the April 2004–February 2017 observational record, the mean and standard deviation of the overturning transport is 17.0±4.4 Sv (Figure 4). The seasonal cycle has a peak-to-peak amplitude of 4.3 Sv (maximum northward transport in October). Interannual variations include a notable dip of roughly 30% in 2009/10, and the period following about April 2008 has been fairly stable with an average transport roughly 2.7 Sv less than was observed in April 2004–April 2008 (Smeed et al., 2018).
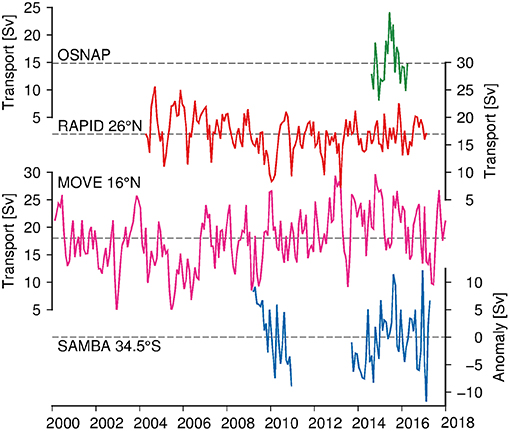
Figure 4. Monthly values of MOCz transport from four observing arrays: OSNAP (green), RAPID 26°N (red), MOVE 16°N (magenta) and SAMBA 34.5°S (blue). For SAMBA, the transports are shown as anomalies (see section 2.4). The respective means are given by the black dashed line (zero in the case of SAMBA).
2.3. MOVE 16°N
In the tropical North Atlantic at 16°N, the region east of the Caribbean and west of the MAR is characterized by the southward-flowing DWBC, and episodic and northward flowing waters and northward moving eddies along the Antilles islands. Most of the northward flow of the overturning circulation occurs in the Caribbean, while east of the MAR it is relatively quiescent. Below the DWBC, there is some northward flowing Antarctic Bottom Water, primarily west of the MAR. While the MOVE array does not span the full basin width at 16°N, it is intended to provide the time-varying AMOC and so is included here.
2.3.1. Observations
At 16°N, the observational approach uses full height moorings and boundary arrays but only over the region west of the MAR (15.5°N, 51.5°W) and east of Guadeloupe (16.3°N, 60.5°W), with direct velocity measurements on the western continental slope (just west of 60.5°W). Recent deployments of the dynamic height moorings are full-height (to within 100 m of the surface), while earlier deployments were only below 1,000 m. The MOVE array was initially deployed in early 2000 and has been in operation ever since. The array remains in place with funding renewing annually.
2.3.2. Methodology
Transports between 60.5°W and 51.5°W are calculated using geostrophy, referencing the dynamic height profiles to zero flow at depth (4,950 dbar). This level coincides with the interface depth between northward-flowing Antarctic Bottom Water and southward-flowing NADW. The AMOC at 16°N is calculated as the deep southward-flowing transport (60.5–51.5°W) between 1,200 and 4,950 dbar. The transport is computed as the sum of the boundary and internal components, from current meters and dynamic height, respectively. While an “external” component can be derived from bottom pressure observations at the western and eastern edge of the array (Frajka-Williams et al., 2018), drift in the measurement precludes analysis of low-frequency variability and so these pressure observations are not included in the AMOC estimate. See Send et al. (2011) and references therein for more details of the methodology.
2.3.3. Uncertainty and Limitations
The array explicitly assumes that the southward-flowing NADW is found in the western half of the basin and neglects transport east of the MAR. Further, no measurements are included in the Caribbean as the MOVE array focuses on the southward-flowing deep transports (absent in the Caribbean). Acknowledging uncertainties associated with the choice of reference level, the array is designed to measure the variability of the overturning rather than its absolute value.
2.3.4. Results
Over the period February 2000–June 2018, the mean and standard deviation of the daily values are 18.0±5.8 Sv (Figure 4). The seasonal cycle has a range of 4.8 Sv and peaks in July. Over this period, there is a strengthening tendency of 0.25 Sv/year. This represents a reversal of the declining tendency of 20% identified between Jan 2000–June 2009, due primarily to deep changes at the western flank of the MAR (Send et al., 2011). More recently, over the 2004–2017 period, the circulation changes at 16°N showed an intensifying AMOC while the observations at 26°N showed a weakening AMOC, associated with differences in the treatment of the reference velocity in the geostrophic calculation (Frajka-Williams et al., 2018).
2.4. SAMBA 34.5°S
In the South Atlantic, the large meridional gap between the African and Antarctic continents provides a significant crossroad for watermass exchange between the eastward flowing Antarctic Circumpolar Current as well as between watermasses of the subtropical Indian and South Atlantic gyres (de Ruijter et al., 1999; Speich et al., 2006). This Indian to Atlantic transfer forms an important part of the source waters to the northward flowing warm and saline waters in the Atlantic, taking place through Agulhas Leakage (Boebel et al., 2003). In addition, the salt and freshwater fluxes in the South Atlantic are key to understanding potential feedbacks in AMOC variability (Dijkstra, 2007).
2.4.1. Observations
Since 2009, moored observations using PIES have been made offshore of South America just north of the separation of the Brazil Current from the coast, with later augmentations to the western array including ADCP and bottom pressure recorder instruments being added up on the continental upper slope/shelf in December 2013 and current-equipped PIES (CPIES) improving the horizontal resolution in 2012. From 2008 to 2010 a pilot array of CPIES was in place offshore of Africa, and since 2013 a more complete array of CPIES and dynamic height/current meter moorings has been built between Walvis Ridge (near the prime meridian) and the South African coast. The array remains in place, with future augmentations in the works, and funding of all of the major components is in place through at least 2020.
2.4.2. Methodology
Initial AMOC estimates from SAMBA have been based on the longest available time series, i.e., the PIES and CPIES at roughly 1,350 dbar of water, on the west and east side of the basin respectively. The PIES/CPIES travel time measurements are combined with hydrography-derived look-up tables via the Gravest Empirical Mode (GEM) method to produce daily dynamic height profiles at the west and east boundaries for estimating the geostrophic velocity shear. The PIES/CPIES bottom pressure measurements are then used to estimate the time-varying portion of the barotropic reference velocity (and hence no ‘residual' zero net flow assumption is made here). Meridional Ekman transport is estimated from gridded observation-based winds (Cross-Calibrated Multi-Platform). Because the bottom pressure sensors used in this way can only estimate the time-variability of the barotropic velocity, the time-mean reference velocity is included from a numerical model (Ocean for the Earth Simulator, OFES). The time-mean of the OFES model output is also used to estimate the meridional transports inshore of the 1,350 dbar isobaths on either side of the basin. See full details of the methodology in Meinen et al. (2018).
2.4.3. Uncertainty and Limitations
The use of a time-mean reference velocity from a model means that the observations at 34.5°S provide only the time-variability of the AMOC rather than an observational mean. In addition, measurements inshore of 1,350 dbar on both boundaries are unsampled, relying on model velocities again.
2.4.4. Results
The 34.5°S array is in a complicated area where the AMOC is highly variable, with both western and eastern boundary currents contributing to the AMOC variability at a variety of timescales (Meinen et al., 2018). On interannual timescales, eastern boundary density changes dominate the AMOC variations, and both baroclinic and barotropic changes at both boundaries are important on seasonal timescales (Meinen et al., 2018), with strong intra-seasonal buoyancy anomalies driven by migrating eddies (Kersalé et al., 2018). The AMOC has a peak-to-peak range of 54.6 Sv (on daily means, monthly means shown in Figure 4).
2.5. Intercomparisons Between Latitudes
With several multi-year measurements of the AMOC at different latitudes, there is the potential to investigate the large-scale circulation spanning multiple latitudes. The average strength of overturning differs among latitudes, though the individual estimates are computed over different time periods (Table 1). As a consequence, the standard error of the mean (standard deviation divided by number of years of the time series) decreases with an increasing length of the time series (Figure 5). There may be a latitudinal dependence to the variability of the AMOC, with higher variance in the South Atlantic than the North Atlantic. However, intercomparisons are limited by the length of the time series; when the standard deviation is computed over the OSNAP period only, they are 4.1 Sv, 2.5 Sv, 4.2 Sv, and 4.7 Sv from north to south.
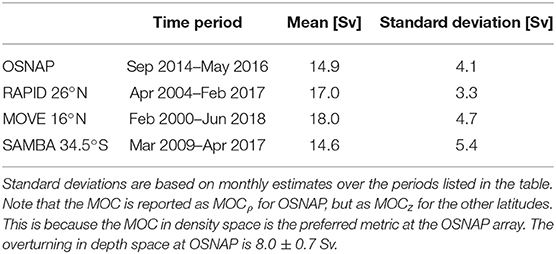
Table 1. Basic statistics for the time series of AMOC strength at the four latitudes where the time series are available.
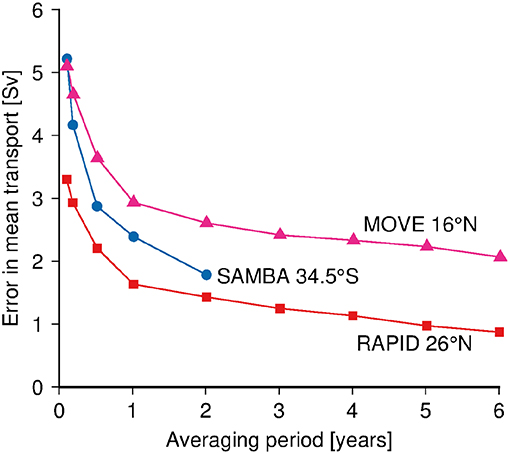
Figure 5. Uncertainty on the estimate of the mean AMOC based on averaging for a certain number of years of the AMOC time series at RAPID 26°N (red squares), MOVE 16°N (magenta triangles) and SAMBA 34.5°S (blue circles). Note that the limit in the error will be bounded below by the intrinsic variability in the time series, which is higher at 16°N than the other two latitudes (see Table 1).
Evaluation of the seasonal cycles of the AMOC between latitudes found that the seasonal cycle of the non-Ekman component of the overturning is 180° out-of-phase (Mielke et al., 2013) between 26°N and 41°N (see section 3.3). Deep transport variability has been compared between 26°N and 16°N, however it was determined that because the MOVE array does not span the entire basin width, an appropriate comparison can only be made by focusing on the westernmost profiles at the two latitudes (Elipot et al., 2014), as the western boundary dynamic height profile captures much of the deep transport (and AMOC variability) at 26°N. On seasonal and interannual timescales, variability is phased between latitudes and related to wind-forcing associated with, e.g., the North Atlantic Oscillation (Elipot et al., 2017). On interannual and longer timescales, low frequency deep density changes are consistent at both 26°N and 16°N in sign and magnitude, with changes occurring first at 26°N and 7 months later at 16°N (Frajka-Williams et al., 2018). Since about 2009, the deep salinities at the western boundary of both latitudes have freshened, resulting in a thicker dynamic height and reducing the basin-wide tilt of isopycnals. Frajka-Williams et al. (2018) further showed that choices in methodology, i.e., the application of a reference level velocity to the geostrophic shear derived from dynamic height, can have a dominant role in the low-frequency variability of the derived AMOC time series.
3. Alternate Approaches for Direct AMOC Estimates
3.1. Bottom Pressure Approaches
The application of the thermal wind balance using full-height mooring data as outlined in section 2 provides geostrophic transport estimates for an oceanic section with vertical walls. As a consequence, direct measurements of velocity are required on boundaries where the ocean walls are sloped. Hughes et al. (2013) show how the thermal wind balance can be extended to obtain geostrophic transport from vertical gradients of ocean bottom pressure (OBP) along sloping boundaries at a given latitude. The RAPID Western Atlantic Variability Experiment (WAVE) at 42–43°N showed that vertical gradients of OBP can be determined from near-bottom velocity and density from moorings (Hughes et al., 2013).
Model studies indicated that the western boundary OBP signal dominates over the eastern boundary signal for determining trans-basin geostrophic transport (Bingham and Hughes, 2008; Hughes et al., 2018). Investigations using the RAPID 26°N array data confirmed that the western boundary contribution to the geostrophic transport in the 1,000–4,000-m layer (relative to 1,000 m), captures more than 50% of the variance of MOCz at periods longer than 230 days (Elipot et al., 2014). The method was directly applied near 39°N using data from the Line W western boundary current array and near 41°N using data from RAPID WAVE (Elipot et al., 2014). The resulting geostrophic transports below 1,000 m using only data from the western boundary showed good agreement with an independent satellite and hydrography based MOCz estimates near 41°N (Willis, 2010). The advantage of this method over the full-height arrays is that these moorings are smaller and less expensive, making them easier to deploy.
3.2. Satellite-Only Methods to Estimate Ocean Circulation
Satellite-based estimates of ocean circulation are not limited to individual latitudes. Geostrophic balance can be applied to both sea level anomaly (SLA from altimetry) and ocean bottom pressure (from gravimetry) to estimate velocities, where horizontal gradients in pressure drive horizontal flow perpendicular to the gradient. The relationship between SLA and the time-varying AMOC in numerical models (Bingham and Hughes, 2009, and others) suggested that SLA could be used to generate a proxy for the AMOC. However, comparisons between RAPID 26°N transports and SLA demonstrated that near surface (0–2,000 m) seasonal variations in steric height were large and under-sampled by subsurface moorings, confounding the use of SLA for ocean transports (Ivchenko et al., 2011). Using longer in situ records and removing a seasonal climatology, a SLA-based proxy of the AMOC at 26°N was found to recover 80% of the upper mid-ocean transport variability (transbasin transport between the Bahamas and Canary Islands, in the top 1,100 m). When combined with the Florida Straits transport and meridional Ekman transport from winds, this approach explains 90% of the interannual variability of the AMOC over the period April 2004–March 2014 (Frajka-Williams, 2015).
Using OBP from the Gravity Recovery and Climate Experiment (GRACE), Landerer et al. (2015) applied geostrophy to OBP between 3,000 and 5,000 m at 26°N (west and east) to calculate deep ocean transports. The transport variability agreed well with the RAPID 26°N observations (explaining 67% of the variance in the LNADW layer at 26°N) after smoothing both with a 9-point Lowess filter. Both of these investigations suggest that, at least in the subtropical gyre at 26°N at sub-decadal timescales, satellite altimetry and gravimetry can be used to make meaningful estimates of ocean transports over large spatial scales. However, the SLA method assumes a relatively stationary relationship between dynamic height profiles and SLA which would be expected to change as watermass properties and distributions change (e.g., due to buoyancy forcing). The gravimetry-based estimates have uncertainties at long timescales, associated with the application of the glacial isostatic adjustment models, limiting their use (for now) to investigating monthly-to-interannual variability.
3.3. Satellite + Hydrography Methods to Estimate Overturning
To combat the limitation of SLA-only approaches—that subsurface velocity structure cannot be determined—multiple efforts have combined SLA with hydrography to estimate velocity. Willis (2010) used SLA and hydrography from Argo floats to estimate the time-varying volume transport above 1,130 m in the North Atlantic. Applying the method in a numerical model, he found that the method captured the AMOC variability at 41°N, just north of where the Gulf Stream separates from the coastline. This was an important feature of the location, as the water velocities on the continental slope (water depths shallower than 2,000 m, typically not sampled by Argo floats) were weak, so that errors resulting from missing data are small.
In the South Atlantic, various methods have been used to combine SLA and subsurface hydrography. Schmid (2014) combined hydrography with altimetry to construct a three-dimensional geostrophic velocity field on a monthly basis in the subtropical South Atlantic. Majumder et al. (2016) further extended the velocity field to the bottom using hydrographic climatologies. They found that the MOC and meridional heat transport are strongly correlated between 20–35°S over the 2000–2014 period. Dong et al. (2015) used a climatological relationship between SLA and temperature and salinity profiles to construct synthetic temperature and salinity profiles from time-varying SLA between 20 and 35°S. They found that interannual variations in the AMOC south of 20°S are dominated by geostrophic variations. In the North Atlantic, Mercier et al. (2015) constructed an AMOC transport in the eastern subpolar gyre (1993–2017) by combining time-varying altimetry with Argo hydrography, and verifying the result with hydrographic section estimates (Figure 6).
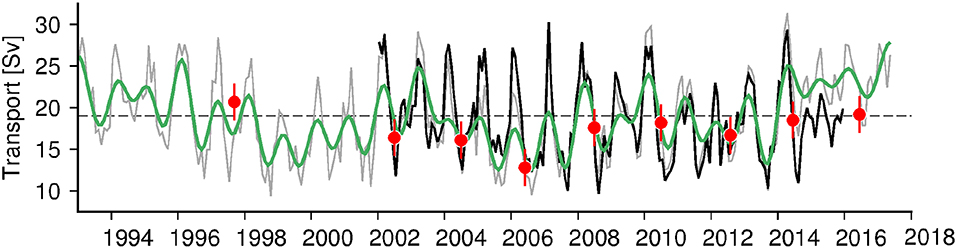
Figure 6. A time series of AMOC transport (MOCρ) at the OVIDE section (eastern subpolar gyre: Portugal to Cape Farewell) for 1993–2017, constructed from altimetry and hydrography. The gray line is from altimetry combined with a time-mean of Argo velocities; the green curve is low-pass filtered using a 2-year running mean. The black curve is from altimetry and Argo. Red circles are estimates from OVIDE hydrography with associated errors given by the red lines. The mean of the gray curve is given by the black dashed line (Updated from Mercier et al., 2015).
Hydrographic sections are typically occupied every 5 years, meaning that they will not resolve the high frequency variations that have been identified by moored observations. Float-based hydrography lacks resolution and coverage in waters shallower than 2,000 m (near boundaries), particularly when compared to the resolution and high frequency sampling of moored observations (section 2.6). However, calculations using hydrography combined with altimetry can be applied globally and retroactively, and so have the potential to fill the gap between individual mooring arrays, with the caveat that near-boundary measurements may be sparse compared to moored approaches.
4. Indirect Approaches for Observation-Based AMOC Estimates
4.1. Budget/Residual Approaches
Ocean heat content (OHC) in a zonally-integrated, meridionally bounded volume of the ocean varies due to inputs from the atmosphere, or meridional heat transport MHT into (out of) the region from the south ys (north yn) by the ocean. This can be estimated as
where Fs are the surface fluxes over the region. This approach was used in Kelly et al. (2014) using observed OHC and surface fluxes. From this, they were able to derive meridional heat transport divergence [in this formulation, MHT(ys,t) − MHT(yn,t)] at a range of latitudes in the Atlantic. Their calculation of heat flux divergence showed a remarkable coherence across latitudes through the South Atlantic which did not hold in the North Atlantic. As they could only infer the heat flux divergence, a time series of known meridional heat transport must be provided for one latitude in order to estimate the heat transport rather than the transport divergence at all other latitudes. Repeating the calculation for both heat and freshwater fluxes, Kelly et al. (2016) produced a time series of meridional heat transport anomalies at 26°N using the Argo-altimetry based estimates at 41°N to anchor their fluxes (Willis, 2010). This approach adds value to a time series of heat transport at a single latitude, and enables a wider view of the meridional coherence or divergence of the AMOC and associated transports.
A second residual approach has been applied by balancing the Earth's energy budget locally (Trenberth and Fasullo, 2017, 2018), where atmospheric heat flux divergence (∇·FA) and top of the atmosphere (RT) radiation are further considered, allowing the derivation of surface fluxes (Fs) as
which reduces the problem of energy budget imbalance in reanalyses. Surface fluxes are combined with ocean heat content (determined from in situ observations) to estimate meridional heat transport
at each latitude ϕ. From this approach, they find the largest uncertainties lie with the OHC estimates used in their calculation, which suffered from spurious signals below 1,000 m. In general, residual approaches are limited by the present generation of Argo floats which are typically pressure-rated to 2,000 dbar. Despite this, they showed a successful reproduction of the reduction in northward heat transport at 26°N in 2009/10.
4.2. State Estimates
State estimates or ocean reanalyses provide another method to determine the time-varying AMOC. State estimates use forced ocean models and assimilate observed data (e.g., in situ temperature and salinity, SST, altimetry), producing a simulated ocean state that is closer to the observed state. Methods of assimilation vary (Balmaseda et al., 2015; Stammer et al., 2016; Carrassi et al., 2018), ranging from simple relaxation, optimal interpolation, Kalman filtering to three-dimensional variational assimilation (3DVar), all of which are sequential or filtering methods used in ocean analysis or reanalysis (the observations only impact the ocean state in the future). Methodologies that are often called “state estimation” rather than “data assimilation” do not directly change ocean fields, but rather adjust surface forcings and ocean mixing parameters to achieve a best, continuous fit to observations (e.g., 4DVar, see Forget et al., 2015). Transports, e.g., the AMOC strength, can then be calculated from the state estimate's full-depth velocity fields. However, care must be taken that the AMOC is suffciently and correctly constrained by the observations since data assimilation or model drifts can lead to incorrect results. Hence more direct MOC estimations are needed to validate MOC estimates derived through assimilation or state estimation (e.g., Evans et al., 2017).
Improvement of the mean AMOC strength has been found in state estimates over forced ocean models (Balmaseda et al., 2007), possibly more so in higher resolution models (Tett et al., 2014). However the improvement of AMOC variability is found to differ between studies. Munoz et al. (2011) and Karspeck et al. (2017) found substantial variations between reanalysis AMOC strengths for the period from 1960 onwards, with more spread in the state estimates than forced ocean models. These results suggest that the state estimates do not always provide reliable estimates of the AMOC changes. On the other hand, several studies found good agreement between state estimates and the RAPID 26°N AMOC on seasonal and interannual timescales (Baehr et al., 2009; Haines et al., 2012; Roberts et al., 2013; Wunsch and Heimbach, 2013; Köhl, 2015; Jackson et al., 2016). One state estimate was then used to diagnose the causes of the temporary AMOC weakening in 2009–10 (Roberts et al., 2013) and its decadal decline (Jackson et al., 2016). The likely reason why these state estimates show agreement amongst themselves and RAPID is that they focus on the satellite period only when there are more observational constraints. The AMOC components (for instance the split between the Florida Straits and upper mid-ocean transports at 26°N) are more difficult to attain (Roberts et al., 2013; Köhl, 2015; Jackson et al., 2016; Evans et al., 2017), suggesting that the AMOC strength may be captured through a large-scale constraint rather than in resolving the detailed circulation. Understanding what creates this large-scale constraint could be important for improving the reanalyses and monitoring the AMOC. Attempts have also been made to assimilate the RAPID 26°N observations themselves, either through direct assimilation of the moored profiles of temperature and salinity (Baehr, 2010; Stepanov et al., 2012; Köhl, 2015), using covariances to derive a large-scale temperature and salinity signal from the moored profiles and then assimilating this signal (Hermanson et al., 2014; Thomas and Haines, 2017), or assimilating the 26°N transports (Baehr, 2010; Köhl, 2015).
State estimates provide continuous AMOC estimates over the whole basin, and can enable deeper investigations into the mechanisms driving AMOC variability. The quality of state estimates can be limited by the lack of observations near coasts, and by insufficient model resolution to resolve boundary currents. Poorer observational coverage prior to the satellite and Argo period may notably restrict their utility back in time.
4.3. Fingerprints and Proxies
Changes in the AMOC strength have been linked to changes in essential ocean variables, including SST and subsurface temperature (Zhang, 2008), SLA (Bingham and Hughes, 2009; Frajka-Williams, 2015), and deep density gradients (Baehr et al., 2008; Zanna et al., 2011). These AMOC fingerprints—defined as a “coherent pattern of response to the ocean circulation” (Alexander-Turner et al., 2018)—can enable prediction or attribution of SST or SLA variations in response to AMOC changes. They have also been used to derive proxies for the AMOC strength by identifying the fingerprint of the AMOC on SST changes, then using the longer SST record to derive the associated AMOC strength back in time (Lopez et al., 2017; Ceasar et al., 2018). Such proxies can provide a longer term context within which to understand present-day variations. However, while fingerprints are often identified using a linear regression between AMOC strength and the fingerprint amplitude, the relationship between the AMOC and fingerprint variable may be non-stationary, meaning that the relationship between AMOC and fingerprint variable changes in time (Alexander-Turner et al., 2018). In addition, there can be multiple drivers of SST variations, meaning that observed variations in SST and AMOC could both be symptoms of an external forcing, complicating attribution (Booth et al., 2012; Zhang et al., 2013, 2016; Clément et al., 2014).
Tide gauge sea level records may be less influenced by atmospheric heating than SST. There is a long history of using tide gauge sea level records on the US East Coast to infer changes in the Florida Current, an AMOC component, based on geostrophic balance (Iselin, 1940; Montgomery, 1941; Hela, 1952). Recent observational studies show significant correlations between US East Coast sea level and the AMOC (Sallenger et al., 2012), Gulf Stream (Kopp, 2013), and AMOC and North Atlantic Oscillation (Goddard et al., 2015), on a variety of timescales from intra-seasonal to multi-decadal. McCarthy et al. (2015a) argue that the coastal sea level difference between the South Atlantic Bight and Mid-Atlantic Bight serves as an index of midlatitude meridional heat flux in the North Atlantic, and that the time integral of this coastal sea level index provides a measure of subpolar North Atlantic Ocean heat content. However, changes in sea level along the US East Coast may also be induced by longshore winds, barometric pressure or river runoff, obscuring the relationship to the large-scale ocean circulation on interannual and longer time scales (e.g., Andres et al., 2013; Woodworth et al., 2014; Piecuch and Ponte, 2015; Piecuch et al., 2018). Moreover, climate modeling studies show that the relationship between sea level and AMOC transport depends on the timescale of variability in question (Little et al., 2017). Confidence in these studies could be improved by developing understanding of the physical mechanisms mediating the relationship between the AMOC and coastal sea level before inferring AMOC variability (e.g., Minobe et al., 2017).
5. Gaps in Observing
Above, we outlined efforts to observe or estimate the strength of the AMOC and associated heat or freshwater transports. However, a narrow focus on these aims leaves gaps in observing that may limit analysis of AMOC-related mechanisms and impacts.
5.1. Paucity of Observations on the Shelf-Break and in the Deep Ocean
Instrument risk is high in shallow shelf seas (e.g., the shelves around Greenland and Labrador). As a consequence, observational approaches using moored observations tend to leave gaps in these regions, adding uncertainty particularly in the freshwater transport estimates in these regions. In the open ocean, the largest signals of transport variability to-date are found in the upper ocean; on longer timescales, changes are anticipated at depth. The deep ocean is relatively undersampled, as the Argo float profiling array concentrates on the top 2,000 m. Full-depth hydrographic measurements remain the primary source of deep ocean observations, but are sparse in time. Deep changes recently observed at 26°N and 16°N are responsible for low frequency circulation changes (Frajka-Williams et al., 2018) but are barely above the limits of instrumental accuracy (McCarthy et al., 2015b). Observing efforts that rely on upper ocean and surface intensified measurements, or boundary-only measurements at depth, may fail to capture the low frequency, deep density variations across the Atlantic basin.
5.2. Interior Pathways
While boundary-focused observations capture the transbasin baroclinic transport, they do not account for interior circulation pathways. Tracer measurements highlight that the DWBC is not the only conduit of newly formed deep waters from high latitudes into the rest of the ocean basins (LeBel et al., 2008). Recent Lagrangian studies using real and numerical floats have shown that, in the North Atlantic, there are ‘interior pathways' of circulation that water parcels likely follow, with the intermediate depth water masses (e.g., Labrador Sea Water at 1,500 m) moving offshore at the Grand Banks and spreading down the Mid-Atlantic Ridge as well as within the DWBC (Bower et al., 2009; Lozier et al., 2013). Likewise, a recent compilation of observations and modeling output has revealed interior pathways for Iceland Scotland Overflow Water, including a southward pathway along the eastern flank of the Mid-Atlantic Ridge (Zou et al., 2017). These pathways are not explicitly resolved in transbasin geostrophic arrays, but are important to understanding the spread of watermasses and tracers (including carbon) and advection timescales of anomalies from high to low latitudes (Lozier et al., 2013; Le Bras et al., 2017).
5.3. Carbon, Nutrients and Oxygen Transports
The North Atlantic is a sink of atmospheric CO2 taking up roughly 40% of the global ocean uptake of carbon from the atmosphere (Takahashi and Coauthors, 2009). A cooling ocean such as the North Atlantic takes up carbon from the atmosphere through the solubility pump. The vertical mixing resulting from the loss in surface buoyancy brings nutrient-rich waters to the surface fueling biological productivity, driving further carbon into the deep ocean via the biological carbon pump. New efforts are underway to estimate the time-varying transport of nutrients and carbon, to develop understanding in the role of the AMOC in North Atlantic carbon uptake. To make time-varying measurements of chemical properties, the Atlantic BiogeoChemical Fluxes (ABC Fluxes) observational programme has added oxygen sensors and samplers to the moorings at 26°N, while oxygen, pH sensors and water samplers were added to the OSNAP Rockall Trough array, and oxygen and pH sensors added to the 53°N array, enabling time-series of biogeochemical properties from transport arrays. The ABC Fluxes 26°N project has estimated time-series of ocean transports of anthropogenic carbon and inorganic nutrients using observations from the RAPID 26°N array, Argo floats and GO-SHIP sections, and applying multiple linear regression between parameters. Preliminary results have shown that the AMOC volume transport at 26°N has a primary role in setting the strength and variability of the property transport across 26°N; that the transport is a first order component of the carbon and nutrient budgets in the North Atlantic; and that AMOC variability also drives significant variability in the uptake of carbon (both solubility and biological pumps) through its control on upper ocean heat content and stratification in the North Atlantic.
6. Future Observational Approaches
6.1. Sustaining AMOC Observations
Our purpose in observing the AMOC is to develop understanding of the oceanic volume, heat and freshwater transport, its variability and dynamics, and response to and feedbacks on the climate system. Importantly, we are concerned with the present, the recent past (~50 years), and how transport variability and mechanisms may change in a changing climate. However, the AMOC variability and its imprint on essential ocean variables differs among global circulation models and coupled climate models. Global models struggle to represent small scale processes—including overflows from the Nordic seas, open-ocean deep convection and narrow boundary currents—and deep ocean circulation in general. In view of the limitations of general circulation models, observations are critical to understanding the mechanisms of AMOC variability. Pressing questions remain as to the role of the AMOC in Atlantic Multidecadal Variability, its role in generating or preconditioning the “cold blob” in the North Atlantic, and how AMOC-generated ocean heat content anomalies influence phenomena with societal relevance including hurricanes, heat waves and regional sea level change. In particular, AMOC observations are needed to investigate
1. The AMOC transports, their variability and meridional coherence,
2. The AMOC response to surface forcing and overflows,
3. The influence of meridional heat transport divergence on ocean heat content, air-sea fluxes, and sea level,
4. The influence of meridional freshwater transport on AMOC transports and variability, and
5. The relationship between interior pathways, boundary currents and the AMOC.
as a function of time-scale (seasonal, interannual, decadal and longer) and latitude bands (subpolar, subtropical, and equatorial). Sustained and widespread observations allow mechanistic understanding to be developed and the attribution of signals to causes. This will improve the monitoring system allowing a greater understanding of the extent and likely impacts of detected signals. Such understanding also helps to improve models used for seasonal-to-decadal and climate predictions.
6.2. Synthesis of Existing AMOC Observations
Moored observations of the AMOC strength (section 2) have profound advantages over the previous methods (using hydrographic sections or western boundary current arrays). These include:
1. High time resolution observations (~daily) combatting the previous problem of aliasing of large amplitude, high frequency variability onto lower frequencies,
2. Near boundary measurements for a complete transbasin estimate, reducing the influence of large-amplitude, mid-basin mesoscale variability,
3. Full-depth observations spanning the full basin width, enabling the use of a zero net mass transport constraint on the choice of reference level for geostrophic velocities.
These observations have provided detailed and robust insights into ocean circulation variability, but they are limited to individual latitudes. How do we reconcile the AMOC variability at individual latitudes (section 2.5) and generate broader understanding of AMOC-related transports and divergence and its role in the climate system?
Direct observational approaches (moored or satellite+hydrography) can be used in combination to quantify or reduce uncertainties due to instrumental accuracy, sampling or methodology. The combination of satellite data with in situ moored observations, with or without concurrent bottom pressure measurements or Argo float profiles may provide an independent check on moored observations (Williams et al., 2015). Subsampling moored observations could be used to validate satellite and Argo approaches—checking how their reduced temporal resolution affects confidence. Observing system simulation experiments, where numerical models are subsampled according to observational sampling, can further be used to evaluate uncertainties, provided the models are sufficiently representative. Ocean state estimates provide a synthesis of numerous data sets, enabling mechanistic interpretation of observed signals (e.g., Evans et al., 2017). Synthesis between direct observational approaches and residual approaches offer new potential for investigating the sensitivity of the AMOC to freshwater inputs from the cryosphere, interactions between the AMOC and atmosphere through air-sea fluxes, or longer timescale variability in the climate system (e.g., the Atlantic Multidecadal Variability).
Synthesis between observations and numerical models is essential to assess and advance the fidelity of models. The concept of a common framework into which both observations and models can be mapped and subsequently analyzed has emerged under the term AMOC metrics. Such comparisons can be prohibitively difficult for individual researchers due to data and infrastructure barriers; incommensurability; and social and scientific barriers. A new project “AMOC Metrics” aims to address these impediments, primarily as a service activity, by (i) promoting the use of metrics in intercomparison projects that are relevant to advancing understanding of the Atlantic Ocean state, circulation, and influence; (ii) reflecting the science advances being driven by the AMOC community; (iii) facilitating the joint interpretation of models and data; and (iv) promoting objectivity in model-intercomparisons. The major deliverable of the project is a set of value-added AMOC-related metrics with associated diagnostics tools and curation for the use of the broader community. To provide the most appropriate observations vs. model comparisons, the tools / packages will enable calculation of transports from the models using methods that are analogous to what observations use, initially focusing on individual latitudinal arrays.
6.3. Evaluating Potential of AMOC Observation Systems
Below, we outline some criteria to consider when evaluating the potential of future AMOC observation systems. These are based on the variability observed by the present arrays, as well as future changes that are anticipated based on numerical simulations but that are not apparent or dominant in the observations.
6.3.1. Regions
Studies of meridional coherence based on observations showed an apparent lack of coherence even just within the North Atlantic subtropical gyre on seasonal timescales (Mielke et al., 2013; Elipot et al., 2014, 2017), although there is some indication of coherence on interannual and longer timescales (Frajka-Williams et al., 2018). Numerical modeling studies and inverse approaches have shown that the coherence of AMOC variability may be distinct between latitudes with coherent variability within the South Atlantic (Kelly et al., 2014, 2016), yet a lack of coherence between gyres in the North Atlantic (Bingham et al., 2007; Lozier et al., 2010) with slower propagation of anomalies in the subpolar regions (Zhang, 2007). AMOC observations will be required at a range of latitudes to reassess our expectations regarding meridional coherence between latitudes.
6.3.2. Boundary vs. Interior
Mesoscale activity results in high amplitude variability of ocean transports on subannual timescales (Wunsch, 2008), potentially introducing uncertainty in transport estimates when variations are not well-resolved in space or time. Mesoscale eddies are suppressed very near boundaries (Kanzow et al., 2009), however, reducing though not eliminating high frequency fluctuations for near-boundary measurements (Zantopp et al., 2017). Boundary currents, however, are more barotropic which, over sloping topography, limits the use of geostrophy to measure transports. As a consequence, AMOC observations require mesoscale-resolving sampling rates to calculate interior geostrophic transports, with absolute velocity observations over sloping topography.
6.3.3. Timescales
While the observed AMOC is variable on daily through decadal timescales, much of the interest in AMOC mechanisms and impacts is on seasonal and longer timescales. Forcing from wind and buoyancy show strong seasonal cycles, and potential impacts of AMOC changes may be relevant on seasonal timescales for e.g., improving seasonal forecasts of extreme summer European Temperatures (Duchez et al., 2016b). From 14 years of observations at RAPID 26°N, we have learned that the majority of the short term transport variability is driven by wind forcing, however the evolution of deep transport and watermass changes will be key to diagnosing buoyancy-forced variability with potentially lower frequency responses, anticipated in numerical adjoint analyses (Pillar et al., 2016).
6.3.4. Changes Not Yet Observed
AMOC transport and variability at 26°N is dominated by wind forcing on daily to interannual timescales, with the largest density variations in the top 1,000 m and on the western boundary (Zhao and Johns, 2014; Moat et al., 2016). However, on longer timescales and in a changing climate, buoyancy forcing at high latitudes and mixing in the abyssal ocean (Callies and Ferrari, 2018) or in the Southern Ocean within the Antarctic divergence (Toggweiler and Samuels, 1998) are expected to influence AMOC variations. These lower frequency variations are likely to appear as smaller amplitude temperature and salinity variations, at depth and potentially away from western boundaries. New observational methods, and testing of these strategies in models, may be required to improve accuracy of AMOC estimates, in order to link lower frequency drivers to the AMOC changes.
7. Conclusions and Outlook
This paper summarized observational efforts in the Atlantic to measure the continuously varying strength of the AMOC. From first transbasin measurements retrieved at 26°N by the RAPID array, a number of startling results have emerged (summarized in Srokosz and Bryden, 2015): that the AMOC ranged from 4 to 35 Sv over a single year, had a seasonal cycle with amplitude over 5 Sv, and that the dip in 2009/10 of 30% exceeded the range of interannual variability found in climate models. The international efforts to measure the AMOC in the Atlantic at a range of latitudes have delivered new understanding of AMOC variability, its structure and meridional coherence. In situ mooring arrays form the primary measurements of the large-scale meridional circulation, though the methodology used varies between latitudes and while some velocities and water mass properties are measured directly, there are also indirect inclusions of Ekman transport at the surface from reanalysis winds. These observations have informed and continue to inform numerical modeling efforts, which show striking differences between the AMOC mean state and variability amongst models (Danabasoglu et al., 2014, 2016). Due to the differences between simulations of the AMOC, and the importance of the AMOC in the climate system, sustained observations are needed to further advance mechanistic understanding of this large-scale circulation, and improve numerical models and climate simulations.
While the in situ arrays have demonstrated the value of high time resolution near boundary observations, the cost of these arrays is significant and still leaves gaps in AMOC observing (section 5). A range of observational techniques have been used to estimate the AMOC strength and variability both directly (from satellite and hydrographic data, section 3) and indirectly (through budgetary approaches or inverse methods, section 4). However, sparse sampling, particularly by the Argo float array, combined with the importance of boundary measurements to resolving transbasin transports, may mean that the uncertainties associated with these methods limit their utility in answering outstanding questions about AMOC mechanisms and impacts (section 6.1). In the future, while it is likely that a small number of observing arrays are necessary to maintain high quality, full time resolution estimates of the AMOC strength, significant gains can be made through monitoring efforts using distributed observations (satellite/Argo) or reduced costs of moored instrumentation with bottom pressure approaches (section 3.1). These approaches can reduce the costs of the AMOC-specific observations, while broadening the geographic coverage beyond individual latitudes. However, transitioning to new methods of sustained observing must be done with care to maintain the continuity of observations and data quality (Karl et al., 1996; National Research Council, 1999; World Meteorological Organization, 2008; Weatherhead et al., 2017). In particular, two recommendations made by Karl et al. (1996) and repeated many times subsequently are that
• Prior to implementing changes to existing systems or introducing new observing systems an assessment of the effects on long-term climate monitoring should be standard practice, and
• Overlapping measurements of both the old and new observing systems for in-situ and satellite data must become standard practice for critical climate variables.
These principles have been adopted in the development of the Global Tropical Moored Buoy Array (Freitag et al., 2018) and they apply equally well to observing systems for the AMOC. The problem with overlapping new and old measurement systems or instruments is that in the short-term there is an increased cost through operating both, though in the longer-term there may be significant savings. This approach, also known as parallel testing, should be the preferred approach (National Research Council, 1999; World Meteorological Organization, 2008).
While the observational records of the AMOC transport variability are relatively short, we have learned a great deal about the structure and variability of the AMOC volume, heat and freshwater transports, its response to wind forcing, and its meridional coherence (or lack thereof) between latitudes. As the records outside of the subtropical North Atlantic increase in length, intercomparisons between latitudes will permit understanding of the AMOC as a circulation system spanning gyres and hemispheres. New developments for observing carbon transports will illuminate the role of the AMOC in carbon storage in the deep ocean. As tools for comparing transports between observations and models are developed, we anticipate further gains in understanding of the AMOC mechanisms, drivers and impacts, and interactions between the ocean circulation and the atmosphere or cryosphere. These observing systems add considerable new knowledge to large-scale ocean circulation dynamics.
Author Contributions
EF-W was the lead author. IJA, GD, SD, KAD, SE, RH, LCJ, JKa, ML, IAL, MSL, ELM, CSM, RCP, CGP, MR, MAS, and KET contributed to the writing. JB, HLB, MPC, SAC, GF, PH, NPH, HM, and BIM contributed to the editing. All authors including SB, GG, DK, JKo, TL, GDM, CM, US, DAS, SS, MvdB, DV and CW contributed to the analysis and to the revision of the manuscript.
Funding
OSNAP is funded by the US National Science Foundation (NSF, OCE-1259013), UK Natural Environment Research Council (NERC, projects: OSNAP NE/K010875/1, Extended Ellett Line and ACSIS); China's national key research and development projects (2016YFA0601803), the National Natural Science Foundation of China (41521091 and U1606402) and the Fundamental Research Funds for the Central Universities (201424001); the German Ministry BMBF (RACE program); Fisheries and Oceans Canada (DFO: AZOMP). Additional support was received from the European Union 7th Framework Programme (FP7 2007–2013: NACLIM 308299) and the Horizon 2020 program (Blue-Action 727852, ATLAS 678760, AtlantOS 633211), and the French Centre National de la Recherche Scientifique (CNRS). RAPID and MOCHA moorings at 26°N are funded by NERC and NSF (OCE1332978). ABC fluxes is funded by the NERC RAPID-AMOC program (grant number: NE/M005046/1). Florida Current cable array is funded by the US National Oceanic and Atmospheric Administration (NOAA). The Meridional Overturning Variability Experiment (MOVE) was funded by the NOAA Climate Program Office-Ocean Observing and Monitoring Division, and initially by the German Federal Ministry of Education and Research (BMBF). SAMBA 34.5°S is funded by the NOAA Climate Program Office-Ocean Observing and Monitoring Division (100007298), the French SAMOC project (11–ANR-56-004), from Brazilian National Council for Scientific and Technological development (CNPq: 302018/2014-0) and Sao Paulo Research Foundation (FAESP: SAMOC-Br grants 2011/50552-4 and 2017/09659-6), the South African DST-NRF-SANAP program and South African Department of Environmental Affairs. The Line W project was funded by NSF (grant numbers: OCE-0726720, 1332667, and 1332834), with supplemental contributions from Woods Hole Oceanographic Institution (WHOI)'s Ocean and Climate Change Institute. The Oleander Program is funded by NOAA and NSF (grant numbers: OCE1536517, OCE1536586, OCE1536851). The 47°N array NOAC is funded by the BMBF (grant numbers: 03F0443C, 03F0605C, 03F0561C, 03F0792A). The Senate Commission of Oceanography from the DFG granted shiptime and costs for travel, transports and consumables. JB's work is funded by DFG under Germany's Excellence Strategy (EXC 2037 Climate, Climatic Change, and Society, Project Number: 390683824), contribution to the Center for Earth System Research and Sustainability (CEN) of Universitat Hamburg. LCJ was funded by the Copernicus Marine Environment Monitoring Service (CMEMS: 23-GLO-RAN LOT 3). MSL was supported by the Overturning in the Subpolar North Atlantic Program (NSF grant: OCE-1259013). GDM was supported by the Blue-Action project (European Union's Horizon 2020 research and innovation programme, grant number: 727852). HM was supported by CNRS. RH acknowledges financial support by the BMBF as part of the cooperative projects RACE (03F0605B, 03F0824C). The National Centre for Atmospheric Research (NCAR) is sponsored by NSF under Cooperative Agreement No. 1852977. JKO was supported by NASA Headquarters under the NASA Earth and Space Science Fellowship Program (Grant NNX16AO39H).
Conflict of Interest Statement
The authors declare that the research was conducted in the absence of any commercial or financial relationships that could be construed as a potential conflict of interest.
Acknowledgments
We would like to acknowledge the collective effort of hundreds of scientists, technicians, students and ship's crew and captains involved in making the fieldwork in these projects a success.
Supplementary Material
The Supplementary Material for this article can be found online at: https://www.frontiersin.org/articles/10.3389/fmars.2019.00260/full#supplementary-material
References
Alexander-Turner, R., Ortega, P., and Robson, J. I. (2018). How robust are the surface temperature fingerprints of the Atlantic overturning meridional circulation on monthly time scales? Geophys. Res. Lett. 45, 3559–3567. doi: 10.1029/2017GL076759
Andres, M., Gawarkiewicz, G. G., and Toole, J. M. (2013). Interannual sea level variability in the western North Atlantic: regional forcing and remote response. Geophys. Res. Lett. 40, 5915–5919. doi: 10.1002/2013GL058013
Baehr, J. (2010). Influence of the 26°N RAPID-MOCHA array and Florida Current cable observations on the ECCO-GODAE state estimate. J. Phys. Oceanogr. 40, 865–879. doi: 10.1175/2009JPO4118.1
Baehr, J., Cunningham, S., Haak, H., Heimbach, P., Kanzow, T., and Marotzke, J. (2009). Observed and simulated estimates of the meridional overturning circulation at 26.5°N in the Atlantic. Ocean Sci. 5, 575–589. doi: 10.5194/os-5-575-2009
Baehr, J., Keller, K., and Marotzke, J. (2008). Detecting potential changes in the meridional overturning circulation at 26°N in the Atlantic. Clim. Change 91, 11–27. doi: 10.1007/s10584-006-9153-z
Balmaseda, M., Anderson, D., and Vidard, A. (2007). Impact of Argo on analyses of the global ocean. Geophys. Res. Lett. 34:L16605. doi: 10.1029/2007GL030452
Balmaseda, M., Hernandez, F., Storto, A., Palmer, M., Alves, O., Shi, L., et al. (2015). The ocean reanalyses intercomparison project (ORA-IP). J. Operat. Oceanogr. 8, s80–s97. doi: 10.1080/1755876X.2015.1022329
Bingham, R. J., and Hughes, C. W. (2008). Determining North Atlantic meridional transport variability from pressure on the western boundary: A model investigation. J. Geophys. Res. Oceans 112:C09008. doi: 10.1029/2007JC004679
Bingham, R. J., and Hughes, C. W. (2009). Signature of the Atlantic meridional overturning circulation in sea level along the east coast of North America. Geophys. Res. Lett. 36:L02603. doi: 10.1029/2008GL036215
Bingham, R. J., Hughes, C. W., Roussenov, V., and Williams, R. G. (2007). Meridional coherence of the North Atlantic meridional overturning circulation. Geophys. Res. Lett. 34:L23606. doi: 10.1029/2007GL031731
Boebel, O., Lutjeharms, J., Schmid, C., Zenk, W., Rossby, T., and Barron, C. (2003). The Cape Cauldron: a regime of turbulent inter-ocean exchange. Deep-Sea Res. Pt. II 50, 57–86. doi: 10.1016/S0967-0645(02)00379-X
Booth, B. B., Dunstone, N. J., Halloran, P. R., Andrews, T., and Bellouin, N. (2012). Aerosols implicated as a prime driver of twentieth-century North Atlantic climate variability. Nature 484, 228–232. doi: 10.1038/nature10946
Bower, A. S., Lozier, M. S., Gary, S. F., and Böning, C. W. (2009). Interior pathways of the North Atlantic meridional overturning circulation. Nature 459, 243–247. doi: 10.1038/nature07979
Bryden, H. L., and Imawaki, S. (2001). “Ocean heat transport,” in Ocean Circulation and Climate, eds G. Siedler, J. Church, and J. Gould (New York, NY: Academic Press), 455–474
Bryden, H. L., Longworth, H. R., and Cunningham, S. A. (2005). Slowing of the Atlantic meridional overturning circulation at 25°N. Nature 438, 655–657. doi: 10.1038/nature04385
Buckley, M. W., and Marshall, J. (2016). Observations, inferences, and mechanisms of Atlantic meridional overturning circulation variability: a review. Rev. Geophys. 54, 5–63. doi: 10.1002/2015RG000493
Callies, J., and Ferrari, R. (2018). Dynamics of an abyssal circulation driven by bottom-intensified mixing on slopes. J. Phys. Oceanogr. 48, 1257–1282. doi: 10.1175/JPO-D-17-0125.1
Carrassi, A., Bocquet, M., Bertino, L., and Evensen, G. (2018). Data assimilation in the geosciences: an overview of methods, issues, and perspectives. Wiley Interdiscip. Rev. 9:e535. doi: 10.1002/wcc.535
Ceasar, L., Rahmstorf, S., Robinson, A., Feulner, G., and Saba, V. (2018). Observed fingerprint of a weakening Atlantic Ocean overturning circulation. Nature 556, 191–196. doi: 10.1038/s41586-018-0006-5
Clément, L., Frajka-Williams, E., Szuts, Z. B., and Cunningham, S. A. (2014). Vertical structure of eddies and Rossby waves and their effect on the Atlantic MOC at 26.5°N. J. Geophys. Res. 119, 6479–6498. doi: 10.1002/2014JC010146
Cunningham, S. A., Kanzow, T., Rayner, D., Baringer, M. O., Johns, W. E., Marotzke, J., et al. (2007). Temporal variability of the Atlantic meridional overturning circulation at 26.5°N. Science 317, 935–938. doi: 10.1126/science.1141304
Danabasoglu, G., Yeager, S. G., Bailey, D., Behrens, E., Bentsen, M., Bi, D., et al. (2014). North Atlantic simulations in Coordinated Ocean-ice Reference Experiments, phase II (CORE-II): Part I: mean states. Ocean Model. 73, 76–107. doi: 10.1016/j.ocemod.2013.10.005
Danabasoglu, G., Yeager, S. G., Kim, W. M., Behrens, E., Bentsen, M., Bi, D., et al. (2016). North Atlantic simulations in coordinated ocean-ice reference experiments phase II (CORE-II). Part II: inter-annual to decadal variability. Ocean Model. 96, 65–90. doi: 10.1016/j.ocemod.2015.11.007
de Ruijter, W. P. M., Biastoch, A., Drijfhout, S. S., Lutjeharms, J. R. E., Matano, R. P., Pichevin, T., et al. (1999). Indian-Atlantic interocean exchange: Dynamics, estimation and impact. J. Geophys. Res. Oceans 104, 20885–20910. doi: 10.1029/1998JC900099
Dijkstra, H. A. (2007). Characterization of the multiple equilibria regime in a global ocean model. Tellus 59A, 695–705. doi: 10.1111/j.1600-0870.2007.00267.x
Dong, S., Goni, G., and Bringas, F. (2015). Temporal variability of the South Atlantic meridional overturning circulation between 20°S and 35°S. Geophys. Res. Lett. 42, 7655–7662. doi: 10.1002/2015GL065603
Duchez, A., Courtois, P., Harris, E., Josey, S. A., Kanzow, T., Marsh, R., et al. (2016a). Potential for seasonal prediction of Atlantic sea surface temperatures using the RAPID array at 26°N. Clim. Dynam. 46, 3351–3370. doi: 10.1007/s00382-015-2918-1
Duchez, A., Frajka-Williams, E., Josey, S. A., Evans, D. G., Grist, J. P., Marsh, R., et al. (2016b). Drivers of exceptionally cold North Atlantic ocean temperatures and their link to the 2015 European heat wave. Environ. Res. Lett. 11:074004. doi: 10.1088/1748-9326/11/7/074004
Elipot, S., Frajka-Williams, E., Hughes, C., Olhede, S., and Lankhorst, M. (2017). Observed basin-scale response of the North Atlantic meridional overturning circulation to wind stress forcing. J. Climate 30, 2029–2054. doi: 10.1175/JCLI-D-16-0664.1
Elipot, S., Frajka-Williams, E., Hughes, C., and Willis, J. (2014). The observed North Atlantic MOC, its meridional coherence and ocean bottom pressure. J. Phys. Oceanogr. 44, 517–537. doi: 10.1175/JPO-D-13-026.1
Evans, D. G., Toole, J., Forget, G., Zika, J. D., Garabato, A. C. N., Nurser, A. J. G., et al. (2017). Recent wind-driven variability in Atlantic water mass distribution and meridional overturning circulation. J. Phys. Oceanogr. 47, 633–647. doi: 10.1175/JPO-D-16-0089.1
Forget, G., Campin, J.-M., Heimbach, P., Hill, C. N., Ponte, R. M., and Wunsch, C. (2015). ECCO version 4: an integrated framework for non-linear inverse modeling and global ocean state estimation. Geosci. Model Dev. 8, 3071–3104. doi: 10.5194/gmd-8-3071-2015
Frajka-Williams, E. (2015). Estimating the Atlantic MOC at 26°N using satellite altimetry and cable measurements. Geophys. Res. Lett. 42, 3458–3464. doi: 10.1002/2015GL063220
Frajka-Williams, E., Cunningham, S. A., Bryden, H. L., and King, B. A. (2011). Variability of Antarctic Bottom Water at 24.5°N in the Atlantic. J. Geophys. Res. 116:C11026. doi: 10.1029/2011JC007168
Frajka-Williams, E., Lankhorst, M., Koelling, J., and Send, U. (2018). Coherent circulation changes in the deep North Atlantic from 16°N and 26°N transport arrays. J. Geophys. Res. 123, 3427–3443. doi: 10.1029/2018JC013949
Freitag, H. P., McPhaden, M. J., and Connell, K. J. (2018). Comparison of ATLAS and T-Flex Mooring Data. Tech. Rep. OAR PMEL-149, NOAA/Pacific Marine Environmental Laboratory, Seattle, WA. doi: 10.25923/h4vn-a328
Goddard, P. B., Yin, J., Griffies, S. M., and Zhang, S. (2015). An extreme event of sea-level rise along the northeast coast of North America in 2009–2010. Nat. Comm. 6:6345. doi: 10.1038/ncomms7346
Haines, K., Valdivieso, M., Zuo, H., and Stepanov, V. N. (2012). Transports and budgets in a 1/4° global ocean reanalysis 1989–2010. Ocean Sci. 8, 333–334. doi: 10.5194/os-8-333-2012.002/qj.2063
Hermanson, L., Dunstone, N., Haines, K., Robson, J., Smith, D., and Sutton, R. (2014). A novel transport assimilation method for the Atlantic meridional overturning circulation at 26°N. Q. J. Royal Meteorol. Soc. 140, 2563–2572. doi: 10.1002/qj.2321
Hughes, C. W., Elipot, S., Maqueda, M. M., and Loder, J. (2013). Test of a method for monitoring the geostrophic meridional overturning circulation using only boundary measurements. J. Atmos. Ocean. Tech. 30, 789–809. doi: 10.1175/JTECH-D-12-00149.1
Hughes, C. W., Williams, J., Blaker, A., Coward, A., and Stepanov, V. (2018). A window on the deep ocean: the special value of ocean bottom pressure for monitoring the large-scale, deep-ocean circulation. Prog. Oceanogr. 161, 19–46. doi: 10.1016/j.pocean.2018.01.011
Hummels, R., Brandt, P., Dengler, M., Fischer, J., Araujo, M., Veleda, D., et al. (2015). Interannual to decadal changes in the western boundary circulation in the Atlantic at 11°S. Geophys. Res. Lett. 42, 7615–7622. doi: 10.1002/2015GL065254
Iselin, C. O. (1940). Preliminary report on long-period variations in the transport of the Gulf Stream system. Papers Phys. Oceanogr. Meteorol. 8, 1–40.
Ivchenko, V. O., Sidorenko, D., Danilov, S., Losch, M., and Schröter, J. (2011). Can sea surface height be used to estimate oceanic transport variability? Geophys. Res. Lett. 38:L11601. doi: 10.1029/2011GL047387
Jackson, L. C., Peterson, K. A., Roberts, C. D., and Wood, R. A. (2016). Recent slowing of Atlantic overturning circulation as a recovery from earlier strengthening. Nat. Geosci. 9, 518–523. doi: 10.1038/NGEO2715
Johns, W. E., Baringer, M. O., Beal, L. M., Cunningham, S. A., Kanzow, T., Bryden, H. L., et al. (2011). Continuous, array-based estimates of Atlantic Ocean heat transport at 26.5°N. J. Climate 24, 2429–2449. doi: 10.1175/2010JCLI3997.1
Kanzow, T., Cunningham, S. A., Johns, W. E., Hirschi, J. J.-M., Marotzke, J., Baringer, M. O., et al. (2010). Seasonal variability of the Atlantic meridional overturning circulation at 26.5°N. J. Climate 23, 5678–5698. doi: 10.1175/2010JCLI3389.1
Kanzow, T., Johnson, H. L., Marshall, D. P., Cunningham, S. A., Hirschi, J. J.-M., Mujahid, A., et al. (2009). Basinwide integrated volume transports in an eddy-filled ocean. J. Phys. Oceanogr. 39, 3091–3110. doi: 10.1175/2009JPO4185.1
Karl, T. R., Knight, R. W., Easterling, D. R., and Quayle, R. G. (1996). Indices of climate change for the United States. B. Am. Meteorol. Soc. 77, 279–292. doi: 10.1175/1520-0477(1996)077<0279:IOCCFT>2.0.CO;2
Karspeck, A. R., Stammer, D., Kohl, A., Danabasoglu, G., Balmaseda, M., Smith, D. M., et al. (2017). Comparison of the Atlantic meridional overturning circulation between 1960 and 2007 in six ocean reanalysis products. Clim. Dyn. 49, 957–982. doi: 10.1007/s00382-015-2787-7
Kelly, K. A., Drushka, K., Thompson, L., Bars, D. L., and McDonagh, E. L. (2016). Impact of slowdown of Atlantic overturning circulation on heat and freshwater transports. Geophys. Res. Lett. 43, 7625–7631. doi: 10.1002/2016GL069789
Kelly, K. A., Thompson, L., and Lyman, J. (2014). The coherence and impact of meridional heat transport anomalies in the Atlantic Ocean inferred from observations. J. Climate 27, 1469–1487. doi: 10.1175/JCLI-D-12-00131.1
Kersalé, M., Lamont, T., Speich, S., Terre, T., Laxenaire, R., Roberts, M. J., et al. (2018). Moored observations of mesoscale features in the Cape Basin: characteristics and local impacts on water mass distributions. Ocean Sci. 14, 923–945. doi: 10.5194/os-14-923-2018
Köhl, A. (2015). Evaluation of the GECCO2 ocean synthesis: transports of volume, heat and freshwater in the Atlantic. Q. J. Royal Meteorol. Soc. 141, 166–181. doi: 10.1002/qj.2347
Kopp, R. E. (2013). Does the mid-Atlantic United States sea level acceleration hot spot reflect ocean dynamic variability? Geophys. Res. Lett. 40, 3981–4985. doi: 10.1002/grl.50781
Kuhlbrodt, T., Griesel, A., Montoya, M., Levermann, A., Hofmann, M., and Rahmstorf, S. (2007). On the driving processes of the Atlantic meridional overturning circulation. Rev. Geophys. 45:RG2001. doi: 10.1029/2004RG000166
Landerer, F. W., Wiese, D. N., Bentel, K., Boening, C., and Watkins, M. M. (2015). North Atlantic meridional overturning circulation variations from GRACE ocean bottom pressure anomalies. Geophys. Res. Lett. 42, 8114–8121. doi: 10.1002/2015GL065730
Le Bras, I. A., Yashayaev, I., and Toole, J. M. (2017). Tracking Labrador Sea Water property signals along the deep western boundary current. J. Geophys. Res. 122, 5348–5366. doi: 10.1002/2017JC012921
LeBel, D. A., Smethie, W. M. Jr., Rhein, M., Kieke, D., Fine, R. A., Bullister, J. L., et al. (2008). The formation rate of North Atlantic deep water and eighteen degree water calculated from CFC-11 inventories observed during WOCE. Deep-Sea Res. Pt. I 55, 891–910. doi: 10.1016/j.dsr.2008.03.009
Li, F., and Lozier, M. S. (2018). On the linkage between Labrador Sea Water volume and overturning circulation in the Labrador Sea: a case study on proxies. J. Climate 31, 5225–5241. doi: 10.1175/JCLI-D-17-0692.1
Li, F., Lozier, M. S., and Johns, W. (2017). Calculating the meridional volume, heat and freshwater transports from an observing system in the subpolar North Atlantic: observing system simulation experiment. J. Atmos. Ocean. Tech. 34, 1483–1500. doi: 10.1175/JTECH-D-16-0247.1
Little, C. M., Piecuch, C. G., and Ponte, R. M. (2017). On the relationship between the meridional overturning circulation, alongshore wind stress, and United States East Coast sea level in the Community Earth System Model Large Ensemble. J. Geophys. Res. 112, 4554–4568. doi: 10.1002/2017JC012713
Lopez, H., Dong, S., and Goni, G. (2017). A reconstructed South Atlantic meridional overturning circulation time series since 1870. Geophys. Res. Lett. 44, 3309–3318. doi: 10.1002/2017GL073227
Lozier, M., Gary, S., and Bower, A. (2013). Simulated pathways of the overflow waters in the North Atlantic: subpolar to subtropical export. Deep Sea Res. Pt. II 85, 147–153. doi: 10.1016/j.dsr2.2012.07.037
Lozier, M. S. (2012). Overturning in the North Atlantic. Ann. Rev. Mar. Sci. 4, 291–315. doi: 10.1146/annurev-marine-120710-100740
Lozier, M. S., Bacon, S., Bower, A. S., Cunningham, S. A., De Jong, M. F., De Steur, L., et al. (2017). Overturning in the subpolar North Atlantic program: a new international ocean observing system. B. Am. Meteorol. Soc. 98, 737–752. doi: 10.1175/BAMS-D-16-0057.1
Lozier, M. S., Li, F., Bacon, S., Bahr, F., Bower, A. S., Cunningham, S. A., et al. (2019). A sea change in our view of overturning in the subpolar North Atlantic. Science 363, 516–521. doi: 10.1126/science.aau6592
Lozier, M. S., Roussenov, V., Reed, M. S. C., and Williams, R. G. (2010). Opposing decadal changes for the North Atlantic meridional overturning circulation. Nat. Geosci. 3, 728–734. doi: 10.1038/ngeo947
Majumder, S., Schmid, C., and Halliwell, G. (2016). An observations and model-based analysis of meridional transports in the South Atlantic. J. Geophys. Res. 121, 5622–5638. doi: 10.1002/2016JC011693
McCarthy, G. D., Haigh, I. D., Hirschi, J. J., Grist, J. P., and Smeed, D. A. (2015a). Ocean impact on decadal Atlantic climate variability revealed by sea-level observations. Nature 521, 508–510. doi: 10.1038/nature14491
McCarthy, G. D., Smeed, D. A., Johns, W. E., Frajka-Williams, E., Moat, B. I., Rayner, D., et al. (2015b). Measuring the Atlantic meridional overturning circulation at 26°N. Prog. Oceanogr. 130, 91–111. doi: 10.1016/j.pocean.2014.10.006
McDonagh, E. L., King, B. A., Bryden, H. L., Courtois, P., Szuts, Z., Baringer, M., et al. (2015). Continuous estimate of Atlantic oceanic freshwater flux at 26.5°N. J. Climate 28, 8888–8906. doi: 10.1175/JCLI-D-14-00519.1
Meinen, C., Speich, S., Piola, A., Ansorge, I., Campos, E., Kersalé, M., et al. (2018). Meridional overturning circulation transport variability at 34.5°S during 2009–2017: baroclinic and barotropic flows and the dueling influence of the boundaries. Geophys. Res. Lett. 45, 4180–4188. doi: 10.1029/2018GL077408
Meinen, C. S., Garzoli, S. L., Perez, R. C., Campos, E., Piola, A. R., Chidichimo, M. P., et al. (2017). Characteristics and causes of Deep Western Boundary Current transport variability at 34.5°S during 2009–2014. Ocean Sci. 13, 175–194. doi: 10.5194/os-13-175-2017
Meinen, C. S., Johns, W. E., Garzoli, S. L., van Sebille, E., Rayner, D., Kanzow, T., et al. (2013). Variability of the deep western boundary current at 26.5°N during 2004–2009. Deep Sea Res. Pt. II 85, 154–168. doi: 10.1016/j.dsr2.2012.07.036
Mercier, H., L'herminier, P., Sarafanov, A., Gaillard, F., Daniault, N., Desbruyeres, D., et al. (2015). Variability of the meridional overturning circulation at the Greenland-Portugal OVIDE section from 1993 to 2010. Prog. Oceanogr. 132, 250–261. doi: 10.1016/j.pocean.2013.11.001
Mielke, C., Frajka-Williams, E., and Baehr, J. (2013). Observed and simulated variability of the AMOC at 26°N and 41°N. Geophys. Res. Lett. 40, 1159–1164. doi: 10.1002/grl.50233
Minobe, S., Terada, M., Qiu, B., and Schneider, N. (2017). Western boundary sea level: a theory, rule of thumb, and application to climate models. J. Phys. Oceanogr. 47, 957–977. doi: 10.1175/JPO-D-16-0144.1
Moat, B., Josey, S., Sinha, B., Blaker, A., Smeed, D., McCarthy, G., et al. (2016). Major variations in sub-tropical North Atlantic heat transport at short (5 day) timescales and their causes. J. Geophys. Res. Oceans 121, 3237–3249. doi: 10.1002/2016JC011660
Montgomery, R. B. (1941). Sea level difference between Key West and Miami, Florida. J. Mar. Res. 4, 32–37.
Munoz, E., Kirtman, B., and Weijer, W. (2011). Varied representation of the Atlantic meridional overturning across multidecadal ocean reanalyses. Deep-Sea Res. Pt. II 58, 1848–1857. doi: 10.1016/j.dsr2.2010.10.064
National Research Council (1999). Adequacy of Climate Observing Systems. Washington: DC: The National Academies Press.
Perez, F. F., Mercier, H., Vazquez-Rodriguez, M., L'herminier, P., Velo, A., Pardo, P., et al. (2013). Atlantic Ocean CO2 uptake reduced by weakening of the meridional overturning circulation. Nat. Geosci. 6, 146–152. doi: 10.1038/ngeo1680
Piecuch, C. G., Bittermann, K., Kemp, A. C., Ponte, R. M., Little, C. M., Engelhart, S. E., et al. (2018). River-discharge effects on United States Atlantic and Gulf coast sea-level changes. Proc. Natl. Acad. Sci. U.S.A. 115, 7729–7734. doi: 10.1073/pnas.1805428115
Piecuch, C. G., and Ponte, R. M. (2015). Inverted barometer contributions to recent sea level changes along the northeast coast of North America. Geophys. Res. Lett. 42, 5918–5925. doi: 10.1002/2015GL064580
Pillar, H., Heimbach, P., Johnson, H., and Marshall, D. (2016). Dynamical attribution of recent variability in Atlantic overturning. J. Climate 29, 3339–3352. doi: 10.1175/JCLI-D-15-0727.1
Richardson, P. L. (2008). On the history of meridional overturning circulation schematic diagrams. Prog. Oceanogr. 76, 466–486. doi: 10.1016/j.pocean.2008.01.005
Roberts, C. D., Waters, J., Peterson, K. A., Palmer, M., McCarthy, G. D., Frajka-Williams, E., et al. (2013). Atmosphere drives observed interannual variability of the Atlantic meridional overturning circulation at 26.5°N. Geophys. Res. Lett. 40, 5164–5170. doi: 10.1002/grl.50930
Roessler, A., Rhein, M., Kieke, D., and Mertens, C. (2015). Long-term observations of North Atlantic Current transport at the gateway between western and eastern Atlantic. J. Geophys. Res. Oceans 120, 4003–4027. doi: 10.1002/2014JC010662
Sallenger, A. H. Jr., Doran, K. S., and Howd, P. A. (2012). Hotspot of accelerated sea-level rise on the Atlantic coast of North America. Nat. Clim. Change 2, 884–888. doi: 10.1038/nclimate1597
Schmid, C. (2014). Mean vertical and horizontal structure of the subtropical circulation in the South Atlantic from three-dimensional observed velocity fields. Deep Sea Res. Pt. I 91, 50–71. doi: 10.1016/j.dsr.2014.04.015
Send, U., Lankhorst, M., and Kanzow, T. (2011). Observation of decadal change in the Atlantic meridional overturning circulation using 10 years of continuous transport data. Geophys. Res. Lett. 38:24606. doi: 10.1029/2011GL049801
Smeed, D. A., Josey, S., Johns, W., Moat, B., Frajka-Williams, E., Rayner, D., et al. (2018). The North Atlantic Ocean is in a state of reduced overturning. Geophys. Res. Lett. 45, 1527–1533. doi: 10.1002/2017GL076350
Smeed, D. A., McCarthy, G., Cunningham, S. A., Frajka-Williams, E., Rayner, D., Johns, W. E., et al. (2014). Observed decline of the Atlantic meridional overturning circulation 2004 to 2012. Ocean Sci. 10, 29–38. doi: 10.5194/os-10-29-2014
Speich, S., Lutjeharms, J. R. E., Penven, P., and Blanke, B. (2006). The Indo-Atlantic exchange: dynamics of a regime transition from a western boundary current to an eastern boundary system. Geophys. Res. Lett. 33:L23611. doi: 10.1029/2006GL027157
Srokosz, M. A., and Bryden, H. L. (2015). Observing the Atlantic meridional overturning circulation yields a decade of inevitable surprises. Science 348:1255575. doi: 10.1126/science.1255575
Stammer, D., Balmaseda, M., Heimbach, P., Kohl, A., and Weaver, A. (2016). Ocean data assimilation in support of climate applications: status and perspectives. Ann. Rev. Mar. Sci. 8, 491–518. doi: 10.1146/annurev-marine-122414-034113
Stepanov, V. N., Haines, K., and Smith, G. C. (2012). Assimilation of RAPID array observations into an ocean model. Q. J. Royal Meteorol. Soc. 138, 2105–2117. doi: 10.1002/qj.1945
Takahashi, T., and Coauthors (2009). Climatological mean and decadal change in surface ocean pCO2, and net sea-air CO2 flux over the global oceans. Deep Sea Res. Pt. II 56, 554–577. doi: 10.1016/j.dsr2.2008.12.009
Tett, S. F. B., Sherwin, T. J., Shravat, A., and Browne, O. (2014). How much has the North Atlantic ocean overturning circulation changed in the last 50 years? J. Clim. 27, 6325–6342. doi: 10.1175/JCLI-D-12-00095.1
Thomas, C. M., and Haines, K. (2017). Using lagged covariances in data assimilation. Tellus A 69. doi: 10.1080/16000870.2017.1377589
Toggweiler, J. R., and Samuels, B. (1998). On the ocean's large-scale circulation near the limit of no vertical mixing. J. Phys. Oceanogr. 28, 1832–1852. doi: 10.1175/1520-0485(1998)028<1832:OTOSLS>2.0.CO;2
Toole, J. M., Andres, M., Bras, I. A. L., Joyce, T. M., and McCartney, M. S. (2017). Moored observations of the deep western boundary current in the NW Atlantic: 2004–2014. J. Geophys. Res. Oceans 122, 7488–7505. doi: 10.1002/2017JC012984
Trenberth, K. E., and Fasullo, J. T. (2017). Atlantic meridional heat transports computed from balancing Earth's energy locally. Geophys. Res. Lett. 44, 1919–1927. doi: 10.1002/2016GL072475
Trenberth, K. E., and Fasullo, J. T. (2018). Applications of an updated atmospheric energetics formulation. J. Climate 31, 6263–6279. doi: 10.1175/JCLI-D-17-0838.1
Weatherhead, E. C., Harder, J., Araujo-Pradere, E. A., Bodeker, G., English, J. M., Flynn, L. E., et al. (2017). How long do satellites need to overlap? Evaluation of climate data stability from overlapping satellite records. Atmospher. Chem. Phys. 17, 15069–15093. doi: 10.5194/acp-17-15069-2017
Williams, J., Hughes, C. W., and Tamisiea, M. (2015). Detecting trends in bottom pressure measured using a tall mooring and altimetry. J. Geophys. Res. Oceans 120, 5216–5232. doi: 10.1002/2015JC010955
Willis, J. K. (2010). Can in situ floats and satellite altimeters detect long-term changes in Atlantic ocean overturning? Geophys. Res. Lett. 37:L06602. doi: 10.1029/2010GL042372
Woodworth, P. L., Maqueda, M. A. M., Roussenov, V. M., Williams, R. G., and Hughes, C. W. (2014). Mean sea-level variability along the northeast American Atlantic coast and the roles of wind and the overturning circulation. J. Geophys. Res. Oceans 119, 8916–8935. doi: 10.1002/2014JC010520
World Meteorological Organization (2008). WMO Statement on the Status of the Global Climate in 2007. Tech. Rep. WMO- No. 1031, WMO, Geneva.
Wunsch, C. (2008). Mass and volume transport variability in an eddy-filled ocean. Nat. Geosci. 1, 165–168. doi: 10.1038/ngeo126
Wunsch, C., and Heimbach, P. (2006). Estimated decadal changes in the North Atlantic meridional overturning circulation and heat flux 1993–2004. J. Phys. Oceanogr. 36, 2012–2024. doi: 10.1175/JPO2957.1
Wunsch, C., and Heimbach, P. (2013). Two decades of the Atlantic meridional overturning circulation: anatomy, variations, extremes, prediction, and overcoming its limitations. J. Climate 26, 7167–7186. doi: 10.1175/JCLI-D-12-00478.1
Zanna, L., Heimbach, P., Moore, A., and Tziperman, E. (2011). Optimal excitation of interannual Atlantic meridional overturning circulation variability. J. Climate 24, 413–427. doi: 10.1175/2010JCLI3610.1
Zantopp, R., Fischer, J., Visbeck, M., and Karstensen, J. (2017). From interannual to decadal: 17 years of boundary current transports at the exit of the Labrador Sea. J. Geophys. Res. Oceans 122, 1724–1748. doi: 10.1002/2016JC012271
Zhang, R. (2007). Anticorrelated multidecadal variations between surface and subsurface tropical North Atlantic. Geophys. Res. Lett. 34:L12713. doi: 10.1029/2007GL030225
Zhang, R. (2008). Coherent surface-subsurface fingerprint of the Atlantic meridional overturning circulation. Geophys. Res. Lett. 35:L20705. doi: 10.1029/2008GL035463
Zhang, R., Delworth, T. L., Sutton, R., Hodson, D. L. R., Dixon, K. W., Held, I. M., et al. (2013). Have aerosols caused the observed Atlantic multidecadal variability? J. Atmospher. Sci. 70, 1135–1144. doi: 10.1175/JAS-D-12-0331.1
Zhang, R., Sutton, R., Danabasoglu, G., Delworth, T. L., Kim, W. M., Robson, J., et al. (2016). Comment on “The Atlantic Multidecadal Oscillation without a role for ocean circulation”. Science 352, 1527–1527. doi: 10.1126/science.aaf1660
Zhao, J., and Johns, W. (2014). Wind-forced interannual variability of the Atlantic meridional overturning circulation at 26.5°N. J. Geophys. Res. Oceans 119, 2403–2419. doi: 10.1002/2013JC009407
Keywords: meridional overturning circulation, thermohaline circulation, observing systems, ocean heat transport, carbon storage, moorings, circulation variability
Citation: Frajka-Williams E, Ansorge IJ, Baehr J, Bryden HL, Chidichimo MP, Cunningham SA, Danabasoglu G, Dong S, Donohue KA, Elipot S, Heimbach P, Holliday NP, Hummels R, Jackson LC, Karstensen J, Lankhorst M, Le Bras IA, Lozier MS, McDonagh EL, Meinen CS, Mercier H, Moat BI, Perez RC, Piecuch CG, Rhein M, Srokosz MA, Trenberth KE, Bacon S, Forget G, Goni G, Kieke D, Koelling J, Lamont T, McCarthy GD, Mertens C, Send U, Smeed DA, Speich S, van den Berg M, Volkov D and Wilson C (2019) Atlantic Meridional Overturning Circulation: Observed Transport and Variability. Front. Mar. Sci. 6:260. doi: 10.3389/fmars.2019.00260
Received: 15 November 2018; Accepted: 02 May 2019;
Published: 07 June 2019.
Edited by:
Fei Chai, Second Institute of Oceanography, ChinaReviewed by:
Ru Chen, University of California, Los Angeles, United StatesHelen Elizabeth Phillips, University of Tasmania, Australia
Wen-Zhou Zhang, Xiamen University, China
Copyright © 2019 Frajka-Williams, Ansorge, Baehr, Bryden, Chidichimo, Cunningham, Danabasoglu, Dong, Donohue, Elipot, Heimbach, Holliday, Hummels, Jackson, Karstensen, Lankhorst, Le Bras, Lozier, McDonagh, Meinen, Mercier, Moat, Perez, Piecuch, Rhein, Srokosz, Trenberth, Bacon, Forget, Goni, Kieke, Koelling, Lamont, McCarthy, Mertens, Send, Smeed, Speich, van den Berg, Volkov and Wilson. This is an open-access article distributed under the terms of the Creative Commons Attribution License (CC BY). The use, distribution or reproduction in other forums is permitted, provided the original author(s) and the copyright owner(s) are credited and that the original publication in this journal is cited, in accordance with accepted academic practice. No use, distribution or reproduction is permitted which does not comply with these terms.
*Correspondence: Eleanor Frajka-Williams, ZWxlYW5vci5mcmFqa2FAbm9jLmFjLnVr