 Kay L. Davis
 Ashly McMahon
- National Marine Science Centre, School of Environment, Science and Engineering, Southern Cross University, Coffs Harbour, NSW, Australia
Estimates of coral reef ecosystem calcification (Gnet) and productivity (Pnet) provide insight into coral community health and functionality in response to short- and long-term stressors such as ocean warming and acidification. Here, we investigate spatial variability in calcification and organic production at One Tree Island (OTI) and compare our new observations to sporadic metabolic rates reported over the previous 50 years on the same reef flat. Gnet and Pnet estimates at the nearshore site were 50% and 166% lower than an offshore site with a shift in organic production from net productive to net respiratory. Contrary to expectations, calcification rates in 2017 (145.7 ± 20.2 mmol m-2 d-1) were comparable to the 1970s estimate (125.0 ± 12.5 mmol m-2 d-1) and 400% greater than similar observations in 2014. Our results indicate only weak associations between Gnet and aragonite (Ωar). A local increase in coral cover from 18% in 2014 to 31% in 2017 was the likely driver of increased calcification. A steeper TA–DIC slope in 2017 demonstrates a greater control of calcification on seawater carbonate chemistry than prior years. Overall, these results highlight the importance of site selection and replication when comparing metabolic datasets, and demonstrate major short-term variability in metabolic rates. The predictive capabilities of ecosystem metabolism studies may be constrained by using the available short-term datasets to represent long-term calcification trends.
Introduction
Coral reefs are threatened by climate change and other anthropogenic activities. Conditional stressors such as ocean warming, acidification, and eutrophication are predicted to increase in severity for the foreseeable future (Borges and Gypens, 2010; Andersson and Gledhill, 2013; Manzello et al., 2013; Hughes et al., 2018). Understanding how stressors and their interactions are driving losses of habitat, biodiversity, and economic value provided by coral reefs is required to safeguard these ecosystems. In particular, investigations of the major metabolic processes can provide valuable information on the long-term response of coral reef ecosystems to anthropogenic stressors (Albright et al., 2013; Cyronak et al., 2018).
Carbon cycling in coral reefs is driven by two main metabolic processes: inorganic, which includes calcification (C) and dissolution (D) of calcium carbonate coral skeletons and calcifying algae, and organic–photosynthesis (P) and respiration (R) by marine algae. The rates of inorganic (NEC or Gnet = C–D) and organic (NEP or Pnet = P–R) production in coral reef ecosystems may be used as a proxy for overall ecosystem health (Venti et al., 2014; DeCarlo et al., 2017). Inorganic and organic production can be estimated by measuring changes in seawater carbon chemistry, namely total alkalinity (TA) and dissolved inorganic carbon (DIC). There is considerable temporal and spatial variability within chemistry-based ecosystem metabolism estimates (Gattuso et al., 1999; Falter et al., 2001; Atkinson and Falter, 2003), which is driven by seasonality, depth, water residence times, species composition, benthic cover, and carbonate chemistry (Demicco and Hardie, 2002; McCulloch et al., 2012; Andersson and Gledhill, 2013; Falter et al., 2013; Camp et al., 2017). Declining rates of calcification have been demonstrated on coral reefs off Australia (Silverman et al., 2012, 2014; Kwiatkowski et al., 2016) and Hawaii (Shamberger et al., 2011). Field results support ocean acidification and coral bleaching predictions for ecosystem metabolism in a changing ocean (Kayanne et al., 2005; Kleypas et al., 2011; Albright et al., 2016, 2018) consistent with an observed increase in coral reef carbon dioxide and decrease in the aragonite saturation state (Cyronak et al., 2014a).
The ecosystem metabolism of the reef flat at One Tree Island (OTI, Capricorn Bunker region of the Southern GBR, Australia) has been studied on four occasions since the late 1960s, providing an opportunity to potentially assess long-term changes in coral reef ecosystem Gnet and Pnet. Springtime calcification at the original study site (hereafter referred to as DK-13) was estimated to be ∼ 125 mmol m-2 d-1 in the late 1960s and early 1970s (Kinsey, 1972). Silverman et al. (2012) provided a 40-year perspective on Kinsey’s early work, suggesting a 45% drop in net ecosystem calcification associated with a 66% reduction in coral cover. More recent observations in 2012 and 2014 imply further community degradation, with reductions in Gnet of up to 75% and increases in Pnet by >300% over the last 45 years (Shaw et al., 2015; Kwiatkowski et al., 2016). If these trends are consistent over time, we would expect Gnet to be approaching zero.
Here, we quantify Gnet and Pnet rates at three locations on the OTI reef flat. Our estimates are compared with prior estimates to investigate long-term trends to the ecosystem metabolism at the reef flat in the last 50 years. Specifically, the objectives of this study were (i) to investigate spatial variability in estimated rates of ecosystem metabolism within the same reef flat, and (ii) to analyze potential long-term trends in ecosystem metabolism. This paper not only replicates earlier observations at two sites (Kinsey, 1972; Silverman et al., 2012; Shaw et al., 2014; Kwiatkowski et al., 2016), but also covers a new location to assess a potential terrestrial effect on nearshore metabolic rates.
Materials and Methods
Field Sampling
One Tree Island is a pseudo-atoll located approximately 20 km southwest of Heron Island in the Capricorn Bunker region of the Southern GBR (23°30′30″S, 152°15′30″E). Two sites, DK-13 and SHAW, were originally chosen based on the locations of previous studies investigating community metabolism at OTI. DK-13 has been previously described by Kinsey (1972), Kinsey (1980) and Silverman et al. (2012) and the SHAW site has been described in Shaw et al. (2013). During field investigations, we observed groundwater seepages from the coral rubble at low tide ∼10 m from the SHAW site. To assess whether the observed groundwater seepage interfered with Gnet, a third site, DAVIS, was also included here, situated approximately 30 m west of SHAW (Figure 1). This site was chosen due to its similar cross-reef position, benthic community, and depth (0.81 m at DAVIS versus 0.60 at SHAW and 0.65 at DK-13), but away from the immediate influence of groundwater seepage from the island. Therefore, the inclusion of a third site allows us to assess the potential influence on ecosystem metabolism of groundwater-derived inputs of carbon, alkalinity, or nutrients that can be important in coral reefs (Cyronak et al., 2014a; McMahon and Santos, 2017). Water samples of five shallow groundwater seeps closest to the SHAW site were taken at low tide for TA, DIC, and nutrients, as described below.
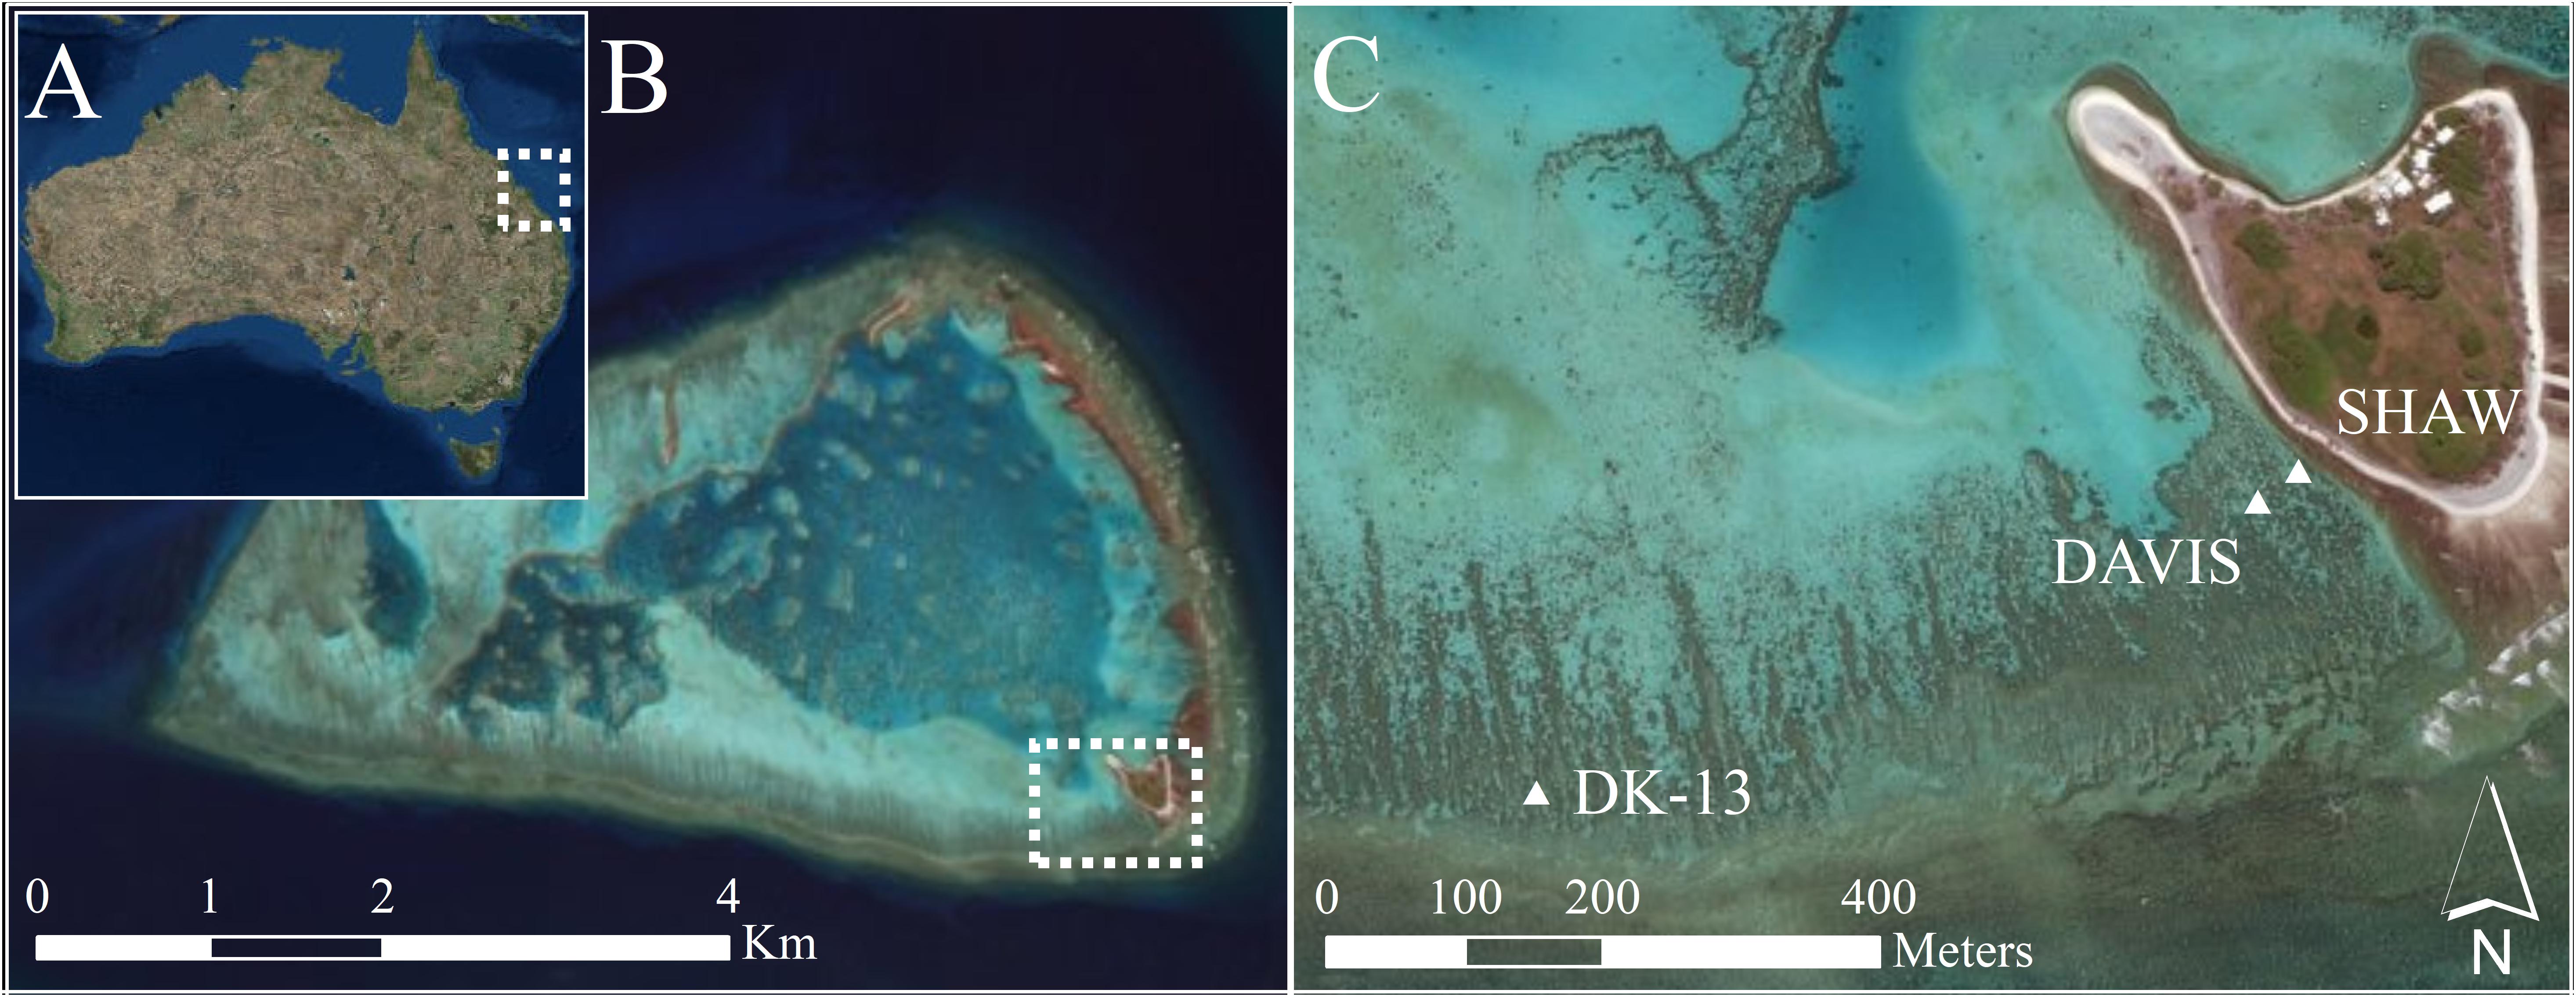
Figure 1. (A) Map of Australia with white dotted square representing the Capricorn Bunker Group of the Southern GBR, (B) One Tree Island coral cay and lagoon with white dotted rectangle denoting area of sampling, and (C) sampling locations used in this study.
Sampling occurred at the southern reef flat of OTI during the austral spring, from 14 to 28 November 2017 (Figure 1). All estimates use the low tide slack water approach originally used by Kinsey (1972) and previously applied to OTI (Kinsey, 1980; Silverman et al., 2012; Shaw et al., 2015; Kwiatkowski et al., 2016). The isolation of the reef flat at periods of low tide prevents the mixing of oceanic water. Thus, changes in water chemistry in the enclosed water body are assumed to be a direct result of biological activity (Kinsey, 1977; Langdon et al., 2010). Daily sampling during low tide gives a 24-hour integration of community metabolism to estimate diel Gnet and Pnet based on changes of the overlying seawater chemistry. Water samples from each site were taken in 30–120-minute increments from the commencement to cessation of reef flat isolation (approximately 1 h before and after low tide, depending on tidal height). Samples were filtered through a 0.45 μm cellulose acetate filter and stored for total alkalinity (TA), dissolved inorganic carbon (DIC), and nutrients (dissolved ammonium, nitrate and nitrite (NOx) and orthophosphate). 0.05% of saturated mercuric chloride (0.37 M HgCl2) was added to DIC vials prior to sampling to prevent carbonate changes due to biological activity (Dickson et al., 2007).
Total alkalinity was determined by the Gran Titration method using a Metrohm Titrando with 0.01 M HCl, referenced with Dickson’s certified reference material (Batches 166 and 170). Triplicate TA analysis per sample yielded a standard deviation of 1.1 ± 0.8 μmol kg-1. DIC was determined using a combined Airica/ Li-Cor 7000 system standardized using Dickson’s certified reference material (Batches 163, 166, and 170). Each analysis ran four replicates with the closest three averaged for final concentrations (see Call et al., 2017 and McMahon et al., 2019 for instrument and analysis specifications). Differences between duplicate analyses of each DIC sample were an average of 0.8 μmol kg-1. Nutrient samples were processed using a Lachat flow-injection analysis (FIA) system (analytical precision of 0.03 μmol L-1) (Eyre and Ferguson, 2005).
Water temperature, pH, and dissolved oxygen (DO) were determined at each sampling interval using a Hach Multiprobe, calibrated with NBS standards. A Hydrolab DS5X was stationed at SHAW to continuously monitor water temperature (±0.1°C), pH (±0.02), salinity (±1%), depth (±1%), conductivity (±1%), and DO (±1%) at 10 min intervals for the duration of the study. Benthic community composition and cover at the time of sampling were estimated at each site using the linear point-intercept method from five 25 m transects spaced ∼5 m apart to be comparable to previous studies performed at these sites (Kinsey, 1972; Silverman et al., 2012; Shaw et al., 2015). The benthos was classified into seven categories following Silverman et al. (2012). It is worth noting that the “dead coral” category actually represents the percentage of filamentous algae, as dead corals are colonized by turfing algae within days of death. For the sake of continuity and comparison, this category will remain labeled as “dead coral.”
Calculations
Net ecosystem calcification (Gnet) was estimated for each low tide:
where a positive Gnet denotes net ecosystem calcification and a negative Gnet describes net dissolution. ΔTA is the incremental change in TA multiplied by -0.5 as two mol of TA are taken up to produce one mol of CaCO3; d refers to water depth at time of sampling, p denotes water density as a function of temperature and salinity, and Δt is the change in time over which the samples were taken. Net ecosystem production (Pnet) was estimated as follows:
where a positive Pnet value denotes net production and a negative value describes net respiration. ΔDIC is the incremental change in measured DIC. Gnet is subtracted to account for changes in DIC due to inorganic precipitation of CO32-. FCO2 refers to the water-to-atmosphere flux of CO2 as described by Raymond and Cole (2001):
where k is the gas transfer velocity parameterized using wind speed (Wanninkhof, 1992), K0 is the solubility of CO2 in seawater, pCO2water is the partial pressure of CO2 in the water at the time of sampling, and pCO2air is the atmospheric partial pressure of CO2, assumed to remain constant at 400 μatm. Wind speed data were obtained from the Australian Bureau of Meteorology at nearby Heron Island. Wind speeds were consistently <10 m s-1, the speed at which models for calculating CO2 fluxes across the water–air interface begin to widely diverge (Ho et al., 2006). To compare flux estimates and to assess whether wind speed was a significant driver of CO2 evasion and DIC dynamics during this study, piston velocities (k) were calculated using the equations presented by both Raymond and Cole (2001) and Wanninkhof (1992).
The relative influence of Pnet on changes in carbonate chemistry was calculated to investigate ecosystem functioning as described by Cyronak et al. (2018):
where mTA-DIC refers to the TA–DIC slope. The Pnet: Gnet ratio can then be simply calculated by dividing % Pnet by % Gnet (i.e., 100–%Pnet).
Rates of Gnet and Pnet were calculated using samples procured at the beginning and end of the low tide isolation only. Logistical difficulties in intensive sampling on the reef crest resulted in no half-hourly samples collected at DK-13 at night. Therefore, samples collected half-hourly during the low tide period as described by McMahon et al. (2018) were not included in metabolic calculations. Diel integrations of metabolic rates were calculated as the sum of average hourly Gnet and Pnet rates. “Daytime” was defined from between 0600–1900. Uncertainties were calculated as the propagation of errors of relevant parameters (Harvard, 2007) as follows:
where SEfinal refers to the standard error for the variable in question (i.e., Gnet), refers to the calculated value of the variable in question, and EP refers to the error propagation, or a sum of fractional uncertainties which make up the constituents in prior equations:
where the letters a... z refer to the mean values of variables used to calculate , and δa..δz refer to the standard error of the specific variable. Wind speed, depth, temperature, salinity, and analytical TA and DIC uncertainties were used in error calculations of instantaneous rates. Final hourly and daily metabolic rates also include intra-hourly variability of Gnet and Pnet in the error propagation, which represents the vast majority of the uncertainties reported.
Results
Live hard coral cover ranged from 31 ± 3.2% to 41 ± 9.0% at the reef flat (Figure 2). Few bleached corals were observed and the majority of dead corals appeared to be deceased for a long period of time as they were colonized by filamentous algae. There was very little calcareous and no large macroalgae observed on the reef flat transects. Nutrient concentrations were low and consistent among sites, demonstrating no obvious influence of groundwater seepage on nutrient dynamics at the SHAW site. Averages of ammonium (NH4+), nitrite and nitrate (NOx), and orthophosphate (PO43-) ranged from 0.17 to 0.21, 0.86 to 0.99, and 0.51–0.53 μmol L-1 respectively, indicating an oligotrophic environment at the three sites.
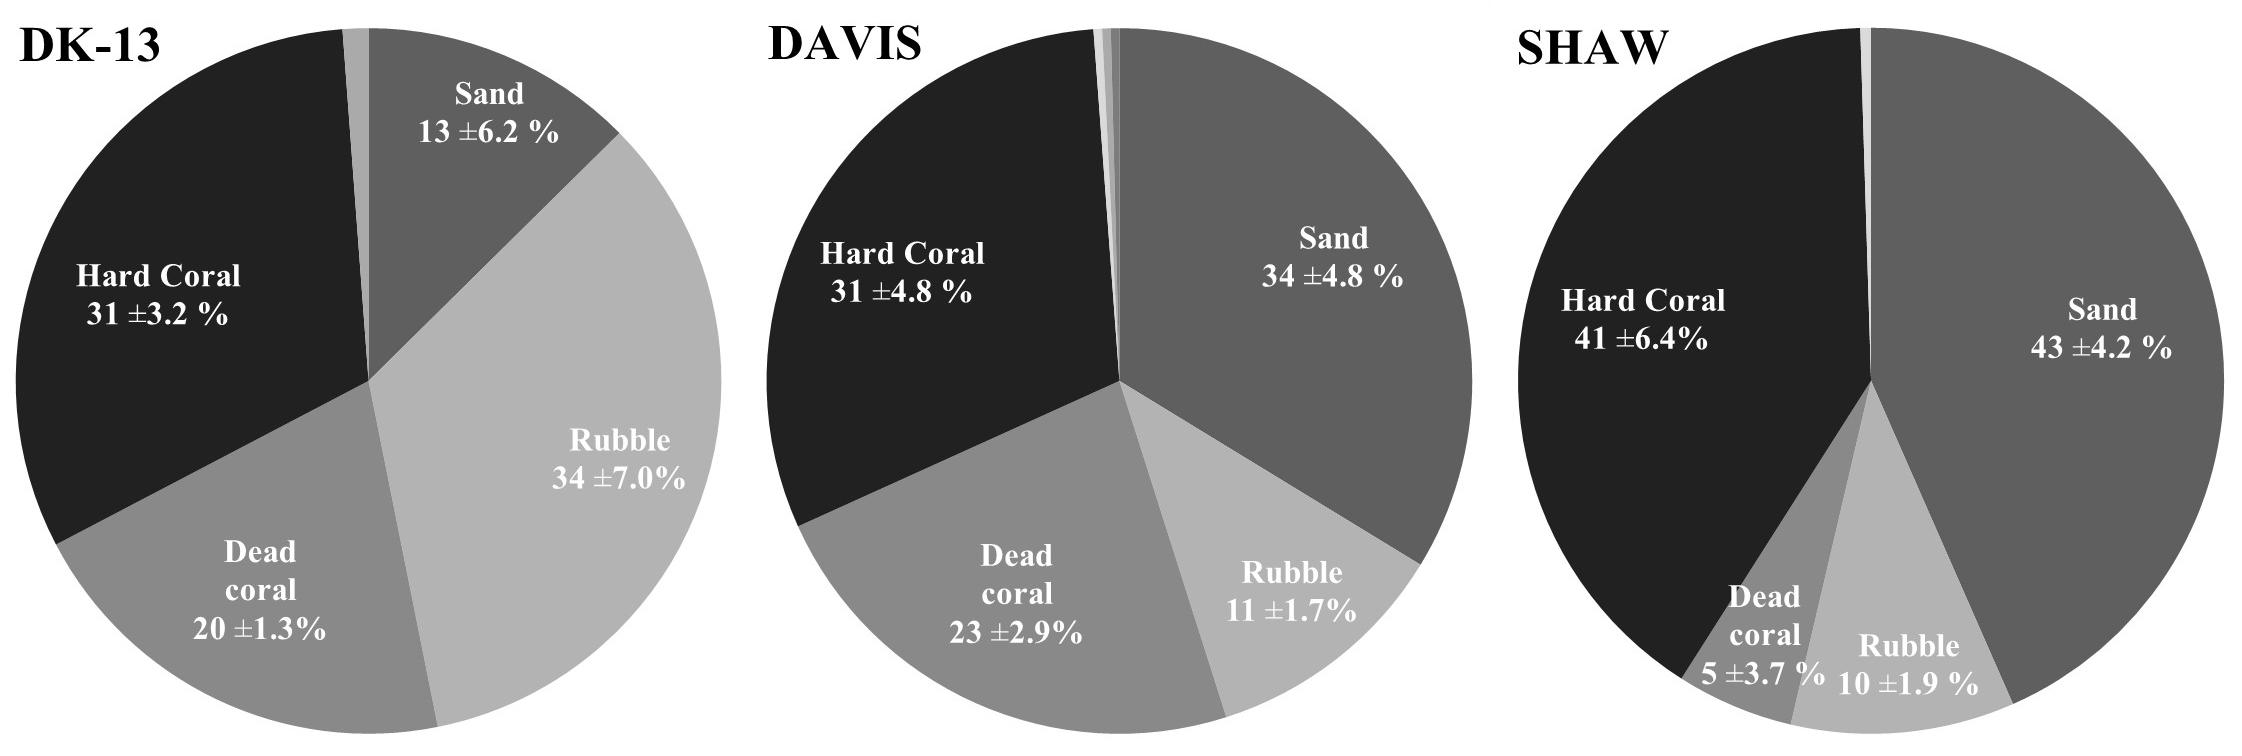
Figure 2. Mean benthic cover (±SE) Soft coral made up approximately 1% of benthic cover at all sites and coralline algae was only observed at DK-13 with 1% cover.
A total of 178 seawater chemistry observations were made at the three sites over 35 low tide periods, resulting in 69 calculated rates of both Gnet and Pnet (Figure 3). Estimates of CO2 evasion rates between the two methods were within 2 mmol m-2 hr-1. The average CO2 fluxes to the atmosphere were 1.75 mmol m-2 hr-1 when using Wanninkhof (1992), and 2.57 mmol m-2 hr-1 when using Raymond and Cole (2001). These values are equivalent to 3.7–5.5% of the hourly DIC change observed in the lagoon, implying that uncertainties in CO2 emissions play a minor role in Pnet estimates. Due to the minor contribution of CO2 fluxes to DIC changes, the fluxes derived using the Raymond and Cole equation will be used for all reported Pnet rates. TA at DK-13 in 2017 was very similar to 2009, with a diel average of 2244 ± 80 μmol kg-1 during this study versus 2248 ± 80 μmol kg-1 reported by Silverman et al. (2012), with similar daytime and nighttime values. In contrast, DIC was much higher in 2017. Nighttime average DIC was 2417 ± 60 μmol kg-1 versus 2095 ± 86 μmol kg-1 in 2009. Daytime mean DIC was also higher by 100 μmol kg-1, resulting in a higher diel DIC average and lower Ωar.
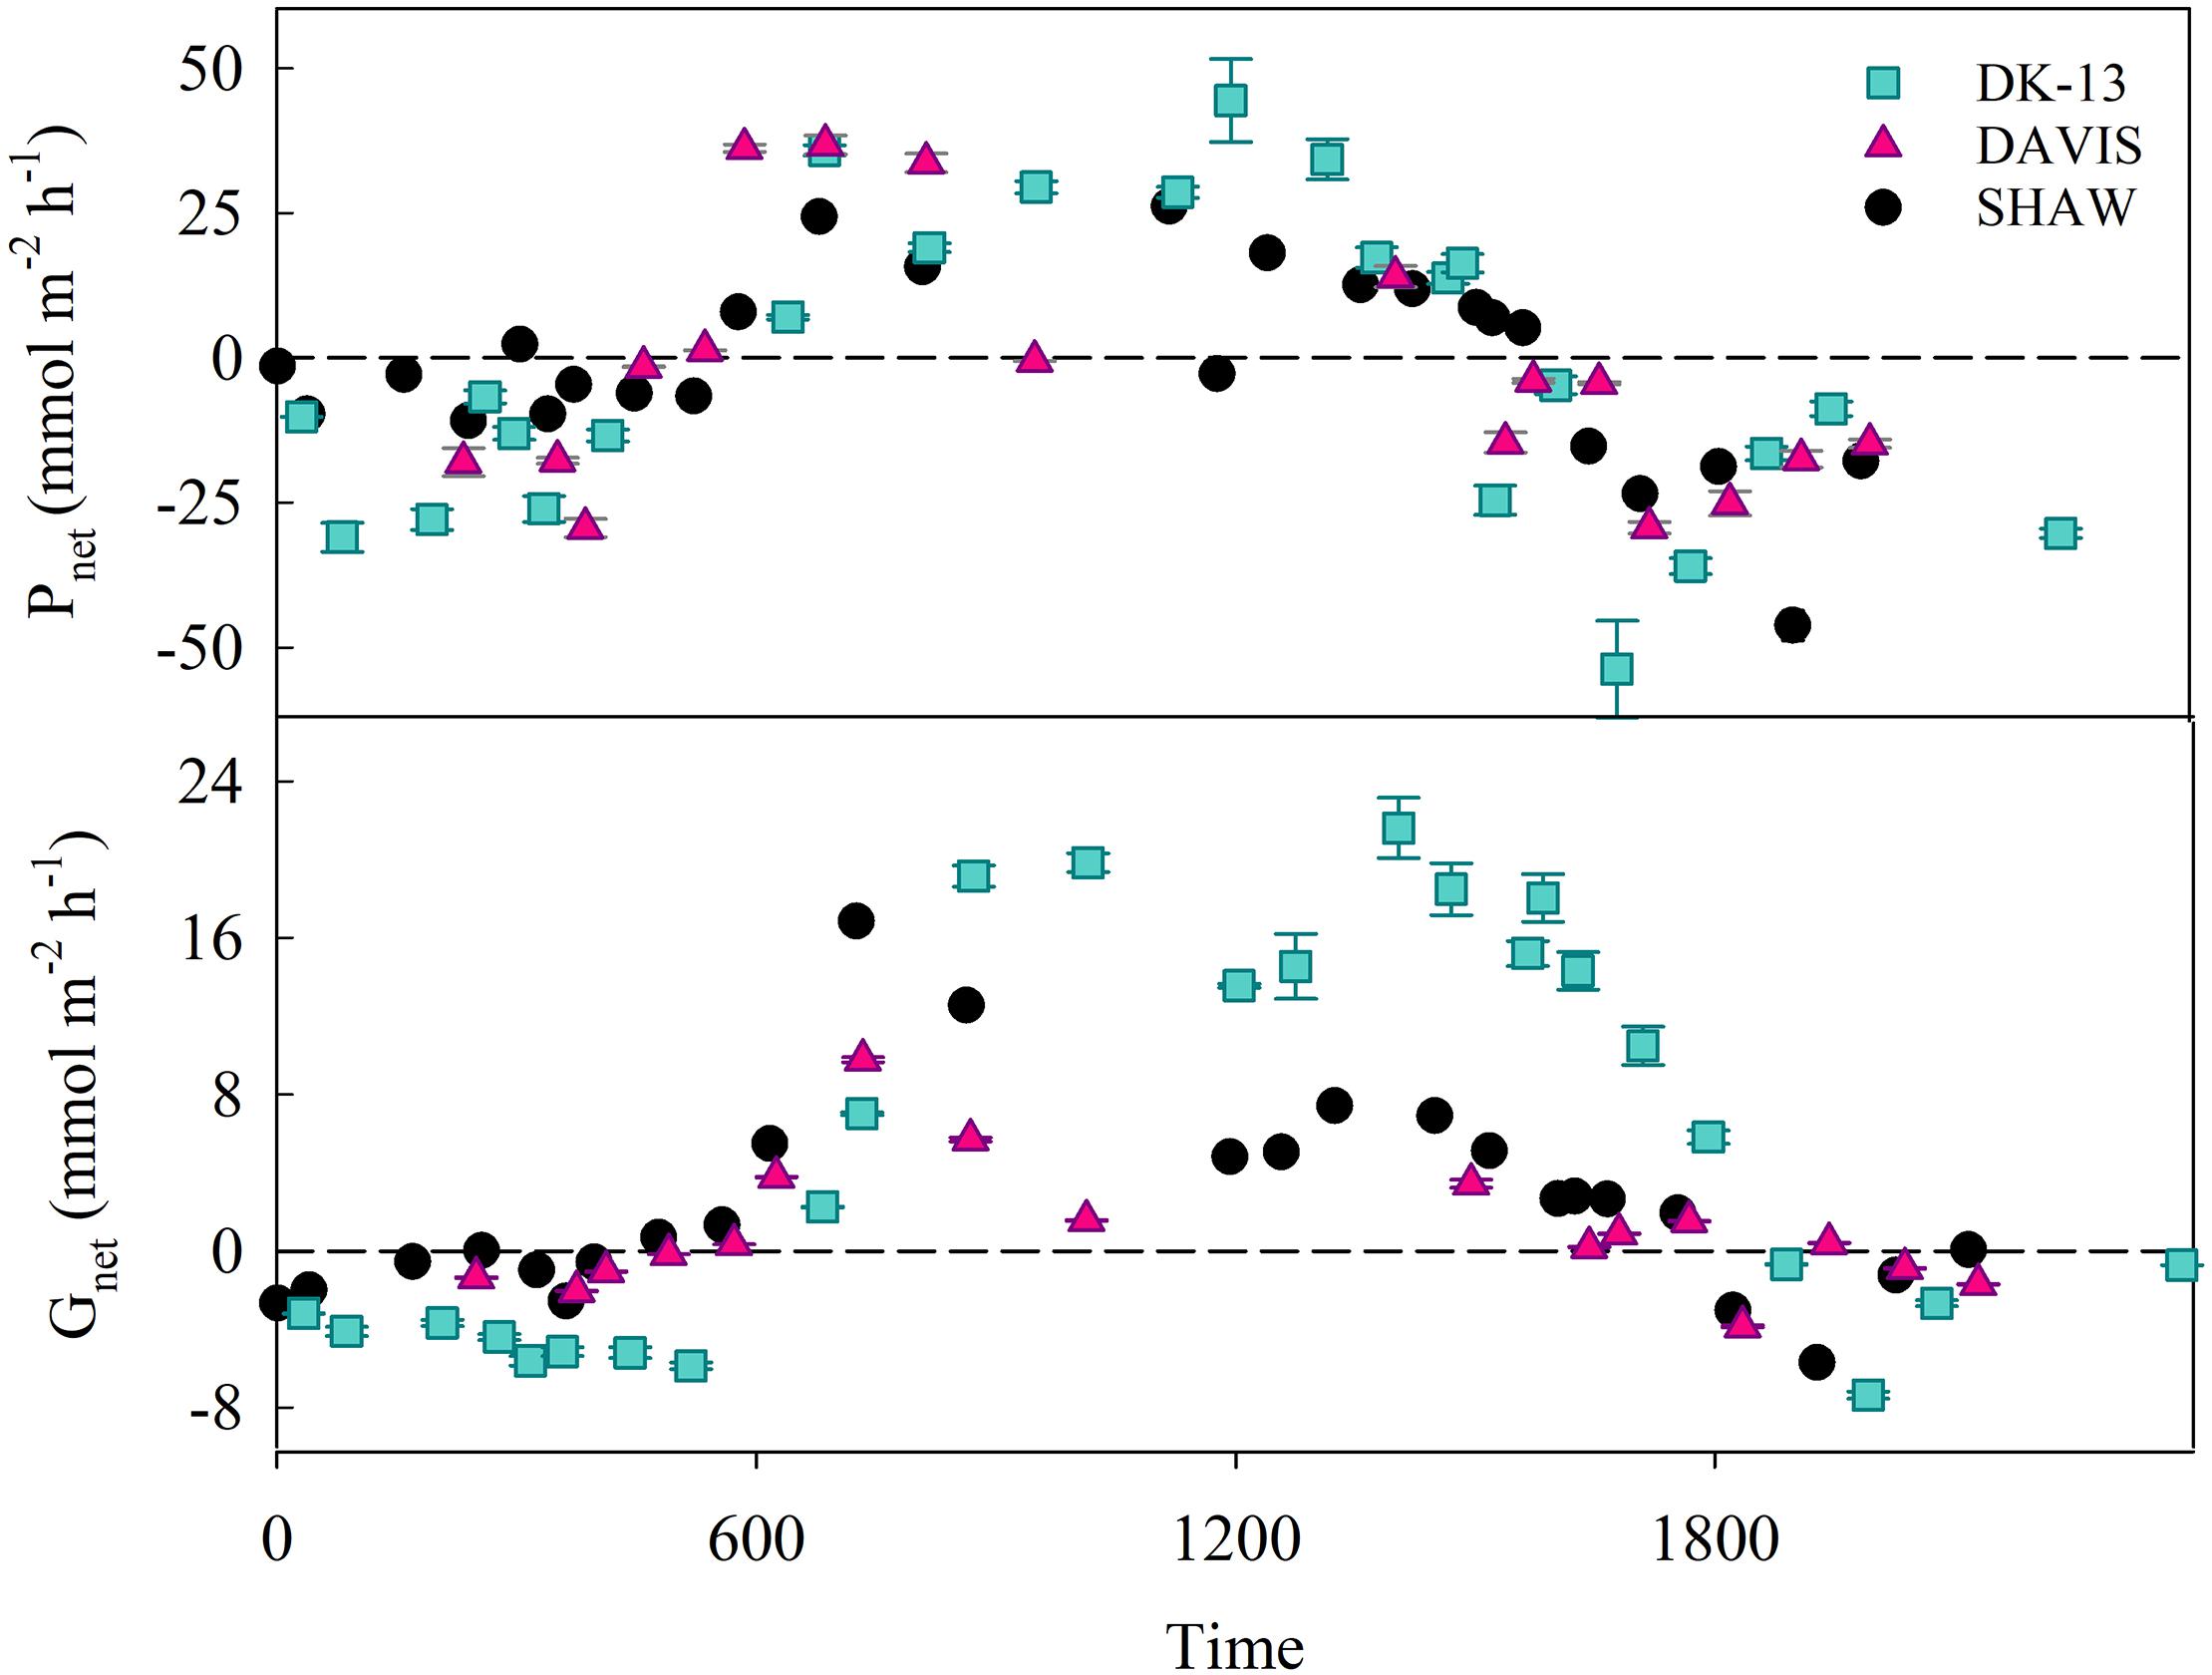
Figure 3. Calculated values of Pnet and Gnet (±SE) for each sampling period at all study sites. Error bars are not visible in many cases as the error is smaller than the symbol. Dotted lines represent net 0 production for Gnet and Pnet.
Daytime uptake and nighttime release of TA and DIC occurred at each of the sites studied. However, dips in uptake occurred during mid-day periods when calcification and photosynthesis are typically highest, thought to be a result of high cloud cover on 15 November when the 1200–1400 period was sampled. The TA and DIC at the beginning of this low-tide isolation (which would be the most similar to source water) was not depleted compared to other sampling periods. Therefore, a change in source water carbonate chemistry is unlikely to have caused the atypical Gnet and Pnet observations during this time. DK-13 had a larger diel range and more extreme values of TA, DIC, and production than both the DAVIS and SHAW sites (Table 1). At the DAVIS site, Gnet tracked very closely to SHAW but Pnet more closely tracked DK-13 (Figure 3). Due to low-tide time constraints, we were unable to sample the DAVIS site from approximately 1200–1400, preventing diel-integrated estimates of metabolic rates at this site.
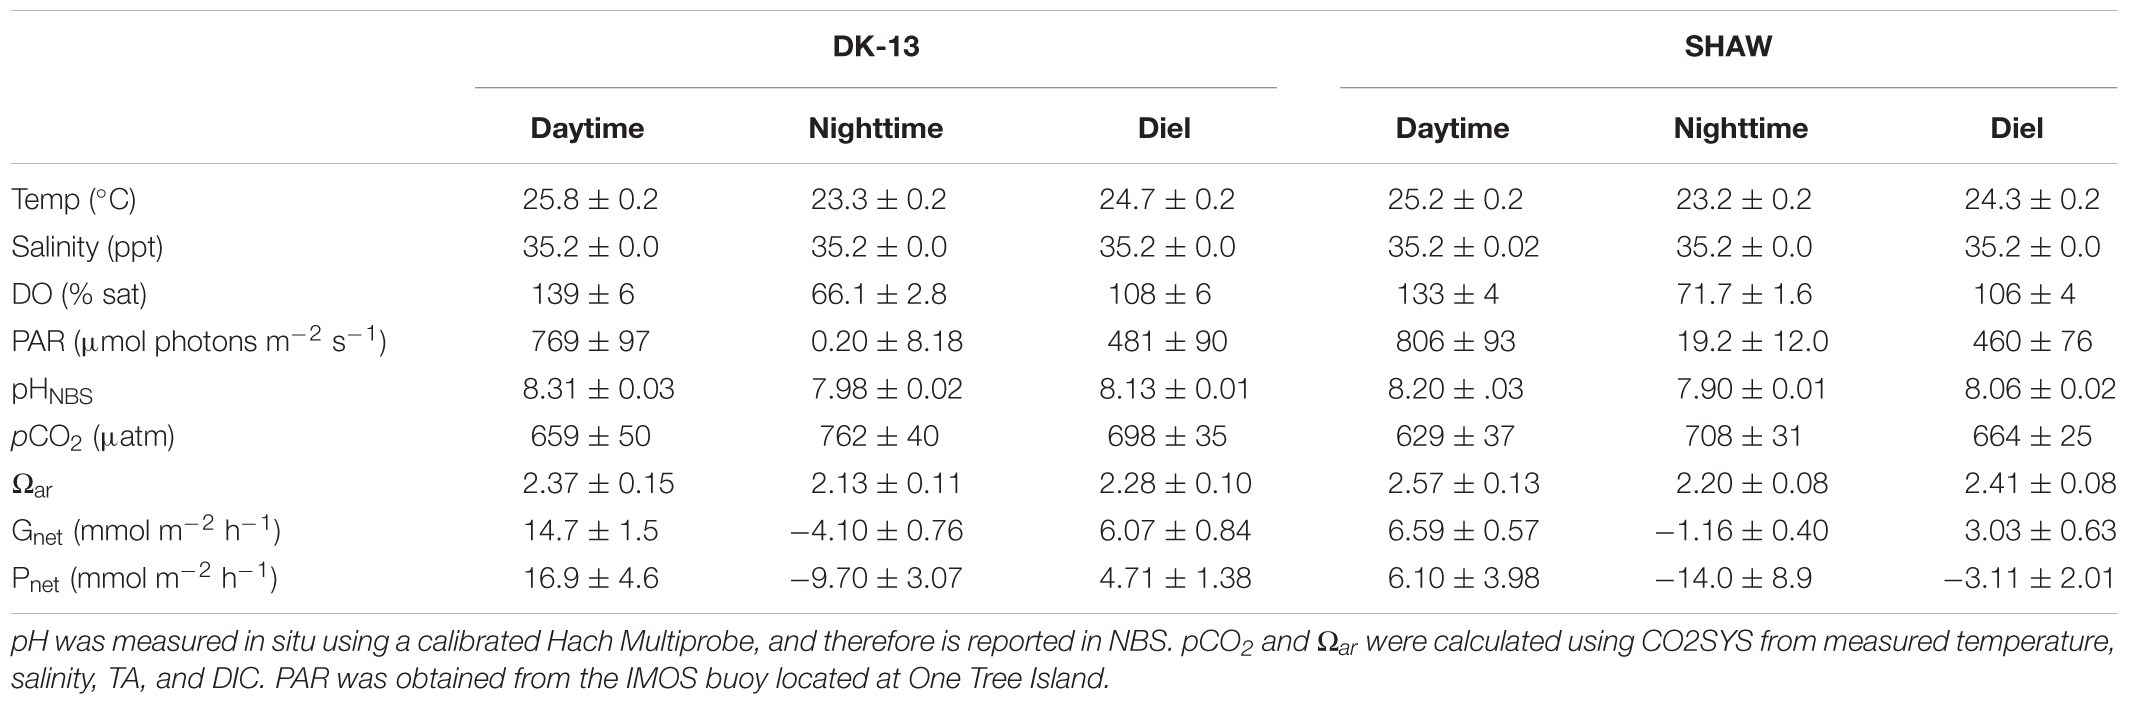
Table 1. Daytime (0600–1900), nighttime (1900–0600), and diel averages (±SE) of seawater chemistry observations and metabolic estimates at each site during low tide slack periods from 14 to 26 November 2017.
Calcification tended to increase with light intensity and photosynthesis (Figure 4). Calcification at DK-13 had a negative correlation with pCO2 and a positive relationship with Ωar (Figure 4). Neither the SHAW nor DAVIS sites were significantly correlated with Ωar. Slopes of TA–DIC regression equations ranged from 0.32 ± 0.03 at SHAW to 0.59 ± 0.05 at DK-13 (Figure 5 and Table 2).
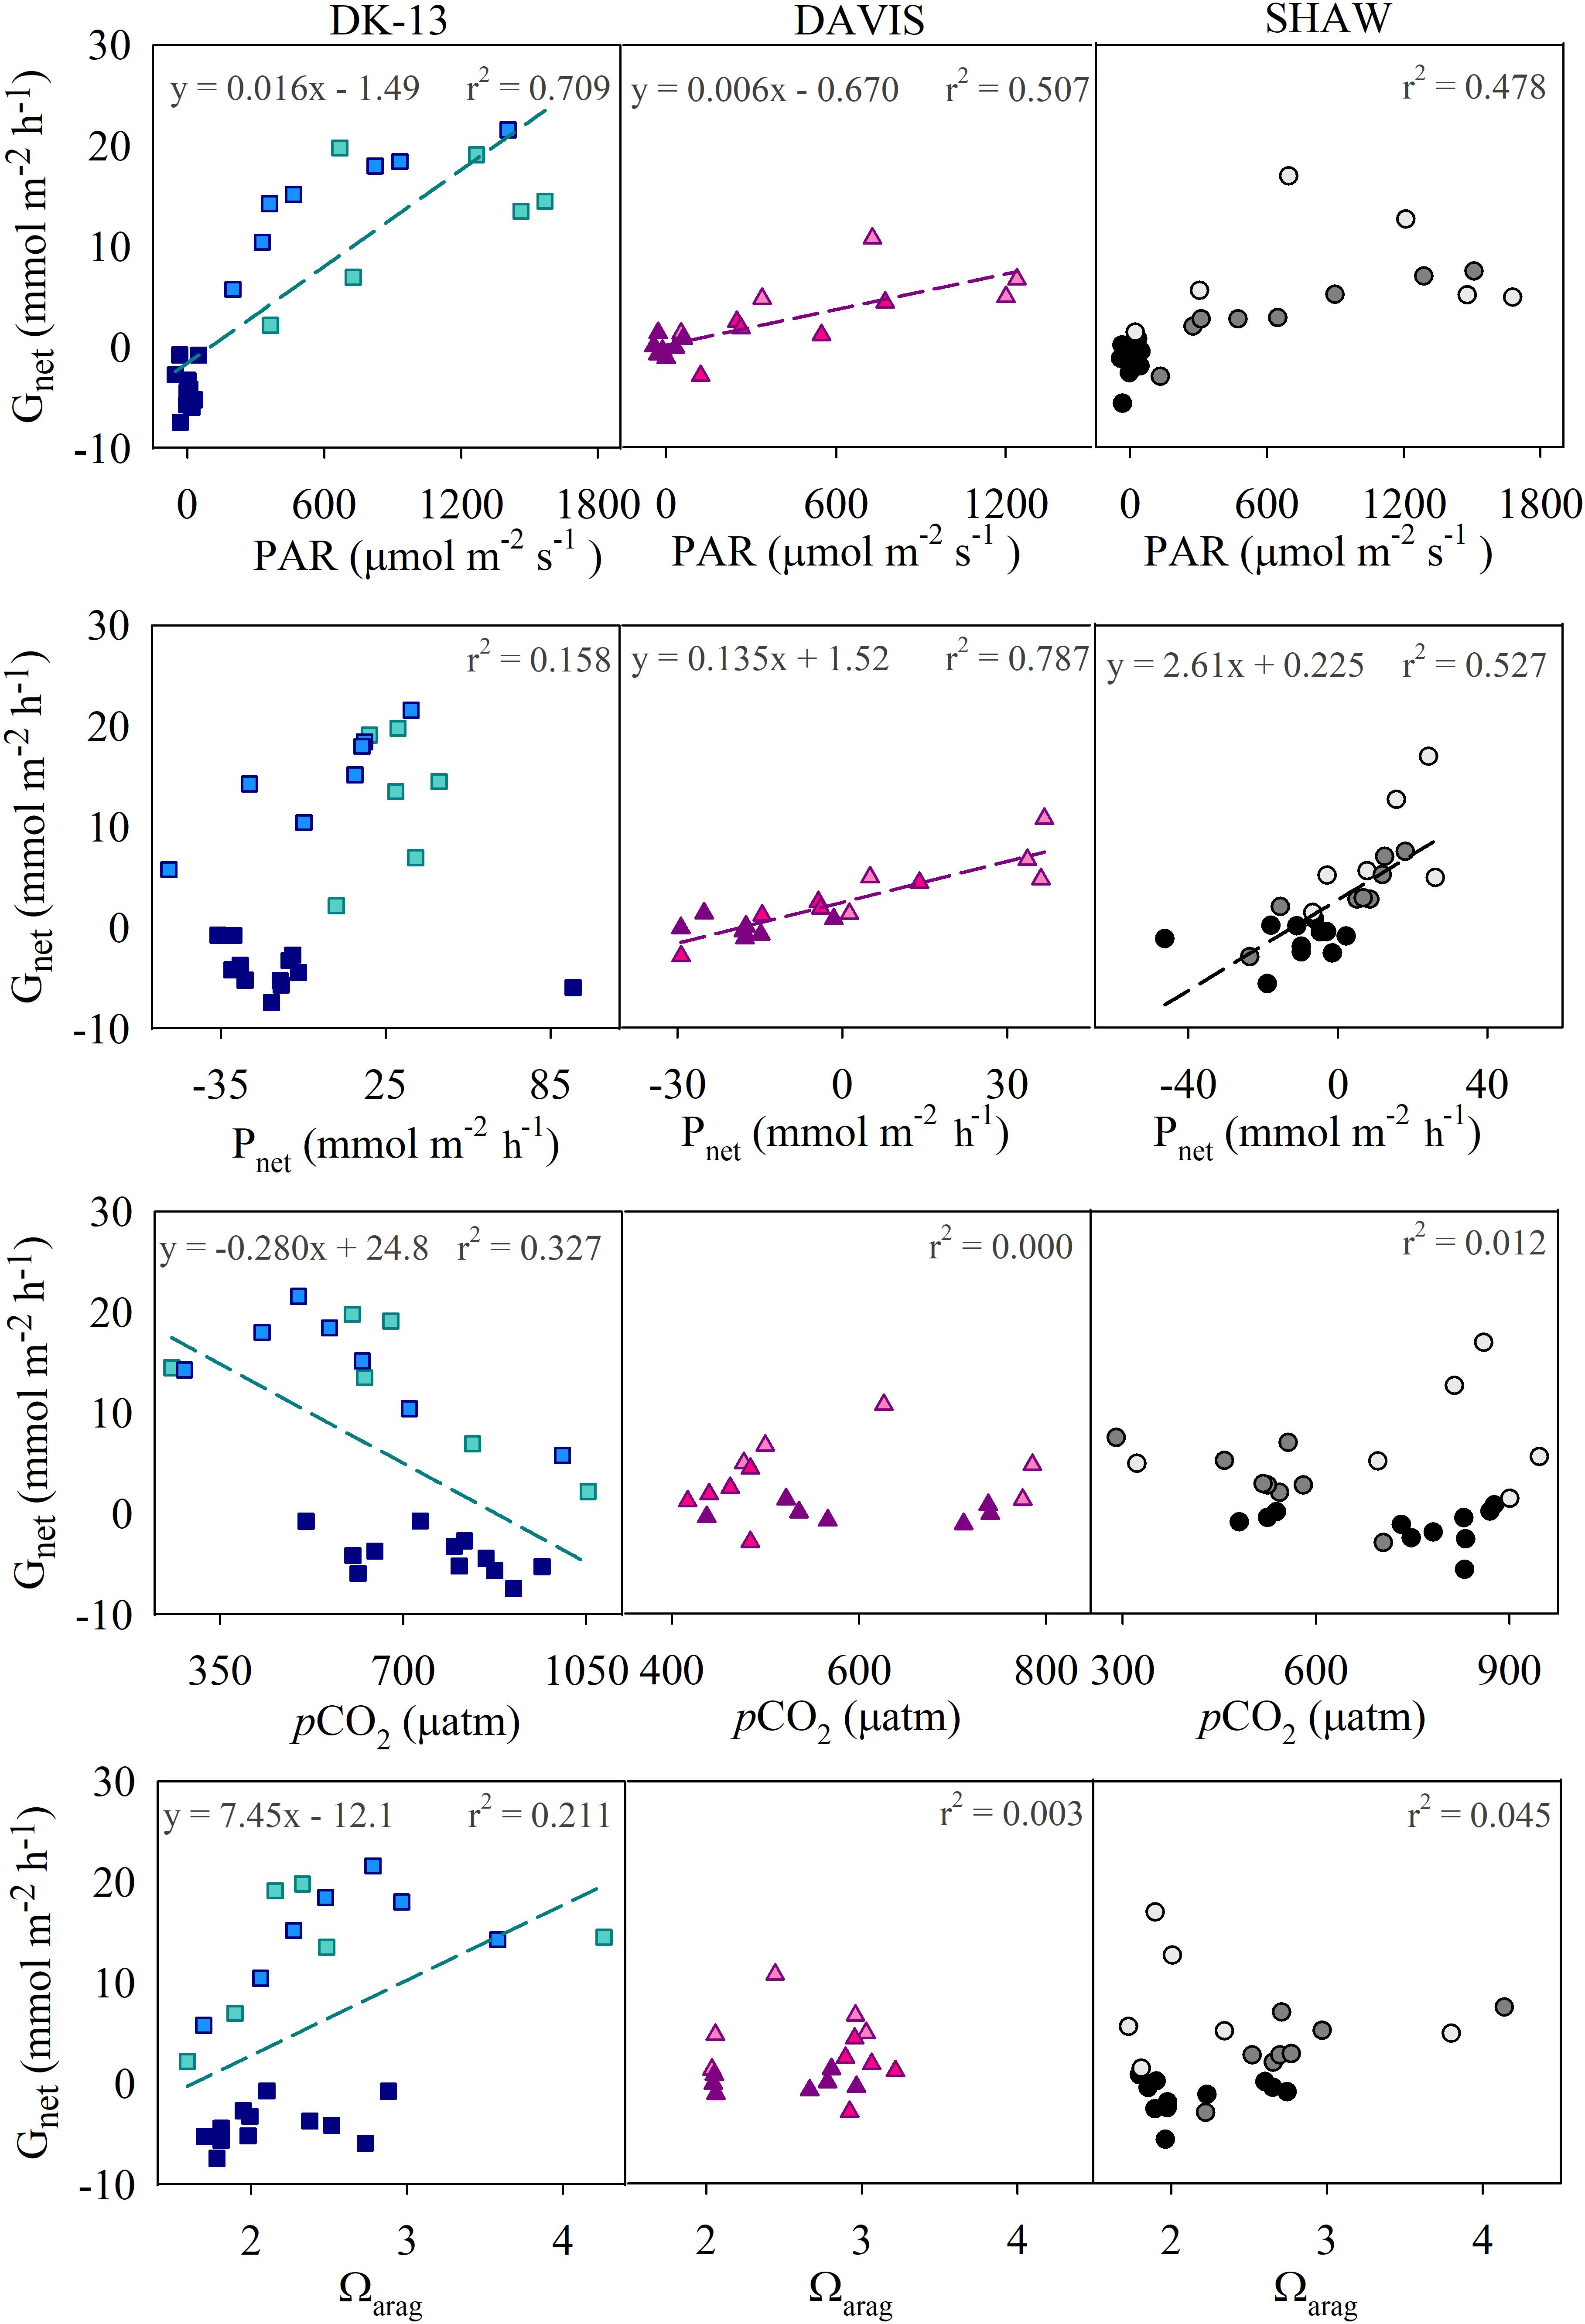
Figure 4. Correlations between calcification and potential controls. Regression lines and equations refer to significant correlations (p < 0.05). Note that Gnet and Ωar may initially appear to have hysteric loops at the DAVIS and DK-13 sites (see McMahon et al., 2013 for comparison). However, when the data are broken down into morning (lighter colors), afternoon (medium colors), and night (darker colors), the data are scattered and do not present a clear hysteric loop, though DK-13 has an overall positive correlation with Ωar regardless of time of day.
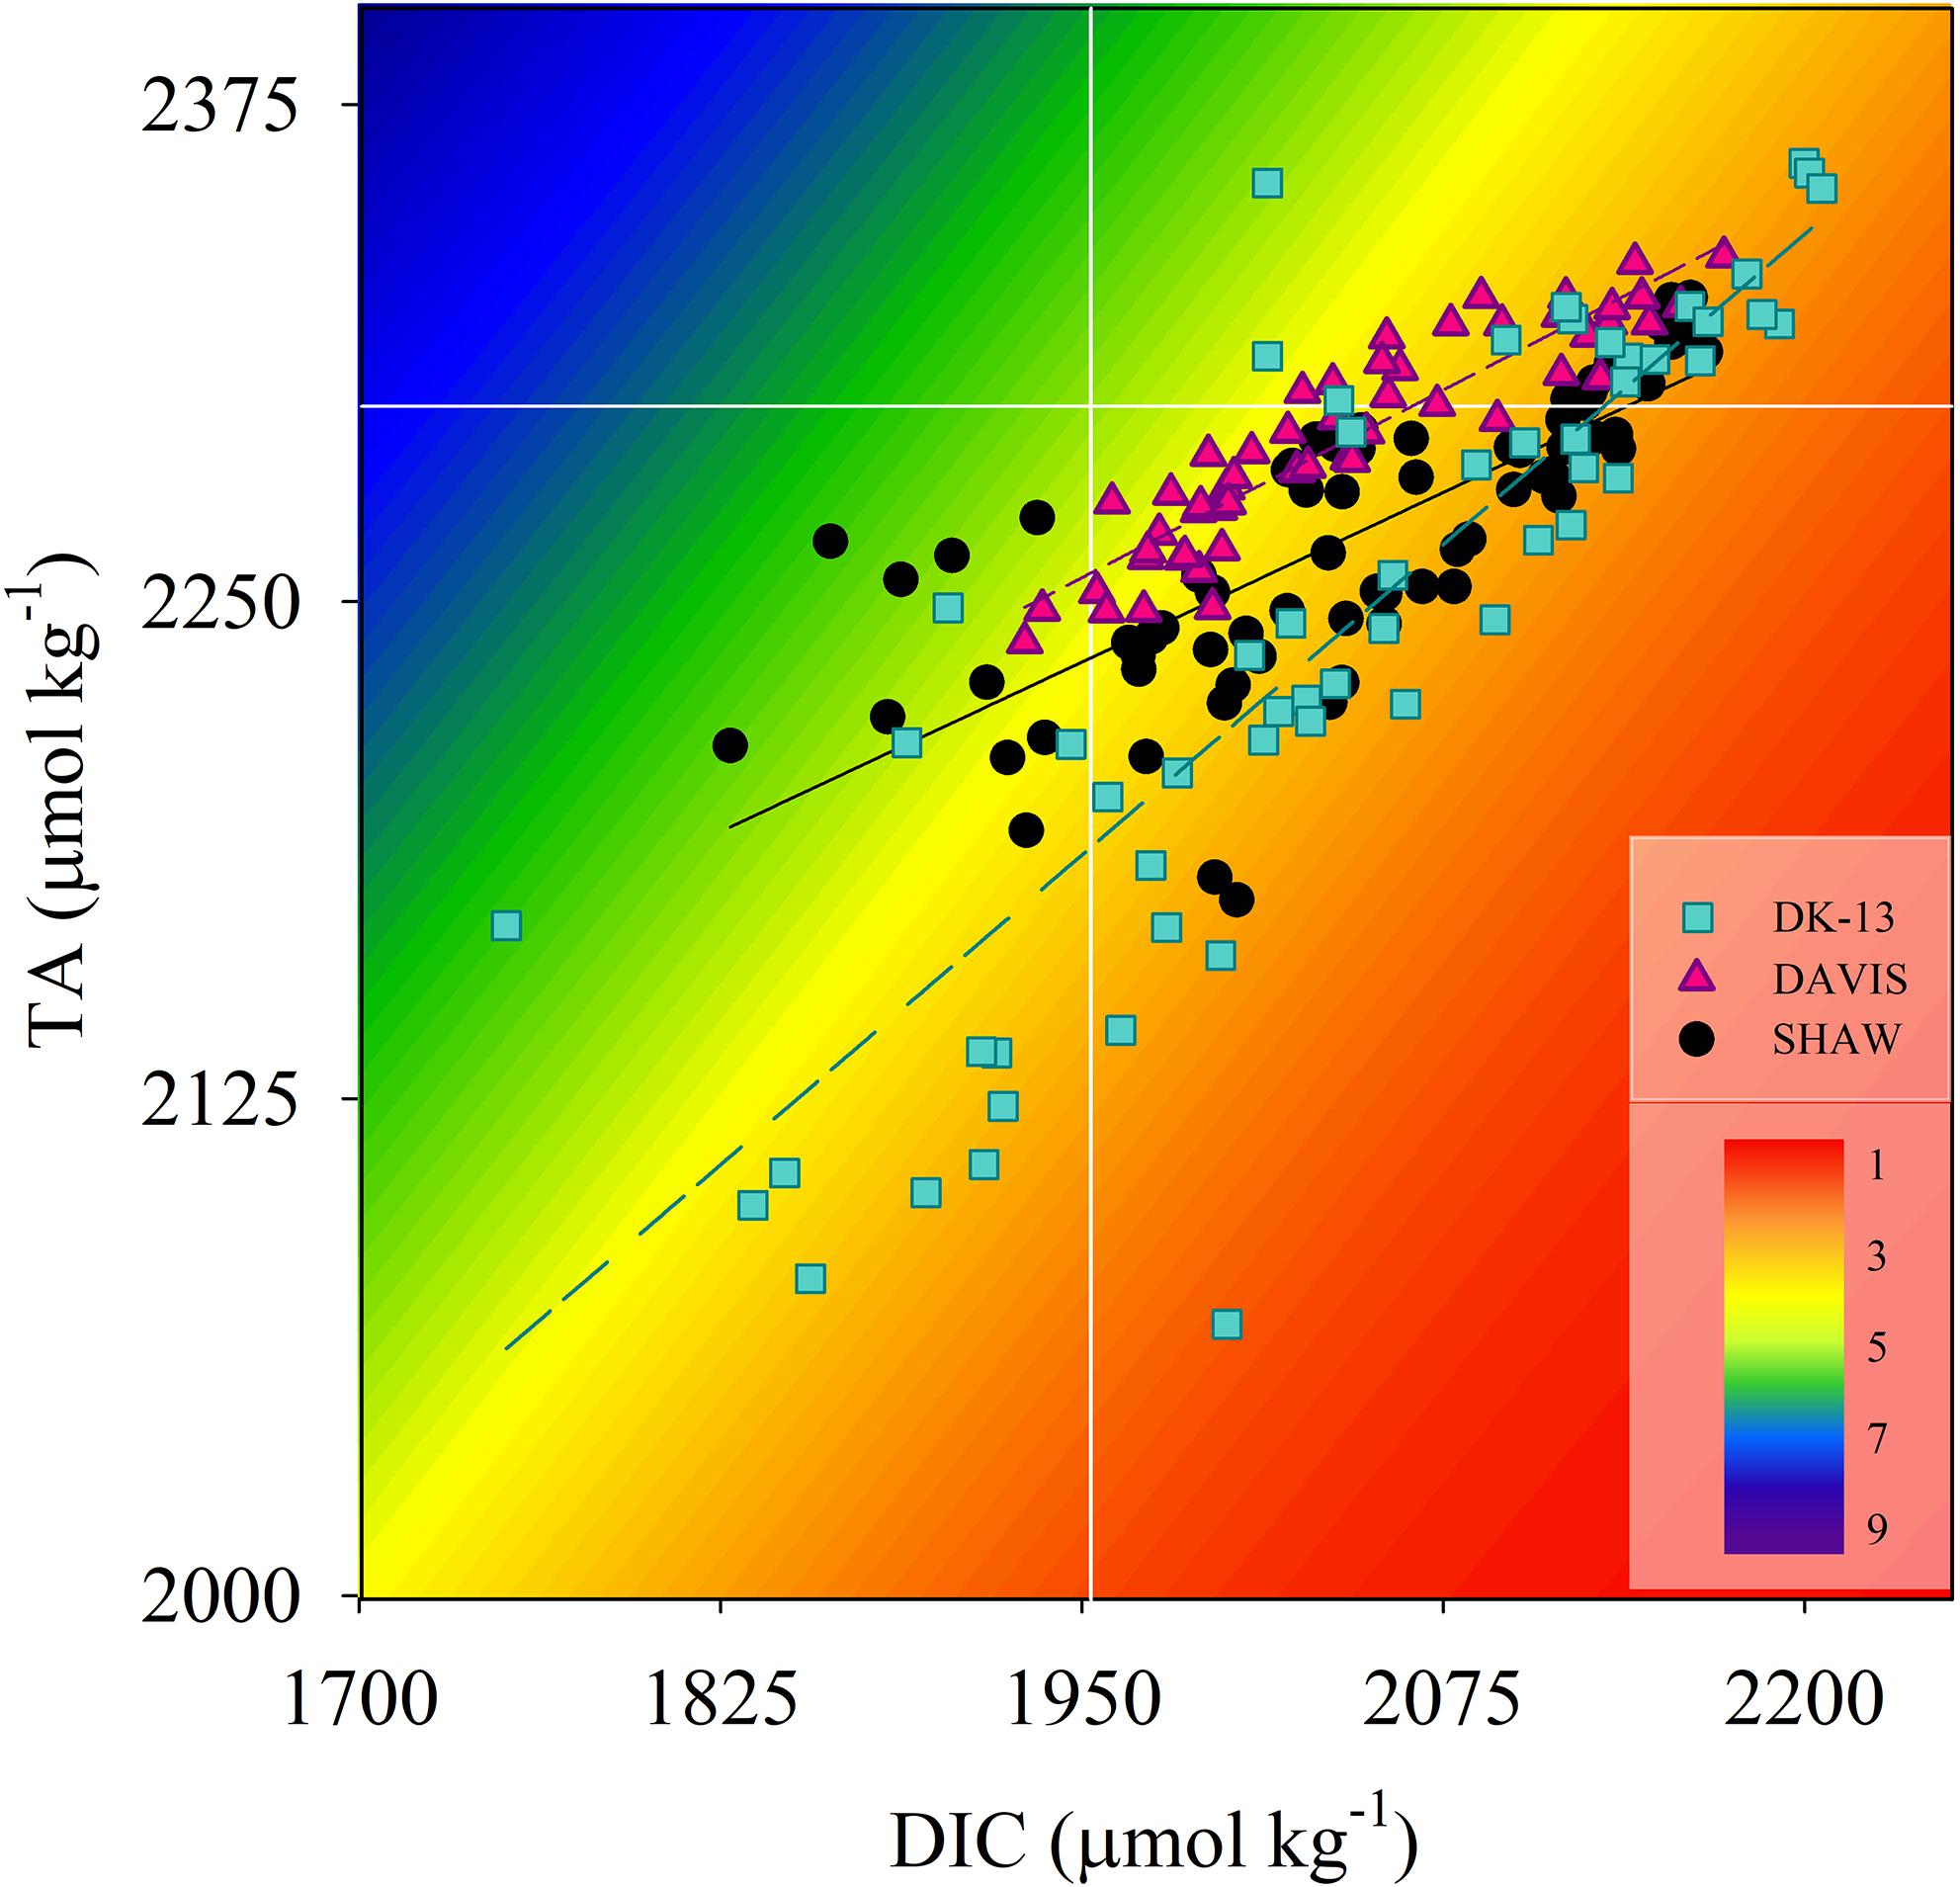
Figure 5. Paired TA and DIC measurements at all sites. Background colors represent the aragonite saturation state normalized to average site temperature and salinity (McDougall and Barker, 2011). White lines represent offshore concentrations of TA and DIC as reported in Mongin et al. (2016).
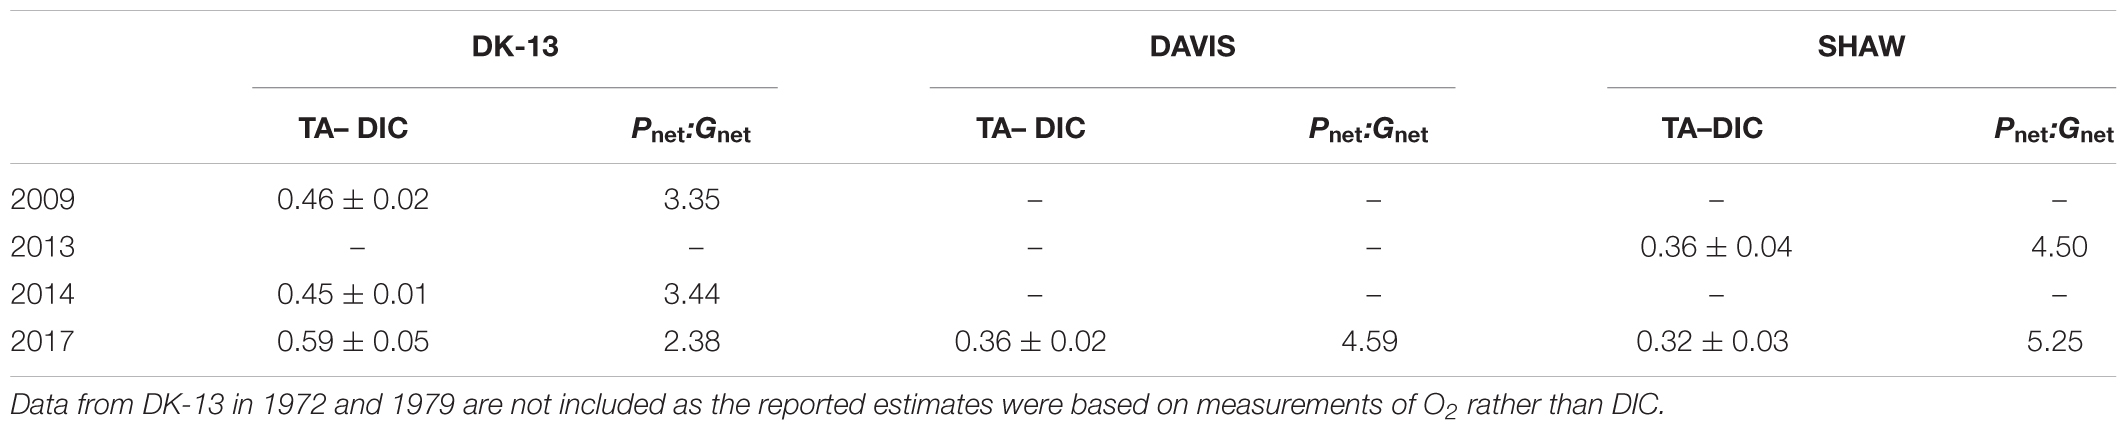
Table 2. Previously reported and calculated slopes (±standard deviation) of TA–DIC regression equations and Pnet:Gnet ratios.
During the day, all sites were net calcifying and net photosynthesizing and at night were net dissolving and net respiratory (Table 1). Daily integrated Gnet rates at SHAW were ∼50% lower than DK-13 estimates, demonstrating significant spatial variability within the reef flat. DK-13 was net autotrophic, with daily rates of estimated organic production nearly 200 mmol m-2 d-1 greater than the SHAW site, which was net heterotrophic (Table 1 and Figure 6).
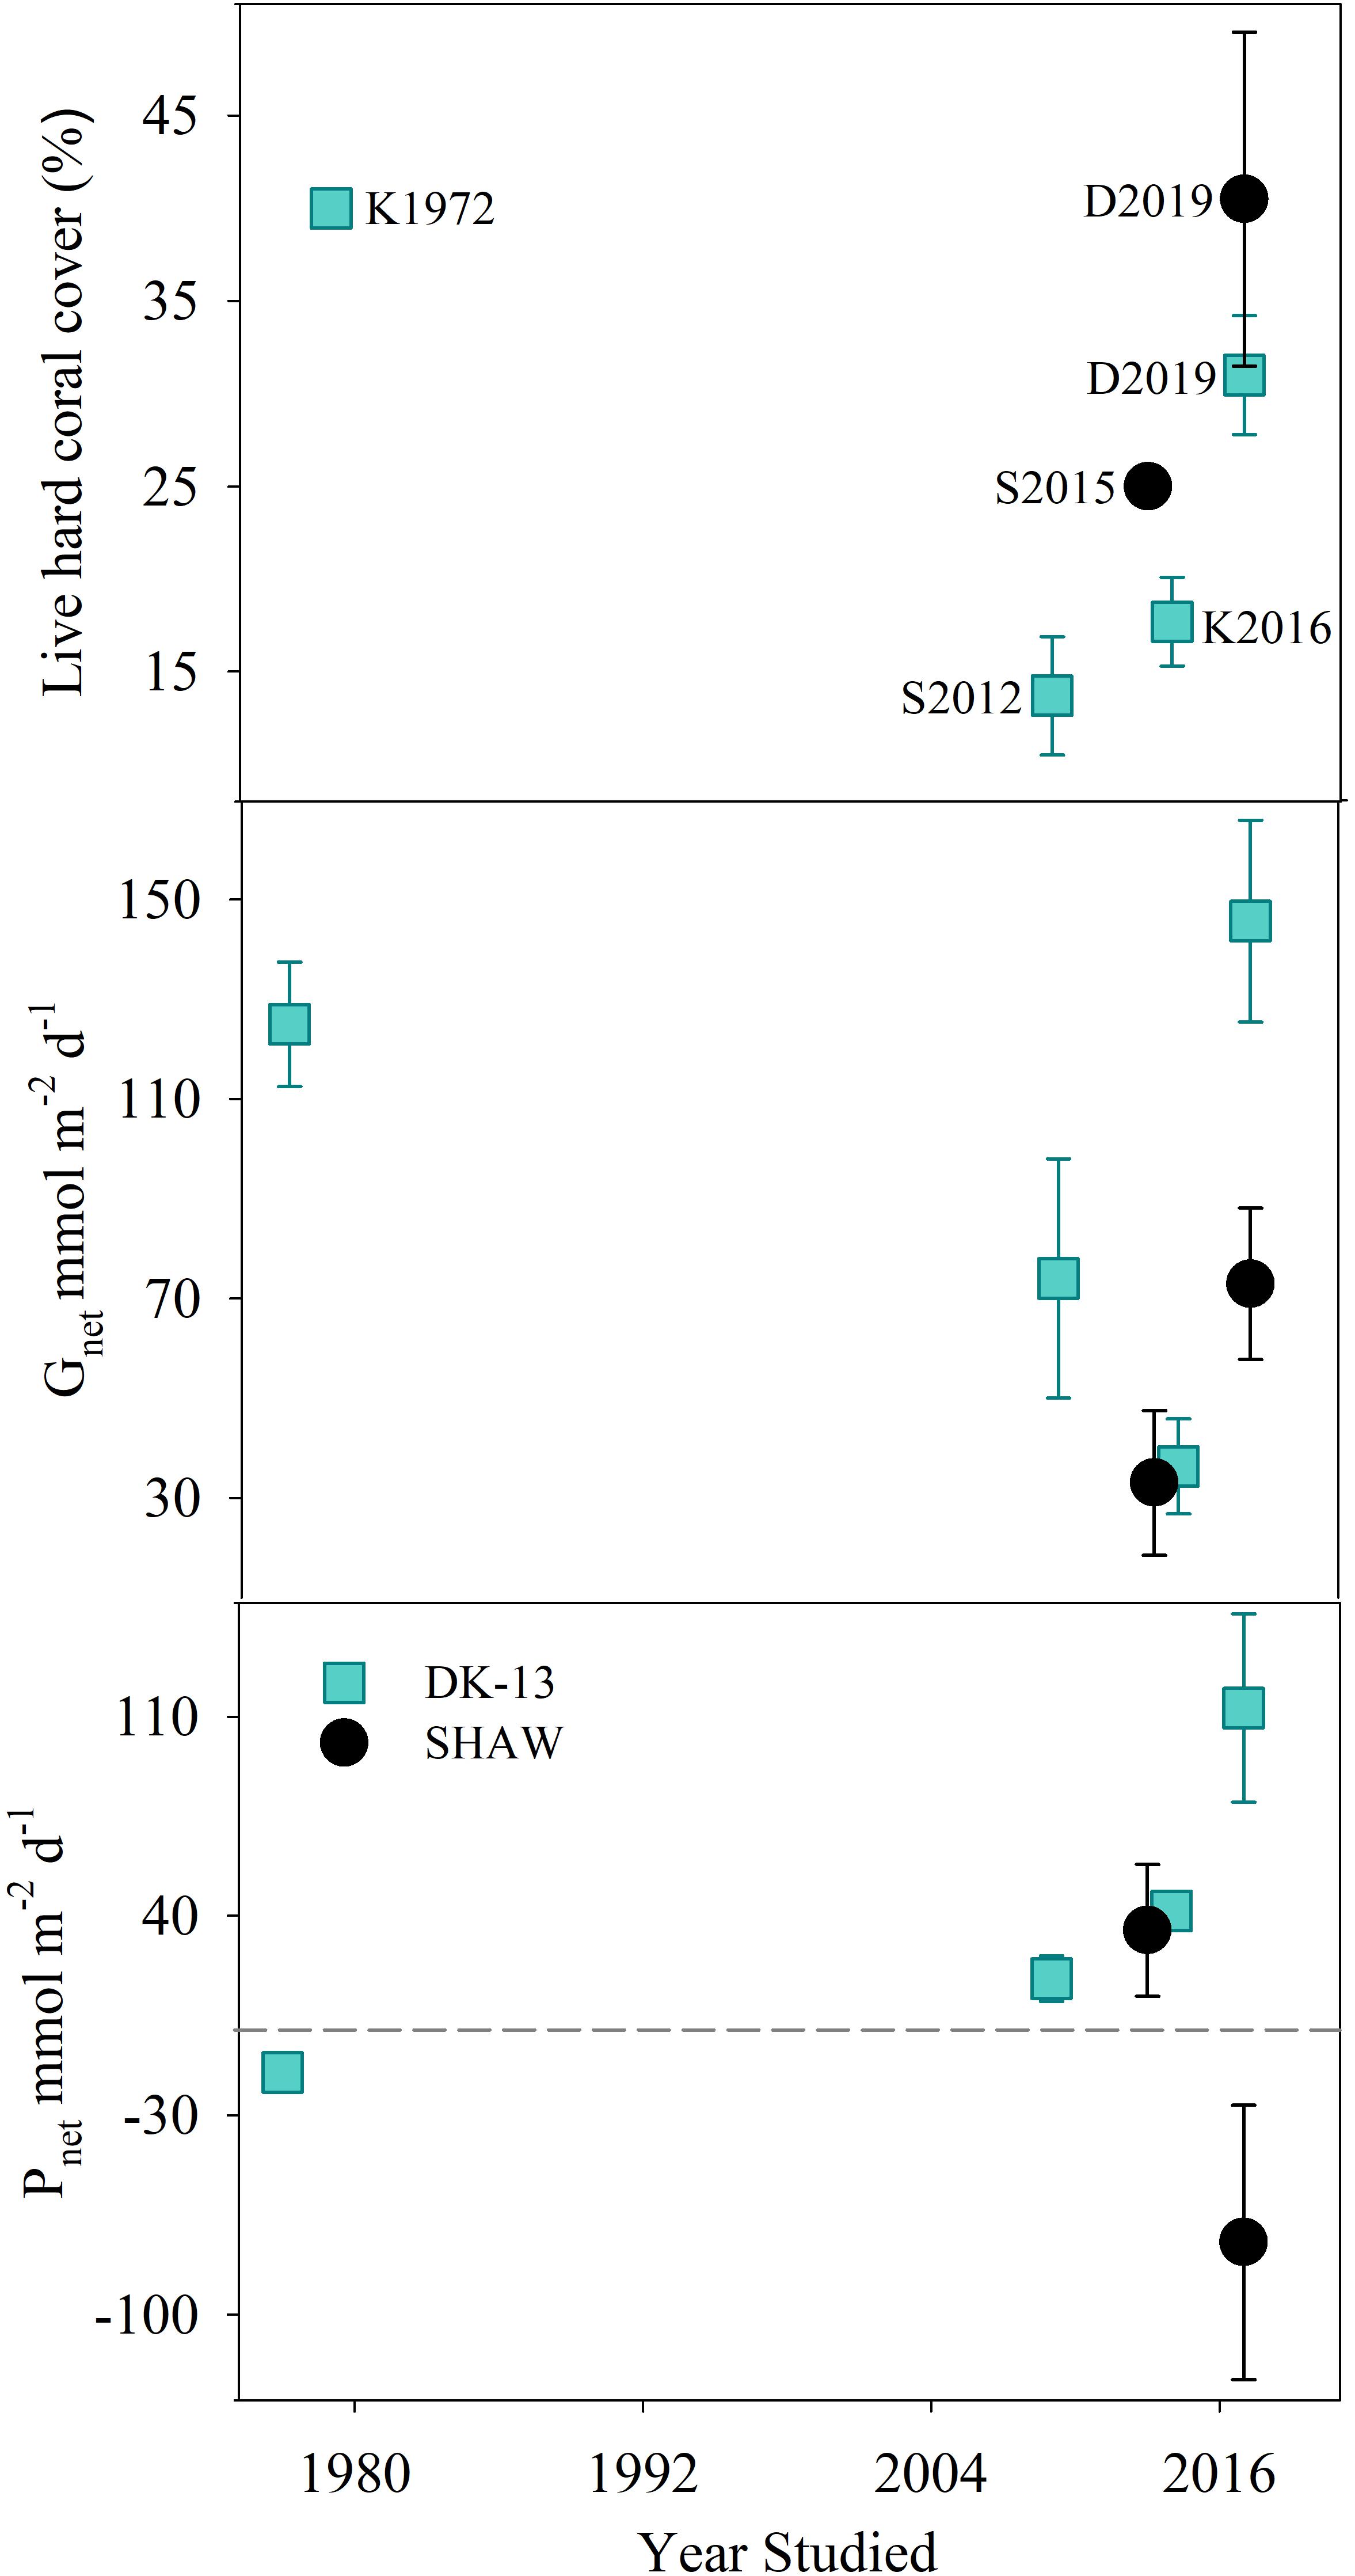
Figure 6. Estimated coral cover, Gnet, and Pnet rates (±SE) at the DK-13 and SHAW sites over time. Dotted line represents net 0 production for Pnet. K1972 refers to Kinsey (1972); S2012 refers to Silverman et al. (2012); K2016 refers to Kwiatkowski et al. (2016); S2015 refers to Shaw et al. (2015), and D2019 refers to this study.
Discussion
Spatial Variability Within the OTI Reef Flat
It is often assumed that metabolic rate estimates derived from a single sampling site on a coral reef can represent the entire ecosystem, provided that benthic structure and hydrodynamics are consistent (Kinsey, 1980; Hatcher, 1990). Numerous experiments have been undertaken to investigate metabolic parameters provided by different reef habitats (e.g., lagoon versus reef flat, Shamberger et al., 2011, 2014, 2018) and benthic structure (e.g., sand versus coral bottom, Yates and Halley, 2006). However, reef types are primarily defined based on geomorphological features without accounting for biological modification of an ecosystem, which creates a mosaic of different microhabitats within a larger area. Here, we use observations from three locations within a single reef habitat type at the same location to assess intra-ecosystem spatial variability. We observed significant spatial variation in Gnet of 50% and Pnet of 166% (relative to DK-13 rates) that would prevent straightforward upscaling of results from a specific location to other areas (Figure 3). These differences may be attributed to (1) variation in the benthic community composition, (2) altered metabolism as a result of site-specific abiotic conditions (such as lower light levels, pH, or nutrients), or (3) site-specific alterations to seawater carbonate chemistry (such as the influx of TA and/or DIC via groundwater seepage) masking metabolic signals.
DK-13 and SHAW had benthic assemblages with 31 ± 3.2 and 41 ± 4.2% live hard coral cover, respectively, with larger differences represented by the proportion of coral rubble and sand. We found higher percentages of live coral and lower percentages of dead coral than was observed in 2009 (Figure 2; Silverman et al., 2012). Coral was dominated by Acropora spp., Montipora spp., Isopora spp., Pocillopora damicornis, and Porites lobata at both sites, similar to community composition found by Silverman et al. (2012), although in general, Montipora spp. and Isopora spp. were more prevalent in the present study than in 2009. If ecosystem cover and speciation is similar, then differences in metabolism could be related to individual coral biology. Intraspecific genetic and intraspecific endosymbiont variability may influence the calcification rates of coral individuals (Parkinson et al., 2015; Rocker et al., 2015; Hughes et al., 2019). Site-specific differences in coral individuals may converge to produce a different metabolic pulse. However, this effect and its magnitude is yet to be experimentally verified, and is recommended for future study.
The 3D structural complexity of each site and how that relates to hydrodynamics and organismal biomass will influence ecosystem productivity (Perry et al., 2008; Hamylton et al., 2013; Long et al., 2013). Sites which differ in rugosity will presumably present a different metabolic signature, though this hypothesis has not been experimentally tested in the field. Long et al. (2013) hypothesized that there would be an exponential increase in metabolism with increasing total surface area to planar area factor. It is possible that a differing reactive surface area is contributing to the difference between the two sites observed here. If ecosystem metabolism is solely based on coral cover surface, then the SHAW site should have the highest rates of calcification. However, our results show that SHAW has 50% lower Gnet than DK-13 even though the SHAW planar cover is 10% higher (Figure 6).
Average PAR, temperature, pCO2, and Ωar were similar among sites (Table 1). A significant (p < 0.05) correlation between NH4+ and Gnet was observed at DK-13 only, though the low sample size (n = 13), low ammonium concentrations (mean ± SE = 0.21 ± 0.06 μmol L-1), and scatter in data (r2 = 0.40) shed doubt on this result. There were no other observed trends to indicate that nutrient concentrations or benthic uptake affected calcification or organic production. As coral cover, species composition, and environmental conditions at DK-13 and SHAW were similar (see Figure 2 and Table 1), it seems most plausible that site-specific processes are occurring which alter seawater carbonate chemistry. External sources of TA and/or DIC to the site would invalidate assumptions in the slack-water approach (i.e., that TA and DIC changes are due only to local biological processes) (Lowe and Falter, 2015), leading to altered calcification and organic production estimates at the SHAW site, and incorrect relationships between Ωar and ecosystem productivity. Furthermore, the SHAW site exhibited irregular trends in pH and DO during data collection compared to DK-13 and the atypical in situ production observations were confirmed by laboratory TA and DIC observations.
Since the SHAW site is situated very close to the island, a groundwater input effect was suspected and the DAVIS site was added for comparison. The DAVIS site exhibited similar, though less prominent, trends to SHAW (Figure 3). Groundwater exchange driven by tidal pumping releases nutrients (McMahon and Santos, 2017) and carbon (Cyronak et al., 2013b) into water near coral cays. Analyses of shallow seeping groundwater near the SHAW site revealed TA and DIC concentrations 16 and 48 μmol kg-1 greater than surface seawater, respectively, likely due to dissolution of carbonate coral rubble which dominates OTI land matter. Shallow seeps had a higher salinity than surface water by 0.8, suggesting that groundwater seepage is in the form of recirculated seawater rather than fresh groundwater as also observed in a nearby coral cay (McMahon and Santos, 2017). The SHAW site was <5 m from the shoreline at low tide (Figure 1). An influx of water with elevated DIC directly adjacent to the site may explain how Pnet appeared to shift from net productive to net respiratory since 2013 (Figure 6). However, more detailed sampling of groundwater composition and influence is necessary to quantify its effect on nearshore water chemistry. Significant groundwater exchange was demonstrated for Rarotonga, Cook Islands with an associated groundwater-derived TA influx of ∼45 mmol m-2 hr-1 to the coral reef (Cyronak et al., 2013a). The fluxes observed at Rarotonga would be large enough to modify our Gnet estimates and invalidate the assumption that changes in alkalinity and DIC are driven primarily by benthic metabolism. The effects of groundwater discharge to nearshore coral reef waters are maximized at absolute low tide (Santos et al., 2010; McMahon and Santos, 2017), thereby elevating surface water DIC and TA during slack water periods, potentially masking metabolic rate estimates (Suzuki and Kawahata, 2003; Crook et al., 2013; Cyronak et al., 2014a; Richardson et al., 2017). As such, estimates of metabolism at certain nearshore sites may not accurately represent the rates of calcification and/or photosynthesis occurring on other parts of the reef.
Prior to the present study, coral calcification rates have been estimated at a third site at OTI. Albright et al. (2016, 2018) used a Eulerian approach over the reef flat and wall separating the first and third lagoons to investigate the in situ effects of reduced Ωar on Gnet, revealing daytime calcification rates of 13.9 ± 1.4 mmol m-2 hr-1 in their control group. The daytime rate of 14.7 ± 1.45 mmol m-2 hr-1 at DK-13 presented in this study is remarkably similar to estimates by Albright et al. (2018). The Albright site is also unlikely to be influenced by groundwater inputs due to its distance from shore, supporting our suggestion that the nearshore SHAW site was influenced by proximity to the island.
Temporal Changes Within the OTI Reef Flat
The decline in calcification reported by Silverman et al. (2012), Shaw et al. (2015), and Kwiatkowski et al. (2016) were not observed at DK-13 in our study (Figure 6), even though sampling was performed in the same month as previous studies with seawater temperatures within 1°C. The daily Gnet rates of 146 ± 20.24 mmol m-2 d-1 DK-13 are comparable to the original estimate of 125 ± 12.5 mmol m-2 d-1 (Kinsey, 1972) and are four times greater than the preceding estimate of 36.3 ± 9.5 mmol m-2 d-1 (Kwiatkowski et al., 2016). Organic production increased at DK-13 by 271% relative to the 2014 estimation of 41.7 ± 21.6 mmol m-2 d-1. At the SHAW site, daily Gnet rates were calculated to be 72.9 ± 15.20 mmol m-2 d-1, over double the rate presented by Shaw et al. (2015). Also contrasting previous results, the SHAW site was found to be net respiratory with Pnet rates of - 74.6 ± 48.14 mmol m-2 d-1 compared with the net autotrophic estimate of +35 mmol m-2 d-1 from the 2013 study (Figure 6). However, the comparison of results from the SHAW site should be interpreted with caution since groundwater inputs may have affected the estimates of ecosystem metabolism.
Our study calculated metabolic rates using paired samples procured at the beginning and end of the low tide isolation rather than samples collected hourly during the low tide as done by prior ecosystem metabolism studies at OTI. Intensive sampling is useful to investigate small-scale processes within a site and provides a larger dataset to determine diel rates. However, the shorter time interval corresponds to a smaller change to seawater chemistry, becoming more subject to analytical uncertainties and small-scale, site-specific environmental perturbations. In this study, calcification estimates using consecutive pairs of TA and DIC observations within a low tide and estimates using samples from the beginning and end of low tide were within 15% of each other at all three sites, with the greatest differences occurring at SHAW (13.4%) and the smallest differences occurring at DK-13 (3.5%). Therefore, we believe the difference in analytical procedures still allow for appropriate comparison to previous studies.
Alterations in TA–DIC slopes over time indicate the influences of inorganic and organic production on reef chemistry. Observations during periods of community degradation and following recovery provide different TA–DIC slopes (Courtney et al., 2017). Therefore, these TA–DIC slopes may be useful to assess the magnitude of impact an event has on the overall seawater carbonate system and ecosystem functioning (Cyronak et al., 2018). TA–DIC analyses indicate that the relative influence of calcification on the seawater carbonate chemistry was higher in 2017 at DK-13, but remained relatively stable at SHAW (Figure 5 and Table 2). The increase in live coral cover at both DK-13 and SHAW may be a likely driver of the elevated Gnet rates and TA–DIC slopes presented in this study. Concerns have been raised about the apparent lack of relationship between calcifier cover and Gnet estimates (DeCarlo et al., 2017; Page et al., 2017). Our results imply that calcification rates track coral cover at One Tree Island even though the small sample size prevents confident conclusions (Figures 6, 7).
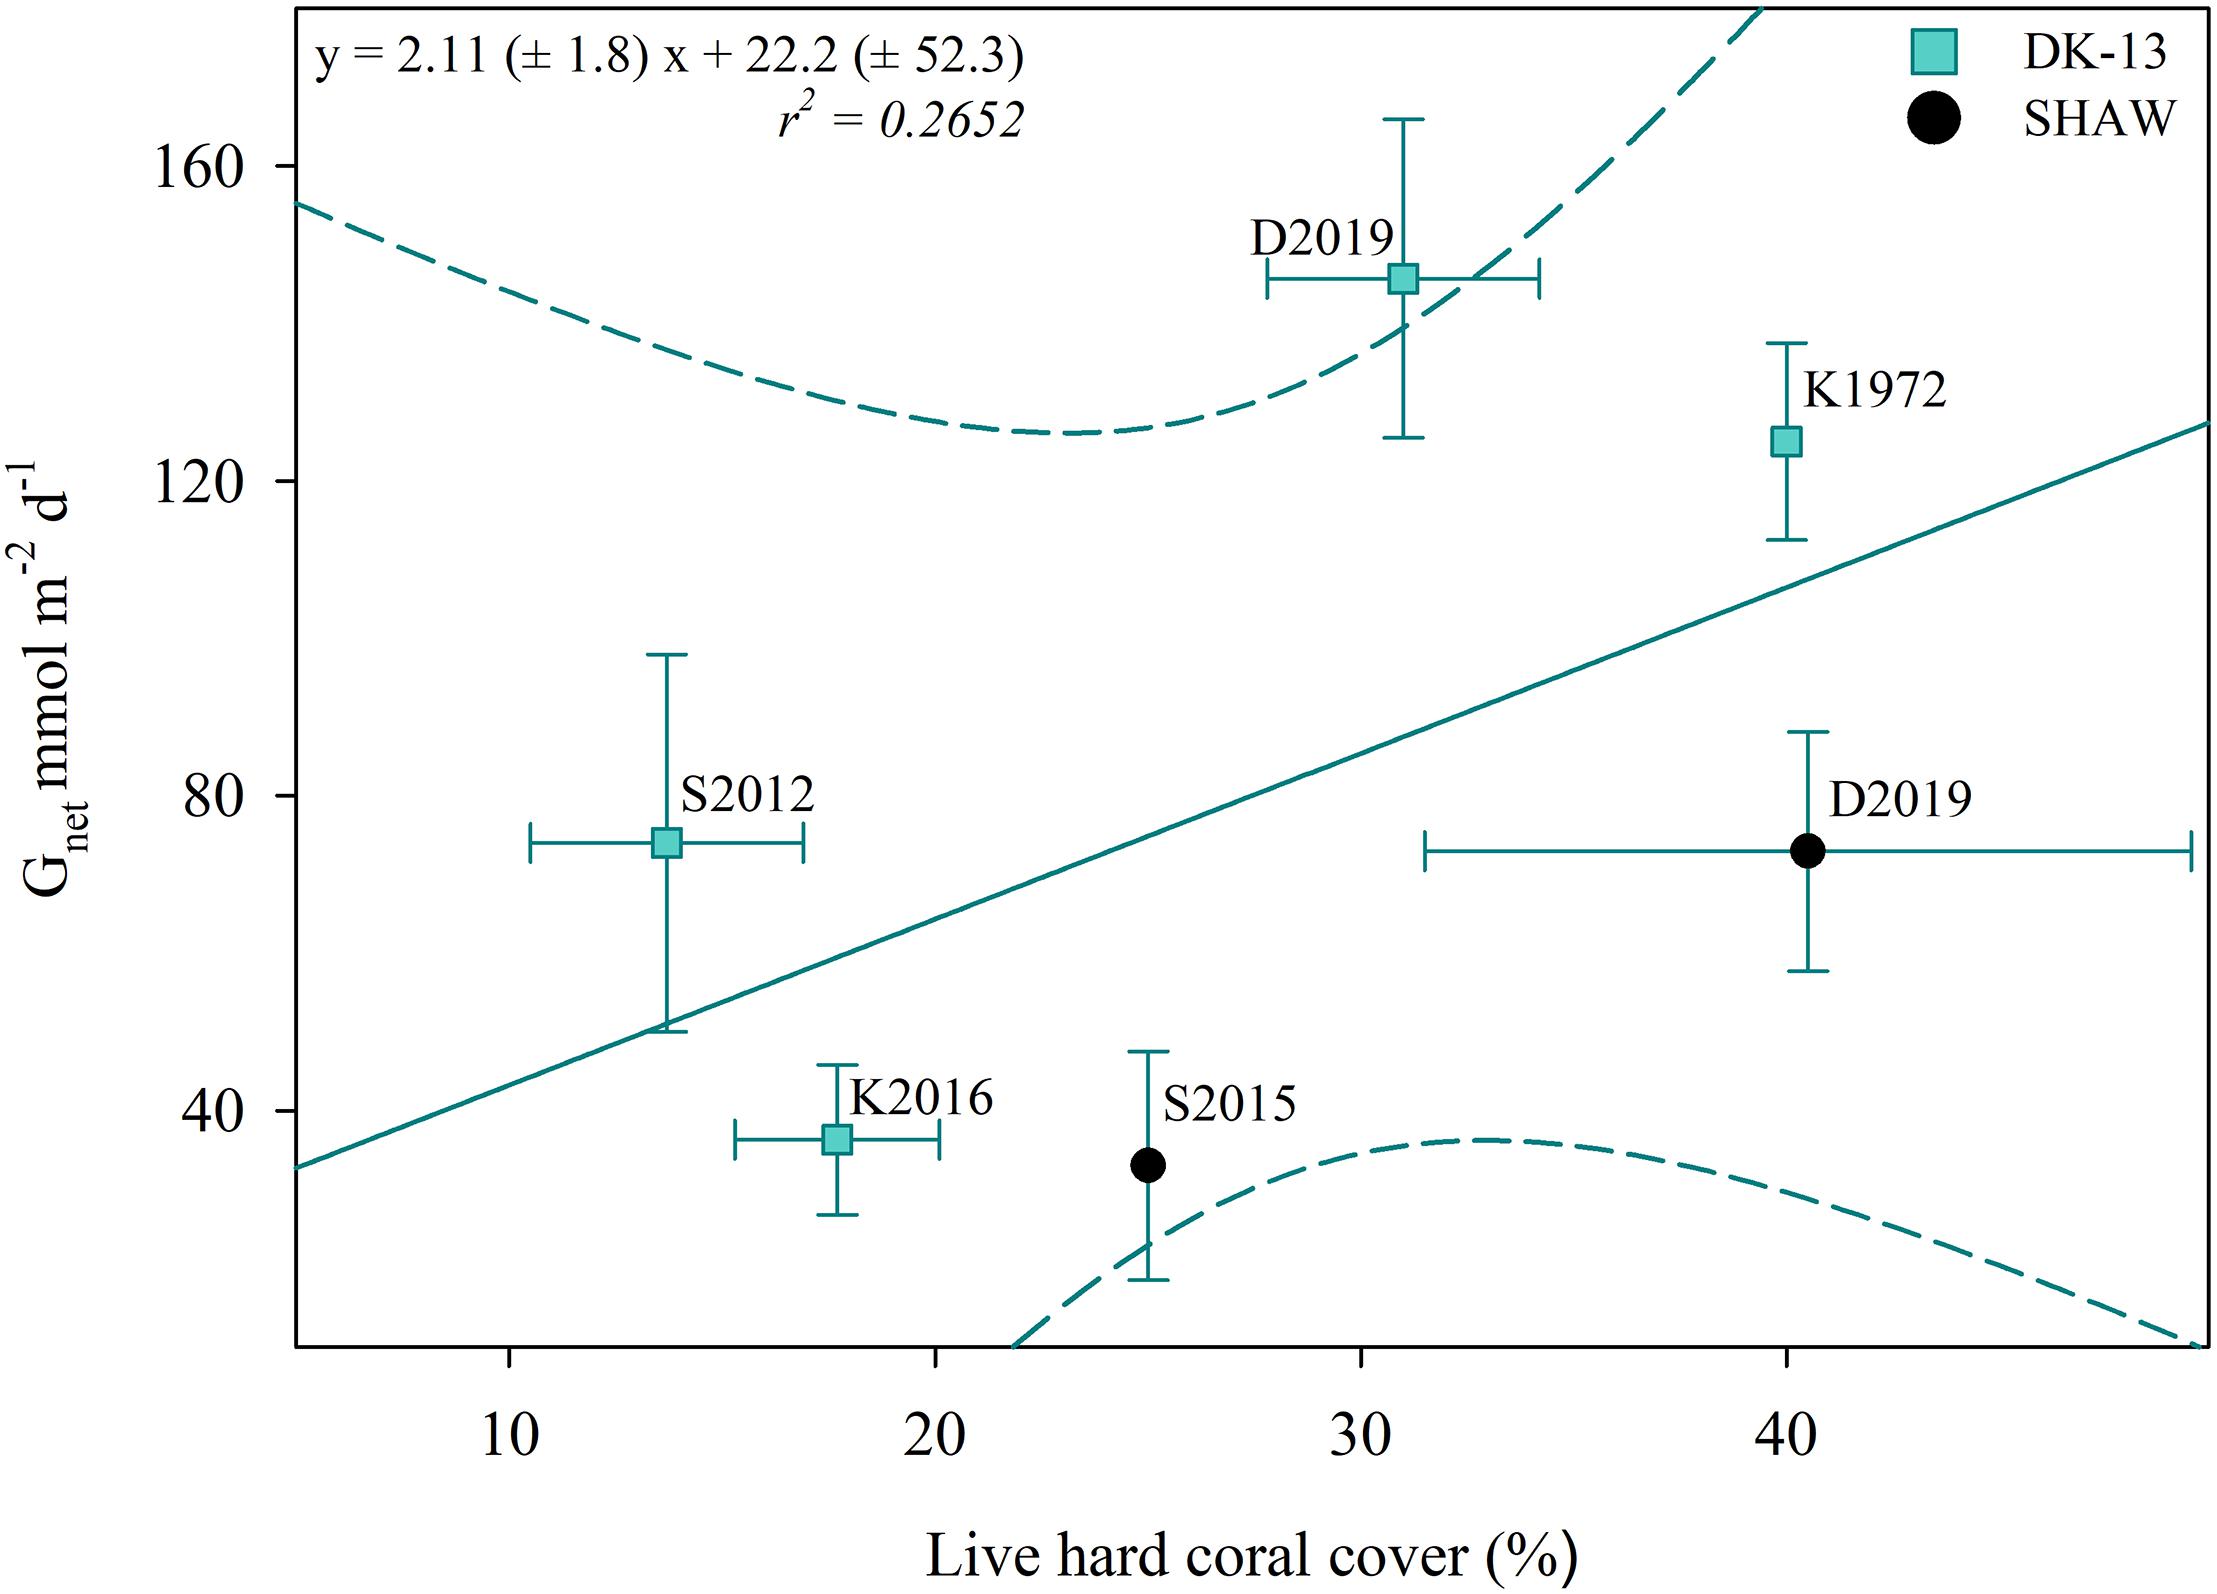
Figure 7. Estimated percent live coral cover versus Gnet at DK-13 (±SE). In this case, the regression line does not correspond with a significant correlation (p > 0.05). Dotted lines represent a 95% confidence interval. As in Figure 6, K1972 refers to Kinsey (1972); S2012 refers to Silverman et al. (2012); K2016 refers to Kwiatkowski et al. (2016); S2015 refers to Shaw et al. (2015), and D2019 refers to this study.
Coral cover determined by metabolism studies at the OTI reef flat was approximately 35–40 % in the 1970s, but decreased to 13–17% at the DK-13 site from 2009 to 2014 and 25% at the SHAW site in 2013, a likely result of the damaging effects of Cyclone Hamish in 2009 (Kinsey, 1978; Kinsey and Davies, 1979; Silverman et al., 2012; Woolsey et al., 2012; Shaw et al., 2015). The greater coral cover in 2017 compared to previous years is supported by long-term monitoring of coral cover at OTI. Coral cover fell to 10–20% in 2013 on the reef perimeter and recovered to 30–40% in 2017 on the fore reef approximately 200 and 500 m from the DK-13 and SHAW sites, respectively (AIMS, 2018a,b). Tropical cyclone Hamish developed and struck the OTI reef on its southeasterly rim with wind speeds of up to 95 km hr-1, causing a reduction in coral cover of 20% and increase in filamentous algae of 30% on the reef flat that encompasses the DK-13 and SHAW sites. Prior to the cyclone, DK-13 was reported to have little to no filamentous algae (Kinsey and Davies, 1979). By 2012, the coral community had not recovered with high algal cover persisting (Woolsey et al., 2012).
Coral reefs may take over a decade to recover from significant disturbances, especially when additional concurrent stressors are involved (Gouezo et al., 2019). For example, significant recovery of coral communities after a devastating El Niño event was demonstrated 20 years after the initial disturbance, with an increase in coral cover of 20–50% at Cocos Island reefs, Brazil (Guzman and Cortés, 2007). Our current live coral cover estimates of 30–40% at the OTI reef flat indicate that there has been coral growth in the area over the past few years (Figure 6), though filamentous algae (using dead coral as substrata) has held its cover since the cyclone.
Calcification and Reef Acidification
Metrics of ocean acidification such as the partial pressure of CO2 in seawater (pCO2) and the aragonite saturation state (Ωar) have been extensively used to explain coral calcification and predict future reef states. Laboratory and field experiments suggest that coral reefs will begin net dissolving when atmospheric pCO2 rises to 600–1000 ppm (Yates and Halley, 2006; Silverman et al., 2007; Shamberger et al., 2011). Diel average surface water pCO2 at the OTI reef flat was above 600 ppm, with net dissolution present at nighttime only (Figure 3 and Table 1). The DK-13 site had the highest pCO2, with a maximum value of 1534 ppm versus a maximum of 1000 ppm at the SHAW site (Figure 4). The CO2 concentrations observed here are higher than most other coral reefs studied (Cyronak et al., 2014b), but have been consistent over the past decade, with Silverman et al. (2012) reporting a diel average of 591 ± 288 ppm and a maximum pCO2 of 1697 ppm, which occurred during the day. There is the commonly observed, albeit noisy, negative trend between Gnet and pCO2 at the DK-13 site only (Figure 4), though this correlation may not be representative of the processes driving Gnet at One Tree Island. Several investigations suggest that the effects of CO2 and/or Ωar on calcification is not necessarily causal (Anthony et al., 2011; Comeau et al., 2018; McMahon et al., 2018).
In contrast, the relatively high CO2 concentrations and low Ωar here may be a product of calcification itself (Gattuso et al., 1996; Jokiel et al., 2014). Cyronak et al. (2014b) developed a model using metabolic data from nearby Heron Island to examine how coral ecosystems modify the pCO2 of their surrounding waters. Increasing calcification by 10% from a “baseline” rate will increase in situ CO2 by 12 μatm, which could explain the increase in diel pCO2 at DK-13 from 591 ± 288 in 2009 to 698 ± 49.6 in 2017 concurrent with an increase in calcification of 84% since 2009 (Table 1). Longhini et al. (2015) also observed high pCO2 in coral reef flat waters in Brazil even though the ecosystem is net productive and no external sources were located. The authors concluded that the carbonate chemistry of reef waters during daytime low tide is related to (1) super-saturation of CO2 at high tide during the previous night, and (2) net calcification occurring in nearby waters, which may also be the mechanisms driving high CO2 observed in this study. We highlight that our CO2 values are averaged over low tide periods only, and total diel CO2 may differ as offshore water flowing over the reef flat during high tide is likely to lower local CO2 concentrations.
Previously, Gnet at the OTI reef flat has been significantly correlated with Ωar (Shaw et al., 2015). Our results indicate only weak associations between Gnet and Ωar at one site, with no clear influence presented at either of the other sites (Figure 4). Net dissolution was predicted to occur at the OTI reef flat when Ωar fell to ∼2.5 (Shaw et al., 2015). The diel Ωar average during this study of 2.28 and 2.41 at DK-13 and SHAW, respectively, correspond with the highest observed Gnet rates ever estimated at these sites (Figure 6). Among all sites, Ωar only elevated above the reported dissolution threshold during the daytime at SHAW with an average of 2.57 (Table 1). However, we found no significant correlation between Ωar and Gnet at the SHAW site (Figure 4). Hysteresis in the relationship between the effect on calcification of co-varied light, temperature, Pnet and Ωar has been observed at nearby Heron Island (McMahon et al., 2013; Albright et al., 2015). Here, Gnet closely tracked Pnet throughout the entire diel cycle (Figure 3), and hysteresis was not observed at SHAW or DK-13 when calcification and Ωar were split into morning, afternoon, and nightly time frames. Net dissolution only occurred when PAR was negligible and when Pnet was <0, as observed elsewhere (McMahon et al., 2013; Muehllehner et al., 2016). Therefore, changes in Ωar as a result of Pnet shifting carbonate equilibria were not the driver of calcification at these sites as previously demonstrated in mesocosm experiments (Jokiel et al., 2014).
If we use the regression equation describing the relationship between calcification and Ωar at DK-13 (Figure 4), a net dissolution threshold value of 1.20–1.62 would be estimated. This is lower than previous estimates for the southern GBR and similar to predictions made for Hawaiian coral reefs (see McMahon et al., 2013; Table 1, and Shamberger et al., 2011, respectively). Since the 2009 study at OTI, diel Ωar has fallen by an average of ∼29%, with a disproportionate influence on daytime Ωar (37.6% lower versus 12.8% lower at nighttime in 2017), yet daytime calcification has increased and nighttime dissolution has decreased in relation to Silverman et al. (2014). Results from the 2014 study at DK-13 indicate that Ωar only weakly influences short-term variabilities in calcification estimates at DK-13 (Kwiatkowski et al., 2016), supporting our new results obtained in 2017.
Andersson and Gledhill (2013), McMahon et al. (2013), and Cyronak et al. (2015) caution against using linear Ωar–Gnet relationships solely to predict bottom-up ecosystem collapse via coral dissolution, as many factors contribute to influence metabolic rates. For example, water residence times and light availability may more accurately and consistently predict calcification rates in coral reefs (Demicco and Hardie, 2002; Falter et al., 2013). The variability in reported impacts of ocean acidification and warming highlights the importance of taking the magnitude of stress and interactive factors into consideration when predicting future reef calcification (Kornder et al., 2018). Multiple factors, such as increased coral cover and/or external TA sources, may have driven the increase in calcification at OTI, which offset the proposed negative effects of declining aragonite saturation states.
The increase in coral cover is the most likely cause of the elevated calcification rates during the day (Page et al., 2017; Figure 7), yet the cause of the de-coupled relationship between Gnet and Ωar and the underlying mechanism of coral growth remains unclear. Recovery of the benthic community after severe storms in the last two decades would be expected, but reduced Ωar should have inhibited this recovery. However, examples of coral reefs thriving and even recovering in low Ωar are not uncommon (Guzman and Cortés, 2007; Shamberger et al., 2011). Coral reefs in areas of Palau sustain a high coral cover regardless of waters having average pCO2 of >1400 ppm and Ωar < 3 (Camp et al., 2017). Since the methodologies, interpretation, and geochemical conditions were similar between our study and the previous studies at OTI, predictions of long term Gnet based on short term Gnet and Ωar correlations are likely invalid for this reef flat in line with the early suggestion by Andersson and Gledhill (2013). Long-term estimates of calcification and a clearer understanding about the role of local processes would be required to make predictions on when coral reefs may become net dissolving.
Comparisons to Other Reefs
Gnet at DK-13 was within the range of estimates produced from nearby islands in the southern GBR. Calcification rates at Lady Elliot Island ranged from 73 mmol m-2 d-1 in summer to 123 mmol m-2 d-1 during winter, with ∼ 40% coral cover (Shaw et al., 2012, 2016). Gnet around Heron Island is estimated to be ∼160 mmol m-2 d-1 during autumn. Both of these studies collected data using low-tide slack water sampling on reef flats (Shaw et al., 2012; McMahon et al., 2018). Pnet at the Heron Island reef flat in 2014 was estimated to be ∼585 mmol m-2 d-1, much higher than our estimates for OTI. However, the Heron Island lagoon in autumn of 2012 was net respiratory, with Pnet estimates of -6 mmol m-2 d-1 (Albright et al., 2015), indicating high variability between reef types. The differences in benthic metabolism around OTI and Heron Island are apparent in metrics often used to determine the relative control that organic and inorganic productivity have on the carbonate system. The organic to inorganic production ratio (Pnet: Gnet ) around Heron Island of 3.65–4.0 (McMahon et al., 2013; Albright et al., 2015, respectively) compared with 2.38 at DK-13 is reflected in the relatively lower TA–DIC slope (0.33 versus 0.59, respectively), indicating that these two ecosystems differ in their benthic functioning, despite being less than 20 km apart. Our results show that organic production is responsible for 70.5% of the changes in DIC at OTI (Table 2). This value falls well within the range of 32–88% reported for all coral reefs that have been studied using similar approaches, though it is on the low end for reefs in the Great Barrier Reef Marine Park and the larger Indo-Pacific region (Cyronak et al., 2018).
Calcification estimates have declined since the 1970s in the northern GBR, Hawai’i, and southern GBR (prior to this study). Gnet has dropped 46% around Lizard Island and 40% at Kāne′ohe Bay from 1977 to 2009 (Kinsey, 1980; Shamberger et al., 2011; Silverman et al., 2014), and calcification at OTI dropped 70% from 1975 to 2014 (Kinsey, 1977; Kwiatkowski et al., 2016; Figure 6). Field results support ocean acidification and bleaching predictions for ecosystem metabolism in a changing ocean (Watanabe et al., 2006; Albright et al., 2016, 2018). However, caution should be used when employing short-term datasets to predict long-term variability in benthic structure and productivity, especially if those datasets used different methodologies over different seasons or sites (Falter et al., 2001; Courtney et al., 2016). Observations made by Kinsey in the 1970s provide seasonal and annual estimates at each of the three locations mentioned above. However, the more recent studies around Lizard Island and in Kāne′ohe Bay were performed over a period of a few days in a season. Estimates at OTI in the 1970s included 36 estimates from November–January (Kinsey, 1980), the 2009 study included 59 estimates (Silverman et al., 2012), in 2014 the use of autosamplers provided 273 estimates (Kwiatkowski et al., 2016), and our study provides 69 estimates. The more recent studies use longer collection periods over consecutive days to allow for overlaps in sample times and more certainty in estimated metabolic rates. The major short-term variability and the lack of continous, long-term datasets prevent the separation of overlapping drivers over time scales of hours, days, seasons, and decades, supporting claims by Falter et al. (2001). Though we have confidence that the rates reported here and in previous studies are representative of the specific time period being sampled, short-term datasets may not provide the information necessary to predict long-term changes in reef ecosystem functioning.
Conclusion
The OTI reef has had sporadic ecosystem metabolism studies in the last 50 years. We report relatively high calcification at the OTI reef flat in 2017 compared to earlier observations. We also highlight the natural spatial variability within estimated rates of ecosystem metabolism using seawater carbonate chemistry analyses and that care should be taken when comparing study results across sites within an ecosystem. The understanding we have of coral reef calcification rates is often based on an assumption that investigations capture the main drivers of short- and long-term variability within the benthic community, and that linkages between Gnet, Ωar, and atmospheric CO2 are well established. Nonetheless, our data compared to earlier work implies that sporadic short-term datasets may not necessarily be used to represent long-term trends in coral reef calcification. Our capacity to understand the underlying mechanisms of ecosystem metabolism and predict future reef states will require us to continue building detailed and uninterrupted longer-term datasets that can separate drivers and rates occurring on time scales of hours to decades.
Author Contributions
KD, BK, and IS designed and planned the study. All authors contributed to data collection and fieldwork. KD and AM processed samples in the laboratory. KD and ES assisted with data calculations and comparisons to prior studies. KD and IS were the primary writers of the manuscript with additions and edits offered by the remainder of the authors.
Funding
Field work and analytical instrumentation were funded by the Australian Academy of Science and the Australian Research Council (FT170100327, LE170100007, and LE120100156).
Conflict of Interest Statement
The authors declare that the research was conducted in the absence of any commercial or financial relationships that could be construed as a potential conflict of interest.
Acknowledgments
We thank the staff at One Tree Island Research Station, James Archibald and Tom Glaze, for support during field investigations, and Kai Schulz for support with DIC analyses.
References
AIMS (2018a). OneTreeIS Reef. Available at: http://data.aims.gov.au/reefpage2/rpdetail.jsp?fullReefID=23055S&sampleType=VPOINT (accessed September, 2018).
AIMS (2018b). One Tree Reef Monitoring. Available at: http://apps.aims.gov.au/reef-monitoring/reef/23055S (accessed September 2018)
Albright, R., Benthuysen, J., Cantin, N., Caldeira, K., and Anthony, K. (2015). Coral reef metabolism and carbon chemistry dynamics of a coral reef flat. Geophys. Res. Lett. 42, 3980–3988. doi: 10.1002/2015gl063488
Albright, R., Caldeira, L., Hosfelt, J., Kwiatkowski, L., Maclaren, J. K., Mason, B. M., et al. (2016). Reversal of ocean acidification enhances net coral reef calcification. Nature 531, 362–365. doi: 10.1038/nature17155
Albright, R., Langdon, C., and Anthony, K. (2013). Dynamics of seawater carbonate chemistry, production, and calcification of a coral reef flat, central Great Barrier Reef. Biogeosciences 10, 6747–6758. doi: 10.5194/bg-10-6747-2013
Albright, R., Takeshita, Y., Koweek, D. A., Ninokawa, A., Wolfe, K., Rivlin, T., et al. (2018). Carbon dioxide addition to coral reef waters suppresses net community calcification. Nature 555, 516–519. doi: 10.1038/nature25968
Andersson, A. J., and Gledhill, D. (2013). Ocean acidification and coral reefs: effects on breakdown, dissolution, and net ecosystem calcification. Ann. Rev. Mar. Sci. 5, 1–28.
Anthony, K. R., Kleypas, J. A., and Gattuso, J. P. (2011). Coral reefs modify their seawater carbon chemistry–implications for impacts of ocean acidification. Glob. Change Biol. 17, 3655–3666. doi: 10.1111/j.1365-2486.2011.02510.x
Atkinson, M. J., and Falter, J. L. (2003). Coral Reefs. Biogeochemistry of marine systems. Oxford: Blackwell.
Borges, A. V., and Gypens, N. (2010). Carbonate chemistry in the coastal zone responds more strongly to eutrophication than ocean acidification. Limnol. Oceanogr. 55, 346–353. doi: 10.4319/lo.2010.55.1.0346
Call, M., Schulz, K. G., Carvalho, M. C., Santos, I. R., and Maher, D. T. (2017). Coupling infrared gas analysis and cavity ring down spectroscopy for autonomous, high-temporal-resolution measurements of DIC and δ13C–DIC. Biogeosciences 14, 1305–1313. doi: 10.5194/bg-14-1305-2017
Camp, E. F., Nitschke, M. R., Rodolfo-Metalpa, R., Houlbreque, F., Gardner, S. G., Smith, D. J., et al. (2017). Reef-building corals thrive within hot-acidified and deoxygenated waters. Sci. Rep. 7:2434. doi: 10.1038/s41598-017-02383-y
Comeau, S., Cornwall, C. E., DeCarlo, T. M., Krieger, E., and McCulloch, M. T. (2018). Similar controls on calcification under ocean acidification across unrelated coral reef taxa. Glob. Change Biol. 24, 4857–4868. doi: 10.1111/gcb.14379
Courtney, T., De Carlo, E., Page, H., Bahr, K., Barro, A., Howins, N., et al. (2017). Recovery of reef-scale calcification following a bleaching event in Kâne’ohe Bay, Hawai’i. Limnol. Oceanogr. Lett. 3, 1–9. doi: 10.1002/lol2.10056
Courtney, T. A., Andersson, A. J., Bates, N. R., Collins, A., Cyronak, T., De Putron, S. J., et al. (2016). Comparing chemistry and census-based estimates of net ecosystem calcification on a rim reef in Bermuda. Front. Mar. Sci. 3:181. doi: 10.3389/fmars.2016.00181
Crook, E. D., Cohen, A. L., Rebolledo-Vieyra, M., Hernandez, L., and Paytan, A. (2013). Reduced calcification and lack of acclimatization by coral colonies growing in areas of persistent natural acidification. Proc. Natl. Acad. Sci. 110, 11044–11049. doi: 10.1073/pnas.1301589110
Cyronak, T., Andersson, A. J., Langdon, C., Albright, R., Bates, N. R., Caldeira, K., et al. (2018). Taking the metabolic pulse of the world’s coral reefs. PLoS One 13:e0190872. doi: 10.1371/journal.pone.0190872
Cyronak, T., Santos, I. R., Erler, D. V., and Eyre, B. D. (2013a). Groundwater and porewater as major sources of alkalinity to a fringing coral reef lagoon (Muri Lagoon, Cook Islands). Biogeosciences 10, 2467–2480. doi: 10.5194/bg-10-2467-2013
Cyronak, T., Santos, I. R., McMahon, A., and Eyre, B. D. (2013b). Carbon cycling hysteresis in permeable carbonate sands over a diel cycle: implications for ocean acidification. Limnol. Oceanogr. 58, 131–143. doi: 10.4319/lo.2013.58.1.0131
Cyronak, T., Santos, I. R., Erler, D. V., Maher, D. T., and Eyre, B. D. (2014a). Drivers of pCO2 variability in two contrasting coral reef lagoons: the influence of submarine groundwater discharge. Glob. Biogeochem. Cycles 28, 398–414. doi: 10.1002/2013gb004598
Cyronak, T., Schulz, K. G., Santos, I. R., and Eyre, B. D. (2014b). Enhanced acidification of global coral reefs driven by regional biogeochemical feedbacks. Geophys. Res. Lett. 41, 5538–5546. doi: 10.1002/2014gl060849
Cyronak, T., Schulz, K. G., and Jokiel, P. L. (2015). The Omega myth: what really drives lower calcification rates in an acidifying ocean. ICES J. Mar. Sci. 73, 558–562. doi: 10.1093/icesjms/fsv075
DeCarlo, T. M., Cohen, A. L., Wong, G. T., Shiah, F. K., Lentz, S. J., Davis, K. A., et al. (2017). Community production modulates coral reef pH and the sensitivity of ecosystem calcification to ocean acidification. J. Geophys. Res. Oceans 122, 745–761. doi: 10.1002/2016jc012326
Demicco, R. V., and Hardie, L. A. (2002). The “carbonate factory” revisited: a reexamination of sediment production functions used to model deposition on carbonate platforms. J. Sediment. Res. 72, 849–857. doi: 10.1306/041502720849
Dickson, A. G., Sabine, C. L., and Christian, J. R. (2007). Guide to Best Practices For Ocean CO2 Measurements. Sidney, BC: North Pacific Marine Science Organization.
Eyre, B. D., and Ferguson, A. J. P. (2005). Benthic metabolism and nitrogen cycling in a subtropical east Australian estuary (Brunswick): temporal variability and controlling factors. Limnol. Oceanogr. 50, 86–96.
Falter, J. L., Atkinson, M. J., and Langdon, C. (2001). Production-respiration relationships at different timescales within the Biosphere 2 coral reef biome. Limnol. Oceanogr. 46, 1653–1660. doi: 10.4319/lo.2001.46.7.1653
Falter, J. L., Lowe, R. J., Zhang, Z., and McCulloch, M. (2013). Physical and biological controls on the carbonate chemistry of coral reef waters: effects of metabolism, wave forcing, sea level, and geomorphology. PLoS One 8:e53303. doi: 10.1371/journal.pone.0053303
Gattuso, J. P., Frankignoulle, M., and Smith, S. V. (1999). Measurement of community metabolism and significance in the coral reef CO2 source-sink debate. Proc. Natl. Acad. Sci. U.S.A. 96, 1317–1322.
Gattuso, J. P., Pichon, M., Delesalle, B., Canon, C., and Frankignoulle, M. (1996). Carbon fluxes in coral reefs. I. Lagrangian measurement of community metabolism and resulting air-sea CO2 disequilibrium. Mar. Ecol. Prog. Ser. 145, 109–121. doi: 10.3354/meps145109
Gouezo, M., Golbuu, Y., Fabricius, K., Olsudong, D., Mereb, G., Nestor, V., et al. (2019). Drivers of recovery and reassembly of coral reef communities. Proc. R. Soc. B 286:20182908. doi: 10.1098/rspb.2018.2908
Guzman, H. M., and Cortés, J. (2007). Reef recovery 20 years after the 1982–1983 El Niño massive mortality. Mar. Biol. 151, 401–411. doi: 10.1007/s00227-006-0495-x
Hamylton, S. M., Pescud, A., Leon, J. X., and Callaghan, D. P. (2013). A geospatial assessment of the relationship between reef flat community calcium carbonate production and wave energy. Coral Reefs 32, 1025–1039. doi: 10.1007/s00338-013-1074-5
Hatcher, B. G. (1990). Coral reef primary productivity. A hierarchy of pattern and process. Trends Ecol. Evol. 5, 149–155. doi: 10.1016/0169-5347(90)90221-X
Ho, D. T., Law, C. S., Smith, M. J., Schlosser, P., Harvey, M., and Hill, P. (2006). Measurements of air-sea gas exchange at high wind speeds in the Southern Ocean: implications for global parameterizations. Geophys. Res. Lett. 33:L16611.
Hughes, T., Kerry, J., and Simpson, T. (2018). Large-scale bleaching of corals on the Great Barrier Reef. Ecology 99, 501–501. doi: 10.1002/ecy.2092
Hughes, T. P., Kerry, J. T., Connolly, S. R., Baird, A. H., Eakin, C. M., Heron, S. F., et al. (2019). Ecological memory modifies the cumulative impact of recurrent climate extremes. Nat. Clim. Change 9, 40–43. doi: 10.1038/s41558-018-0351-2
Jokiel, P. L., Jury, C. P., and Rodgers, K. S. (2014). Coral-algae metabolism and diurnal changes in the CO2-carbonate system of bulk sea water. PeerJ 2:e378. doi: 10.7717/peerj.378
Kayanne, H., Hata, H., Kudo, S., Yamano, H., Watanabe, A., Ikeda, Y., et al. (2005). Seasonal and bleaching-induced changes in coral reef metabolism and CO2 flux. Glob. Biogeochem. Cycles. 19:GB3015.
Kinsey, D. (1972). “Preliminary observations on community metabolism and primary productivity of the pseudo-atoll reef at One Tree Island, Great Barrier Reef,” in Proceedings of the First International Symposium on Corals and Coral Reefs, eds C. Munkundan and C. S. Gopinadha Pillai (Ernakulum: Marine Biological Association of India).
Kinsey, D. (1978). Productivity and calcification estimates using slack-waterperiod and field enclosures, in Coral Reef Research Methods, UNESCO Monographs on Oceanographic Methodology, eds D. R. Stoddart and R. E. Johannes (Paris: UNESCO), 439–468.
Kinsey, D. W. (1980). Carbon Turnover and Accumulation by Coral Reefs. Ph.D. thesis, University of Hawaii, Honolulu, HI.
Kinsey, D., and Davies, P. (1979). Carbon Turnover, Calcification and Growth in Coral Reefs, Studies in Environmental Science. Amsterdam: Elsevier, 131–162.
Kinsey, D. W. (1977)). “Seasonal and zonation in coral reef productivity and calcification,” in Proceedings of the Third International Coral Reef Symposium, (Miami, FL), 383–388.
Kleypas, J. A., Anthony, K. R., and Gattuso, J. P. (2011). Coral reefs modify their seawater carbon chemistry–case study from a barrier reef (Moorea. French Polynesia). Glob. Change Biol. 17, 3667–3678. doi: 10.1111/j.1365-2486.2011.02530.x
Kornder, N. A., Riegl, B. M., and Figueiredo, J. (2018). Thresholds and drivers of coral calcification responses to climate change. Glob. Change Biol. 24, 5084–5095. doi: 10.1111/gcb.14431
Kwiatkowski, L., Albright, R., Hosfelt, J., Nebuchina, Y., Ninokawa, A., Rivlin, T., et al. (2016). Interannual stability of organic to inorganic carbon production on a coral atoll. Geophys. Res. Lett. 43, 3880–3888. doi: 10.1002/2016gl068723
Langdon, C., Gattuso, J. P., and Andersson, A. (2010). “Measurements of calcification and dissolution of benthic organisms and 13 communities,” in Guide to best practices for ocean acidification research and data reporting, eds U. Riebesell, V. J. Fabry, L. Hansson and J.-P. Gattuso (Luxembourg: Publications Office of the European Union).
Long, M. H., Berg, P., de Beer, D., and Zieman, J. C. (2013). In situ coral reef oxygen metabolism: an eddy correlation study. PLoS One 8:e58581. doi: 10.1371/journal.pone.0058581
Longhini, C. M., Souza, M. F., and Silva, A. M. (2015). Net ecosystem production, calcification and CO2 fluxes on a reef flat in Northeastern Brazil. Estuar. Coast. Shelf Sci. 166, 13–23. doi: 10.1016/j.ecss.2014.12.034
Lowe, R. J., and Falter, J. L. (2015). Oceanic forcing of coral reefs. Ann. Rev. Mar. Sci. 7, 43–66. doi: 10.1146/annurev-marine-010814-015834
Manzello, D., Enochs, I., Musielewicz, S., Carlton, R., and Gledhill, D. (2013). Tropical cyclones cause CaCO3 undersaturation of coral reef seawater in a high-CO2 world. J. Geophys. Res. Oceans. 118, 5312–5321. doi: 10.1002/jgrc.20378
McCulloch, M., Falter, J., Trotter, J., and Montagna, P. (2012). Coral resilience to ocean acidification and global warming through pH up-regulation. Nat. Clim. Change. 2, 623–627. doi: 10.1038/srep42405
McDougall, T. J., and Barker, P. M. (2011). Getting started with TEOS-10 and the Gibbs Seawater (GSW) oceanographic toolbox. London: SCOR/IAPSO WG 127, 1–28.
McMahon, A., and Santos, I. R. (2017). Nitrogen enrichment and speciation in a coral reef lagoon driven by groundwater inputs of bird guano. J. Geophys. Res. Oceans. 122, 7218–7236. doi: 10.1002/2017jc012929
McMahon, A., Santos, I. R., Cyronak, T., and Eyre, B. D. (2013). Hysteresis between coral reef calcification and the seawater aragonite saturation state. Geophys. Res. Lett. 40, 4675–4679. doi: 10.7717/peerj.378
McMahon, A., Santos, I. R., Schulz, K. G., Cyronak, T., and Maher, D. T. (2018). Determining coral reef calcification and primary production using automated alkalinity, pH and pCO2 measurements at high temporal resolution. Estuar. Coast. Shelf Sci. 209, 80–88. doi: 10.1016/j.ecss.2018.04.041
McMahon, A., Santos, I. R., Schulz, K. G., Scott, A., Silverman, J., Davis, K. L., et al. (2019). Coral reef calcification and production after the 2016 bleaching event at Lizard Island, Great Barrier Reef. J. Geophys. Res. 124. doi: 10.1029/2018JC014698
Mongin, M., Baird, M. E., Tilbrook, B., Matear, R. J., Lenton, A., Herzfeld, M., et al. (2016). The exposure of the Great Barrier Reef to ocean acidification. Nat. Commun. 7:10732. doi: 10.1038/ncomms10732
Muehllehner, N., Langdon, C., Venti, A., and Kadko, D. (2016). Dynamics of carbonate chemistry, production, and calcification of the Florida reef tract (2009–2010): evidence for seasonal dissolution. Glob. Biogeochem. Cycles 30, 661–688. doi: 10.1002/2015gb005327
Page, H. N., Courtney, T. A., Collins, A., De Carlo, E. H., and Andersson, A. J. (2017). Net community metabolism and seawater carbonate chemistry scale non-intuitively with coral cover. Front. Mar. Sci. 4:161. doi: 10.3389/fmars.2017.00161
Parkinson, J. E., Banaszak, A. T., Altman, N. S., LaJeunesse, T. C., and Baums, I. B. (2015). Intraspecific diversity among partners drives functional variation in coral symbioses. Sci. Rep. 5:15667. doi: 10.1038/srep15667
Perry, C. T., Spencer, T., and Kench, P. S. (2008). Carbonate budgets and reef production states: a geomorphic perspective on the ecological phase-shift concept. Coral Reefs 27, 853–866. doi: 10.1007/s00338-008-0418-z
Raymond, P. A., and Cole, J. J. (2001). Gas exchange in rivers and estuaries: choosing a gas transfer velocity. Estuaries 24, 312–317.
Richardson, L. E., Graham, N. A., Pratchett, M. S., and Hoey, A. S. (2017). Structural complexity mediates functional structure of reef fish assemblages among coral habitats. Environ. Biol. Fish. 100, 193–207. doi: 10.1007/s10641-016-0571-0
Rocker, M. M., Noonan, S., Humphrey, C., Moya, A., Willis, B. L., and Bay, L. K. (2015). Expression of calcification and metabolism-related genes in response to elevated pCO2 and temperature in the reef-building coral Acropora millepora. Mar. Genom. 24, 313–318. doi: 10.1016/j.margen.2015.08.001
Santos, I. R., Erler, D., Tait, D., and Eyre, B. D. (2010). Breathing of a coral cay: tracing tidally driven seawater recirculation in permeable coral reef sediments. J. Geophys. Res 115:C12010. doi: 10.1029/2010JC006510
Shamberger, K. E., Cohen, A. L., Golbuu, Y., McCorkle, D. C., Lentz, S. J., and Barkley, H. C. (2014). Diverse coral communities in naturally acidified waters of a Western Pacific reef. Geophys. Res. Lett. 41, 499–504. doi: 10.1002/2013gl058489
Shamberger, K. E., Lentz, S. J., and Cohen, A. L. (2018). Low and variable ecosystem calcification in a coral reef lagoon under natural acidification. Limnol. Oceanogr. 63, 714–730. doi: 10.1002/lno.10662
Shamberger, K. E. F., Feely, R. A., Sabine, C. L., Atkinson, M. J., DeCarlo, E. H., Mackenzie, F. T., et al. (2011). Calcification and organic production on a Hawaiian coral reef. Mar. Chem. 127, 64–75. doi: 10.1016/j.marchem.2011.08.003
Shaw, E. C., Hamylton, S. M., and Phinn, S. R. (2016). Incorporating benthic community changes into hydrochemical-based projections of coral reef calcium carbonate production under ocean acidification. Coral Reefs 35, 739–750. doi: 10.1007/s00338-016-1407-2
Shaw, E. C., McNeil, B. I., and Tilbrook, B. (2012). Impacts of ocean acidification in naturally variable coral reef flat ecosystems. J. Geophys. Res. 117:C03038.
Shaw, E. C., Mcneil, B. I., Tilbrook, B., Matear, R., and Bates, M. L. (2013). Anthropogenic changes to seawater buffer capacity combined with natural reef metabolism induce extreme future coral reef CO2 conditions. Glob. Change Biol. 19, 1632–1641. doi: 10.1111/gcb.12154
Shaw, E. C., Phinn, S. R., Tilbrook, B., and Steven, A. (2014). Comparability of slack water and Lagrangian flow respirometry methods for community metabolic measurements. PLoS One 9:e112161. doi: 10.1371/journal.pone.0112161
Shaw, E. C., Phinn, S. R., Tilbrook, B., and Steven, A. (2015). Natural in situ relationships suggest coral reef calcium carbonate production will decline with ocean acidification. Limnol. Oceanogr. 60, 777–788. doi: 10.1002/lno.10048
Silverman, J., Kline, D. I., Johnson, L., Rivlin, T., Schneider, K., Erez, J., et al. (2012). Carbon turnover rates in the One Tree Island reef: a 40-year perspective. J. Geophys. Res. 117:G03023.
Silverman, J., Lazar, B., and Erez, J. (2007). Effect of aragonite saturation, temperature, and nutrients on the community calcification rate of a coral reef. J. Geophys. Res. 112:C05004.
Silverman, J., Schneider, K., Kline, D. I., Rivlin, T., Rivlin, A., Hamylton, S., et al. (2014). Community calcification in Lizard Island, Great Barrier Reef: a 40-year perspective. Geochim. Cosmochim. Acta. 144, 72–81. doi: 10.1016/j.gca.2014.09.011
Suzuki, A., and Kawahata, H. (2003). Carbon budget of coral reef systems: an overview of observations in fringing reefs, barrier reefs and atolls in the Indo-Pacific regions. Tellus B 55, 428–444. doi: 10.1034/j.1600-0889.2003.01442.x
Venti, A., Kadko, D., Andersson, A. J., Langdon, C., and Bates, N. R. (2014). A multi-tracer model approach to estimate reef water residence times. Limnol. Oceanogr Methods 10, 1078–1095. doi: 10.4319/lom.2012.10.1078
Wanninkhof, R. (1992). Relationship between wind speed and gas exchange over the ocean. J. Geophys. Res. Oceans. 97, 7373–7382.
Watanabe, A., Kayanne, H., Hata, H., Kudo, S., Nozaki, K., Kato, K., et al. (2006). Analysis of the seawater CO2 system in the barrier reef–lagoon system of Palau using total alkalinity-dissolved inorganic carbon diagrams. Limnol. Oceanogr. 51, 1614–1628. doi: 10.4319/lo.2006.51.4.1614
Woolsey, E., Bainbridge, S. J., Kingsford, M. J., and Byrne, M. (2012). Impacts of cyclone hamish at one tree reef: integrating environmental and benthic habitat data. Mar. Biol. 159, 793–803. doi: 10.1007/s00227-011-1855-8
Keywords: aragonite, calcification, coral reef, ecosystem metabolism, organic productivity
Citation: Davis KL, McMahon A, Kelaher B, Shaw E and Santos IR (2019) Fifty Years of Sporadic Coral Reef Calcification Estimates at One Tree Island, Great Barrier Reef: Is it Enough to Imply Long Term Trends? Front. Mar. Sci. 6:282. doi: 10.3389/fmars.2019.00282
Received: 07 February 2019; Accepted: 13 May 2019;
Published: 04 June 2019.
Edited by:
Xinping Hu, Texas A&M University Corpus Christi, United StatesReviewed by:
Chris Langdon, University of Miami, United StatesDavid Koweek, Carnegie Institution for Science (CIS), United States
Derek Manzello, National Oceanic and Atmospheric Administration (NOAA), United States
Copyright © 2019 Davis, McMahon, Kelaher, Shaw and Santos. This is an open-access article distributed under the terms of the Creative Commons Attribution License (CC BY). The use, distribution or reproduction in other forums is permitted, provided the original author(s) and the copyright owner(s) are credited and that the original publication in this journal is cited, in accordance with accepted academic practice. No use, distribution or reproduction is permitted which does not comply with these terms.
*Correspondence: Kay L. Davis, ay5kYXZpcy4zMEBzdHVkZW50LnNjdS5lZHUuYXU=