 Victor E. L. da Silva1*
 Luana P. S. Silva-Firmiano1
 Fabrício B. Teresa2
 Vandick S. Batista1*
 Richard J. Ladle1,3
 Nidia N. Fabré1
- 1Institute of Biological and Health Sciences, Federal University of Alagoas, Maceió, Brazil
- 2Campus of Exact and Technological Sciences, State University of Goiás, Anápolis, Brazil
- 3School of Geography and the Environment, University of Oxford, Oxford, United Kingdom
One of the core challenges of functional diversity is the identification of traits that can accurately be linked to ecological processes. Trait-based metrics have been used to detect and quantify the effects of deterministic processes, such as niche filtering and co-occurrence mechanisms. However, most functional studies have simplified the measured attributes, especially for fish species. Here, we aimed to test the influence of trait resolution and surrogates on the accuracy in expressing resource partitioning among tropical fish species. We assessed pairwise species similarity between distinct ways of express resource use by species (through increasing trait resolution), and tested whether differences in resolutions are strong enough to provide different patterns in the functional structure of tropical fish assemblages. Our study shows that distinct ways of expressing resource partitioning among species may provide different ecological interpretations of this process as different resolutions or surrogates can change pairwise species, similarity.
Introduction
The last decade has seen an explosion of interest in the use of functional traits in community ecology research, spurred in part by McGill et al.’s (2006) influential synthesis and repositioning of the field (Didham et al., 2016). Much of the promise of functional approaches rests on the assumption that patterns of dissimilarities among co-occurring species can provide direct insights into ecological processes (Vandewalle et al., 2010; de Bello, 2012). For instance, trait-based metrics have been used to detect and quantify the effects of deterministic processes, such as niche filtering and co-occurrence mechanisms (Siefert et al., 2013). Yet, one of the core challenges of applied functional research is the identification and discrimination of traits that can be accurately linked to direct ecological processes (McGill et al., 2006; Didham et al., 2016). More precisely, as observed by Didham et al. (2016), most functional studies have simply quantified a small number of easily measured attributes from a few “representative” sample of species within a defined taxonomic or functional group. This is potentially problematic because decisions about the chosen “resolution” (here defined as the degree of detail applied in the measurement of a particular function or process) can have a significant influence on the robustness of functional diversity estimation (Lavorel et al., 2008) and consequently in subsequent inferences about ecological processes (Poff et al., 2006).
Resource partitioning among fish species, for example, is one of the ecological process that is often inferred and expressed through different trait resolutions and/or surrogates (Albouy et al., 2011). Ideally, direct measurement of this mechanism, such as through diet analysis, would not only capture the functional structure of communities but also give a full picture of how species use available resources in ecosystems, allowing inferences about functions performed by species and their influence on ecosystem processes (Violle et al., 2012). However, such analysis typically requires considerable research effort and, thus, is rarely performed, leading researchers to often use in studies a variety of alternative methods. For example, at a smaller measurement resolution, resource partitioning within communities may be assessed by the classification of species into guilds according to the type of prey consumed, giving partial information on the trophic niche occupied by species in assemblages’ organization (Albouy et al., 2011). Although widely used in studies, there are a few issues with this approach because species in the same guild will inevitably differ in some subtle aspects of resource use (Petchey and Gaston, 2002a; da Silva and Fabré, 2019), resulting in a vague understanding of the partitioning process.
In the same manner, we can also highlight other simpler and less research-intensive surrogates widely used to express resource use by species that still need further investigation on how effective they are for functional analysis (Didham et al., 2016; Soler et al., 2016; Ramírez-Ortiz et al., 2017). For instance, the use of morphological patterns and phylogenetic relationships in functional studies have always been surrounded by important issues in relation to at what extension functions and ecological processes are being assessed by these different surrogates (Hugueny and Pouilly, 1999; Cadotte et al., 2013; Gibb et al., 2015; Didham et al., 2016; Tucker et al., 2017). Ideally, traits such as mouth size, eye position and body shape are expected to indicate the types of consumed preys and/or feeding strategies adopted by species (Albouy et al., 2011; Dolbeth et al., 2016), providing information on ecological specialization of species to the use of core resources (Adite and Winemiller, 1997; Ramírez-Ortiz et al., 2017). Likewise, the evolutionary history of species should also reflect such mechanisms as the topology of a phylogenetic tree represents the differences in phenotypic, genetic and behavioral features of species (Vitt and Pianka, 2005; Grime, 2006; Diniz-Filho et al., 2010; Mouquet et al., 2012). Yet, it is still unclear how strong is the correlation between such surrogates and the direct measure of resource use in ecosystems.
Precise identification of which trait resolution and/or surrogate can be used to assess functions performed by species in ecosystems is a key factor in the advance of functional ecology studies (Villéger et al., 2017). Therefore, the present study aimed to test the influence of trait resolution on the accuracy in expressing resource partitioning among tropical fish species. Specifically, we assessed pairwise species similarity between different ways of express resource use, and tested whether differences in resolutions are strong enough to provide contrasting patterns in the functional structure of tropical fish assemblages.
Materials and Methods
Sampling Design and Study Area
Fishes were sampled from a coastal area in the tropical Atlantic Southwest ecoregion (09°47′80″S – 35°49′56″W and 10°21′26″S, 36° 05′33″W) that is comprised of three geomorphologically distinct habitats: (i) reef habitats (hereafter named reef), characterized by sandstone reefs making up 23% of the total area; (ii) an estuary lagoon habitat (hereafter named lagoon), influenced by one of the largest lagoons of Brazil, the Mundaú-Manguaba estuarine complex (CELMM) which generates a plume of sediment that influences the surrounding coastal area; and (iii) an estuary-river habitat (hereafter named estuary), characterized by the drainage of the São Francisco River, the second largest river in Brazil (Knoppers et al., 2006), whose sediment plumes extends for 10–20 km from the river mouth.
Six sampling sites for fish collections were used in each habitat (reef, lagoon, and estuary) generating 36 sampling points per sampling trip. Samplings were carried out from January to July 2013 using ten nylon gillnets of 100 m long, 2.9 m height with different meshes which were linked by nylon cables in a random arrangement. The linked nets were set at each site, close to the bottom, for 4 h to catch demersal species (Federal Scientific Fish Sampling License 1837810). The catch was immediately placed in ice slurry to sedate the fish and to aid preservation.
Diet Analysis and Traits Characterization
In the laboratory, fish were identified to species level following Figueiredo and Menezes (1978), Lessa and Nóbrega (2000), and (Carpenter, 2002). Morphometric measurements were taken from each fish individual to obtain morphological traits, and stomachs were removed and fixed in formalin (4%) for gravimetric gut content analysis. Each food item was identified to the lowest possible taxonomic level depending on the state of preservation and then weighed to the nearest gram.
We then characterized the functional traits of species using seven different forms of measurement, all related to resource partitioning among species: five increasing levels of diet resolutions (R1 to Rmax) and two surrogates of resource use (S1 and S2). A concise summary of each form of measurement is given below:
Resolution 1 (R1)
Species were grouped in trophic guilds according to the main diet of adults, using information of published papers and online databases (e.g., FishBase1).
Resolution 2 (R2)
As in R1, species were also grouped in trophic guilds. However, guilds were defined by qualitative analysis of food items found in the gut content of species. A presence/absence matrix of preys found in diet composition of species was built and a hierarchical agglomerative clustering by Ward’s Method with Euclidean distance was performed to visualize trophic similarity between species. We identified groups that had diet similarity among species greater than 50%. To test whether or not the differences in prey similarity among identified guilds were significant, we used an analysis of similarities (ANOSIM) at a significance level of p = 0.05. The similarity percentage (SIMPER) was later used to typify and discriminate which prey species contributed the most for dissimilarity between trophic guilds. Multivariate analyses were performed in the software PAST v.3 (Hammer et al., 2001).
Resolution 3 (R3)
We carried out a qualitative analysis (presence/absence) of food items found in the gut content without grouping species in guilds.
Resolution 4 (R4)
Quantitative data from categorized feeding index (FIiC) using an ordinal scale. We first obtained the feeding index values (FIi) for each species through the frequency of occurrence (Fi%) and total weight (Wi%) of found preys. Fi% indicates the proportion of stomachs containing a specific prey i in relation to all stomachs examined for the species (Hynes, 1950). The weighted index (Wi%) estimates the proportion of total weight of a specific prey taxa i in relation to the weight of all preys consumed by the species (Hynes, 1950). Both indexes were combined to obtain FIi for each species following Kawakami and Vazzoler (1980) adapted by Oliveira et al. (2004):
The Feeding index was then categorized (FIiC) using an ordinal scale according to the degree of food item importance (0 = prey absence; 1 = prey with less than 20% importance; and 2 = prey with 20% or more of importance). This categorization process causes details in diet composition to be lost as the real importance of food items are not evaluated.
Maximum Resolution (Rmax)
At the highest resolution, we defined feeding habit of species using quantitative raw data from FIi values. Specifically, we took in consideration the actual importance of each food item found in the gut content analysis for each species, which provided us a more detailed and comprehensive information on how species use available resources.
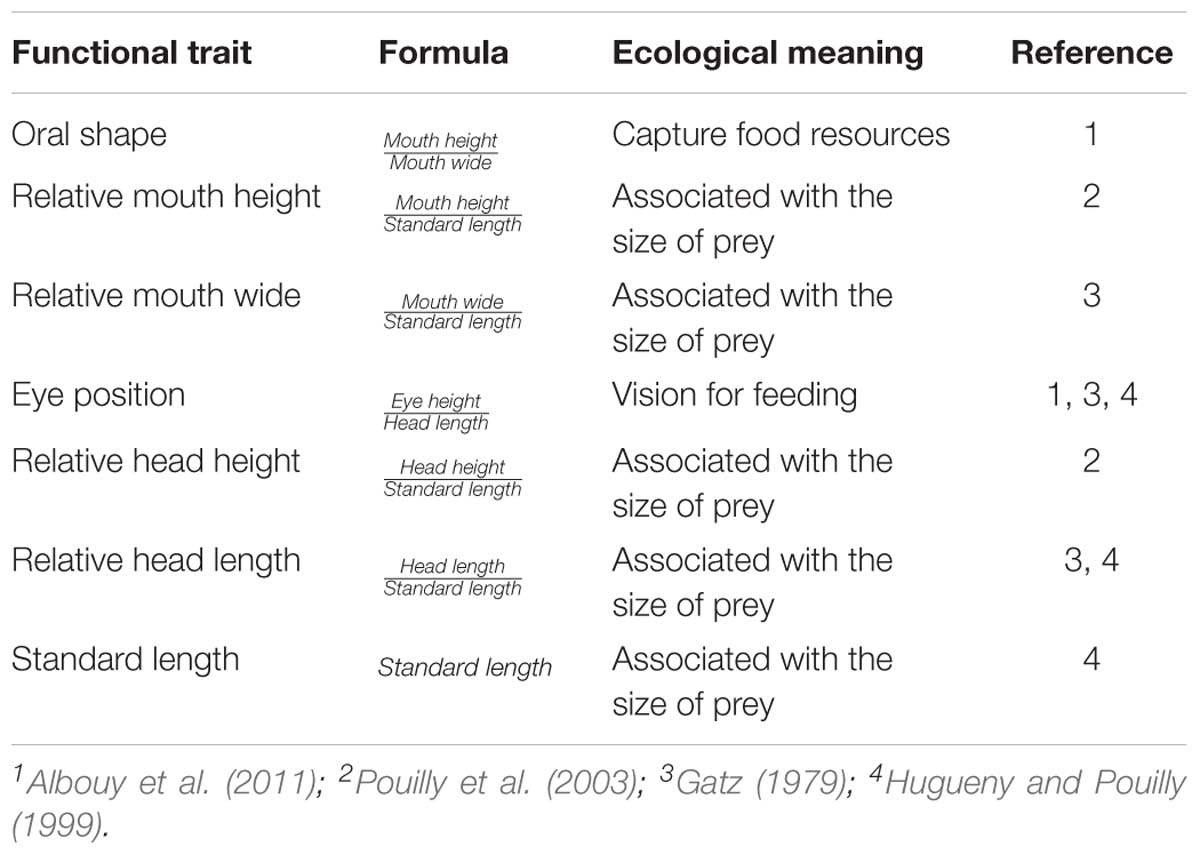
Table 1. Ecomorphological traits used as surrogates for fish diet.
Surrogate 1 (S1)
Seven morpho-functional traits were chosen based on their well-documented relationships with feeding habit and strategies (see Table 1 for description of traits and ecological meaning). Size-related variables were taken as ratios of standard length to reduce the effects of allometry.
Surrogate 2 (S2)
A phylogenetic analysis of species was carried out based on the current taxonomy of fishes (Betancur-r et al., 2013). The phylogenetic topology was built using the software Mesquite2. Finally, branch length was used to estimate the dated phylogeny by the software Phylocom3 using the function bladj.
A trait-species matrix was created for each diet resolution (R1, R2, R3, R4, and Rmax) and the morphological surrogate (S1) with species in rows and functional traits in columns. The number of columns (traits) varied greatly between matrices with its number increasing with higher resolutions (for the exact number of traits in each resolution see Figure 1A). The trait-species matrices and the phylogenetic topology were treated in two different ways which will be discussed in next sections.
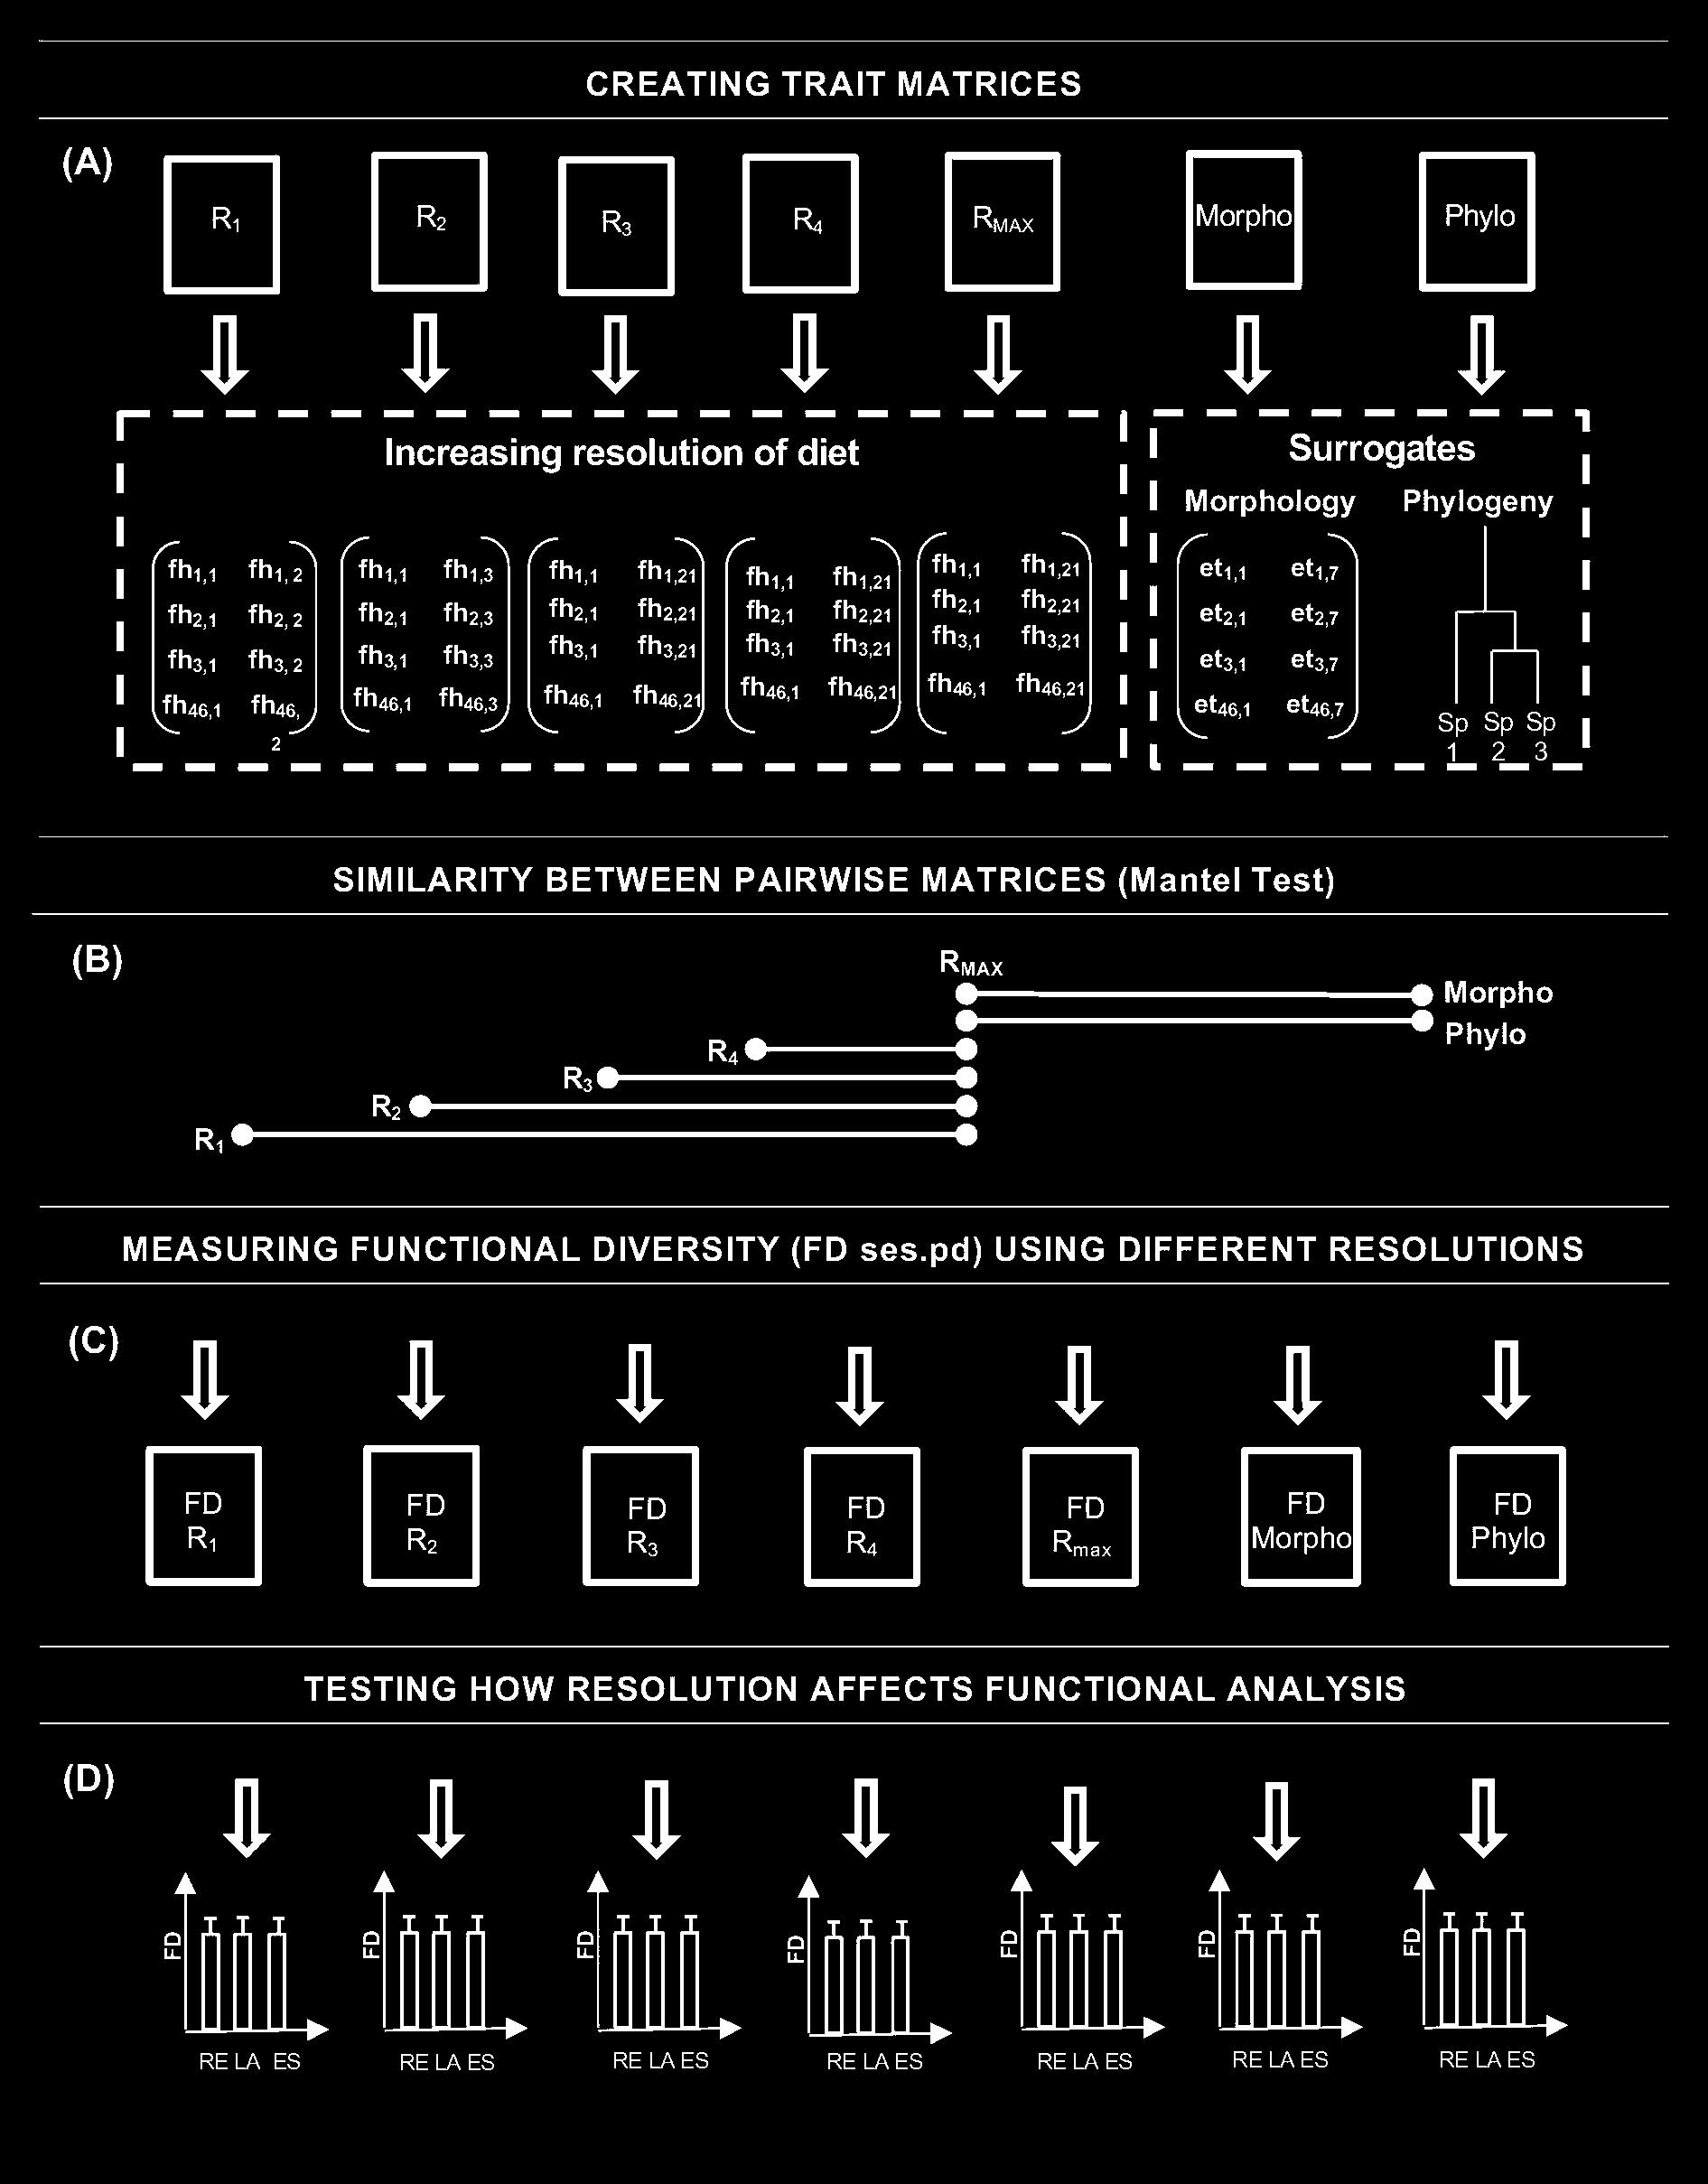
Figure 1. Methodological framework. (A) Traits related to resource partitioning were expressed through five levels resolutions of feeding data and two surrogates of feeding strategy (ecomorphological traits and phylogeny), which were used to create six trait-species matrices and one phylogenetic topology; (B) a Mantel Test was carried out to test pairwise species similarity between trait matrices and the maximum level of resolution of feeding data (Rmax); (C) functional diversity index (FD) was calculated using resolution and surrogate individually; (D) we compared observed functional patterns found for each resolution and surrogate between three habitats found in the study area to test whether differences in resolutions are strong enough to provide different patterns in the functional structure of tropical fish assemblages. (R1 – Qualitative data grouped in guild from FishBase source; R2 – Qualitative data grouped in guild from similar food item; R3 – Qualitative food items data ungrouped in guild; R4 – Quantitative data from Feeding Index Categorized (FIiC); Rmax – Quantitative data from FIi not categorized; fh – feeding habitat; et – morphological trait; Morpho – ecomorphological trait; Sp – Species; Morpho and Phylo – phylogenetic topology of the species. The connotation fh46,2 matches 46 rows and 2 columns so on; FD R1 – Value of FD from matrix of qualitative data grouped in guild from FishBase source; FD R2 – Value of FD from matrix qualitative data grouped in guild from similar food item; FD R3 – Value of FD from matrix qualitative food items data ungrouped in guild; FD R4 – Value of FD from matrix quantitative data from Feeding index Categorized (FIiC); FD Rmax – Value of FD from matrix quantitative data from Feeding index (FIi) not categorized; fh: feeding habitat; et: morphological trait; (FD Morpho) Value of FD from matrix morphological trait, and FD Phylo – Value of FD from topology of phylogeny of the species. FD – Value of functional diversity; RE – reef; LA – lagoon and ES – estuary.)
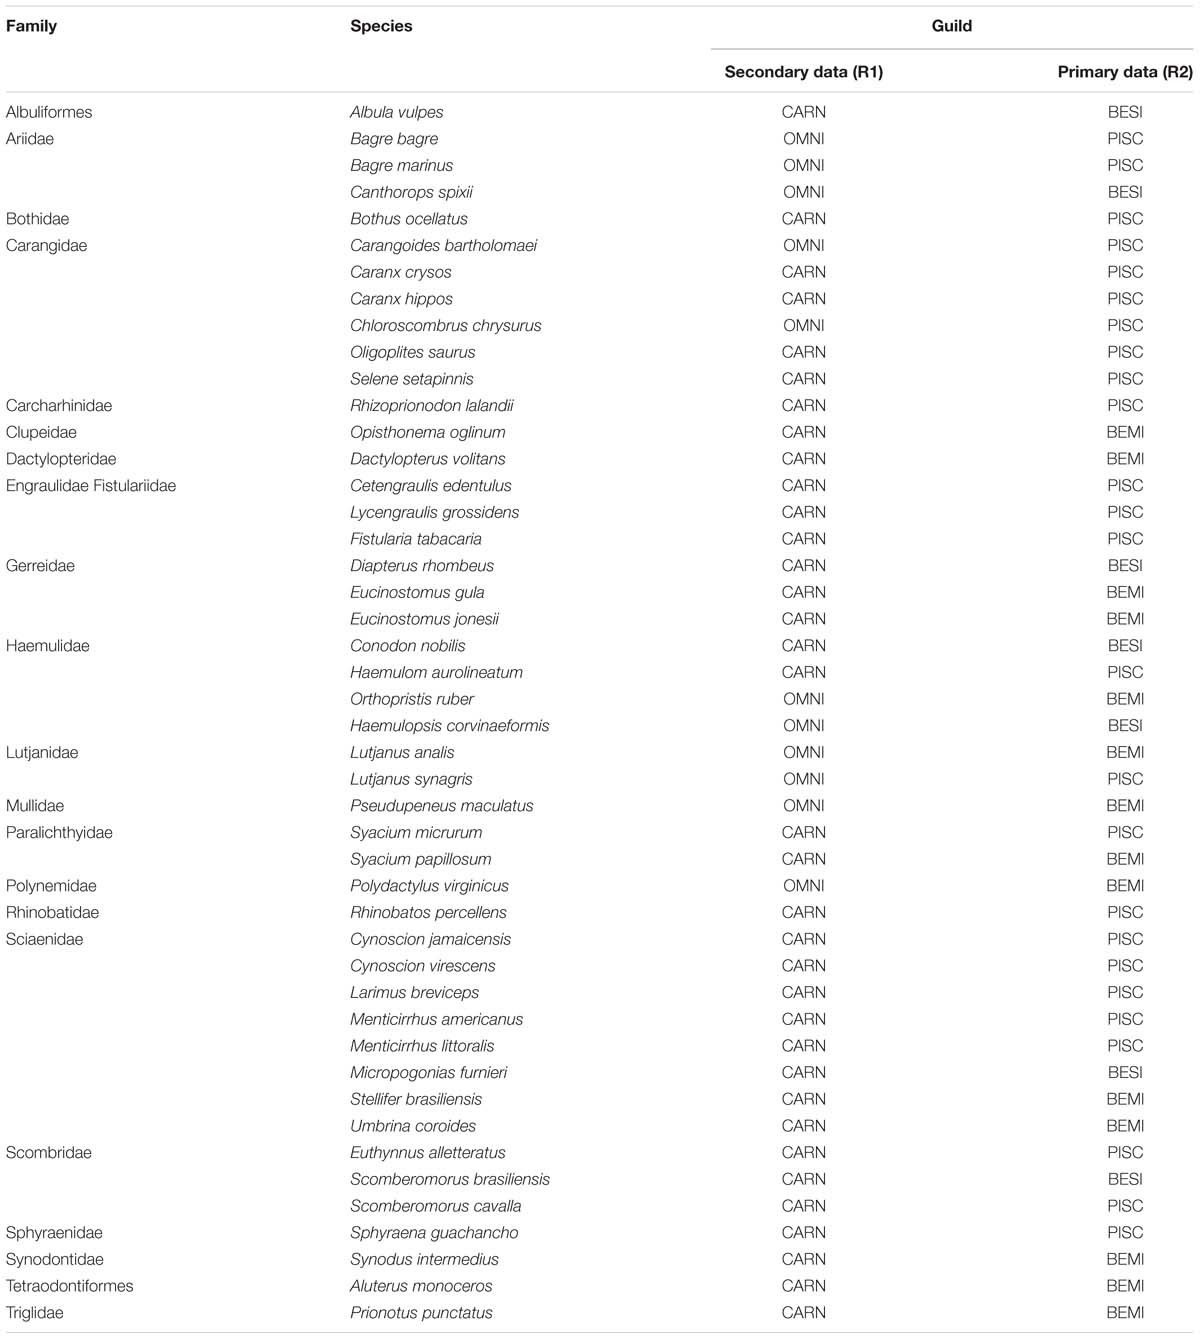
Table 2. Fish species collected during the study period and their respective guilds based on secondary data (R1: CARN – carnivores; OMNI – omnivores) and primary data (R2: BESI – benthivorous sedentary invertebrates; BEMI – benthivorous mobile invertebrate; and PISC – piscivores).
Testing Similarity Pairwise Matrix
The core aim of our study was to identify how different ways of express one particular function or process may affect our perception of this process. Therefore, to test whether different trait resolutions and surrogates change pairwise species similarity, the trait-species matrices and the phylogenetic topology were all converted into distance matrices, and a Mantel test was carried out to evaluate correlations between the maximum resolution (Rmax) to the other four diet resolutions (R1, R2, R3, and R4) as well as to the two studied surrogates (S1 – morphological traits and S2 – phylogeny) (Figure 1B). As each resolution and surrogate presented different types of data, the distance matrix of each component was created using different measures: Jaccard distance for qualitative data (R1, R2, and R3), Bray–Curtis distance for quantitative data (R4, R5, and S1), and the Cophenetic distance for phylogeny data (S2). The pairwise similarity correlation (with 999 permutations) was performed in the software R (R Core Team, 2013) using the Vegan package at a significance level of 0.05. The threshold of 0.7 was adopted to identify which matrices were highly correlated (Dormann et al., 2013).
Effect of the Trait Resolution in the Community Assemblage Patterns
Second, we tested whether studied resolutions and surrogates provide different ecological interpretations of communities. Functional diversity of fish assemblages for the three habitats found in the study area was measured by the standardized size effect of Petchey and Gaston’s (2002b), using all trait-species matrices and the phylogenetic topology, individually (Figure 1C). A one-way analysis of variance (ANOVA) was then performed to test differences in FD obtained for each resolution between habitats (Figure 1D).
Here, FD was defined as the sum of the total branch length of the functional dendrogram connecting co-occurring species. The standardized effect size was used to control the influence of species richness in the estimation of FD (Kembel et al., 2010). Prior comparisons of FD values, normality and homoscedasticity assumptions were checked using Shapiro–Wilk and Levene’s test, respectively. Whenever necessary, data was transformed – ln(x+1) or x2 – to reduce the effect of data aggregation. All functional analyses were performed in the software R.
Results
Diet Composition and Trophic Guild
The gut content of 213 individuals from 46 species was analyzed. Species classification in trophic guilds differed between applied methods (Table 2). For instance, in R1, according to publishing data and online database searching, species were only classified into two groups (carnivorous and omnivorous). Meanwhile, when considering the gut content in R2, three different guilds were found (benthivorous mobile invertebrates/BEMI; piscivores/PISCV and benthivorous sedentary invertebrates/BESI). The PISCV group was the most representative guild with 24 species, BEMI was comprised of 15 species, and BESI was represented by 7 species (Figure 2). Diet composition among the three guilds was significantly different (ANOSIM, R = 0.538; p < 0.01), supporting the results of the cluster analysis. Detritus (16%) and Decapoda (9%) contributed the most to total dissimilarity between the BESI and PISCV, while Osteichthyes (28%) and Decapoda (15%) were responsible for dissimilarity between PISCV and BEMI. Differences between BESI and BEMI were caused by detritus (11%) and Osteichthyes (10%) items. A full characterization of food items identified for species is provided in Supplementary Material (Supplementary Table S1).
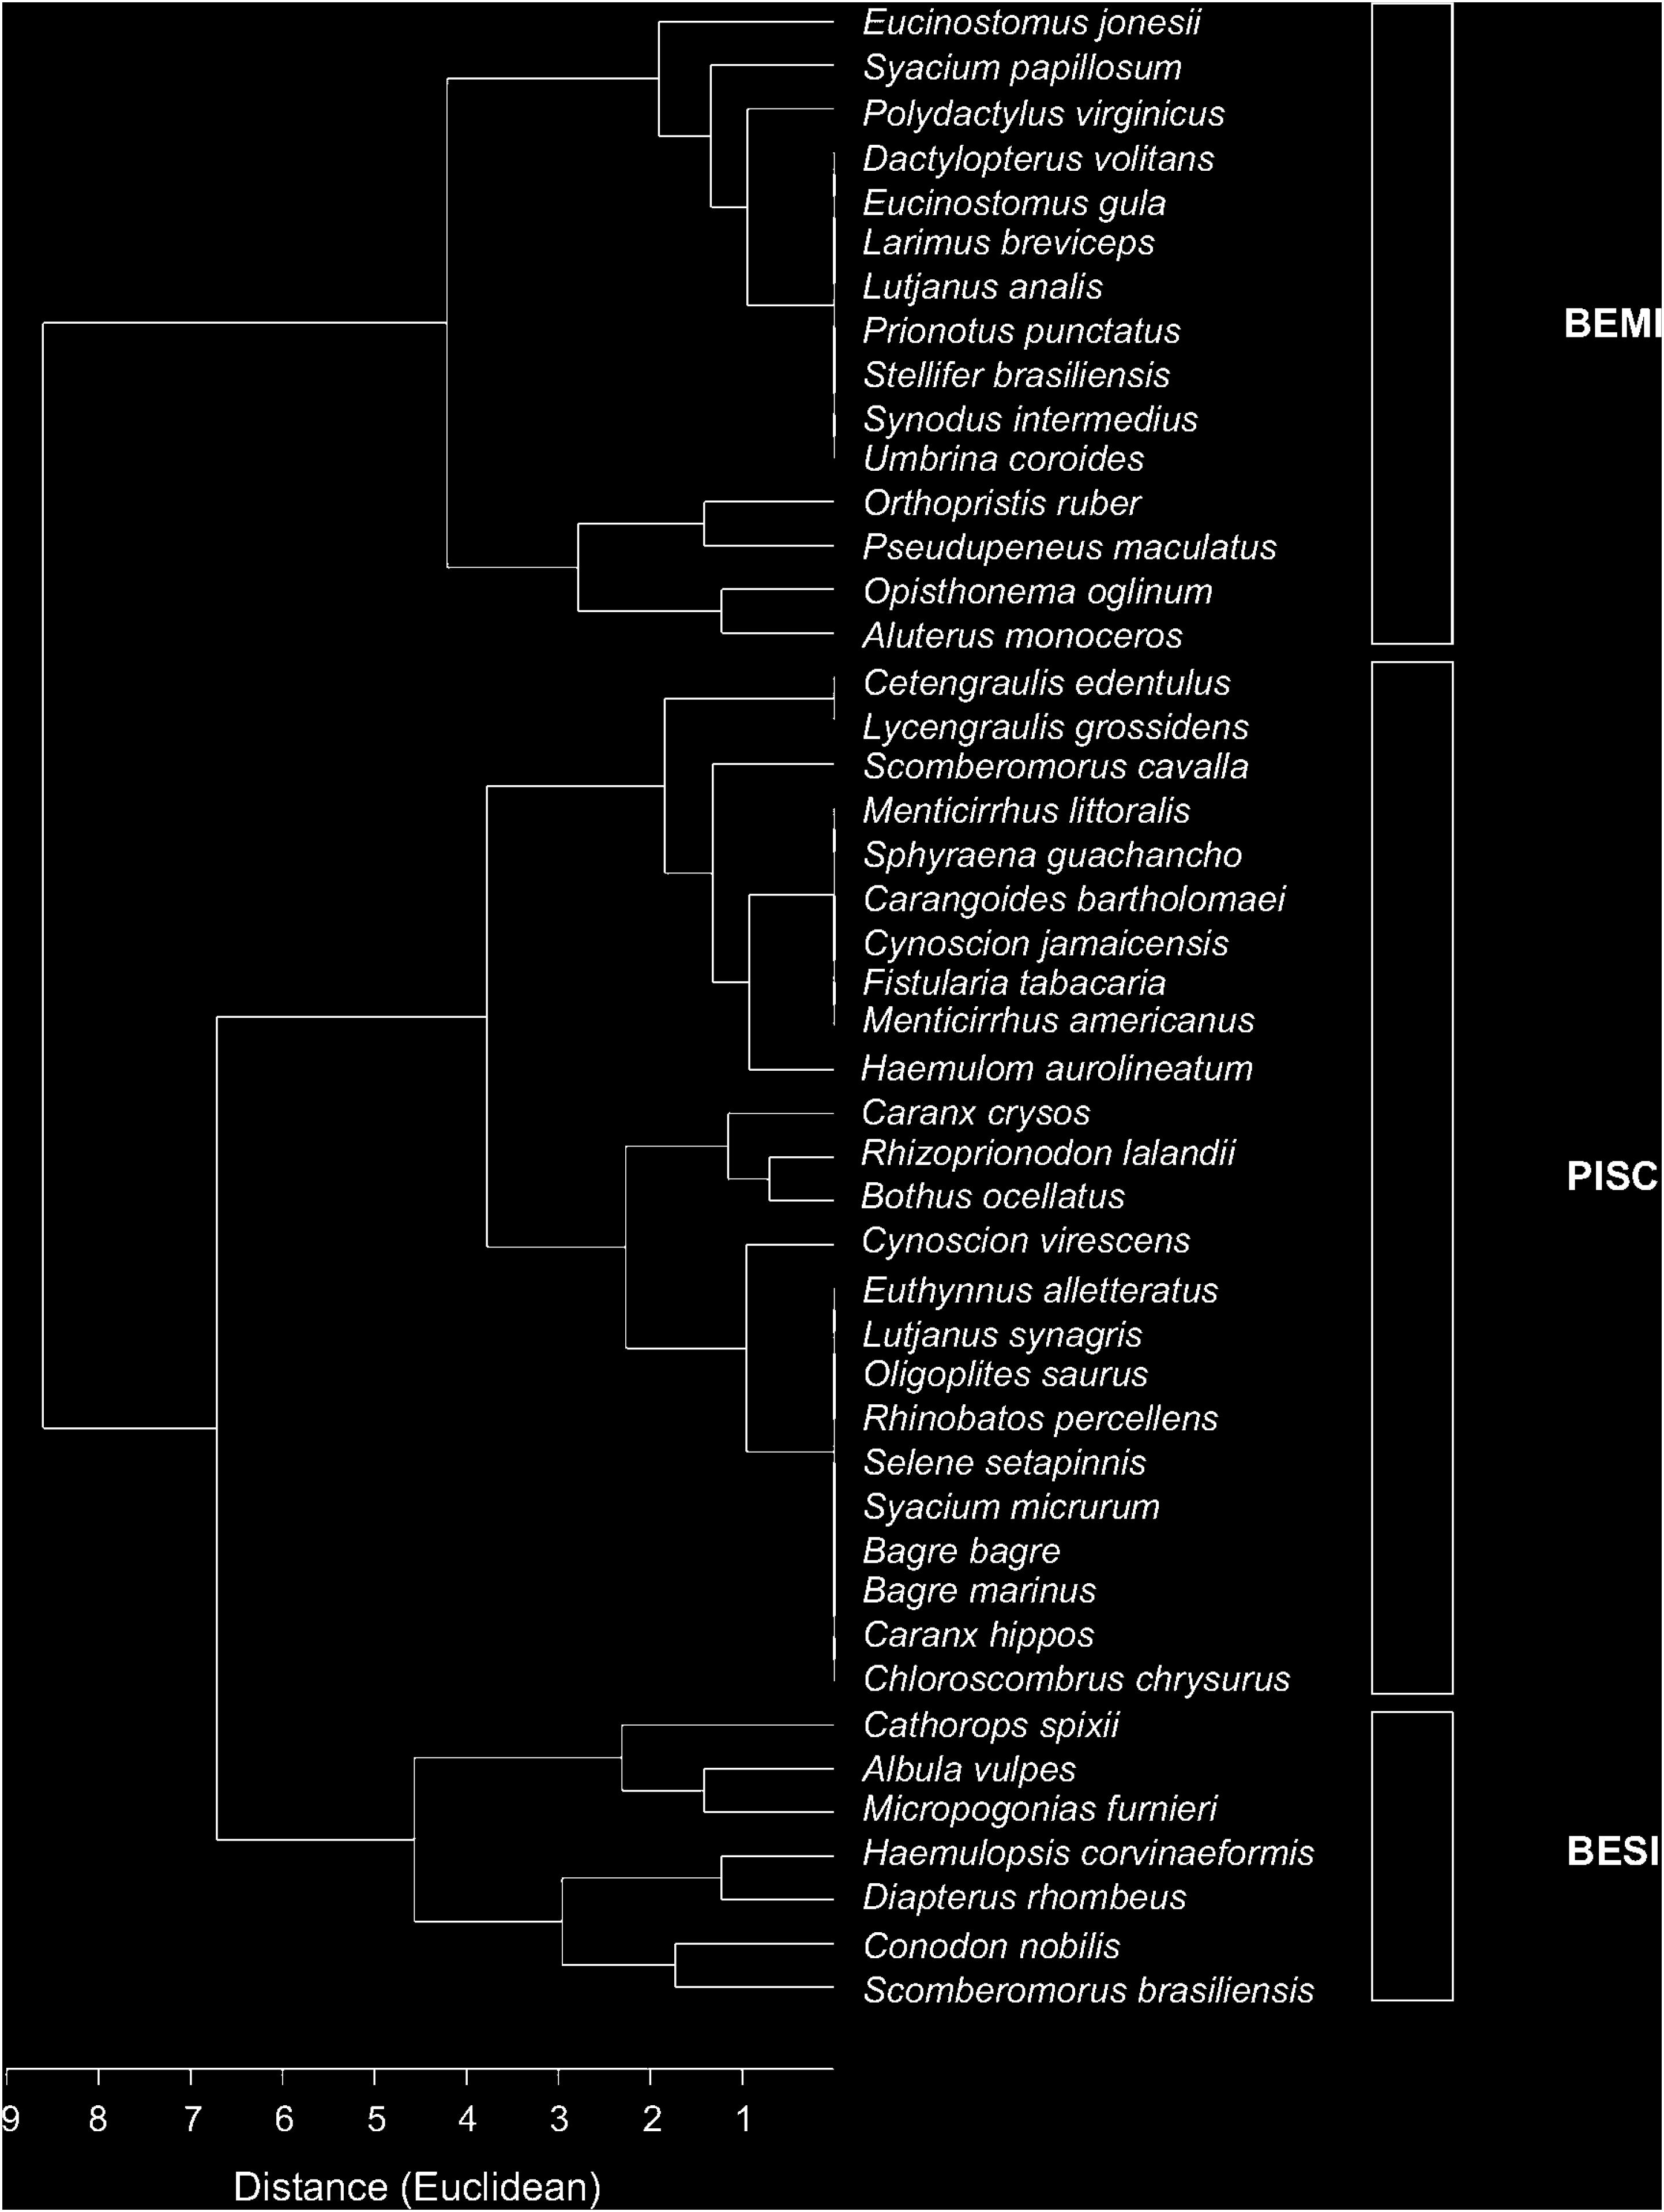
Figure 2. Dendrogram of the trophic guilds of the fish assemblage using qualitative data of food item (R2). BEMI: Benthivorous mobile invertebrates; PISC: Piscivores; and BESI: Benthivorous sedentary invertebrates.
Similarity Between Rmax and Resolutions and Surrogates of Diet
The correlation between Rmax and other diet measures (R1, R2, R3, and R4) increased with higher resolutions (Figure 3), indicating that more detailed information on diet provide a better picture of how species share resources. Although the first resolution using qualitative data from published literature (R1) did not present a significant relationship (p > 0.05) with the highest resolution (Rmax), from R2 onward, where we used direct analysis of gut content in different ways, correlations were statistically significant (p < 0.05). Surprisingly, surrogates (S1 and S2) did not present any correlation with Rmax (p > 0.05).
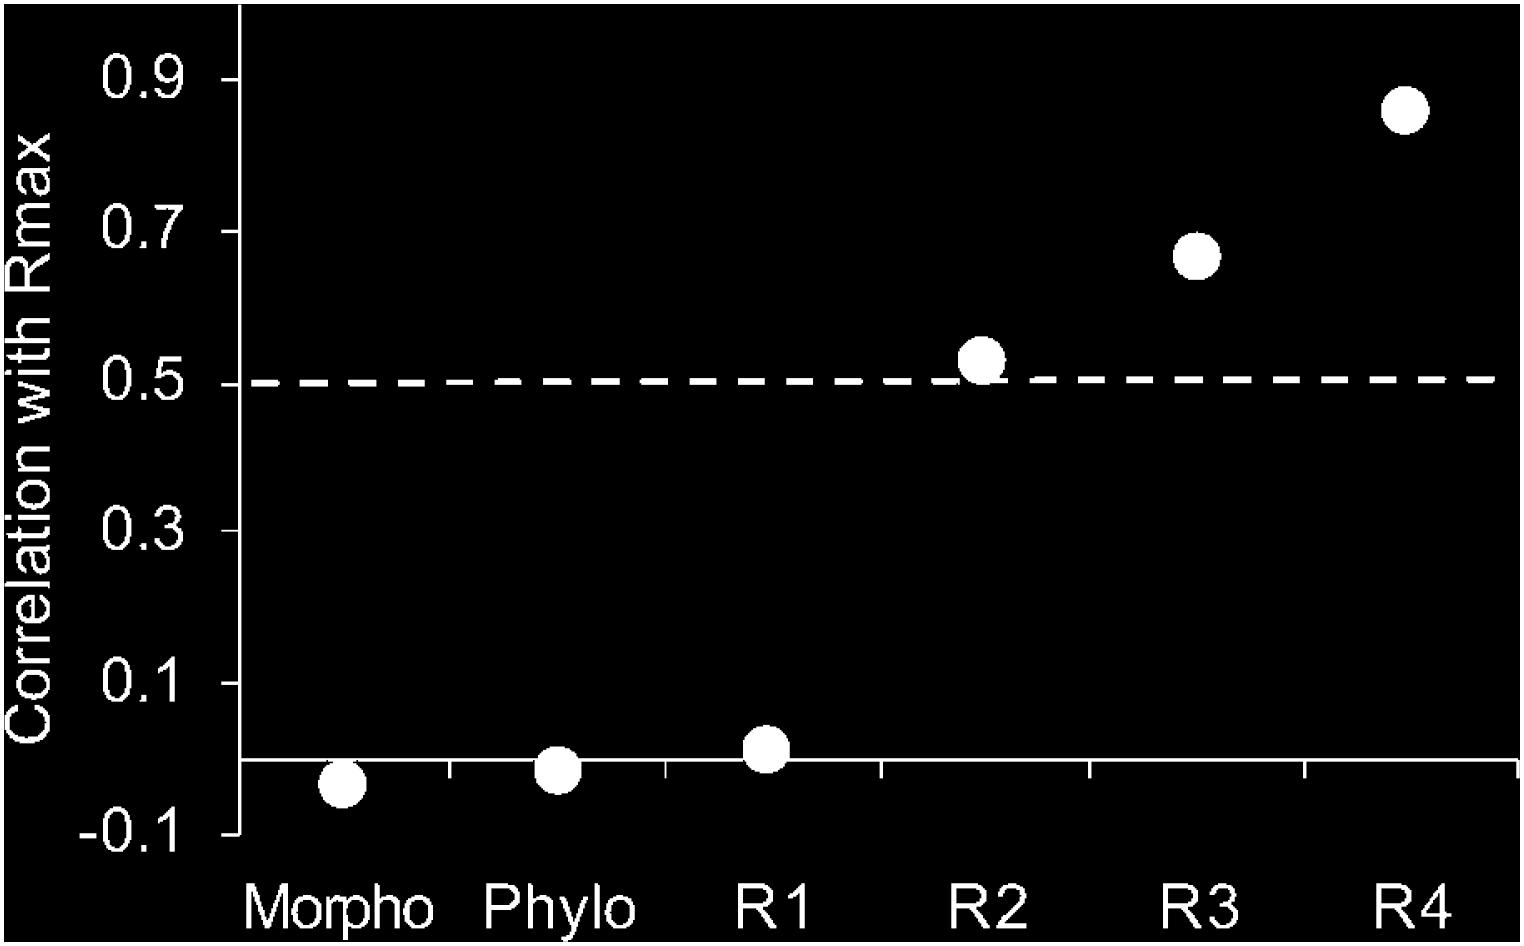
Figure 3. Correlation coefficient from Mantel test performed between (Rmax) with morphological traits, phylogeny, and increasing diet resolution (R1, R2, R3, and R4). (R1) qualitative data grouped from FishBase; (R2) qualitative data grouped by food item; (R3) qualitative food items data ungrouped; (R4) quantitative data from Feeding Index Categorized (FIiC); and (Rmax) Quantitative data from Feeding Index (FIi) not categorized. The dashed line represents the level of significance at p < 0.05.
Effect of Trait Resolution on Detection of Functional Diversity Patterns
Overall, we found that observed functional patterns of fish assemblages may differ depending on trait resolution (Figure 4). Specifically, lower resolutions (R1 to R4) and surrogates (S1 and S2) were not able to identify significant differences in the functional structure of assemblages between studied habitats (p > 0.05, Figure 4), while the maximum resolution showed functional aggregation of species in the estuary habitat in relation to the others (p < 0.05).
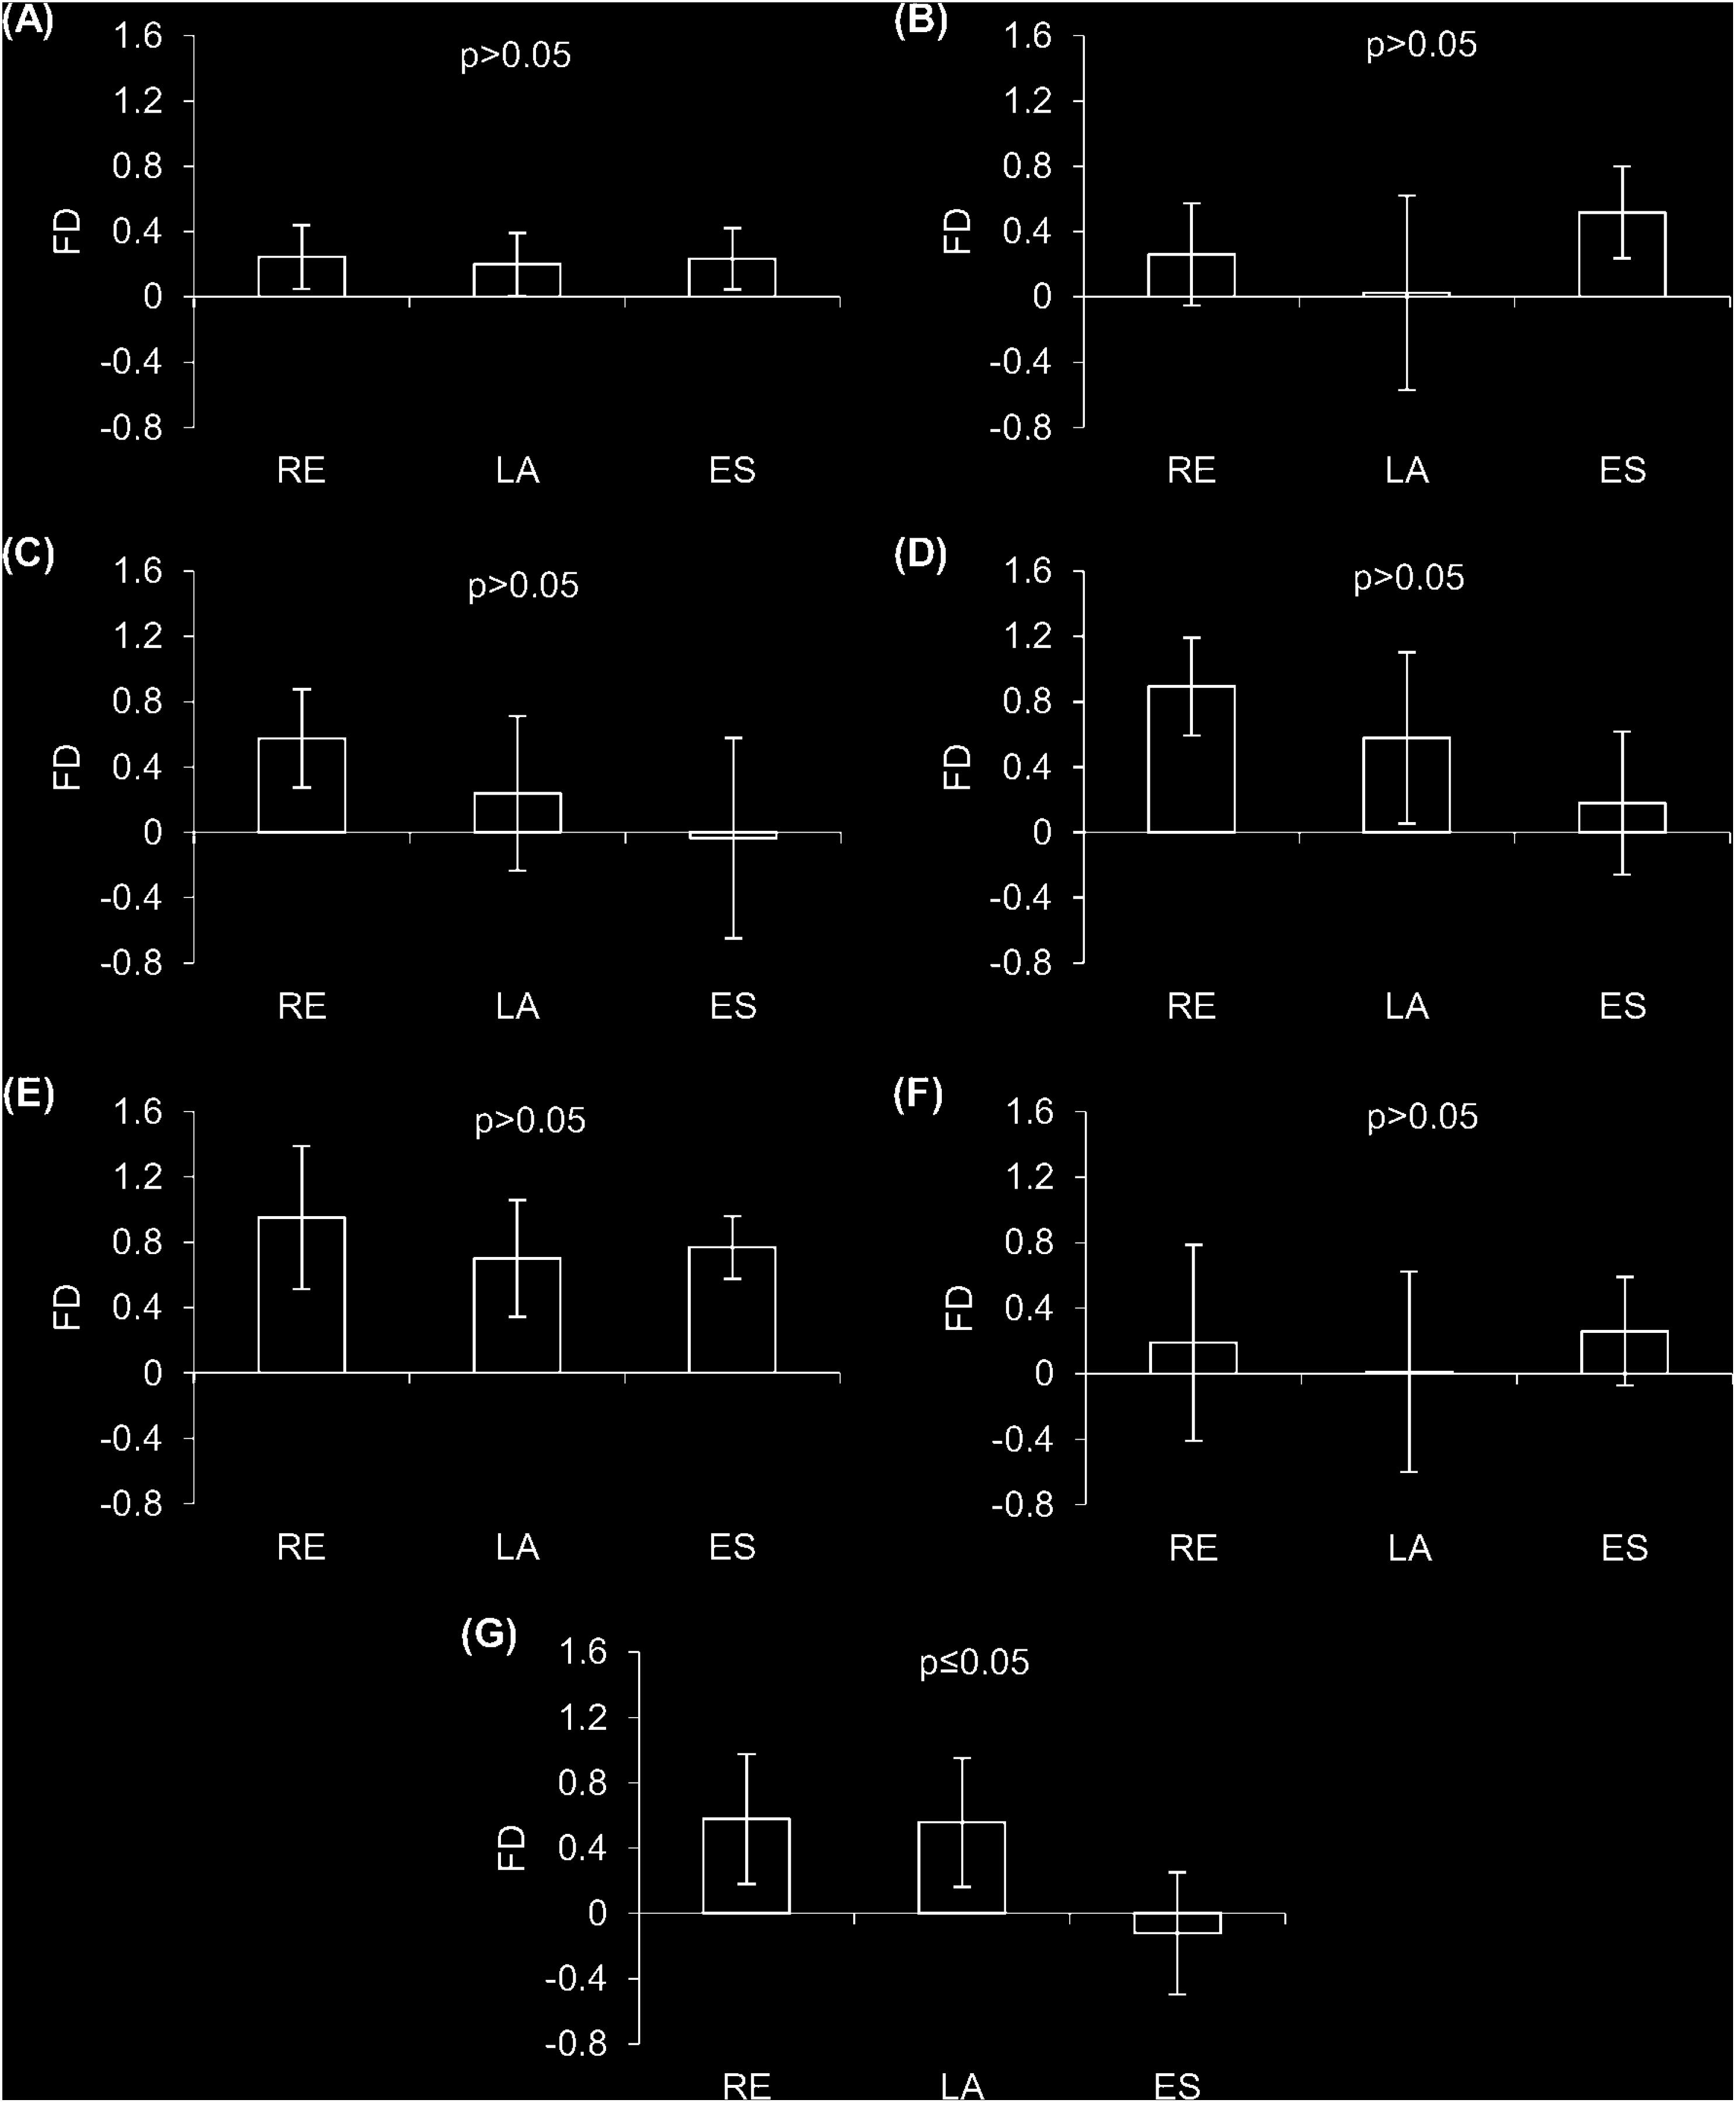
Figure 4. Mean functional diversity by habitat (± standard deviation). (A) R1 – qualitative data grouped from FishBase; (B) R2 – qualitative data grouped by food item; (C) R3 – qualitative food items data ungrouped; (D) R4 – quantitative data from Feeding Index Categorized; (E) Morpho – morphological trait; (F) Phylo – topology of species phylogeny; (G) Rmax – quantitative data from Feeding Index (FIi). FD: functional diversity index; RE: reef; LA: lagoon, and ES: estuary.
Discussion
Our results support the idea that different methods used in the measurement of a particular process can create distinct patterns in observed functional diversity. Specifically, our study shows that distinct ways of expressing resource partitioning among species may provide different ecological interpretations of this process as different resolutions or surrogates can change pairwise species similarity.
Trait Resolution and Surrogates to Assess Resource Partitioning
Trophic interactions play an important role in maintaining the structure and functioning of ecosystems (Longo et al., 2014), thereby, it is not surprising that the trophic niche of species is one of the most studied niche dimensions in animal ecology (Winemiller et al., 2015). The description of this dimension may be accomplished through the analysis of the different mechanisms underlying this process, such as the understanding of how species use the different resources available in ecosystems.
Typically, one of the easiest ways of study resource partitioning is by categorizing species into guilds based on literature information (secondary data), as primary data for most groups of species are hard to be obtained, especially in the tropics (Nonogaki et al., 2007). However, our results indicate that data retrieved from online databases or published papers might be a poor surrogate of in locus species traits, as R1 was the only diet resolution that had no correlation with Rmax (Figure 3). One of the main reasons for such differences is that available data may not always translate ecological characteristics of particular species as plasticity in feeding behavior depends on many factors, such as variation in productivity levels, ontogenetic and prey availability (Bowen and Allanson, 1982; Reisinger et al., 2017). Moreover, diet shifts of single species may spatially occur due to regional differences in environmental conditions (Condini et al., 2015) which may result in the misclassification of species. Thereby, the use of published data to categorized species should be done with caution.
Resolutions that used data obtained from gut content analysis were all positively correlated with the maximum resolution (Rmax), with the degree of correlation increasing as more detailed information of diet were included. Many studies have acknowledged that detailed information about traits are the best choice for analyzing ecological processes and understanding ecosystem functioning (Violle et al., 2007). In fact, these “hard traits” – direct information of a particular function – are known for their highly explicative power as they take in consideration variability in many aspects of species’ biology (Lavorel and Garnier, 2002), providing a better picture of the niche occupied by species (Herbert et al., 1999). For example, although species grouping in trophic guilds based on qualitative analysis of diet (R2) was correlated to the highest resolution (Rmax), this relationship was not strong (Figure 3), indicating that the information loss that occurs during the clustering process masks the fine-scale aspects of resource use. This is particularly problematic as new studies have shown that even redundant species may differ in the way they perform a particular function (Elmqvist et al., 2003; Nyström, 2006; Cariveau et al., 2013; da Silva and Fabré, 2019), which makes necessary the use of more detailed data to accurately assess ecological information.
Our results also suggest that both phylogeny and morphology are a poor proxy of resource partitioning among coastal marine fishes in the tropics (Figure 3). No relationship between morphological traits (S1) with the maximum resolution (Rmax) was found in our study, indicating that fish species with similar morphological patterns do not necessarily use the same food items available in ecosystems. Although widely used in functional ecology, many authors have addressed some important issues in relation to the use of morphology in predicting functions related to the use of resources by species, possibly due to the generalist prey selection of species as well as their high plasticity in feeding behavior (Pouilly et al., 2003; Ibañez et al., 2007; Reecht et al., 2013; Teresa and Casatti, 2017). The core challenge is that most morpho-anatomical traits are only capable of discriminate groups without assessing fine-scale aspects of fish ecology (Albouy et al., 2011), thus expressing only the potential or fundamental niche of species. This happens, in part, because species that present similar body structures may have different mechanisms for food acquisition and consumption (Konow and Bellwood, 2011), resulting in a weak relationship between body shape and the actual diet of species, as shown in our results.
The absence of correlation between the trait-phylogeny matrix with Rmax found in our study may be associated to many factors, including local environmental conditions. Even though phylogenetically related species are expected to be more similar in their functional role, trait variability may occur due to pressures from ecological divergence. For instance, in tropical areas, the high competition for resources and diet partitioning may cause trait divergence, regardless of morphology and phylogeny (Vitt and Pianka, 2005; Grime, 2006; Cadotte et al., 2013). Furthermore, the availability of preys may cause high trophic plasticity as an adaptation to current conditions, leading trait variation in the ecological time but not in the evolutionary history (Vitt and Pianka, 2005). For this reason, some studies involving phylogenetic structure and trait analysis have not been able to detect covariation (Gibb et al., 2015).
Trait Resolution and Its Impact on Functional Analysis
Our results also showed that different measures of resource partitioning may provide distinct patterns in observed functional diversity of fish assemblages. More precisely, when functional diversity between studied habitats was tested, only the direct measure of resource partitioning (expressed through the maximum diet resolution) was able to identify significant differences among habitats (Figure 4). These different patterns in the observed functional structure of assemblages found herein may result from the level of detailing considered in the measurement of the partitioning process. Although expensive and a research-intensive alternative, detailed information on resource use provides more reliable niche dimensions, allowing the comprehension of niche-based processes that drive assemblages’ structure (Gonçalves-Souza et al., 2014; Passos et al., 2016). Moreover, hard traits, such as diet composition, have been shown as good predictors of the ecological performance of species, showing fine-scale aspects of habitat selection, physiological response to environmental conditions and shifts in behavior (Violle et al., 2007; Lozanovska et al., 2018).
Author Contributions
VdS wrote the manuscript and helped with functional analysis. LS-F helped with gut content analysis and wrote the manuscript. FT helped with phylogenetic analysis and the planning of our manuscript. NF organized the project and wrote the manuscript. RL and VB supported manuscript preparation.
Funding
This study was supported by the Coordination for the Improvement of Higher Education Personnel – CAPES (Master’s degree fellowship for VdS and LS-F), the State Funding Agency of Alagoas – FAPEAL, the Brazilian Ministry of Fisheries and Aquaculture – MPA and the Brazilian National Council for Scientific and Technological Development – CNPq (FT: grant #306912/2018-0; VB: grant 311038/2017-4; NF: grant #311785/2018-2; RL: grant #310953/2014-6).
Conflict of Interest Statement
The authors declare that the research was conducted in the absence of any commercial or financial relationships that could be construed as a potential conflict of interest.
Acknowledgments
We would like to thank colleagues Daniele Vieira, Guilherme Ramalho, Ivan Assis, and Maria Oliveira from the Federal University of Alagoas for their assistance during field and laboratory work. Dr. Thiago Gonçalves-Souza from the Federal Rural University of Pernambuco for his comments on early versions of the manuscript.
Supplementary Material
The Supplementary Material for this article can be found online at: https://www.frontiersin.org/articles/10.3389/fmars.2019.00303/full#supplementary-material
TABLE S1 | Trait-species matrices created to express resource partitioning among sampled fish species. Each matrix represents a different resolution (R1 – Qualitative data grouped in guild from FishBase source; R2 – Qualitative data grouped in guild from similar food item; R3 - Qualitative food items data ungrouped in guild; R4 – Quantitative data from Feeding Index Categorized (FIiC); Rmax – Quantitative data from FIi not categorized; S1 – ecomorphological trait).
Footnotes
References
Adite, A., and Winemiller, K. O. (1997). Trophic ecology and ecomorphology of fish assemblages in coastal lakes of Benin, West Africa. Ecoscience 4, 6–23. doi: 10.1080/11956860.1997.11682371
Albouy, C., Guilhaumon, F., Villéger, S., Mouchet, M., Mercier, L., Culioli, J. M., et al. (2011). Predicting trophic guild and diet overlap from functional traits: statistics, opportunities and limitations for marine ecology. Mar. Ecol. Prog. Ser. 436, 17–28. doi: 10.3354/meps09240
Betancur-r, R., Broughton, R. E., Wiley, E. O., Carpenter, K., López, J. A., Li, C., et al. (2013). The tree of life and a new classification of bony fishes. PLoS Curr. 5. doi: 10.1371/currents.tol.53ba26640df0ccaee75bb165c8c26288
Bowen, S. H., and Allanson, B. R. (1982). Behavioral and trophic plasticity of juvenile Tilapia mossambica in utilization of the unstable littoral habitat. Environ. Biol. Fishes 7, 357–362. doi: 10.1007/BF00005570
Cadotte, M., Albert, C. H., and Walker, S. C. (2013). The ecology of differences: assessing community assembly with trait and evolutionary distances. Ecol. Lett. 16, 1234–1244. doi: 10.1111/ele.12161
Cariveau, D. P., Williams, N. M., Benjamin, F. E., and Winfree, R. (2013). Response diversity to land use occurs but does not consistently stabilise ecosystem services provided by native pollinators. Ecol. Lett. 16, 903–911. doi: 10.1111/ele.12126
Carpenter, K. E. (2002). “The living marine resources of the Western Central Atlantic II: Bony fishes I (Acipenseridae to Grammatidae),” in FAO Species Identification Guide for Fishery Purposes and American Society of Ichthyologists and Herpetologists Special Publication No. 5, ed. K. E. Carpenter (Rome: FAO).
Condini, M. V., Hoeinghaus, D. J., and Garcia, A. M. (2015). Trophic ecology of dusky grouper Epinephelus marginatus (Actinopterygii, Epinephelidae) in littoral and neritic habitats of southern Brazil as elucidated by stomach contents and stable isotope analyses. Hydrobiologia 743, 109–125. doi: 10.1007/s10750-014-2016-0
R Core Team (2013). R: A Language and Environment for Statistical Computing. Vienna: The R Foundation for Statistical Computing.
da Silva, V. E. L., and Fabré, N. N. (2019). Rare species enhance niche differentiation among tropical estuarine fish species. Estuaries Coasts 42, 890–899. doi: 10.1007/s12237-019-00524-2
de Bello, F. (2012). The quest for trait convergence and divergence in community assembly: are null-models the magic wand? Glob. Ecol. Biogeogr. 21, 312–317. doi: 10.1111/j.1466-8238.2011.00682.x
Didham, R. K., Leather, S. R., and Basset, Y. (2016). Circle the bandwagons - challenges mount against the theoretical foundations of applied functional trait and ecosystem service research. Insect. Conserv. Divers. 9, 1–3. doi: 10.1111/icad.12150
Diniz-Filho, J. A. F., Terribile, L. C., Cruz, M. J. R., and Vieira, L. C. G. (2010). Hidden patterns of phylogenetic non-stationarity overwhelm comparative analyses of niche conservatism and divergence. Glob. Ecol. Biogeogr. 19, 916–926. doi: 10.1111/j.1466-8238.2010.00562.x
Dolbeth, M., Vendel, A. L., Baeta, A., Pessanha, A., and Patrício, J. (2016). Exploring ecosystem functioning in two Brazilian estuaries integrating fish diversity, species traits and food webs. Mar. Ecol. Prog. Ser. 560, 41–55. doi: 10.3354/meps11895
Dormann, C. F., Elith, J., Bacher, S., Buchmann, C., Carl, G., Carré, G., et al. (2013). Collinearity: a review of methods to deal with it and a simulation study evaluating their performance. Ecography 36, 027–046. doi: 10.1111/j.1600-0587.2012.07348.x
Elmqvist, T., Folke, C., Nystrom, M., Peterson, G., Bengtsson, J., Walker, B., et al. (2003). Response diversity, ecosystem change, and resilience. Front. Ecol. Environ. 1:488–494. doi: 10.2307/3868116
Figueiredo, J. L., and Menezes, N. (1978). Manual de Peixes Marinhos do Sudeste do Brasil. II. Teleostei (1). São Paulo: Universidade de São Paulo.
Gatz, A. J. J. (1979). Community organization in fishes as indicated by morphological features. Ecology 60, 711–718. doi: 10.2307/1936608
Gibb, H., Stoklosa, J., Warton, D. I., Brown, A. M., Andrew, N. R., and Cunningham, S. A. (2015). Does morphology predict trophic position and habitat use of ant species and assemblages? Oecologia 177, 519–531. doi: 10.1007/s00442-014-3101-9
Gonçalves-Souza, T., Romero, G. Q., and Cottenie, K. (2014). Metacommunity versus biogeography: a case study of two groups of neotropical vegetation-dwelling arthropods. PLoS One 9:e115137. doi: 10.1371/journal.pone.0115137
Grime, J. P. (2006). Trait convergence and trait divergence in herbaceous plant communities: mechanisms and consequences. J. Veg. Sci. 17, 255–260. doi: 10.1111/j.1654-1103.2006.tb02444.x
Hammer, Ø, Harper, D. A. T., and Ryan, P. D. (2001). PAST: paleontological statistics software package for education and data analysis. Palaeontol. Electron 4, 1–9. doi: 10.1016/j.bcp.2008.05.025
Herbert, D. A., Rastetter, E. B., Shaver, G. R., and Ågren, G. I. (1999). Effects of plant growth characteristics on biogeochemistry and community composition in a changing climate. Ecosystems 2, 367–382. doi: 10.1007/s100219900086
Hugueny, B., and Pouilly, M. (1999). Morphological correlates of diet in an assemblage of West African freshwater fishes. J. Fish Biol. 54, 1310–1325. doi: 10.1006/jfbi.1999.0962
Hynes, H. B. N. (1950). The food of fresh-water sticklebacks (Gasterosteus aculeatus and Pygosteus pungitius), with a review of methods used in studies of the food of fishes. J. Anim. Ecol. 19, 36–58. doi: 10.2307/1570
Ibañez, C., Tedesco, P. A., Bigorne, R., Hugueny, B., Pouilly, M., Zepita, C., et al. (2007). Dietary-morphological relationships in fish assemblages of small forested streams in the Bolivian Amazon. Aquat. Living Resour. 20, 131–142. doi: 10.1051/alr:2007024
Kawakami, E., and Vazzoler, G. (1980). Método gráfico e estimativa de índice alimentar aplicado no estudo de alimentação de peixes. Bol. Inst. Oceanogr. 29, 205–207. doi: 10.1590/s1679-87591980000200043
Kembel, S. W., Cowan, P. D., Helmus, M. R., Cornwell, W. K., Morlon, H., Ackerly, D. D., et al. (2010). Picante: R tools for integrating phylogenies and ecology. Bioinformatics 26, 1463–1464. doi: 10.1093/bioinformatics/btq166
Knoppers, B., Medeiros, P. R. P., De Souza, W. F. L., and Jennerjahn, T. (2006). “The São Francisco Estuary, Brazil,” in Estuaries. The Handbook of Environmental Chemistry, Vol. 5H, ed. P. J. Wangersky (Berlin: Springer).
Konow, N., and Bellwood, D. R. (2011). Evolution of high trophic diversity based on limited functional disparity in the feeding apparatus of marine angelfishes (f. pomacanthidae). PLoS One 6:e24113. doi: 10.1371/journal.pone.0024113
Lavorel, S., and Garnier, E. (2002). Predicting changes in community composition and ecosystem functioning from plant traits: revisiting the Holy Grail. Funct. Ecol. 16, 545–556. doi: 10.1046/j.1365-2435.2002.00664.x
Lavorel, S., Grigulis, K., McIntyre, S., Williams, N. S. G., Garden, D., Dorrough, J., et al. (2008). Assessing functional diversity in the field – methodology matters! Funct. Ecol. 22, 134–147. doi: 10.1111/j.1365-2435.2007.01339.x
Lessa, R., and Nóbrega, M. (2000). Programa REVIZEE/Score-NE: Guia de identificação de Peixes Marinhos da Região Nordeste. Recife: UFRPE.
Longo, G. O., Ferreira, C. E. L., and Floeter, S. R. (2014). Herbivory drives large-scale spatial variation in reef fish trophic interactions. Ecol. Evol. 4, 4553–4566. doi: 10.1002/ece3.1310
Lozanovska, I., Ferreira, M. T., and Aguiar, F. C. (2018). Functional diversity assessment in riparian forests – Multiple approaches and trends: a review. Ecol. Indic. 95, 781–793. doi: 10.1016/j.ecolind.2018.08.039
McGill, B. J., Enquist, B. J., Weiher, E., and Westoby, M. (2006). Rebuilding community ecology from functional traits. Trends Ecol. Evol. 21, 178–185. doi: 10.1016/j.tree.2006.02.002
Mouquet, N., Devictor, V., Meynard, C. N., Munoz, F., Bersier, L. F., Chave, J., et al. (2012). Ecophylogenetics: advances and perspectives. Biol. Rev. 87, 769–785. doi: 10.1111/j.1469-185X.2012.00224.x
Nonogaki, H., Nelson, J. A., and Patterson, W. P. (2007). Dietary histories of herbivorous loricariid catfishes: evidence from δ13C values of otoliths. Environ. Biol. Fishes 78, 13–21. doi: 10.1007/s10641-006-9074-8
Nyström, M. (2006). Redundancy and response diversity of functional groups: implications for the resilience of coral reefs. Ambio 35, 30–35. doi: 10.1579/0044-7447-35.1.30
Oliveira, A. K., Alvim, M. C. C., Peret, A. C., and Alves, C. B. M. (2004). Diet shifts related to body size of the pirambeba Serrasalmus brandtii Lütken, 1875 (Osteichthyes, Serrasalminae) in the Cajuru Reservoir, São Francisco River Basin, Brazil. Braz. J. Biol. 64, 117–124. doi: 10.1590/S1519-69842004000100013
Passos, C. V. B., Fabré, N. N., Malhado, A. C. M., Batista, V. S., and Ladle, R. J. (2016). Estuarization increases functional diversity of demersal fish assemblages in tropical coastal ecosystems. J. Fish Biol. 89, 847–862. doi: 10.1111/jfb.13029
Petchey, O. L., and Gaston, K. J. (2002a). Extinction and the loss of functional diversity. Proc. R. Soc. B Biol. Sci. 269, 1721–1727. doi: 10.1098/rspb.2002.2073
Petchey, O. L., and Gaston, K. J. (2002b). Functional diversity (FD), species richness and community composition. Ecol. Lett. 5, 402–411. doi: 10.1046/j.1461-0248.2002.00339.x
Poff, N. L., Olden, J. D., Vieira, N. K. M., Finn, D. S., Simmons, M. P., and Kondratieff, B. C. (2006). Functional trait niches of North American lotic insects: traits-based ecological applications in light of phylogenetic relationships. J. North Am. Benthol. Soc. 25, 730–755. doi: 10.1899/0887-3593(2006)025
Pouilly, M., Lino, F., Bretenoux, J. G., and Rosales, C. (2003). Dietary-morphological relationships in a fish assemblage of the bolivian amazonian floodplain. J. Fish Biol. 62, 1137–1158. doi: 10.1046/j.1095-8649.2003.00108.x
Ramírez-Ortiz, G., Calderon-Aguilera, L. E., Reyes-Bonilla, H., Ayala-Bocos, A., Hernández, L., Fernández Rivera-Melo, F., et al. (2017). Functional diversity of fish and invertebrates in coral and rocky reefs of the Eastern Tropical Pacific. Mar. Ecol. 38:e12447. doi: 10.1111/maec.12447
Reecht, Y., Rochet, M. J., Trenkel, V. M., Jennings, S., and Pinnegar, J. K. (2013). Use of morphological characteristics to define functional groups of predatory fishes in the celtic sea. J. Fish Biol. 83, 355–377. doi: 10.1111/jfb.12177
Reisinger, L. S., Elgin, A. K., Towle, K. M., Chan, D. J., and Lodge, D. M. (2017). The influence of evolution and plasticity on the behavior of an invasive crayfish. Biol. Invasions 19, 815–830. doi: 10.1007/s10530-016-1346-4
Siefert, A., Ravenscroft, C., Weiser, M. D., and Swenson, N. G. (2013). Functional beta-diversity patterns reveal deterministic community assembly processes in eastern North American trees. Glob. Ecol. Biogeogr. 22, 682–691. doi: 10.1111/geb.12030
Soler, G. A., Edgar, G. J., Stuart-Smith, R. D., Smith, A. D. M., and Thomson, R. J. (2016). Predicting the diet of coastal fishes at a continental scale based on taxonomy and body size. J. Exp. Mar. Bio. Ecol. 480, 1–7. doi: 10.1016/j.jembe.2016.03.017
Teresa, F. B., and Casatti, L. (2017). Trait-based metrics as bioindicators: responses of stream fish assemblages to a gradient of environmental degradation. Ecol. Indic. 75, 249–258. doi: 10.1016/j.ecolind.2016.12.041
Tucker, C. M., Cadotte, M. W., Carvalho, S. B., Davies, T. J., Ferrier, S., Fritz, S. A., et al. (2017). A guide to phylogenetic metrics for conservation, community ecology and macroecology. Biol. Rev. 92, 698–715. doi: 10.1111/brv.12252
Vandewalle, M., de Bello, F., Berg, M. P., Bolger, T., Dolédec, S., Dubs, F., et al. (2010). Functional traits as indicators of biodiversity response to land use changes across ecosystems and organisms. Biodivers. Conserv. 19, 2921–2947. doi: 10.1007/s10531-010-9798-9
Villéger, S., Brosse, S., Mouchet, M., Mouillot, D., and Vanni, M. J. (2017). Functional ecology of fish: current approaches and future challenges. Aquat. Sci. 79, 783–801. doi: 10.1007/s00027-017-0546-z
Violle, C., Enquist, B. J., McGill, B. J., Jiang, L., Albert, C. H., Hulshof, C., et al. (2012). The return of the variance: intraspecific variability in community ecology. Trends Ecol. Evol. 27, 244–252. doi: 10.1016/j.tree.2011.11.014
Violle, C., Navas, M. L., Vile, D., Kazakou, E., Fortunel, C., Hummel, I., et al. (2007). Let the concept of trait be functional! Oikos 116, 882–892. doi: 10.1111/j.2007.0030-1299.15559.x
Vitt, L. J., and Pianka, E. R. (2005). Deep history impacts present-day ecology and biodiversity. Proc. Natl. Acad. Sci. U.S.A. 102, 7877–7881. doi: 10.1073/pnas.0501
Keywords: resolution, functional diversity, diet analysis, trophic guild, similarity
Citation: da Silva VEL, Silva-Firmiano LPS, Teresa FB, Batista VS, Ladle RJ and Fabré NN (2019) Functional Traits of Fish Species: Adjusting Resolution to Accurately Express Resource Partitioning. Front. Mar. Sci. 6:303. doi: 10.3389/fmars.2019.00303
Received: 02 November 2018; Accepted: 22 May 2019;
Published: 07 June 2019.
Edited by:
Mario Barletta, Federal University of Pernambuco, BrazilReviewed by:
Henrique Cabral, Irstea Centre de Bordeaux, FranceMarina Dolbeth, Centro Interdisciplinar de Investigação Marinha e Ambiental (CIIMAR), Portugal
Copyright © 2019 da Silva, Silva-Firmiano, Teresa, Batista, Ladle and Fabré. This is an open-access article distributed under the terms of the Creative Commons Attribution License (CC BY). The use, distribution or reproduction in other forums is permitted, provided the original author(s) and the copyright owner(s) are credited and that the original publication in this journal is cited, in accordance with accepted academic practice. No use, distribution or reproduction is permitted which does not comply with these terms.
*Correspondence: Victor E. L. da Silva, bG9wZXNkYXNpbHZhdmljdG9yQGdtYWlsLmNvbQ==; Vandick S. Batista, dmFuZGlja2JhdGlzdGFAZ21haWwuY29t