 Sebastiaan Swart1,2*
 Sarah T. Gille3
 Bruno Delille4
 Simon Josey5
 Matthew Mazloff3
 Louise Newman6
 Andrew F. Thompson7
 Jim Thomson8
 Brian Ward9
 Marcel D. du Plessis2,10
 Elizabeth C. Kent11
 James Girton8
 Luke Gregor10,12
 Petra Heil13
 Patrick Hyder14
 Luciano Ponzi Pezzi15
 Ronald Buss de Souza16
 Veronica Tamsitt17,18
 Robert A. Weller19
 Christopher J. Zappa20
- 1Department of Marine Sciences, University of Gothenburg, Gothenburg, Sweden
- 2Department of Oceanography, University of Cape Town, Cape Town, South Africa
- 3Scripps Institution of Oceanography, University of California, San Diego, San Diego, CA, United States
- 4Chemical Oceanography Unit, University of Liège, Liège, Belgium
- 5National Oceanography Centre, Southampton, Southampton, United Kingdom
- 6Southern Ocean Observing System International Project Office, University of Tasmania, Hobart, TAS, Australia
- 7Division of Geological and Planetary Sciences, Department of Environmental Science and Engineering, California Institute of Technology, Pasadena, CA, United States
- 8Applied Physics Laboratory, University of Washington, Seattle, WA, United States
- 9AirSea Laboratory, School of Physics and Ryan Institute, National University of Ireland Galway, Galway, Ireland
- 10Southern Ocean Carbon and Climate Observatory, Council for Scientific and Industrial Research, Pretoria, South Africa
- 11National Oceanography Centre, Southampton, Southampton, United Kingdom
- 12Environmental Physics, Institute of Biogeochemistry and Pollutant Dynamics, ETH Zürich, Zurich, Switzerland
- 13Australian Antarctic Division and Antarctic Climate and Ecosystem CRC, University of Tasmania, Hobart, TAS, Australia
- 14Met Office Hadley Centre, Exeter, United Kingdom
- 15Earth Observation General Coordination, National Institute for Space Research, São Paulo, Brazil
- 16Center for Weather Forecasting and Climate Studies, National Institute for Space Research, São Paulo, Brazil
- 17Climate Change Research Centre, University of New South Wales, Sydney, NSW, Australia
- 18Centre for Southern Hemisphere Oceans Research, CSIRO Oceans and Atmosphere, Hobart, TAS, Australia
- 19Woods Hole Oceanographic Institution, Woods Hole, MA, United States
- 20Lamont-Doherty Earth Observatory, Columbia University, Palisades, NY, United States
Air-sea and air-sea-ice fluxes in the Southern Ocean play a critical role in global climate through their impact on the overturning circulation and oceanic heat and carbon uptake. The challenging conditions in the Southern Ocean have led to sparse spatial and temporal coverage of observations. This has led to a “knowledge gap” that increases uncertainty in atmosphere and ocean dynamics and boundary-layer thermodynamic processes, impeding improvements in weather and climate models. Improvements will require both process-based research to understand the mechanisms governing air-sea exchange and a significant expansion of the observing system. This will improve flux parameterizations and reduce uncertainty associated with bulk formulae and satellite observations. Improved estimates spanning the full Southern Ocean will need to take advantage of ships, surface moorings, and the growing capabilities of autonomous platforms with robust and miniaturized sensors. A key challenge is to identify observing system sampling requirements. This requires models, Observing System Simulation Experiments (OSSEs), and assessments of the specific spatial-temporal accuracy and resolution required for priority science and assessment of observational uncertainties of the mean state and direct flux measurements. Year-round, high-quality, quasi-continuous in situ flux measurements and observations of extreme events are needed to validate, improve and characterize uncertainties in blended reanalysis products and satellite data as well as to improve parameterizations. Building a robust observing system will require community consensus on observational methodologies, observational priorities, and effective strategies for data management and discovery.
Introduction
Air-sea fluxes determine how properties, such as momentum, heat, freshwater, and gasses, exchange between the atmosphere and the ocean. They are essential to understanding the global energy budget (Trenberth and Fasullo, 2010), evaluating and improving weather prediction and climate models, and understanding oceanic and atmospheric processes that depend on the upper ocean [ocean heat uptake, mixed-layer temperature, Sea Surface Temperature (SST) variability] (Dong et al., 2007). This is exemplified in the Southern Ocean (SO), where extreme winds and sea states, strong temperature gradients, and strong seasonal changes (e.g., sea-ice cover) enhance air-sea exchanges in a region that is key to global climate (e.g., Sabine et al., 2004; Frölicher et al., 2015; Rintoul, 2018) and highly responsive to changing climate conditions (e.g., Andrews et al., 2015).
In situ observations of variables needed to estimate fluxes, in particular, meteorological measurements, are sparse in the SO (Figure 1), with almost no observations from autumn or winter months or at any time in the regions impacted by permanent or seasonal sea-ice cover. This results in large errors in SO reanalysis products (see section “Status of Flux Reanalyses and Requirements to Reduce Uncertainty,” Figure 2) and poor representation in climate models, with significant inter-related biases in SSTs, ocean thermal structure, winds and clouds, due to its strongly coupled dynamics (e.g., Thompson et al., 2011; Bodas-Salcedo et al., 2014, 2016; Hermanson et al., 2018; Hyder et al., 2018). The lack of in situ data also limits our ability to improve remote sensing products and optimize blending of model and remote sensing inputs (e.g., Objectively Analyzed Flux – Yu and Weller, 2007), and increases uncertainty in atmosphere and ocean dynamics and boundary-layer thermodynamic processes. The consequent uncertainties in climate projections further hinder our ability to develop climate mitigation and adaptation measures. To assess and improve flux estimates and understand key processes in the SO there is an urgent requirement for accurate, direct air-sea-ice flux observations, and the meteorological variables on which they depend.
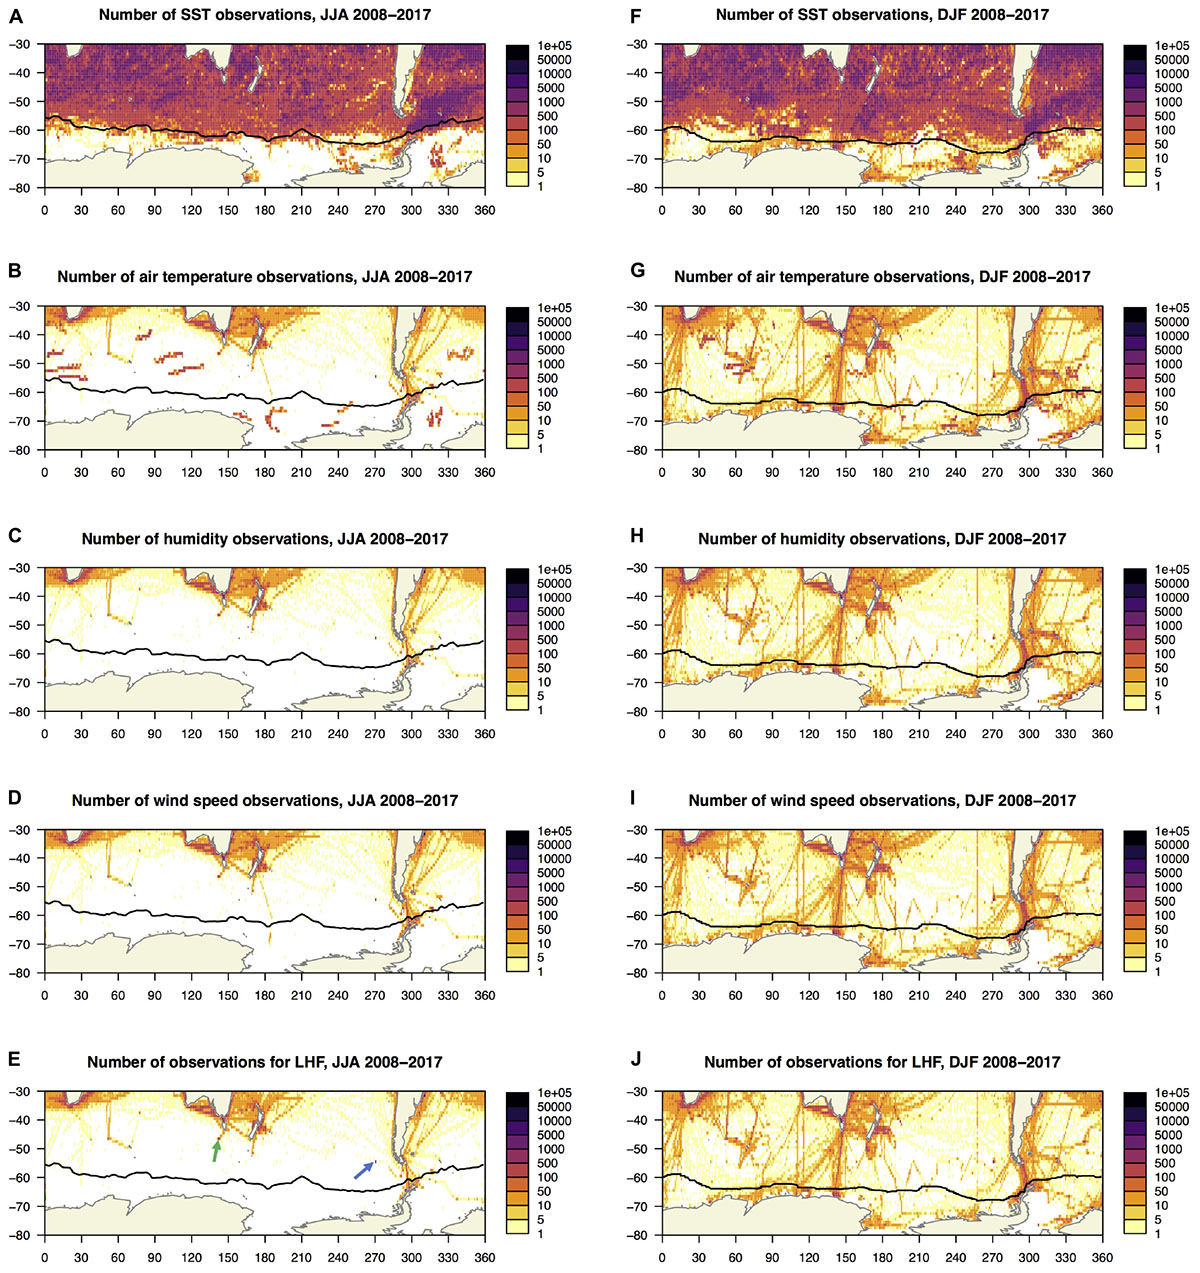
Figure 1. In situ observations count for critical air-sea flux ocean and atmospheric parameters for austral winter (June–August) on the left versus summer (December–February) on the right, for 10 years (2008–2017): (A,F) SST, (B,G) air temperature, (C,H) humidity, (D,I) wind speed, and (E,J) latent heat flux (LHF). Humidity observations include dew point temperature and relative humidity. LHF observations include co-located measurements of SST, air temperature, humidity and wind speed. Data from International Comprehensive Ocean-Atmosphere Data Set (ICOADS), as described by Freeman et al. (2017). The two existing surface mooring sites, OOI and SOFS, are indicated in panel (E) using a blue and green arrow, respectively. Black contour denotes the 10-year mean of the 15% sea ice concentration from NCEP/DOE AMIP-II Reanalysis, representing the sea-ice edge in winter (left panels) and summer (right panels).
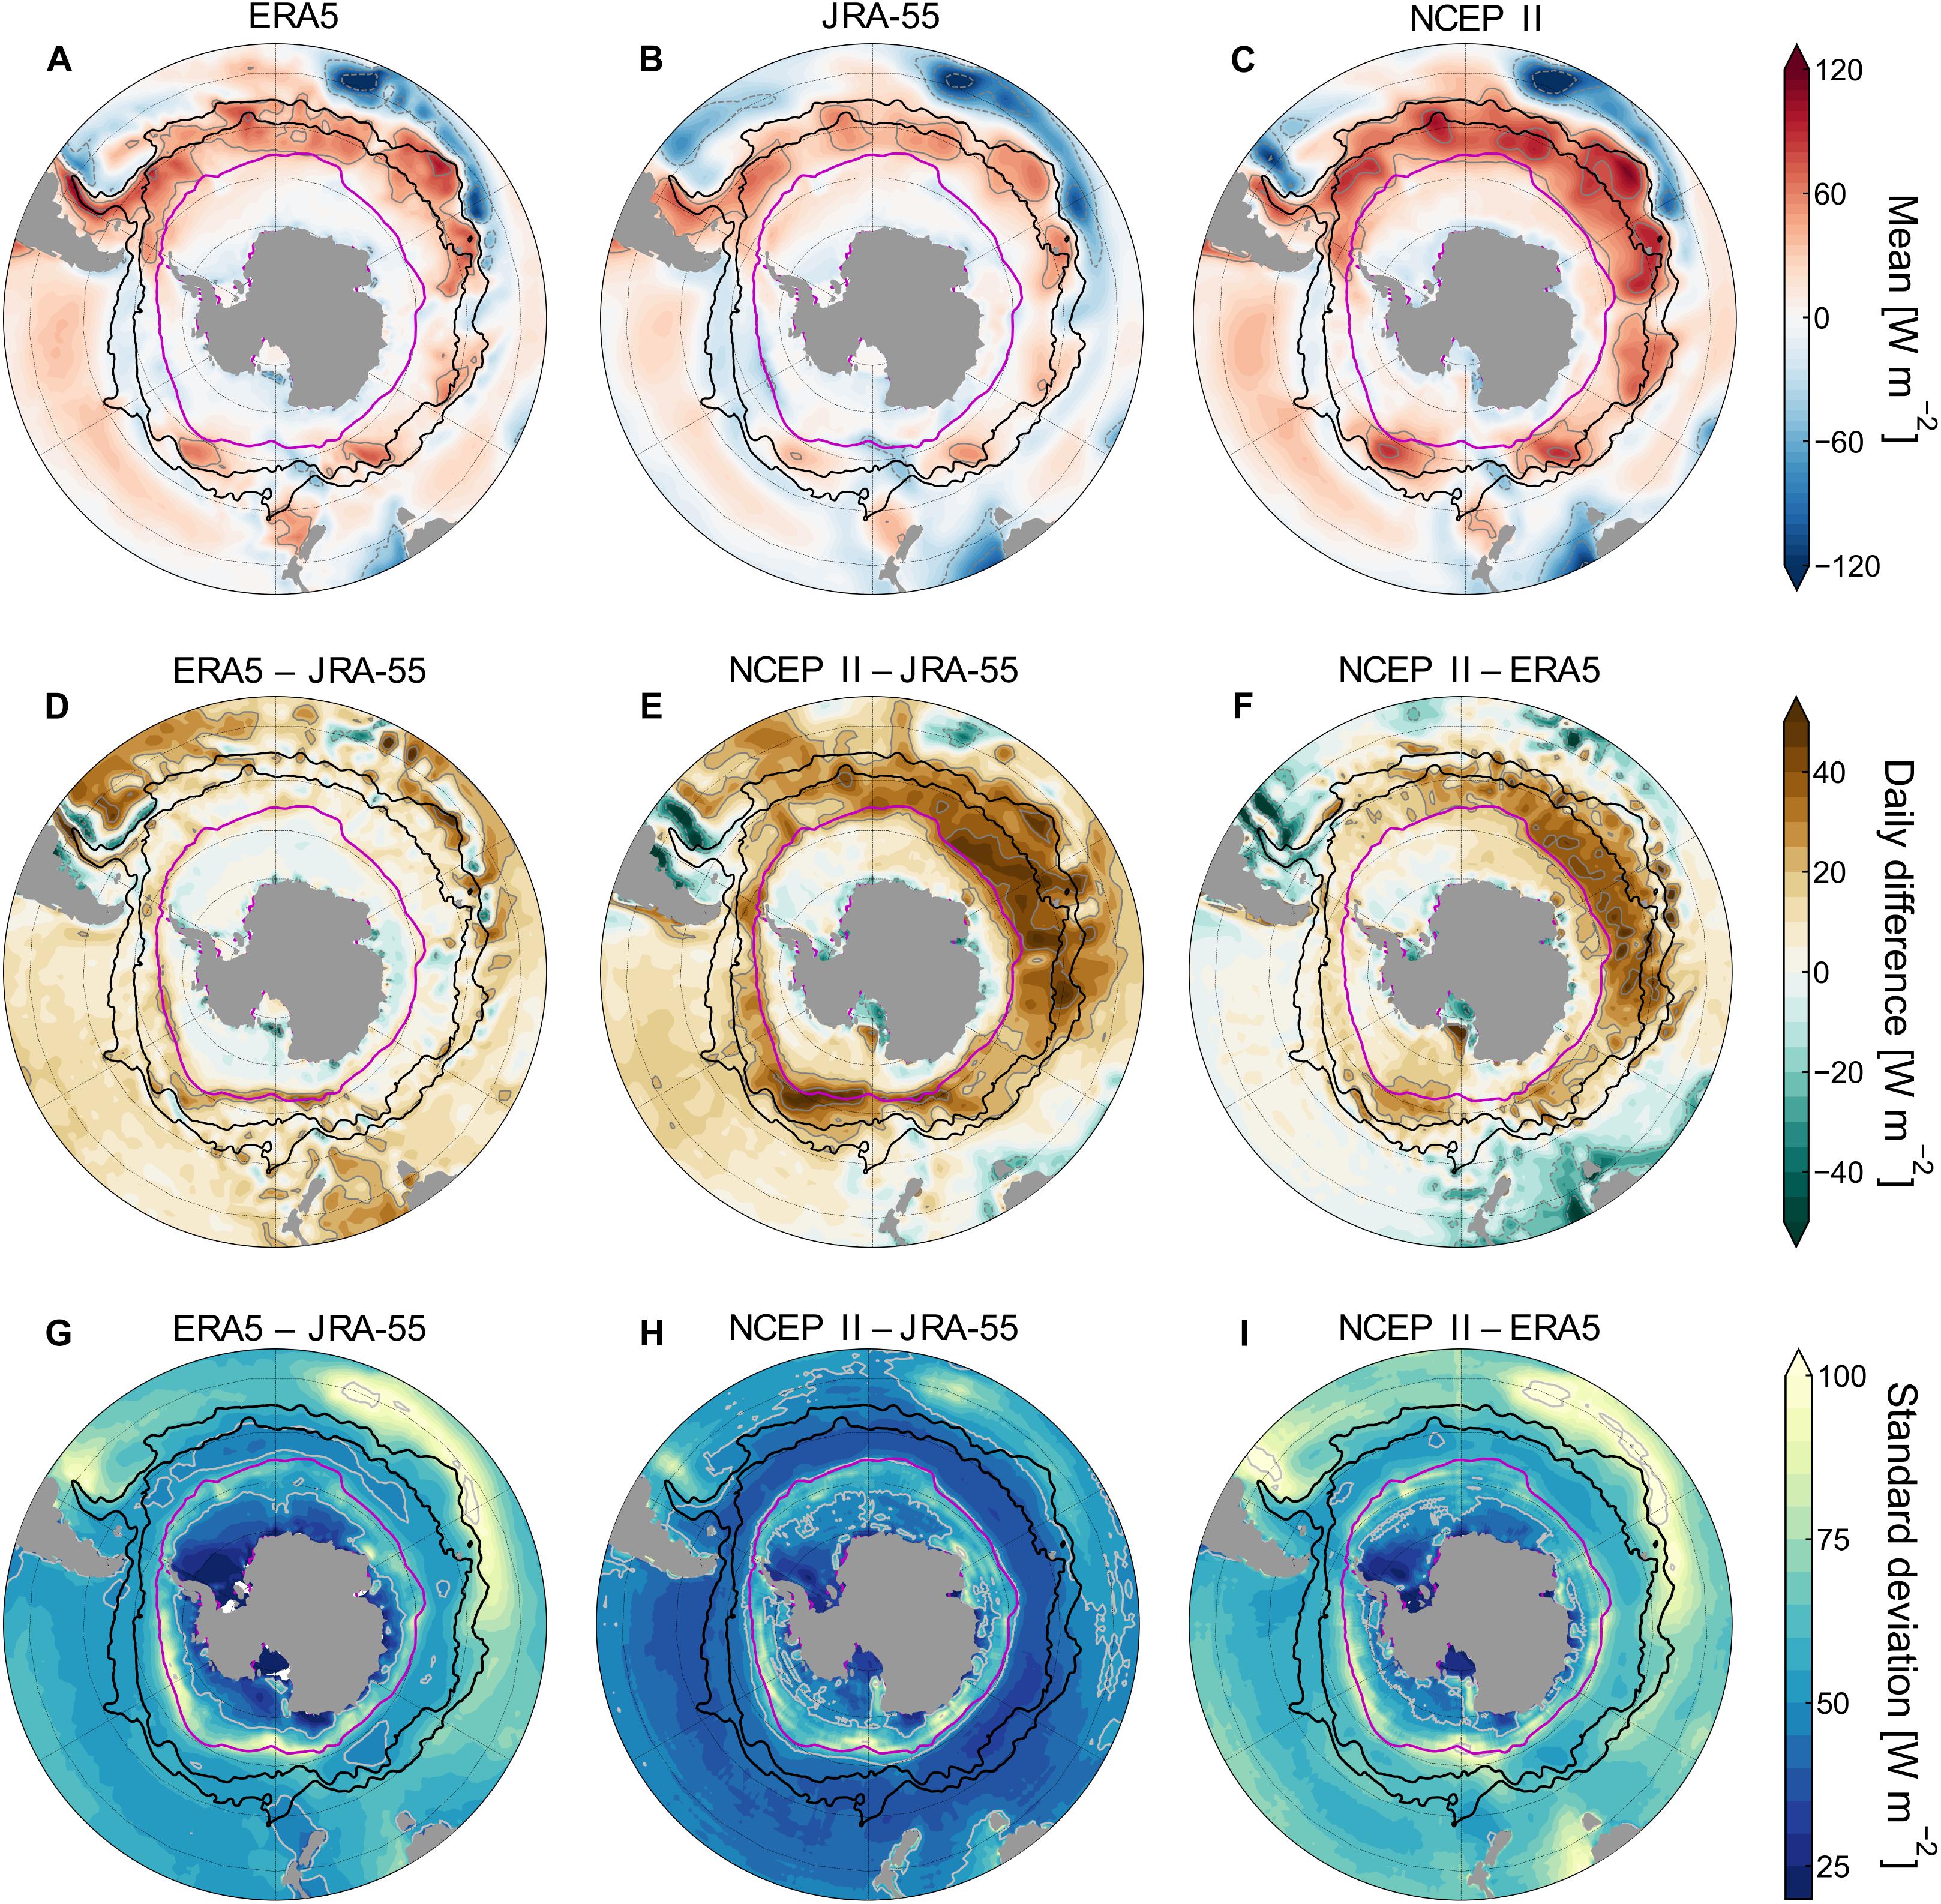
Figure 2. (A–C) The 10-year (2008–2017) mean net heat flux (W m–2) for three reanalysis products: ERA5, JRA-55 and NCEP-II. (D–F) The 10-year mean difference in daily net heat flux (in W m–2) between the products. (G–I) Standard deviation of the daily differences (in W m–2) shown in panel (D–F). Positive (negative) values denote a heat flux into (out of) the ocean. Magenta line denotes the 10-year mean of the 15% sea ice concentration from NCEP/DOE AMIP-II Reanalysis representing the maximum sea-ice edge. Gray lines contour the mean (–120 to 120 W m–2 intervals of 40 W m–2), the daily difference (–40 to 40 W m–2 intervals of 20 W m–2), and standard deviation (50 and 100 W m–2). Solid (dashed) contours represent positive (negative) values. Black contours indicate the 10-year mean position of the Sub-Antarctic Front (north) and Antarctic Polar Front (south) from the AVISO Absolute Dynamic Topography (as in Swart et al., 2010).
This paper builds on the high-latitude flux review of Bourassa et al. (2013). The objectives of this paper are to highlight the Southern Ocean-specific observational gaps, scales, and challenges in estimating air-sea-ice fluxes, to summarize key focus areas for future flux research, and to offer recommendations for improving estimates of fluxes. In particular, recent technological progress, such as surface flux moorings and autonomous surface vehicles, provide new mechanisms to improve high-latitude flux observations and research in the coming decade. For details on broad-scale heat and momentum fluxes for the global ice-free ocean the paper by Cronin et al. (2019) should also be referred to. This paper articulates a charge for the SO air-sea flux community to come together to plan, collect and share air-sea-ice flux information, experience and knowledge. It is a product of the Southern Ocean Observing System (SOOS) international working group on SO air-sea fluxes (SOFLUX; Gille et al., 2016), which coordinates observing-system capabilities and requirements for SO air-sea-ice fluxes.
Key Spatial and Temporal Scales of Fluxes
The short time- and length-scale variability of SO air-sea fluxes makes quantifying exchanges challenging (Lenton et al., 2006; Monteiro et al., 2015). This variability is predominantly driven by the high-frequency structure of winds (Yuan et al., 2009) and high-wavenumber structure of the ocean state (Chelton et al., 1998). However, one may exploit the low-frequency variability of ocean properties and low-wavenumber structure of the atmospheric properties to constrain the fluxes. For example, Observing System Simulation Experiments (OSSEs) show that the Argo float array is able to constrain the upper-ocean climate signals of heat, carbon, and freshwater content on seasonal timescales (Majkut et al., 2014; Kamenkovich et al., 2017; Mazloff et al., 2018). Spatial and temporal integrals of oceanic heat content change provide information on net heat fluxes, which can be used to assess biases in the bulk formulae derived from point measurements. Yet large-scale budgets do not provide information about the mechanisms driving small-scale air-sea fluxes, which are vital to understanding the system and can be revealed by in situ time-series observations (Ogle et al., 2018).
SOFLUX has prioritized the collection of high-quality in situ point measurements necessary to understand true small-scale flux variability, while also measuring the large-scale properties that reveal integrated flux values. High-frequency measurements suggest that Subantarctic air-sea CO2 fluxes should be measured at a 3-day frequency to provide an unbiased constraint, particularly during the more stratified summer period. Sampling at lower temporal frequency would potentially alias the more rapid response of mixing and entrainment to storm events (Monteiro et al., 2015). Alternatively, Mazloff et al. (2018) suggest that maintaining platforms every 20° longitude by 6° latitude would constrain the climate-scale heat and carbon inventory, and validate integrated air-sea fluxes. While fluxes themselves have significant high-frequency variability, the low-frequency component has large spatial scales of approximately 90° longitude by 10° latitude. Climate-scale fluxes for the ocean between 35°S and 70°S, could therefore be determined with 100 optimally spaced platforms. The current Argo array of >600 floats results in non-negligible uncertainty in estimating climate signals, with crucial gaps in the sea-ice impacted regions (Mazloff et al., 2018). Nevertheless, the results imply that reducing uncertainty in fluxes and their parameterizations, is feasible. Statistical significance of observed trends will improve as fixed-point time series are sustained. Constraining the marginal ice zone (MIZ), however, remains a priority (Figures 1A,F).
Status of Flux Reanalyses and Requirements to Reduce Uncertainty
Gridded satellite and reanalysis datasets in the SO suffer from a large inter-product spread in estimates of the net air-sea heat flux (e.g., Liu et al., 2011), stemming from insufficient observations, particularly in winter (Figures 1A–E), and the need to determine the net exchange as the sum of four individual components (latent – Figures 1E,J, sensible, shortwave, longwave; Bentamy et al., 2017). Evaluation of the spread in net heat flux between atmospheric reanalysis products has revealed regional differences up to 60 Wm–2 (Liu et al., 2011). These differences persist when zonally averaged and show ship-based and reanalysis products differing by 30–40 Wm–2 at a given latitude (e.g., Josey et al., 2013).
To further demonstrate first-order uncertainties around SO air-sea fluxes, a comparison is made between three commonly used reanalysis products of net heat flux (NCEP-II, ERA5, and JRA-55; Figure 2). Large mean state (10 year) differences (up to 50 W m–2; Figures 2A–C) and mean daily differences (reaching up to 40 W m–2; Figures 2D–F) exist between products for large swaths of the SO (e.g., in Figure 2E: mean daily differences >20 W m–2 for 35% of area south of 35°S), particularly in the NCEP-II comparisons. These differences are highest in the central Antarctic Circumpolar Current (ACC) domains, at the boundaries to strong subtropical originating currents (Malvinas Confluence and Agulhas Return Current), and around the southern ACC to the edge of the winter sea-ice extent (especially in the Pacific and Indian sectors). The standard deviation of these daily differences (Figures 2G–I) emphasizes the larger range of differences (reaching > 100 W m–2) found in both the northern ACC domain and at the winter sea-ice edge and extending into the MIZ. The larger uncertainty associated with the edge or within sea-ice regions suggests complexities in constraining fluxes impacted by ice-ocean processes and/or the limitation of satellites/reanalysis products to estimate fluxes in ice-impacted domains (Yu et al., 2017). Strong ocean gradients at the boundary to the subtropical gyres could be leading to enhanced heat flux differences (Figures 2D–I; see section “Ocean Impact on Fluxes”) and these regions should be targeted for enhanced observational coverage to reduce uncertainty (see section “Specific Recommendations for the Coming Decade”).
The momentum (wind stress) flux is better determined in a climatological sense than the heat flux, as it is a function of fewer, more easily determined variables that are reasonably estimated from satellite observations. However, significant wind speed differences still exist between gridded products and in situ data (Schmidt et al., 2017) with biases of up to 7.5 m s–1 depending on the wind speed magnitude (higher wind speeds are subject to considerably higher errors). Consequently, there is only medium confidence that SO wind-stress forcing has strengthened on decadal timescales (Swart and Fyfe, 2012; Rhein et al., 2013) as is expected from coupled model-based studies (Russell et al., 2018).
Given the uncertainties noted above, improvement in SO heat and momentum flux accuracies is vital. This has long been recognized (e.g., OceanObs′99 and ′09 – Fairall et al., 2010) and the deployment of two surface flux moorings1 is progressing towards this goal. The time-series are currently insufficient to evaluate whether reanalysis products accurately represent interannual and decadal variability, thus sustaining these time-series is key to reducing these uncertainties. Recently, analysis of ship data across the open ocean to the MIZ has enabled better understanding of air-sea interaction in this key transition region (Yu et al., 2017), although winter measurements remain lacking (Figure 1).
Ocean Impact on Fluxes
The exchange of tracers and energy across the air-sea interface is modulated by a complex upper-ocean “mixed layer” structure (Kilbourne and Girton, 2015). Instruments that quantify upper-ocean turbulence (e.g., Air-Sea Interaction Profiler; Ward et al., 2014) provide direct estimates of the mixing and mixed-layer depths from measurements of the dissipation rate of turbulent kinetic energy (ε) and density (ρ), respectively. Combined with velocity scales associated with wind, wave, and buoyancy (e.g., after Belcher et al., 2012), improved parameterizations of mixing in the SO can be determined. It is anticipated turbulence from wave breaking and Langmuir circulation will play a dominant role in the turbulence generation and scaling (Esters et al., 2018). As ocean turbulence is a major driver for air-sea fluxes, such studies will lead to improved parameterizations in the SO.
Additionally, small-scale turbulence in the mixed-layer is influenced by oceanic motions spanning a few hundred meters (submesoscale) to hundreds of kilometers (mesoscale). For example, Ardhuin et al. (2017) show a strong covariance of mesoscale currents and surface-wave energy, especially in the Drake Passage. This implies a change in mesoscale surface roughness and thus effective surface-ocean stress (Small et al., 2008; O’Neill et al., 2012). This dependence impacts gas exchange via surface wave breaking (Brumer et al., 2017), although the magnitude remains to be directly measured. Furthermore, remote-sensing products indicate up to 20% of South Atlantic turbulent heat flux variance is explained by mesoscale eddies (Villas Bôas et al., 2015; Figure 2). Autonomous surface vehicles (ASVs) are key for augmenting in situ measurements of surface ocean variability, which is dominated by small-scale, submesoscale gradients (Thomson and Girton, 2017). Strong coupling exists between both waves and surface currents as well as between oceanic and atmospheric temperatures (Villas Bôas et al., 2015). This supports earlier work showing that fronts and eddies (and associated SST gradients) can substantially impact the air-sea exchange and near-surface atmospheric conditions in vigorous SO boundary-current regions (Pezzi et al., 2005, 2009; Messager et al., 2012; de Camargo et al., 2013; Rouault et al., 2016).
Submesoscale (0.1–20 km) lateral density gradients in the upper ocean can also significantly modulate the depth of the mixed-layer on sub-seasonal time scales (Rosso et al., 2015; du Plessis et al., 2017, 2019), with implications for heat and carbon uptake, water mass modification due to surface buoyancy fluxes, and the timing of biological processes (Swart et al., 2015). The intensity of these features is strongly localized by the circulation of the ACC and its interaction with topographic features (Viglione et al., 2018). The MIZ may also be a site of enhanced vertical velocities due to the coupling between thin sea ice and near-surface oceanic flows (Manucharyan and Thompson, 2017). This can lead to enhanced lateral and vertical heat fluxes toward sea-ice, as well as modifying air-sea fluxes through, for example, changes in sea-ice concentration and floe size distributions (Horvat et al., 2016).
Observing Fluxes Through Ice
Sea-ice presence and concentration dramatically affect physical, gas, and aerosol fluxes (Bourassa et al., 2013), which in turn, provide a significant feedback to sea-ice state, extent, and thickness (e.g., Perovich et al., 2008). As sea-ice parameters change in a warming climate, a significant adjustment in the balance of the high-latitudes air-sea-ice fluxes is likely. Ice-covered regions of the SO are acutely under sampled, especially in autumn and winter – with the hypothesis that open water in autumn before freeze-up is exposed to enhanced wind stress and mixing, amplifying air-sea exchange. Fluxes within open waters surrounded by sea ice (MIZ, leads and polynyas) can be estimated by classical approaches, but must account for (i) logistical constraints and (ii) ice-specific processes, such as reduced fetch area, wave attenuation and scattering, shear in the ice-ocean boundary layer, buoyant convection or stratification, short period gravity waves, and ice–flow interactions.
Air-sea-ice fluxes are ‘in this sense’ dramatically different from air-sea fluxes and often require separate methodology. For instance, heat flux budgets require assessment of sea-ice growth using ice mass-balance buoys, which provide spatially restricted point-measurements and require consolidated ice for deployment (i.e., not on unconsolidated ice formed in polynyas). While sea-ice processes drive gas fluxes at the air-sea-ice interface, assessment of these fluxes must take into account the unique gas dynamics and transport within sea ice, which are derived from techniques used for terrestrial fluxes. In addition, snow load and structure affect energy and gas transfer in different ways and are poorly constrained.
Finally, budgeting fluxes in ice-covered regions requires understanding of spatial and temporal variability of the sea-ice cover (Schröder et al., 2003; Matear et al., 2015), for which remote sensing is critical. However, deriving sea-ice volume, growth, type, temperature, snow load and structure, and momentum absorption from remote sensing is challenging. These properties are not measured directly and require models that are prone to errors. Further field process studies (see section “Specific Recommendations for the Coming Decade”) are needed in sea ice to constrain these uncertainties so as to improve the accuracy of fluxes that are reliant on satellite-derived information about sea ice characteristics.
Technological Requirements for the Coming Decade
SO flux observations are almost exclusively collected by ships, with valuable time-series observations provided by two moored surface buoys (Figure 1). Expansion of these observing systems are necessary (see recommendation 1 below). Yet, ships suffer superstructure flow distortion effects on measurement accuracy (Yelland et al., 2002) and collect data for relatively short periods (days to weeks), while moorings provide point-location estimates and have significant maintenance costs. Detailed flow distortion calculations for research vessels operating in the SO would help improve the analysis of ship-based flux observations (e.g., Moat et al., 2006). Studies of the flow distortion around the towers of surface moorings shows minimal impact on wind velocity, although buoy position should be tracked to allow the wind observations relative to the buoy to be corrected to absolute wind velocity. More significant challenges involve coping with icing, surface waves and sea birds and so improvements to current surface buoy designs are recommended. These include phasing-in heating of key sensors to prevent ice and frost build up, including anemometers and radiometers, adding cameras to document icing (being implemented on Irminger Sea Buoy) and actively ventilating air temperature and humidity sensor enclosures. In addition, incorporation of turbulent flux sensors (3-D sonic anemometers, fast response humidity, and temperature) and platform attitude and motion sensors can be done now to allow computation of the turbulent fluxes by the Direct Covariance Flux methods (Edson et al., 1998).
Recent advances in relatively cheap, small (2–7 m) and robust ASV with associated miniaturized sensors, improved battery capacity and energy harvesting, are demonstrating the capability to collect multi-month time-series of high-resolution air-sea flux and meteorology observations. The latest generation of ASV, such as Wave Gliders and Saildrone, have been deployed successfully in the SO (Monteiro et al., 2015; Schmidt et al., 2017; Thomson and Girton, 2017). Key technical issues for ASV flux measurements center on the low height of the atmospheric measurements and the effect of platforms tilts on observations, such as incoming shortwave and longwave radiation. Bulk algorithms for estimating fluxes rely on the gradients beyond the ocean-atmosphere interface, which increase (and therefore are more reliably measured) with height. Very close to the surface, these measurements may have an insufficient signal-to-noise ratio. Further, measurements within the wave-affected portion of the atmospheric boundary layer may not be appropriate for comparison to the larger scale fluxes used in circulation models (e.g., Schmidt et al., 2017). These issues require careful calibration and validation over the full dynamic range of conditions.
The question now becomes how best to coordinate the distribution of these assets to ensure collection of high-quality data for end users, including agreement on data standards and management. To date, ASV deployments have been short-term project-based missions. A sustained and coordinated effort to deploy multiple ASVs (and Lagrangian platforms – SWIFT/drifting buoys) in the SO, potentially centered around key mooring sites, will require international resources and effort (see Newman et al., 2019). This type of system will address the data gaps between sparse vessel-based observations and achieve year-round presence in harsh/remote regions. In order to achieve this vision, recommended enhancements include; extending deployment duration (harness alternate forms of energy from current or wind; improved battery capability), autonomous piloting techniques (on-board route decision making), ocean/atmosphere feature tracking and automated coordination between platforms, and upper ocean profiling (e.g., automated hydrographic casts). Additionally, year-round flux observations in the seasonal ice-covered regions of the SO are required. Given that current ASV technology is limited to the ice-free ocean, new technologies need to be developed for the unique characteristics of Antarctic sea ice, which largely melts and reforms on an annual basis thereby not allowing for multi-season installations of platforms that are proven capabilities in the Arctic (e.g., Ice Tethered Profilers, Arctic Ocean Flux Buoys, and meteorological stations). One approach could be surface floating platforms that are able to withstand being frozen into the ice pack and then continue to operate once the sea ice melts and releases the platform into the ocean until the next freezing period (e.g., UpTempO buoys).
Unmanned aerial vehicles (UAV) are a new platform supplementing flux sensing capabilities from existing platforms, with duration of fixed-wing missions of up to 24 h. UAVs, like satellites and aircraft, can provide a synoptic view of a relatively large area, while providing unprecedented ground resolutions (as fine as 1 cm) due to their slower speed, making for an exciting approach for process studies in particular. Significant progress has been made in developing cutting-edge UAV payloads for air-sea turbulent fluxes, radiative fluxes, surface albedo, SST variability, ocean surface waves, and ocean biogeochemistry (e.g., Reineman et al., 2016). Applications for UAVs in air-sea interaction have been demonstrated in polar seas, such as from polynyas (Cassano et al., 2010) and the MIZ.
Specific Recommendations for the Coming Decade
Targeted Field Observations
Enhanced flux observations are required almost everywhere (Figure 1), however, we particularly require them in (i) varying conditions (e.g., transient events/storms, different types of sea-ice, and sea state); (ii) regions with higher uncertainty and variability in reanalyses (marked on Figure 2, see section “Status of Flux Reanalyses and Requirements to Reduce Uncertainty”), which are predominantly in the boundary regions of the SO (e.g., Agulhas Return Current, Malvinas Current region), regions prone to higher energetics/eddy kinetic energy (e.g., downstream of Campbell Plateau, Drake Passage), and in the seasonal ice zone, especially in the region of the winter maximum sea ice extent. Further, SOFLUX recommends efforts towards achieving year-round time-series (i.e., mooring sites supplemented with new technologies, such as ASVs that can provide a spatial length-scale component to the time-series observations). Seasonally, the autumn and winter are priority periods to obtain even the most basic flux-related observations. Given that almost no flux-related observations exist in the seasonal and permanent sea-ice covered regions (approximately the entire SO south of 60°S), the community should see this as one of the highest priorities with potentially the most important priority being areas prone to abrupt flux events driven by spurious gaps in the sea ice (from coastal and open ocean polynyas down to the scale of leads in the pack ice). The SOCCOM float array is starting to address this, especially in the seasonal ice zone, but higher “carbon capable” (pH) float density is needed (further guidelines for density in Mazloff et al., 2018). OSSEs are valuable for optimizing the quantity and locations of time-series measurements, and flow distortion studies would enable better interpretation of vessel flux observations.
Dedicated Studies to Understand Air-Sea-Ice Flux Processes
Process studies are critical to improve flux and model parameterizations. Experiments from both poles would deliver process information on fluxes under various conditions. Studies should leverage existing flux time-series provided by mooring sites to enhance understanding of annual and inter-annual flux variability. More specifically, observations able to resolve intra-seasonal processes and variability that impact fluxes are needed, such as those associated with oceanic eddies and fronts or the passage of atmospheric storms. This would provide insight into the temporal-spatial scales over which the atmosphere and ocean respond to changes imposed by the other. This justifies targeted process studies aimed at measuring flux differences over the scale of the first baroclinic Rossby radius (50 km or less) and over strong oceanic (temperature) gradients. Further detail can also be found in Newman et al. (2019).
Improve Satellite Flux Capabilities
Satellite retrievals of air-sea-ice fluxes pose a series of challenges, many of which are addressed by Bourassa et al. (2013). The challenges vary depending on the flux: (1) Momentum fluxes are well measured by scatterometers, but the global network of scatterometers does not provide the spatio-temporal coverage that is desired for tracking rapidly evolving and otherwise poorly sampled SO storms. The proposed SKIM (waves and currents) and WaCM (winds and currents) missions would be particularly valuable for assessing the direct transfer of momentum from atmosphere to wave and current fields. (2) Turbulent heat fluxes are typically inferred using bulk formulae from ship or buoy measurements. Satellites do not provide measurements of temperature and humidity in the planetary boundary layer that are necessary to apply bulk formulae, but they can measure properties of the ocean surface. Therefore, further work to develop reliable retrievals of turbulent heat fluxes would be valuable, particularly for the high wind, high sea spray conditions typical of the SO. The small Rossby radius in the SO means narrow frontal features (ACC fronts and eddies) have the potential to influence fluxes significantly, but are not necessarily well resolved in existing retrievals – high spatial resolution would be of value. (3) Freshwater fluxes depend on precipitation and evaporation. The Global Precipitation Mission estimates precipitation, but only in the latitude range from 65°S to 65°N (missing snow and rain within the Antarctic circle). Future satellite missions providing full coverage of the high latitudes would be valuable towards constraining air-sea-ice freshwater fluxes.
Accessibility of Data
Flux and meteorological data must be made more accessible, with uniformity of data processing and quality control. Polar-specific data discovery may be a way to address this (e.g., through SOOSmap). Likewise, the efforts of the Shipboard Automated Meteorological and Oceanographic System (SAMOS), which collects flux-related data from vessels and provides data collection standardization information and targets, needs to be supported/expanded (see Smith et al., 2015, 2019). Furthermore, increased field and vessels access to conduct flux measurements (e.g., available ship berth space or sensor installations) should be encouraged. The SOOS tool “DueSouth: Database of Upcoming Expeditions to the SO” provides support towards this end.
Author Contributions
SS and SG conceptualized the manuscript with inputs from the SOFLUX working group and wrote the first draft of the manuscript. AT, BdS, JT, SJ, MM, and BW led the sections of the manuscript. SS, EK, MdP, and MM conceptualized and developed the figures. All authors contributed to the writing of the manuscript and read and approved its final version.
Funding
SS was funded by a Wallenberg Academy Fellowship (WAF 2015.0186). EK was funded by the NERC ORCHESTRA Project (NE/N018095/1). LP was funded by the Advanced Studies in Oceanography of Medium and High Latitudes (CAPES 23038.004304/2014-28) and the Research Productivity Program (CNPq 304009/2016-4). BdS was a research associate at the F.R.S-FNRS. PeH was supported by the Australian Antarctic Science Projects 4301 and 4390, and the Australian Government’s Cooperative Research Centres Programme through the Antarctic Climate and Ecosystems Cooperative Research Centre and the International Space Science Institute Project 406. SG and MM were funded by National Science Foundation awards OCE-1658001 and PLR-1425989. AT was supported by NASA (NNX15AG42G) and NSF (OCE-1756956).
Conflict of Interest Statement
The authors declare that the research was conducted in the absence of any commercial or financial relationships that could be construed as a potential conflict of interest.
Acknowledgments
This manuscript is a contribution to the Southern Ocean Air-Sea Flux (SOFLUX) capability working group of the SCAR-SCOR Southern Ocean Observing System (SOOS). SOFLUX thanks the SCAR and SCOR for financial support in order to host meetings and support travel. The ICOADS data was acquired at the National Center for Atmospheric Research, Computational and Information Systems Laboratory, Boulder, CO, United States (available online at https://doi.org/10.5065/D6ZS2TR3). The three satellite-reanalysis products used include: (1) NCEP_ Reanalysis 2 data provided by the NOAA/OAR/ESRL PSD, Boulder, CO, United States, available at www.esrl.noaa. gov/psd/; (2) ERA5 is generated using Copernicus Climate Change Service Information, available at www.ecmwf.int/en/forecasts/datasets/archive-datasets/reanalysis-datasets/era5; and (3) JRA-55: Japanese 55-year Reanalysis, available at: https://doi.org/10.5065/D6HH6H41.
Footnotes
- ^ Integrated Marine Observing System (IMOS) SO Flux Station (SOFS) south of Tasmania (Schulz et al., 2012) and the Ocean Observatories Initiative (OOI) mooring upstream of Drake Passage at 55°S, 90°W (Ogle et al., 2018).
References
Andrews, T., Gregory, J. M., and Webb, M. J. (2015). The dependence of radiative forcing and feedback on evolving patterns of surface temperature change in climate models. J. Clim. 28, 1630–1648. doi: 10.1175/jcli-d-14-00545.1
Ardhuin, F., Gille, S. T., Menemenlis, D., Rocha, C. B., Rascle, N., Chapron, B., et al. (2017). Small-scale open ocean currents have large effects on wind wave heights. J. Geophys. Res. Oceans 122, 4500–4517. doi: 10.1002/2016JC012413
Belcher, S. E., Grant, A. L. M., Hanley, K. E., Fox-Kemper, B., Van Roekel, L., Sullivan, P. P., et al. (2012). A global perspective on Langmuir turbulence in the ocean surface boundary layer. Geophys. Res. Lett. 39:L18605. doi: 10.1029/2012GL052932
Bentamy, A., Piollé, J. F., Grouazel, A., Danielson, R., Gulev, S., and Paul, F. (2017). Review and assessment of latent and sensible heat flux accuracy over the global oceans. Remote Sens. Environ. 201, 196–218. doi: 10.1016/j.rse.2017.08.016
Bodas-Salcedo, A., Hill, P. G., Furtado, K., Williams, K. D., Field, P. R., Manners, J. C., et al. (2016). Large contribution of supercooled liquid clouds to the solar radiation budget of the Southern Ocean. J. Clim. 29, 4213–4228. doi: 10.1175/jcli-d-15-0564.1
Bodas-Salcedo, A., Williams, K. D., Ringer, M. A., Beau, I., Cole, J. N. S., Dufresne, J. L., et al. (2014). Origins of the solar radiation biases over the Southern Ocean in CFMIP2 models. J. Clim. 27, 41–56. doi: 10.1175/jcli-d-13-00169.1
Bourassa, M. A., Gille, S. T., Bitz, C., Carlson, D., Clayson, C. A., and Cerovecki, I. (2013). High-latitude ocean and sea ice surface fluxes: challenges for climate research. Bull. Am. Met. Soc. 94, 403–423. doi: 10.1175/bams-d-11-00244.1
Brumer, S. E., Zappa, C. J., Blomquist, B. W., Fairall, C. W., Cifuentes-Lorenzen, A., Edson, J. B., et al. (2017). Wave-related reynolds number parameterizations of CO2 and DMS transfer velocities. Geophys. Res. Lett. 44, 9865–9875. doi: 10.1002/2017GL074979
Cassano, J. J., Maslanik, J. A., Zappa, C. J., Gordon, A. L., Cullather, R. I., and Knuth, S. L. (2010). Observations of antarctic polynya with unmanned aircraft systems. Eos Trans. Am. Geophys. Union 91, 245–246. doi: 10.1029/2010EO280001
Chelton, D. B., deSzoeke, R. A., Schlax, M. G., El Naggar, K., and Siwertz, N. (1998). Geographical variability of the first baroclinic rossby radius of deformation. J. Phys. Oceanogr. 28, 433–460. doi: 10.1175/1520-04851998028<0433:GVOTFB<2.0.CO;2
Cronin, M., Gentemann, C. L., Edson, J., Ueki, I., Bourassa, M., Brown, S., et al. (2019). Air-sea fluxes with a focus on heat and momentum. Front. Mar. Sci. doi: 10.3389/fmars.2019.00430
de Camargo, R., Todesco, E., Pezzi, L. P., and de Souza, R. B. (2013). Modulation mechanisms of marine atmospheric boundary layer at the Brazil-Malvinas confluence region. J. Geophys. Res. Atmos 118, 6266–6280. doi: 10.1002/jgrd.50492
Dong, S., Gille, S. T., and Sprintall, J. (2007). An assessment of the Southern Ocean mixed layer heat budget. J. Clim. 20, 4425–4442. doi: 10.1175/JCLI4259.1
du Plessis, M., Swart, S., Ansorge, I. J., and Mahadevan, A. (2017). Submesoscale processes promote seasonal restratification in the Subantarctic Ocean. J. Geophys. Res. 122, 2960–2975. doi: 10.1002/2016jc012494
du Plessis, M. D., Swart, S., Ansorge, I. J., Mahadevan, A., and Thompson, A. F. (2019). Southern Ocean seasonal restratification delayed by submesoscale wind-front interactions. J. Phys. Ocean. 49, 1035–1053. doi: 10.1175/JPO-D-18-0136.1
Edson, J. B., Hinton, A. A., Prada, K. E., Hare, J. E., and Fairall, C. W. (1998). Direct covariance flux estimates from mobile platforms at sea. J. Atmos. Ocean. Technol. 15, 547–562. doi: 10.1175/1520-0426015<0547:DCFEFM<2.0.CO;2
Esters, L., Breivik, Ø, Landwehr, S., ten Doeschate, A., Sutherland, G., Christensen, K. H., et al. (2018). Turbulence scaling comparisons in the ocean surface boundary layer. J. Geophys. Res. 123, 2172–2191. doi: 10.1002/2017JC013525
Fairall, C. W., Barnier, B., Berry, D. I., Bourassa, M. A., Bradley, E. F., and Clayson, C. A. (2010). “Observations to quantify air-sea fluxes and their role in climate variability and predictability,” in Proceedings of OceanObs′09: Sustained Ocean Observations and Information for Society, 2, eds J. Hall, D. E. Harrison, and D. Stammer (Paris: European Space Agency), 299–313.
Freeman, E., Woodruff, S. D., Worley, S. J., Lubker, S. J., Kent, E. C., Angel, W. E., et al. (2017). ICOADS release 3.0: a major update to the historical marine climate record. Int. J. Climatol. 37, 2211–2232. doi: 10.1002/joc.4775
Frölicher, T. L., Sarmiento, J. L., Paynter, D. J., Dunne, J. P., Krasting, J. P., Winton, M., et al. (2015). Dominance of the Southern Ocean in anthropogenic carbon and heat uptake in CMIP5 models. J. Clim. 28, 862–886. doi: 10.1175/jcli-d-14-00117.1
Gille, S., Josey, S., and Swart, S. (2016). New approaches for air-sea fluxes in the Southern Ocean. Eos 97. doi: 10.1029/2016EO052243
Hermanson, L., Ren, H. L., Vellinga, M., Dunstone, N. D., Hyder, P., Ineson, S., et al. (2018). Different types of drifts in two seasonal forecast systems and their dependence on ENSO. Clim. Dyn. 51, 1411–1426. doi: 10.1007/s00382-017-3962-9
Horvat, C., Tziperman, E., and Campin, J. M. (2016). Interaction of sea ice floe size, ocean eddies, and sea ice melting. Geophys. Res. Lett. 43, 8083–8090. doi: 10.1002/2016gl069742
Hyder, P., Edwards, J. M., Allan, R. P., Hewitt, H. T., Bracegirdle, T. J., Gregory, J. M., et al. (2018). Critical Southern Ocean climate model biases traced to atmospheric model cloud errors. Nat. Commun. 9:3625. doi: 10.1038/s41467-018-05634-2
Josey, S. A., Gulev, S., and Yu, L. (2013). “Exchanges through the ocean surface,” in Ocean Circulation and Climate: A 21st Century Perspective, eds G. Siedler, J. Church, W. J. Gould, and S. Griffies (Cambridge, MA: Academic Press), 115–140. doi: 10.1016/b978-0-12-391851-2.00005-2
Kamenkovich, I., Haza, A., Gray, A. R., Dufour, C. O., and Garraffo, Z. (2017). Observing system simulation experiments for an array of autonomous biogeochemical profiling floats in the Southern Ocean. J. Geophys. Res. Oceans 122, 7595–7611. doi: 10.1002/2017JC012819
Kilbourne, B. F., and Girton, J. B. (2015). Surface boundary layer evolution and near-inertial wind power input. J. Geophys. Res. 120:75067520.
Lenton, A., Matear, R. J., and Tilbrook, B. (2006). Design of an observational strategy for quantifying the Southern Ocean uptake of CO2. Glob. Biogeochem. Cycl. 20:GB4010.
Liu, J., Tingyin, X., and Chen, L. (2011). Intercomparisons of air–sea heat fluxes over the Southern Ocean. J. Clim. 24, 1198–1211. doi: 10.1175/2010jcli3699.1
Majkut, J. D., Carter, B. R., Frölicher, T. L., Dufour, C. O., Rodgers, K. B., and Sarmiento, J. L. (2014). An observing system simulation for Southern Ocean carbon dioxide uptake. Philos. Trans. R. Soc. 372:20130046. doi: 10.1098/rsta.2013.0046
Manucharyan, G. E., and Thompson, A. F. (2017). Submesoscale sea ice-ocean interactions in marginal ice zones. J. Geophys. Res 122, 9455–9475. doi: 10.1002/2017jc012895
Matear, R. J., O’Kane, T. J., Risbey, J. S., and Chamberlain, M. (2015). Sources of heterogeneous variability and trends in Antarctic sea-ice. Nat. Commun. 6:8656. doi: 10.1038/ncomms9656
Mazloff, M. R., Cornuelle, B. D., Gille, S. T., and Verdy, A. (2018). Correlation lengths for estimating the large-scale carbon and heat content of the Southern Ocean. J. Geophys. Res. Oceans 123, 883–901. doi: 10.1002/2017jc013408
Messager, C., Speich, S., and Key, E. (2012). Marine atmospheric boundary layer over some Southern Ocean fronts during the IPY BGH cruise. Ocean Sci. 8, 1001–1023. doi: 10.5194/os-8-1001-2012
Moat, B. I., Yelland, M. J., Pascal, R. W., and Molland, A. F. (2006). Quantifying the airflow distortion over merchant ships. Part I: validation of a CFD Model. J. Atmos. Ocean. Technol. 23, 341–350. doi: 10.1175/JTECH1858.1
Monteiro, P. M. S., Gregor, L., Lévy, M., Maenner, S., Sabine, C. L., and Swart, S. (2015). Intraseasonal variability linked to sampling alias in air-sea CO2 fluxes in the Southern Ocean. Geophys. Res. Lett. 42, 8507–8514. doi: 10.1002/2015GL066009
Newman, L., Heil, P., Trebilco, R., Katsumata, K., Constable, A. J., van Wijk, E., et al. (2019). Delivering sustained, coordinated and integrated observations of the Southern Ocean for global impact. Front. Mar. Sci. doi: 10.3389/fmars.2019.00433
Ogle, S. E., Tamsitt, V., Josey, S. A., Gille, S. T., Ceroveèki, I., Talley, L. D., et al. (2018). Episodic Southern Ocean heat loss and its mixed layer impacts revealed by the furthest south multi-year surface flux mooring. Geophys. Res. Lett. 45, 5002–5010. doi: 10.1029/2017gl076909
O’Neill, L. W., Chelton, D. B., and Esbensen, S. K. (2012). Covariability of surface wind and stress responses to sea surface temperature fronts. J. Clim. 25, 5916–5942. doi: 10.1175/jcli-d-11-00230.1
Perovich, D. K., Richter-Menge, J. A., Jones, K. F., and Light, B. (2008). Sunlight, water, and ice: extreme Arctic sea ice melt during the summer of 2007. Geophys. Res. Lett. 35:L11501.
Pezzi, L. P., Souza, R. B., Acevedo, O., Wainer, I., Mata, M. M., Garcia, C. A. E., et al. (2009). Multiyear measurements of the oceanic and atmospheric boundary layers at the Brazil-Malvinas confluence region. J. Geophys. Res. 114:D19103. doi: 10.1029/2008JD011379
Pezzi, L. P., Souza, R. B., Dourado, M. S., Garcia, C. A. E., Mata, M. M., and Silva-Dias, M. A. F. (2005). Ocean-atmosphere in situ observations at the Brazil-Malvinas Confluence region. Geophys. Res. Lett. 32:L22603.
Reineman, B. D., Luc, L., and Melville, W. K. (2016). The use of ship- launched fixed-wing UAVs for measuring the marine atmospheric boundary layer and ocean surface processes. J. Atmos. Ocean. Technol. 33, 2029–2052. doi: 10.1175/jtech-d-15-0019.1
Rhein, M., Rintoul, S. R., Aoki, S., Campos, E., Chambers, D., Feely, R. A., et al. (eds) (2013). “Observations: ocean,” in Climate Change 2013: The Physical Science Basis. Contribution of Working Group I to the Fifth Assessment Report of the Intergovernmental Panel on Climate Change, ed T. F. Stocker, (Cambridge: Cambridge University Press).
Rintoul, S. R. (2018). The global influence of localised dynamics in the Southern Ocean. Nature 558, 209–218. doi: 10.1038/s41586-018-0182-3
Rosso, I., McC. Hogg, A., Kiss, A. E., and Gayen, B. (2015). Topographic influence on submesoscale dynamics in the Southern Ocean. Geophys. Res. Lett. 42, 1139–1147. doi: 10.1002/2014gl062720
Rouault, M., Verley, P., and Backeberg, B. (2016). Wind changes above warm agulhas current eddies. Ocean Sci. 12, 495–506. doi: 10.5194/os-12-495-2016
Russell, J. L., Kamenkovich, I., Bitz, C., Ferrari, R., Gille, S. T., Goodman, P. J., et al. (2018). Metrics for the evaluation of the Southern Ocean in coupled climate models and earth system models. J. Geophys. Res. Oceans 123, 3120–3143. doi: 10.1002/2017JC013461
Sabine, C. L., Feely, R. A., Gruber, N., Key, R. M., Lee, K., Bullister, J. L., et al. (2004). The Oceanic Sink for Anthropogenic CO2. Science 305, 367–371. doi: 10.1126/science.1097403
Schmidt, K. M., Swart, S., Reason, C., and Nicholson, S.-A. (2017). Evaluation of satellite and reanalysis wind products with in situ Wave Glider wind observations in the Southern Ocean. J. Atmos. Ocean. Tech 34. doi: 10.1175/JTECH-D-17-0079.1
Schröder, D., Vihma, T., Kerber, A., and Brümmer, B. (2003). On the parameterization of turbulent surface fluxes over heterogeneous sea ice surfaces. J. Geophys. Res. 108:3195.
Schulz, E. W., Josey, S. A., and Verein, R. (2012). First air-sea flux mooring measurements in the Southern Ocean. Geophys. Res. Lett. 39:L16606. doi: 10.1029/2012GL052290
Small, R. J., DeSzoeke, S. P., Xie, S. P., O’Neill, L., Seo, H., and Song, Q. (2008). Air–sea interaction over ocean fronts and eddies. Dyn. Atmos. Oceans 45, 274–319. doi: 10.1016/j.dynatmoce.2008.01.001
Smith, S., Gaël, A., Axel, A., William, A., Alex, B., David, I. B., et al. (2019). Ship-based contributions to global ocean, weather, and climate observing systems. Front. Mar. Sci. doi: 10.3389/fmars.2019.00434
Smith, S. R., Lopez, N., and Bourassa, M. A. (2015). Shipboard Automated Meteorological and Oceanographic System (SAMOS) Air-Sea Fluxes. Boulder, CO: National Center for Atmospheric Research, doi: 10.5065/D6930R70
Swart, N. C., and Fyfe, J. C. (2012). Observed and simulated changes in the Southern Hemisphere surface westerly wind-stress. Geophys. Res. Lett. 39:L16711. doi: 10.1029/2012GL052810
Swart, S., Speich, S., Ansorge, I. J., and Lutjeharms, J. R. E. (2010). An altimetry-based gravest empirical mode south of Africa: 1. Development and validation. J. Geophys. Res. 115:C03002. doi: 10.1029/2009JC005299
Swart, S., Thomalla, S. J., and Monteiro, P. M. S. (2015). The seasonal cycle of mixed layer dynamics and phytoplankton biomass in the Sub-Antarctic Zone: a high-resolution glider experiment. J. Mar. Syst. 147, 103–115. doi: 10.1016/j.jmarsys.2014.06.002
Thompson, D. W. J., Solomon, S., Kushner, P. J., England, M. H., Grise, K. M., Karoly, D. J., et al. (2011). Signatures of the Antarctic ozone hole in Southern Hemisphere surface climate change. Nat. Geosci. 4, 741–749. doi: 10.1038/ngeo1296
Thomson, J., and Girton, J. (2017). Sustained measurements of Southern Ocean airsea coupling from a Wave Glider autonomous surface vehicle. Oceanography 30, 104–109. doi: 10.5670/oceanog.2017.228
Trenberth, K. E., and Fasullo, J. T. (2010). Simulation of present day and twenty first century energy budgets of the Southern Oceans. J. Clim. 23, 440–454. doi: 10.1175/2009jcli3152.1
Viglione, G. A., Thompson, A. F., Flexas, M. M., Sprintall, J., and Swart, S. (2018). Abrupt transitions in submesoscale structure in southern Drake Passage: glider observations and GCM results. J. Phys. Oceanogr. 48, 2011–2027. doi: 10.1175/jpo-d-17-0192.1
Villas Bôas, A. B., Sato, O. T., Chaigneau, A., and Castelão, G. P. (2015). The signature of mesoscale eddies on the air-sea turbulent heat fluxes in the South Atlantic Ocean. Geophys. Res. Lett. 42, 1856–1862. doi: 10.1002/2015GL063105
Ward, B., Fristedt, T., Callaghan, A. H., Sutherland, G., Sanchez, X., Vialard, J., et al. (2014). The Air-Sea Interaction Profiler (ASIP): an autonomous upwardly-rising profiler for microstructure measurements in the upper ocean. J. Atmos. Ocean. Technol. 31, 2246–2267. doi: 10.1175/jtech-d-14-00010.1
Yelland, M. J., Moat, B. I., Pascal, R. W., and Berry, D. I. (2002). CFD Model Estimates of the airflow distortion over research ships and the impact on momentum flux measurements. J. Atmos. Ocean. Technol. 19, 1477–1499. doi: 10.1175/1520-04262002019<1477:CMEOTA<2.0.CO;2
Yu, L., Jin, X., Schulz, E. W., and Josey, S. (2017). Air-sea regimes in the sub-Antarctic Southern Ocean and Antarctic marginal ice zone revealed by icebreaker measurements. J. Geophys. Res. Oceans 122, 6547–6564. doi: 10.1002/2016JC012281
Yu, L., and Weller, R. A. (2007). Objectively analyzed air-sea heat Fluxes (OAFlux) for the global ice-free oceans. Bull. Am. Meteorol. Soc. 88, 527–533. doi: 10.1175/BAMS-88-4-527
Keywords: air-sea/air-sea-ice fluxes, Southern Ocean, ocean–atmosphere interaction, climate, ocean–ice interaction
Citation: Swart S, Gille ST, Delille B, Josey S, Mazloff M, Newman L, Thompson AF, Thomson J, Ward B, du Plessis MD, Kent EC, Girton J, Gregor L, Heil P, Hyder P, Pezzi LP, de Souza RB, Tamsitt V, Weller RA and Zappa CJ (2019) Constraining Southern Ocean Air-Sea-Ice Fluxes Through Enhanced Observations. Front. Mar. Sci. 6:421. doi: 10.3389/fmars.2019.00421
Received: 31 October 2018; Accepted: 05 July 2019;
Published: 31 July 2019.
Edited by:
Sabrina Speich, École Normale Supérieure, FranceReviewed by:
Brent Else, University of Calgary, CanadaTong Lee, NASA Jet Propulsion Laboratory (JPL), United States
Copyright © 2019 Swart, Gille, Delille, Josey, Mazloff, Newman, Thompson, Thomson, Ward, du Plessis, Kent, Girton, Gregor, Heil, Hyder, Pezzi, de Souza, Tamsitt, Weller and Zappa. This is an open-access article distributed under the terms of the Creative Commons Attribution License (CC BY). The use, distribution or reproduction in other forums is permitted, provided the original author(s) and the copyright owner(s) are credited and that the original publication in this journal is cited, in accordance with accepted academic practice. No use, distribution or reproduction is permitted which does not comply with these terms.
*Correspondence: Sebastiaan Swart, c2ViYXN0aWFhbi5zd2FydEBtYXJpbmUuZ3Uuc2U=