 Sólvá Jacobsen1*
 Eilif Gaard1
 Hjálmar Hátún1
 Petur Steingrund1
 Karin Margretha Húsgarð Larsen1Jákup Reinert1
 Sólveig Rósa Ólafsdóttir2Meinhard Poulsen3Helga Bára Mohr Vang1
- 1Faroe Marine Research Institute, Tórshavn, Faroe Islands
- 2Marine and Freshwater Research Institute, Reykjavík, Iceland
- 3Nakskov Gymnasium og HF, Nakskov, Denmark
Comprehensive late June surveys have for decades been carried out on the Faroe shelf in order to estimate the abundance of juvenile fish – the 0-group. The abundance of cod juveniles has previously been used in recruitment studies, while the ecological implication of the 0-groups has hitherto received less attention. Here we examined the pelagic 0-group stage in four of the main fish species on the Faroe shelf: cod, haddock, Norway pout and sandeel, representing more than 90% of all juvenile fish on the shelf. A positive relationship between length and abundance at the 0-group stage is observed for all juveniles, and the inter-annual variability was highly similar among the four fish species. Based on this knowledge, we produced a new ecological indicator for the central Faroe shelf ecosystem – the 0-group length index. The 0-group length index is characterized by marked peaks in 1984, 1987, 1994, 2000, 2009, and 2017, which appear to be related to the shelf primary production from spring to mid-summer, and possibly to the marine climate surrounding the Faroe shelf. There is a better temporal overlap between the fish larvae and their prey (i.e., small- to medium sized zooplankton) in years with an early and intensive bloom, while late and/or weak blooms lead to unfavorable feeding conditions. We furthermore show that a large abundance of 0-group fish has the potential to graze down and thus regulate the biomass of large-sized zooplankton during late June. In addition to this top-down influence the 0-group fish clearly impact commercial fish stocks and seabird colonies, and our 0-group length index is therefore a key ecological indicator for the state of the entire central Faroe shelf ecosystem.
Introduction
The Faroe shelf is a spawning and nursery area for several commercially and ecologically important fish stocks, including cod (Gadus morhua), haddock (Melanogrammus aeglefinus), sandeel (Ammodytes marinus), and Norway pout (Trisopterus esmarkii). These stocks spawn on the Faroe shelf in February–May (Jákupsstovu and Reinert, 1994; Ottosen et al., 2018). The pelagic larvae and juveniles co-occur in the water column and the youngest stages are retained on the shelf by the shelf front (Gaard and Steingrund, 2001; Gaard and Reinert, 2002). The front is typically situated between 100 and 130 m bottom depth (Larsen et al., 2009) and it separates the oceanic environment from the well mixed central shelf (CS) water (Hansen et al., 2005; Larsen et al., 2008, 2009). Thus, the CS contains a distinct neritic ecosystem different from the ecosystem in the outer shelf/open ocean (Gaard et al., 1998; Gaard, 1999; Eliasen et al., 2017a; Jacobsen et al., 2018).
During the first-feeding period in late April the fish larvae feed on copepod eggs and nauplii (Gaard and Steingrund, 2001). The copepod reproduction initiates shortly after the phytoplankton spring bloom (Gaard, 1999; Debes and Eliasen, 2006; Jacobsen et al., 2018), although some prebloom production occurs (Gaard, 2000; Debes and Eliasen, 2006; Madsen et al., 2008). As the larvae grow they gradually switch to larger food items. In May the 0-groups feed mainly on copepodites of both neritic and oceanic origin (Gaard and Steingrund, 2001; Gaard and Reinert, 2002). The neritic copepod abundance is highly dependent on the local phytoplankton biomass (Gaard, 1999; Debes and Eliasen, 2006; Jacobsen et al., 2018), while the variable abundance of the ecologically important oceanic copepod Calanus finmarchicus is affected by the variable exchange rate between the on- and offshelf waters as well as the variable production in the open ocean and on the shelf (Gaard, 2000; Gaard and Hansen, 2000; Sundby, 2000; Debes et al., 2008a) and perhaps also the variable predation from 0-group fish (Gaard and Reinert, 2002). In late June, the 0-group fish feed mainly on late-stage C. finmarchicus (Gaard and Steingrund, 2001; Gaard and Reinert, 2002), which also dominates the zooplankton biomass on the shelf (Gaard, 1999; Debes et al., 2005).
There is a close positive relationship between the CS primary production index (PPI) and fish growth and number of attending seabirds (Gaard et al., 2002; Steingrund and Gaard, 2005). The highly variable PPI is also reflected in e.g., cod recruitment at age 2 years (Gaard et al., 2002; Steingrund and Gaard, 2005) and in sandeel 0-group growth and survival (Eliasen et al., 2011). However, there is a negative relationship between the PPI and the zooplankton biomass during summer (Gaard, 2003; Hansen et al., 2005).
Diatoms usually dominate the phytoplankton biomass in the CS throughout the spring and summer (Gaard et al., 1998; Debes et al., 2008b; Djurhuus et al., 2015), and therefore the development of the spring bloom is likely dependent on silicate availability, whereas nitrate is replete most years (Eliasen et al., 2017b). The upper-layer pre-bloom silicate concentrations in the North Atlantic are regulated by the subpolar gyre (Figure 1A) and show marked inter-annual variability with a declining trend during the past decades (Hátún et al., 2017b). This variability may have large consequences for the biological production in the North Atlantic including the production of diatoms and zooplankton (Hátún et al., 2016, 2017a).
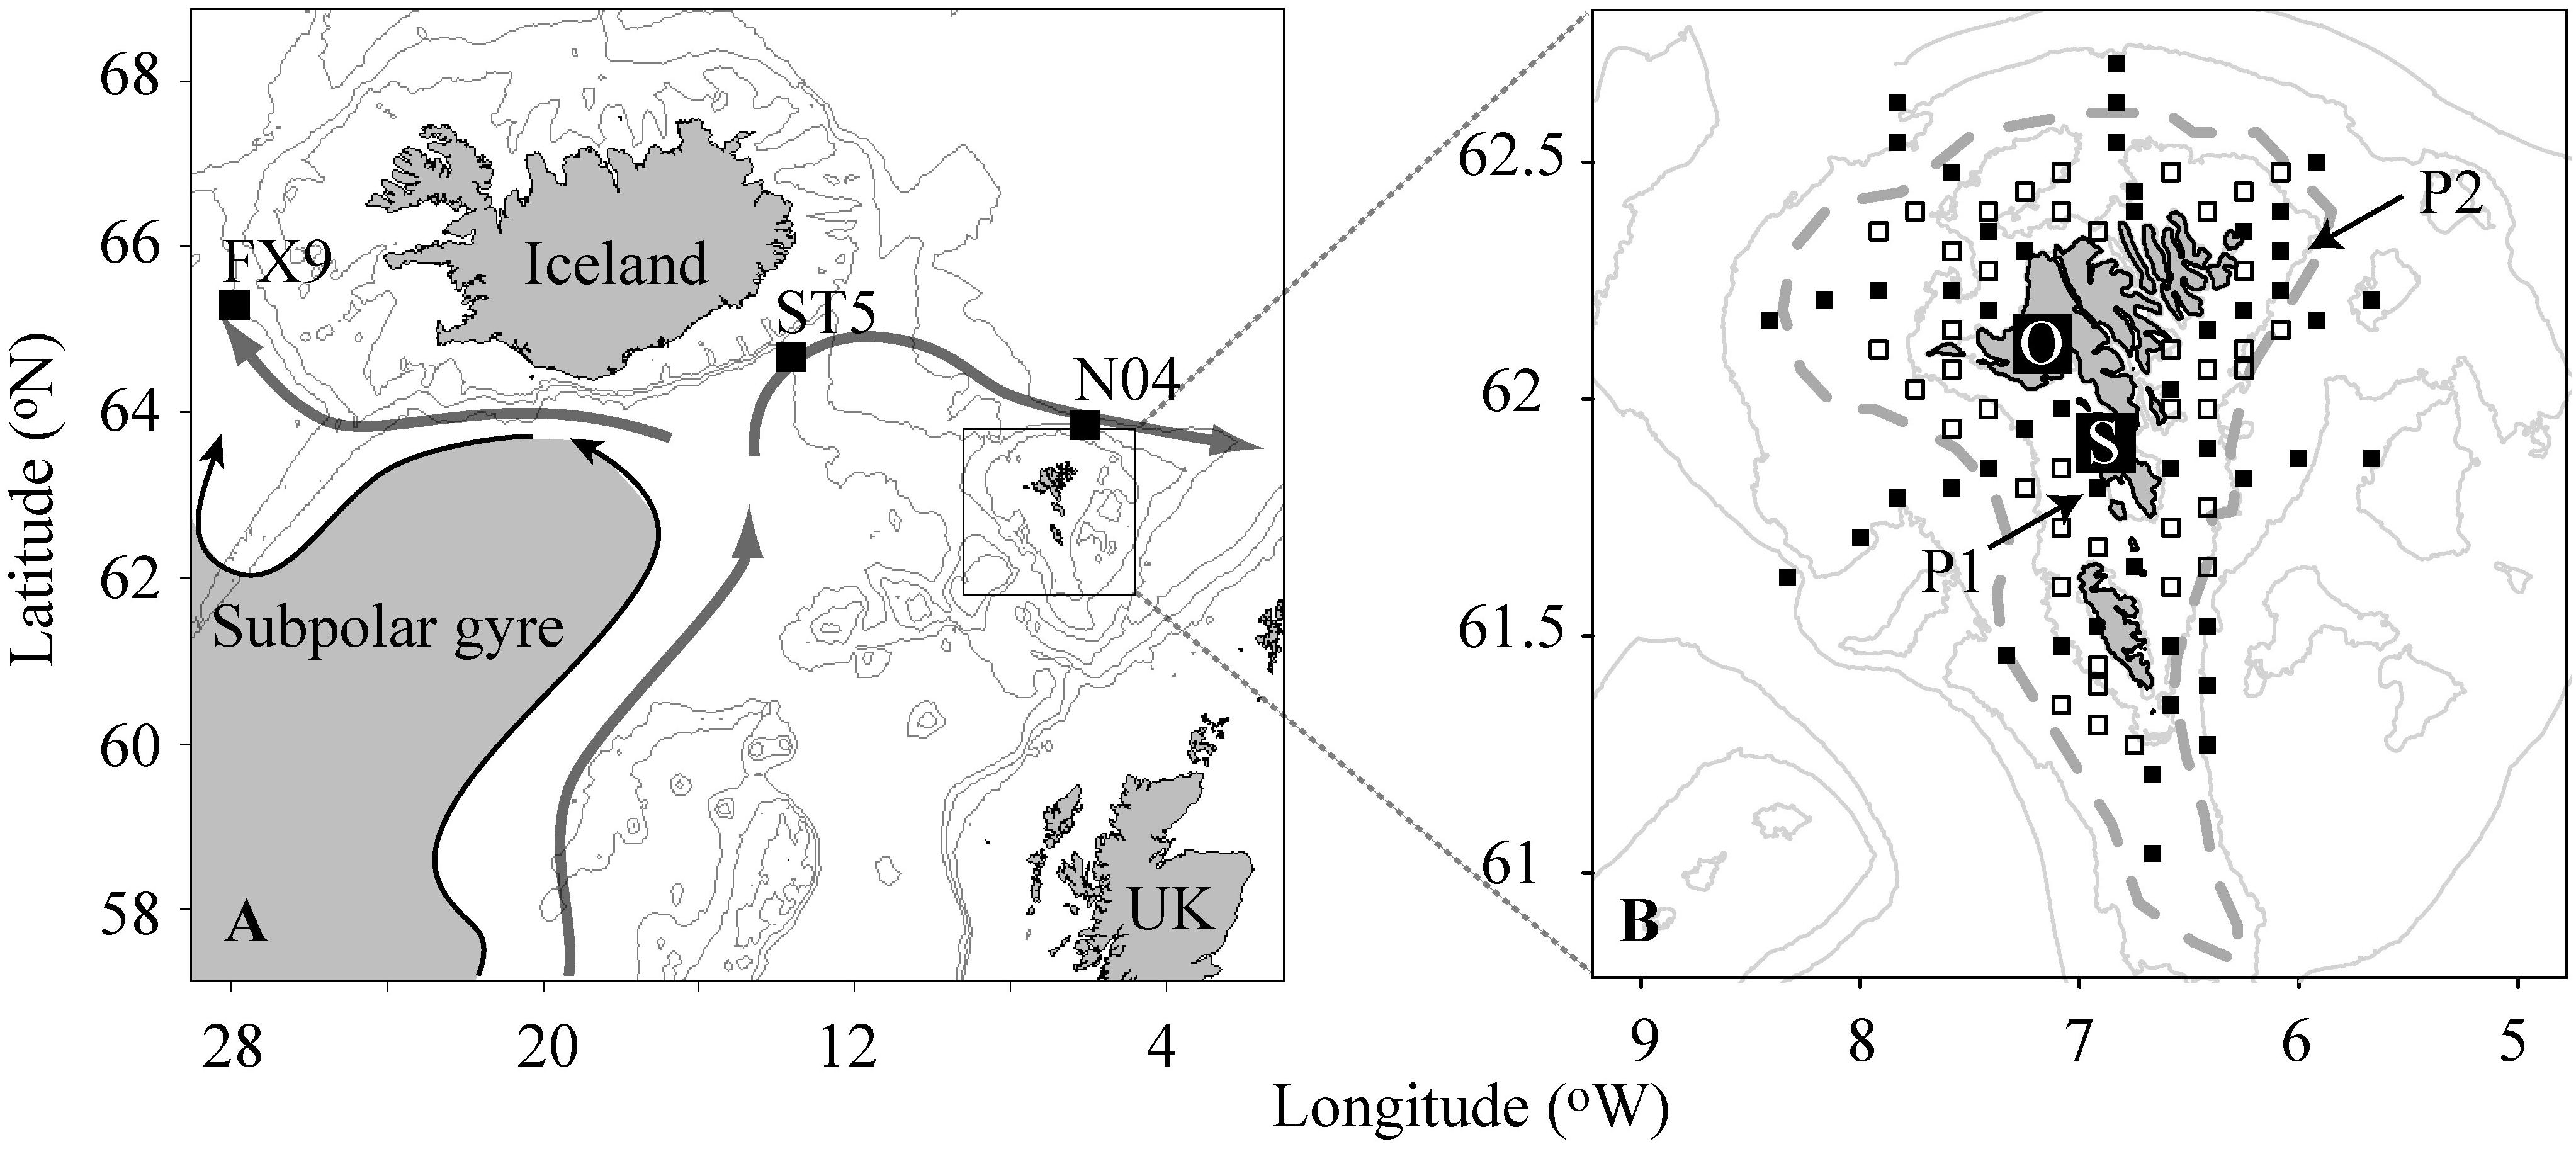
Figure 1. (A) The North East Atlantic. The squares show the positions of the nutrients time series stations, while the gray lines represent the 200, 500, and 1000 m bottom depth contours, respectively. The subpolar gyre and the northward flow of North Atlantic waters carried by the gyre are illustrated by arrows. (B) The Faroe Shelf. The filled squares show survey haul positions and biological oceanography stations occupied during the 0-group survey in the second half of June, while the open squares show survey haul stations only. P1 and P2 are stations on which the PPI is based (refer to section “Phytoplankton”). O and S denote fixed coastal stations on the shelf. The gray lines represent 100, 200, and 500 m bottom depth contours, and the gray dashed line is the average position of the Faroe shelf front (Larsen et al., 2009).
The recruitment to the Faroe cod and haddock stocks has largely failed during the past decade (ICES, 2018), partly as a result of high fishing mortality and partly by poor environmental conditions (Steingrund and Gaard, 2005). There are many bottlenecks affecting the final year-class strengths of fish, yet the early life phase of the individuals (i.e., larval and pelagic juvenile stages) is essential for successful further development (Leggett and Deblois, 1994). Key factors in survival of fish larvae are rapid growth through the early stages of development when vulnerability to predation, starvation and advective loss from suitable nursery areas is highest (Hjort, 1914; Anderson, 1988; Cushing, 1990; Houde, 1997). Temperature and food availability are considered key drivers for larval growth and survival (Fuiman and Werner, 2002). Seawater warming increases both growth and the food demand of the fish larvae due to the metabolism and energetic cost of poikilotherms. In temperate waters, such as the Faroe shelf and the North Sea, recruitment is better during cold years (Ottosen et al., 2018), potentially due to higher abundances of copepods in suitable sizes for the fish larvae and better temporal overlap between the larvae and their prey during cold years (Beaugrand et al., 2003).
Many nations conduct 0-group surveys upon which they base their first prediction of the year-class strength of commercial fish species (e.g., Sundby et al., 1989; Anderson and Dalley, 2000), but such early indications of year-class strength do not always correlate well with recruitment (Astthorsson et al., 1994; Jákupsstovu and Reinert, 1994; Anderson and Dalley, 2000; Steingrund et al., 2010). Still, 0-group indices are not only assembled for commercial fish species, but also e.g., Norway pout and sandeel. These two species play key roles in the CS ecosystem acting as intermediate trophic level species being preferred food for saithe (Pollachius virens) (Homrum et al., 2012), cod (Eliasen et al., 2011) and many seabird species (Gaard et al., 2002). Furthermore, larvae and 0-group fish utilize the annual pelagic production of zooplankton. Wide distribution and high abundance of the 0-group fish make these an important link in the energy transfer in marine ecosystems (Eriksen et al., 2011).
The here utilized 0-group survey data have provided annual information on the abundance, distribution and size of pelagically distributed fish species on the Faroe shelf since 1983. In the present paper, we have investigated the length and abundance of the four most abundant 0-group fish species, i.e., cod, haddock, Norway pout and sandeel for the years 1983–2018. We have used a holistic approach by studying the 0-groups temporal and to a lesser extent spatial variations in relation to relevant local environmental variables like temperature, phytoplankton, and zooplankton biomass and large-scale environmental processes like pre-bloom open-ocean nutrient availability. Moreover, the age composition of cod in four contrasting years was studied. By comparing age-length relationships in juvenile cod, we examined whether inter-annual size differences are growth or age related, and by examining the back-calculated hatch date compositions our aim was to determine if differences in survival are linked to the environment.
Materials and Methods
Survey Area and Sampling
The main material was collected on an annual 0-group survey in the second half of June1 on the Faroe shelf during the period 1983–2018, which is toward the end of the pelagic phase (i.e., close to settlement) of 0-group cod and haddock. The primary purpose of the survey is to obtain an early prediction of the year-class strength of cod. Indications of year-class strength of other fish species, e.g., haddock, Norway pout and sandeel are also obtained during the survey in addition to data on distribution and length of all juveniles caught. Length is measured to get an indication of the condition of the juveniles. Environmental variables that directly or indirectly might affect the 0-groups have been an integrated part of the survey since 1989/1990. These environmental parameters are temperature and salinity, nutrients and phytoplankton, and zooplankton. Since 1993 the survey has had a fixed station grid (Figure 1B), however, prior to this the stations were selected according to a random design. 100 survey haul stations have been occupied every year. In order to reduce possible effects from diel vertical migrations and the effects from possible differences in vertical distribution and feeding behavior during the day and night, the sampling was carried out during daytime, between 06:30 and 18:30.
Fish Juveniles
Fish juveniles were collected with a small pelagic trawl with 5 mm mesh size in the codend with a mouth opening of about 8 m (horizontally) times 4–5 m (vertically). The trawling depth was approximately 30–40 m; the exact depth chosen was based on the recordings on the echo-sounder. Thus, the number and biomass of the juveniles might be somewhat overestimated. The towing speed was three knots and the duration of each haul was 30 min. The species were identified, length measured to the nearest millimeter below and counted on board. In the cases of very large catches, subsamples were analyzed and the results were calculated to total catches.
To get an idea of the predatory capacity of the 0-groups an estimation of the dry weight of the fish juveniles was calculated. Biomass (dry weight) estimates were calculated from cubic length assuming condition factors of 1.01 for cod, 0.98 for haddock, 0.76 for Norway pout, and 0.28 for sandeel and a wet weight to dry weight conversion factor of 0.18. The condition factors were based on weight-length relationships of fish caught in the autumn (August–September) bottom trawl survey.
The spatial abundances shown were based on data from all survey 0-group hauls from 1993 to 2018, i.e., on data from the entire fixed station grid, while time series of juvenile abundances, biomass and lengths are averages over all stations inside the 100 m bottom depth contour, i.e., CS stations.
Furthermore, to get a more reliable and rigorous indicator for the 0-groups condition and to simplify our investigation of possible environmental drivers for the mean size of all four fish species, the mean length of all four fish species were collated into a so-called 0-group length index using principal component analysis (PCA) (Legendre and Legendre, 1998; Frederiksen et al., 2007b). Length was preferred over abundances/biomass considering that abundances may be more affected by e.g., variable weather conditions and patchiness during sampling and also by peculiarities in the population dynamics of the different species. Sandeel was almost twice the length of the other species, thus in order to make each species contribute equally to the PCA the lengths were standardized prior to the analysis. The 0-group length index is represented by the first principal component.
Zooplankton
Zooplankton sampling was initiated in 1989 and was collected with vertical hauls from 50 m depth to the surface using a WP-2 net with a mesh size of 200 μm. The towing speed was 0.3–0.5 m s–1. Zooplankton biomass was determined by drying at ∼60°C until a constant weight was attained. The time series for zooplankton biomass represents an average over all stations inside the 100 m bottom depth contour, i.e., CS stations.
Additionally, in 2016 and 2018 zooplankton samples were collected weekly using a net with a mesh size of 100 μm at the land-based station S (Figure 1B). This station pumps large amounts of seawater (about 15 tons min–1) from 18 m depth at a location on the CS, where the water column is always well mixed from surface to bottom (Larsen et al., 2008).
Phytoplankton
The PPI-index (PPI) (1990–2018) was calculated based on drawdown in nitrate concentration from winter to June 26th at two stations in the CS water mass (Figure 1B), adjusted by an estimate of net inflow of nitrate. The method for calculating the index is described in Gaard et al. (2002) and Steingrund and Gaard (2005). The PPI is an approximate index of new primary production only.
Furthermore, weekly chlorophyll a (chl) measurements were carried out at station S. Chl was measured spectrophotometrically according to Parsons et al. (1984).
Nutrients
Pre-bloom, upper-layer nutrient (i.e., nitrate and silicate) measurements were carried out at stations FX9, ST5, and N04 (Figure 1A). The stations are located in the northern Irminger Sea (FX9), northern Iceland Basin (ST5) and north of the Faroe Islands (N04), respectively. Nutrients were measured according to Grasshoff et al. (1999). The samples were taken during the pre-bloom period, i.e., in February–April, and nutrient concentrations were vertically averaged over 15–200 m depth.
Temperature and Salinity
Temperature data dating back to 1992 were acquired at Station O (Figure 1B) and measured using Aanderaa, Sensordata and recently Starmon temperature recorders. Salinity samples have been collected at Station S since 1996 and measured using an Autosal salinometer (Larsen et al., 2008). Like Station S, Station O is placed in well-mixed CS water and the temperature variations at the two stations are almost identical (Larsen et al., 2008). In the present study, when comparing temperature and salinity to the 0-group and other variables, mean temperatures and salinities for February–June were applied.
Growth and Age: A Case Study Using Cod
Age Determination
In some years, subsamples of juvenile cod were collected and stored in ethanol. Due to large variability in the mean length of cod between years, the age of juveniles from the 1997, 2001, 2015, and 2016 cohorts was determined by studying daily growth rings in the otoliths. In the laboratory the fish were length measured to nearest mm. No correction for shrinkage due to preservation was made. Sagittae and lapillae from a total of 393 juveniles were removed under a dissecting microscope with a polarized light source, and mounted on microscope slides using mounting wax. Otoliths were hand-polished with wet/dry sandpaper with grit sizes ranging from 0.3–2.5 μm until the core and all increments were exposed. For more information on otolith removal and preparation see Secor et al. (1992). Pictures of the otoliths were taken with 20×, 40×, and/or 63× magnification and calibrated with a 1 mm ruler to microns. The images were saved and otolith analyses were done using an image analyses system (Image Pro V. 4 or ImageJ). In most cases the counting was done on the lapillus, but in some cases the sagitta was used. To validate the age reading 85 or around 20% of the otoliths were read twice. The coefficients of variation (CV) showed that there was generally good agreement between the two readings (mean CV = 3.7%, range 0–14.3%).
Time of Spawning
To account for the role that timing of spawning of the parent generation had on the age of the cod juveniles, the spawning distribution was estimated based on data on maturity of fish captured in the spring (February–March) bottom trawl survey. More details on the data material and calculations are described in Ottosen et al. (2018).
Statistical Analyses
The spatial analyses of log-transformed fish juvenile abundances and zooplankton biomasses were based on interpolation between points and images were assembled by applying the function image.plot using R (R Core Team, 2018).
For correlation purposes, the Pearson correlation coefficient was determined. All correlations were tested for autocorrelation (Pyper and Peterman, 1998). When comparing one continuous (dependent) variable to more than one (independent) variable, we used multiple linear regression. If an independent variable was qualitative or conditional multiple linear regression was replaced by ANCOVA. When comparing means, we used two sample t-tests. The tests were performed using R (R Core Team, 2018) and the XLstat ecology software. A p-value of 0.05 or lower was considered statistically significant.
Results
Spatial Distributions
The (1993–2018) spatial distribution of the four species showed that cod, Norway pout and sandeel juveniles generally tended to be found in shallower waters than haddock. All four species showed highest concentrations on the eastern side and lowest concentrations in a tongue extending onto the shelf from the south-western side of the shelf (Figures 2A–D). Furthermore, zooplankton distribution during the second half of June showed high biomass in the outer shelf areas and small biomass in the CS area (Figure 2E). The difference in mean abundance within the 100 m bottom depth contour (i.e., CS) and outside the 150 m bottom depth contour was highly significant in the case of cod, Norway pout, sandeel and zooplankton biomass (two sample t-test, p < 0.01), and approaching significant in the case of haddock (two sample t-test, p = 0.06).
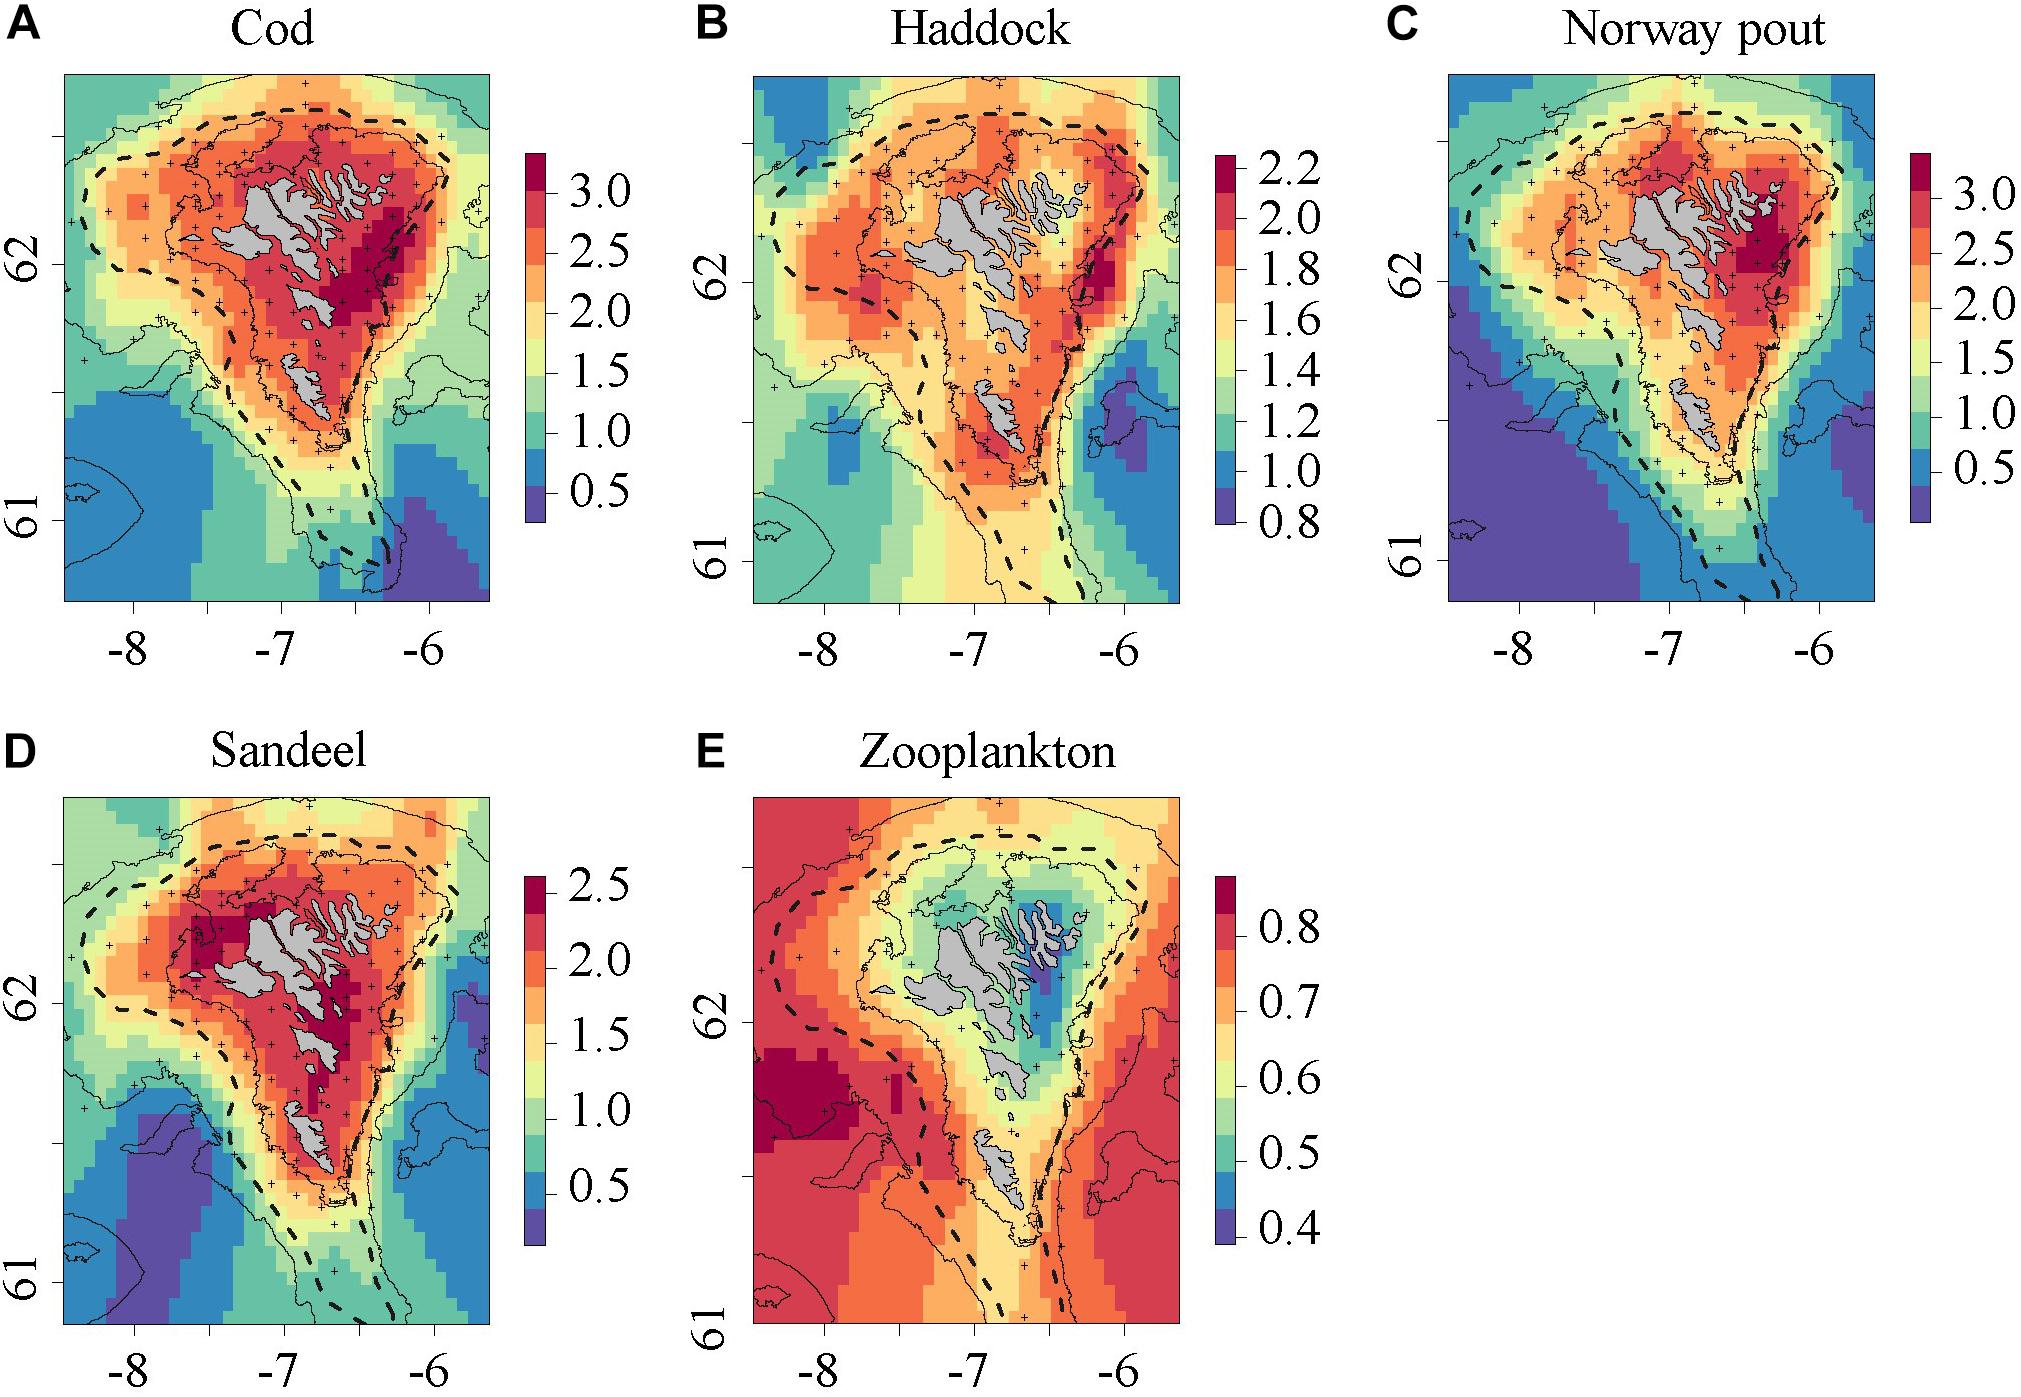
Figure 2. Log-transformed distribution of (A) cod, (B) haddock, (C) Norway pout, (D) sandeel (1993–2018), and (E) zooplankton biomass on the Faroe shelf (1989–2018). The data were smoothed with a kernel bandwidth of 0.1°. Black (+) indicate sampled stations, gray lines the 100 and 200 m bottom depth contours and the dashed line indicates the average position of the shelf front.
The 0-Group Length Index
The total number of cod, haddock, Norway pout, and sandeel amounted to more than 90% of the total survey catches of all fish species. The mean abundance (Figure 3A) and mean length (Figure 3B and Table 1) of all four species varied greatly between years.
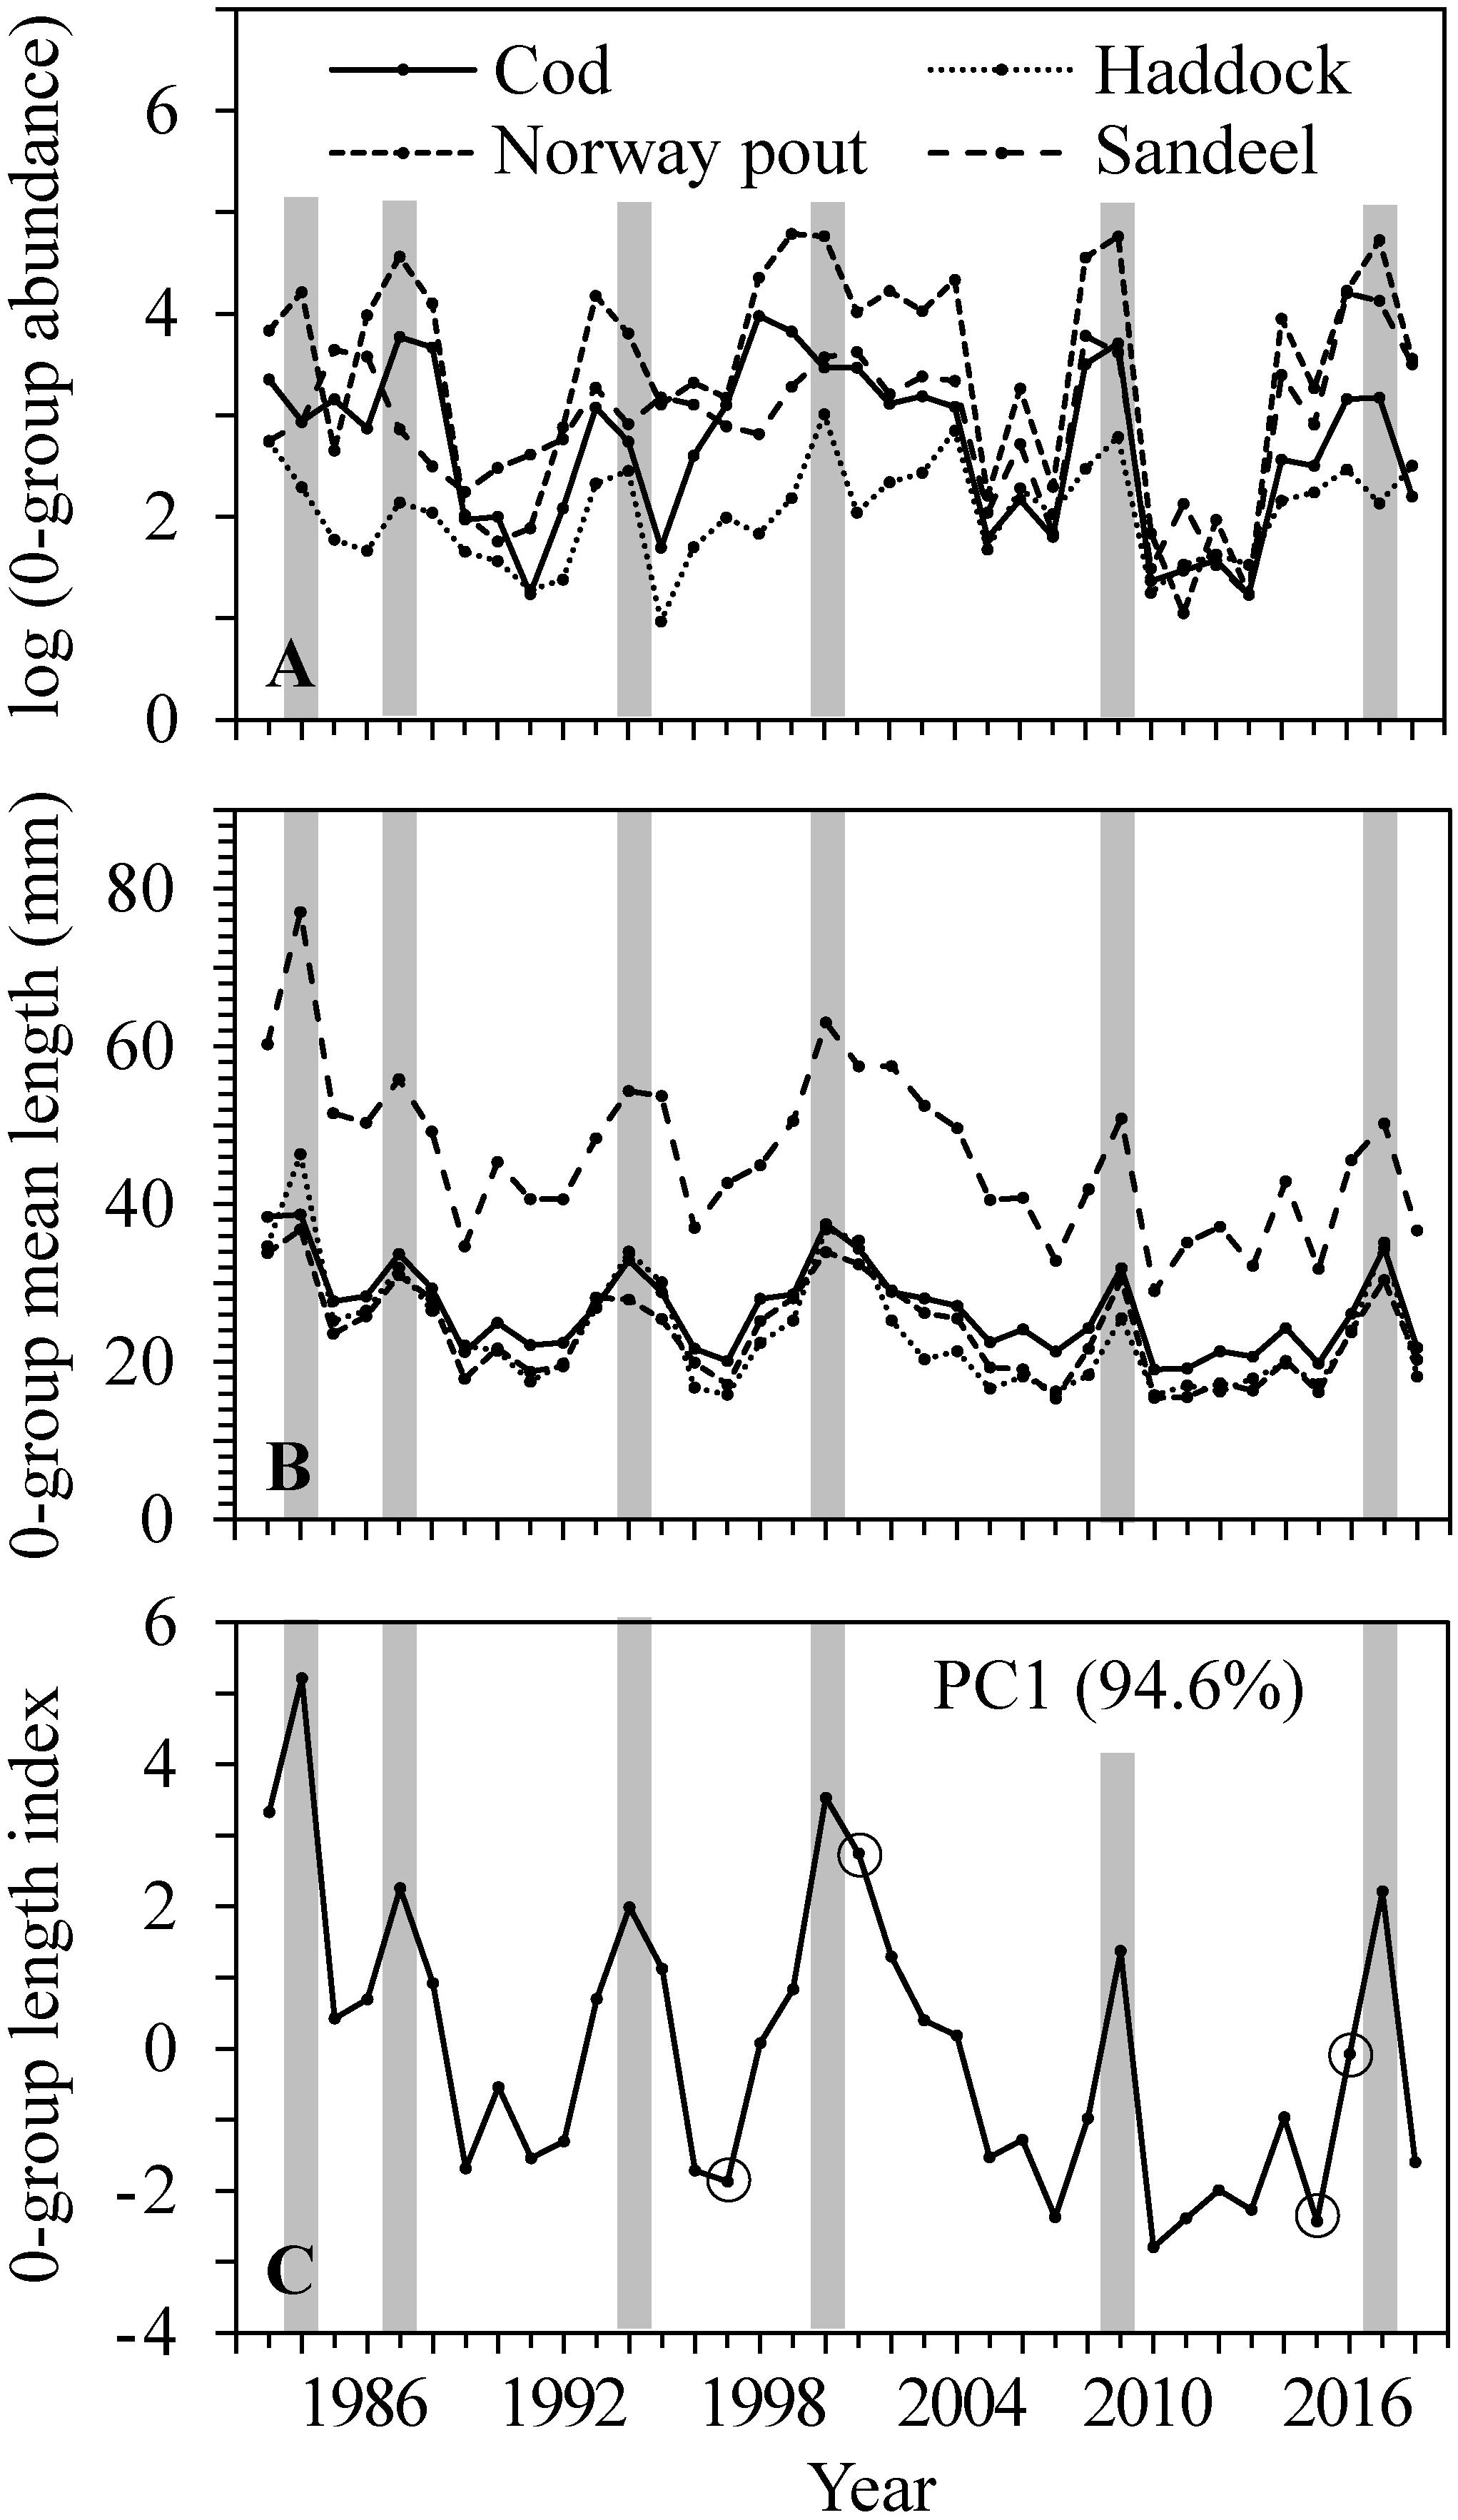
Figure 3. 0-group cod, haddock, Norway pout and sandeel within the CS (i.e., average of all stations within the 100 m bottom depth contour) in 1983–2018. (A) Log of abundance and (B) mean length. (C) 0-group length index constructed from the factor scores of the first principal component (PC1) of the mean lengths. The PC1 explained 94.6% of the total inter-annual variability. Gray bars highlight peaks in abundance, mean length and 0-group length index, while open circles (O) indicate years where subsamples of cod were age analyzed.
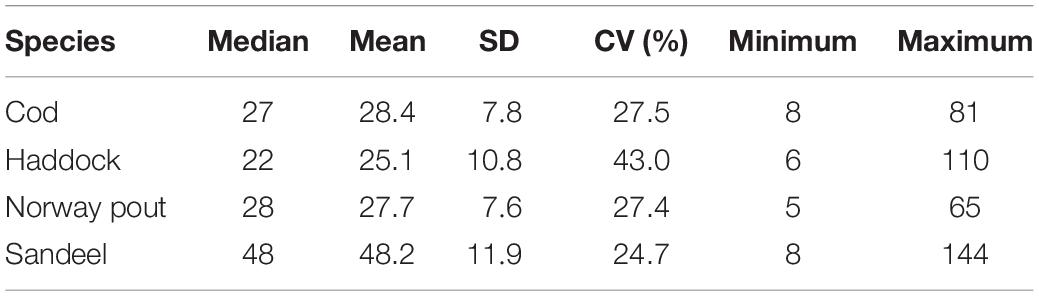
Table 1. Overall median, mean, standard deviation (SD), coefficient of variation (CV), and minimum and maximum length (mm) at the 0-group stage of cod, haddock, Norway pout, and sandeel within the CS 1983–2018.
There was a large degree of synchrony in abundance variability between the four species (Figure 3A) and an even larger degree of synchrony in length variability with simultaneous peaks in 1984, 1987, 1994, 2000, 2009, and 2017 (Figure 3B) indicating simultaneous environmental influences on mortality and individual sizes of all four species. There was also a positive relationship between length and abundance within and among the different 0-group species (Table 2); thus, high/low abundances of juveniles relate to large/small mean lengths.
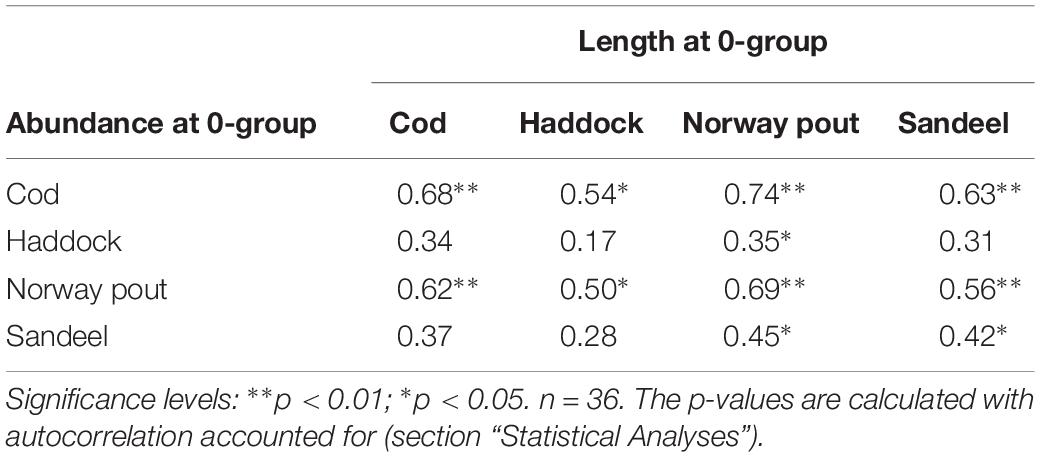
Table 2. Correlations (r) between log-transformed abundance and mean length at the pelagic 0-group stage of cod, haddock, Norway pout, and sandeel within the CS 1983–2018.
Based on the mean length of the four fish species an 0-group length index was constructed using PCA (Figure 3C). The 0-group length index is represented by the first principal component, which explained ∼95% of the total inter-annual variability. Since the mean lengths were highly synchronous between the species (Table 1 and Figure 3B), the loss of information from the PCA was kept to a minimum and the index must be considered robust.
Covariability With Environmental Indicators
The inter-annual variability in the 0-group length index resembled the inter-annual variability in zooplankton biomass, PPI and silicate at FX9 (Figure 4). The inter-annual variations in silicate concentrations at FX9, ST5, and N04 were similar. The concentrations at FX9 were higher, though peaks at all three locations occured in synchrony (Figure 4D). The longest record, FX9, was therefore used as representative for the pre-bloom nutrient concentration off the Faroe shelf.
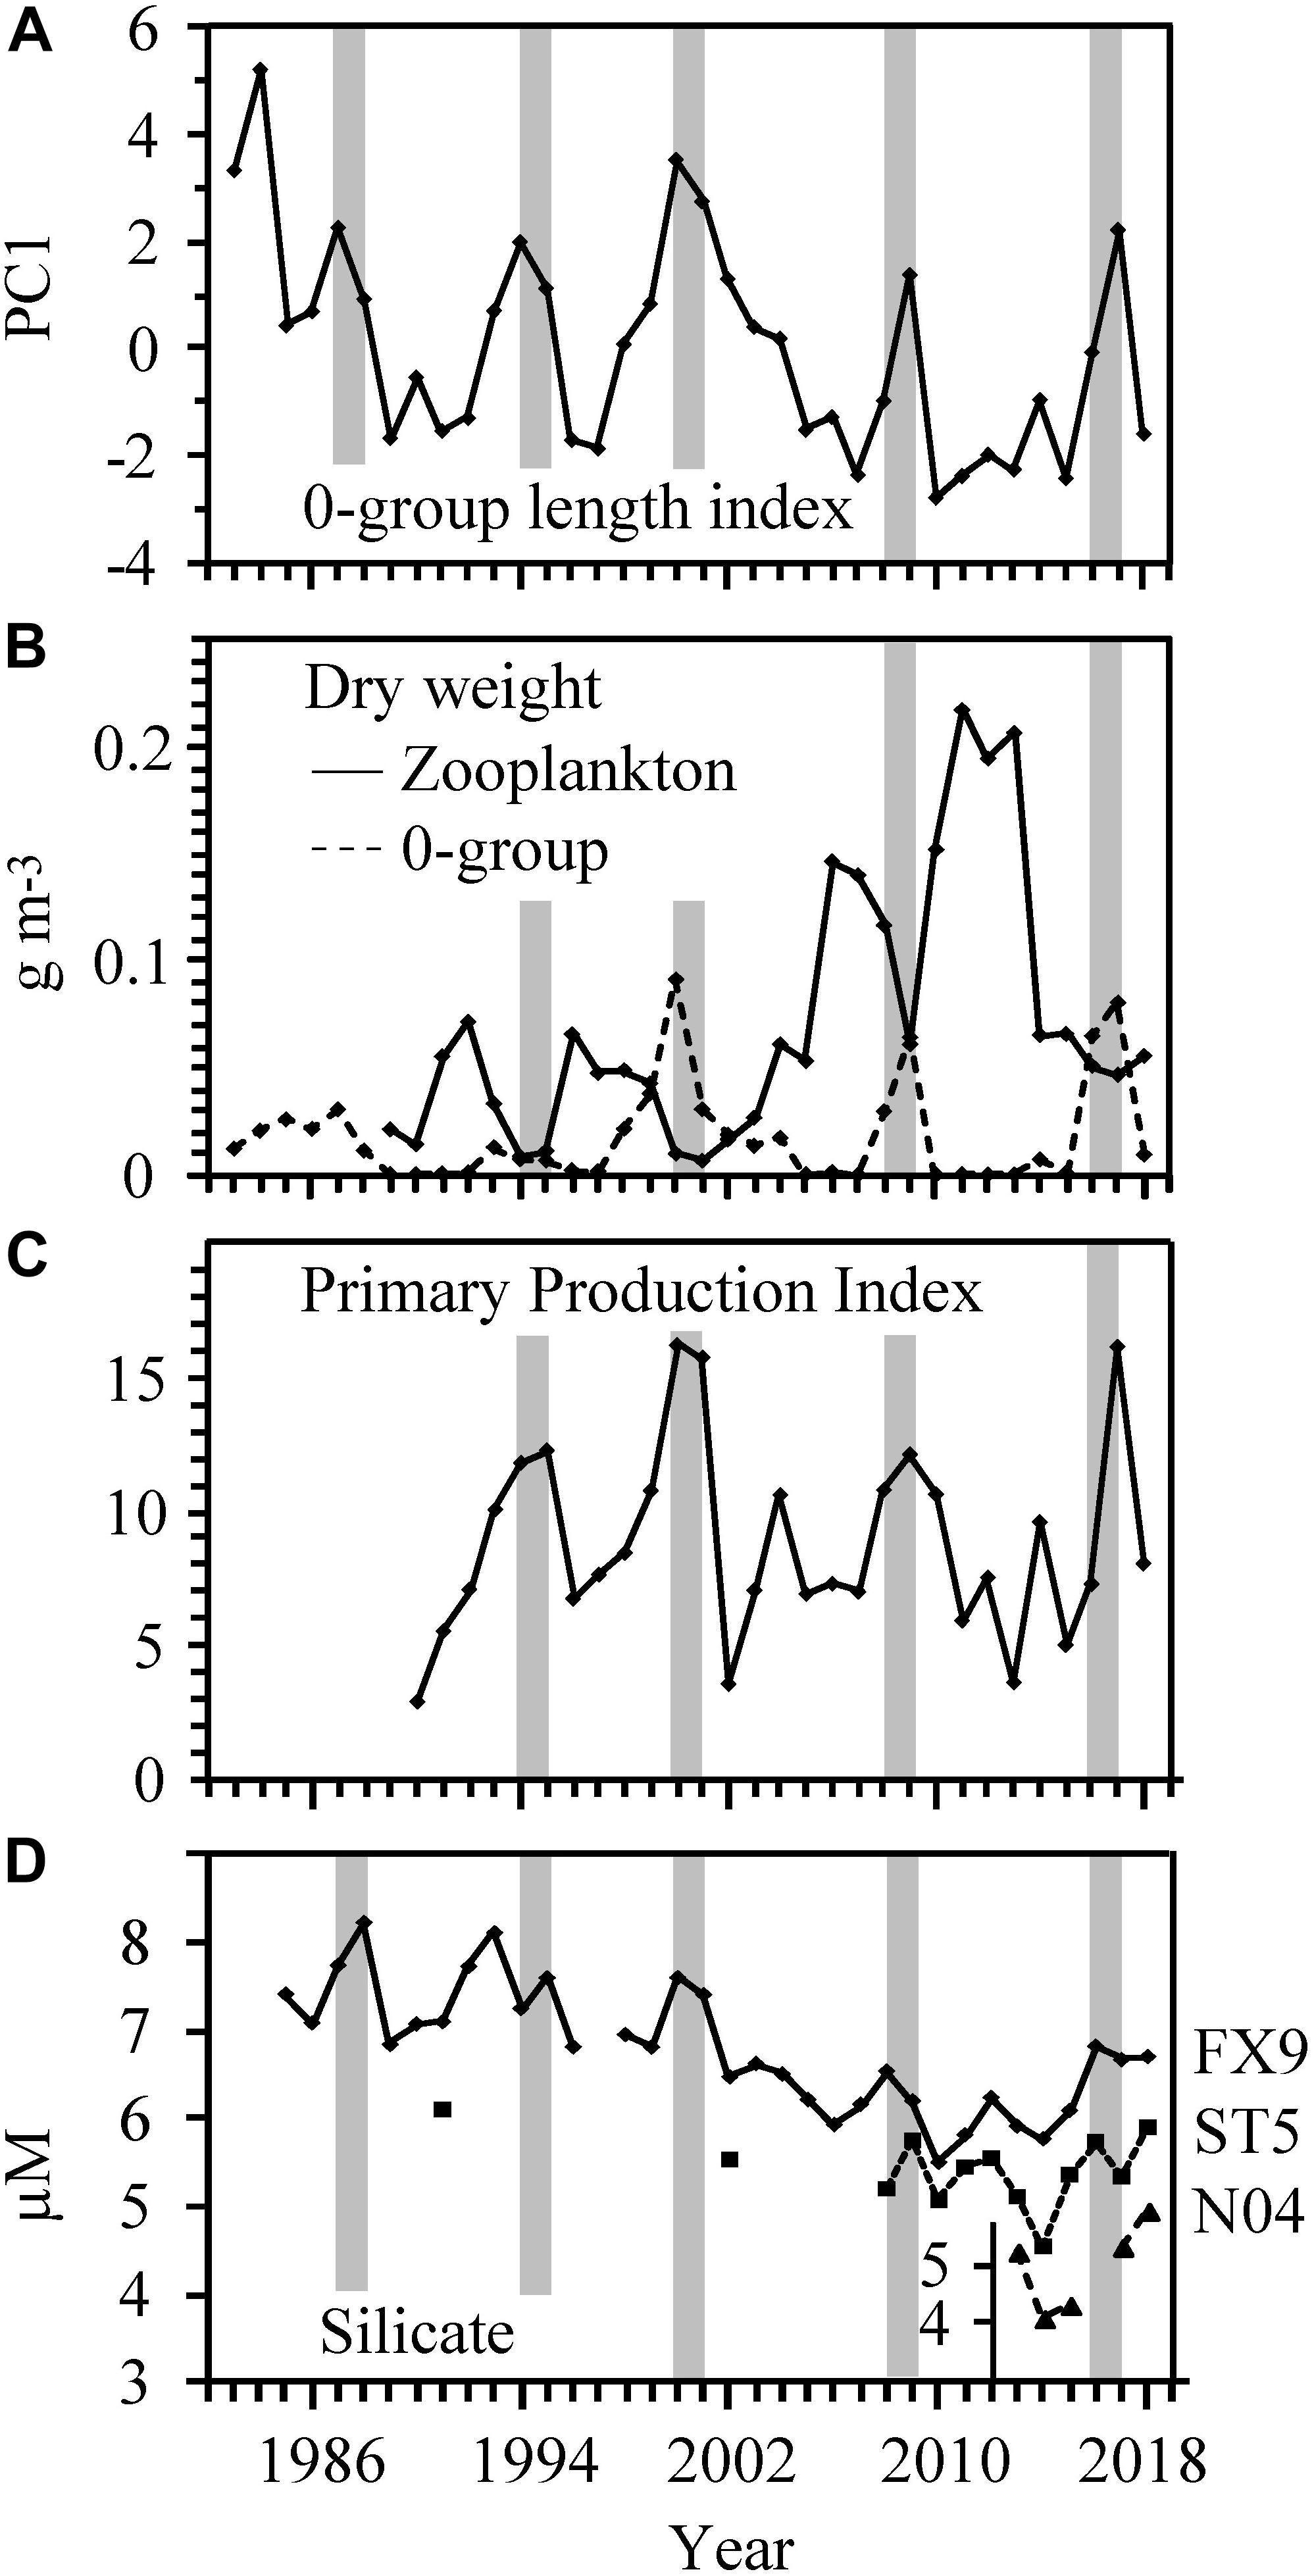
Figure 4. Temporal development in the (A) 0-group length index (B) Zooplankton and 0-group biomass, (C) PPI from spring to late June, and (D) open-ocean pre-bloom silicate concentrations. The gray bars highlight periods of simultaneous high 0-group length index and biomass, low zooplankton biomass, high PPI and high silicate concentration.
According to a multiple linear regression model the zooplankton biomass and PPI are significant predictors of the 0-group length index (adjusted r2 = 0.71, p < 0.001). Silicate approached significance (p = 0.06), while nitrate, temperature and salinity had no predictive value (p > 0.1). Pairwise correlations between the variables are shown in Table 3.
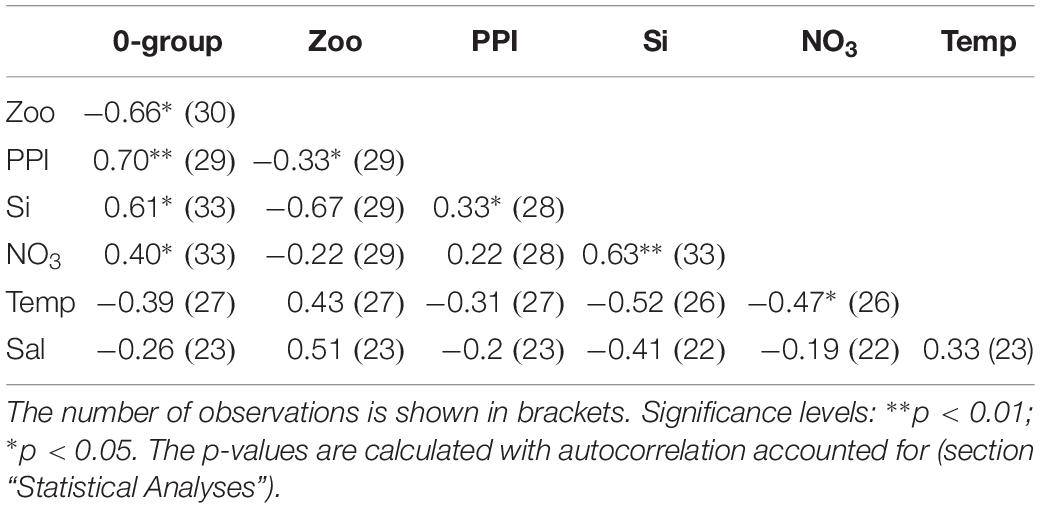
Table 3. Correlations (r) between yearly values in 0-group length index, zooplankton biomass, PPI, oceanic pre-bloom silicate and nitrate concentration, temperature, and salinity.
The PPI (and pre-bloom silicate concentration) were positively related to the 0-group length index indicating bottom-up relationships (Table 3 and Figure 4). A comparison between the PPI and the average chl from April–June shows that the two are highly correlated (r2 = 0.87, p < 0.01) (Figure 5).
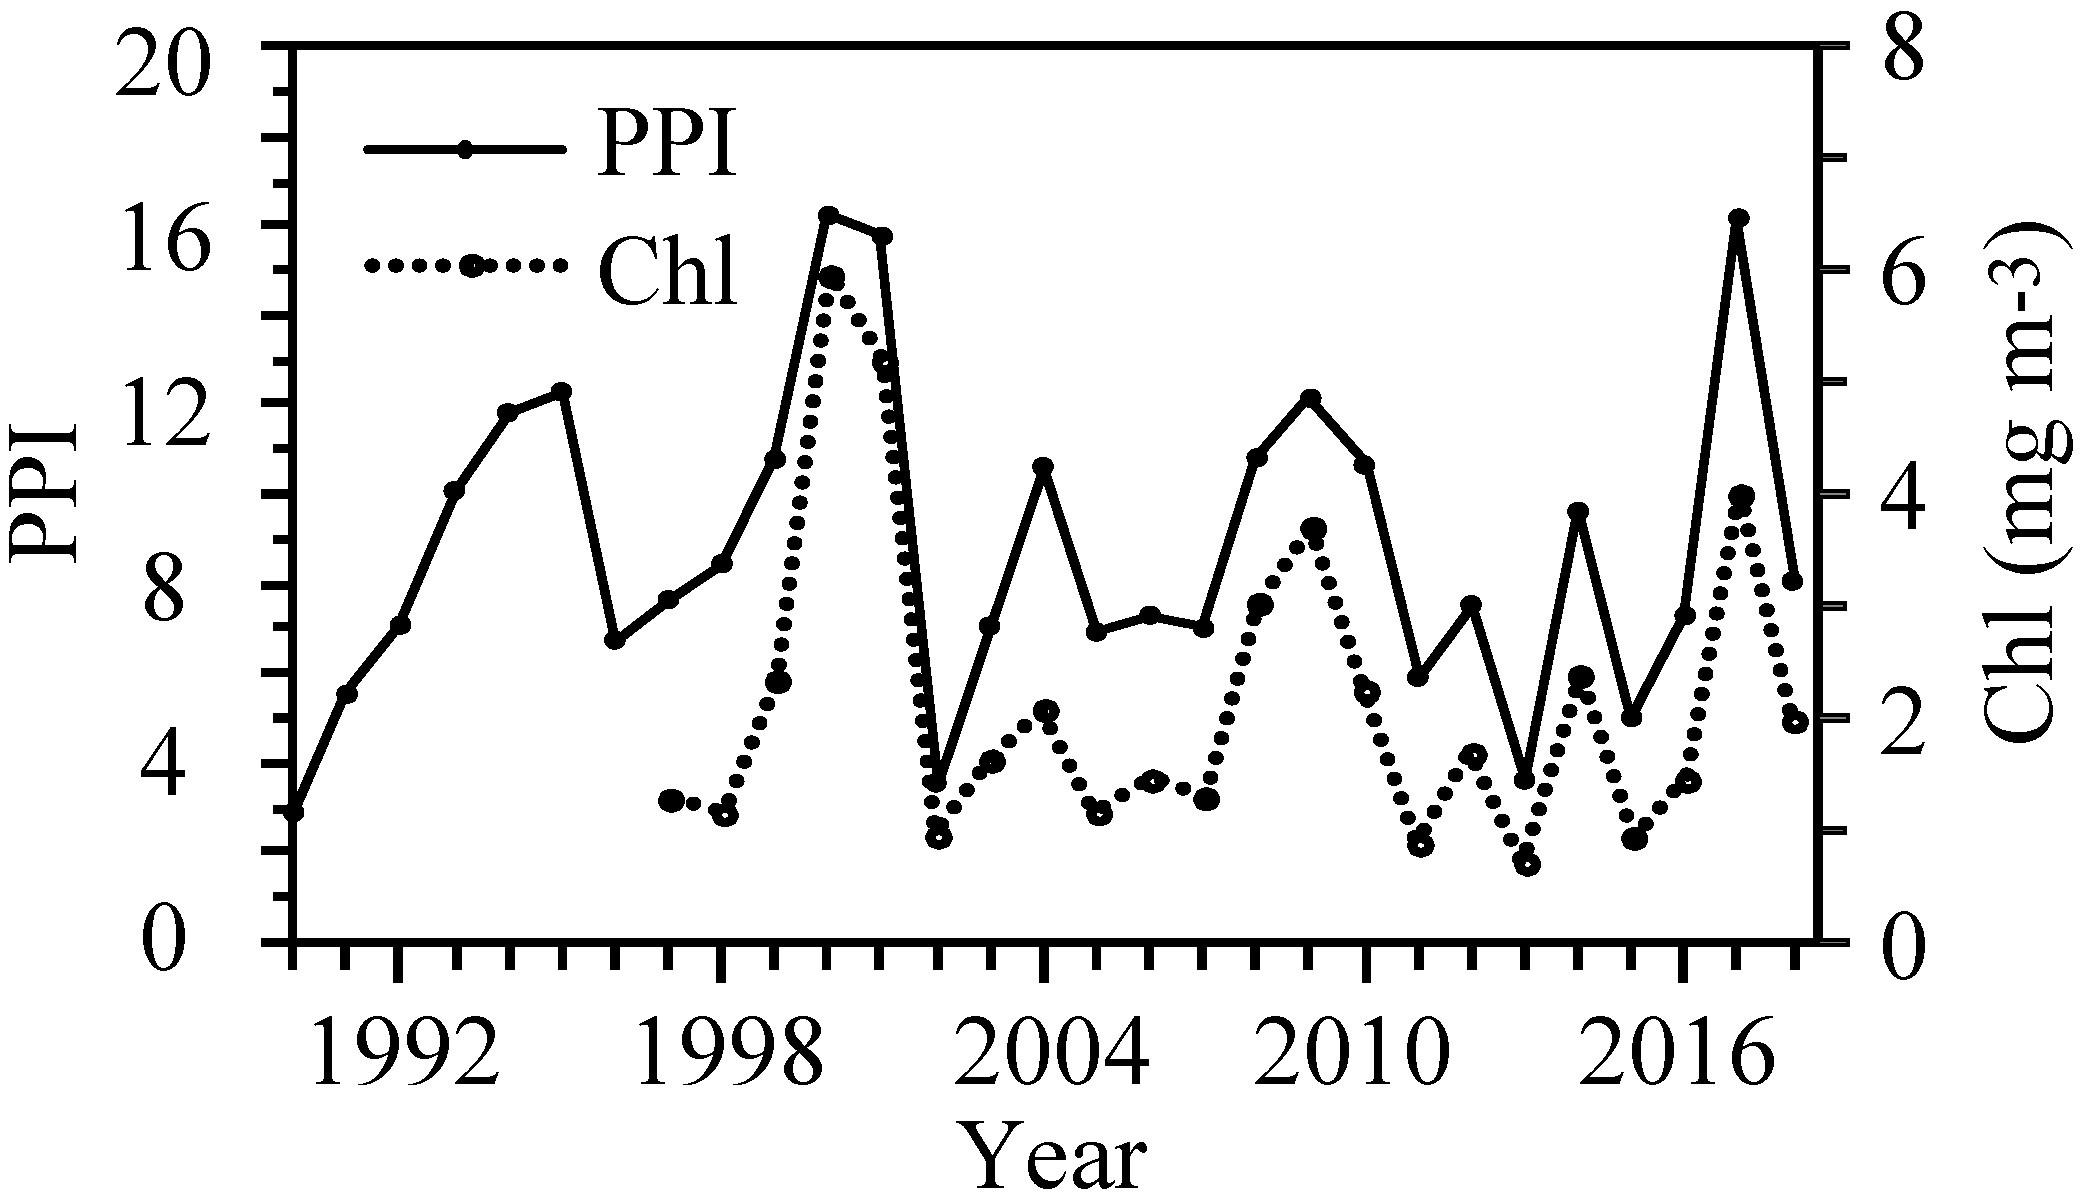
Figure 5. Inter-annual variations in the PPI in the CS 1990–2018 and in the daily chl concentration (mean April–June) at station S 1997–2018.
The PPI was highest in years with an early, intensive and prolonged bloom, i.e., 2000–2001 and 2017. When the spring bloom was delayed or disrupted, i.e., years 1999, 2004, 2008–2010, and 2014, the PPI was typically around average, while a late and low magnitude of spring bloom resulted in a below average index value (Figures 5, 6).
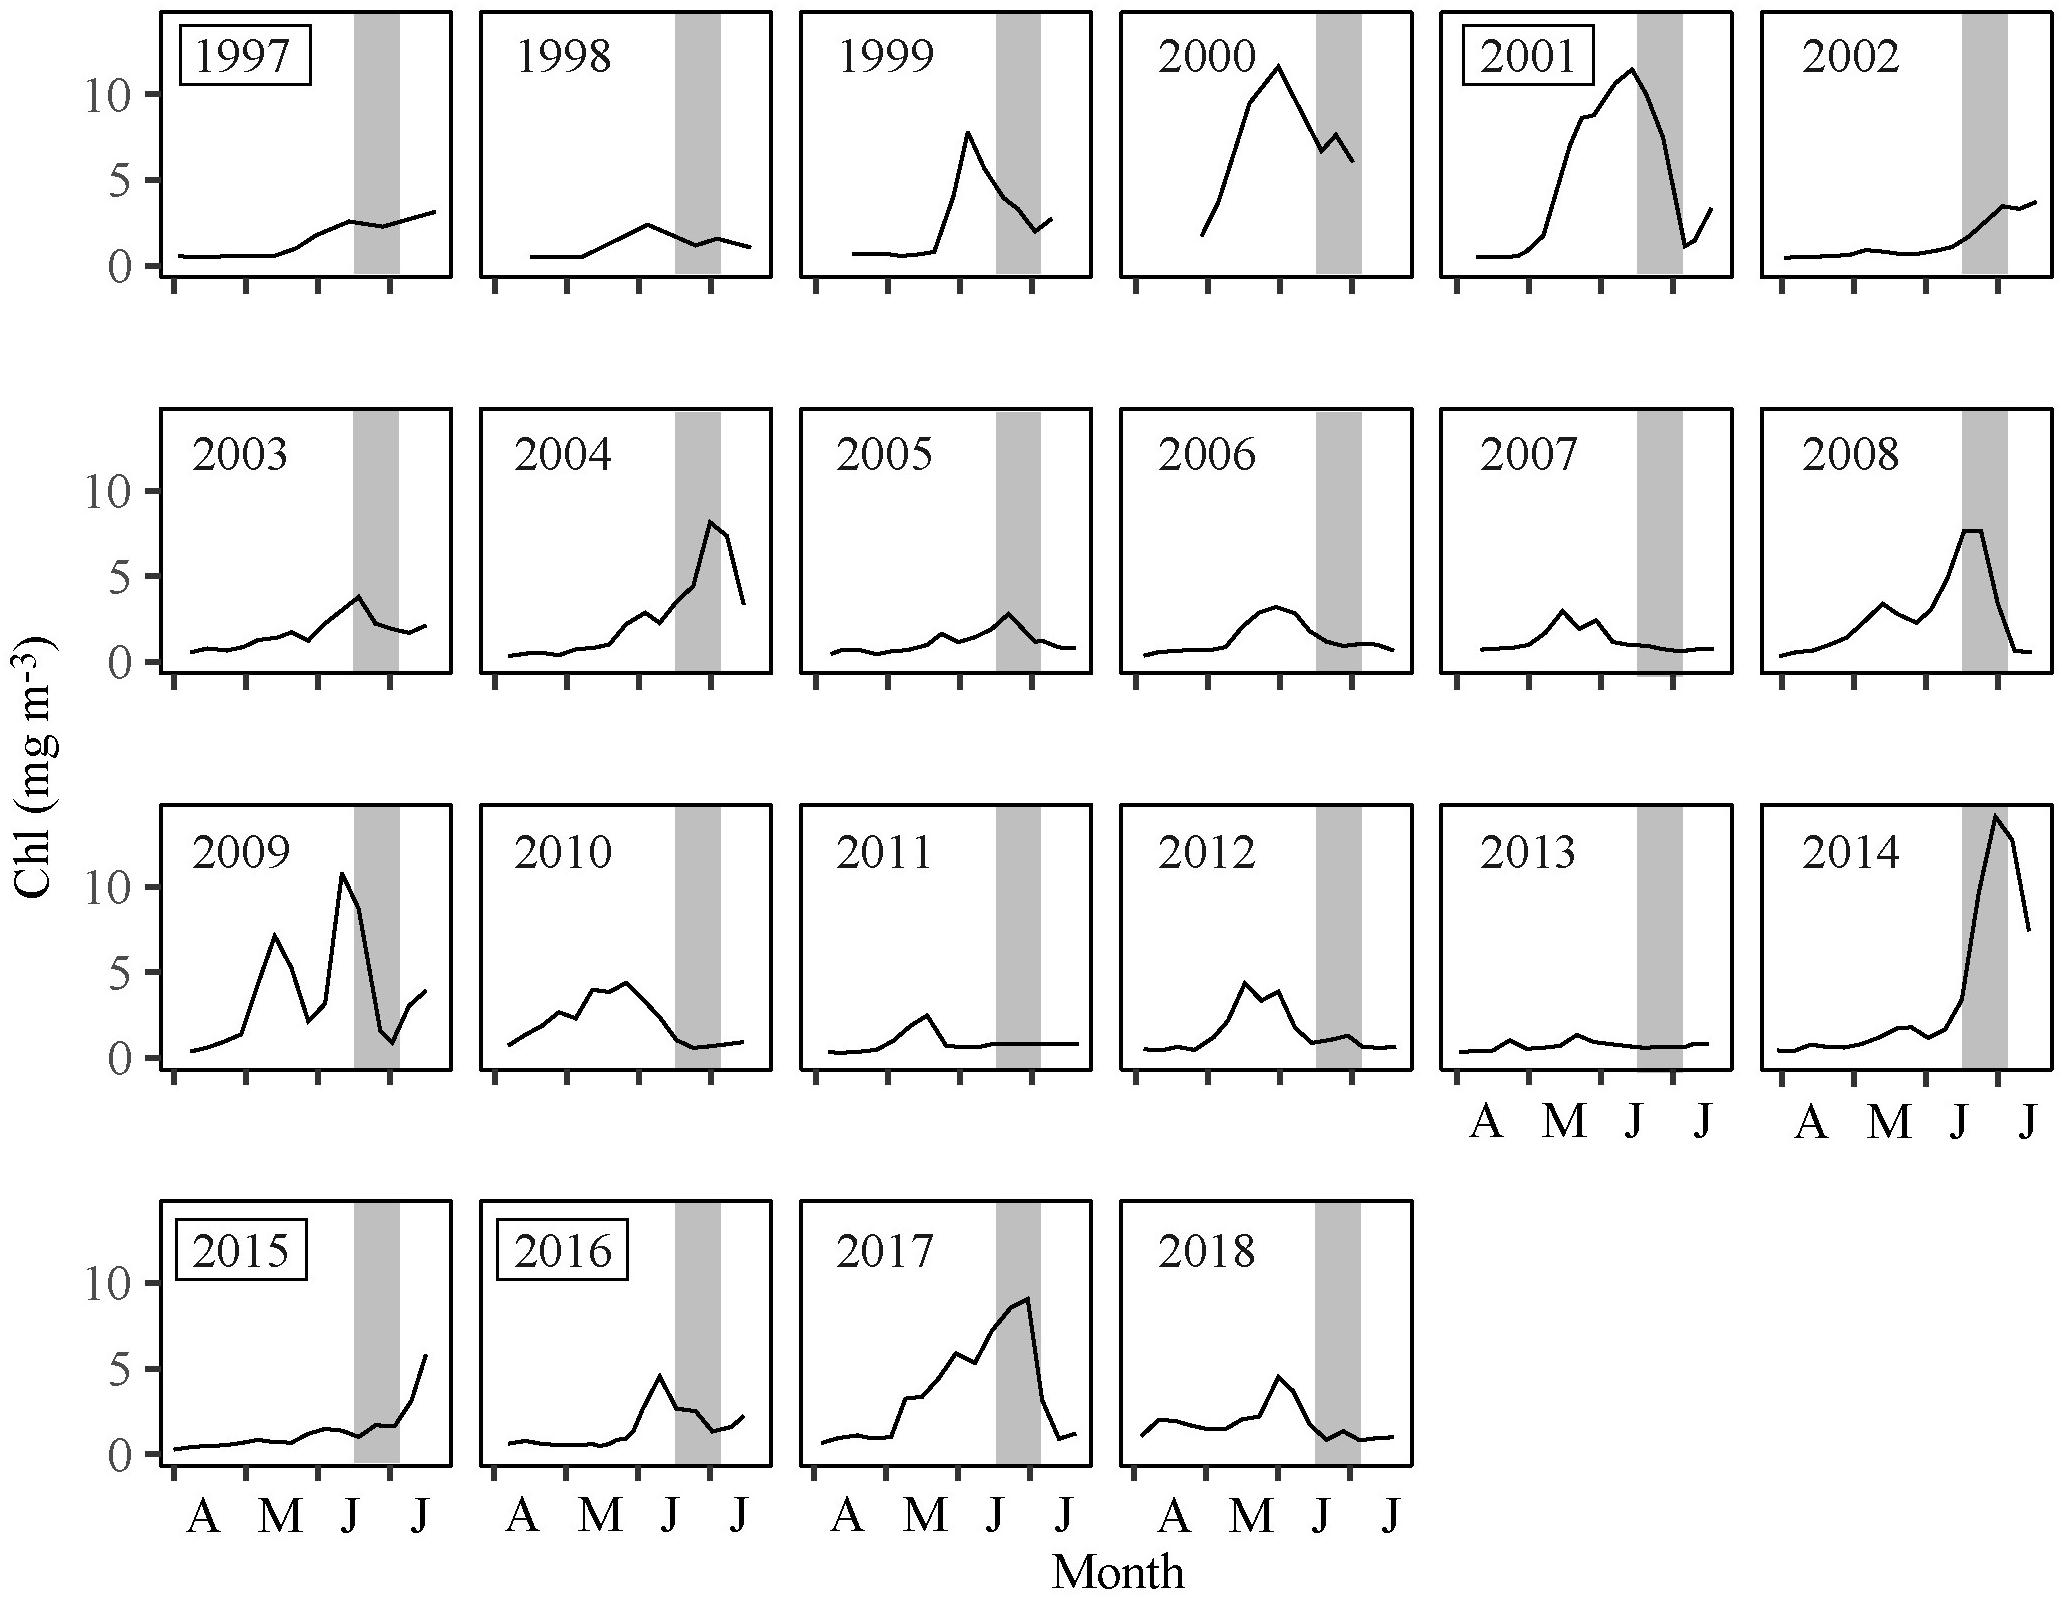
Figure 6. Chl at station S from April to July 1997–2018. The gray bars indicate the timing of the 0-group survey. Years enclosed in a box are years where subsamples of cod were age analyzed.
Furthermore, the abundance of copepod nauplii at station S followed the chl concentration with a 2 weeks delay (Figure 7).
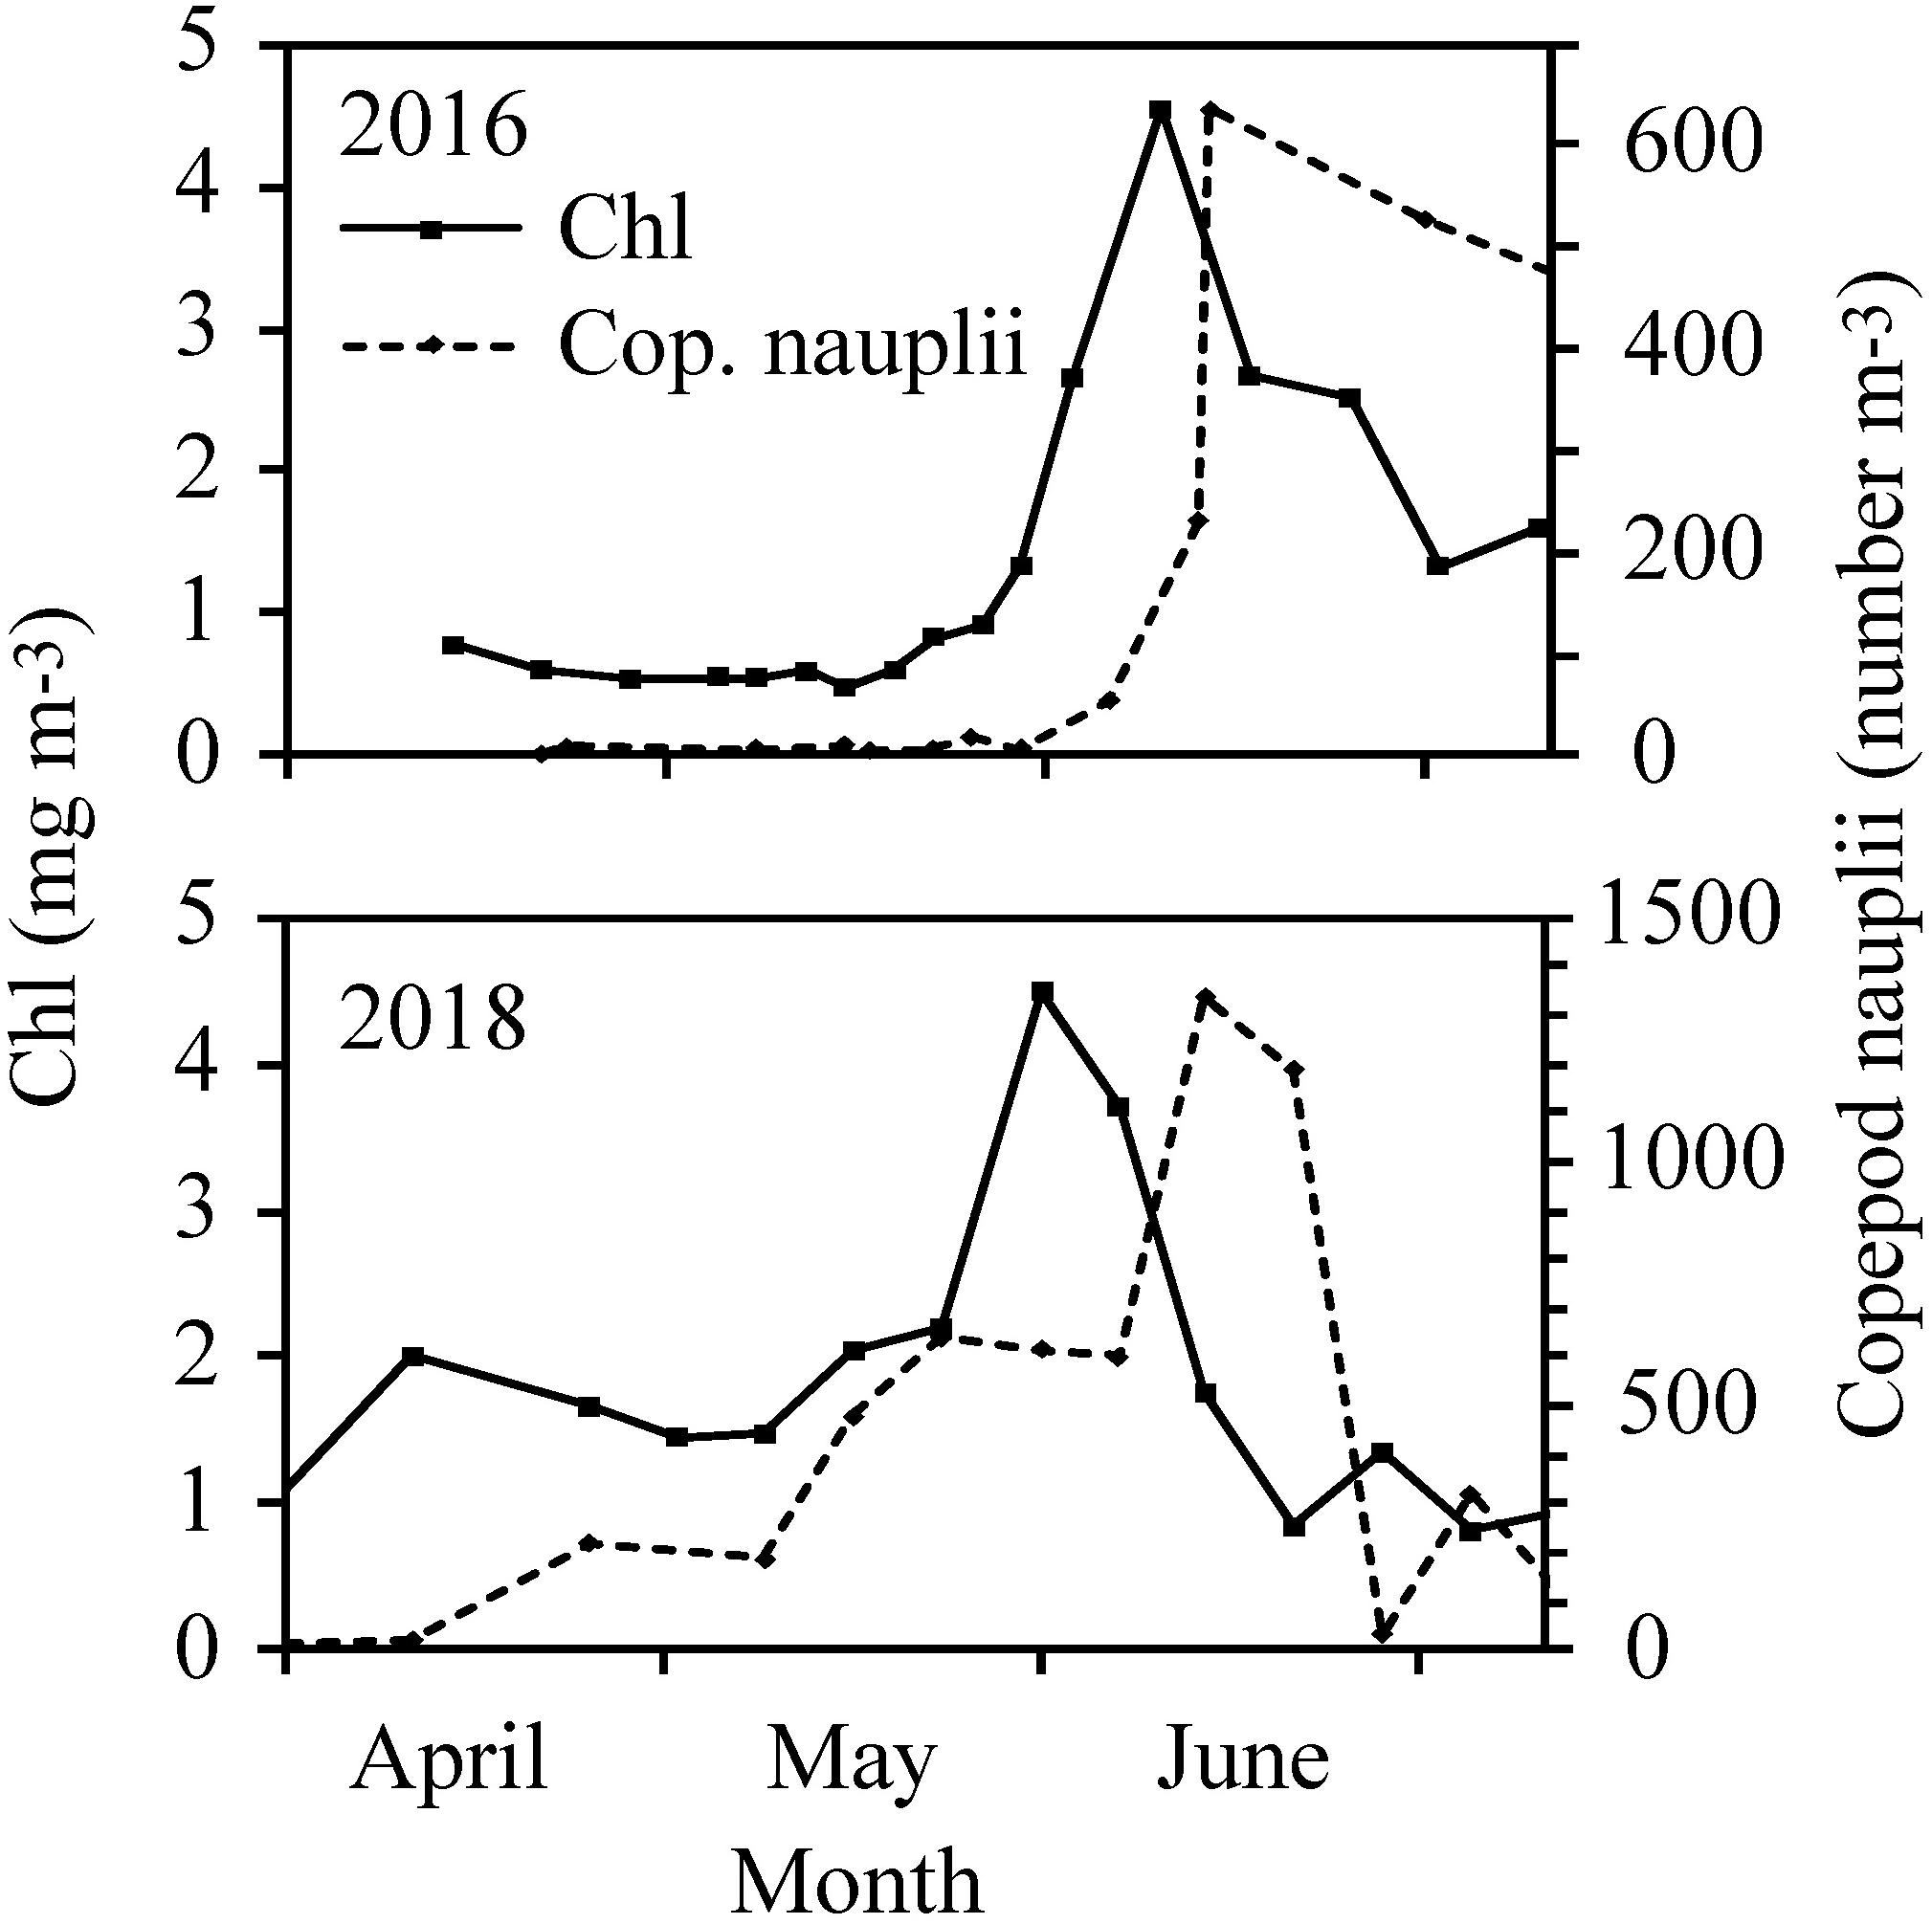
Figure 7. Chl and abundance of copepod nauplii at station S in 2016 and 2018.
However, in June the standing stock of zooplankton biomass was negatively related to the 0-group length index (Table 3 and Figure 4). And, when the 0-group biomass was at its highest (i.e., in 2000, 2001, and 2017) it exceeded the zooplankton biomass (Figure 4B). This indicates a top-down pressure effect of the 0-groups on the zooplankton.
Growth and/or Age? A Case Study Using Cod
In order to investigate if growth and age of the fish juveniles were different from 1 year to another, otoliths from 0-group cod from the contrasting 1997, 2001, 2015, and 2016 year-classes were examined. The length of the juveniles captured in 1997 and 2015 was well below the long-term mean. In 2016 the length was around average and in 2001 the length was well above the long-term mean (Figures 3B,C). A relationship between otolith growth and somatic growth was established by the curved positive correlation between estimated age and length of the cod juveniles (Figure 8). However, there was a significant effect of year on the size of the juveniles after controlling for age (ANCOVA, p < 0.01). Thus, any increase in age (i.e., a daily growth increment) of cod in one particular year would not necessarily reflect the same proportional increase in another year. This was especially true for the 2001 year-class, which was significantly larger at age than the 1997, 2015, and 2016 year-classes (Figure 8), indicating much higher growth rates in 2001 compared to the other years.
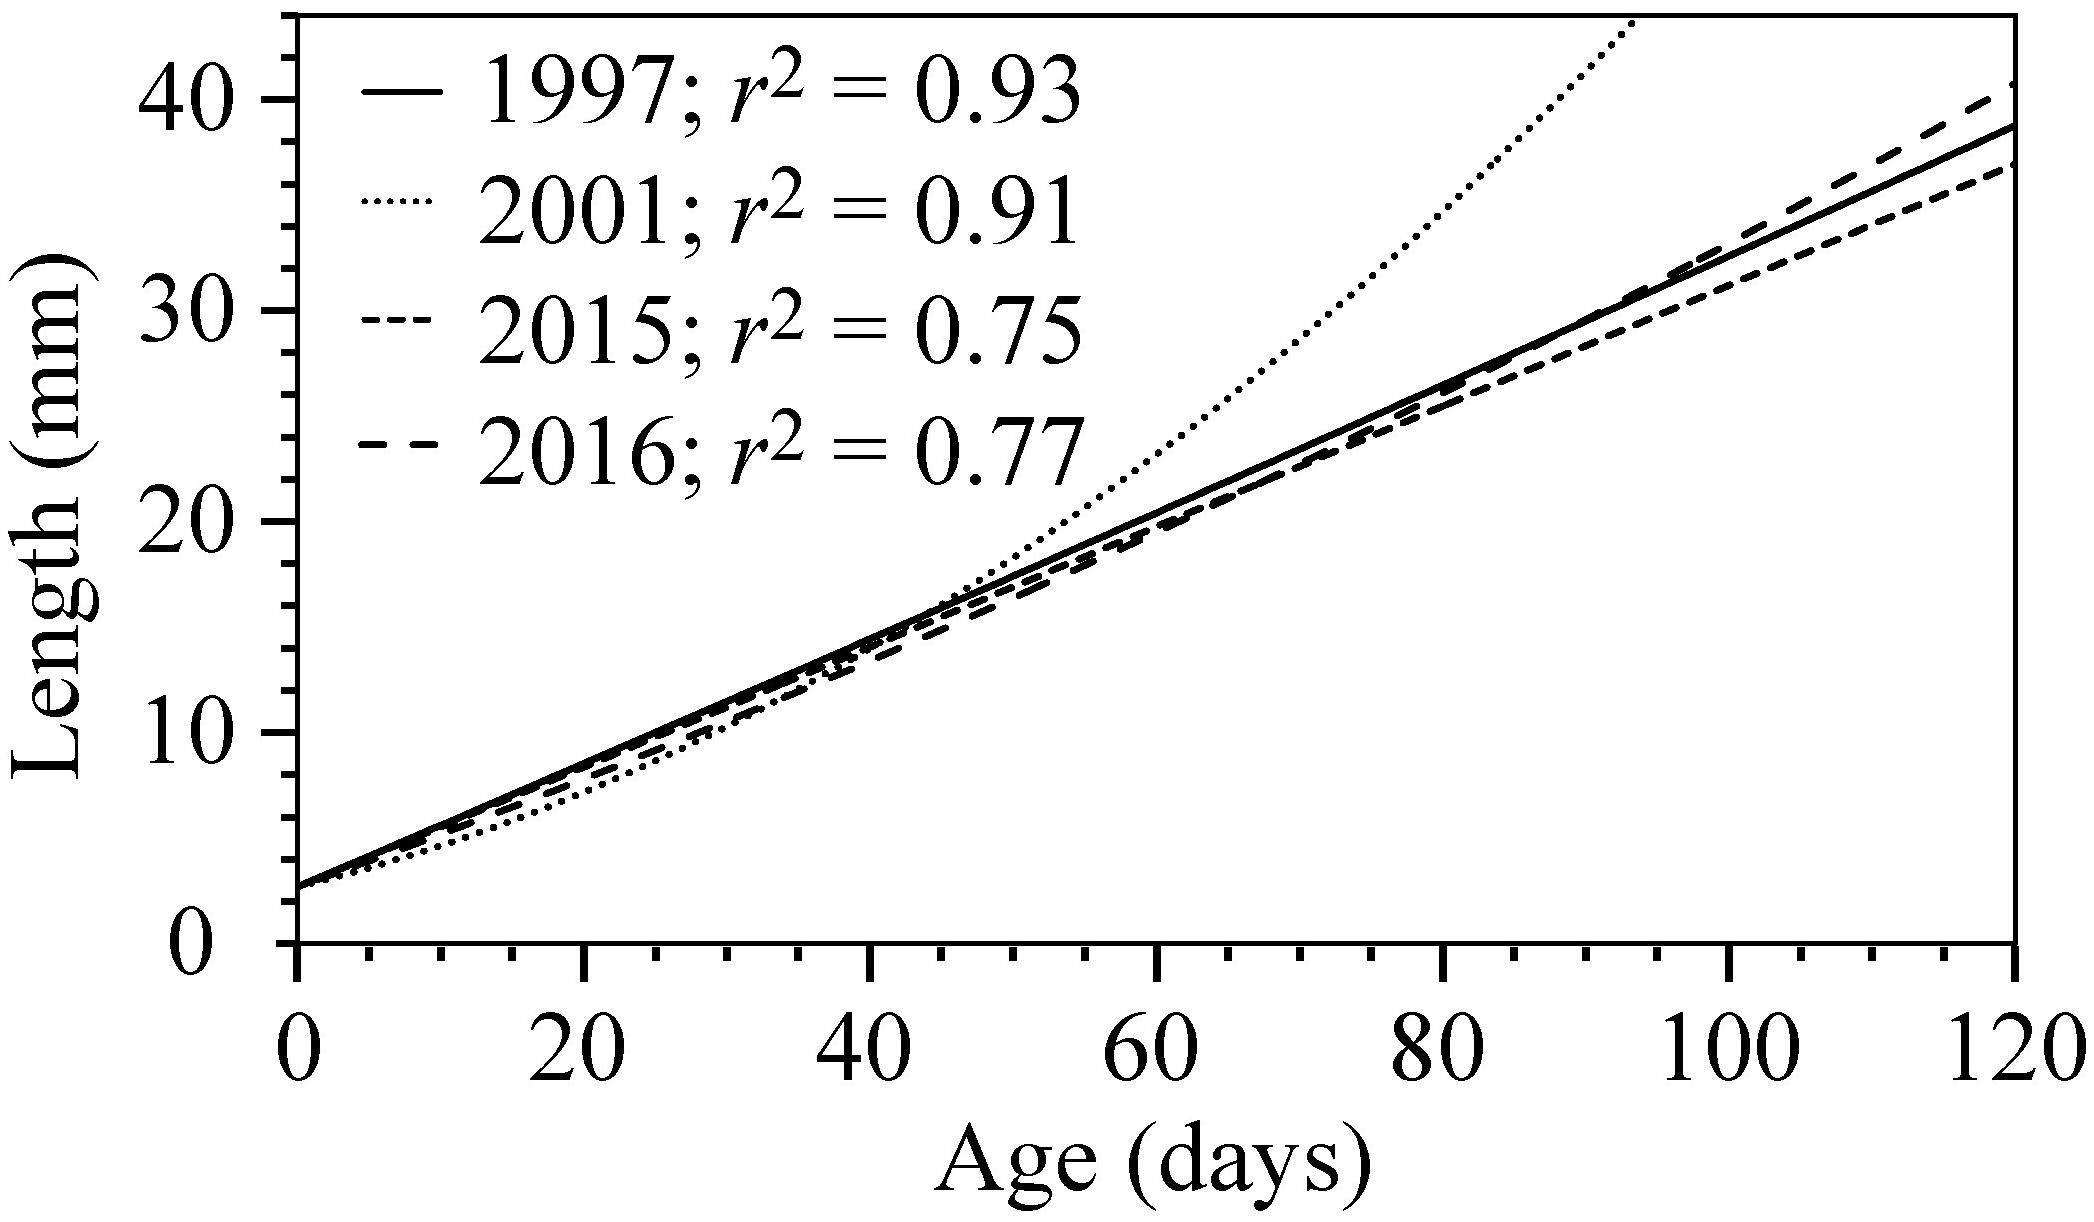
Figure 8. Growth curves of 0-group cod on the Faroe shelf in 1997 (n = 94), 2001 (n = 116), 2015 (n = 103), and 2016 (n = 81) estimated from age and length together with goodness of fit (r2).
The otolith age analyses revealed that the peak in hatch dates varied by almost a month between the 4 years studied (Figure 9). The back-calculation of hatch dates showed that the oldest cod juvenile was hatched on March 8, 2016, while the youngest was hatched on May 17, 1997. 50% of the juveniles were hatched before April 30, 1997, April 16, 2001, April 22, 2015, and April 3, 2016. The hatching was thus displaced 27 days between year 1997 and year 2016 (Figure 9). The variability in peak spawning date was 10 days and occurred earliest in 2016 (March 19) and latest in 2001 (March 29). The PPI was highest in 2001 (15.8) and lowest in 2015 (7.6) (Figure 4C), reflecting an early and intensive bloom in 2001 and a late and small spring bloom in 2015 (Figure 9). The temperature difference in the CS between 1997, 2001, 2015, and 2016 was negligible and within one standard deviation of the average for the years 1992–2016 (Figure 10).
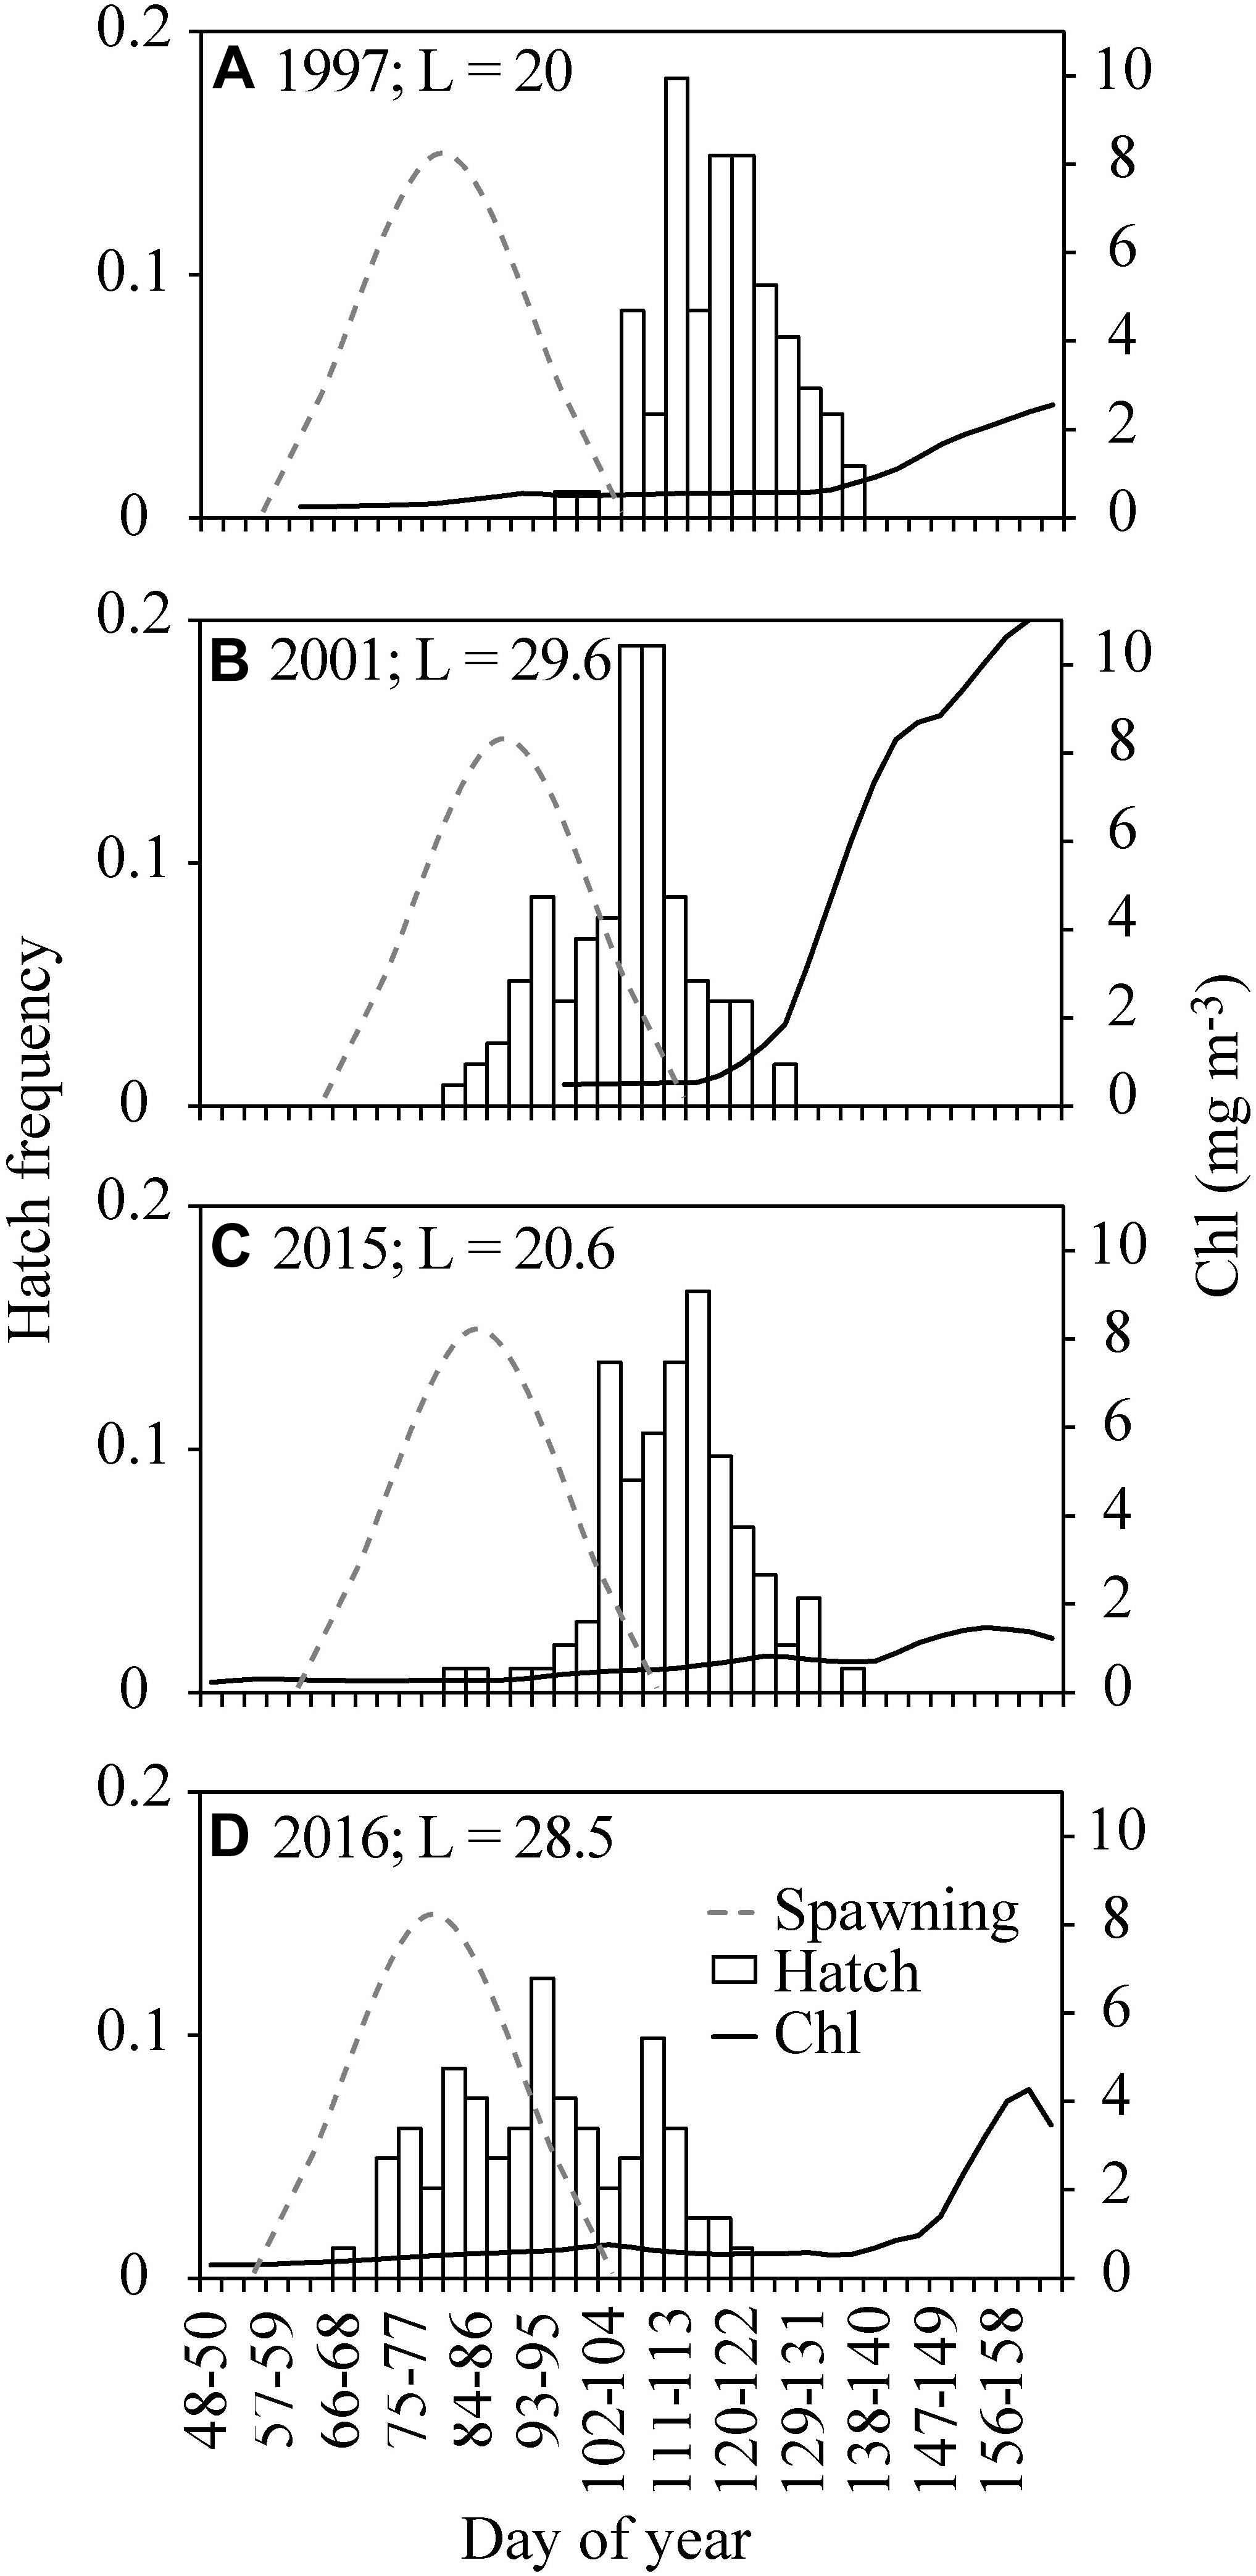
Figure 9. Back-calculated cod hatch day frequency histogram and estimated spawning distribution (dashed line) in (A) 1997, (B) 2001, (C) 2015, and (D) 2016 together with chl at station S (black line) from mid February to mid June (i.e., the beginning of the 0-group survey). The mean length (mm) (L) of the fish included in the otolith analysis is indicated for each year.
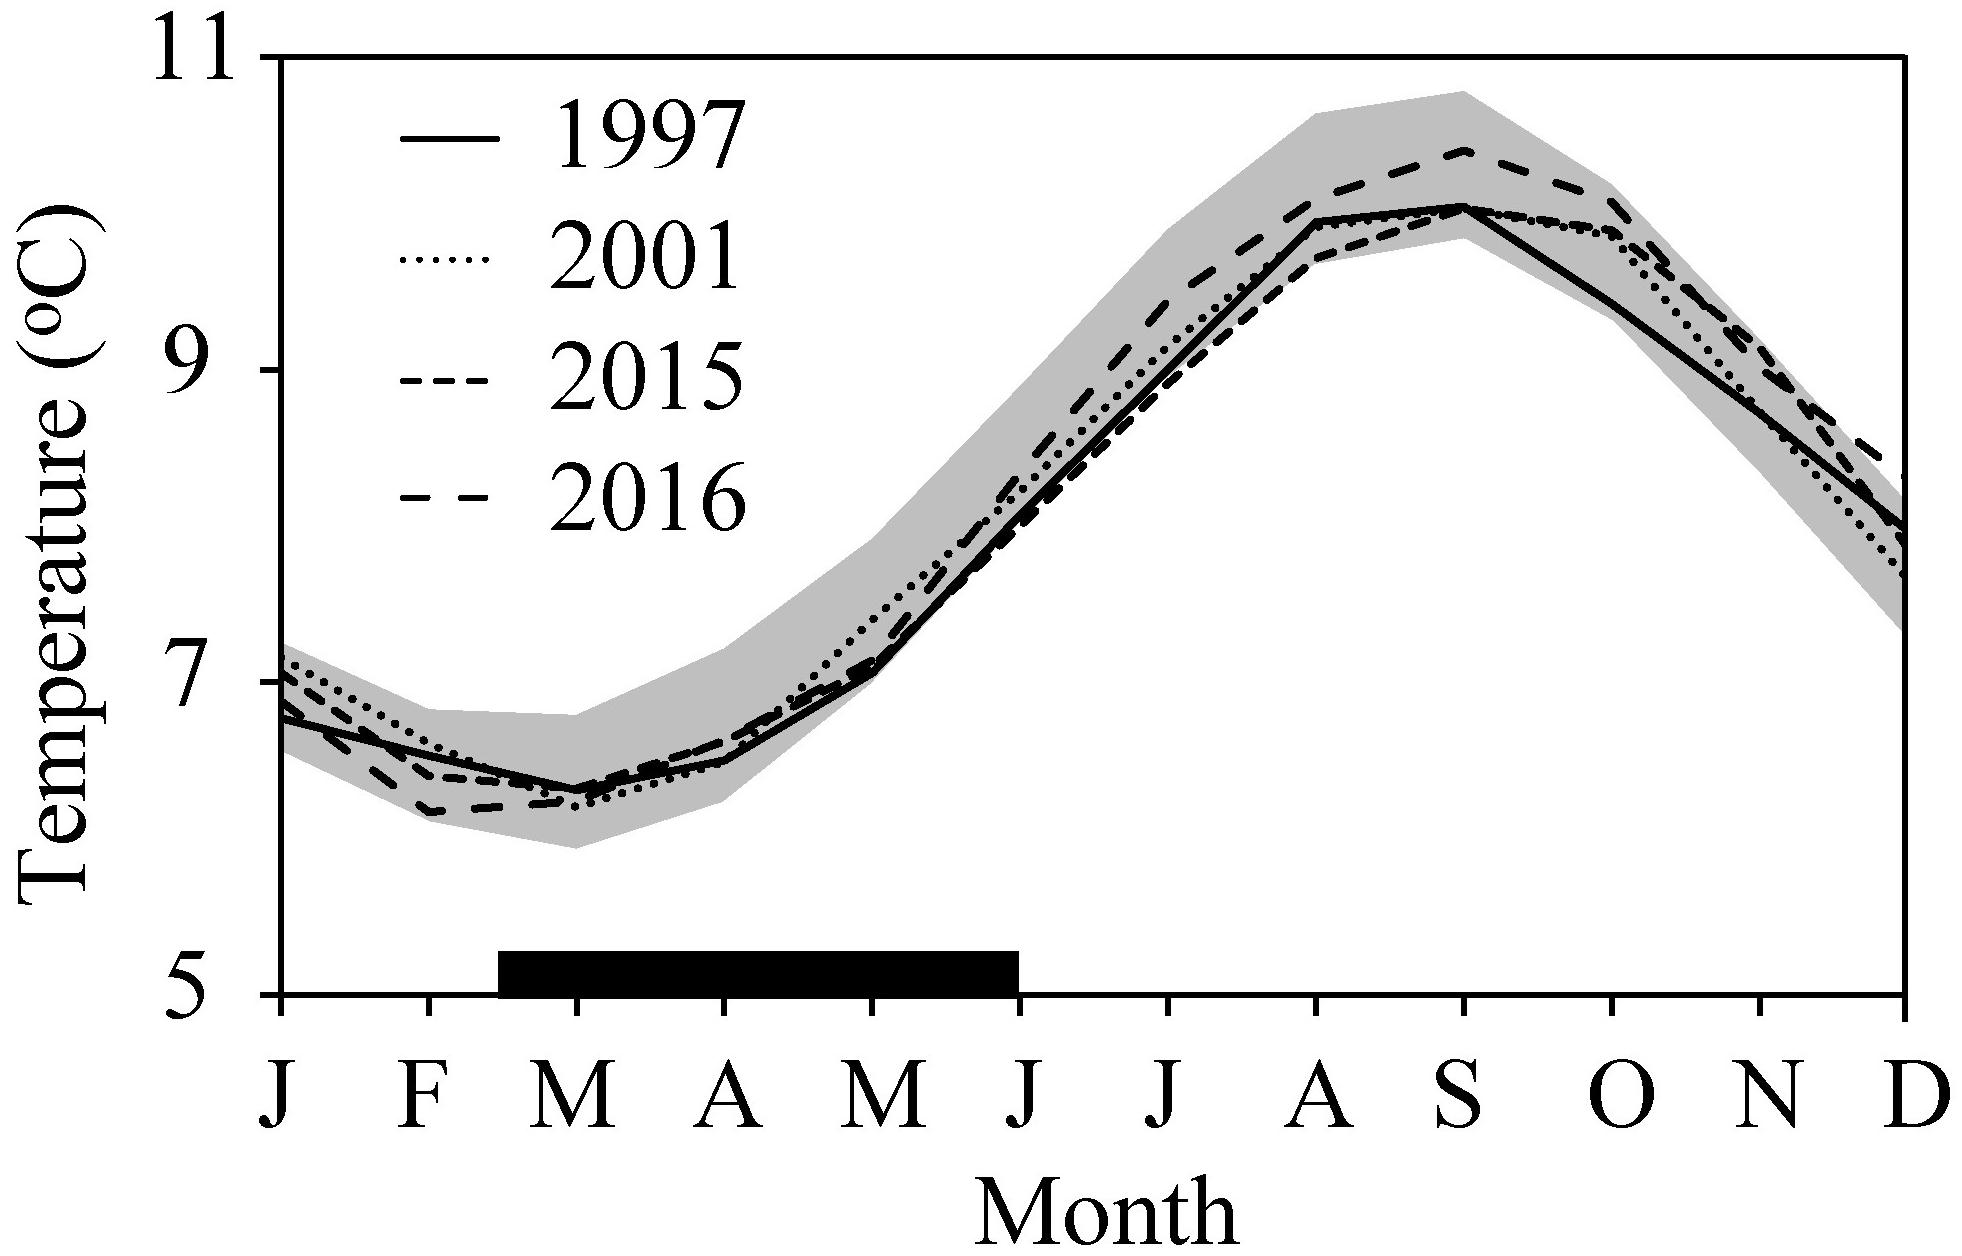
Figure 10. Temperature in the CS in 1997, 2001, 2015, and 2016. The gray area highlights the one standard deviation range from the average for the years 1992–2016. The thick black horizontal line marks the larval and pelagic juvenile period of cod.
Since the mean length of all four fish species, i.e., cod, haddock, Norway pout, and sandeel in late June co-varies (Figure 3B) it is reasonable to assume that the differences in growth and survival from 1 year to another observed in juvenile cod also exists in the other three fish species.
Discussion
In this paper, we have investigated the size and abundance of the four most abundant 0-group fish species on the Faroe shelf, i.e., cod, haddock, Norway pout and sandeel for the years 1983–2018 and studied their temporal (and spatial) variations in relation to relevant environmental variables. The outcome showed that the mean lengths of juveniles within the CS during June had a high inter-annual variability, and the temporal development was highly similar between the four species (Figure 3B). For all 0-groups, a relatively large length co-fluctuated with high abundances (Table 2). The close inter-annual synchrony between all four fish species justified an integration of all the fish records into a single 0-group length index. The main results showed that (i) the state of the juveniles appears to be regulated by the environmental conditions during spring – a bottom-up process – and that (ii) the juveniles, in turn, most likely regulate the biomass of zooplankton within the CS during summer – a top-down process.
Bottom-Up Processes During Spring
Our first finding, that the condition of the pelagic juveniles is regulated by bottom-up processes is supported by the positive correlations between the 0-group length index and the PPI (Table 3 and Figure 4). Evidence of a linkage between 0-group sandeel indices and the PPI has been shown before in Eliasen et al. (2011).
The growth rate of larvae and pelagic juveniles is generally expected to be higher in warm years provided that there are sufficient food resources (Houde, 1989; Folkvord, 2005). However, the CS 0-group length index did not follow the quite low variability in CS seawater temperature, and, if anything, the 0-group juveniles tended to be larger during cold years (Table 3). Therefore, there must be other effects such as earlier spawning, increased survival of the earliest hatched larvae and/or increased food availability to the larvae that over-ride the direct effects that temperature is expected to have on the size of the juveniles.
Under the assumption that cod spawns in several batches, distributed evenly through early spring and in a similar fashion every year, it is reasonable to assume that food limitation during the late spring/early summer months may have led to low survival in years with low primary production (as in 1997 and 2015) and vice versa in years with high primary production (as in 2001). However, the spawning timing is not entirely fixed (Figure 9). Thus, since the 0-group surveys are conducted at a given date (late June), one could argue that the 0-group index is simply regulated by variable spawning timing. To disentangle the relative importance of spawning variability vs. variability in survival and growth of the 0-groups, otolith age analysis on cod juveniles collected during four dissimilar years was conducted. The analysis showed that the juvenile cohort from 2001 was larger at age compared with the other cohorts (i.e., 1997, 2015, and 2016 cohorts) (Figure 8). Furthermore, the back-calculated hatch dates showed that the 2001 and 2016 cohorts were spawned earlier than the 1997 and 2015 cohorts, even though the spawning itself in 2001 occurred relatively late (Figure 9 – dashed lines). This suggests (i) better feeding conditions in 2001 (and 2016) compared with the other years, and (ii) better survival of the first spawned larvae in 2001 and 2016 compared with 1997 and 2015 (i.e., the larvae spawned during the early spawning period, i.e., February–March in 1997 and 2015 did not survive until the late June survey). Comparing the PPI values in these 4 years shows that the CS primary production was highest and extended from mid-February to late May in 2001, thus matching with the hatching and early larval phase of cod. Meanwhile, the PPI was below average in 1997 and 2015 as a result of a late and low spring bloom accompanying a mismatch between larvae and their prey.
On the Faroe shelf, once the spring bloom primary production has started, the secondary production follows shortly after (Figure 7; Gaard, 1999; Debes and Eliasen, 2006; Debes et al., 2008a; Jacobsen et al., 2018). Furthermore, there is a significant positive relationship between the phytoplankton biomass (chl) and abundance of small- and medium-sized zooplankton (<1.2 mm) in particular neritic copepods in spring (Jacobsen et al., 2018). Cod larvae select these small- to medium-sized (mainly) neritic copepods during mid-late May (Gaard and Steingrund, 2001). The abundance of neritic zooplankton therefore most likely affects the feeding conditions of small fish larvae during spring, and could thus be a major factor affecting the abundance of fish larvae and juveniles in spring and summer.
However, the bloom initiation (i.e., the time when the chl concentration exceeds 1 mg m–3) (Eliasen et al., 2017a, 2019) was still at best approximately 2 weeks after the peak in hatch dates (Figure 6). This indicates that the first few weeks of larval feeding, i.e., the feeding on copepod eggs, is not dependent on the local chl concentration. C. finmarchicus produces eggs during the pre-bloom phase based on winter lipid reserves (Jónasdóttir et al., 2008; Madsen et al., 2008), and on-shelf transport of C. finmarchicus eggs and nauplii is also considered to be an important food source for fish larvae during spring on the Faroe shelf (Gaard and Steingrund, 2001).
To unravel the relative importance of neritic vs. oceanic zooplankton for the fish larvae within the CS, more research is required. For our subsequent discussion it suffices to realize that the neritic zooplankton species mainly rely on the on-shelf primary production, while the abundance of the oceanic C. finmarchicus depends on both the local production in addition to the abundance in and exchanges with the open ocean surrounding the Faroe shelf.
The drivers underlying the marked inter-annual variability in primary production in the CS spring bloom are still not thoroughly understood. A so-called critical volume hypothesis, involving the establishment and shoreward movement of the tidal front together with variable isolation, has recently been suggested to explain the onset timing of the bloom (Eliasen et al., 2019). The diatom-dominated spring bloom usually becomes silicate limited in spring/summer, and a prerequisite for a prolonged diatom bloom is an erosion of the shelf front giving access to a silicate reservoir at depth on the outer shelf (Eliasen et al., 2017b). Silicate concentrations across the north Atlantic have similar trends and peaks (Figure 4D) and are linked to the subpolar gyre dynamics as represented by the gyre index (Hátún et al., 2017b). The silicate concentration off the Faroe shelf may therefore influence the intensity of the CS primary production, in addition to the oceanic phytoplankton dynamics (Allen et al., 2005; Pacariz et al., 2016).
There was a synchrony between peaks in the silicate concentration off the Faroe shelf (Figure 4D) and in the CS 0-group length index (Figure 4A). There was also a significant positive correlation between silicate and the PPI (p < 0.05) (Table 3). In addition, the oceanic silicate concentrations may also be an indicator of the oceanic concentration of C. finmarchicus (Hátún et al., 2016, 2017a). The zooplankton biomass south of Iceland (Hátún et al., 2016, 2017a) and in subarctic waters north of the Faroe slope (Kristiansen et al., 2019) has been linked to the gyre index. Hence, the marked peaks in silicate that are also recognized in the 0-group length index may also represent an increased production of off-shelf C. finmarchicus. In this way, the dynamics of the subpolar gyre may influence both the CS primary production and the CS zooplankton biomass.
Top-Down Processes During Summer
Our second finding, that the fish juveniles affect the concentration of zooplankton within the CS during summer is supported by the significant negative relationship between the 0-group length index and the standing stock of zooplankton biomass during late June – both in time (Table 3 and Figure 4) and space (Figure 2). A comparison between the 0-group biomass and the zooplankton biomass (Figure 4B) in late June showed that the estimated 0-group biomass in years with a high 0-group length index exceeded the zooplankton biomass – which thus supports the above mentioned top-down statement. In addition to fish juveniles, adult sandeel seems to be the only significant predator on the zooplankton in the Faroe shelf ecosystem. However, due to large predation by e.g., adult cod, haddock and many seabird species (Gaard et al., 2002), the number of adult sandeel is usually much smaller than the number of fish juveniles. Other predators on the zooplankton such as larger zooplankton usually are of very minor importance. A possible top-down regulation by the Faroe shelf 0-groups on the zooplankton during summer has only briefly been mentioned in the literature before as a secondary finding in a study by Gaard and Reinert (2002). However, this type of relationship between zooplankton and higher trophic levels is recognized in other marine ecosystems (e.g., Frank et al., 2005, 2007; Fauchald et al., 2011).
A previous attempt to explain the inverse relation between the PPI and the summer zooplankton biomass involved an exchange hypothesis which suggested that the observed low zooplankton biomass within the CS in late June in years with a high PPI was a result of low influx of C. finmarchicus from off-shelf waters and vice versa in years with a low PPI (Hansen et al., 2005). However, the evidence for a relationship between zooplankton biomass and advection remains elusive (Jacobsen et al., 2018). Here, we hypothesize that in years with an early and intensive spring bloom, stimulating early and high abundance of neritic small- to medium-sized copepods, the abundance and feeding conditions of larvae in spring (April and May) are good and the abundance and growth of the fish 0-groups is high. This high abundance of the 0-groups may then be able to predate down the copepods during May and June. In years with late and low phytoplankton growth in spring the situation is reversed.
A top-down regulation by the 0-groups on the zooplankton implies that there might be food shortage at the late juvenile period in years with high growth and survival. This is supported by a study by Gaard and Reinert (2002) who found a high proportion of empty cod and haddock stomachs in late June. Furthermore, a study by Jacobsen (in prep.) on the feeding ecology of cod in the CS shows that in late June there is a higher proportion of empty stomachs in juveniles in good years (i.e., 2000 and 2001) compared with poor years (i.e., 2004–2005) indicating food scarcity in the second half of June in good years.
Links to Other Trophic Levels in the Ecosystem
The 0-groups are preyed upon by several fish and seabird species in the CS (Gaard et al., 2002; Eliasen et al., 2011; Homrum et al., 2012), and thus likely affect their predators’ growth, abundance and distribution. The breeding success of Faroe blacklegged kittiwakes (Hátún et al., 2017b), which prefer 0-group sandeel in the CS during summer, corresponds well with the 0-group length index with peaks in 1994–1995, 2000–2001, and 2009 (Figure 11). This indicates a coupling between the 0-group strength and the kittiwake breeding success. Kittiwakes are widely used as indicators of marine ecosystem status (Hamer et al., 1993; Frederiksen et al., 2007a; Wanless et al., 2007; Cook et al., 2014; Hátún et al., 2017b). Similar fluctuations are furthermore identified in a broad selection of higher trophic level records from the Faroe shelf (Gaard et al., 2002; Steingrund and Gaard, 2005; ICES, 2018). Hence, the 0-groups very likely have key roles in the CS ecosystem as intermediate species that connect the plankton to non-planktivorous species, and potentially also by influencing the abundance of planktivorous pelagic fish species and other planktivorous animals. A comprehensive description of the bottom-up impact of the variable 0-group abundance on upper trophic level species warrants an analogous study on this particular topic.
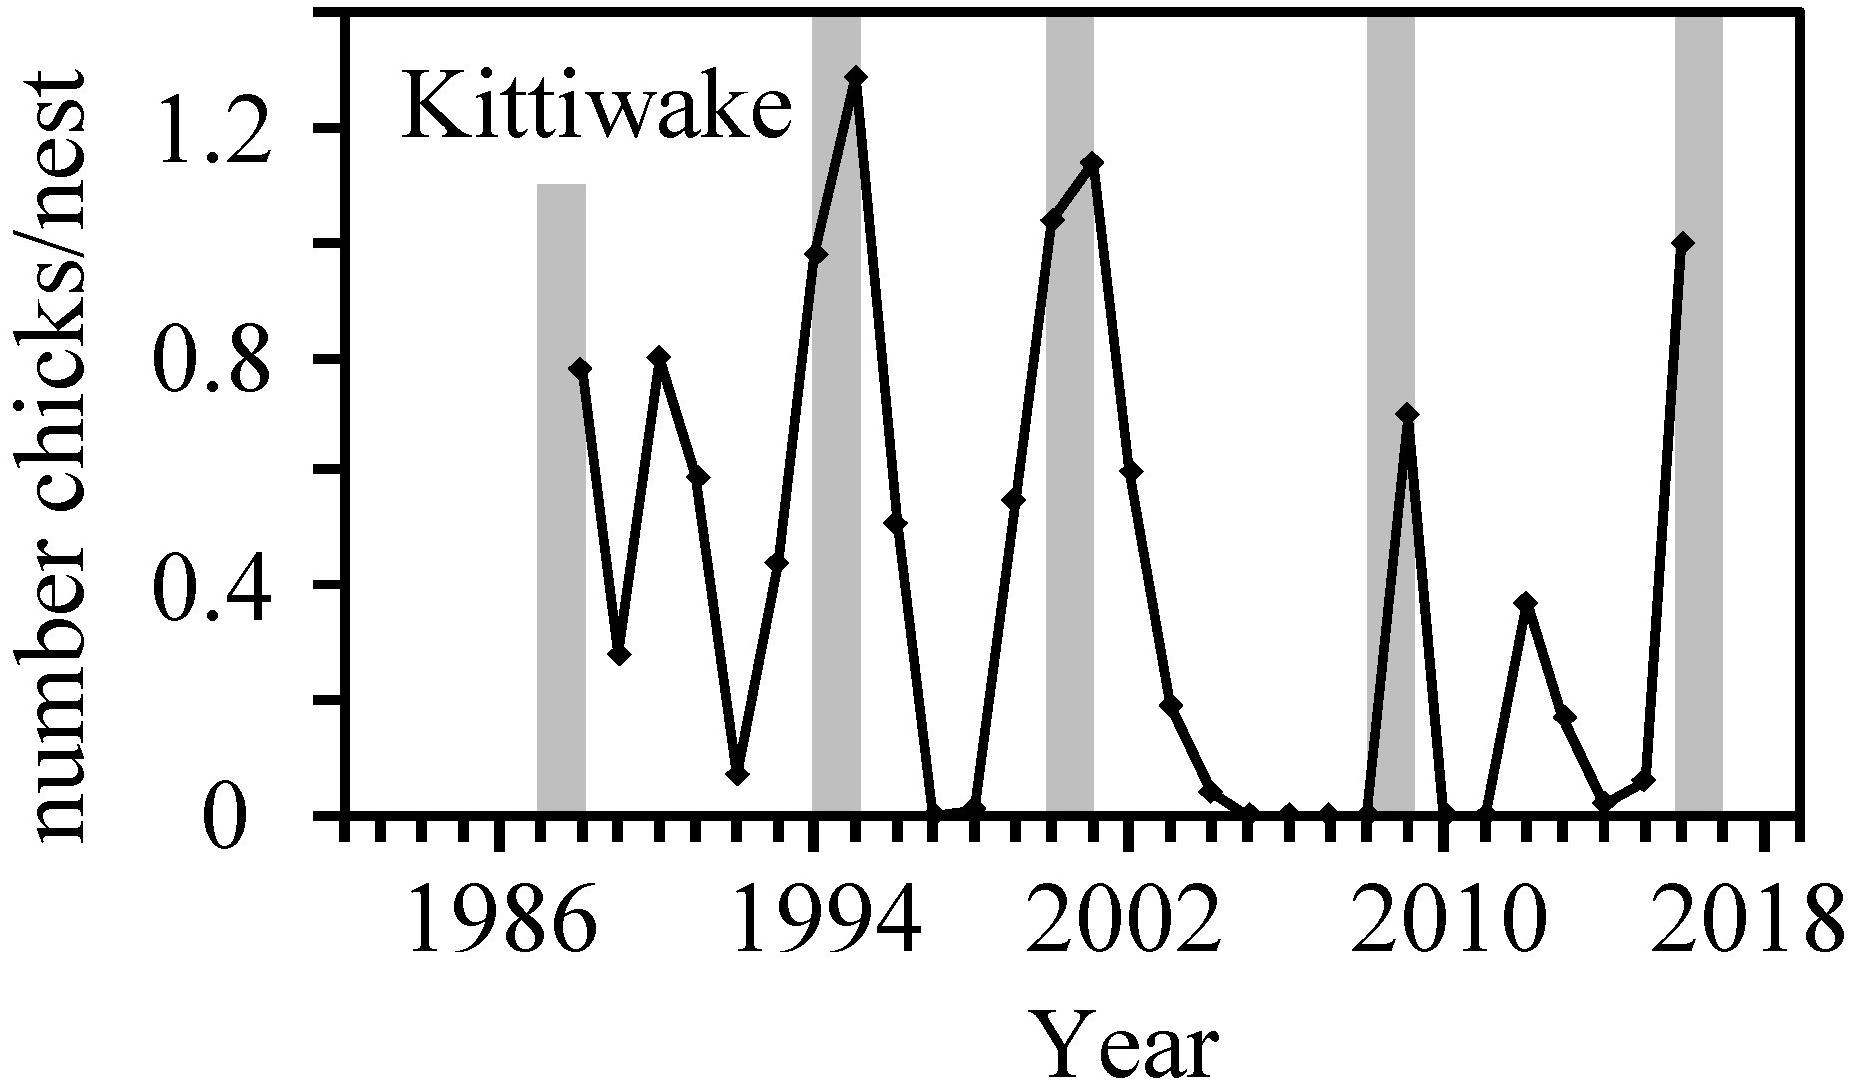
Figure 11. The breeding success of the Faroe kittiwake from Hátún et al. (2017b). The gray bars are equivalent to the gray bars in Figure 4.
Moreover, the abundance of mackerel increased in the Faroe area after 2005 (Nøttestad et al., 2016), and local fishermen have postulated that this pelagic predator could have influenced the year-class strengths of cod and haddock. The results in the present paper suggest, however, that the mechanism may be the direct opposite: low abundances of fish larvae and pelagic juveniles from demersal species are not able to graze down the zooplankton biomass during summer, and this leaves a considerable food source to migrating pelagic fish such as mackerel.
The grazing-down of zooplankton by fish larvae could potentially lead to reduced growth or survival of fish juveniles later in life. However, that appears not to be the case as shown by the positive correlation between 0-group indices and subsequent recruitment to the fishable stock of cod and haddock (Jákupsstovu and Reinert, 1994; Steingrund et al., 2010). A potential reason for this could be that cod and haddock juveniles stop feeding on zooplankton after they have settled to the bottom and target benthic prey instead. Other processes, such as cannibalism, may also affect recruitment of cod (Steingrund et al., 2010). The present study focuses on processes during the first spring-summer season, and can provide a basis for follow-up studies on the relationship between the 0-group and recruitment to the commercial fish stocks.
Conclusion
The four discussed species, cod, haddock, Norway pout, and sandeel amount to more than 90% of the total juvenile fish abundance on the central Faroe shelf. Close inter-annual synchrony between all four fish species justified an integration of all the fish records into a single so-called 0-group length index. The 0-group growth and survival in the central Faroe shelf was found to be bottom-up controlled and highly dependent on the spring bloom primary production with large growth and high survival in years with an early and prolonged plankton bloom. The dynamics of the subpolar gyre might also play a role in the state of the 0-group through its regulation of the pre-bloom silicate concentrations and/or abundance of C. finmarchicus in the oceanic waters surrounding the Faroe shelf. Subsequently, the inter-annual variability in biological production in the central Faroe shelf ecosystem shows increased productivity typically for a couple of years with a 5–8 year period. The fish growth and survival clearly appears to be bottom-up regulated, but then shifts to top-down regulation as the season progresses. The juveniles likely have a significant ecological role by their top-down predation pressure on the zooplankton biomass during summer and, at least in the case of sandeel and Norway pout, fueling higher trophic levels, e.g., demersal fish stocks and seabird populations. Our novel 0-group length index should therefore be regarded as a key ecological indicator for the environmental/biological conditions in the central Faroe shelf ecosystem. A more detailed investigation on the feeding ecology of the 0-groups during spring and summer is, however, warranted.
Author Contributions
SJ composed the story told, did all the data analyses, participated in the fish 0-group surveys and the production of the cod otolith data in 2015–2016, and led the writing process. EG produced the plankton data. PS produced the underlying cod data. HH developed the underlying North Atlantic marine climate data. KL produced the Faroe shelf climate data. JR produced the 0-group survey data from the beginning until 2017. SÓ produced the Icelandic nutrient data. MP produced the cod otolith data in 1997 and 2001. HV produced the 0-group survey data in 2018. All co-authors have read, commented, and agreed to the manuscript before submission.
Funding
The research leading to these results has received funding from the Faroese Research Council under grant agreement no. 0443 and Statoil Faroes.
Conflict of Interest Statement
The authors declare that the research was conducted in the absence of any commercial or financial relationships that could be construed as a potential conflict of interest.
Acknowledgments
We would like to thank Prof. Arild Folkvord and colleagues at the University of Bergen for help with the otolith analysis. We would like to give our thanks to colleagues at the Faroe Marine Research Institute for constructive discussions during the writing process. We are also grateful for the constructive comments made by the independent reviewers.
Footnotes
- ^ If nothing else is stated, then all tables and figures are based on data from the second half of June.
References
Allen, J. T., Brown, L., Sanders, R., Moore, C. M., Mustard, A., Fielding, S., et al. (2005). Diatom carbon export enhanced by silicate upwelling in the northeast Atlantic. Nature 437, 728–732. doi: 10.1038/nature03948
Anderson, J. T. (1988). A review of size dependent survival during pre-recruit stages of fishes in relation to recruitment. J. Northwest Atl. Fish Sci. 8, 55–66. doi: 10.2960/j.v8.a6
Anderson, J. T., and Dalley, E. L. (2000). Inter-annual differences in hatching times and growth rates of pelagic juvenile cod in newfoundland waters. Fish Res. 46, 227–238. doi: 10.1016/s0165-7836(00)00148-x
Astthorsson, O. S., Gislason, A., and Gudmundsdóttir, A. (1994). Distribution, abundance, and length of pelagic juvenile cod in Icelandic waters in relation to environmental conditions. ICES Mar. Sci. Symp. 198, 529–541.
Beaugrand, G., Brander, K. M., Lindley, J. A., Souissi, S., and Reid, P. C. (2003). Plankton effect on cod recruitment in the North Sea. Nature 426, 661–664. doi: 10.1038/nature02164
Cook, A. S. C. P., Dadam, D., Mitchell, I., Ross-Smith, V. H., and Robinson, R. A. (2014). Indicators of seabird reproductive performance demonstrate the impact of commercial fisheries on seabird populations in the North Sea. Ecol. Indic. 38, 1–11. doi: 10.1016/j.ecolind.2013.10.027
Cushing, D. H. (1990). Plankton production and year-class strength in fish populations: an update of the match/mismatch hypothesis. Adv. Mar. Biol. 26, 249–293. doi: 10.1016/s0065-2881(08)60202-3
Debes, H., Eliasen, K., and Gaard, E. (2008a). Seasonal variability in copepod ingestion and egg production on the Faroe shelf. Hydrobiologia 600, 247–265. doi: 10.1007/s10750-007-9238-9233
Debes, H. H., Gaard, E., and Hansen, B. (2008b). Primary production on the faroe shelf: temporal variability and environmental influences. J. Mar. Sys. 74, 686–697. doi: 10.1016/j.jmarsys.2008.07.004
Debes, H. H., and Eliasen, K. (2006). Seasonal abundance, reproduction and development of four key copepod species on the Faroe shelf. Mar. Biol. Res. 2, 249–259. doi: 10.1080/17451000600798787
Debes, H. H., Hansen, B. W., Hansens, P. J., and Hansen, P. J. (2005). The relative importance of protozooplankton and copepods as grazers on phytoplankton during a spring bloom situation on the Faroe Shelf. Fróðskaparrit 53, 82–99.
Djurhuus, A., Jørgensen, J., Hátún, H., Debes, H. H., and Christiansen, D. H. (2015). Seasonal progression of microbial communities on the faroe shelf. Mar. Biol. Res. 11, 895–908. doi: 10.1080/17451000.2015.1041532
Eliasen, K., Reinert, J., Gaard, E., Hansen, B., Jacobsen, J. A., Christensen, J. T., et al. (2011). Sandeel as a link between primary production and higher trophic levels on the Faroe shelf. Mar. Ecol. Prog. Ser. 438, 185–194. doi: 10.3354/meps09301
Eliasen, S. K., Hátún, H., Larsen, K. M. H., Hansen, B., and Rasmussen, T. A. S. (2017a). Phenologically distinct phytoplankton regions on the faroe shelf - identified by satellite data, in-situ observations and model. J. Mar. Sys. 169, 99–110. doi: 10.1016/j.jmarsys.2017.01.015
Eliasen, S. K., Hátún, H., Larsen, K. M. H., and Jacobsen, S. (2017b). Faroe shelf bloom phenology – The importance of ocean-to-shelf silicate fluxes. Cont. Shelf Res. 143, 43–53. doi: 10.1016/j.csr.2017.06.004
Eliasen, S. K., Hátún, H., Larsen, K. M. H., Vang, H. B. M., and Rasmussen, T. A. S. (2019). The Faroe shelf spring bloom onset explained by a ‘Critical Volume Hypothesis.’. J. Mar. Syst. 194, 91–101. doi: 10.1016/j.jmarsys.2019.02.005
Eriksen, E., Bogstad, B., and Nakken, O. (2011). Ecological significance of 0-group fish in the Barents Sea ecosystem. Polar. Biol. 34, 647–657. doi: 10.1007/s00300-010-0920-y
Fauchald, P., Skov, H., Skern-Mauritzen, M., Johns, D., and Tveraa, T. (2011). Wasp-waist interactions in the north sea ecosystem. PLoS One 6:e22729. doi: 10.1371/journal.pone.0022729
Folkvord, A. (2005). Comparison of size-at-age of larval Atlantic cod (Gadus morhua) from different populations based on size- and temperature-dependent growth models. Can. J. Fish Aquat Sci. 62, 1037–1052. doi: 10.1139/f05-008
Frank, K. T., Petrie, B., Choi, J. S., and Leggett, W. C. (2005). Trophic cascades in a formerly cod - dominated ecosystem. Science 308, 1621–1623. doi: 10.1126/science.1113075
Frank, K. T., Petrie, B., and Shackell, N. L. (2007). The ups and downs of trophic control in continental shelf ecosystems. Trends Ecol. Evol. 22, 236–242. doi: 10.1016/j.tree.2007.03.002
Frederiksen, M., Furness, R. W., and Wanless, S. (2007a). Regional variation in the role of bottom-up and top-down processes in controlling sandeel abundance in the North Sea. Mar. Ecol. Prog. Ser. 337, 279–286. doi: 10.3354/meps337279
Frederiksen, M., Mavor, R. A. R., and Wanless, S. (2007b). Seabirds as environmental indicators: the advantages of combining data sets. Mar. Ecol. Prog. Ser. 352, 205–211. doi: 10.3354/meps07071
Fuiman, L. A., and Werner, R. G. (2002). Fishery Science: The Unique Contributions of Early Life Stages. Hoboken: Blackwell Science.
Gaard, E. (1999). The zooplankton community structure in relation to its biological and physical environment on the Faroe shelf, 1989-1997. J. Plankton Res. 21, 1133–1152. doi: 10.1093/plankt/21.6.1133
Gaard, E. (2000). Seasonal abundance and development of Calanus finmarchicus in relation to phytoplankton and hydrography on the Faroe Shelf. ICES J. Mar. Sci. 57, 1605–1611. doi: 10.1006/jmsc.2000.0963
Gaard, E. (2003). Plankton variability on the Faroe Shelf during the 1990s. ICES Mar. Sci. Symp. 219, 182–189.
Gaard, E., and Hansen, B. (2000). Variations in the advection of Calanus finmarchicus onto the Faroe Shelf. ICES J Mar. Sci. 57, 1612–1618. doi: 10.1006/jmsc.2000.0962
Gaard, E., Hansen, B., and Heinesen, S. P. (1998). Phytoplankton variability on the Faroe Shelf. ICES J. Mar. Sci. 55, 688–696. doi: 10.1006/jmsc.1998.0373
Gaard, E., Hansen, B., Olsen, B., and Reinert, J. (2002). “Ecological features and recent trends in the physical environment, plankton, fish stocks, and seabirds in the faroe shelf ecosystem,” in Large Marine Ecosystems in the North Atlantic, eds K. Sherman and H. R. Skjoldal (Amsterdam: Elsevier), 245–265. doi: 10.1016/s1570-0461(02)80060-x
Gaard, E., and Reinert, J. (2002). Pelagic cod and haddock juveniles on the faroe plateau: distribution, diets and feeding habitats, 1994-1996. Sarsia 87, 193–206. doi: 10.1080/00364820260294833
Gaard, E., and Steingrund, P. (2001). Reproduction of faroe plateau cod: spawning grounds. Egg. Advection and Larval Feeding. Fróðskaparrit 48, 87–103.
Grasshoff, K., Erhardt, M., and Kremling, K. (1999). “Methods for seawater analysis, 3rd completely revised and extended edition,” in Marine Chemistry, ed. P. Wangersky (Weinheim: Verlag Chemie), 86–87.
Hamer, K. C., Monaghan, P., Uttley, J. D., Walton, P., and Burns, M. D. (1993). The influence of food supply on the breeding ecology of Kittiwakes Rissa tridactyla in Shetland. IBIS 135, 255–263. doi: 10.1111/j.1474-919X.1993.tb02842.x
Hansen, B., Eliasen, S. K., Gaard, E., and Larsen, K. M. H. (2005). Climatic effects on plankton and productivity on the Faroe Shelf. ICES J. Mar. Sci. 62, 1224–1232. doi: 10.1016/j.icesjms.2005.04.014
Hátún, H., Azetsu-Scott, K., Somavilla, R., Rey, F., Johnson, C., Mathis, M., et al. (2017a). The subpolar gyre regulates silicate concentrations in the North Atlantic. Sci. Rep. 7:14576. doi: 10.1038/s41598-017-14837-4
Hátún, H., Olsen, B., and Pacariz, S. V. (2017b). The dynamics of the North Atlantic subpolar gyre introduces predictability to the breeding success of kittiwakes. Front. Mar. Sci. 4:123. doi: 10.3389/fmars.2017.00123
Hátún, H., Lohmann, K., Matei, D., Jungclaus, J. H., Pacariz, S. V., Bersch, M., et al. (2016). An inflated subpolar gyre blows life toward the northeastern Atlantic. Prog. Oceanogr 147, 49–66. doi: 10.1016/j.pocean.2016.07.009
Hjort, J. (1914). Fluctuations in the great fisheries of northern Europe viewed in the light of biological research. Rapp. P V Réun Cons. Int. Explor. Mer. 20, 1–228.
Homrum, E. I., Hansen, B., Steingrund, P., and Hátún, H. (2012). Growth, maturation, diet and distribution of saithe (Pollachius virens) in Faroese waters (NE Atlantic). Mar. Biol. Res. 8, 246–254. doi: 10.1080/17451000.2011.627921
Houde, E. D. (1989). Comparative Growth, Mortality, and Energetics of Marine Fish Larvae: Temperature and Implied Latitudinal Effects. Fish. Bull. 87, 471–495.
Houde, E. D. (1997). Patterns and trends in larval-stage growth and mortality of teleost fish∗. J. Fish Biol. 51, 52–83. doi: 10.1111/j.1095-8649.1997.tb06093.x
ICES (2018). Report of the North-Western Working Group (NWWG). ICES NWWG REPORT 2018. Copenhagen: ICES.
Jacobsen, S., Gaard, E., Larsen, K. M. H., Eliasen, S. K., and Hátún, H. (2018). Temporal and spatial variability of zooplankton on the Faroe shelf in spring 1997–2016. J. Mar. Sys. 177, 28–38. doi: 10.1016/j.jmarsys.2017.08.004
Jákupsstovu, S. H. Í, and Reinert, J. (1994). Fluctuations in the Faroe Plateau cod stock. ICES Mar. Sci. Symp. 198, 194–211.
Jónasdóttir, S. H., Richardson, K., Heath, M. R., Ingvarsdóttir, A., and Christoffersen, A. (2008). Spring production of Calanus finmarchicus at the iceland-scotland ridge. Deep Sea Res. I 55, 471–489. doi: 10.1016/j.dsr.2007.12.009
Kristiansen, I., Hátún, H., Petursdóttir, H., Gislason, A., Broms, C., Melle, W., et al. (2019). Decreased influx of Calanus spp. into the south-western Norwegian Sea since 2003. Deep Sea Res. Part 1 Oceanogr. Res. Pap. 149:103048. doi: 10.1016/j.dsr.2019.05.008
Larsen, K. M. H., Hansen, B., and Svendsen, H. (2008). Faroe Shelf Water. Cont. Shelf Res. 28, 1754–1768. doi: 10.1016/j.csr.2008.04.006
Larsen, K. M. H., Hansen, B., and Svendsen, H. (2009). The faroe shelf front: properties and exchange. J. Mar. Sys. 78, 9–17. doi: 10.1016/j.jmarsys.2009.02.003
Legendre, P., and Legendre, L. (1998). “Numerical Ecology,” in Developments in Environmental Modelling, eds S. E. Jorgensen and M. J. Gromiec (Amsterdam: Elsevier Science), 853.
Leggett, W. C., and Deblois, E. (1994). Recruitment in marine fishes: is it regulated by starvation and predation in the egg and larval stages? Neth. J. Sea Res. 32, 119–134. doi: 10.1016/0077-7579(94)90036-90031
Madsen, M. L., Gaard, E., and Hansen, B. W. (2008). Wax-ester mobilization by female Calanus finmarchicus (Gunnerus) during spring ascendance and advection to the Faroe Shelf. ICES J. Mar. Sci. 65, 1112–1121. doi: 10.1093/icesjms/fsn097
Nøttestad, L., Utne, K. R., Óskarsson, G. J., Jónsson, S. Þ, Jacobsen, J. A., Tangen, Ø, et al. (2016). Quantifying changes in abundance, biomass, and spatial distribution of Northeast Atlantic mackerel (Scomber scombrus) in the Nordic seas from 2007 to 2014. ICES J. Mar. Sci. 73, 359–373. doi: 10.1093/icesjms/fsv218
Ottosen, K. M., Steingrund, P., Magnussen, E., and Payne, M. R. (2018). Distribution and timing of spawning Faroe Plateau cod in relation to warming spring temperatures. Fish. Res. 198, 14–23. doi: 10.1016/j.fishres.2017.10.022
Pacariz, S. V., Hátún, H., Jacobsen, J. A., Johnson, C., Eliasen, S. K., and Rey, F. (2016). Nutrient-driven poleward expansion of the Northeast Atlantic mackerel (Scomber scombrus) stock: a new hypothesis. Elementa 4:000105. doi: 10.12952/journal.elementa.000105
Parsons, T. R., Maita, Y., and Lalli, C. M. (1984). A Manual of Chemical and Biological Methods for Seawater Analysis. Oxford: Pergamon Press, 115.
Pyper, B. J., and Peterman, R. M. (1998). Comparison of methods to account for autocorrelation in correlation analyses of fish data. Can. J. Fish Aquat. Sci. 55, 2127–2140. doi: 10.1139/f98-104
R Core Team, (2018). R: A Language and Environment for Statistical Computing. Vienna: R Foundation for Statistical Computing. Available at: http://www.R-project.org/. R version 3.5.2, 2018-12-20.
Secor, D., Dean, J., and Laban, E. (1992). “Otolith removal and preparation for microstructure examination,” in Canadian Special Publication of Fisheries and Aquatic Sciences, eds D. Stevenson and S. E. Campana (Ottawa: NRC Research Press), 19–57.
Steingrund, P., and Gaard, E. (2005). Relationship between phytoplankton production and cod production on the Faroe Shelf. ICES J. Mar. Sci. 62, 163–176. doi: 10.1016/j.icesjms.2004.08.019
Steingrund, P., Mouritsen, R., Reinert, J., Gaard, E., and Hátún, H. (2010). Total stock size and cannibalism regulate recruitment in cod (Gadus morhua) on the Faroe Plateau. ICES J. Mar. Sci. 67, 111–124. doi: 10.1093/icesjms/fsp240
Sundby, S. (2000). Recruitment of atlantic cod stocks in relation to temperature and advection of copepod populations. Sarsia 85, 277–298. doi: 10.1080/00364827.2000.10414580
Sundby, S., Bjørke, H., Soldal, A. V., and Olsen, S. (1989). Mortality rates during the early life stages and year-class strength of northeast Arctic cod (Gadus morhua L.). Rapp P V Réun Cons. Int. Explor Mer. 191, 351–358.
Keywords: 0-group fish, Faroe shelf, primary production, zooplankton, silicate, survival, growth
Citation: Jacobsen S, Gaard E, Hátún H, Steingrund P, Larsen KMH, Reinert J, Ólafsdóttir SR, Poulsen M and Vang HBM (2019) Environmentally Driven Ecological Fluctuations on the Faroe Shelf Revealed by Fish Juvenile Surveys. Front. Mar. Sci. 6:559. doi: 10.3389/fmars.2019.00559
Received: 06 December 2018; Accepted: 26 August 2019;
Published: 06 September 2019.
Edited by:
Stelios Katsanevakis, University of the Aegean, GreeceReviewed by:
Brian R. MacKenzie, Technical University of Denmark, DenmarkFilipe Martinho, University of Coimbra, Portugal
Copyright © 2019 Jacobsen, Gaard, Hátún, Steingrund, Larsen, Reinert, Ólafsdóttir, Poulsen and Vang. This is an open-access article distributed under the terms of the Creative Commons Attribution License (CC BY). The use, distribution or reproduction in other forums is permitted, provided the original author(s) and the copyright owner(s) are credited and that the original publication in this journal is cited, in accordance with accepted academic practice. No use, distribution or reproduction is permitted which does not comply with these terms.
*Correspondence: Sólvá Jacobsen, c29sdmFqQGhhdi5mbw==