 Erik Simon-Lledó1*
 Samuel Thompson2
 Andrew Yool1Adrian Flynn3Christina Pomee4John Parianos5
 Daniel O. B. Jones1
- 1National Oceanography Centre, Southampton, United Kingdom
- 2National Oceanography Centre, University of Southampton, Southampton, United Kingdom
- 3Fathom Pacific Pty Ltd., Melbourne, VIC, Australia
- 4Nautilus Minerals Tonga Ltd., Nuku‘alofa, Tonga
- 5Nautilus Minerals Ltd., Brisbane, QLD, Australia
We report on preliminary observations of the abyssal megafauna communities in the exclusive economic zone of Kiribati, a huge abyssal area with few previous studies. These observations also provide useful context for marine minerals exploration within the exclusive economic zone (EEZ) and for the neighboring Clarion Clipperton Zone (CCZ), where deep-sea mining operations are planned. Seafloor images collected during seabed mining exploration were used to characterize megafaunal communities (fauna > 1 cm) in three abyssal plain areas in the eastern Kiribati EEZ (study area extending from 1 to 5°N and 173 to 156°W). Additionally, hydrographic features in each of the survey locations were inferred by reference to near-seabed current flows modeled using open-sourced oceanographic data. The images showed a dominance of foraminiferal organisms. Metazoan communities were high in morphospecies richness but had low density. These general patterns were comparable to abyssal megabenthic communities in the CCZ. There was evidence of spatial variation between the assemblages in Kiribati, but there was a relatively large pool of shared morphospecies across the entire study area. Low metazoan density limited detailed assessment of spatial variation and diversity at local scales. This finding is instructive of the levels of sampling effort required to determine spatial patterns in low density abyssal communities. The results of this study are preliminary observations that will be useful to guide future biological survey design and marine spatial planning strategies.
Introduction
The Republic of Kiribati is a Pacific Micronesian small island state comprised of three island groups: the more populous Gilbert Islands in the West, the largely uninhabited Phoenix Islands in the middle and Line Islands to the East. The three groups of islands each occur on major Cretaceous volcanic chains (Epp, 1984) that form approximately NW-SE oriented ridge systems rising from the abyssal seafloor in the central Pacific. Although the total land area of Kiribati is only 811 km2 (Rotjan et al., 2014), the exclusive economic zone (EEZ) covers around 3.5 million km2 and >89% of this is abyssal (>4000 m water depth) ocean (Weatherall et al., 2015).
Marine mineral exploration in Kiribati has been intermittent since the early 1980s (e.g., Gauss, 1980) and has revealed extensive deposits of polymetallic nodules and metalliferous sediments on the abyssal seafloor and ferromanganese crust resources on the seamount areas (Okamoto, 2005). The Line Islands form the westernmost boundary of the Clarion Clipperton Zone (CCZ, at 2–20°N; 115–155°W), which is of significant interest for polymetallic nodules. A Mineral Resource (minerals in sufficient quantities to provide reasonable prospects for eventual economic extraction) has never been declared for the deposits in Kiribati waters. However, baseline knowledge of the environment is important in developing plans for exploitation of mineral resources and management of mining activities particularly in areas of high uncertainty like the deep-sea.
There have been few deep-water seabed biological investigations in Kiribati and almost no assessment of the abyssal plain areas. The only abyssal sample obtained to the authors’ knowledge was a single dredge sample that was collected in the Line Islands EEZ at 5029 m depth during the Challenger expedition (station 274) on 11 September 1875, which contained a xenophyophore (Psammina nummulina), several sponges (Euplectella crassistellata and Cladorhiza abyssicola), holothurians (including Benthodytes selenkiana and Psycheotrephes exigua), an asteroid (Hyphalaster hyalinus), an echinoid [Phormosoma (now Tromikosoma) tenue], polymetallic nodules and fossil shark teeth (Théel, 1882; Murray and Renard, 1891; Murray, 1895). On the shallower slopes (1000–1300 m depth) of the Phoenix Islands investigations have been made with baited video (Obura et al., 2011). The limited deeper water work around the Phoenix Islands was stimulated by the creation of the Phoenix Islands Protected area (PIPA) in 2008, which is one of the largest (encompassing 408,250 km2) marine parks in the world (Rotjan et al., 2014). Deep water assessment of the seamount communities of the Phoenix Islands and primarily the PIPA area have been made recently by ROV in March 2017 (Okeanos Explorer expedition “Discovering the Deep: Exploring Remote Pacific Marine Protected Areas”) and October 2017 (RV Falkor expedition “Discovering Deep Sea Corals of the Phoenix Islands”). These assessments primarily focused on the impressive deep-water coral communities associated with seamounts, including those on ferromanganese crusts (Cordes, 2017; Kennedy, 2017).
In this paper we present observations from an opportunistic assessment of some of the first photographs of the abyssal seabed of Kiribati. We aim to describe the variation in epibenthic megafaunal assemblages in the northern Phoenix Islands and Line Islands of Kiribati. We use consistent morphospecies taxonomy with studies carried out in the CCZ, enabling comparison between these areas.
Materials and Methods
Study Areas
Data were acquired during the RV Yuzhmorgeologiya expedition to the western Kiribati EEZ, between −1 to 5° N and 173 to 156° W, in the mid Pacific Ocean (Figure 1). Three abyssal areas of interest were defined from W to E within this region: Area A (east of the Phoenix Group Islands, mean water depth: 5460 m), Area B (west of the Line Island Group, mean water depth: 5020 m), and Area C (east of Line Island Group, mean water depth: 4630 m). Area A and B are ∼1200 km apart, separated by an abyssal basin. Areas B and C are ∼700 km apart and separated by the Line Islands ridge system (Figure 1). Areas B and C exhibited a similar seafloor geomorphology with slopes <5° and unconsolidated sediment bed (Figure 2A). Area A had similar geomorphology with the exception of one transect (Dive 4, Figure 2B) conducted upon on steeper terrain (>5° slope), where hard substratum was present in the form of partially sediment-covered ferromanganese-coated basalt bedrock and polymetallic nodules (see section “Image Data Collection and Processing”).
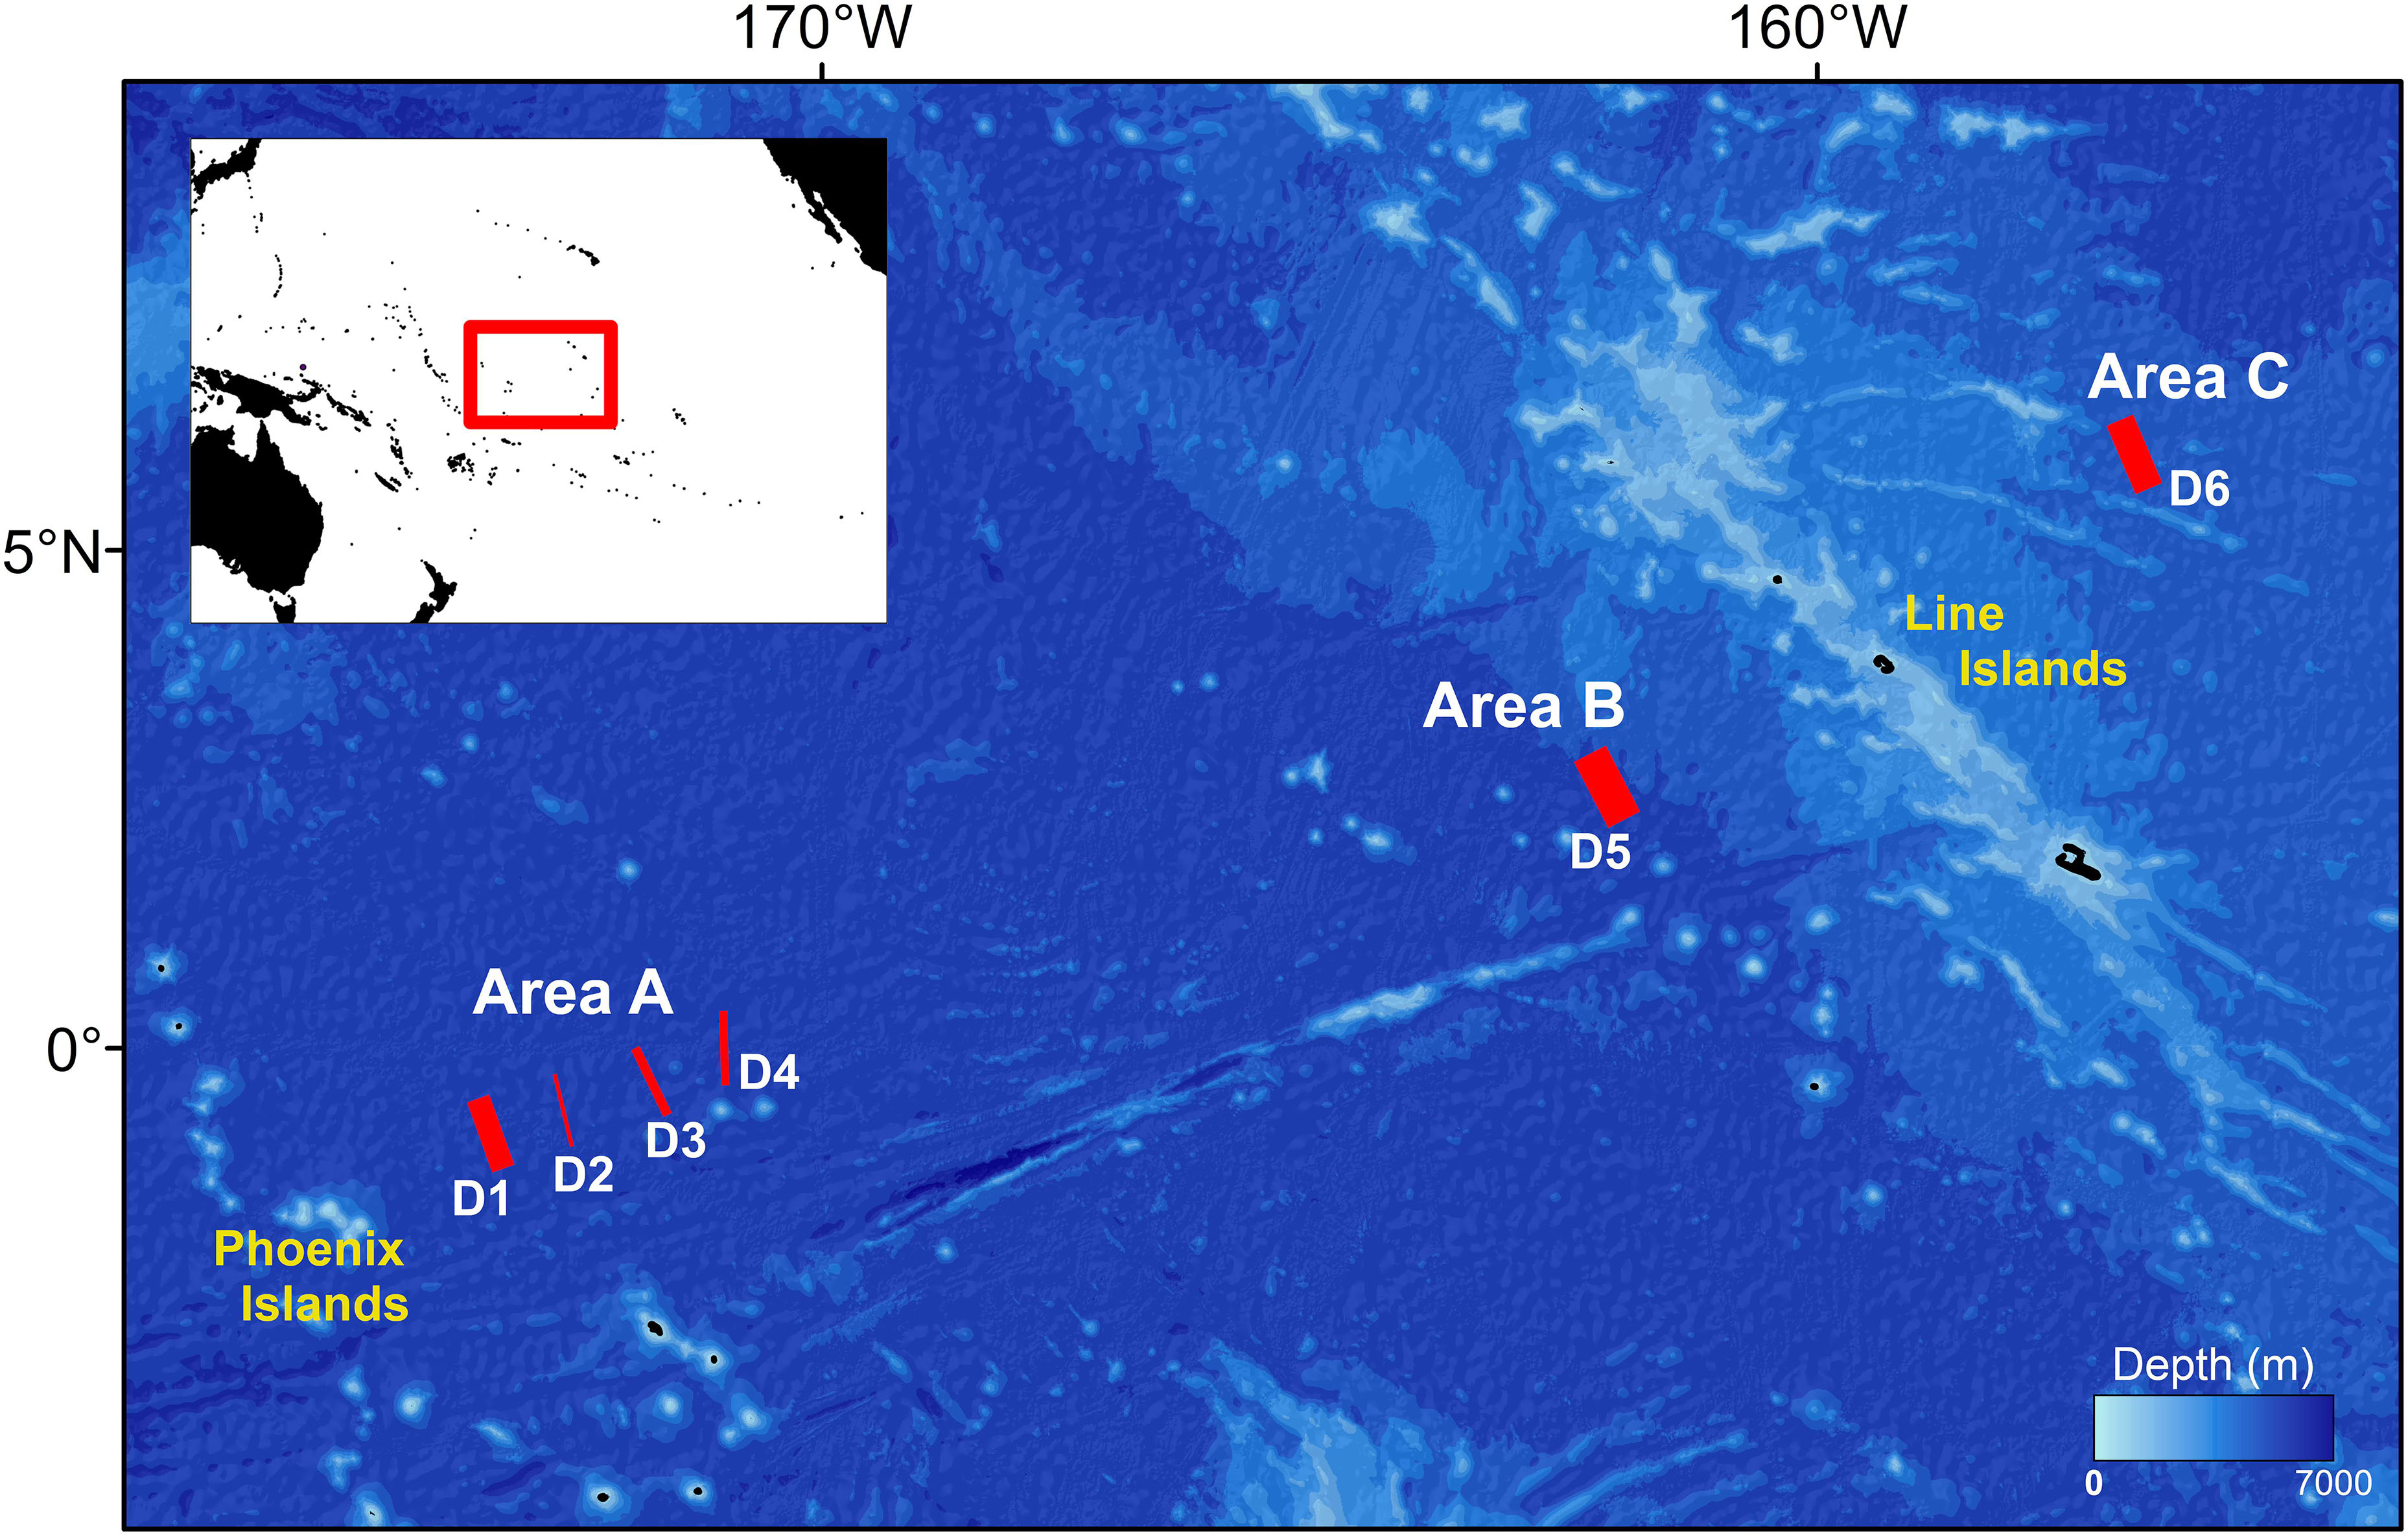
Figure 1. Map of survey locations used for the present study within the eastern Kiribati EEZ. Red lines indicate image transect locations. Line thicknesses represent the relative seabed area coverage (i.e., the length) of each survey dive (D). A map of the mid Pacific Ocean is inset, showing the studied area region (empty red rectangle). Water depth data obtained from Becker et al. (2009). Further survey metadata are provided in Supplementary Table S1.
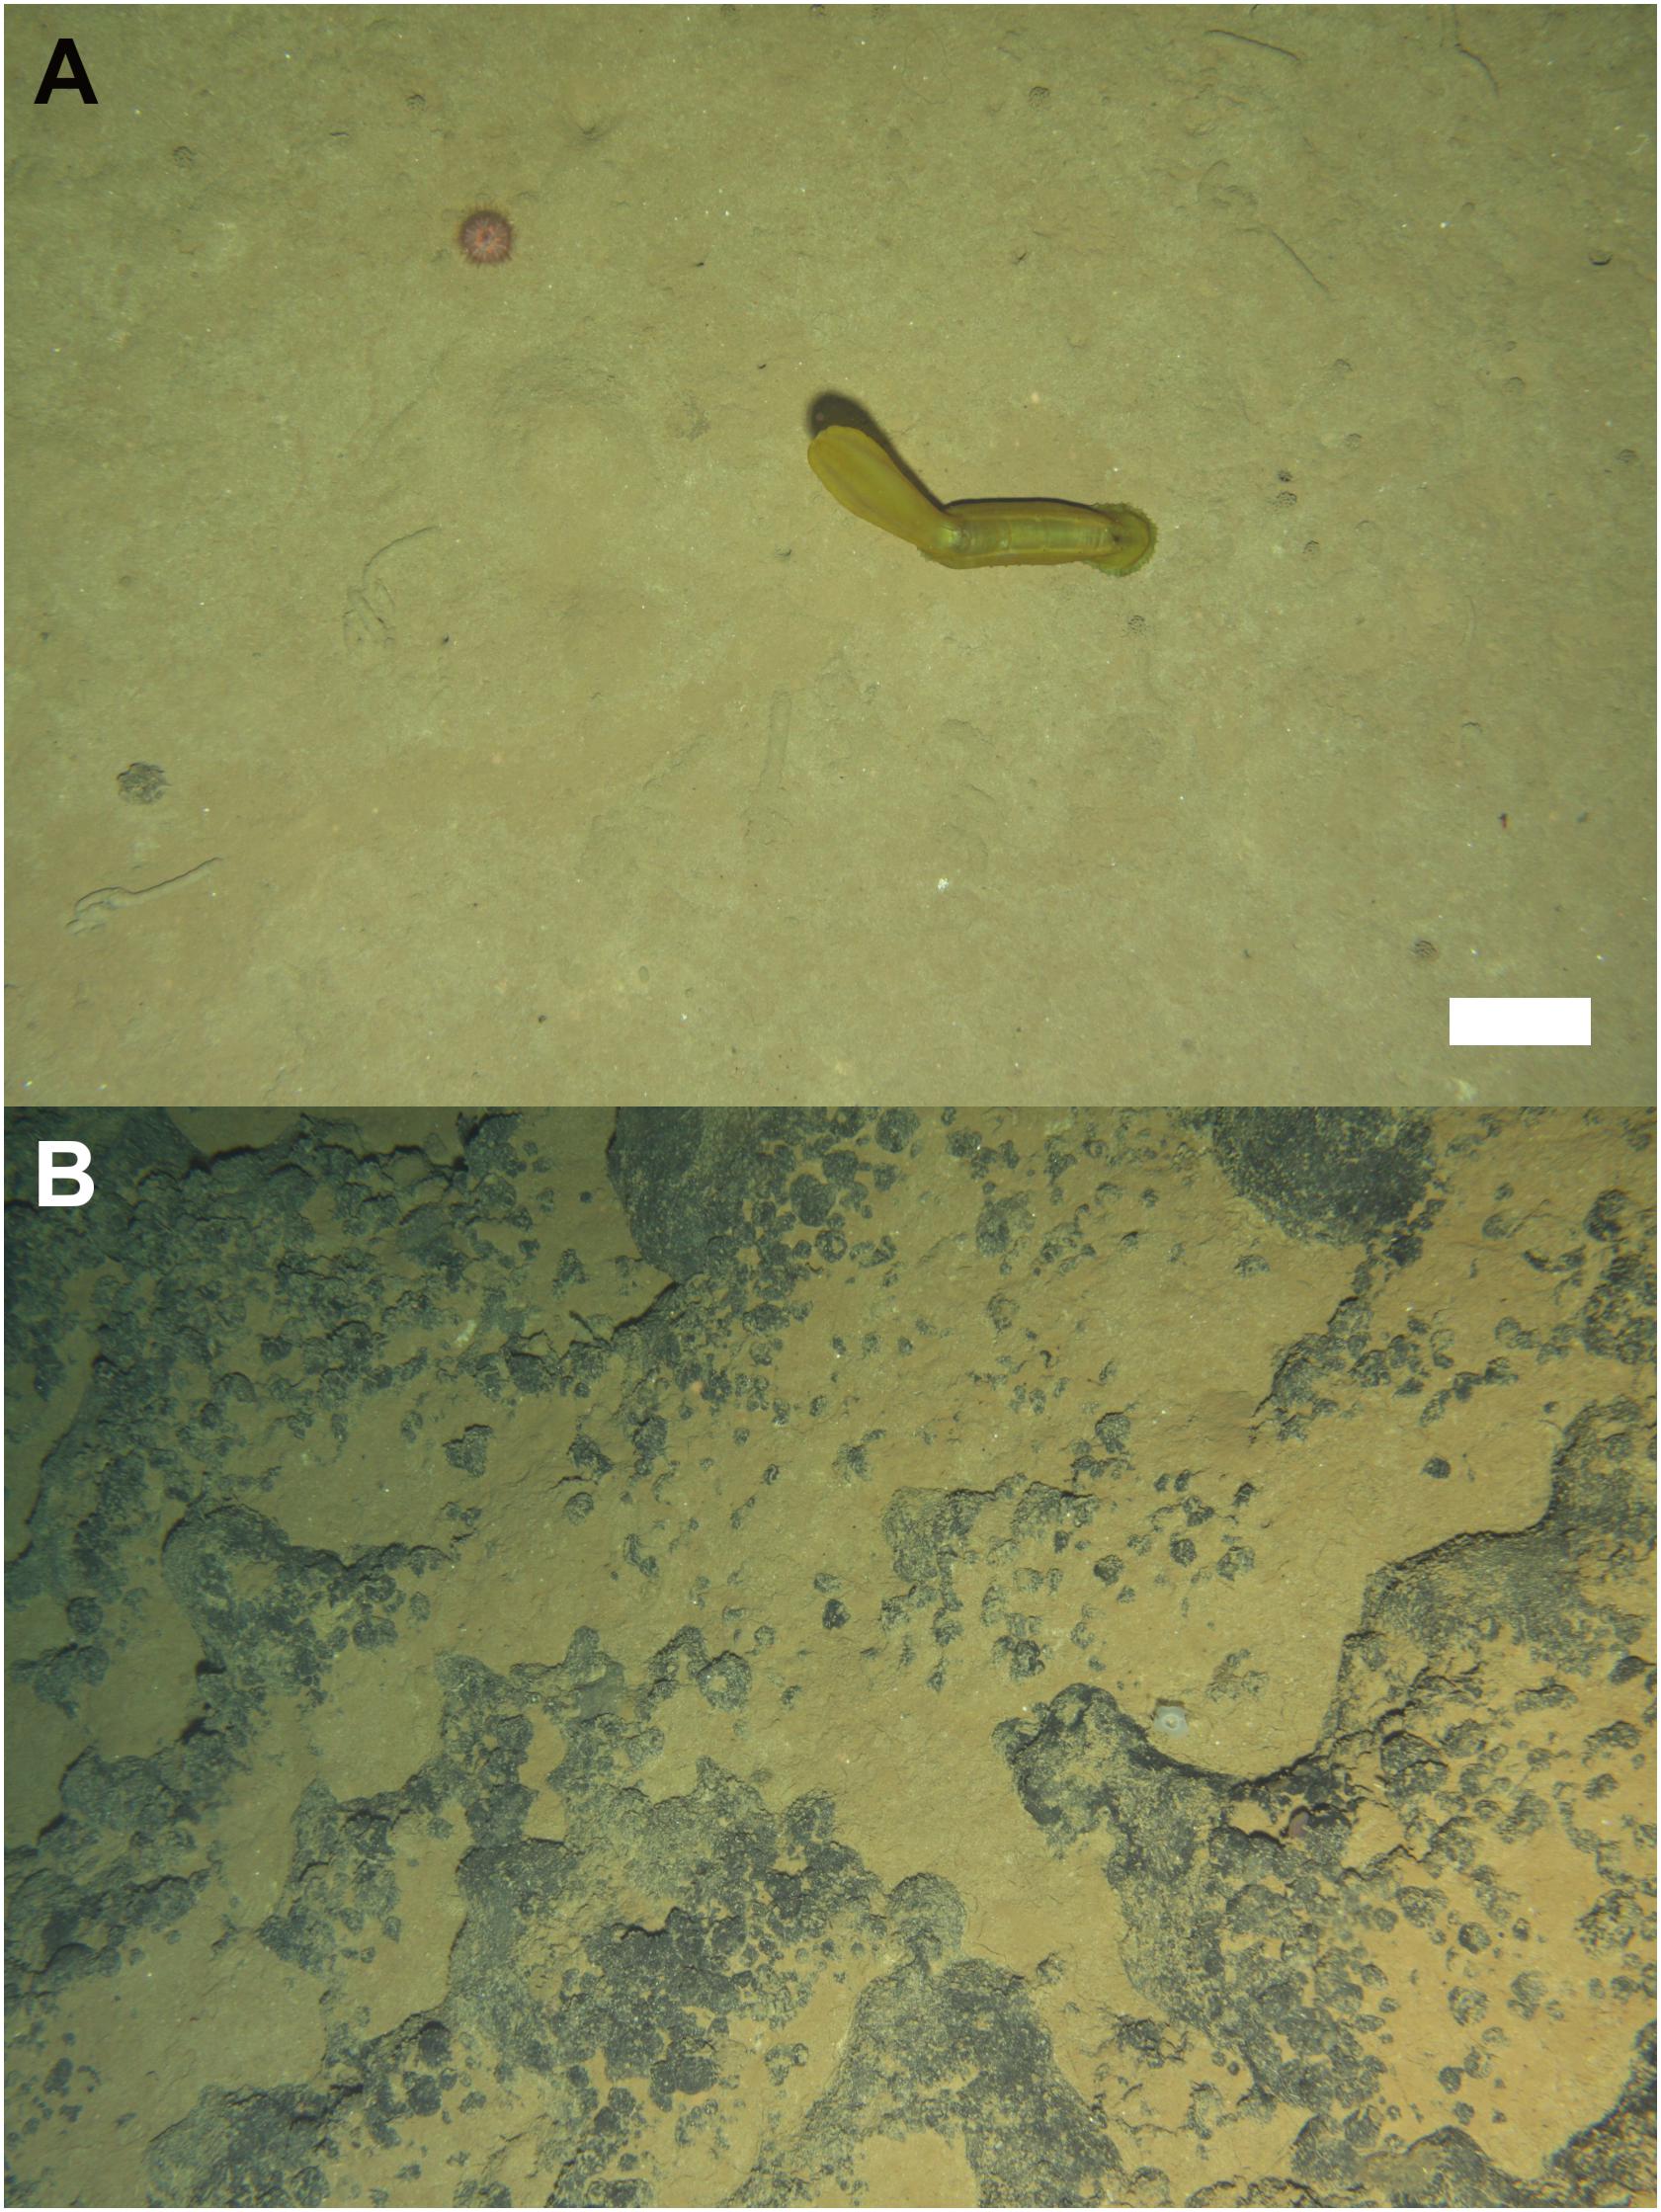
Figure 2. Examples of the seafloor types surveyed in the present study. (A) Sediment-only seabed, in Area A, Dive 1 (i.e., idem Dives 1, 2, 3, 5, and 6). Note the presence of the holothurian Psychropotes longicaudata -yellow morphotype-, the echinoid Kamptosoma sp. msp-2, and several xenophyophore specimens. (B) Sediment and hard substratum seabed, in Area AH, Dive 4. Note the presence of the sponge Docosaccus nidulus sp. inc. Scale bar represents 20 cm and applies to both images.
Environmental Assessment
Hydrographic Variations
The potential hydrographic isolation between sites was assessed by reference to near-seabed current flows. Since appropriate measurements were not available, seafloor current velocities for areas greater than 3000 m depth were drawn from a high-resolution ocean general circulation model. The model used was a global 1/12°configuration of the Nucleus for European Modeling of the Ocean model (NEMO; Madec, 2008), simulated for the period 1978 to 2010. The model’s temperature and salinity fields were initialized using the World Ocean Atlas (WOA) 2005 climatology, and it was forced at the air-sea boundary using the DFS4.1 reanalysis product, which includes observationally-derived 6-hourly fields of atmospheric properties and winds, daily fields of heat fluxes and monthly precipitation fields (Brodeau et al., 2010). Full details of the simulation can be found in Marzocchi et al. (2015).
Biological Assessment
Image Data Collection and Processing
Seafloor images were collected using a digital camera (Canon D60; 3456 × 2304 pixels) mounted on the towed camera system Neptune, developed by the Russian marine institute Yuzhmorgeologiya (Nautilus Minerals, 2016). The Neptune system was towed at a speed of 0.5–1.0 m s–1 and pictures were taken at an altimeter-triggered altitude of 3.5 m above the seafloor, at least every 30 s to avoid overlap between frames. At the target altitude, individual photographs imaged 3.6 m2 of seabed. A total of six image transects (Dives 1 to 6) were surveyed using the Neptune system, but each of a different length, as these were originally collected for the geological scouting of the area by Nautilus Minerals (Nautilus Minerals, 2016). Four transects were collected in Area A (Dives 1 to 4), one in Area B (Dive 5), and one in Area C (Dive 6) (Figure 1, Table 1, and Supplementary Table S1). The full resultant dataset was composed of data from 4,074 non-overlapping images, representing a total seafloor area of 14,666 m2 (Table 1).
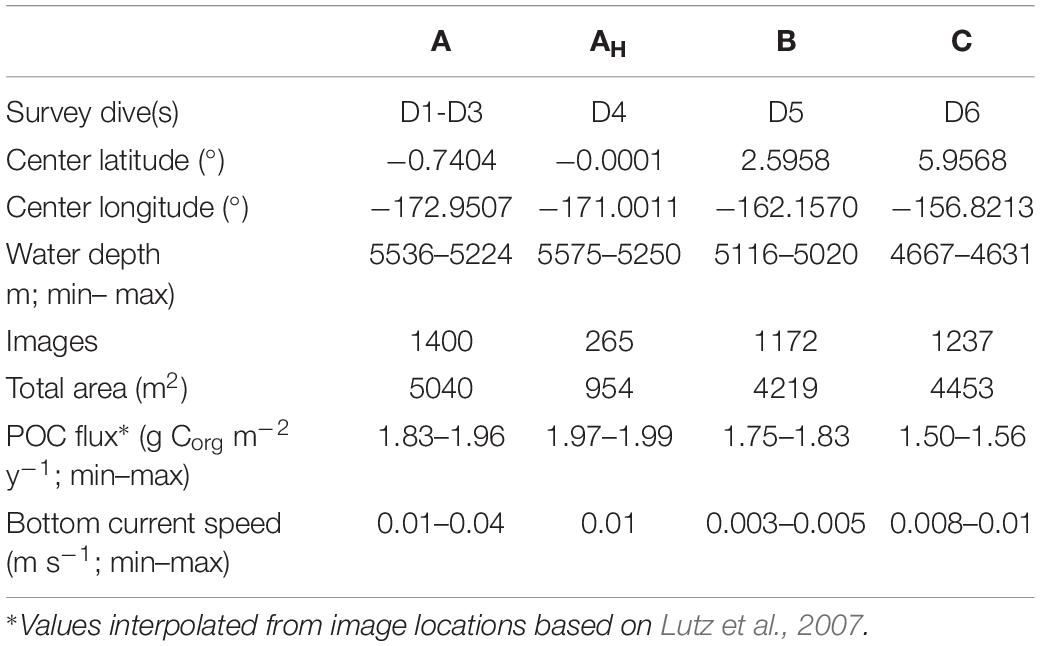
Table 1. Environmental features and sampling details in each of the survey locations investigated in the present study.
Images were reviewed in random order to minimize time or sequence-related bias (Durden et al., 2016). Megafauna specimens (>1 cm) were identified to the lowest taxonomic hierarchy possible (morphospecies: typically Genus or Family level; see Supplementary Table S2), and their physical dimension measured, using BIIGLE 2.0 (Langenkämper et al., 2017). To ensure consistency in specimen identification, an abyssal-Pacific standardized megafauna morphospecies (msp) catalog (e.g., Figure 3) was compiled from previous studies in the Pacific basin (Amon et al., 2016; Simon-Lledó et al., 2019a,b,c) and by reference to existing literature (Molodtsova and Opresko, 2017; Kersken et al., 2018; Drazen et al., 2019). The likely feeding behavior of each morphospecies was inferred from similar organisms described in the literature (i.e., Iken et al., 2001). Foraminifera specimens (Protists >1 cm; miliolids and xenophyophores; see e.g., Figures 3M–O) were identified in a subset of 2000 images selected at random across the six transects collected (i.e., half of the images of each transect), and these were only classified into four categories (miliolids and plate-, reticular-, and tubular-shaped xenophyophores).
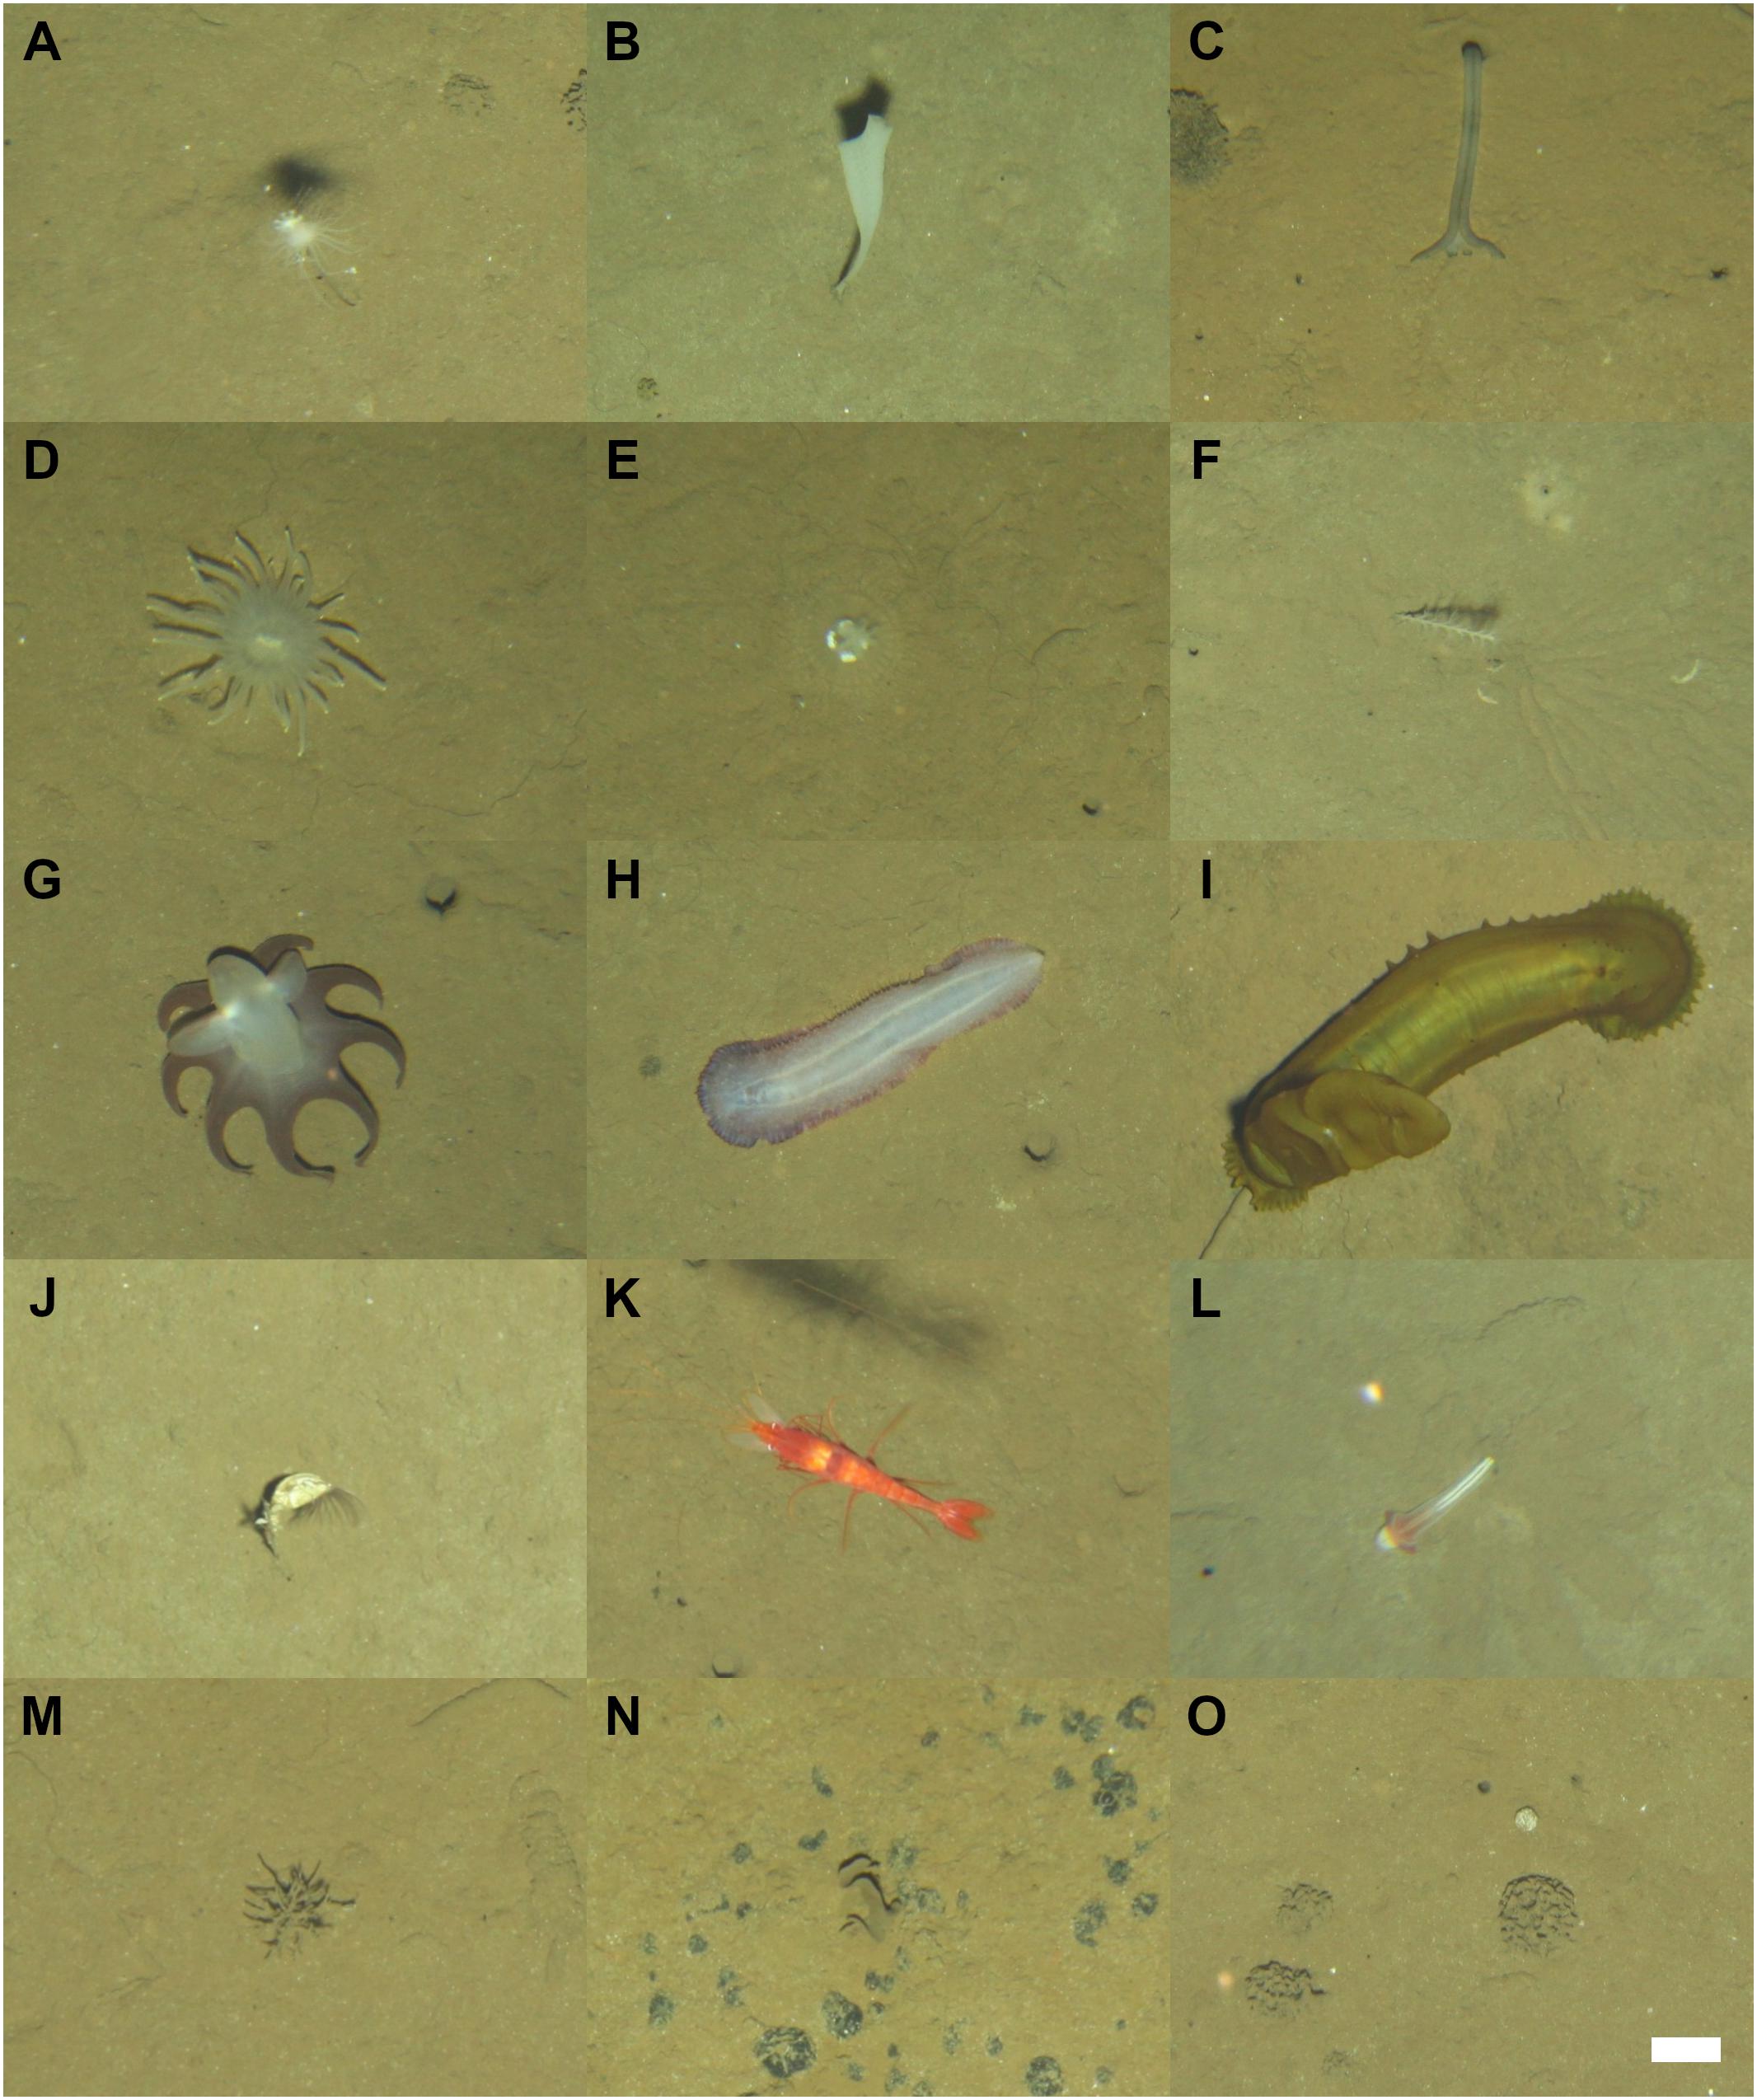
Figure 3. Examples of megafauna photographed at the Kiribati EEZ seafloor during Neptune towed-camera surveys. Scale bar represents 5 cm and applies to all images. A–L: Metazoan megafauna. (A) Cladorhiza sp. msp-4. (B) Porifera msp-20. (C) Echiura msp-3. (D) Actiniaria msp-10. (E) Actiniaria msp-36. (F) Bathygorgia sp. msp-2. (G) Grimpoteuthis sp. msp-1. (H) Paelopatides sp. msp-4. (I) Psychropotes longicauda, yellow-morphotype. (J) Neoscalpellum msp-1. (K) Cerataspis sp. msp-3. (L) Torquaratoridae sp. msp-2. M–O: Foraminifera specimens. (M) Tubular-shaped xenophyophore. (N) Plate-shaped xenophyophore (O) Miliolid (white round specimen) and three reticular-shaped xenophyophores.
Data Analysis
Observation data (faunal records in images) were pooled for different study areas to investigate variations in megabenthic characteristics between these. A total of four study areas were considered since observation data from Dive 4 were processed separately (Area AH) from the rest of Area A data, owing to the different seabed morphology and surface composition in this location (i.e., ∼40% of Dive 4 images were collected in areas with >5° slope and hard substratum present). However, the pool of images in Area AH subsample was about four times smaller than that in each of the other three areas (Table 1). Metazoan and foraminiferal data were processed separately and the latter were excluded from diversity assessments because: (i) it is not possible to determine whether foraminifera are alive in images (Hughes and Gooday, 2004); (ii) the taxonomic resolution allowed in image assessments is lower to that achieved in metazoans (see e.g., Gooday et al., 2017b); and (iii) there is a substantial mismatch between the biomass of metazoan and foraminifera specimens, since the protoplasm volume of the latter represents only 1–0.01% of their visible test (Levin and Gooday, 1992; Gooday et al., 2018).
Observation data from each area (Areas: A, AH, B, and C) were resampled using a modified form of bootstrapping (Davison and Hinkley, 1997). Bootstrapping is a statistical method for estimating the distribution of a given parameter (or a set of these) by sampling with replacement from the original sample. Resampling techniques provide robust estimates of standard errors and confidence intervals of sample parameters (Crowley, 1992; Rodgers, 1999), and are particularly well suited to analyze data derived from survey designs that lack true sample replication (see e.g., Simon-Lledó et al., 2019b). To implement the bootstrap, each study area image data subset was randomly resampled with replacement until a minimum of 500 m2 of seafloor (139 images) were encompassed, and that process was repeated 1000 times for each area. This resampling process yielded bootstrap-like samples (bootstrap generated sub-samples with fixed size) that ranged in metazoan specimen counts of 17–140. The same process was repeated using only those images where foraminifera were identified, which yielded bootstrap-like samples with foraminiferal specimen counts of 233–2042. We adopted this controlled seabed area approach to control the impact of the physical sample size on the estimation of biological diversity and faunal composition parameters.
A range of ecological parameters was calculated for each of the 4 × 1000 bootstrap-like samples, including metazoan and foraminiferal numerical density (ind m–2) and metazoan taxa density, i.e., morphospecies richness (S) in c. 500 m2. Variation in metazoan community composition was assessed by 2-d non-metric multidimensional scaling (nMDS) ordination of all 4 × 1000 bootstrap-like samples, based on square-root transformed faunal density and use of the Bray-Curtis dissimilarity measure (Clarke, 1993). Mean values of these parameters were calculated from each bootstrap-like sample set, together with corresponding 95% confidence intervals based on the simple percentile method (Davison and Hinkley, 1997). Data processing and analyses were performed using a custom R (R Core Team, 2017) script incorporating multiple functions from the “vegan” package (Oksanen et al., 2018). We report statistical assessments of variations in ecological parameters between study areas by comparisons of the 95% confidence intervals, i.e., the upper limit of a given estimate must be lower than the lower limits of the estimate that is compared to. Such cases are significant at p < 0.05, though the true (undetermined) p-value will, necessarily, be considerably lower.
Additionally, a rarefaction approach was applied to assess the potential impact of sampling unit size on morphospecies density (Chao et al., 2014). Sampling unit size was quantified as both number of individuals and seabed area observed. Metazoan observation data for each separate survey area, and for the whole dataset combined, were randomly resampled 100 times without replacement, to form increasingly larger image sampling units. The mean and 95% confidence intervals of each parameter were calculated at each sampling unit size using Estimate S v.9.1 software (Colwell, 2013).
Results
Hydrographic Variations
Modeled bottom current speeds in seabed areas below 3000 m water depth within the Kiribati EEZ ranged between 0.001 and 0.1 m s–1 (Figure 4A). Modeled current speeds in the seafloor of Areas A, AH, and C were similar (∼0.01 m s–1) and substantially stronger than those obtained for Area B (Table 1). Model results suggested that the current speed at the seabed area where Dive 01 was collected (in Area A) was ∼4 times stronger than in the rest of Area A survey locations.
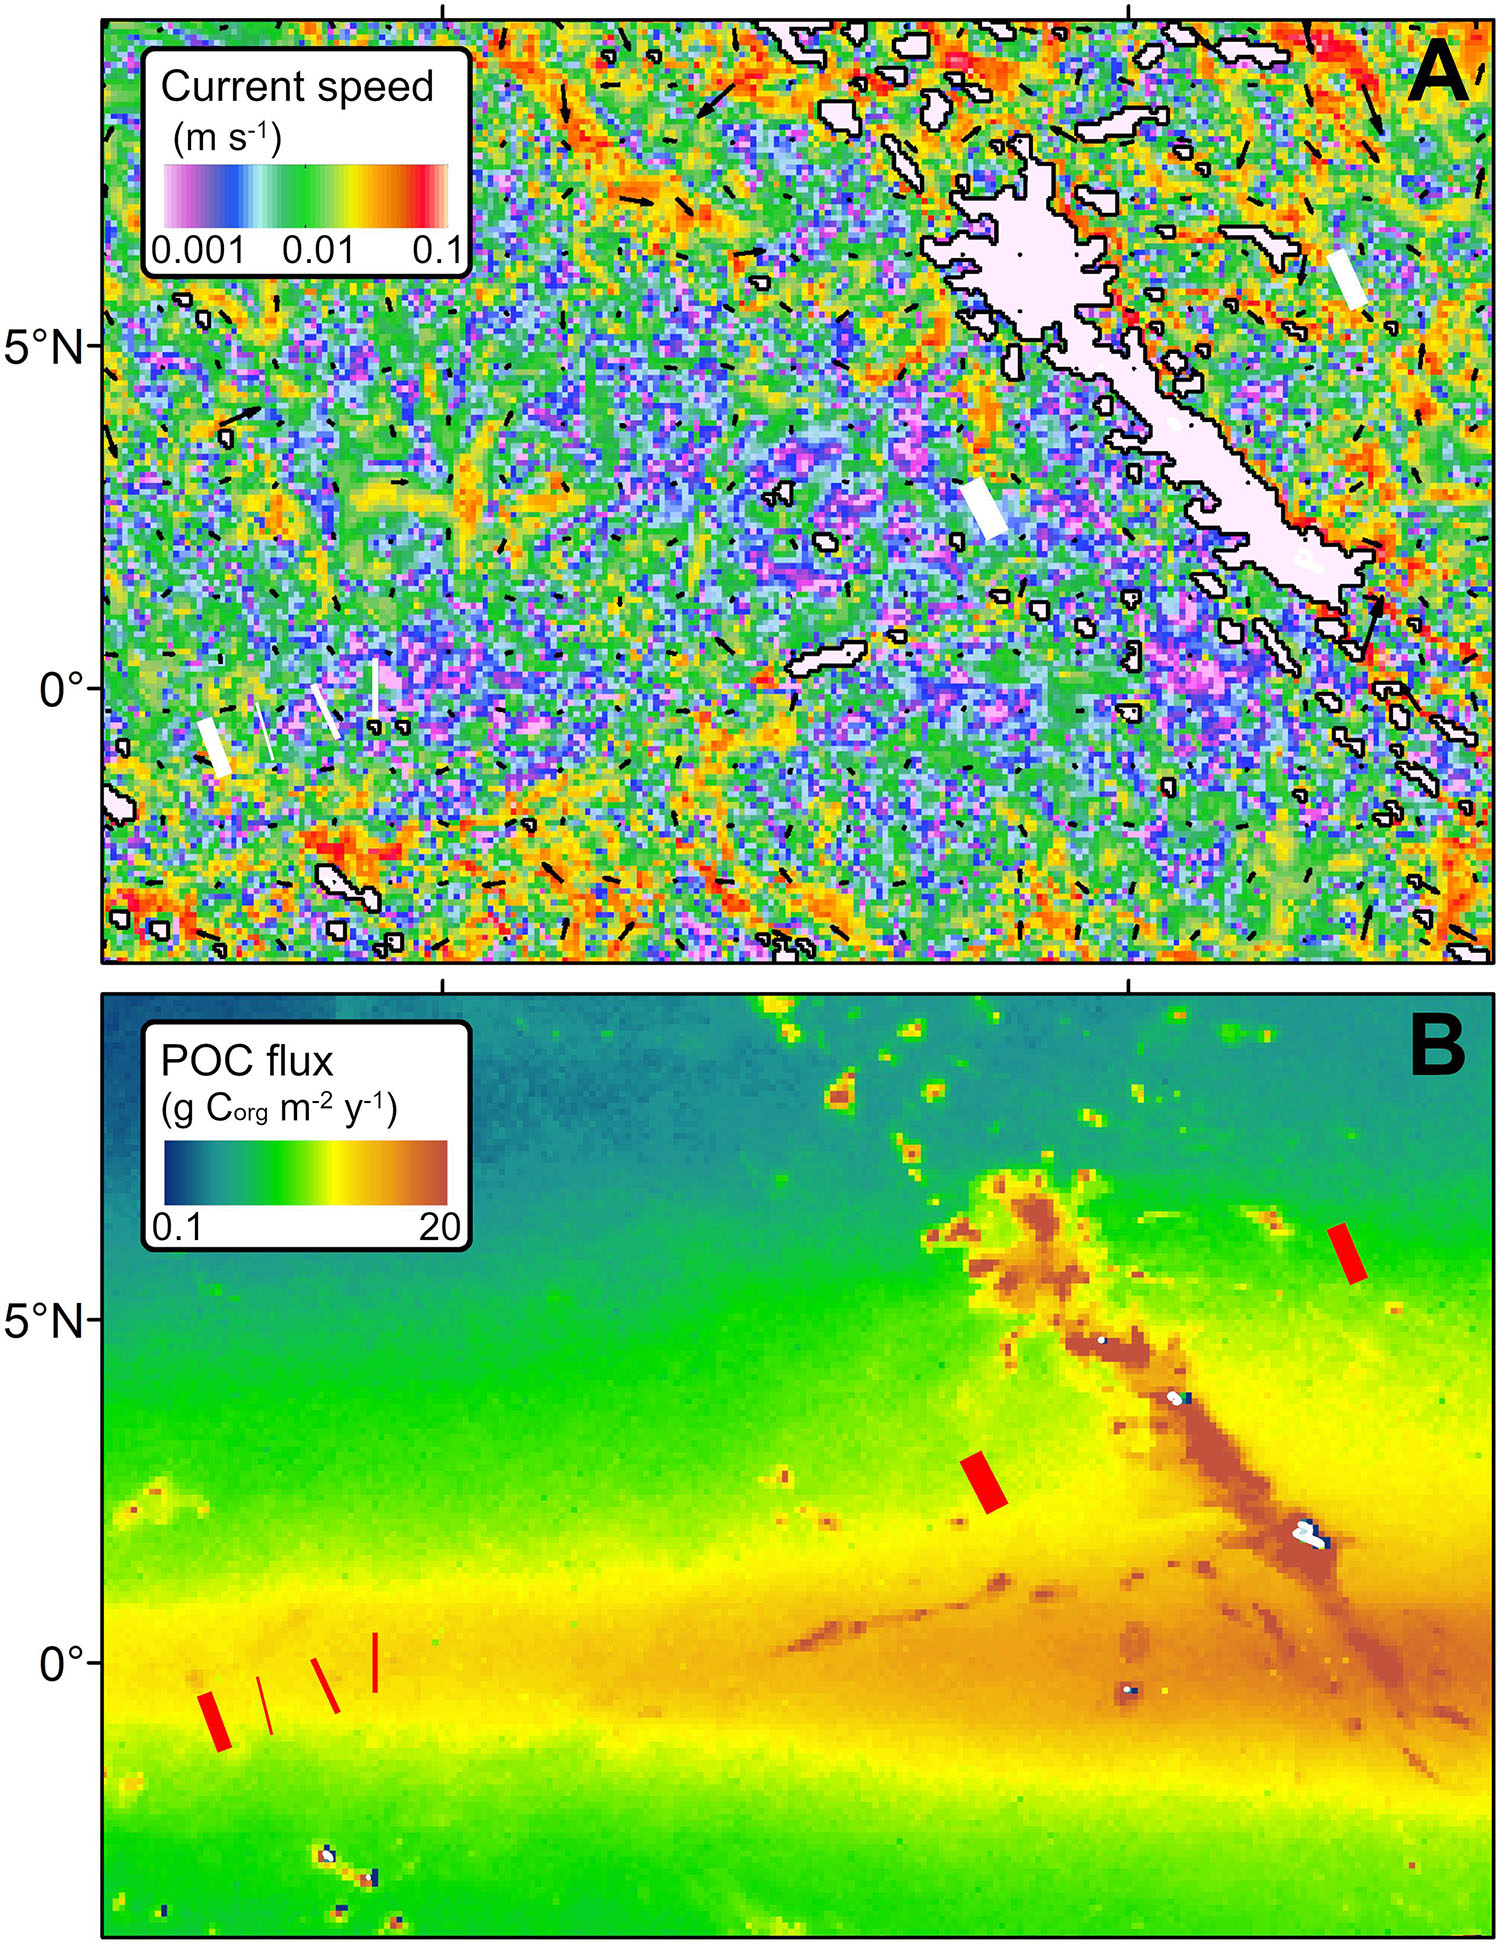
Figure 4. Environmental features of the eastern Kiribati EEZ seabed. (A) Modeled bottom water circulation in areas below 3000 m water depth. (B) Nutrient flux from surface to the seafloor, as reported by Lutz et al. (2007).
Megafauna Assessment
Foraminiferal tests numerically dominated the assemblages recorded during the present study; being overall, almost 15 times more abundant than metazoans (Figure 5). A total of 15,196 foraminifera specimens (in 7,200 m2 of seabed) and 1948 metazoans (in 14,666 m2 of seabed), all >1 cm, were recorded across all the study areas surveyed within the Kiribati EEZ.
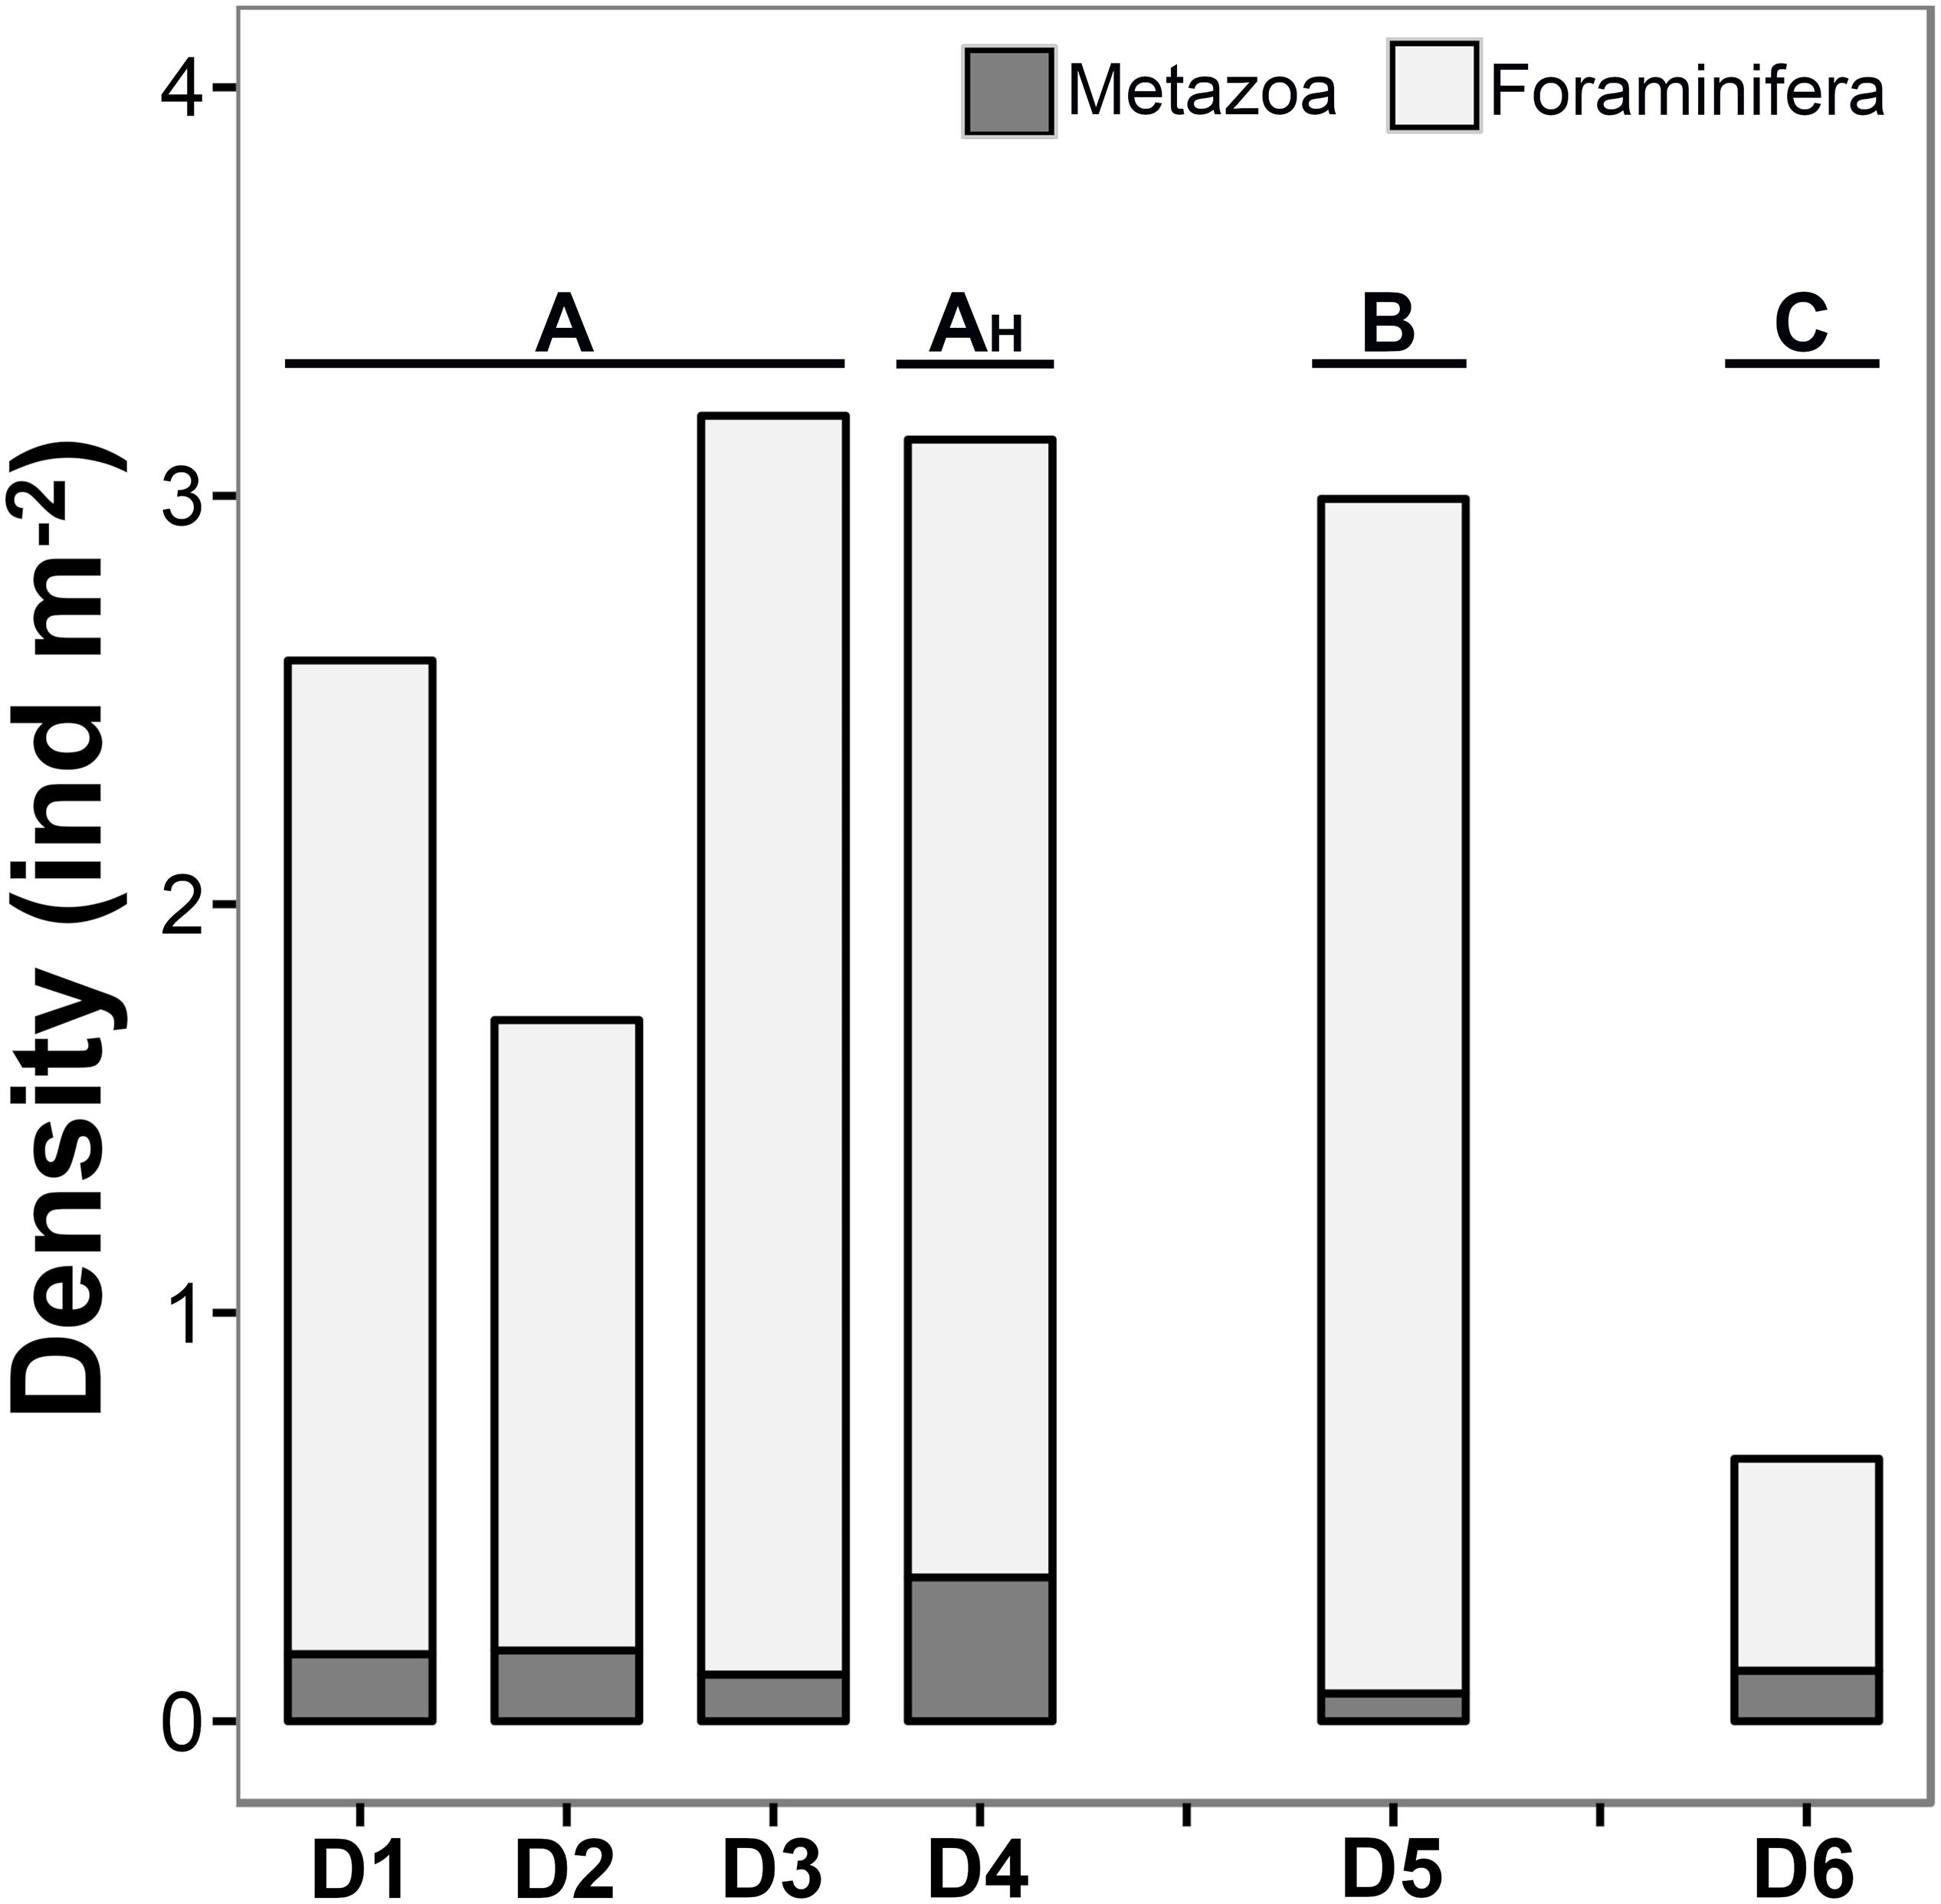
Figure 5. Total density of metazoan and foraminiferal specimens (>1 cm) encountered in each image transect analyzed in the present study.
Metazoan Megafauna
A total of 118 metazoan morphospecies, and 5 higher taxonomic categories (i.e., Order, Family), were documented from images (Table 2 and Supplementary Table S2). Rare taxa (≤3 records) represented 46% of the total metazoan morphospecies richness. The metazoan fauna observed were predominantly cnidarians (19 msp; 36% of all metazoan records), arthropods (10 msp; 20% of all metazoan records), sponges (22 msp; 17% of all metazoan records), and echinoderms (37 msp; 15% of all metazoan records). Annelids, chordates, and molluscs (as well as bryozoans, ctenophores, and an enteropneust worm) were also recorded at lower abundances (Table 2 and Supplementary Table S2). Suspension feeding organisms represented >60% of all the metazoan specimens recorded, while deposit feeders and predators and scavengers represented 16 and 23% of all metazoan records, respectively. The three most abundant metazoan morphospecies were: an actiniarian (Actiniaria msp-22; 240 specimens), a barnacle (Neoscalpellum sp. msp-1; 150 specimens; Figure 3J), and a hexactinellid sponge (Docosaccus maculatus sp. inc.; 78 specimens).
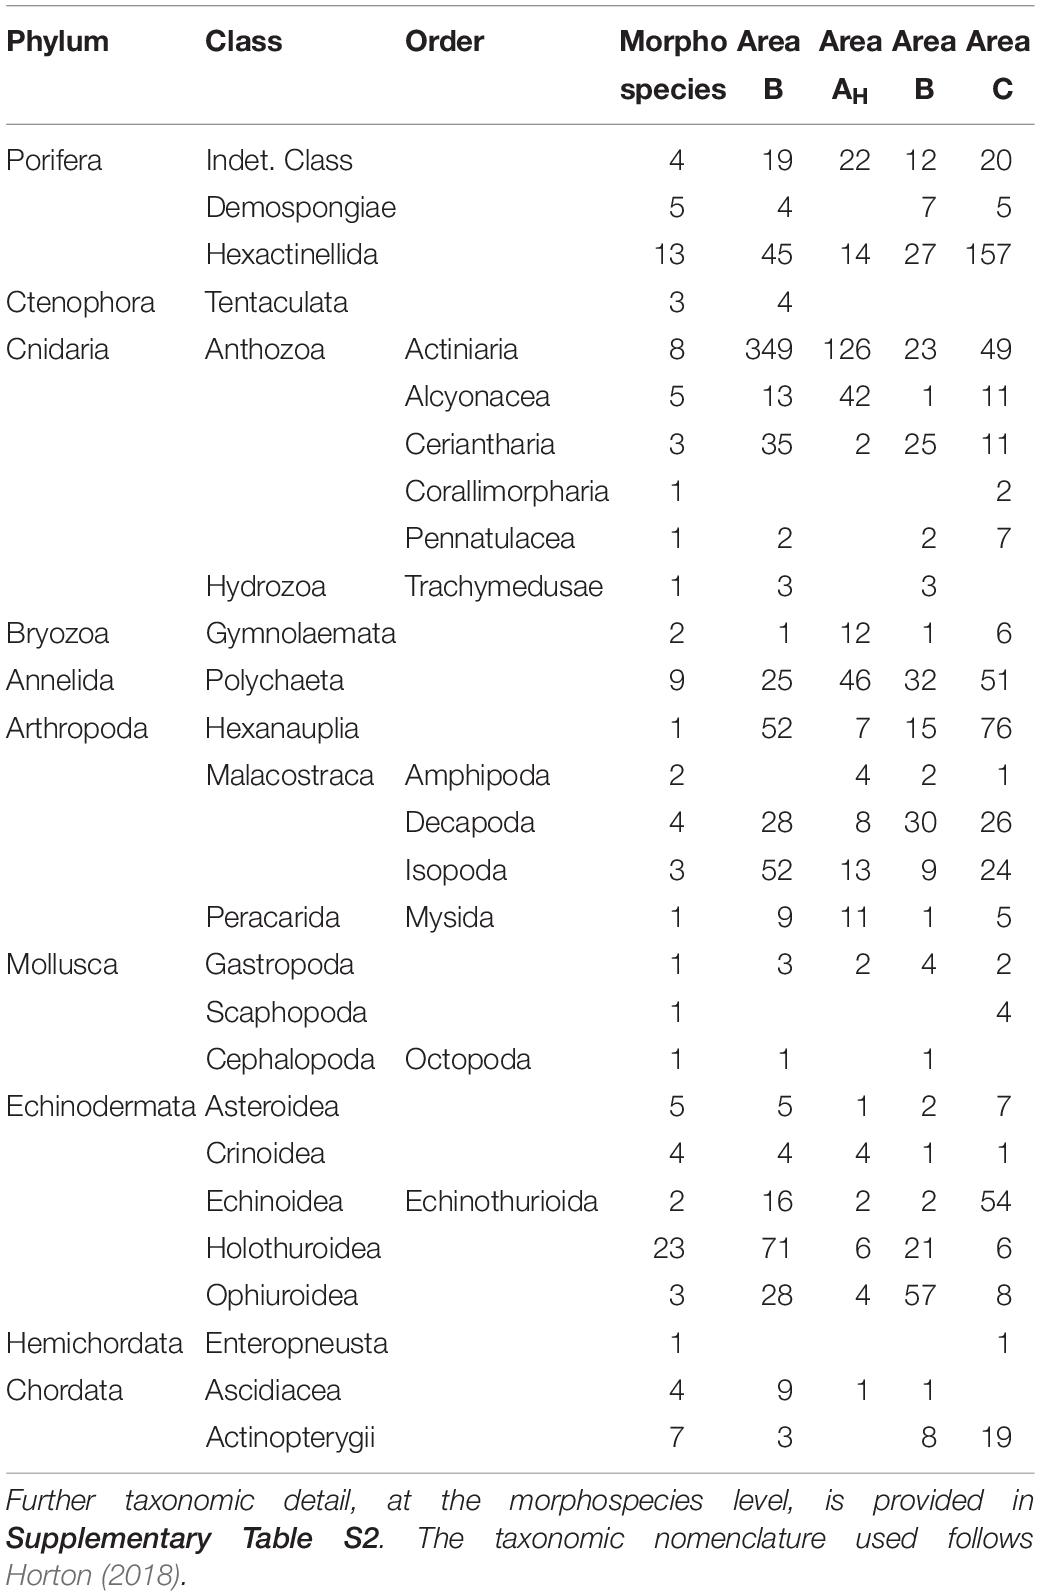
Table 2. Total abundance and taxon richness of major metazoan taxa encountered during the present study.
Variations in standing stocks
Metazoan numerical density was variable across the different areas surveyed (Figure 6A) with mean values ranging between 0.07 and 0.3 ind m–2 (in samples c. 500 m2). Metazoan density was lower in Area B than in Areas A and C, which were similar. In Area AH, mean metazoan density was around twice that of the rest of Area A and Area C, and was almost five times higher than the density found in Area B (Figure 6A). These variations primarily resulted from changes in the suspension feeder standing stock across survey areas (Figure 6B). Suspension feeder density was considerably reduced in Area B compared to Areas C and A, and was substantially higher in AH than in any other study area. Densities of deposit feeder (Figure 6D) and predator and scavenger metazoan fauna (Figure 6F) were similar across study areas.
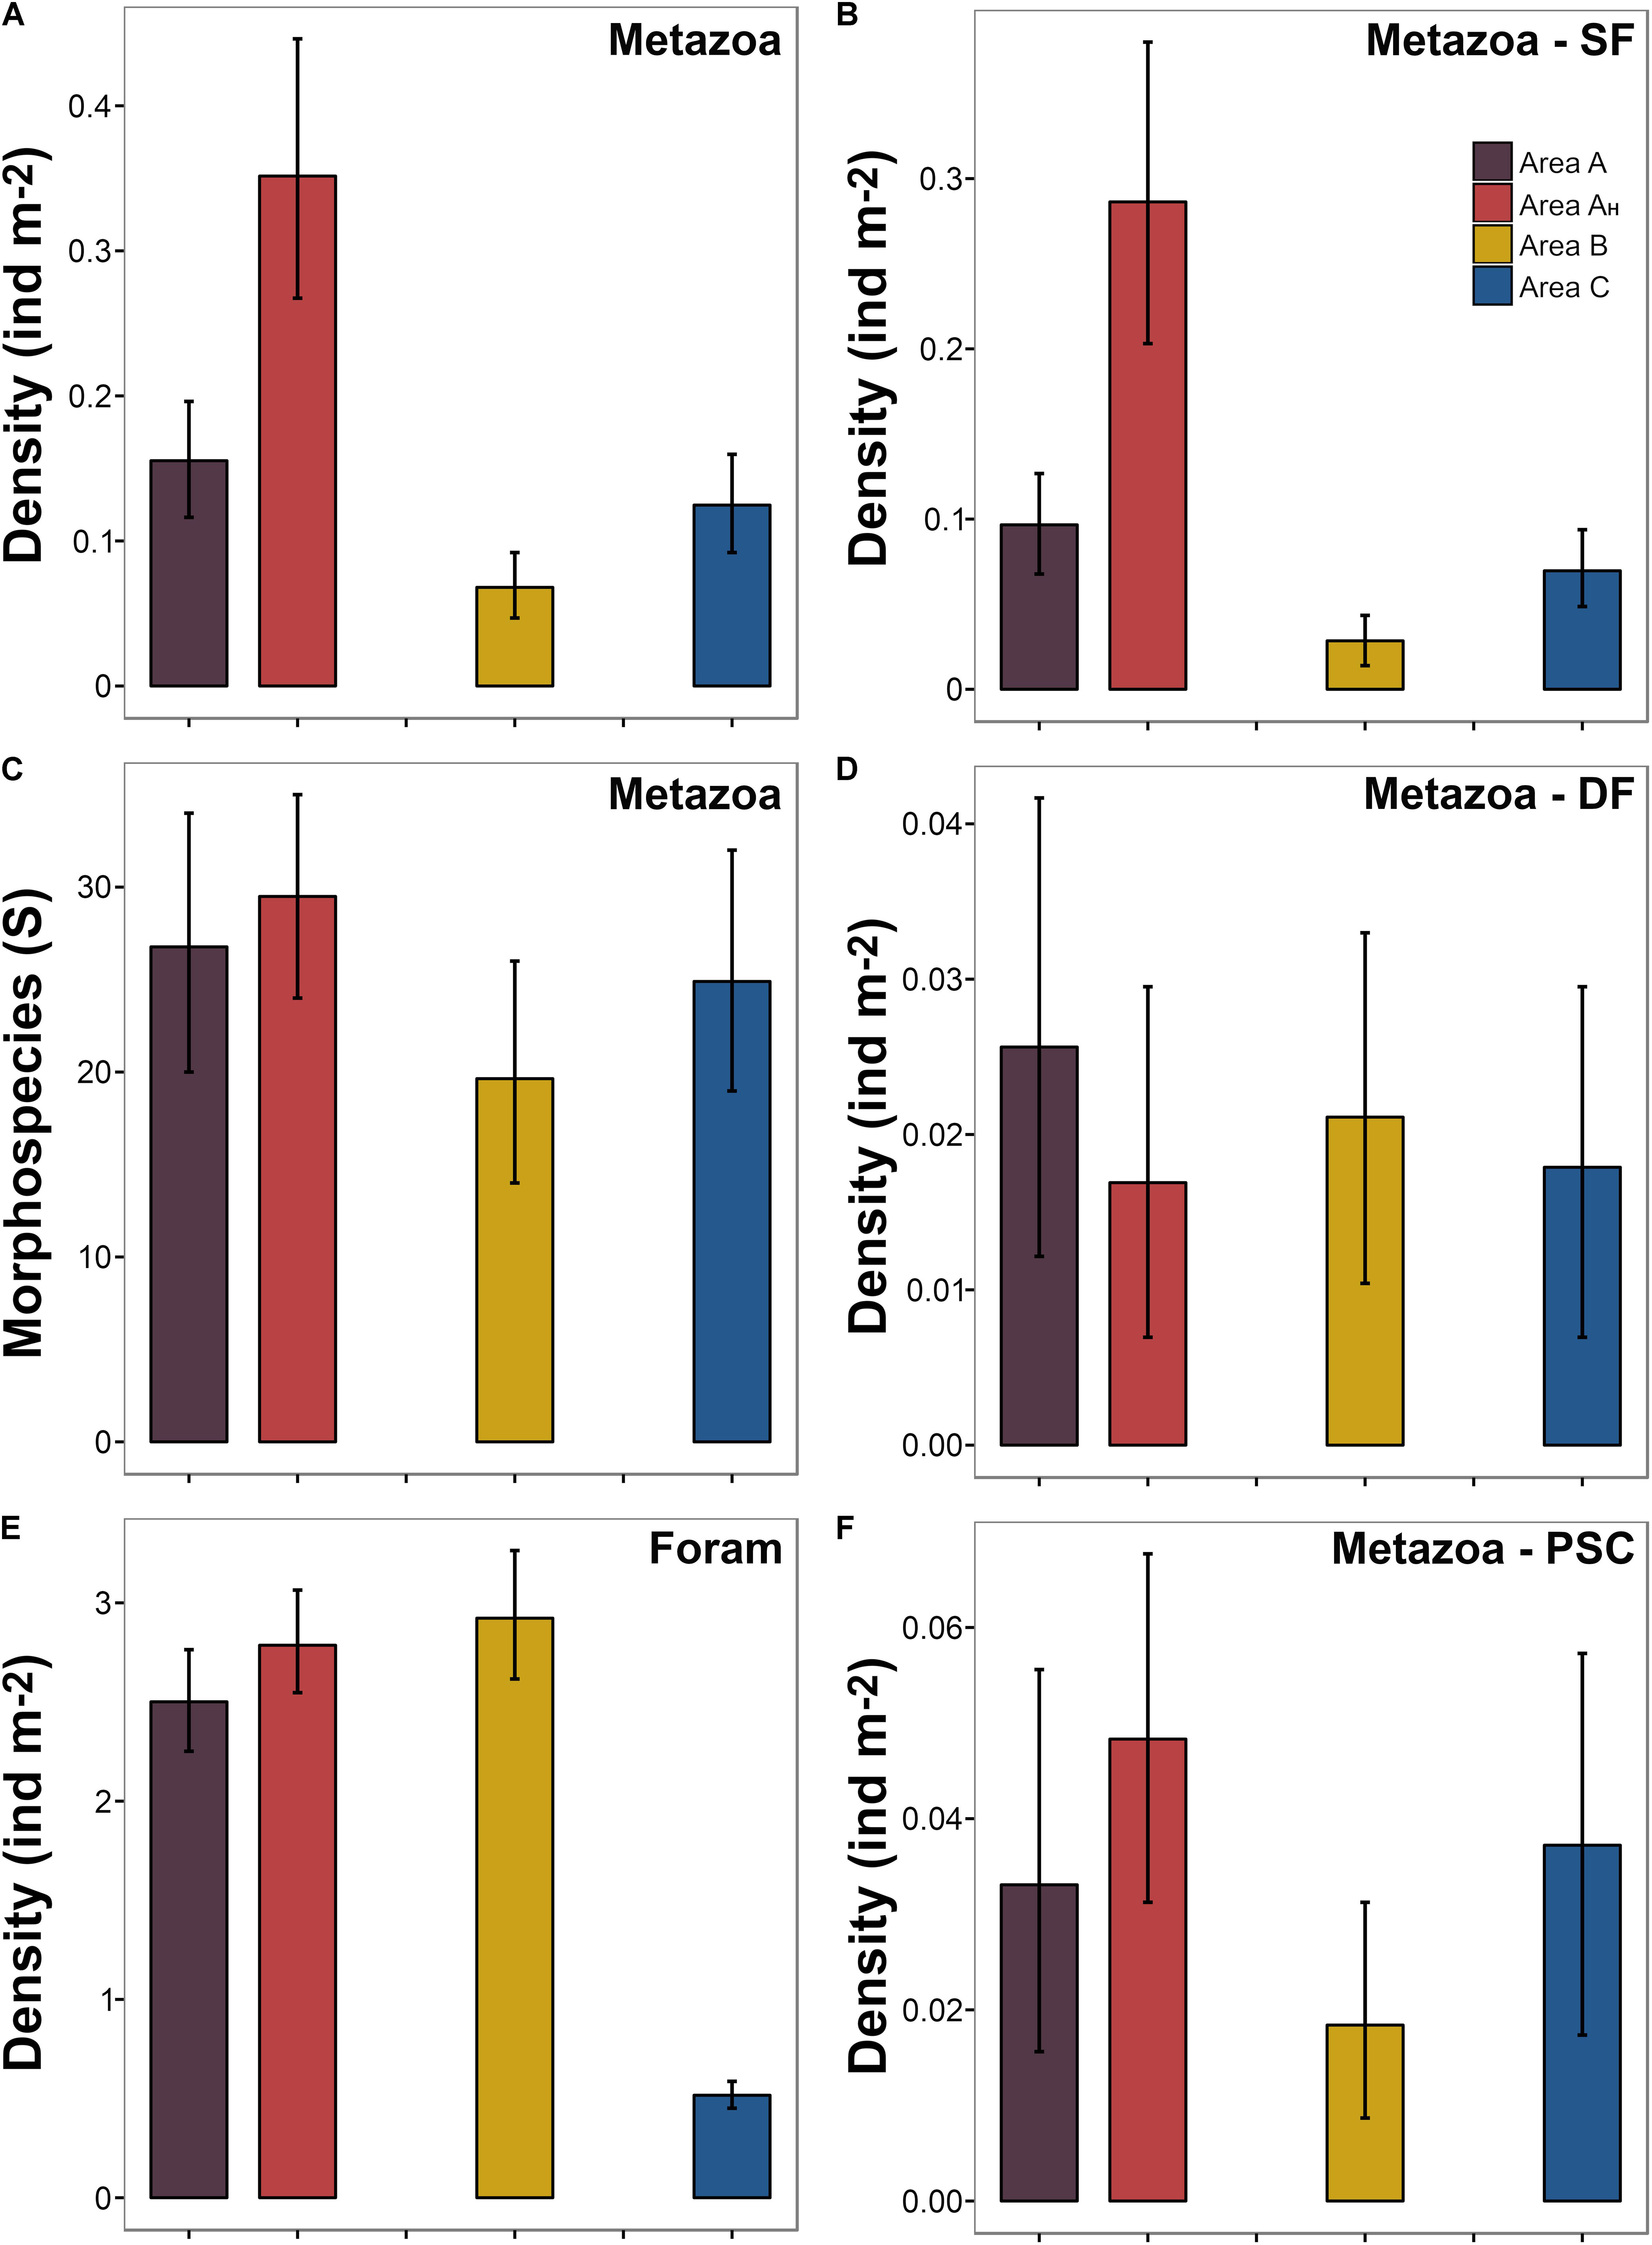
Figure 6. Variation in different biological parameters across the areas surveyed. Bars indicate mean density calculated from the bootstrap-like sample set generated for each area. Error bars represent 95% confidence intervals. (A) Density of metazoan fauna (note that B, D, and F are each a subset of A). (B) Density of metazoan suspension feeder fauna. (C) Metazoan morphospecies richness (in c. 500 m2 samples). (D) Density of metazoan deposit feeders. (E) Density of foraminiferal tests. (F) Density of metazoan predator and scavenger fauna. Abbreviations: Foram: foraminifera; SF: suspension feeders; DF: deposit feeders; and PSC: predators and scavengers.
Variations in diversity and composition
Mean metazoan morphospecies richness ranged between 19.6 and 29.6 (S, in samples c. 500 m2) across the different areas surveyed (Figure 6C). Area B exhibited the lowest mean taxa richness and Area AH the highest, but variations between areas were not substantial (i.e., overlapping confidence intervals: Figure 6C). Morphospecies richness curves showed no significant variations between different study areas in sample sizes up to 4,000 m2 (Figure 7A). However, individual-based assessments (Figure 7B) revealed a different taxa accumulation pattern in Area B, which indicates that the lower taxon richness found in this area resulted from its inherent lower faunal density, as opposed to Area AH. These patterns were consistent at whole study level (dashed-depicted accumulation curves; Figure 7).
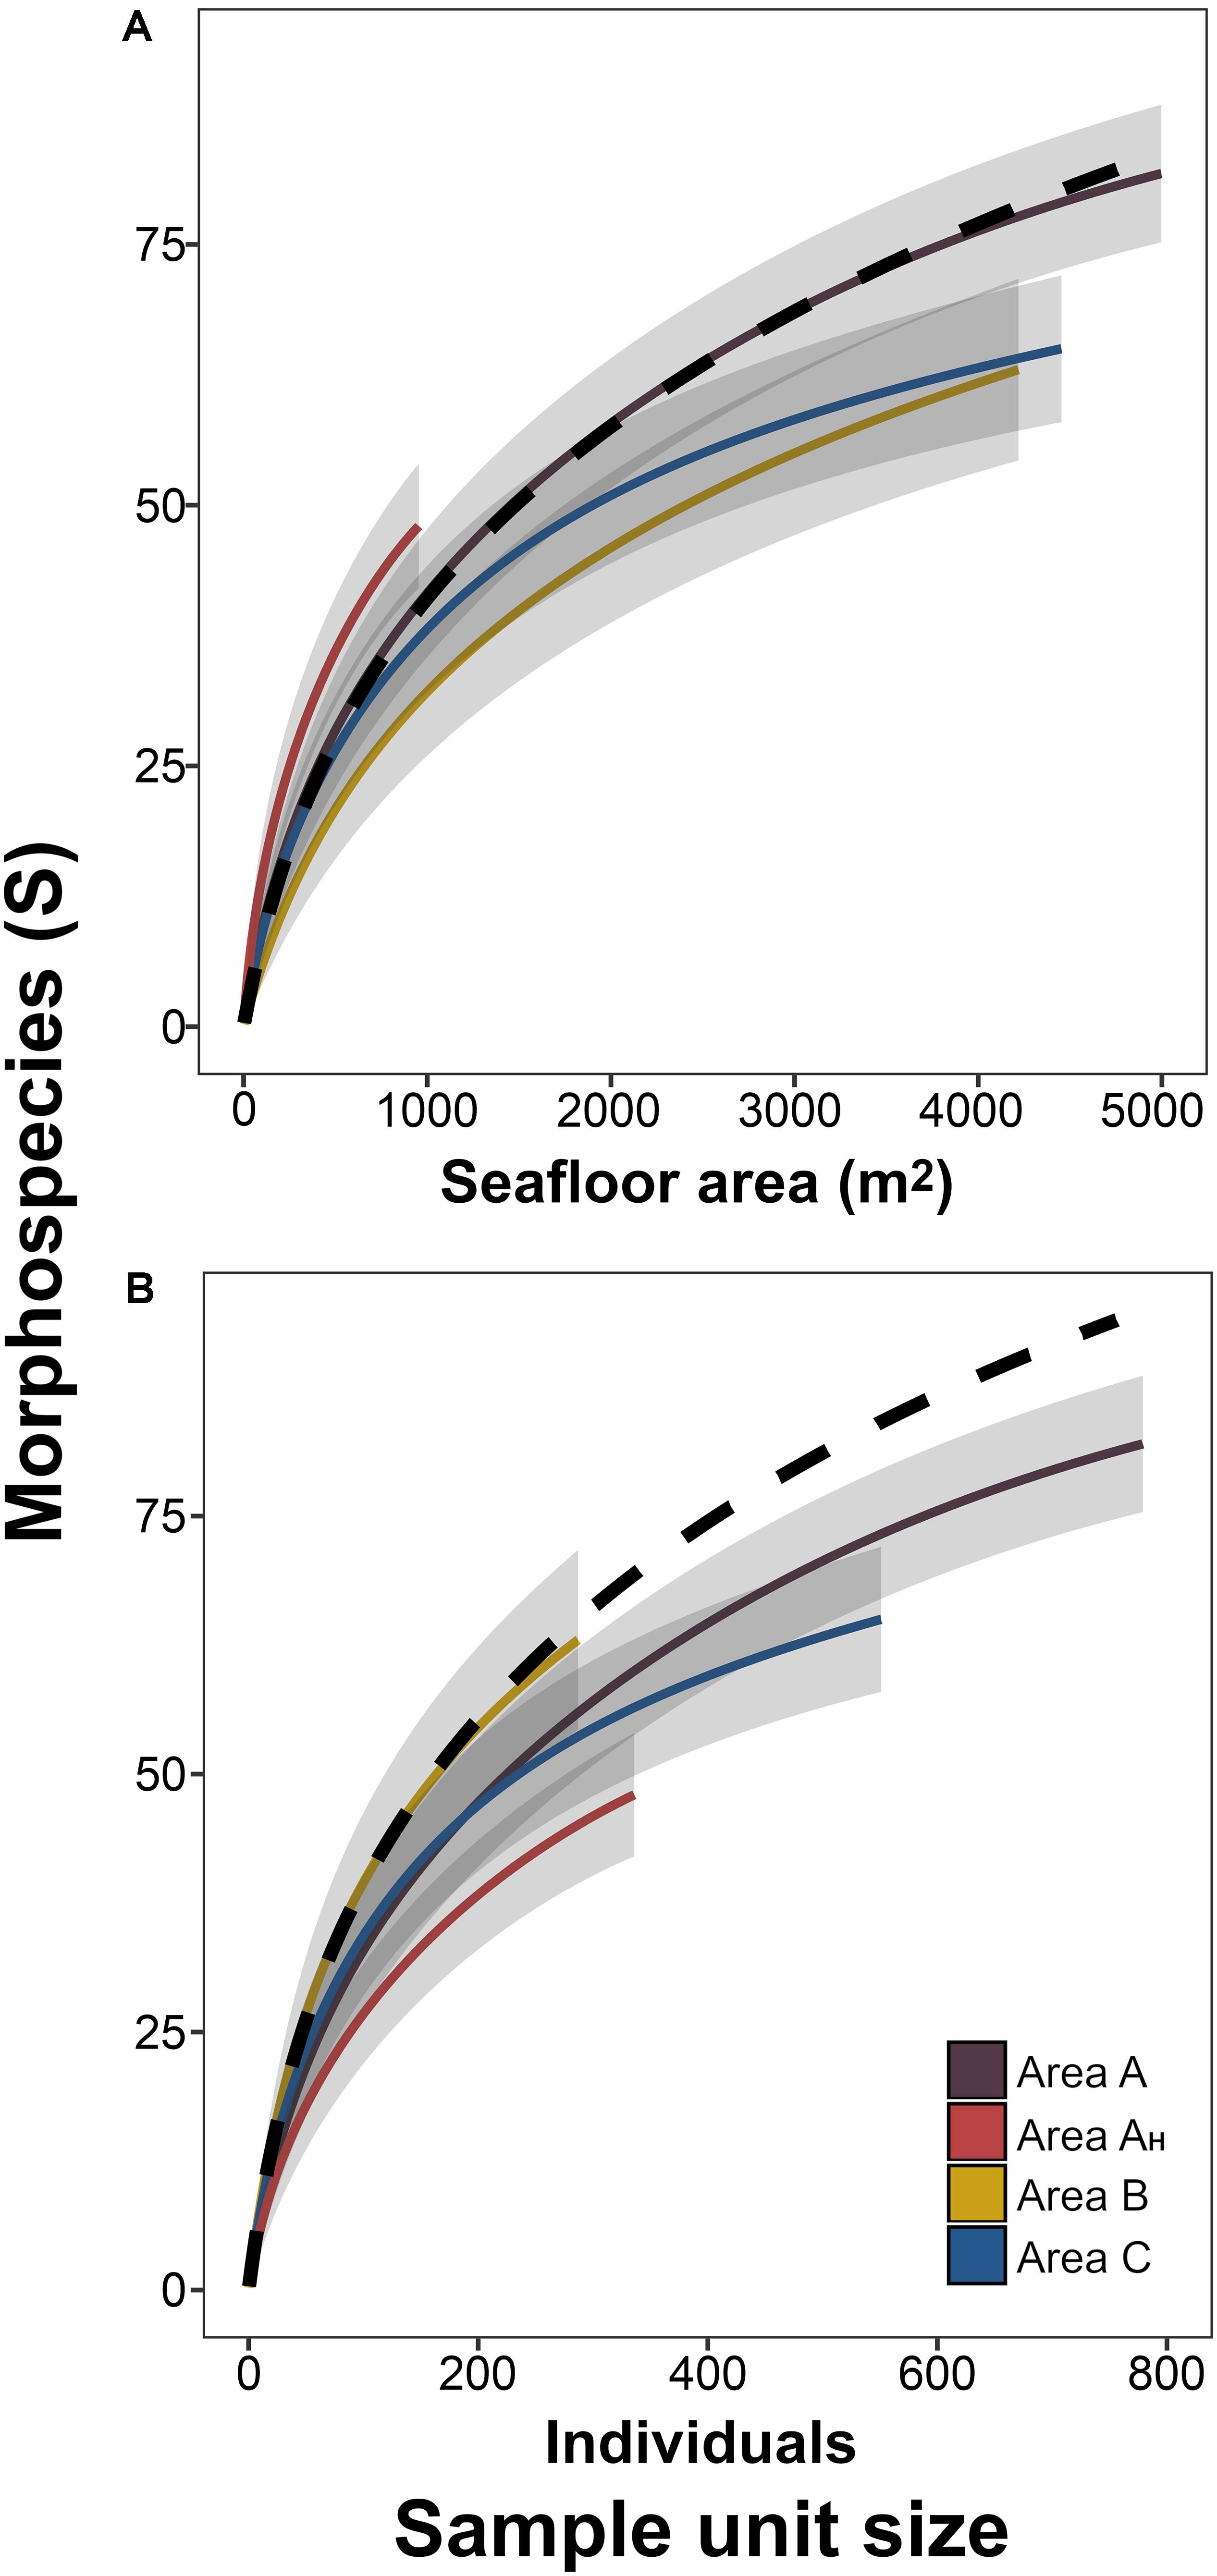
Figure 7. Metazoan morphospecies accumulation curves for each survey area. Curves were calculated as a function of the seabed area (A) or the number of individuals encompassed by the sample unit size (B). Lines represent mean values across the 100 randomizations performed at each sample unit size increase, for each study area. Shadowing representing 95% confidence intervals. Dashed line represents mean values of curve calculated using whole-study collated data.
In total, 33% of the metazoan morphospecies recorded were present in all three study areas, 18% were noted in only two areas, and 49% were detected in only one area (Figure 8A). More than half (53%) of the records exclusively found in a single area were singletons. Areas A and B shared a larger number of metazoan taxa (50%) than Area C with Areas A (36%) and B (35%). Two dimensional ordination of faunal composition by density readily distinguished Area A, B, and C samples, and Area AH samples from the rest of Area A (Figure 8B). However, within-site dissimilarity was substantial in Areas A, B, and C, with Area B exhibiting the highest heterogeneity; some bootstrap-like samples generated for Area B showed a higher similarity to those generated for Areas A and C than to other Area B samples. Density distribution of the four most-abundant metazoan phyla across study areas was variable (Figure 9). While the mean density (in samples c. 500 m2) of arthropods and particularly echinoderms was similar across study areas (Figures 9C,D), the mean density of cnidarians was substantially higher in Area A, especially in Area AH, compared to the other two areas (Figure 9A). On the other hand, mean sponge density (in samples c. 500 m2) was substantially higher (and similar) in Areas AH and C compared to that in Areas A and B (Figure 9B). The most remarkable variations in distribution at the morphospecies level between study areas were: (i) 95% of all Actiniaria msp-22 records (n = 228) were found in Areas A and AH; (ii) 97% of all the records (n = 76) of the sponge Docosaccus maculatus sp. inc. were found in Area C, (iii) 97% of all the records (n = 43) of the holothurian Psychropotes longicaudata (yellow morphotype; Figure 3I) were found in Areas A and B, while only one specimen was recorded in Area C, and (iv) all the records (n = 14) of the fish Ipnops meadi were found exclusively in Area C.
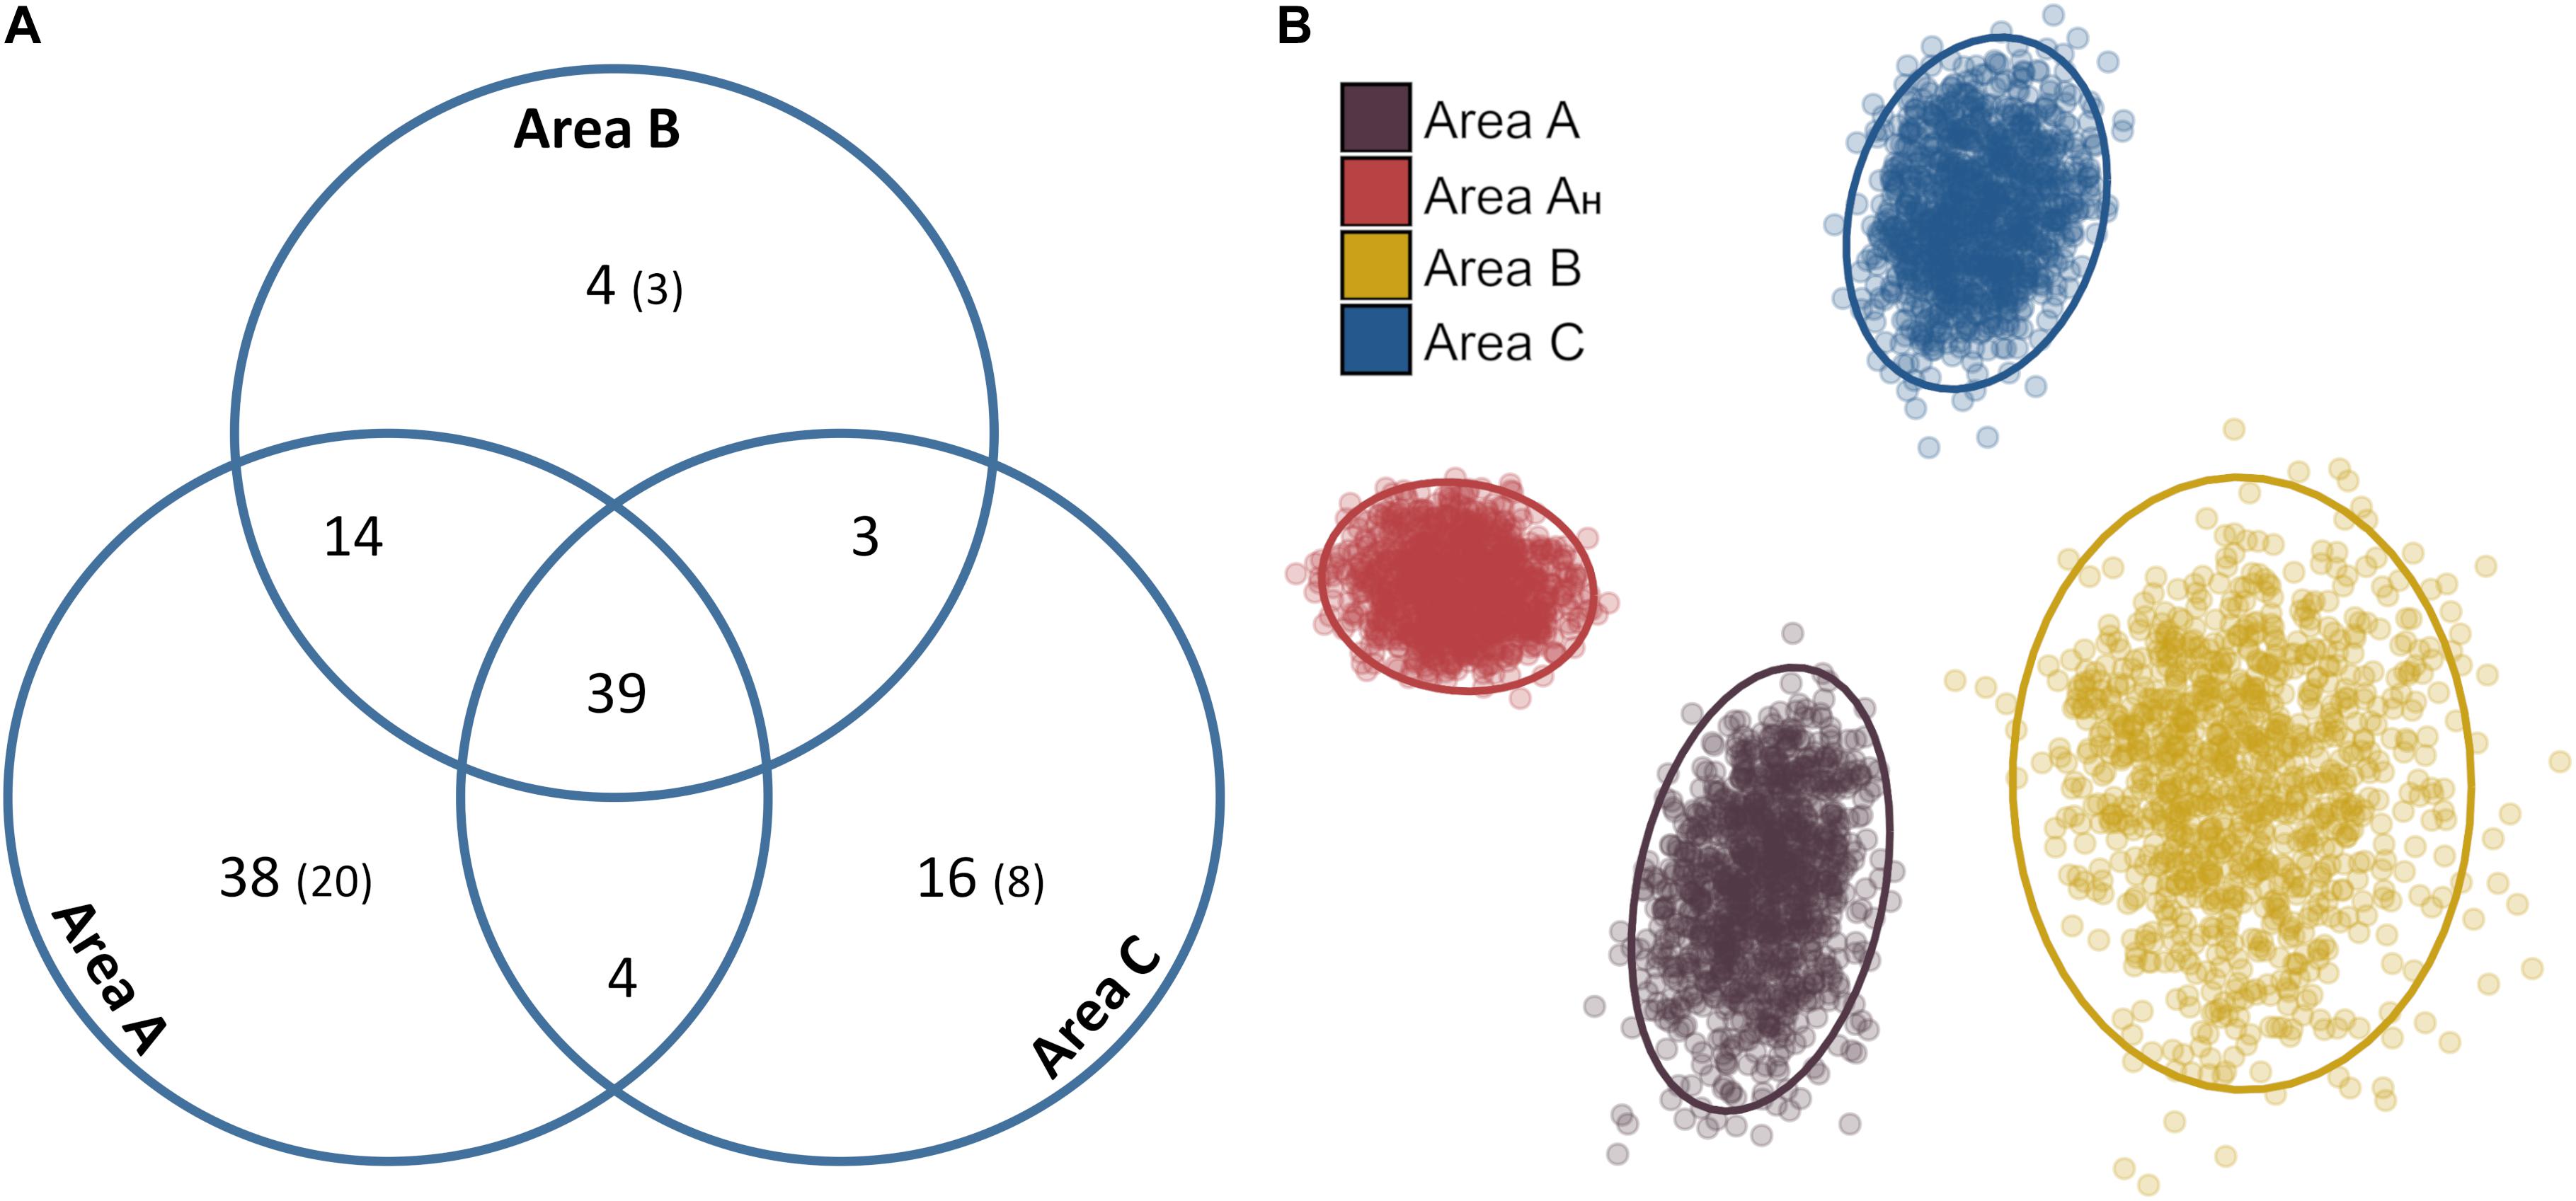
Figure 8. Qualitative and quantitative variations in metazoan community composition between different survey areas. (A) Venn diagram showing the total number of metazoan taxa shared between each combination of survey areas. In brackets: singleton morphospecies. (B) MDS plot describing 2D ordination of abundance-based dissimilarity (distance) between the assemblages of each bootstrap-like sample (stress = 0.08). Ellipses represent 95% confidence intervals for each bootstrap-like sample set.
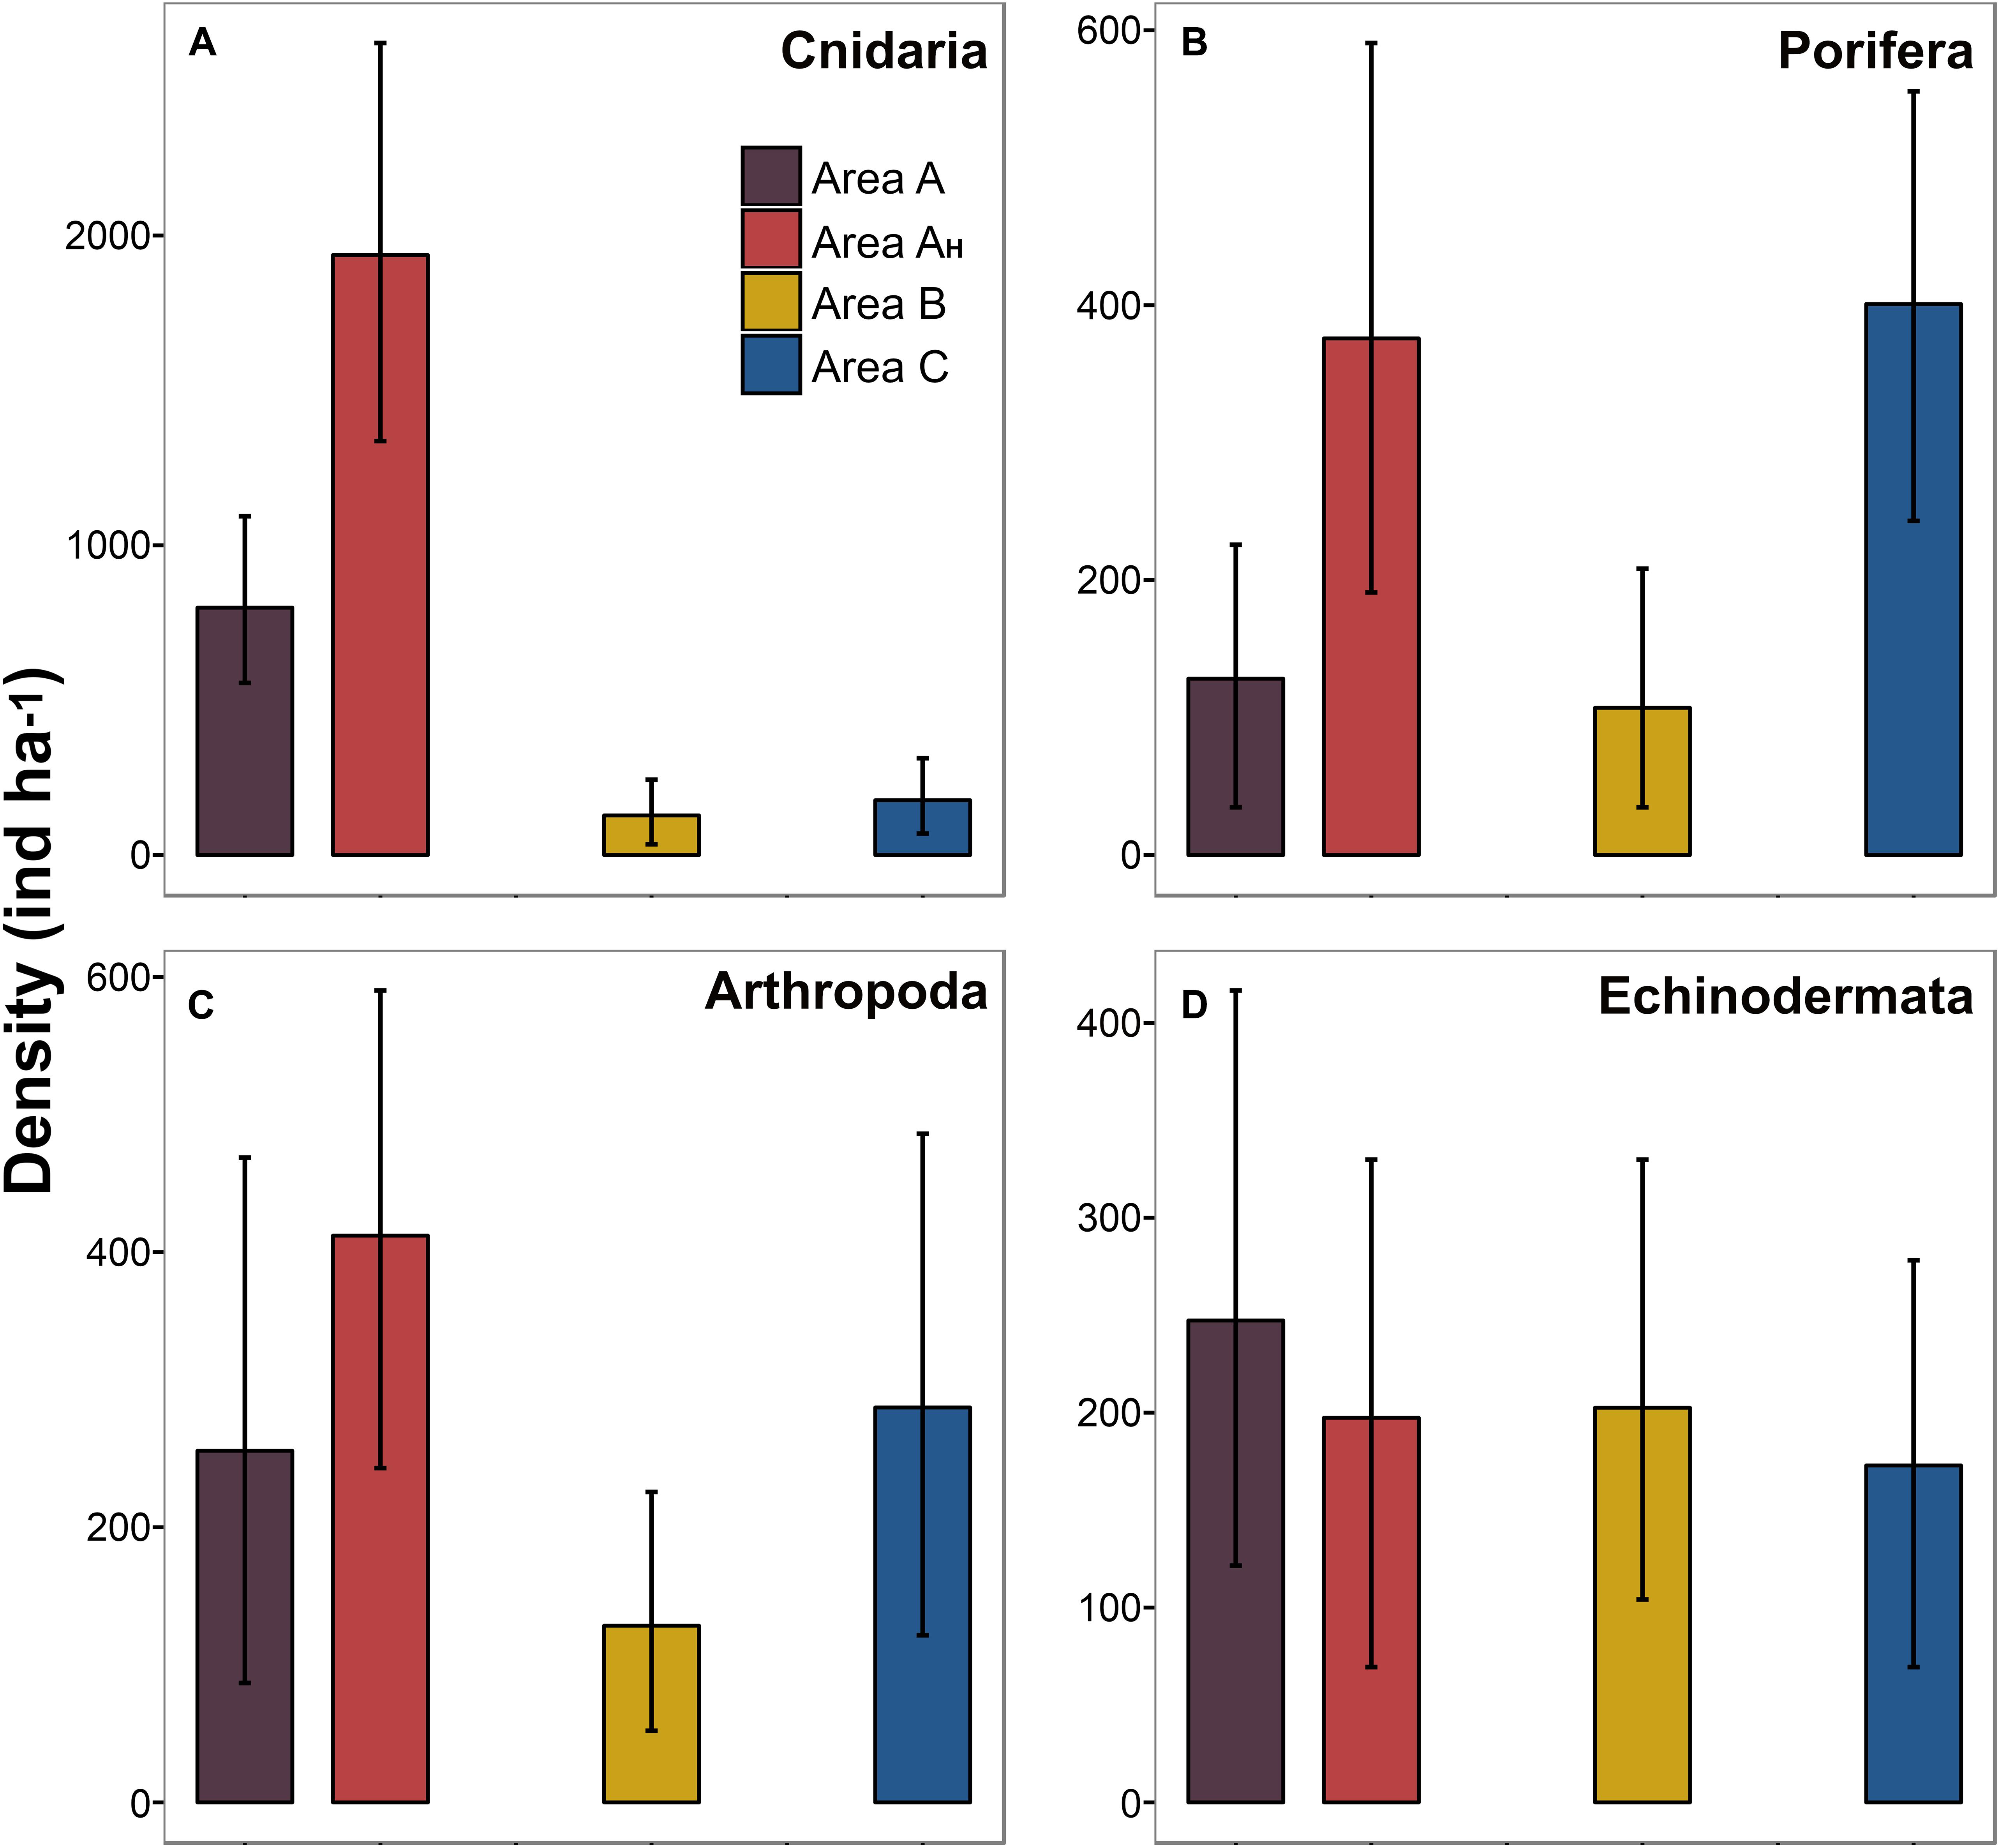
Figure 9. Variation in standing stock of different metazoan taxonomic groups across the study areas surveyed. Bars indicate mean density calculated from the bootstrap-like sample set generated for each area. Error bars represent 95% confidence intervals. (A) Cnidarian density. (B) Sponge density. (C) Arthropod density. (D) Echinoderm density.
Foraminiferal Megafauna
Most foraminiferal specimens observed were xenophyophores exhibiting reticulated (57%), plate-shaped (36%), and tubular (4%) morphologies, while miliolids represented only a small fraction (3%). Mean numerical density of foraminiferal tests was variable across the different areas surveyed (0.5 to 2.9 ind m–2), but exhibited different between-site patterns to those recorded in metazoan fauna (Figure 6E). Mean foram density was almost 6 times lower in Area C than in Areas A and B, and test density in Area AH was similar to that in the rest of Area A (Figure 6E). Reticulated xenophyophore morphospecies dominated the foraminiferal assemblages in Areas A (53%) and B (67%), while plate-shaped forms dominated the foraminiferal assemblages in Areas AH (47%) and C (50%). Total miliolid density in Area A (1230 ind ha–1) was higher than in Areas B (495 ind ha–1) and C (15 ind ha–1).
Discussion
Environmental Setting
Modeled bottom current speeds in the studied areas were relatively modest (∼0.01 cm s–1) compared to the ranges estimated below 3000 m water depth in the Kiribati region (∼0.001 to ∼0.1 m s–1; Figure 4A). Bottom current speed ranges obtained in our model were broadly comparable to those reported from in situ observations performed in eastern (Aleynik et al., 2017) and western (Hayes, 1979) areas of the CCZ. In turn, presumed ranges of vertical nutrient supply amongst the studied areas (1.50–1.99 g Corg m–2 y–1) were only comparable to those in more southern areas of the CCZ (Lutz et al., 2007; Figure 4B) as spring blooms in surface waters are more pronounced toward the equator (Pennington et al., 2006). As a result, despite that Area C is found ∼1000 m shallower than Areas A and B, and food supply usually decreases inversely with water depth (Buesseler et al., 2007), the closer proximity of Areas A and B to the equator is presumed to provide these with a comparably higher vertical nutrient input than Area C (Lutz et al., 2007).
Metazoan Megafauna
Standing Stocks
Metazoan standing stocks varied across the abyssal locations explored. Perhaps contrary to expectation, environmental factors differing between study areas (Table 1) that typically affect faunal density, such as water depth (Rex et al., 2006) and surface production (Johnson et al., 2007), appeared to have no observable effect on the relative megabenthic standing stock across study areas. The metazoan density surveyed in Area C was similar to that in Area A despite the comparably higher food supply that Area A is presumed to have (Lutz et al., 2007, Figure 4A). It is important to consider that differences in metazoan abundance across the areas surveyed were predominantly a result of variations in suspension feeder fauna density (e.g., sessile cnidarians and sponges). These organisms clearly dominated the metazoan megabenthos of the Kiribati abyss, with densities about an order of magnitude higher than those observed in deposit feeding or predator and scavenger fauna, a pattern that has been commonly reported in eastern areas of the CCZ (Amon et al., 2016; Simon-Lledó et al., 2019a). Deep-sea suspension feeder standing stocks are sensitive to variations in bottom water current speeds as these can alter the flux of laterally transported organic particles (Thistle et al., 1985; Angel and Boxshall, 1990). The substantially reduced presence of suspension feeders in Area B may hence be influenced by the comparably weaker bottom water circulation strength expected in this location (Table 1 and Figure 4A). These results suggest that the available environmental information was not sufficient to predict megabenthic standing stocks in this region, which may result from scale mismatches and local effects being more important that broad-scale generalizations. Therefore, further environmental characterization of the Kiribati abyssal seabed will be needed to fully understand the controls on metazoan abundance.
Area AH, the only survey location where some hard substratum was present in the seabed (i.e., partially sediment-covered exposed bedrock and polymetallic nodules), exhibited a substantially larger metazoan standing stock than the other study areas (Figure 6A) as a result of an enhanced abundance of sessile cnidarians (i.e., Actiniaria and alcyonacea; Table 2 and Figure 9A). Simon-Lledó et al. (2019b) recently showed that the availability of hard substratum can be key in the regulation of standing stocks and assemblage composition in abyssal megabenthic communities. For instance, at the CCZ, populations of sessile cnidarians are usually significantly reduced in areas where polymetallic nodules are absent (Vanreusel et al., 2016; Simon-Lledó et al., 2019b), as some of these taxa are typically obligate hard-substratum dwellers (Amon et al., 2016; Lim et al., 2017). In turn, metazoan densities observed in sediment-only areas (Area A, B, and C) were comparable to those reported in nodule-free areas explored in the eastern CCZ (Simon-Lledó et al., 2019b) using a similar image-sampling methodology (i.e., similar altitude of collection above-seabed and resolution). These results support that the availability of hard substratum in abyssal sedimentary habitats may be an important environmental driver in the structuring of local megabenthic communities. However, the total area surveyed in Area AH (∼1000 m2 of seabed) was substantially lower than those in the other study areas (i.e., 4200–5000 m2) and hence comparisons between this area and the rest should be drawn with caution, as a larger sampling effort may reveal further/different biological features.
Diversity and Assemblage Compositions
We found similar mean metazoan taxa richness across study areas, but taxa accumulation patterns suggested that the sampling effort applied was insufficient to fully characterize the richness of each separate study area (Figure 7). The low metazoan density characteristic of the North Pacific abyss, especially on sediment beds, can limit the representativeness of image-based megafauna samples (Simon-Lledó et al., 2019a). While the assessment of faunal density in deep-sea benthic environments typically requires relatively small sample sizes (e.g., >30 individuals per sample; Benoist et al., 2019; Simon-Lledó et al., 2019a), precise characterization of taxa richness and composition usually require a larger number of individuals in each sample (e.g., >500 individuals and >140 individuals per sample, respectively; Benoist et al., 2019; Simon-Lledó et al., 2019a) than was possible to obtain here (samples c. 500 m2, range: 27–151 individuals per sample). Consequently, while discussions of patterns across the areas studied here are presumably robust in terms of standing stocks, our results should be interpreted with caution with respect to community composition and are best limited to whole-of-study-area with respect to taxa richness. The total metazoan richness recorded in the Kiribati abyss (118 morphospecies: Table 2 and Supplementary Table S2) upon collation of all sample data (1948 metazoans) was comparable to that found in eastern CCZ locations, like the APEI6 (7837 metazoans, 133 taxa: Simon-Lledó et al., 2019b) or the UK-1 area (∼3500 metazoans, ∼126 taxa: Amon et al., 2016). Synthesis studies collating taxonomical data across all these studies are critical to determine the variability and biogeographical patterns across the North Pacific abyss.
Qualitative and quantitative analyses enabled a preliminary interpretation of variations in faunal composition across the areas studied. Qualitatively, a larger shared morphospecies pool was found between Areas A and B (42%) than between each of these and Area C (34–33%) (Figure 8A). A possible explanation is that the Line Islands volcanic ridge may isolate Area C populations from those to the west, as shown for other ridge systems on the abyssal plains (Carey, 1981; McClain et al., 2009). However, there was still a relatively large pool of shared taxa (30%) across all the areas, despite the large spatial distances (e.g., Area A to C: ∼2000 km) and the relatively small specimen sample sizes obtained, so dispersal pathways could exist (Figure 1). In contrast, quantitatively, faunal compositions varied across the four areas investigated (Figure 8B) owing to differences in the relative density of particular suspension feeder taxa between areas, such as sessile cnidarians and sponges (Figures 9A,B). Metazoan assemblages in Area A were numerically dominated by actiniarians (e.g., Actiniaria msp-22), whilst hexactinellid sponges (e.g., Docosaccus maculatus sp. inc.) dominated the assemblages in Area C. Moreover, the availability of hard substratum in Area AH appeared to generate a different metazoan aggregation than in the rest of Area A, with an enhanced presence of hard-substratum-dwelling taxa (e.g., alcyonacea soft corals; Cairns, 2016), as typically occurs between nodule-free and nodule-bearing sites at the local scale within the CCZ (Vanreusel et al., 2016; Simon-Lledó et al., 2019b). Results of quantitative analysis of composition were driven by the different faunal abundances encountered across the areas studied. For instance, the mean number of individuals encountered in Area AH (fixed area) samples was 96 (±11 standard deviation) while this number was 35 (± 6 standard deviation) in Area B samples. Consequently, while Area B exhibited the largest within-site heterogeneity, Area AH exhibited the most homogeneous assemblage (e.g., Figure 8B). These results suggest that further, larger, and comprehensively designed surveys will need to be conducted across the abyssal areas of Kiribati to determine if the preliminary patterns in richness and composition drawn in this study are consistent at larger scales. Future assessments should be sensitive to the environmental stratification (e.g., seabed composition, geomorphological setting, depth, etc.) that can drive biological variations and also to the low density -yet high richness- that is characteristic of metazoan megabenthic communities in the abyssal Pacific (Amon et al., 2016; Simon-Lledó et al., 2019a, this study).
Foraminifera Assemblages
Foraminiferal specimens (forams; xenophyophores and miliolids, Figures 3M–O) numerically dominated the megabenthic assemblages in the Kiribati abyss; being overall, an order of magnitude more abundant than metazoans, and reaching a peak density of 16.6 ind m–2 in an image from Area B. These results are consistent with previous assessments in abyssal Pacific megabenthic communities, which are typically dominated by giant foraminifera (Kamenskaya et al., 2013; Simon-Lledó et al., 2019a). Standing stocks of the larger sized fauna decrease dramatically with water depth (Rex et al., 2006) as diminishing food supply appears to prevent growth to larger body sizes (McClain et al., 2005). This hypothesis is consistent with the large dominance of foraminifera in the abyssal megabenthos, as their protoplasm volume represents a minor fraction of their visible test (Levin and Gooday, 1992), and because benthic bacteria dominate carbon consumption of these ecosystems (Sweetman et al., 2019).
Mean foram density in Areas A and B was comparable, though slightly lower, to that found in eastern CCZ locations surveyed using a similar sampling methodology (Simon-Lledó et al., 2019a). Forams are a key group in the functioning of abyssal Pacific communities (Kamenskaya et al., 2013), particularly at the CCZ, where these organisms are exceptionally diverse and abundant (Gooday et al., 2017a). The substantially reduced xenophyophore density within Area C is hence remarkable (Figure 6E), and somewhat unexpected given the closer proximity of this location to the CCZ compared to Areas A and B. Moreover, previous studies have shown increased abundances of xenophyophores in areas where hard substratum is present (Amon et al., 2016; Simon-Lledó et al., 2019b) as a result of the hard-substratum-attached life-habit of some taxa (Kamenskaya et al., 2013; Gooday et al., 2015). However, we found no substantial differences in the foram density between Area AH and the rest of Area A, despite the availability of hard substratum in the former, but only a shift in dominance from reticular to plate-shaped morphologies. Further investigation of the factors driving the development of foram taxa in abyssal depths is in urgent need, particularly in the North Pacific, where their extremely large abundance has been suggested to play a crucial role in providing habitat structures and enhancing the organic content of sediments surrounding their tests (Gooday et al., 2017a).
Conclusion
This study presents the first quantitative assessment of megafauna in the abyssal benthos of Kiribati, and an example of successful collaboration between industry and academic research. We found clear differences in the density of both the metazoan and the foraminiferal standing stocks across the study areas, but little if any substantive variation in biological diversity, and a potentially sample-size biased variation in community composition. Despite the low metazoan faunal density recorded, this study provides evidence of the high biodiversity of megafauna found in the Kiribati abyss. However, only a minor proportion of Kiribati’s deep seabed has been targeted for biological exploration (Rotjan et al., 2014; Cordes, 2017; Kennedy, 2017; this study), and hence further research will be required to characterize the true taxonomic richness of benthic communities in this region. Although no commercial activities have been proposed to date in the Kiribati abyss, future conservation plans and exploration efforts within this area should consider the high biodiversity and low density of megabenthic populations reported in this study if they are to be effective.
Data Availability Statement
All datasets generated for this study are included in the manuscript/Supplementary Files.
Author Contributions
All authors contributed to the design and implementation of the experimental strategy. JP, AF, and CP supervised the collection and processing of the seafloor imagery data. AY conducted the hydrographic data analysis. ES-L, ST, and CP performed the biological annotation of images. ES-L, AF, and DJ steered the biological survey design. ES-L and ST conducted biological data analysis. ES-L drafted the manuscript, which was critically revised and accepted by all the co-authors.
Funding
This work was supported by the United Kingdom Government through the Commonwealth Marine Economies Program, which aims to enable safe and sustainable marine economies across Commonwealth Small Island Developing States. DJ also received support from NERC through National Capability funding to NOC as part of the Climate Linked Atlantic Section Science (CLASS) program, grant number NE/R015953/1. The funders had no role in the study data processing and analysis, decision to publish, or preparation of the manuscript.
Conflict of Interest
AF was employed by company Fathom Pacific. JP and CP were employed by company Nautilus Minerals.
The remaining authors declare that the research was conducted in the absence of any commercial or financial relationships that could be construed as a potential conflict of interest.
Acknowledgments
We would like to thank Nautilus Minerals Inc., for providing the data for scientific study and the Kiribati Ministry of Fisheries and Marine Resource Development, particularly Tebete England, Kabure Yeeting and Joyce Uan, for their support of the project. The data were obtained under a Marine Scientific Research Permit to Nautilus Minerals Inc., issued by the Environment and Conservation Division of the Kiribati Ministry of Environment, Lands and Agricultural Development. We would also like to thank the scientific party and crew of the Research Vessel “Yuzhmorgeologiya” for their excellent work during marine operations. We would also like to thank Jeffrey Drazen and Astrid Leitner for their help in fish identifications, and Andrew Gooday for his help in the identification of foraminifera specimens.
Supplementary Material
The Supplementary Material for this article can be found online at: https://www.frontiersin.org/articles/10.3389/fmars.2019.00605/full#supplementary-material
References
Aleynik, D., Inall, M. E., Dale, A., and Vink, A. (2017). Impact of remotely generated eddies on plume dispersion at abyssal mining sites in the Pacific. Sci. Rep. 7:16959. doi: 10.1038/s41598-017-16912-16912
Amon, D. J., Ziegler, A. F., Dahlgren, T. G., Glover, A. G., Goineau, A., Gooday, A. J., et al. (2016). Insights into the abundance and diversity of abyssal megafauna in a polymetallic-nodule region in the eastern Clarion-Clipperton Zone. Sci. Rep. 6:30492. doi: 10.1038/srep30492
Angel, M. V., and Boxshall, G. A. (1990). Life in the benthic boundary layer: connections to the mid-water and sea floor [and Discussion]. Philos. Trans. R. Soc. Lond. Ser A Math. Phys. Sci. 331, 15–28. doi: 10.1098/rsta.1990.0053
Becker, J. J., Sandwell, D. T., Smith, W. H. F., Braud, J., Binder, B., Depner, J., et al. (2009). Global bathymetry and elevation data at 30 arc seconds resolution: SRTM30_PLUS. Marine Geodesy 32, 355–371. doi: 10.1080/01490410903297766
Benoist, N. M. A., Morris, K. J., Bett, B. J., Durden, J. M., Huvenne, V. A. I., Le Bas, T. P., et al. (2019). Monitoring mosaic biotopes in a marine conservation zone by autonomous underwater vehicle. Conserv. Biol. 33, 1174–1186. doi: 10.1111/cobi.13312
Brodeau, L., Barnier, B., Treguier, A. M., Penduff, T., and Gulev, S. (2010). An ERA40-based 461 atmospheric forcing for global ocean circulation models. Ocean. Model. 31, 88–104. doi: 10.1016/j.ocemod.2009.10.005
Buesseler, K. O., Lamborg, C. H., Boyd, P. W., Lam, P. J., Trull, T. W., Bidigare, R. R., et al. (2007). Revisiting carbon flux through the ocean’s twilight zone. Science 316, 567–570. doi: 10.1126/science.1137959
Cairns, S. D. (2016). New abyssal Primnoidae (Anthozoa: Octocorallia) from the clarion-clipperton fracture zone, equatorial northeastern Pacific. Mar. Biodivers. 46, 141–150. doi: 10.1007/s12526-015-0340-x
Carey, A. G. (1981). A comparison of benthic infaunal abundance on two abyssal plains in the northeast Pacific Ocean. Deep Sea Res. Part A Oceanogr. Res. Pap. 28, 467–479. doi: 10.1016/0198-0149(81)90138-2
Chao, A., Gotelli, N. J., Hsieh, T. C., Sander, E. L., Ma, K. H., Colwell, R. K., et al. (2014). Rarefaction and extrapolation with Hill numbers: a framework for sampling and estimation in species diversity studies. Ecol. Monogr. 84, 45–67. doi: 10.1890/13-0133.1
Clarke, K. R. (1993). Non-parametric multivariate analyses of changes in community structure. Aust. J. Ecol. 18, 117–143. doi: 10.1111/j.1442-9993.1993.tb00438.x
Colwell, R. (2013). EstimateS: Statistical Estimation of Species Richness and Shared Species From Samples. Version 9. Available at: http://viceroy.eeb.uconn.edu/EstimateS/index.html
Cordes, E. (2017). Discovering deep sea corals of the phoenix islands cruise catalog: FK171005. Mar. Geosci. Data Syst. doi: 10.7284/907641
Crowley, P. H. (1992). Resampling methods for computation-intensive data analysis in ecology and evolution. Annu. Rev. Ecol. Syst. 23, 405–447. doi: 10.1146/annurev.ecolsys.23.1.405
Davison, A. C., and Hinkley, D. V. (1997). Bootstrap Methods and Their Application. Cambridge: Cambridge University Press.
Drazen, J. C., Leitner, A., Morningstar, S., Marcon, Y., Greinert, J., and Purser, A. (2019). Observations of deep-sea fishes and mobile scavengers from the abyssal DISCOL experimental mining area. Biogeosciences 16, 3133–3146. doi: 10.5194/bg-16-3133-2019
Durden, J. M., Schoening, T., Althaus, F., Friedman, A., Garcia, R., Glover, A. G., et al. (2016). “Perspectives in visual imaging for marine biology and ecology: from acquisition to understanding,” in Oceanography and Marine Biology: An Annual Review, Vol. 54, eds R. N. Hughes, D. J. Hughes, I. P. Smith, and A. C. Dale, (Boca Raton, FL: CRC Press), 1–72.
Epp, D. (1984). Possible perturbations to hotspot traces and implications for the origin and structure of the Line Islands. J. Geophys. Res. Solid Earth 89, 11273–11286. doi: 10.1029/jb089ib13p11273
Gauss, G. A. (1980). Kiribati Offshore Survey. Cruise Report, No. 37 of PE/Kl - l, PE/KI-2; and PE/Kl-3. South Pacific: Joint Offshore Prospecting for Mineral Resources in South Pacific Offshore Areas (CCOP/SOPAC), 14.
Gooday, A. J., Goineau, A., and Voltski, I. (2015). Abyssal foraminifera attached to polymetallic nodules from the eastern Clarion Clipperton Fracture Zone: a preliminary description and comparison with North Atlantic dropstone assemblages. Mar. Biodivers. 45, 391–412. doi: 10.1007/s12526-014-0301-9
Gooday, A. J., Holzmann, M., Caulle, C., Goineau, A., Kamenskaya, O., Weber, A. A. T., et al. (2017a). Giant protists (xenophyophores, Foraminifera) are exceptionally diverse in parts of the abyssal eastern Pacific licensed for polymetallic nodule exploration. Biol. Conserv. 207, 106–116. doi: 10.1016/j.biocon.2017.01.006
Gooday, A. J., Holzmann, M., Goineau, A., Pearce, R. B., Voltski, I., Weber, A. A. T., et al. (2017b). Five new species and two new genera of xenophyophores (Foraminifera: Rhizaria) from part of the abyssal equatorial Pacific licensed for polymetallic nodule exploration. Zool. J. Linn. Soc. 183, 723–748. doi: 10.1093/zoolinnean/zlx093
Gooday, A. J., Sykes, D., Góral, T., Zubkov, M. V., and Glover, A. G. (2018). Micro-CT 3D imaging reveals the internal structure of three abyssal xenophyophore species (Protista, Foraminifera) from the eastern equatorial Pacific Ocean. Sci. Rep. 8:12103. doi: 10.1038/s41598-018-30186-30182
Hayes, S. P. (1979). “Benthic current observations at DOMES sites A, B, and C in the tropical north pacific ocean,” in Marine Geology and Oceanography of the Pacific Manganese Nodule Province, eds J. L. Bischoff, and D. Z. Piper, (Boston, MA: Springer), 83–112. doi: 10.1007/978-1-4684-3518-4_3
Horton, T., et al. (2018). World Register of Marine Species. Available at: http://www.marinespecies.org (accessed August 5, 2019).
Hughes, J. A., and Gooday, A. J. (2004). Associations between living benthic foraminifera and dead tests of Syringammina fragilissima (Xenophyophorea) in the darwin mounds region (NE Atlantic). Deep Sea Res. Part I Oceanogr. Res. Pap. 51, 1741–1758. doi: 10.1016/s0967-0637(04)00112-8
Iken, K., Brey, T., Wand, U., Voigt, J., and Junghans, P. (2001). Food web structure of the benthic community at the porcupine abyssal plain (NE Atlantic): a stable isotope analysis. Prog. Oceanogr. 50, 383–405. doi: 10.1016/s0079-6611(01)00062-3
Johnson, N. A., Campbell, J. W., Moore, T. S., Rex, M. A., Etter, R. J., McClain, C. R., et al. (2007). The relationship between the standing stock of deep-sea macrobenthos and surface production in the western North Atlantic. Deep Sea Res. Part IOceanogr. Res. Pap. 54, 1350–1360. doi: 10.1016/j.dsr.2007.04.011
Kamenskaya, O. E., Melnik, V. F., and Gooday, A. J. (2013). Giant protists (xenophyophores and komokiaceans) from the Clarion-Clipperton ferromanganese nodule field (eastern Pacific). Biol. Bull. Rev. 3, 388–398. doi: 10.1134/s2079086413050046
Kennedy, B. R. C. (2017). Okeanos Explorer 2017 EX1703 (Collection). Silver Spring, MD: National Oceanic and Atmospheric Administration.
Kersken, D., Janussen, D., and Martínez Arbizu, P. (2018). Deep-sea glass sponges (Hexactinellida) from polymetallic nodule fields in the clarion-clipperton fracture Zone (CCFZ), northeastern Pacific: Part I – Amphidiscophora. Mar. Biodivers. 48, 545–573. doi: 10.1007/s12526-017-0727-y
Langenkämper, D., Zurowietz, M., Schoening, T., and Nattkemper, T. W. (2017). BIIGLE 2.0 - browsing and annotating large marine image collections. Front. Mar. Sci. 4:83. doi: 10.3389/fmars.2017.00083
Levin, L. A., and Gooday, A. J. (1992). “Possible roles for xenophyophores in deep-sea carbon cycling,” in Deep-Sea Food Chains and the Global Carbon Cycle, eds G. T. Rowe and V. Pariente, (Dordrecht: Springer), 93–104. doi: 10.1007/978-94-011-2452-2_6
Lim, S.-C., Wiklund, H., Glover, A. G., Dahlgren, T. G., and Tan, K.-S. (2017). A new genus and species of abyssal sponge commonly encrusting polymetallic nodules in the Clarion-Clipperton Zone, East Pacific Ocean. System. Biodivers. 15, 507–519. doi: 10.1080/14772000.2017.1358218
Lutz, M. J., Caldeira, K., Dunbar, R. B., and Behrenfeld, M. J. (2007). Seasonal rhythms of net primary production and particulate organic carbon flux to depth describe the efficiency of biological pump in the global ocean. J. Geophys. Res. 112:C10011. doi: 10.1029/2006JC003706
Madec, G. (2008). NEMO reference manual, ocean dynamic component: NEMO–OPA. Notes du Pole de modélisation. Institut Pierre-Simon Laplace (IPSL). Tech. Rep. 27, 1288–1161.
Marzocchi, A., Hirschi, J. J. M., Holliday, N. P., Cunningham, S. A., Blaker, A. T., and Coward, A. C. (2015). The North Atlantic subpolar circulation in an eddy–resolving global ocean model. J. Mar. Syst. 142, 126–143. doi: 10.1016/j.jmarsys.2014.10.007
McClain, C. R., Rex, M. A., and Etter, R. J. (2009). “Deep-sea macroecology,” in Marine Macroecology, eds J. D. Witman, and K. Roy, (Chicago, IL: University of Chicago Press), 65–100. doi: 10.7208/chicago/9780226904146.003.0003
McClain, C. R., Rex, M. A., and Jabbour, R. (2005). Deconstructing bathymetric body size patterns in deep-sea gastropods. Mar. Ecol. Prog. Ser. 297, 181–187. doi: 10.3354/meps297181
Molodtsova, T. N., and Opresko, D. M. (2017). Black corals (Anthozoa: Antipatharia) of the Clarion-Clipperton Fracture Zone. Mar. Biodivers. 47, 349–365. doi: 10.1007/s12526-017-0659-6
Murray, J., and Renard, A. F. (1891). Report on Deep-Sea Deposits Based on the Specimens Collected During the Voyage of H.M.S. Challenger in the years 1872 to 1876. Report on the scientific results of the voyage of HMS Challenger during the years 1873-76. Edinburgh: H.M. Stationery Office.
Murray, J. W. (1895). A Summary of the Scientific Results Obtained at the Sounding, Dredging and Trawling Stations of H.M.S. Challenger. Edinburgh: H.M. Stationery Office.
Nautilus Minerals, (2016). NI 43-101 Technical Report. TOML Clarion Clipperton Zone Project, Pacific Ocean. Brisbane, QLD: AMC Consultants, 280.
Obura, D., Stone, G., Mangubhai, S., Bailey, S., Yoshinaga, H., and Barrel, R. (2011). Baseline marine biological surveys of the phoenix islands, July 2000. Atoll. Res. Bull. 589, 1–63.
Okamoto, N. (2005). Deep-sea mineral potential in the south pacific region: review of the Japan/SOPAC Deep-sea mineral resources study programme. Occas. Pap. 41, 21–30.
Oksanen, J., Guillaume Blanchet, F., Friendly, M., Kindt, R., Legendre, P., McGlinn, D., et al. (2018). vegan: Community Ecology Package. R package version 2.4-6. Available at: https://CRAN.R-project.org/package=vegan (accessed April 20, 2019).
Pennington, J. T., Mahoney, K. L., Kuwahara, V. S., Kolber, D. D., Calienes, R., and Chavez, F. P. (2006). Primary production in the eastern tropical Pacific: a review. Prog. Oceanogr. 69, 285–317. doi: 10.1016/S0140-6736(14)60844-8
R Core Team, (2017). R: A Language and Environment for Statistical Computing. Vienna: R Foundation for Statistical Computing.
Rex, M. A., Etter, R. J., Morris, J. S., Crouse, J., McClain, C. R., Johnson, N. A., et al. (2006). Global bathymetric patterns of standing stock and body size in the deep-sea benthos. Mar. Ecol. Prog. Ser. 317, 1–8. doi: 10.3354/meps317001
Rodgers, J. L. (1999). The bootstrap, the jackknife, and the randomization test: a sampling taxonomy. Multivariate Behav. Res. 34, 441–456. doi: 10.1207/S15327906MBR3404_2
Rotjan, R., Jamieson, R., Carr, B., Kaufman, L., Mangubhai, S., Obura, D., et al. (2014). “Chapter Eight - establishment, management, and maintenance of the phoenix islands protected area,” in Advance Marine Biology, eds M. L. Johnson, and J. Sandell, (Cambridge, MA: Academic Press).
Simon-Lledó, E., Bett, B. J., Huvenne, V. A. I., Schoening, T., Benoist, N. M. A., Jeffreys, R. M., et al. (2019a). Megafaunal variation in the abyssal landscape of the clarion clipperton zone. Prog. Oceanogr. 170, 119–133. doi: 10.1016/j.pocean.2018.11.003
Simon-Lledó, E., Bett, B. J., Huvenne, V. A. I., Schoening, T., Benoist, N. M. A., and Jones, D. O. B. (2019b). Ecology of a polymetallic nodule occurrence gradient: implications for deep-sea mining. Limnol. Oceanogr. 64, 1883–1894. doi: 10.1002/lno.11157
Simon-Lledó, E., Bett, B. J., Huvenne, V. A. I., Köser, K., Schoening, T., Greinert, J., et al. (2019c). Biological effects 26 years after simulated deep-sea mining. Sci. Rep. 9:8040. doi: 10.1038/s41598-019-44492-w
Sweetman, A. K., Smith, C. R., Shulse, C. N., Maillot, B., Lindh, M., Church, M. J., et al. (2019). Key role of bacteria in the short-term cycling of carbon at the abyssal seafloor in a low particulate organic carbon flux region of the eastern Pacific Ocean. Limnol. Oceanogr. 64, 694–713. doi: 10.1002/lno.11069
Théel, H. (1882). the Holothurioidea, dredged by H.M.S. Challenger during the Years 1873-1876. Part 1. Reports of Science Research Voyage of H.M.S. Challenger. Zoology 4, 1–176.
Thistle, D., Yingst, J. Y., and Fauchald, K. (1985). A deep-sea benthic community exposed to strong near-bottom currents on the Scotian Rise (western Atlantic). Mar. Geol. 66, 91–112. doi: 10.1016/0025-3227(85)90024-6
Vanreusel, A., Hilario, A., Ribeiro, P. A., Menot, L., and Arbizu, P. M. (2016). Threatened by mining, polymetallic nodules are required to preserve abyssal epifauna. Sci. Rep. 6, 26808. doi: 10.1038/srep26808
Keywords: deep-sea, biodiversity, imagery, conservation, EEZ, Pacific basin
Citation: Simon-Lledó E, Thompson S, Yool A, Flynn A, Pomee C, Parianos J and Jones DOB (2019) Preliminary Observations of the Abyssal Megafauna of Kiribati. Front. Mar. Sci. 6:605. doi: 10.3389/fmars.2019.00605
Received: 21 May 2019; Accepted: 11 September 2019;
Published: 30 September 2019.
Edited by:
William W. Chadwick, Pacific Marine Environmental Laboratory (NOAA), United StatesReviewed by:
Chris Mah, National Museum of Natural History (SI), United StatesPaulo Yukio Gomes Sumida, University of São Paulo, Brazil
Steven Auscavitch, Temple University, United States
Copyright © 2019 Simon-Lledó, Thompson, Yool, Flynn, Pomee, Parianos and Jones. This is an open-access article distributed under the terms of the Creative Commons Attribution License (CC BY). The use, distribution or reproduction in other forums is permitted, provided the original author(s) and the copyright owner(s) are credited and that the original publication in this journal is cited, in accordance with accepted academic practice. No use, distribution or reproduction is permitted which does not comply with these terms.
*Correspondence: Erik Simon-Lledó, ZXJpbW9uQG5vYy5hYy51aw==