 Xiaoxiao Wang
 Xiaoshou Liu
 Jishang Xu
- 1College of Marine Life Sciences, Ocean University of China, Qingdao, China
- 2Institute of Evolution and Marine Biodiversity, Ocean University of China, Qingdao, China
- 3Key Lab of Submarine Geosciences and Prospecting Techniques, Ministry of Education, Qingdao, China
- 4College of Marine Geosciences, Ocean University of China, Qingdao, China
Sediment samples were collected from 23 sites near the Yap Trench in the Western Pacific Ocean with a depth range of 2896–7837 m. The assemblage composition, spatial distribution, and relationship with environmental variables of meiofauna were studied. A total of 17 meiofaunal taxa were identified, including free-living marine nematodes, benthic copepods, nauplii, ostracods, halacarids, kinorhynchs, cumaceans, turbellarians, cladocerans, polychaetes, oligochaetes, isopods, tanaidaceans, amphipods, tardigrades, gastrotrichs, and pycnogonids. The average abundance of meiofauna was (172.88 ± 149.02) ind⋅10 cm–2. Marine nematodes were the most abundant group, with an average abundance of (120.26 ± 102.85) ind⋅10 cm–2, accounting for 69.97% of the total meiofauna, followed by benthic copepods (36.13 ± 48.72) ind⋅10 cm–2, accounting for 21.04%. The horizontal distribution of meiofauna showed that the high values of meiofaunal abundance were mainly distributed in the northwestern part of the study area and correlated with high sediment organic matter content, which possibly was related to the localized topography, food sources, and hydrodynamics within this area. Vertical distribution showed that meiofauna were mainly distributed in the upper and middle sediment layer (0–6 cm). Results of BIOENV showed that sediment median diameter and pheophorbide content were the most important factors affecting meiofauna community structure. This study provides an insight into relationships of deep-sea meiofauna assemblages with environmental factors in the Western Pacific Ocean.
Introduction
Meiofauna represents a group of small-sized benthic animals that pass a mesh screen with an aperture of 0.5 mm (or 1.0 mm), but are retained by a mesh screen with an aperture of 0.031 mm (Thiel, 1971). Meiofauna in deep-sea sediments tends to be smaller, and researchers recommend using a mesh screen of 0.031 mm aperture (SCOR Working Group 76, 1994). There are several widely distributed meiofauna taxa which show a high turnover rate, and are food sources for larvae of fishes, shrimps, and shellfish. They also play an important role in energy conversion and as indicators for environmental health. Meiofauna also provide links in the marine benthic food web (Higgins and Thiel, 1988; Montagna, 1995) and affect biogeochemical cycles through mineralization (Findlay and Tenore, 1982; Ingham et al., 1985; Heip et al., 1992). Several studies demonstrated that meiofauna taxa are good indicators for pollution, disturbance, and climate changes (Coull and Chandler, 1992; Pusceddu et al., 2014; Zeppilli et al., 2015). Meiofauna activities modify a series of physical, chemical, and biological sediment properties. These changes, directly or indirectly, positively or negatively, affect a variety of ecosystem services, including sediment stabilization, biogeochemical cycles, waste removal, and food web dynamics, at different spatial and temporal scales. Small animals can regulate ecosystem processes in sediment with few or no large animals, thereby improving the resilience of benthic ecosystem processes that are essential for the continued provision of ecosystem services (Schratzberger and Ingels, 2018).
For example, through the behavior and physiological activities of different meiofauna taxa, it is possible to understand how the organal and physiological activities of meiofauna respond to environmental changes and provide early warning signals for human disturbance (Zeppilli et al., 2015). Some researchers have studied the main mode of action of oil water-soluble fractions on long-term sublethal effects of meiofauna such as nematodes (Monteiro et al., 2019) and effects of marine hypoxia on meiofauna (Neira et al., 2018).
With respect to water depth, the marine environment can be divided into shallow littoral shelf zones (water depth <200 m) and deep-water zones (water depth >200 m) (Li and Fan, 2011). The deep-sea is the largest ecosystem on the planet. It is considered to be an extreme environment due to high pressure, low temperature. Zeppilli et al. (2018) summarized the biodiversity, ecological, and physiological responses of meiofauna living in extreme marine environments, providing information on how meiofauna adapting to the extreme conditions of the deep sea and how being affected by anthropogenic activities (Gage and Tyler, 1991; Mestre et al., 2014). Deep-sea environments include troughs, trenches, seamounts, hydrothermal and cold springs, and deep-sea plains (Ramirez-Llodra et al., 2010). Meiofauna is a major component of deep-sea environments. Since the 1960s, the ecology of meiofauna of the deep-sea has been increasingly studied (Vincx et al., 1994). Thiel (1971, 1983) carried out several meiofaunal studies in deep-sea areas, including the Atlantic, Indian, and Mediterranean oceans, and studies on the relationship between productivity and the abundance of meiofauna with water depth gradients in some deep-sea basins and central oceanic regions. Thiel (1983) first reviewed the quantitative studies of meiofauna in the early 1980s. Tietjen (1992) studied and summarized abundance and biomass trends of meiofauna in the Atlantic, Pacific, and Indian oceans along with water depth gradients, and the relationship between meiofauna stocks and those of other benthic taxa. Soltwedel (2000) reviewed the population relationships between different regions and differences in surface productivity along water depth gradients. In a very recent paper, Rosli et al. (2017) studied the environmental variables and possible biological and anthropogenic disturbances affecting meiofauna assemblages in the deep sea at different regional scales. Schmidt et al. (2019) investigated meiofauna in the Kuril–Kamchatka Trench and adjacent abyssal plain in relation to environmental variables. Several studies have shown that meiofauna can adapt to extreme environments (mangroves, submarine caves, Polar ecosystems, hypersaline areas, hypoxic/anoxic environments, hydrothermal vents, cold seeps, etc.) (Danovaro, 2010; Fontaneto et al., 2015). There are also some studies of deep-sea meiofauna focusing on the northern part of the South China Sea and the Pacific Ocean, including studies by Zou (2006), who studied the genetic diversity of meiofauna. Gao et al. (2002), Yang et al. (2005), and Liu et al. (2014) studied the abundance, biomass, and spatial distribution of meiofauna. Ye et al. (2005) and Wang et al. (2013) studied the methodology of meiofauna research in deep sea. Although deep seas are less disturbed by humans than shallow waters, deep-sea ecosystems are disrupted as mineral extraction, natural gas/hydrocarbon exploration and global warming, ocean acidification, hypoxia, etc. This study explored the composition, abundance of meiofauna, and sediment characteristics in the adjacent waters of the Yap trench, including the West Caroline basin, and measured sediment organic matter content, grain size, chlorophyll, and pheophorbide (Pha) contents. Through analysis of the relationship between these environmental factors with the abundance and assemblages of meiofauna, the present study aims to explore whether any of these environmental variables drives the meiofauna assemblages and how these compare to depth differences, and whether the topography of the deep-sea floor affects meiofauna distribution.
Materials and Methods
Field Sampling
From May to July 2017, sediment samples were collected from 23 sites on board of the R/V Haida in the Western Pacific Ocean (Figure 1). The study area is located in the West Caroline Basin in the southwest, the Yap Trench in the northwest (where the Caroline Plate subducts below the Philippine Plate), and the West Caroline Uplift in the north. The Caroline plate subducted westward along the Yap trench to the Philippine Sea plate to form a trench (above 7000 m) and a relatively flat West Caroline Basin. The sediment types were mainly brown clay, calcareous, or siliceous ooze. Sites A4, C1 were located at the trench and Site B1 was located in the back-arc basin of the west side of the trench (Yap Island Arc) (Dong et al., 2017). The other 20 sites were mainly distributed in the West Caroline Basin. Sediment samples were collected with a 0.25 m2 Gray-O’Hara box corer. Three cores of sediment (a plexiglass tube with a 6 cm inner diameter and 10 cm length) were carefully taken for meiofauna from box corers at each sampling site. The samples were horizontally sectioned by layers of 0–1, 1–2, 2–4, 4–6, 6–8, and 8–10 cm, and fixed with 5% buffered formalin. At the same time, sediment samples were also collected and frozen at −20°C for analysis of organic matter content, grain size, Chlorophyll-a (Chl-a), and Pha following the General Administration of Quality Supervision, Inspection and Quarantine of the People’s Republic of China (2008). Bottom water pH values were determined by a CTD (Seabird 911 plus, United States) on board.
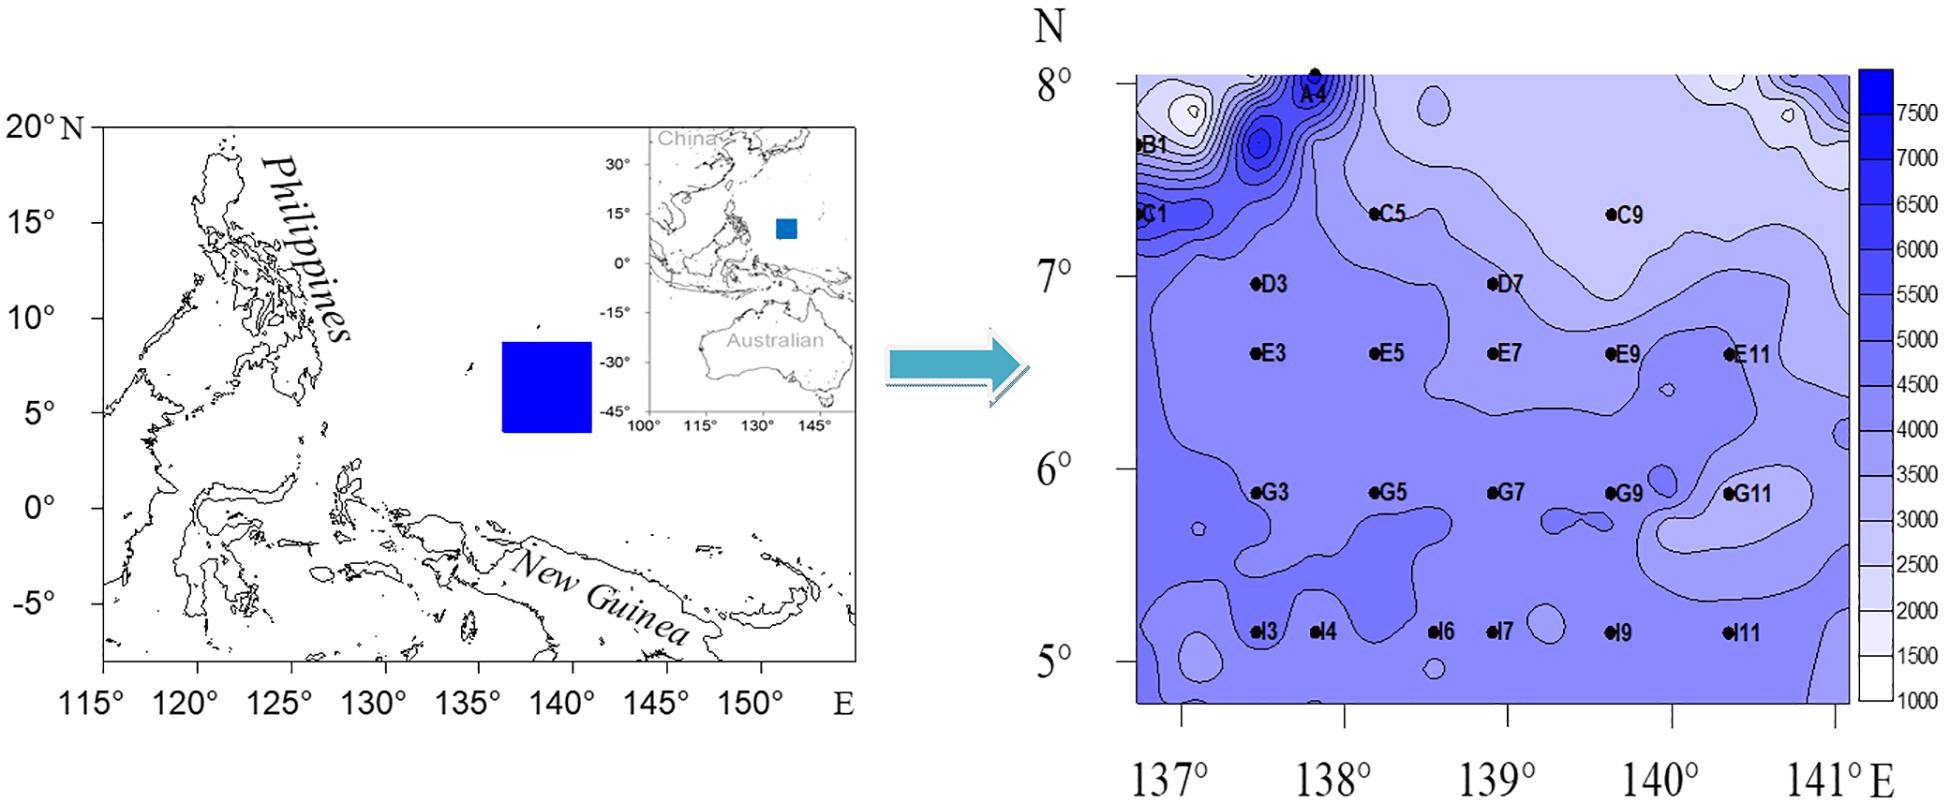
Figure 1. Map of the adjacent areas to the Yap trench, Western Pacific Ocean, showing the sampling sites with fathom lines (Unit: m).
Laboratory Analysis
Measurement of Environmental Factors
Chlorophyll-a and Pha contents were measured by spectrophotometry. Briefly, the frozen sediment samples (2 g) were weighed and put into a 15 mL centrifuge tube together with 10 mL of acetone (90%) and a small amount of magnesium carbonate, and the centrifuge tubes were carefully shaken and kept in a dark environment at 4°C for 24 h. The tubes were placed in a centrifuge for centrifugation at 4000 rpm for 10 min, and the supernatant was adjusted to 11 mL. Samples were then transferred to a fluorescence spectrophotometer for measurement of Chl-a and Pha (Wang, 1986). For the measurement of sediment grain size, the sediment sample was dried, and passed through a 2-mm sieve. The sediment remaining on the sieve was weighed and analyzed by a Mastersizer 3000 particle size analyzer (Malvern, United Kingdom), which could detect fractions between 2 and 2000 μm. The organic matter sample was freeze-dried to constant weight, ground, and sieved with 75 μm mesh. The sample was placed in a closed desiccator and fumigated with concentrated hydrochloric acid for 48 h to remove inorganic carbon, followed by drying at <60°C for 12 h to remove residual inorganic carbon and water. The sample was wrapped in tin foil and the content of organic matter was determined by VarioEL III elemental analyzer (Elementar, Germany).
Analysis of Meiofauna
The sediment samples were transferred to the laboratory for meiofauna sorting. Samples were stained with 1‰ Rose Bengal for >24 h. The dyed samples were washed on screens with 0.5 and 0.031 mm mesh size (the boundary of meiofauna) with tap water to remove clay and silt. Meiofauna samples were obtained by centrifuging three times with Ludox-TM with a specific gravity of 1.15 g/mL. The meiofauna obtained were sorted, identified, and counted under a stereoscopic microscope. For identification to higher taxa, Higgins and Thiel (1988) and Giere (2009) were used as reference materials. The sorted meiofauna were put into different sample tubes according to different taxa. All meiofauna individuals were fixed with 5% buffered formalin solution.
Data Processing and Statistical Analysis
Sampling site map, isobath map, and horizontal distribution maps of meiofauna and major taxa were drawn using Surfer 8.0 (Golden Software, United States). The vertical distribution of the abundance of meiofauna and major benthic taxa was analyzed using Microsoft Excel. Principal component analysis (PCA) was performed in the multivariate statistical software PRIMER6.01 (Clarke and Gorley, 2006) for the analysis of environmental factors. Pearson correlation was used to determine the relationships between meiofauna and the environment. In addition, multivariate analysis including non-parametric multidimensional scaling (MDS), hierarchical clustering (CLUSTER), and BIOENV were performed to analyze the meiofaunal community structure and environmental factors affecting the meiofauna assemblages. BIOENV analysis with Spearman correlation coefficient was used to find a subset of environmental variables that maximizes the hierarchical relationship between the Euclidean distance dissimilarity matrix and the Bray–Curtis similarity matrix of biological samples. Maximum correlation means the best match between the measured environmental factors and the meiofauna assemblages, that is, the combination of environmental factors is the best explanation for the observed community structure (but does not mean that there is a direct causal relationship between them) (Zhou and Zhang, 2003).
Results
Environmental Factors
Environmental characteristics of the sampling sites were shown in Table 1. Water depth ranged from 2896 (Site C9) to 7837 m (Site A4). Sediment types (Table 1) were predominantly calcareous or siliceous ooze or clay. The silt–clay content of all the sites ranged from 41.32 to 94.66%. Sediment median diameter (Md) ranged from 0.007 to 0.080 mm. The highest value was at Site I9 (0.077 mm), and the lowest value was at Site I7 (0.007 mm). The mean value of sediment Chl-a (Table 1) was 0.017 mg⋅kg–1, and the highest value was 0.1 mg⋅kg–1 at Site G5. The mean value of Pha in sediments was 0.10 mg⋅kg–1, and the highest value was 1.22 mg⋅kg–1 at Site I7. For sediments sampled at Sites G11, G7, I4, I7, I9, no Chl-a or Pha were not detected. The mean organic matter content was 0.19%. The highest value was at Site I3 (0.76%), and the lowest value was at Site D3 (0.02%).
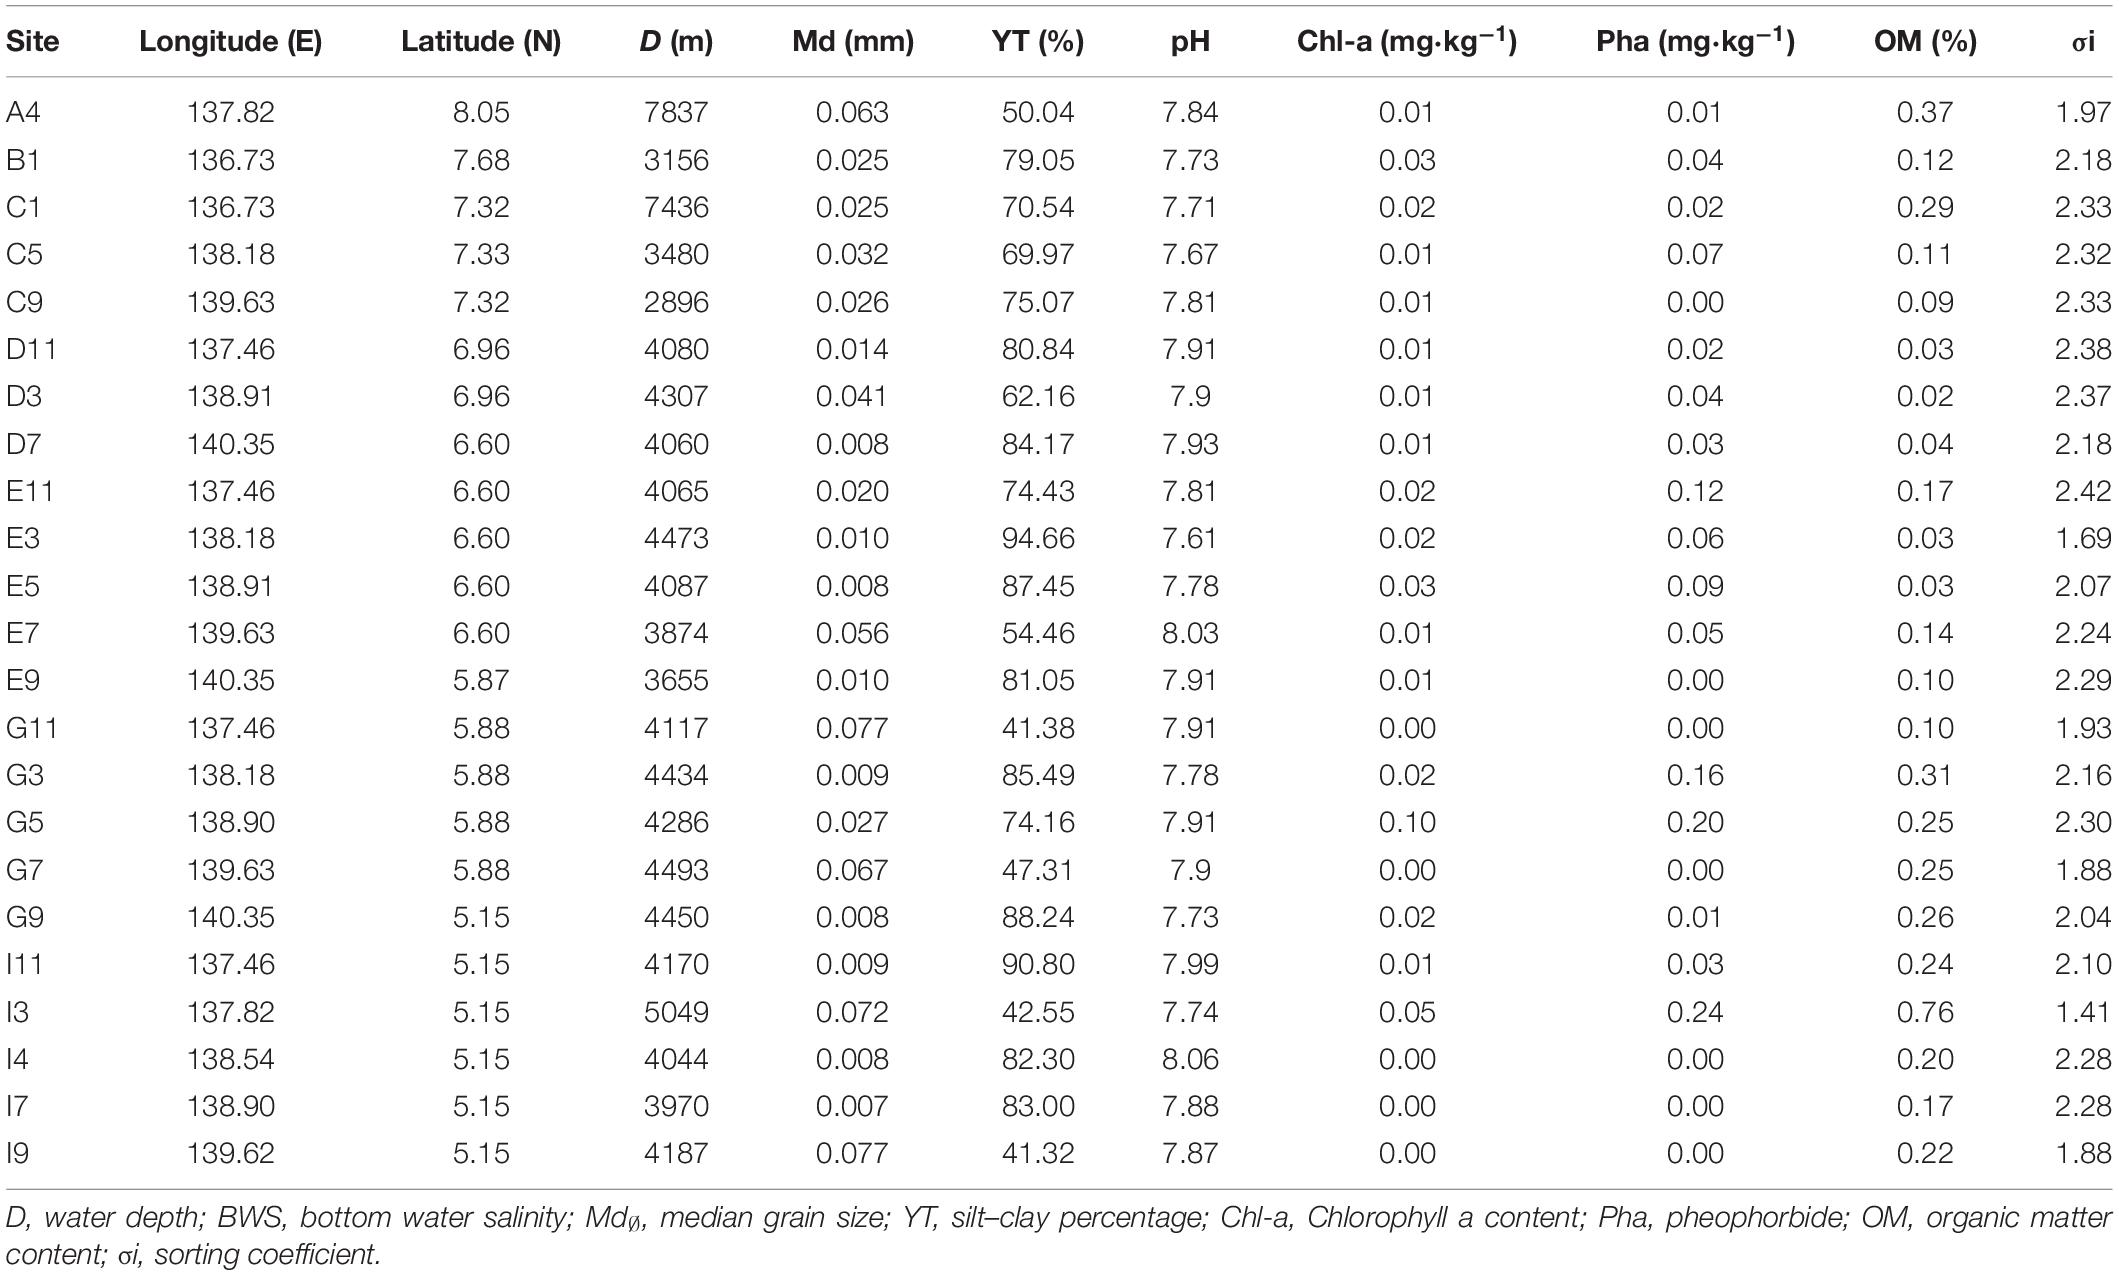
Table 1. Environmental variables at the sampling site near the Yap trench of the Western Pacific Ocean.
Principal component analysis was performed based on standardized data of environmental factors and results (Table 2) showed that axis of PC1, PC2, PC3, PC4, and PC5 totally accounted for 90.1% of environmental variability. On PC1 axis, sediment factors, including sediment median diameter (0.512), organic matter content (0.439), and water depth (0.315), were important factors that differentiate the sampling sites. On the PC2 axis, the most important environmental factors were pH (0.535), Chl-a content (−0.511), and silt–clay percentage (−0.347). Figure 2 shows that on the PC1 axis, from left to right the following factors were increasing: sediment median diameter, water depth, and organic matter content. On the PC2 axis, organic matter content, silt–clay percentage, and Chl-a content decreased from top to bottom.
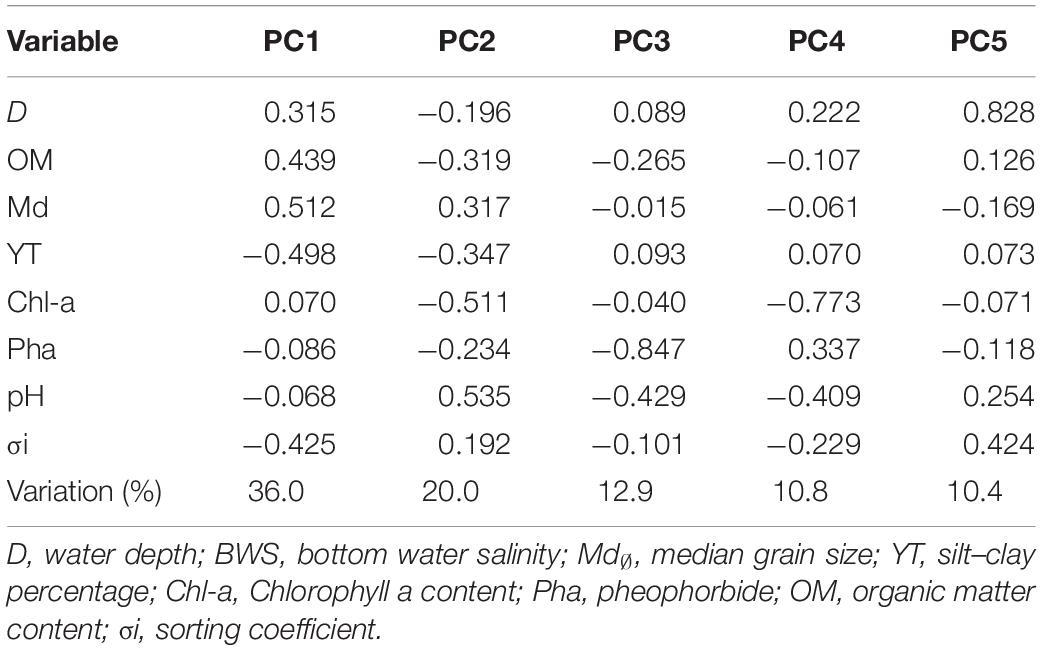
Table 2. Principal component analysis of environmental variables near the Yap Trench of the Western Pacific.
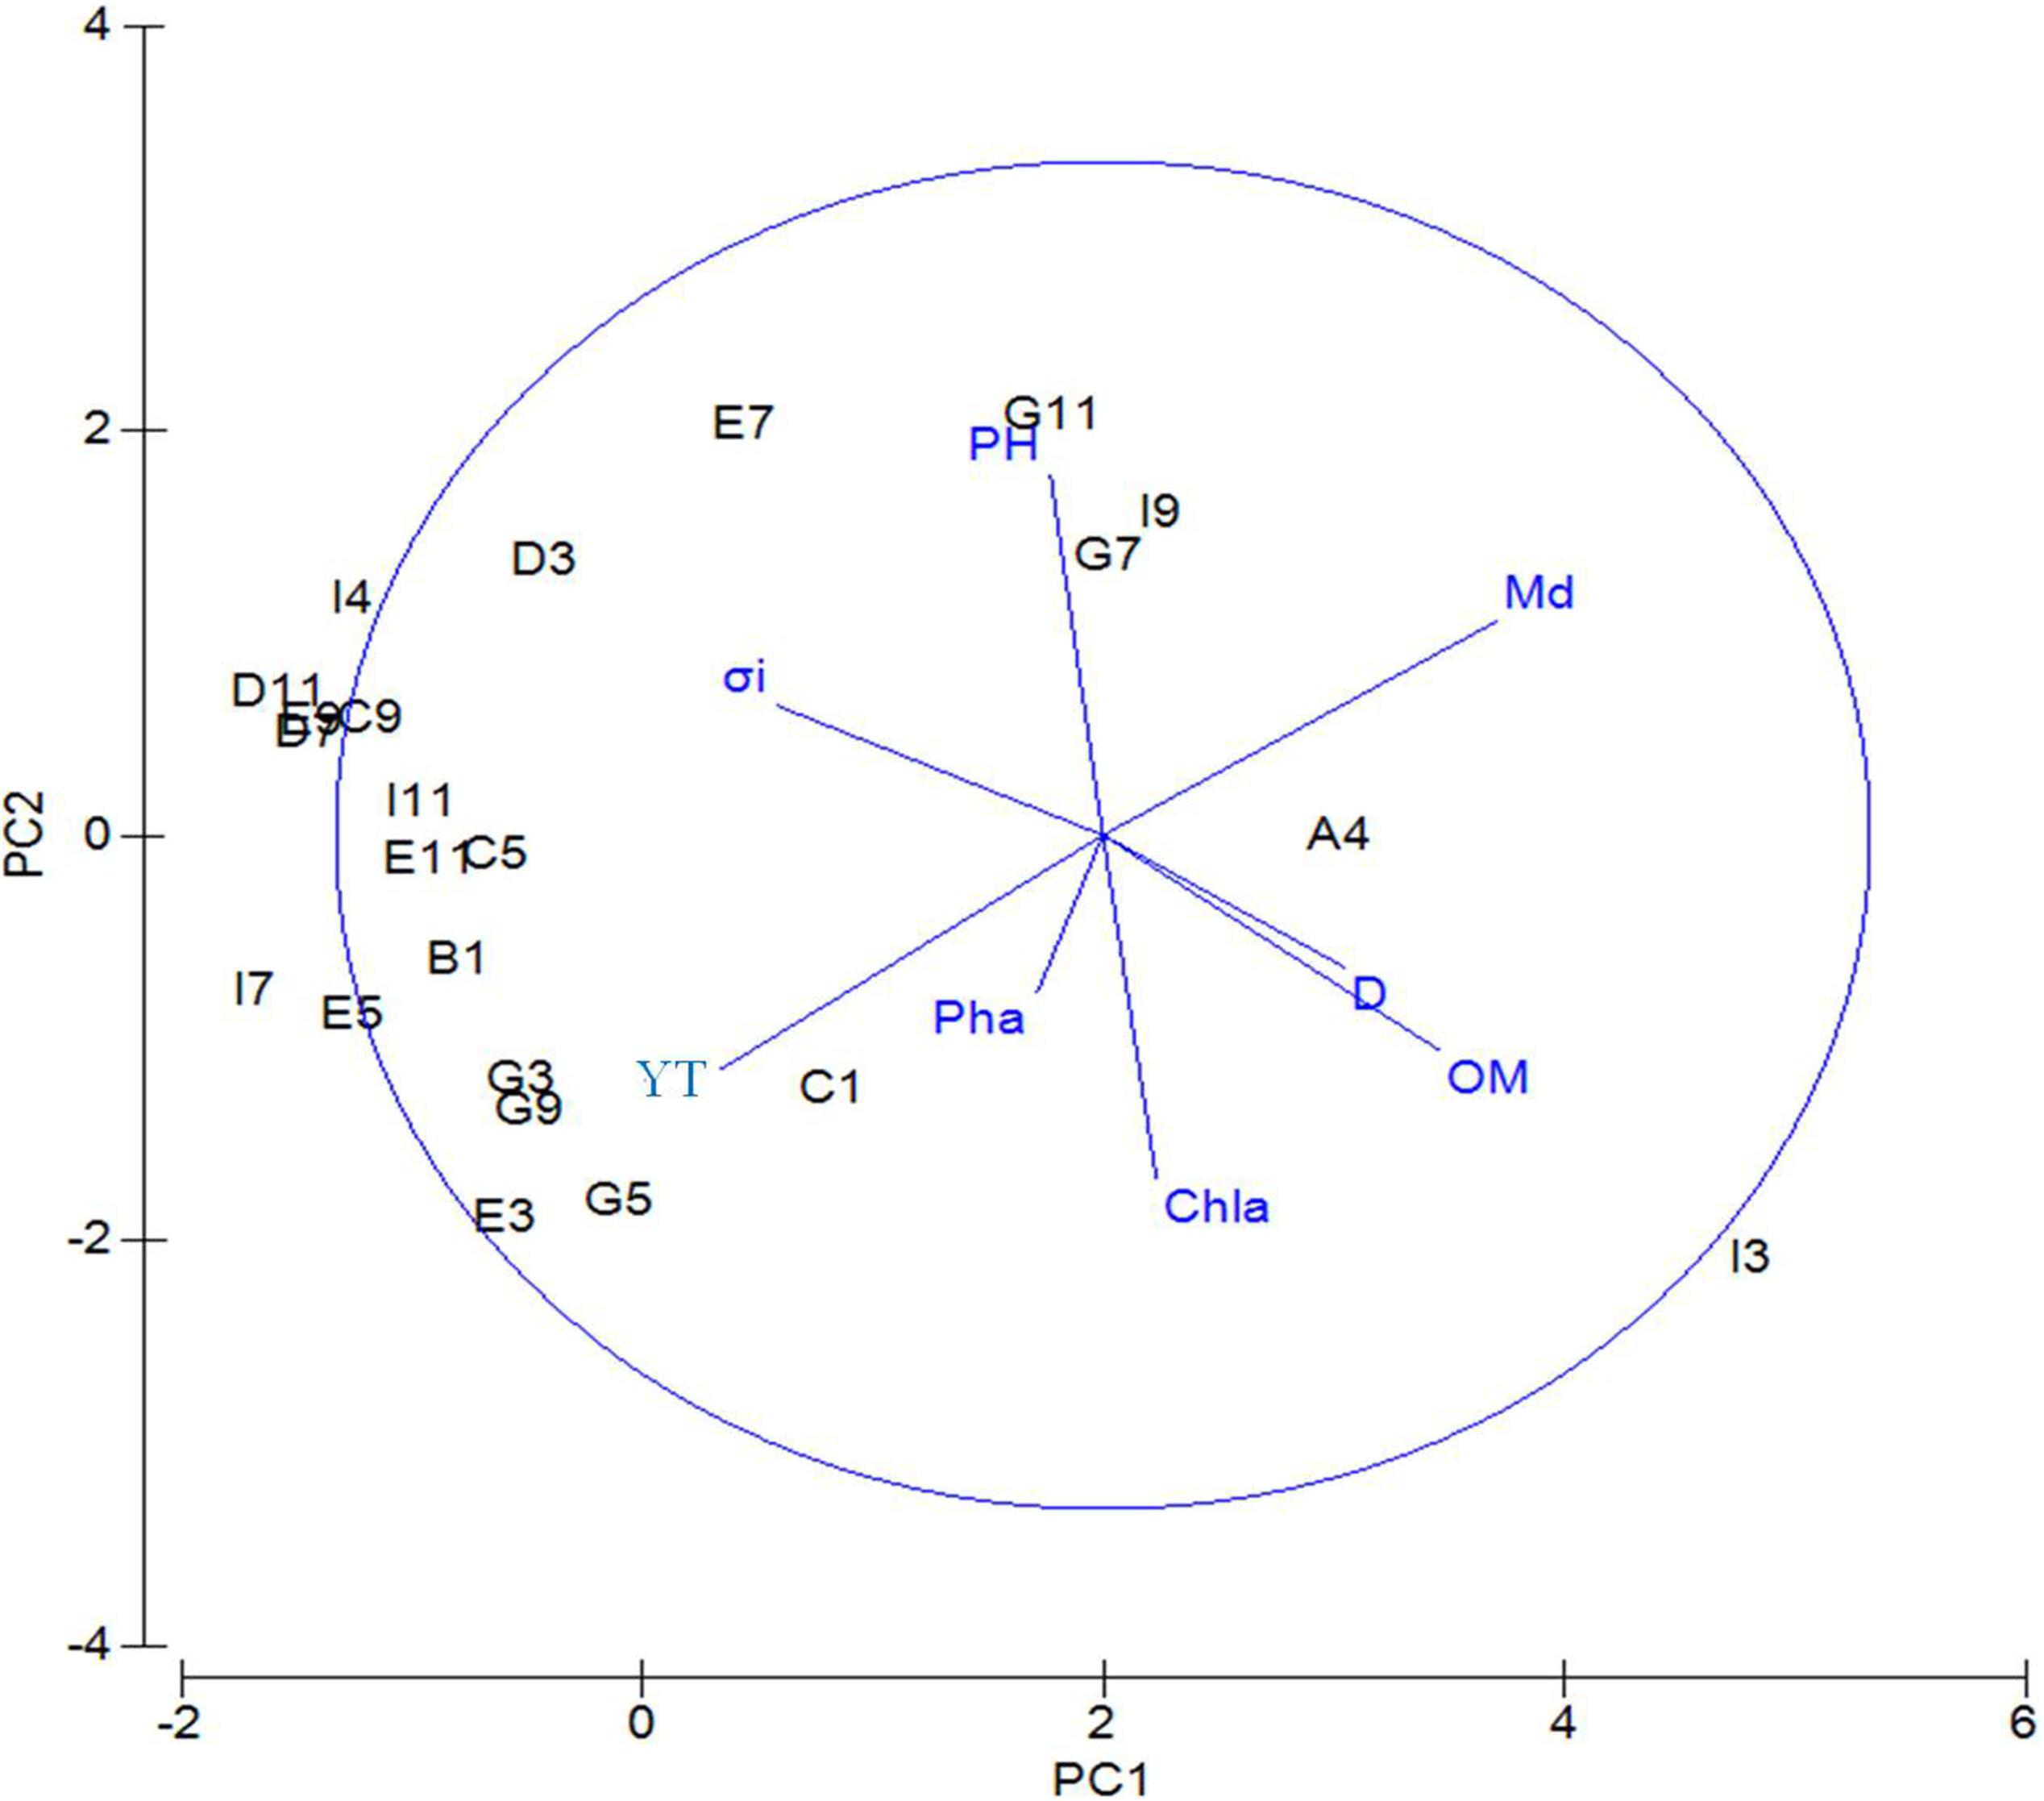
Figure 2. PCA of environmental factors for the sampling sites near the Yap Trench of the Western Pacific Ocean. D, water depth; BWS, bottom water salinity; Md∅, median grain size; YT, silt–clay content; Chl-a, chlorophyll a content; Pha, pheophorbide; OM, organic matter content; σi, sorting coefficient.
Meiofauna
Taxa Composition of Meiofauna
A total of 17 meiofauna higher taxa were identified in this study, including Nematoda, Copepoda, Nauplii, Ostracoda, Halacaroidea, Kinorhyncha, Cumacea, Tubellaria, Cladocera, Polychaeta, Oligochaeta, Isopoda, Tanaidacea, Amphipoda, Tardigrada, Gastrotricha, and Pycnogonida. The abundance and percentage of each taxa are shown in Table 3. Nematode was the most dominant group, with an average abundance of (120.26 ± 102.85) ind⋅10 cm–2 (69.97%), followed by copepods, with (36.17 ± 48.72) ind⋅10 cm–2 (21.04%), nauplii with (12.15 ± 14.29) ind⋅10 cm–2 (7.07%), and the other taxa accounting for 1.92% of the total meiofauna.
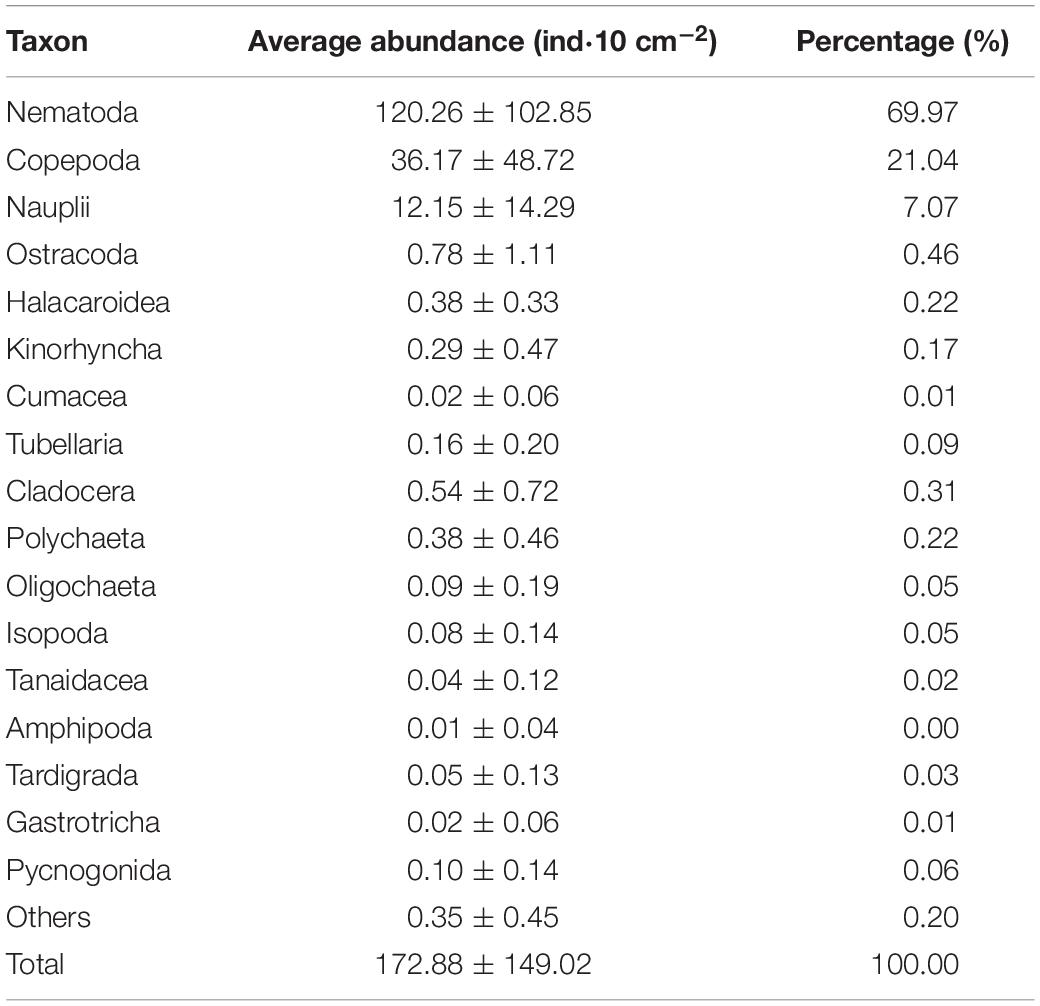
Table 3. Abundance of each meiofaunal taxon in the adjacent areas of the Yap Trench, Western Pacific Ocean.
Horizontal and Vertical Distribution of Meiofauna
The horizontal distribution of meiofauna indicated that the highest abundance of meiofauna was site E11, followed by Site C5. These two sites were located on the southern slope of the West Caroline uplift. Higher sediment organic matter content may be due to the localized topography, food sources, and hydrodynamics within this area. Contour maps of total meiofauna and dominant taxa (Figure 3) showed that the distribution patterns of meiofauna and nematodes were similar and the high values were mainly distributed in the northwestern part of the study area. The vertical distribution showed that the proportion of meiofauna distributed in 0–1, 1–2, 2–4, 4–6, 6–8, and 8–10 cm were 16.70, 15.20, 18.39, 20.35, 16.47, and 12.89%, respectively. Generally, the meiofauna were mainly distributed in the upper and middle layers (0–6 cm), accounting for 70.65% in total, and the 6–10 cm layer was 29.35%. The proportion of nematodes distributed in 0–1, 1–2, 2–4, 4–6, 6–8, and 8–10 cm were 19.14, 16.18, 18.64, 19.53, 14.32, and 12.19%, respectively. Nematodes were mainly distributed in the upper and middle layers (0–6 cm), accounting for 73.5%, and the 6–10 cm layer was 26.5% (Figure 4). In this study, a box corer was used. Compared with the multi-corer, the box corer may cause damage to surface sediments during the sampling process, affecting the abundance of meiofauna and producing abundance error. This may explain the relatively low abundance in the 0–1 and even the 1–2 cm layer, compared to traditional vertical sediment meiofauna abundance patterns from other deep-sea studies.
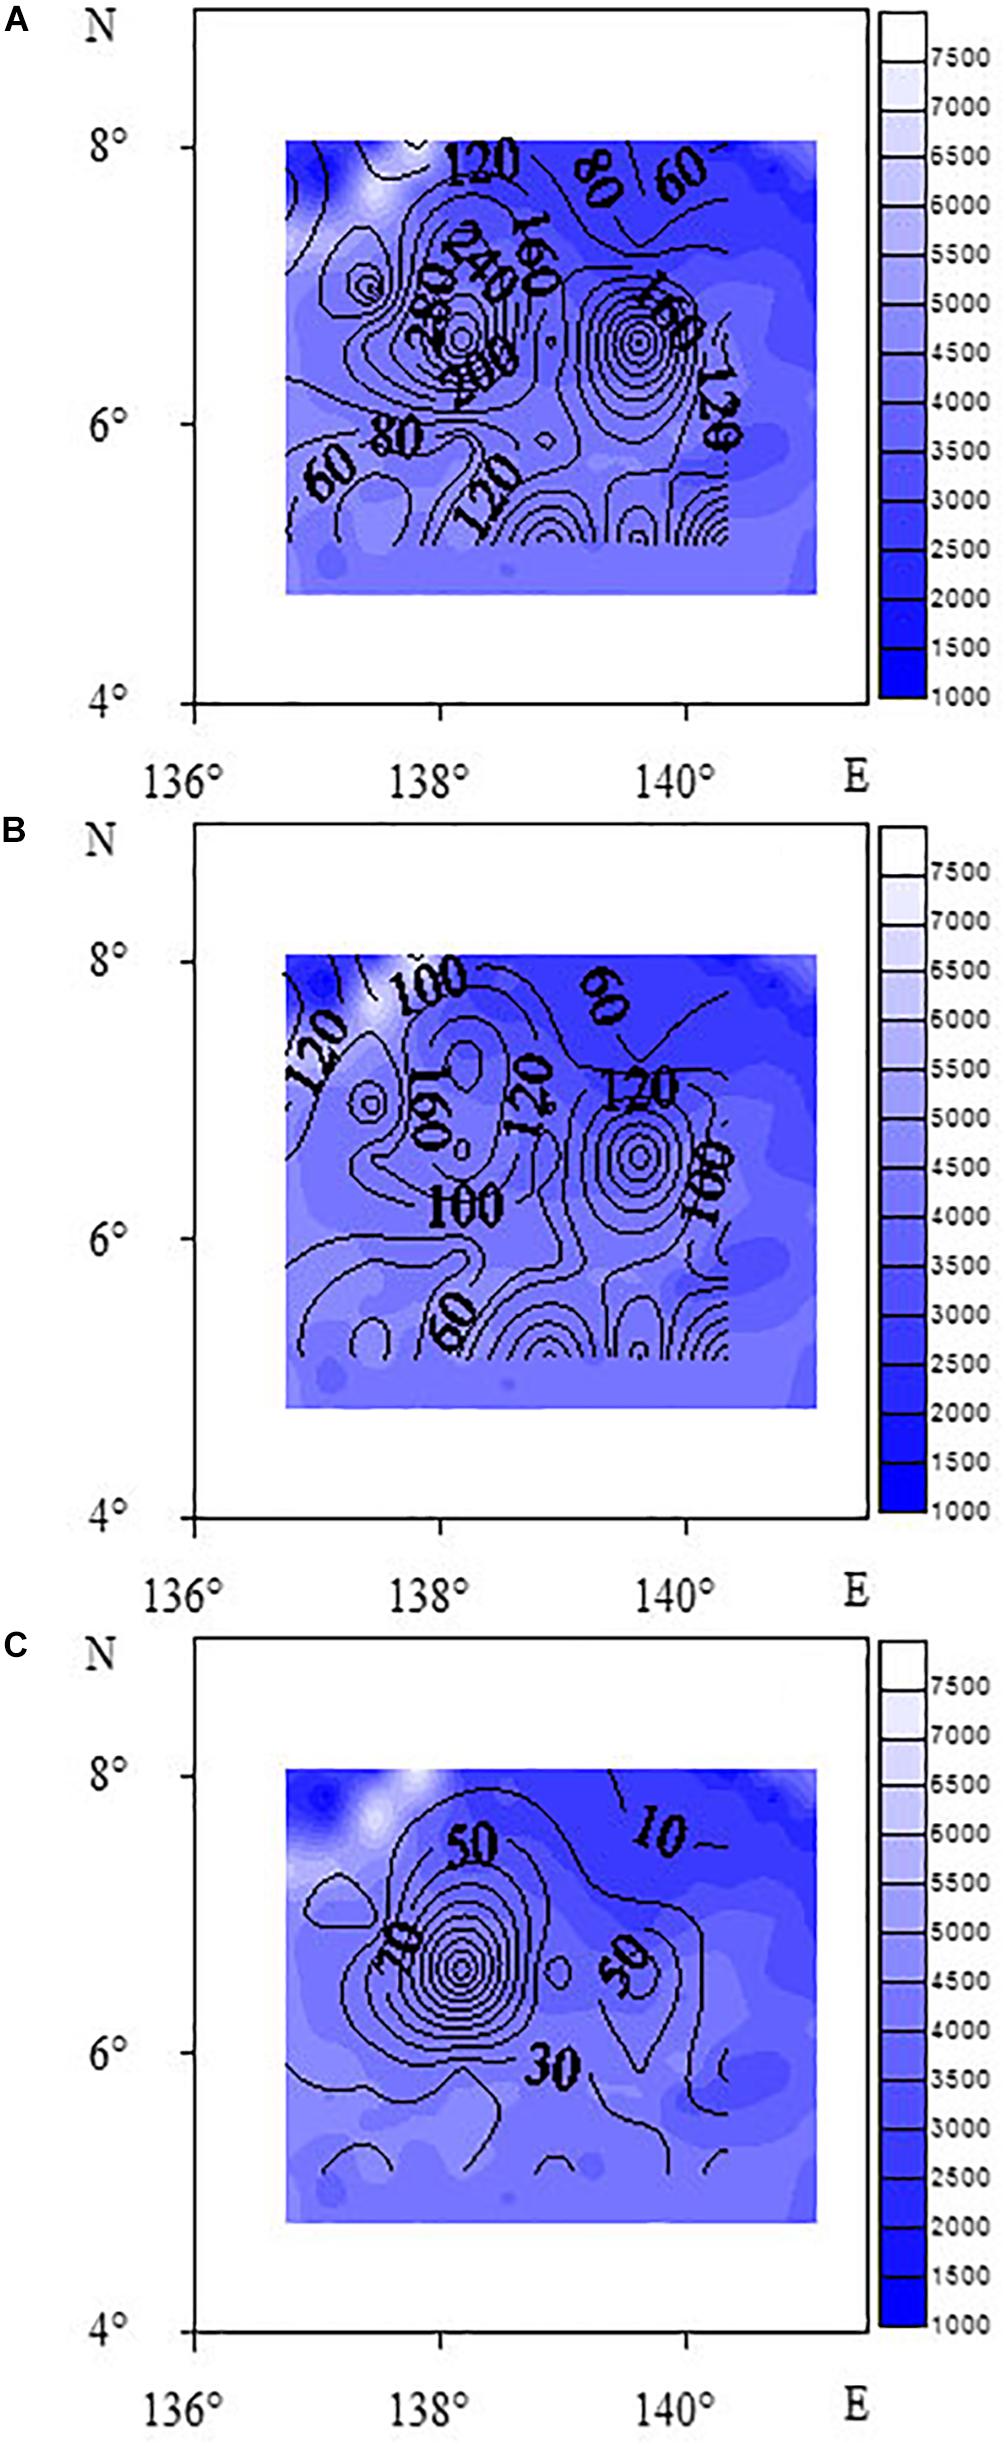
Figure 3. Contour maps of abundance of meiofauna (A), nematodes (B), and benthic copepods (C) (unit: ind⋅10 cm– 2).
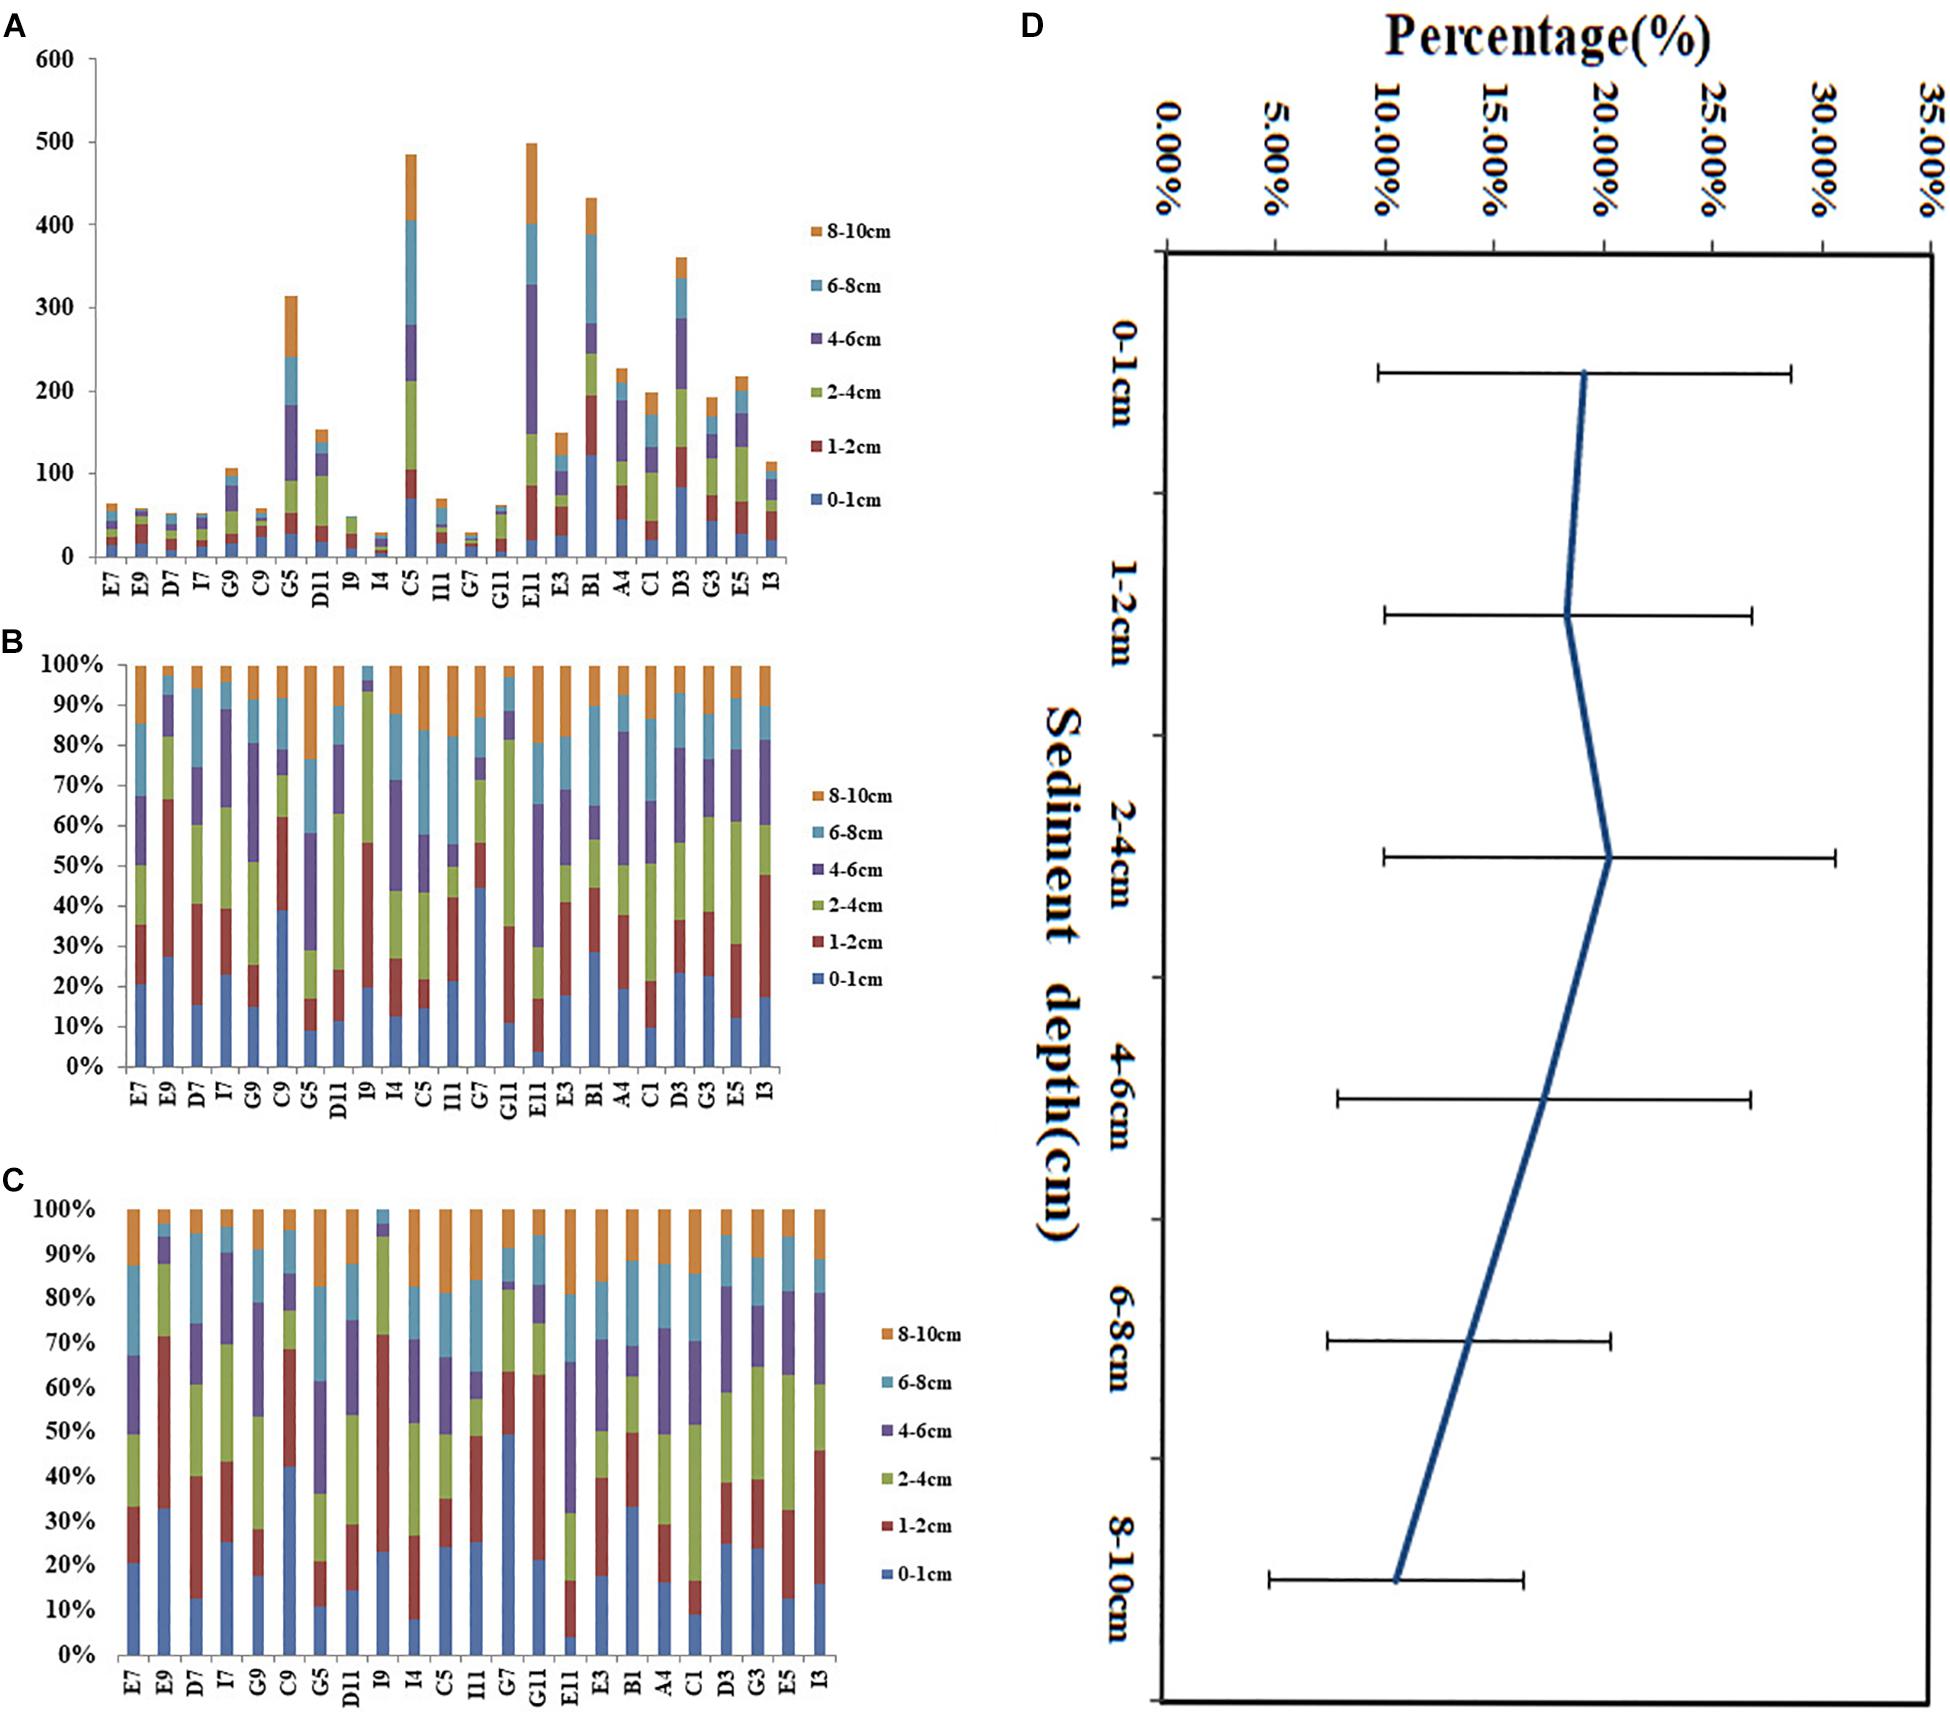
Figure 4. Vertical distribution of meiofaunal abundance (A), percentage of meiofauna (B,D), and nematodes (C) at each sampling site in the adjacent areas of the Yap Trench, Western Pacific Ocean.
CLUSTER Analyses
Hierarchical clustering analysis of meiofaunal taxon composition showed that the community of meiofauna can be divided into three groups (Figure 5) at a similarity of 73%: Group 1 included Sites G9, D7, G5, I3, D11, G3, C5, B1, E5, E3, D3, A4, and C1; Group 2 included Sites G7, I9, I4, G11, E7, and E9; and Group 3 included Sites G7, I9, I4, G11, I7, C9, I11, E7, and E9.
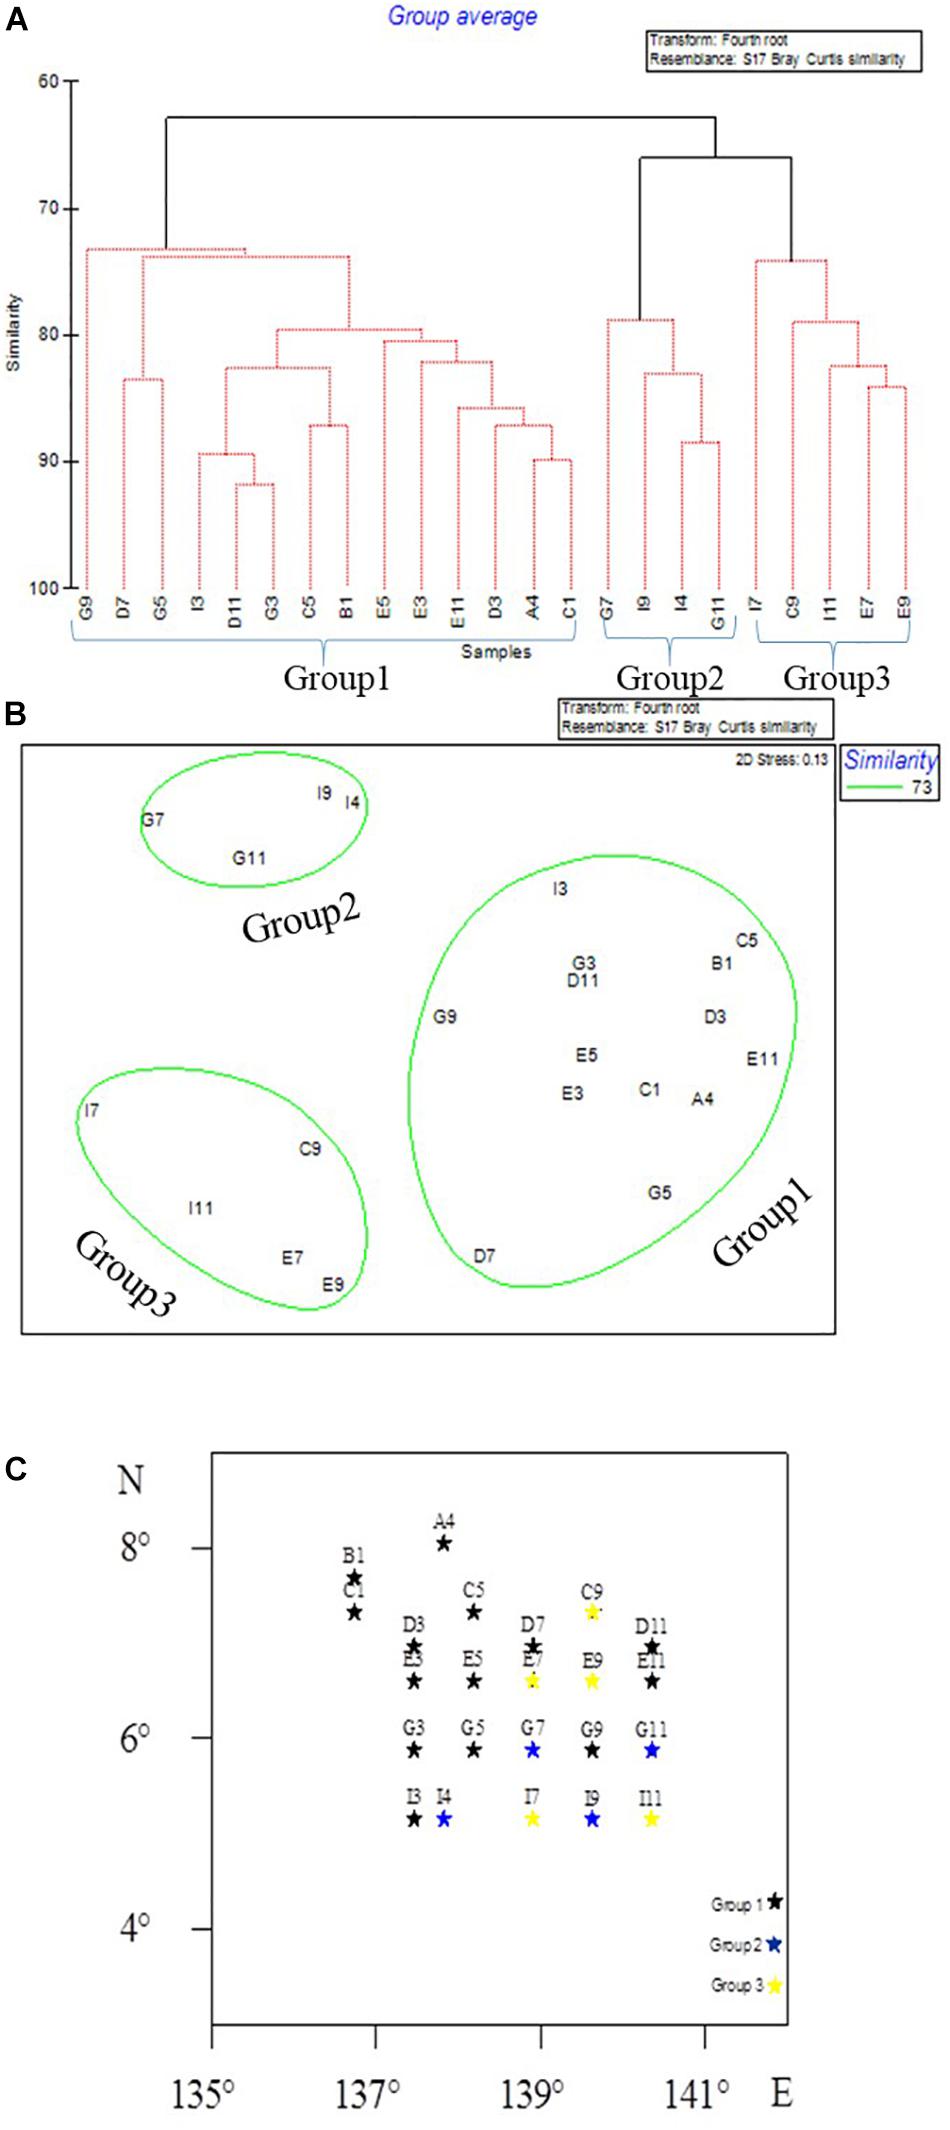
Figure 5. Meiofaunal community groups in the Western Pacific Ocean as divided by CLUSTER analysis (A), MDS ordination (B), and as shown on the map (C).
Relationship Between Meiofauna and Environmental Factors
Results of correlation analysis between the abundance of meiofauna and environmental factors by SPSS showed that the abundance of meiofauna was significantly negatively correlated with pH (0.451, P < 0.05) (Table 4). Abundance of nematodes was significant and positively correlated with Chl-a (0.426, P < 0.05). Sediment median grain size was significant and negatively correlated with silt–clay percentage (−0.982, P < 0.01); organic matter content and silt–clay percentage were significant and negatively correlated (−0.421, P < 0.05); water depth was significant and positively correlated with organic matter content (0.468, P < 0.05). Copepod abundance had no significant correlation with the above environmental factors.
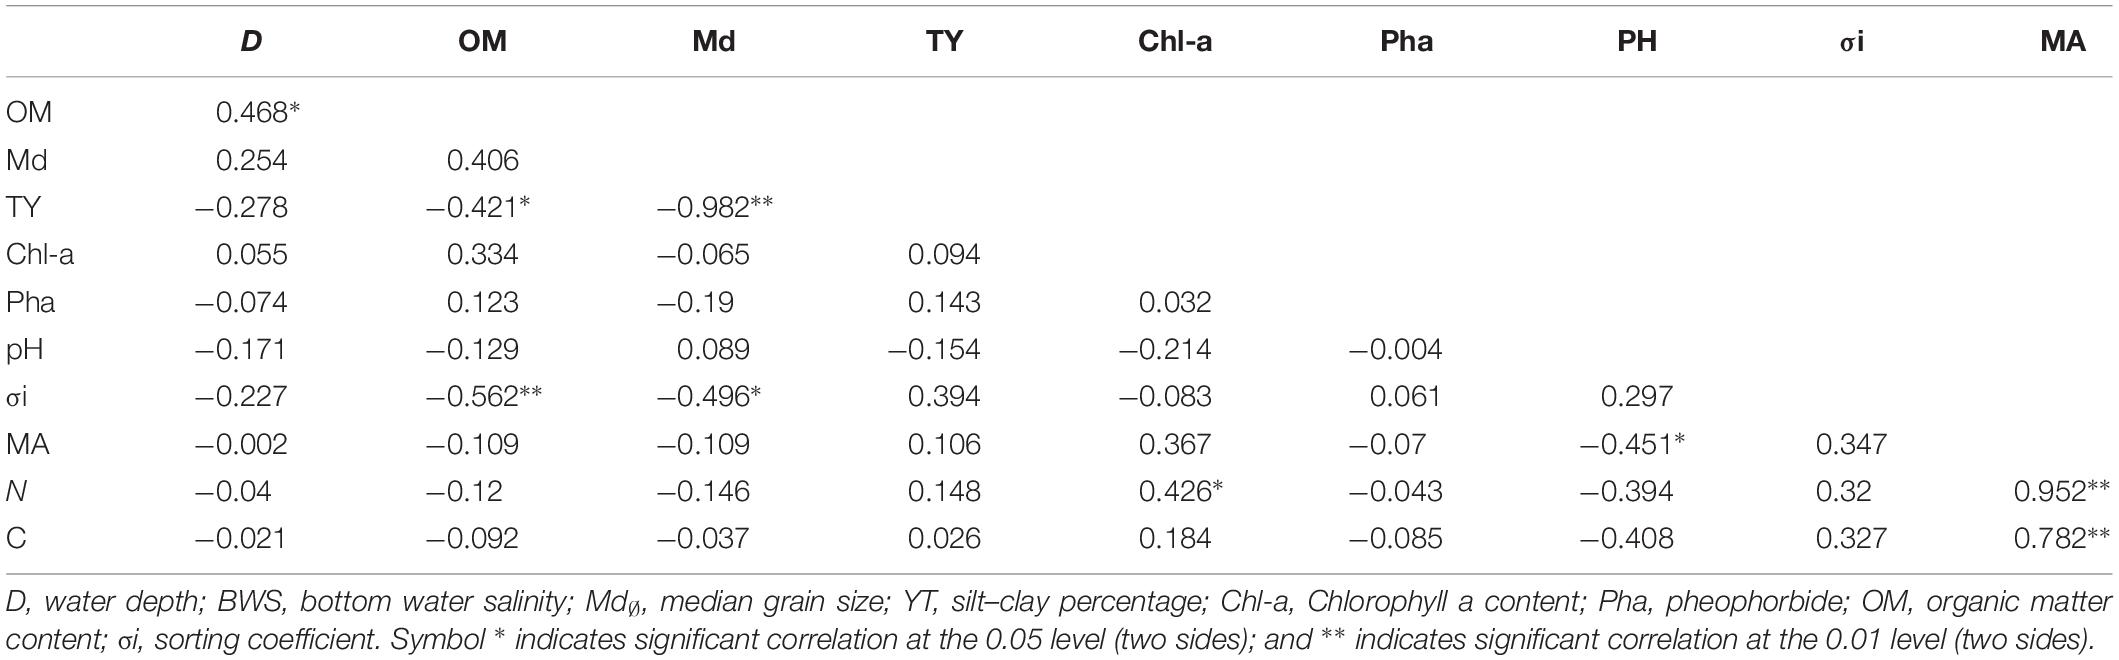
Table 4. Correlation coefficient between abundance of Nematode meiofauna and environmental factors.
According to results of BIOENV (Table 5), meiofaunal assemblages may have been influenced by a variety of environmental factors, among which the best combination of environmental factors included sediment median grain size and Pha, with a correlation coefficient of 0.287, followed by Pha and silt–clay percentage, with a correlation coefficient of 0.258. The single environmental factor with the largest impact was sediment median grain size with correlation coefficient of 0.161.
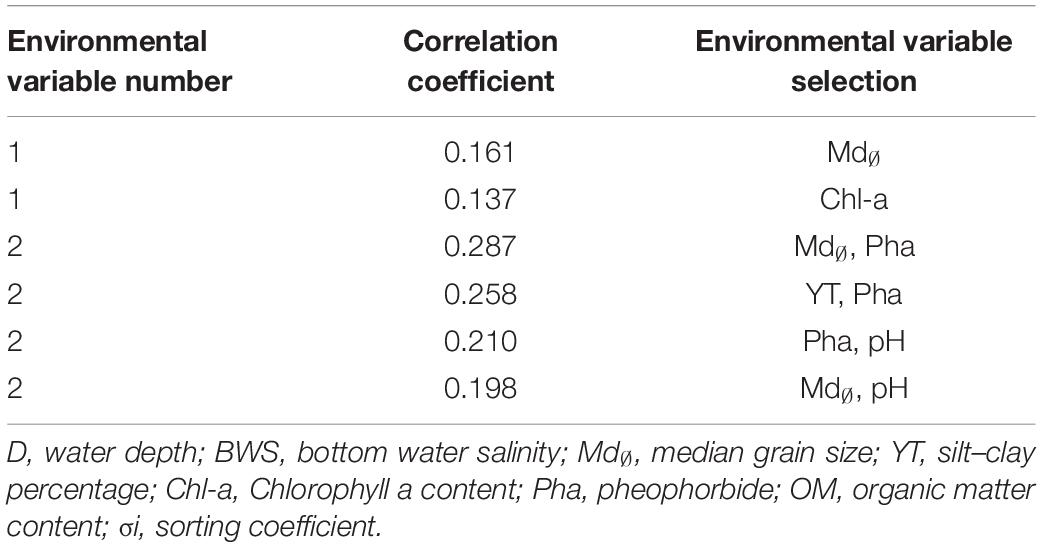
Table 5. BIOENV analysis of meiofauna and environmental factors.
Discussion
Environmental Factors and Distribution of Meiofauna
Generally, only 0.5–2% of the net primary productivity of the light-transmitting belt reaches the sea bottom <2000 m (Buesseler et al., 2007). A number of studies have shown that food availability is an important factor affecting the abundance of meiofauna (e.g., Danovaro et al., 2002; Gambi and Danovaro, 2016; Leduc et al., 2016). In this study, the water depth ranged from 3156 to 7837 m, which may lead to low inputs of food sources from the land. The movement of organic matter from the more productive surface to the seabed has been shown to have a significant control over benthic populations. The organic matter content of sediments usually decreases with increasing water depth (Billett et al., 1993). Correlation analysis showed that water depth was significantly positively correlated with organic matter (0.468, P < 0.05), which may be due to the relatively high organic matter contents of Sites A4 (7837 m) and C1 (7436 m) compared with the adjacent sites. Wu et al. (2018) reported that the bottom of the Yap trench had an oxidized environment, and the source of microbial organic carbon was the main contributor to the total organic carbon in the Yap trench in the Western Pacific Ocean. The organic matter contents inside the trench were higher than those in the adjacent deep-sea environment (Wu et al., 2018). In addition, this phenomenon may be affected by the topography. Yap Trench (Site A4) may be more conducive to the accumulation of organic carbon, and causes more organic matter to accumulate on the bottom. Research on the characteristics of sediments in this area showed the calcite compensation depth (CCD line) in the Yap Trench to be 4568 m (Yue et al., 2018). The sediments above the CCD line tended to have a large amount of calcium carbonate, especially the deposition of calcareous slime, while the sediments below the CCD line were silicate deposits (Zhang et al., 2006; Yue et al., 2018).
In most marine environments, the horizontal distribution patterns of meiofauna are patchy (Findlay, 1981; Ansari et al., 1982), and most organisms dwell on or within the sediments (McIntyre, 1969; Alongi, 1986). The richness, diversity, and structure of meiofauna in deep-sea areas are different in different regions. Meiofauna abundance and distribution are affected by factors such as food availability, substrate structure, physical and chemical properties, and physical disturbances (Rosli et al., 2017). The distribution pattern of abundance of meiofauna along water depth gradient in this study was not obvious. Many studies have shown that water depth is an important limiting factor affecting deep-sea meiofauna. Between 500 and 2000 m of water depth, the abundance of meiofauna decreases with increasing water depth, but beyond 2000 m water depth, changes in the abundance of meiofauna with water depth are not obvious. Recently, Schmidt and Arbizu (2015) studied the relationship between meiofaunal abundance and water depth in the Kamchatka trench in Thousand Islands. They found that the total abundance of meiofauna generally did not decrease with increasing depth. Instead, it initially decreased as the depth increased, but increased after a certain depth (critical depth). In the present study, the abundance of meiofauna in water depth <4500 m had no significant patterns but it increased <4500 m (Figure 6). The meiobenthos (including foraminiferans) of the Molloy Deep (Frain Strait, Arctic Ocean) was studied at four sites between 5416 and 5569 m water depth. The analysis of biogenic sediment compounds (e.g., chloroplastic pigments, particulate proteins) confirmed comparably high amounts of organic matter in the sediments, presumably favoring increased faunal densities and biomasses (2153–2968 ind⋅10 cm–2). The total meiofauna of the Molloy Deep consisted of relatively small organisms compared to other deep or shallower regions which could not be explained by reduced food availability to the benthos (Soltwedel et al., 2003).
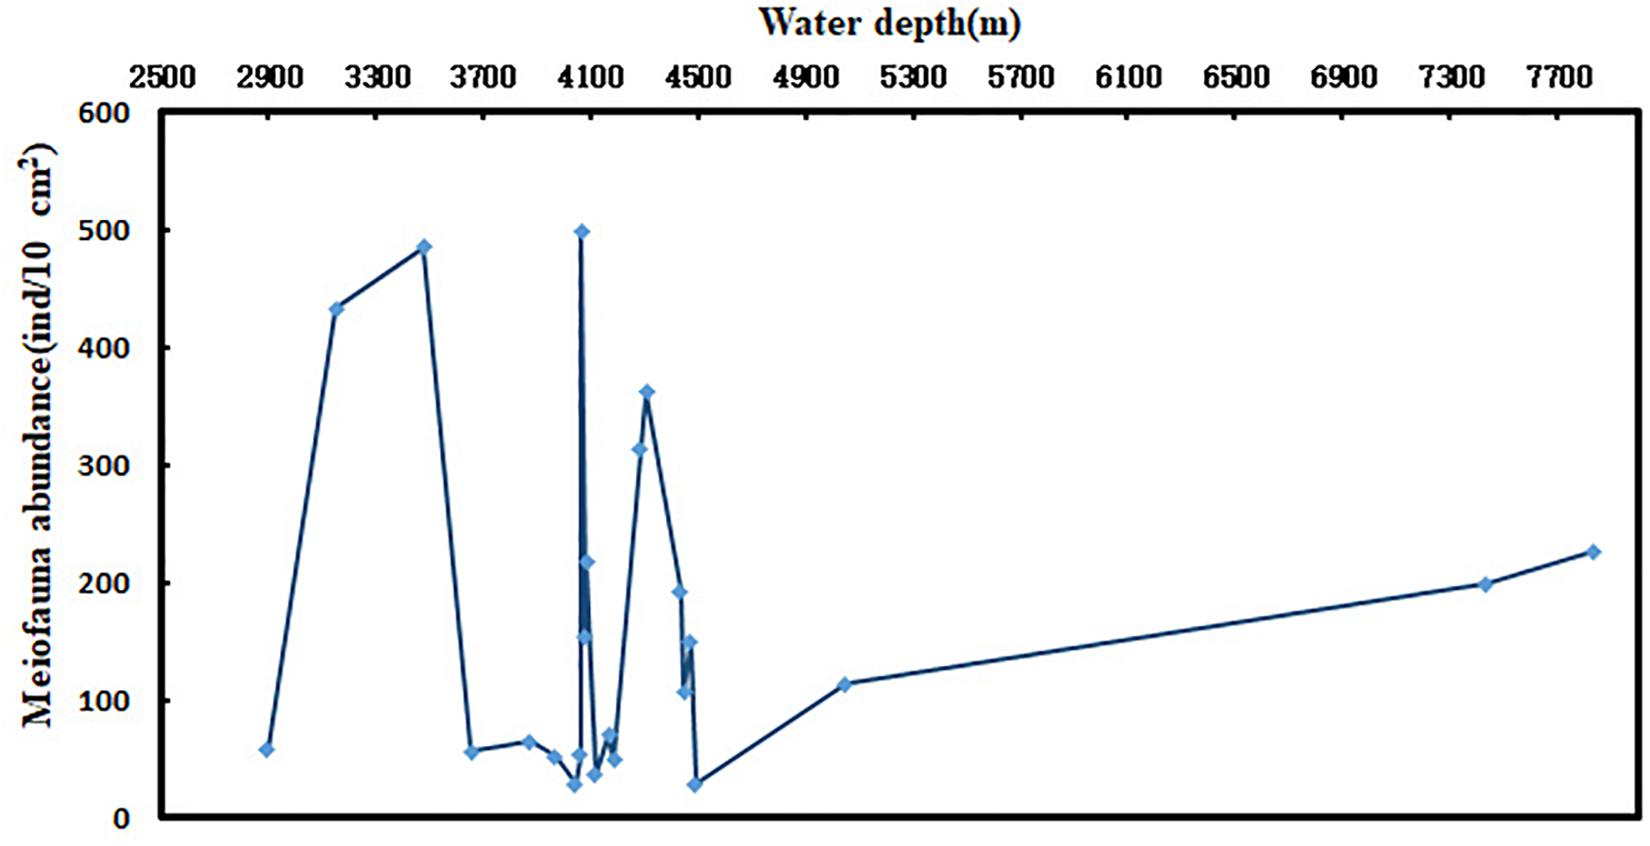
Figure 6. Distribution pattern of meiofaunal abundance along with water depth.
The CLUSTER analysis divided the sampling sites into three groups based on meiofauna assemblage structure. When comparing the three groups, oligochaetes were present at each site of Group 3. The water depth at each site in Group 2 was between 4044 and 4493 m, where the median grain size was larger while Chl-a and Pha were not detected, and the abundance of nematodes and meiofauna was lower than for other two groups. The contour map (Figure 3) shows that high values of meiofauna were mainly distributed in the subduction zone on the east side of the Yap Trench. Due to the topography, it is more conducive to the accumulation of sediment organic matter (Table 1). BIOENV analysis showed that the median particle size was the most important single variable affecting meiofauna abundance, and the best combination of environmental factors affecting meiofauna was the combination of median grain size and Pha. Trebukhova et al. (2013) have shown that water depth affected sediment grain size structure, and that as the depth increased, the median grain size also decreased significantly. This study could not confirm this trend since there was no significant correlation between water depth and median grain size. Therefore, this kind of relationship between water depth and sediment median grain size is not considered to be applicable to the present study.
Several studies have shown that sediment grain size is an important factor in determining the abundance and assemblages of meiofauna (Wieser, 1959; Boaden, 1962; Jansson, 1967; Gray, 1981). Overall, with the increase of median grain size, the abundance of meiofauna and nematodes tended to decrease. This may be due to erosion by water flow (Kotwicki et al., 2005). Biotic factors such as competition between organisms, predation, and lack of food sources also leads to lower abundance of meiofauna. We conclude that, water depth is not the only important factor affecting the abundance of meiofauna, which may be not consistent to some previous studies. However, the uneven distribution of food sources due to topography and other factors affect the distribution of meiofauna. Median grain size can affect the assemblages of meiofauna.
Comparison With Other Deep Seas
There were differences in the assemblages and distribution of meiofauna in different deep seas (Table 6). In the Japanese seas, <300 m water depth, polychaetes were the main taxa, while nematodes only account for 12–36.9%. This phenomenon was unique compared with other deep-seas (Trebukhova et al., 2013). Shirayama and Kojima (1994) studied the Japan Trench in the Pacific Northwest (5000–7000 m) and showed higher abundance of meiofauna and nematodes. In addition, the abundance of meiofauna in the Atacama Trench was 14–144 times higher than in other hadal zones (Angel, 1982; Shirayama, 1984; Tietjen et al., 1989; Shirayama and Kojima, 1994; Danovaro et al., 2002). Atacama Trench area was characterized by upwelling, which leads to higher productivity and the winds and currents also played an important role in transporting materials from the mainland (Jamieson, 2015). The Barbados Trench is rich in methane released from Atalante and Cyclope volcanoes which were located >1000 m in the Barbados Trench. At the same time, chemosynthesis was present in the volcanoes, indicating the release of methane and the production of sulfides in the sediments, which lead to higher abundance of meiofauna (Olu et al., 1997). Due to the differences in geographical, biological, and abiotic factors, the abundance of meiofauna was very different, and each area needed to be studied separately (Taylor et al., 2017).
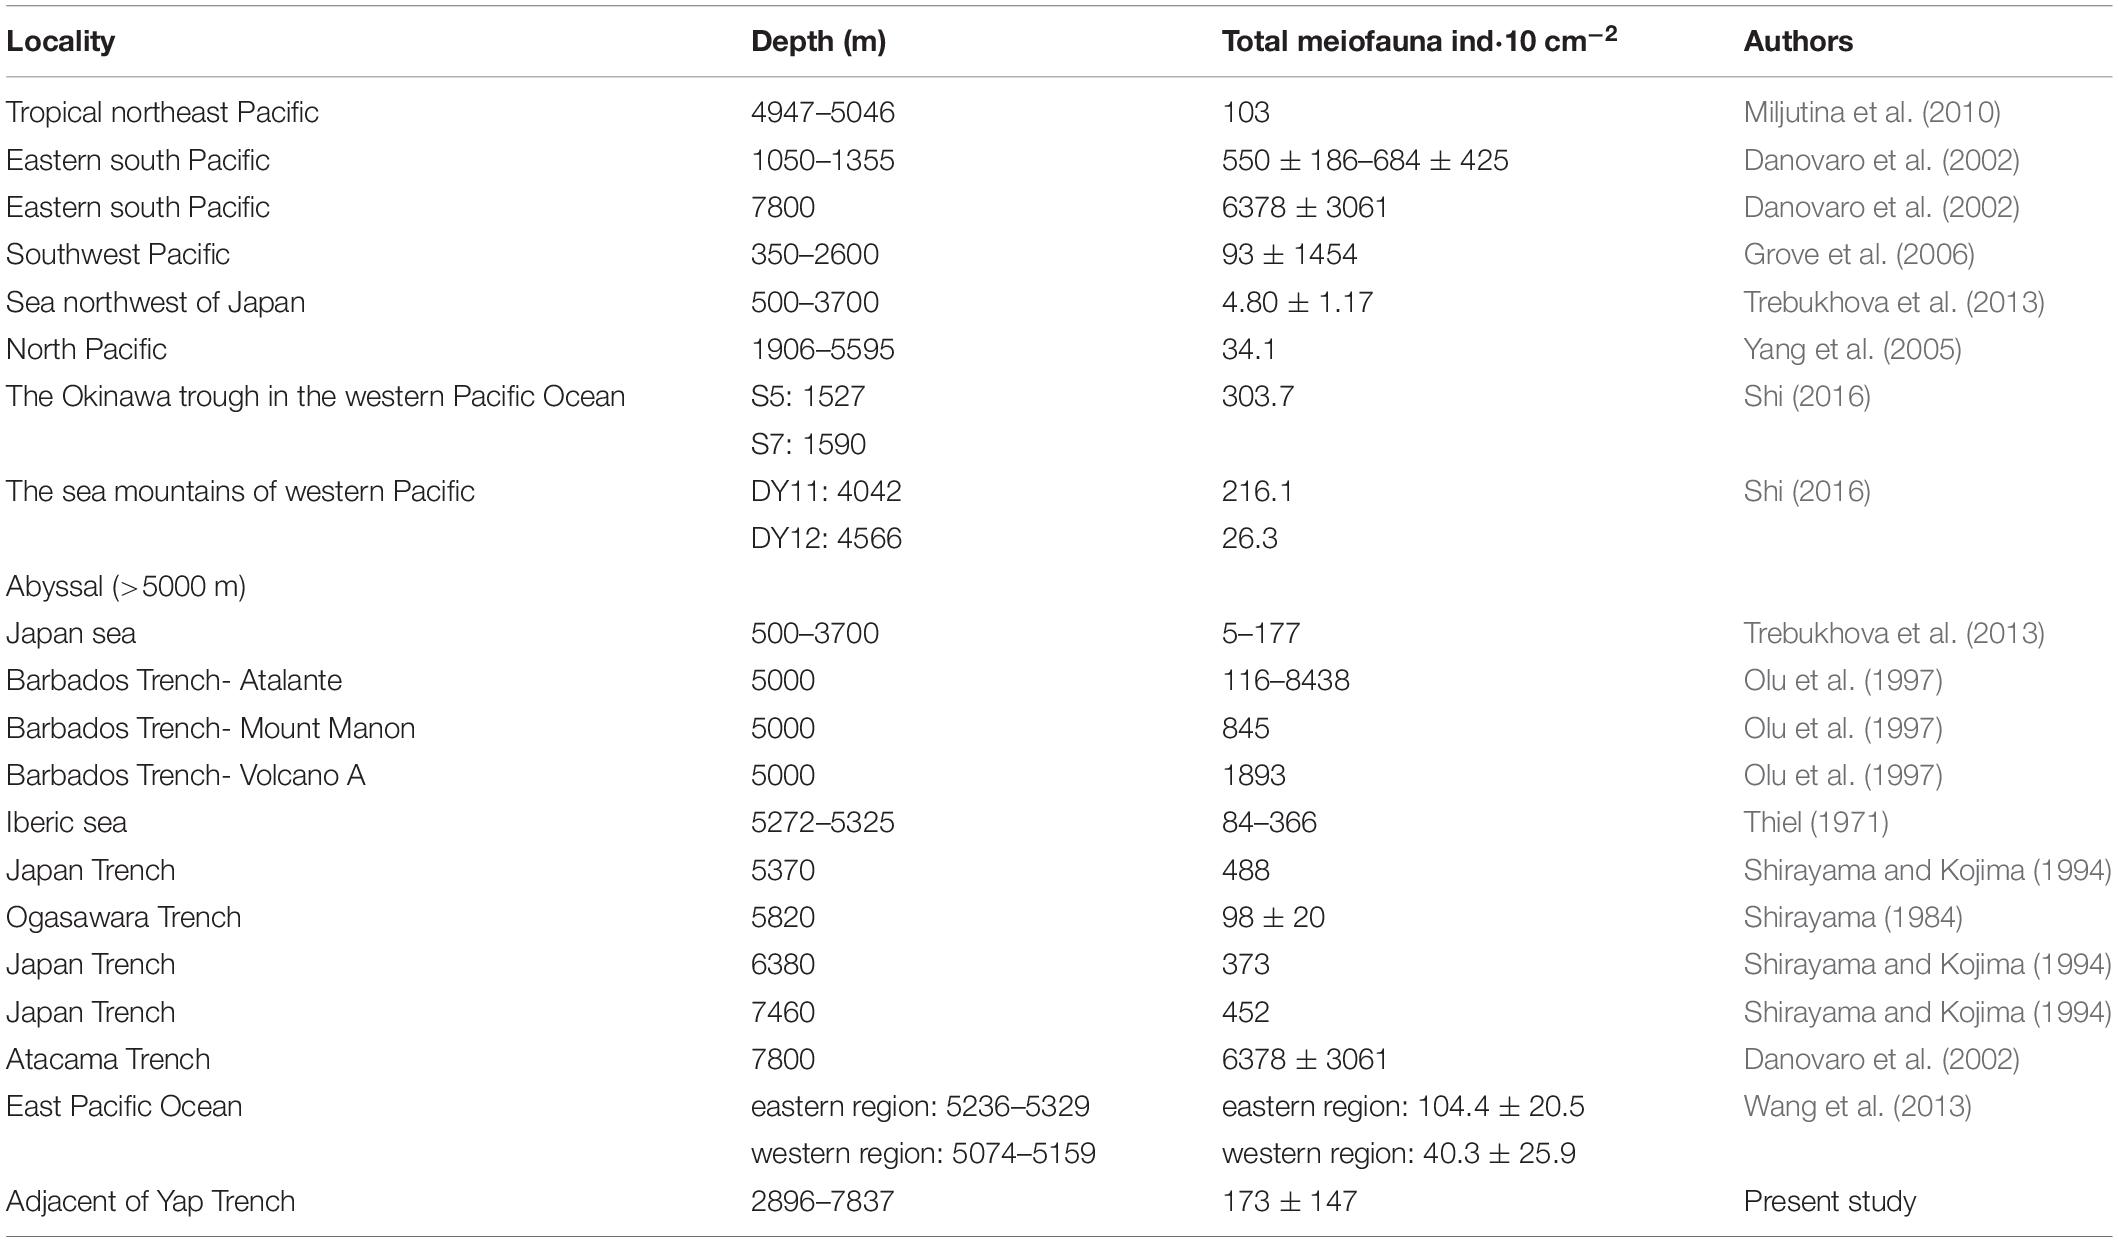
Table 6. Comparison of meiofauna studies in the Western Pacific Ocean and other seas.
The biomass of meiofauna was not measured in this study, but according to our observation during the microscopic sorting process, the volumes of nematodes were notably smaller than those of other waters, such as shallow seas, which increased the difficulty of sorting. Previous deep-sea studies reported the miniaturization of nematodes in sediments, while observing a decrease in abundance of nematodes. This phenomenon led to the hypothesis of nematode miniaturization, which is the result of adaptation to an overall decline in the availability of food (Shirayama, 1984; Vincx et al., 1994; Schewe and Soltwedel, 1998). This seems to be a clear result of an overall decrease in the food supply as depth increases. However, the Chl-a content reached 2.0 mg/kg in the sediments at a depth of 7800 m in the Atacama trench. In this nutrient-rich system, the individual volume of nematode and other meiofauna taxa was reduced by 30–40% in the deep-sea, which is contrary to the hypothesis of nematode miniaturization (Danovaro et al., 2002). Due to progress in science and technology, the difficulty of deep-sea sampling has been reduced. To further understand deep-sea ecosystems, existing information can be supplemented with data from different spatial scales and regions. However, the overall study of the deep-sea meiofauna and ecosystems should be carried out in connection with specific environmental conditions.
Conclusion
Meiofauna were mainly distributed in the subduction zone of the northwest side (near the Yap Trench) and on the slopes of the West Caroline uplift, where organic matter was accumulated. Vertical distribution showed that meiofauna were mainly distributed in the upper and middle sediment layers (0–6 cm). The distribution pattern of meiofauna in this study was not only affected by water depth, but may be related to the topography and organic matter distribution. The funnel-shaped topography of the trench and the slope of the West Caroline Sea Mountain accumulated high amounts of organic matter, providing abundant food sources for meiofauna. Therefore, water depth was not the only important factor affecting meiofauna in this study.
Data Availability Statement
All datasets generated for this study are included in the article/supplementary material.
Author Contributions
XL and JX designed this study. JX carried out the field sampling and the analysis of environmental factors. XW performed the meiofauna and statistical analysis. XW, XL, and JX wrote the manuscript.
Funding
This study was jointly funded by the Global Change and Air-Sea Interaction Project granted by the Ministry of Natural Resources of China (No. GASI-02-PAC-CJ15), the Open Fund of Laboratory of Marine Ecosystem and Biogeochemistry, SOA (LMEB201405), the Pilot Project of Resources R&D Program in International Seabed Region, COMRA (DY125-22-QY-20), and the Fundamental Research Funds for Central Universities of the Ministry of Education of China (Nos. 201964024 and 201762017).
Conflict of Interest
The authors declare that the research was conducted in the absence of any commercial or financial relationships that could be construed as a potential conflict of interest.
Acknowledgments
We appreciate Ms. Chunzi Gao and Ms. Lei He for their help in the analysis of meiofaunal samples. We are also very grateful to Prof. Hans-Uwe Dahms who made critical revision on this manuscript.
Footnotes
References
Alongi, D. M. (1986). Quantitative estimates of benthic protozoa in tropical marine systems using silica gel: a comparison of methods. Estuar. Coast. Shelf Sci. 23, 443–450. doi: 10.1016/0272-7714(86)90002-8
Ansari, Z. A., Rodrigues, C. L., and Chatterji, A. (1982). Distribution of meiobenthos and macrobenthos at the mouth of some rivers of east coast of India. Am. Hist. Rev. 117, 866–867. doi: 10.1007/s11873-012-0189-4
Billett, D. S. M., Lampitt, R. S., Rice, A. L., and Mantoura, R. F. C. (1993). Seasonal sedimentation of phytoplankton to the deep-sea benthos. Nature 302, 520–522. doi: 10.1038/302520a0
Boaden, P. J. S. (1962). Colonization of graded sand by an interstitial fauna. Cah. Biol. Mar. 111, 245–248.
Buesseler, K. O., Lamborg, C. H., Boyd, P. W., Lam, P. J., Trull, T. W., Bidigare, R. R., et al. (2007). Revisiting carbon flux through the ocean’s twilight zone. Science 316, 567–570. doi: 10.1126/science.1137959
Coull, B. C., and Chandler, G. T. (1992). Pollution and meiofauna: field, laboratory, and mesocosm studies. Oceanogr. Mar. Biol. 30, 191–271.
Danovaro, R. (2010). Methods for the Study of Deep-Sea Sediments, Their Functioning and Biodiversity. Boca Raton: CRC Press.
Danovaro, R., Gambi, C., and Croce, N. D. (2002). Meiofauna hotspot in the atacama trench, eastern South Pacific Ocean. Deep Sea Res. Part Oceanogr. Res. Pap. 49, 843–857. doi: 10.1016/S0967-0637(01)00084-x
Dong, D. D., Zhang, G. X., Qian, J., Fan, J. K., Zhang, Z. Y., and Zhang, G. L. (2017). Geomorphology and stratigraphic framework of the yap subduction zone, Western Pacific. Mar. Geol. Quat. Geol. 20, 23–29.
Findlay, S., and Tenore, K. (1982). Effect of a free-living marine nematode (Diplolaimella chitwoodi) on detrital carbon mineralization. Mar. Ecol. Progr. Ser. 8, 161–166. doi: 10.3354/meps008161
Findlay, S. E. G. (1981). Small-scale spatial distribution of meiofauna on a mud- and sandflat. Estuar. Coast. Shelf Sci. 12, 471–484. doi: 10.1016/S0302-3524(81)80006-0
Fontaneto, D., Iakovenko, N., and De Smet, W. H. (2015). Diversity gradients of rotifer species richness in Antarctica. Hydrobiologia 761, 235–248. doi: 10.1007/s10750-015-2258-5
Gage, J. D., and Tyler, P. A. (1991). Deep-Sea Biology: A Natural History of Organisms at the Deep-Sea Floor. Cambridge, MA: Cambridge University Press.
Gambi, C., and Danovaro, R. (2016). Biodiversity and life strategies of deep-sea meiofauna and nematode assemblages in the Whittard Canyon (Celtic Margin. NE Atlantic Ocean). Deep Sea Res. Part Oceanogr. Res. Pap. 108, 13–22. doi: 10.1016/j.dsr.2015.12.001
Gao, A. G., Wang, C. S., Yang, J. Y., Wang, Z. P., and He, D. H. (2002). Distribution of deep-sea meiobenthos of the eastern and western portions of the COMRA’s Pioneer Area. Donghai Mar. Sci. 20, 29–36. doi: 10.3969/j.issn.1001-909X.2002.01.004
Giere, O. (2009). Meiobenthology: the Microscopic Fauna in Aquatic Sediments. Berlin: Springer-Verlag, doi: 10.1007/978-3-540-68661-3
Grove, S. L., Probert, P. K., Berkenbusch, K., and Nodder, S. D. (2006). Distribution of bathyal meiofauna in the region of the subtropical front. Chatham Rise, south-west Pacific. J. Exp. Mar. Biol. a Ecol. 330, 342–355. doi: 10.1016/j.jembe.2005.12.038
Heip, C. H. R., Huys, R., and Alkemade, R. (1992). Community structure and functional role of meiofauna in the North Sea. Netherland J. Aquat. Ecol. 26, 31–41. doi: 10.1007/bf02298026
Higgins, R. P., and Thiel, H. (1988). Introduction to the Study of Meiofauna. Washington, DC: Smithsonian Institution Press, 1–488.
Ingham, R. E., Trofymow, J. A., Ingham, E. R., and Coleman, D. C. (1985). Interactions of Bacteria, Fungi, and their Nematode Grazers: effects on Nutrient Cycling and Plant Growth. Ecol. Monogr. 55, 119–140. doi: 10.2307/1942528
Jamieson, A. J. (2015). The Hadal Zone Life in the Deepest Oceans. London: Cambridge University Press.
Jansson, B. O. (1967). The significance of grain size and pore water content for the interstitial fauna of sandy beaches. Oikos 18, 311–322.
Kotwicki, L., Szymelfenig, M., Troch, M. D., Urban-Malinga, B., and Węsławski, J. M. (2005). Latitudinal biodiversity patterns of meiofauna from sandy littoral beaches. Biodivers. Conserv. 14, 461–474. doi: 10.1007/10531-004-6272-6
Leduc, D., Rowden, A. A., Glud, R. N., Wenzhöfer, F., Kitazato, H., and Clark, M. R. (2016). Comparison between infaunal communities of the deep floor and edge of the tonga trench: possible effects of differences in organic matter supply. Deep Sea Res. PartI Oceanogr. Res. Pap. 116, 264–275. doi: 10.1016/j.dsr.2015.11.003
Liu, X. S., Xu, M., Zhang, J. H., Liu, D., and Liu, X. (2014). Abundance and biomass of deep-sea meiofauna in the northern South China Sea. J. Trop. Oceanogr. 33, 52–59. doi: 10.3969/j.issn.1009-5470.2014.02.007
McIntyre, A. D. (1969). Ecology of marine meiobenthos. Biol. Rev. 44, 245–288. doi: 10.1111/j.1469-185X.1969.tb00828.x
Mestre, N. C., Calado, R., and Soares, A. M. (2014). Exploitation of deep-sea resources: the urgent need to understand the role of high pressure in the toxicity of chemical pollutants to deep-sea organisms. Environ. Pollut. 185, 369–371. doi: 10.1016/j.envpol.2013.10.021
Miljutina, M. A., Miljutin, D. M., Mahatma, R., and Galéron, J. (2010). Deep-sea nematode assemblages of the clarion-clipperton Nodule Province (Tropical North-Eastern Pacific). Mar. Biodivers. 40, 1–15. doi: 10.1007/s12526-009-0029-0
Monteiro, L., Moens, T., Lynen, F., and Traunspurger, T. (2019). Effects of the water-soluble fraction of a crude oil on freshwater meiofauna and nematode assemblages. Ecotoxicol. Environ. Saf. 176, 186–195. doi: 10.3389/fmars.2018.00448
Neira, C., Ingels, J., Mendoza, G., Hernandez-Lopez, E., and Levin, L. A. (2018). Distribution of meiofauna in bathyal sediments influenced by the oxygen minimum zone off Costa Rica. Front. Mar. Science 5:448. doi: 10.3389/fmars.2018.00448
Olu, K., Lance, S., Sibuet, M., Henry, P., Fiala-Médioni, A., and Dinet, A. (1997). Cold seep communities as indicators of fluid expulsion patterns through mud volcanoes seaward of the Barbados accretionary prism. Deep Sea Res. Part Oceanog. Res. Pap. 44, 811–841. doi: 10.1016/s0967-0637(96)00123-9
Pusceddu, A., Bianchelli, S., Martín, J., and Puig, P. (2014). Chronic and intensive bottom trawling impairs deep-sea biodiversity and ecosystem functioning. Proc. Natl. Acad. Sci. U.S.A. 11, 8861–8866. doi: 10.1073/pnas.1405454111
Ramirez-Llodra, E., Brandt, A., Danovaro, R., De Mol, B., Escobar, E., German, C. R., et al. (2010). Deep, diverse and definitely different: unique attributes of the world’s largest ecosystem. Biogeosciences 7, 2851–2899. doi: 10.5194/bg-7-2851-2010
Rosli, N., Leduc, D., Rowden, A. A., and Probert, P. K. (2017). Review of recent trends in ecological studies of deep-sea meiofauna, with focus on patterns and processes at small to regional spatial scales. Mar. Biodivers. 2017, 1–22. doi: 10.1007/s12526-017-0801-5
Schewe, I., and Soltwedel, T. (1998). “Life under perennial ice coverage: the deep-sea meiobenthos of the Central Arctic Ocean (Poster),”in 10th International Meiofauna Conference, (Plymouth).
Schmidt, C., and Arbizu, P. M. (2015). Unexpectedly higher metazoan meiofauna abundances in the Kuril–Kamchatka trench compared to the adjacent abyssal plains. Deep Sea Res. Part 111, 60–75. doi: 10.1016/j.dsr2.2014.08.019
Schmidt, C., Sattarova, V. V., Katrynski, L., and Arbizu, P. M. (2019). New insights from the deep: meiofauna in the kuril-kamchatka trench and adjacent abyssal plain. Progr. Oceanogr. 173, 192–207. doi: 10.1016/j.pocean.2019.02.010
Schratzberger, M., and Ingels, J. (2018). Meiofauna matters: the roles of meiofauna in benthic ecosystems. J. Exp. Mar. Biol. Ecol. 502, 12–25. doi: 10.1016/j.jembe.2017.01.007
SCOR Working Group 76, (1994). Suggested criteria for describing deep-sea benthic communities; the final report of SCOR Working Group 76. Progr. Oceanogr. 34, 81–100. doi: 10.1016/0079-6611(94)90002-7
Shi, B. Z. (2016). Taxonomy of Nematodes and Community Structure of Meiofauna in V arious Marine Habitats. Beijing: Institute of Oceanology, Chinese Academy of Sciences. PhD thesis.
Shirayama, Y. (1984). The abundance of deep-sea meiobenthos in the Western Pacific in relation to environmental factors. Oceanol. Acta 7, 113–121.
Shirayama, Y., and Kojima, S. (1994). Abundance of deep-sea meiobenthos off Sanriku. Northeastern Japan. J. Oceanogr. 50, 109–117. doi: 10.1007/BF02233860
Soltwedel, T. (2000). Metazoan meiobenthos along continental margins: a review. Progr. Oceanogr. 46, 59–84. doi: 10.1016/S0079-6611(00)00030-6
Soltwedel, T., Miljutina, M., Mokievsky, V., Thistle, D., and Vopel, K. (2003). The meiobenthos of the Molloy Deep (5 600 m). Fram Strait, Arctic Ocean. Vie Milieu life Environ. 53, 1–13.
Taylor, J., Krumpen, T., Soltwedel, T., Gutt, J., and Bergmann, M. (2017). Dynamic benthic megafaunal communities: assessing temporal variations in structure, composition and diversity at the arctic deep-sea observatory HAUSGARTEN between 2004 and 2015. Deep Sea Res. Part Oceanogr. Res. Pa. 122, 81–94. doi: 10.1016/j.dsr.2017.02.008
Thiel, H. (1971). Frequency and distribution of meiofauna in area of Island Faroe-Ridge. Berichte Der Deutschen Wissenschaftlichen Kommission Fur Meeresforschung 22, 99–128.
Thiel, H. (1983). “Meiobenthos and nanobenthos of the deep-sea,” in Deep Sea Biology, The Sea, Vol. 8, ed. G. T. Rowe, (New York, NY: John Wiley and Sons), 167–230.
Tietjen, J. H. (1992). Abundance and biomass of metazoan meiobenthos in the Deep Sea. Deep Sea Food Chains Global Carbon Cycle 360, 45–62. doi: 10.1007/978-94-011-2452-2_4
Tietjen, J. H., Deming, J. W., Rowe, G. T., Macko, S., and Wilke, R. J. (1989). Meiobenthos of the Hatteras abyssal plain and puerto rico trench: abundance, biomass and associations with bacteria and particulate fluxes. Deep Sea Res. Part A Oceanogr. Res. Pap. 36, 1567–1577. doi: 10.1016/0198-0149(89)90058-7
Trebukhova, Y. A., Miljutin, D. M., Pavlyuk, O. N., Mar’yash, A. A., and Brenke, N. (2013). Changes in deep-sea metazoan meiobenthic communities and nematode assemblages along a depth gradient (North-western Sea of Japan, Pacific). Deep Sea Res. Part Top. Stud. Oceanogr. 86-87, 56–65. doi: 10.1016/j.dsr2.2012.08.015
Vincx, M., Bett, B. J., Dinet, A., Ferrero, T., Gooday, A. J., Lambshead, P. J. D., et al. (1994). Meiobenthos of the Deep Northeast Atlantic. Adv. Mar. Biol. 30, 1–88. doi: 10.1016/S0065-2881(08)60061-9
Wang, R. (1986). Correction of the formula to convert fluorescence measurement to phaeophorbide a concentration in acidification method. Mar. Sci. 10, 1—-5.
Wang, X. G., Zhou, Y. D., Zhang, D. S., Hong, L. S., and Wang, C. S. (2013). A study of meiofauna in the COMRA’s contracted area during the summer of 2005. Acta Ecol. Sin. 33, 492–500. doi: 10.5846/stxb201111251801
Wu, B., Li, D., Zhao, J., Liu, C. G., Sun, C. J., et al. (2018). Vertical distribution of sedimentary organic carbon in the Yap Trench and its implications. China Environ. Sci. 38, 304–313.
Yang, J. Y., Wang, C. S., Liu, Z. S., Gao, A. G., and Wang, X. G. (2005). The spatial distribution of tropical north Pacific deep-sea meiobenthos. J. Mar. Sci. 23, 23–29. doi: 10.3321/j.issn:1000-0933.2008.02.004
Ye, S. M., Pan, Y., Gao, S. J., and Yang, J. Y. (2005). The design of automatic separation facility for benthic meiofauna sample. J. Southern Yangtze Univ. 4, 240–243.
Yue, X. A., Yan, Y. X., Ding, H. B., Sun, C. J., and Yang, G. P. (2018). Biological geochemical characteristics of the sediments in the Yap Trench and its oceanographic significance. Periodical Ocean Univ. China 48, 88–96.
Zeppilli, D., Leduc, D., Fontanier, C., Fontaneto, D., Fuchs, S., Gooday, A. J., et al. (2018). Characteristics of meiofauna in extreme marine ecosystems: a review. Mar. Biodivers. 2018, 35–71. doi: 10.1007/s12526-017-0815-z
Zeppilli, D., Sarrazin, J., Leduc, D., Martinez Arbizu, P., Fontaneto, D., Fontanier, C., et al. (2015). Is the meiofauna a good indicator for climate change and anthropogenic impacts? Mar. Biodivers. 45, 505–535. doi: 10.1007/s12526-015-0359-z
Zhang, F. Y., Li, A. C., Lin, Z. H., Zhang, W. Y., Zhang, X. U., and Zhang, J. (2006). Classification and nomenclature of deep-sea sediments. Oceanol. Limnol. Sin. 37, 517–523. doi: 10.3321/j.issn:0029-814X.2006.06.007
Zhou, H., and Zhang, Z. N. (2003). Rationale of multivariate statistical software PRIMER and its application in benthic community ecology. J. Ocean Univ. Qingdao. 33, 58–64. doi: 10.3969/j.issn.1672-5174.2003.01.023
Keywords: meiofauna, distribution pattern, deep-sea, Yap Trench, Western Pacific Ocean
Citation: Wang X, Liu X and Xu J (2019) Distribution Patterns of Meiofauna Assemblages and Their Relationship With Environmental Factors of Deep Sea Adjacent to the Yap Trench, Western Pacific Ocean. Front. Mar. Sci. 6:735. doi: 10.3389/fmars.2019.00735
Received: 02 August 2019; Accepted: 12 November 2019;
Published: 06 December 2019.
Edited by:
Daniela Zeppilli, Institut Français de Recherche pour l’Exploitation de la Mer (IFREMER), FranceReviewed by:
Jeroen Ingels, Florida State University, United StatesMotohiro Shimanaga, Kumamoto University, Japan
Copyright © 2019 Wang, Liu and Xu. This is an open-access article distributed under the terms of the Creative Commons Attribution License (CC BY). The use, distribution or reproduction in other forums is permitted, provided the original author(s) and the copyright owner(s) are credited and that the original publication in this journal is cited, in accordance with accepted academic practice. No use, distribution or reproduction is permitted which does not comply with these terms.
*Correspondence: Xiaoshou Liu, bGl1eHNAb3VjLmVkdS5jbg==; Jishang Xu, amlzaGFuZ3h1QG91Yy5lZHUuY24=