 Nicolas Sanchez1*
 Christian S. Reiss2
 Osmund Holm-Hansen3
 Christopher D. Hewes3
 Kemal C. Bizsel4
 Murat V. Ardelan1
- 1Department of Chemistry, Norwegian University of Science and Technology, Trondheim, Norway
- 2Antarctic Ecosystem Research Division, Southwest Fisheries Science Center (NOAA), La Jolla, CA, United States
- 3Polar Research Program, Marine Biology Research Division, Scripps Institution of Oceanography, University of California, San Diego, La Jolla, CA, United States
- 4Institute of Marine Sciences and Technology, Dokuz Eylul University, İzmir, Turkey
An oceanographic survey around the South Shetland Islands (SSI) and the South Orkney Islands (SOI) was conducted during January 2007 and February 2008, respectively, as part of the United States Antarctic Marine Living Resources (AMLR) program ecosystems surveys. At 27 stations, concentrations of dissolved labile Fe (DFe) and total acid leachable (unfiltered, TaLFe) iron (Fe) were measured in the upper 200 m (including coastal and oceanic waters) to better resolve the factors limiting primary production in these regions. Northwest of the SSI, a region influenced by Drake Passage (DP) waters, mean DFe (∼0.26 nM) and TaLFe (∼1.02 nM) concentrations were the lowest, whereas intermediate concentrations for both DFe and TaLFe were measured in the Bransfield Strait (BS). Around Elephant Island (EI), over and off the continental shelf, Fe concentrations differed between the west and the east margins. DFe and TaLFe concentrations further support the argument that the effect of the Shackleton Transverse Ridge (STR) is a crucial structure affecting both the Fe and the chlorophyll distributions in this region. The waters around the SOI had DFe concentrations higher than those in the SSI, with the area north of the South Scotia Ridge (SSR) (60°S), having the highest DFe (0.54 nM) concentrations and the waters in Powell Basin (PB) having the lowest DFe (1.17 nM) and TaLFe (4.51 nM) and concentrations. These spatial patterns of Fe suggest that there are different Fe inputs from shelf waters near the Antarctic Slope Front (ASF). The overall TaLFe:DFe ratios, used as indicator for understanding the relative distance of Fe sources, were lower around the SOI compared to those in the SSI, suggesting that the Fe source for SOI waters was more distant. The spatial patterns between Fe and chlorophyll-a (Chl-a) concentrations in relation to the hydrography highlight the complexity and variability of the oceanographic processes in the region. These results improve the knowledge on the Fe sources and inputs in the less known SOI waters during the austral summer, and they further support the importance of advective processes from the Fe-rich waters that flow from the eastern margin of the Antarctic Peninsula (AP) into the Weddell-Scotia Confluence (WSC).
Introduction
The Southern Ocean constitutes the largest high-nutrient low-chlorophyll zone in the world (Martin et al., 1990; Chisholm and Morel, 1991). Although the major nutrients that control primary production throughout much of the world’s oceans are plentiful, relatively high phytoplankton biomass is restricted to sectors around or downstream of islands, the continental shelf, and in the Antarctic Polar Frontal Zone (Sullivan et al., 1993; Holm-Hansen et al., 2005). Over the past three decades, ample evidence has demonstrated that the low concentrations of chlorophyll-a (Chl-a) in the pelagic waters of the Southern Ocean is, to a large extent, the result of limiting concentrations of Fe (De Baar et al., 1990, 2005; Martin et al., 1990; Boyd et al., 2007). This trace element and the light availability, controlled by the depth of the upper mixed layer (UML) constitute the two strongest bottom-up controls on phytoplankton growth in the Southern Ocean (Mitchell et al., 1991; Boyd et al., 1999, 2007; Boyd, 2002; Llort et al., 2019).
In the areas adjacent to the Antarctic continent, Fe can be supplied by different mechanisms, of which the most relevant are islands’ shallow topography (Bucciarelli et al., 2001; Blain et al., 2007), eddies (Kahru et al., 2007; Read et al., 2007), icebergs (Lannuzel et al., 2008; Raiswell et al., 2016), seasonal ice edge (Edwards and Sedwick, 2001; Lannuzel et al., 2007), ice sheet melting (Hawkings et al., 2014), glacier weathering (Hodson et al., 2017), and lateral transport from coastal areas such as the Antarctic Peninsula (AP) (Hewes et al., 2008; Ardelan et al., 2010; De Jong et al., 2012). In the case of the latter, the large-scale Chl-a distribution in the eastward flowing Antarctic Circumpolar Current (ACC), between the South American and Antarctic continents, shows that Fe limitation may be alleviated even a long distance away from the continental margins. Recently compiled evidence, together with full water column data, suggests that sediments at the continental margins of southern South America and of the AP are important potential natural Fe sources (De Jong et al., 2012; Klunder et al., 2014).
The circulation of the Weddell Sea along the east continental margin of the AP plays an essential role in the export of particulate material from the coast to more open waters. The cyclonic outflow of the Weddell Sea gyre over the shallow shelf regions becomes enriched in sediment-derived Fe, making the UML relatively high in Fe (Westerlund and Öhman, 1991; Sanudo-Wilhelmy et al., 2002; Klunder et al., 2014). At the northern tip of the AP, the flow of Weddell Sea shelf water (WSSW) divides into: (1) a partial flow toward the southwest over the northern shelf regions of the South Shetland Islands (SSI) into the Bransfield Strait (BS, including the central and the eastern basins) and (2) a northerly flow toward Elephant Island (EI) (Von Gyldenfeldt et al., 2002; Zhou et al., 2006, 2010). This outflow of less dense water masses of the Weddell Sea released onto the northwestern shelf also affects the Powell Basin [PB, extending beyond the South Orkney Plateau (SOP)], resulting primarily in the horizontal mixing between the nutrient-rich WSSW and the Fe-poor but well-stratified Drake Passage (DP) ACC waters (Von Gyldenfeldt et al., 2002; Heywood et al., 2004). Because of this enrichment process, high Chl-a concentrations occur within the western Weddell-Scotia Confluence (WSC) region. This process is also arguably more important than the vertical enrichment of surface waters through upwelling (Hewes et al., 2008), as it occurs in other areas of natural fertilization such as the Crozet (Pollard et al., 2007a, b) and Kerguelen (Blain et al., 2008) plateaux. Horizontal mixing and transport of Fe is likely one of the most important factors driving relatively high Chl-a biomass east of the WSC and in open waters in the Scotia Sea.
Although the effect of the west outflow of WSSW on the Fe distribution in waters surrounding the AP has been studied in more detail (Ardelan et al., 2010; Frants et al., 2013; Hatta et al., 2013; Measures et al., 2013), the effect of the eastern component in areas such as the SOP has been less studied. In this region, the outflows of the locally formed water masses likely have different roles in contributing to the Fe transport into the ACC, the Scotia Sea, and as far as 30°E into the Weddell gyre (WG) (De Baar et al., 1995; De Jong et al., 2012; Heywood et al., 2014). In the Scotia Sea, although there are more data available in the southern portion (Nolting et al., 1991; Loscher et al., 1997) compared to those in the northern portion (Nielsdóttir et al., 2012), there is overall large variability in both the spatial and the temporal scales regarding the Fe inputs. The latter highlights the dynamic nature of the region and the persistence of gaps in our knowledge on quantifying these inputs.
Fe plays a critical role in controlling primary productivity and the associated drawdown of atmospheric carbon dioxide in the Southern Ocean (De Baar et al., 2005; Boyd et al., 2007), and therefore has the potential to exert a substantial influence on the oceanic and atmospheric carbon budgets on a global scale (Watson et al., 2000; Sarmiento et al., 2004). It is therefore relevant to enhance the data resolution in order to better constrain the models on both the sources and the sinks of this essential micronutrient, that constitute the bottom-up control of the productivity and associated carbon export within one of the most important areas in the Antarctic ecosystem. As part of the Antarctic Marine Living Resources (AMLR) program ecosystems surveys, an oceanographic survey was conducted in the northern AP (SSI) and within the vicinity of the SOP [South Orkney Islands (SOI)]. The objective was to increase the Fe data resolution in the upper ocean, in order to improve the understanding of the sources for this essential micronutrient, and ultimately better resolve the factors affecting the primary production within the WSC region.
Materials and Methods
Field Sampling and Oceanographic Measurements
The sampling area is that of the AMLR program, covering the SSI in the region of the AP and the vicinity within the southern portion of the Scotia Sea (Figure 1). The sampling of the SSI was conducted in 2007 between the 11th and the 31st of January, and the survey in the SOI was conducted in 2008 between the 18th and the 29th of February. Both surveys were conducted onboard the R/V Yuzhmorgeologiya and consisted of a total of 213 routine conductivity-temperature-depth (CTD) stations conducted down to 750 m (or to 5–7 m of the sea bottom at shallower stations). At 27 of these stations, samples for Fe were collected down to 200 m [see section “Dissolved Labile (DFe) and Total Acid Leachable Fe”].
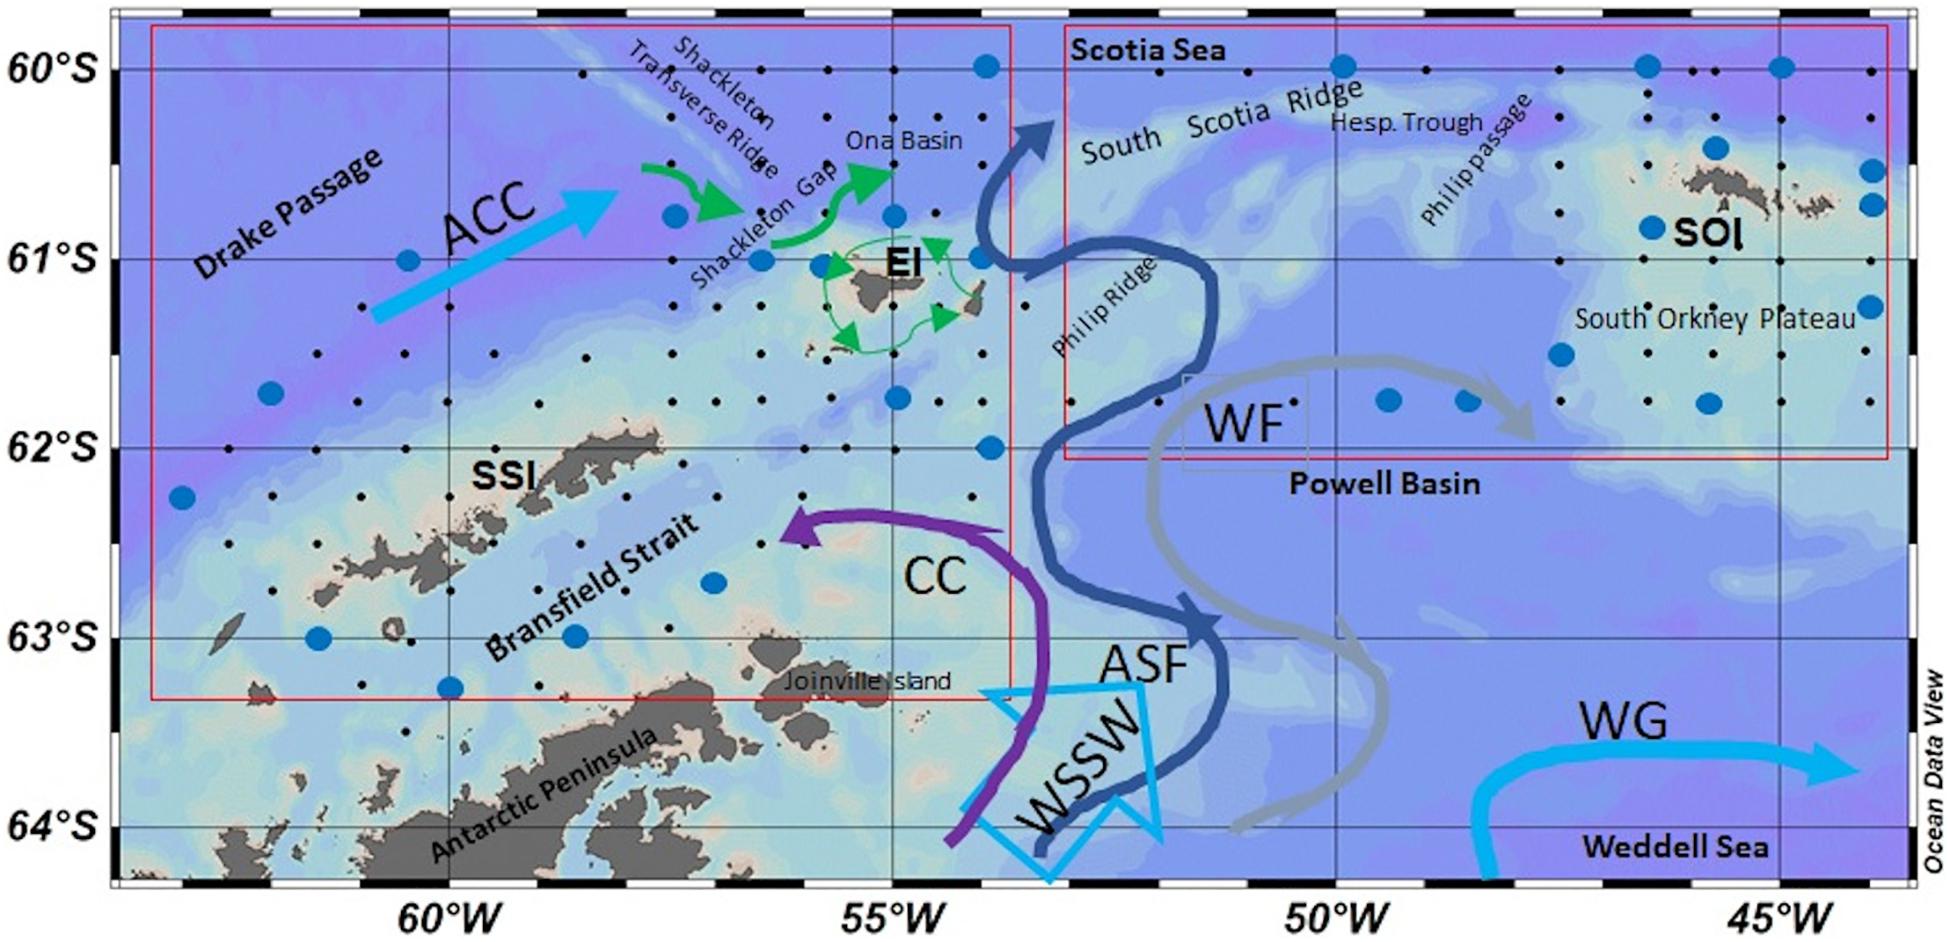
Figure 1. Region of study surveyed in 2007 [South Shetland Islands (SSI) and Elephant Island area (EI)—left square] and 2008 [South Orkney Islands (SOI)—right square] with the most relevant geographical features. Between these two groups of islands, is located the Weddell-Scotia Confluence (WSC). Stations marked in blue are the 27 stations sampled for iron. Colored arrows represent the main schematic flows of the Antarctic Circumpolar Current (ACC), Weddell gyre (WG), together with main outflows of the Weddell Sea shelf waters (WSSW): The Coastal Current (CC purple), Antarctic Slope Front (ASF dark blue), and Weddell Front (WF gray arrow); based on Thompson et al. (2009). Green arrows represent the counter-clockwise circulation around EI, based on Ardelan et al. (2010) and Zhou et al. (2010). Graphs plotted with Ocean Data View (Schlitzer, 2016).
The CTD rosette was equipped with 11 General Oceanics Niskin bottles (8 L) and a Sea-Bird SBE-9/11 CTD with SBE 43 dissolved oxygen probe, SBE pump, Chelsea Instruments Aquatracka III fluorometer for measurement of in situ Chl-a fluorescence, and Wetlabs C-Star red and blue transmissometer for measurement of the attenuation of light at 660 nm. Samples for Chl-a and macronutrient determinations were obtained from Niskin bottles at discrete depths of 5, 10, 15, 20, 30, 40, 50, 75, 100, and 200 m.
Chlorophyll-a
Chl-a concentrations (mg m–3) were determined by measurement of the fluorescence after extraction in methanol. Sample volumes of 100 mL were filtered through glass fiber filters (Whatmann GFF, 25 mm) at a reduced pressure of (1/3 atmosphere). The filters with the particulate material were placed in 10 mL of methanol in 15-mL tubes and the photosynthetic pigments were extracted at 4°C for at least 12 h (Holm-Hansen and Riemann, 1978). Fluorescence was measured by using a fluorometer (Turner Designs model 700) that had been calibrated by using purified Chl-a concentrations (Sigma C-6144). The values for Chl-a presented correspond to integrated values in the depth of the UML.
Inorganic Macronutrients
Water samples (∼50 mL) for macronutrient analysis were poured directly from the Niskin sampling bottles on the carousel into acid-washed (1 N HCl) polyethylene (PE) bottles of 60 mL capacity. The samples were maintained at −20°C until analysis. An auto-analyzer (Technicon) was used for determination of nitrate + nitrite (hereafter nitrate), phosphate, and silicic acid as described by Atlas et al. (1971).
Upper-Mixed-Layer Depth
The depth of the UML was calculated as the depth at which potential density sigma-theta differed by 0.05 kg m–3 from the mean potential density measured between 5 and 10 m depth.
Hydrography: Grouping of Stations and Definition of Water Zones
Table 1 shows the main bio-oceanographic features of the 27 stations occupied for Fe sampling. The stations were grouped within specific geographic regions in the SSI and the SOI sectors (Figure 1). These areas exhibit the influences of the two main sources of water masses present in the region, the ACC and the Weddell Sea outflow. The hydrography in the region is well characterized and it is classified within specific water zones (Holm-Hansen et al., 1997; Hewes et al., 2008). The five water zones (WZ-1 to WZ-5) result as a gradient formed by the influence of ACC waters from the northwest and Weddell Sea from the southeast of the AP. Here we focus on the water properties in the upper 250 m within these regions.
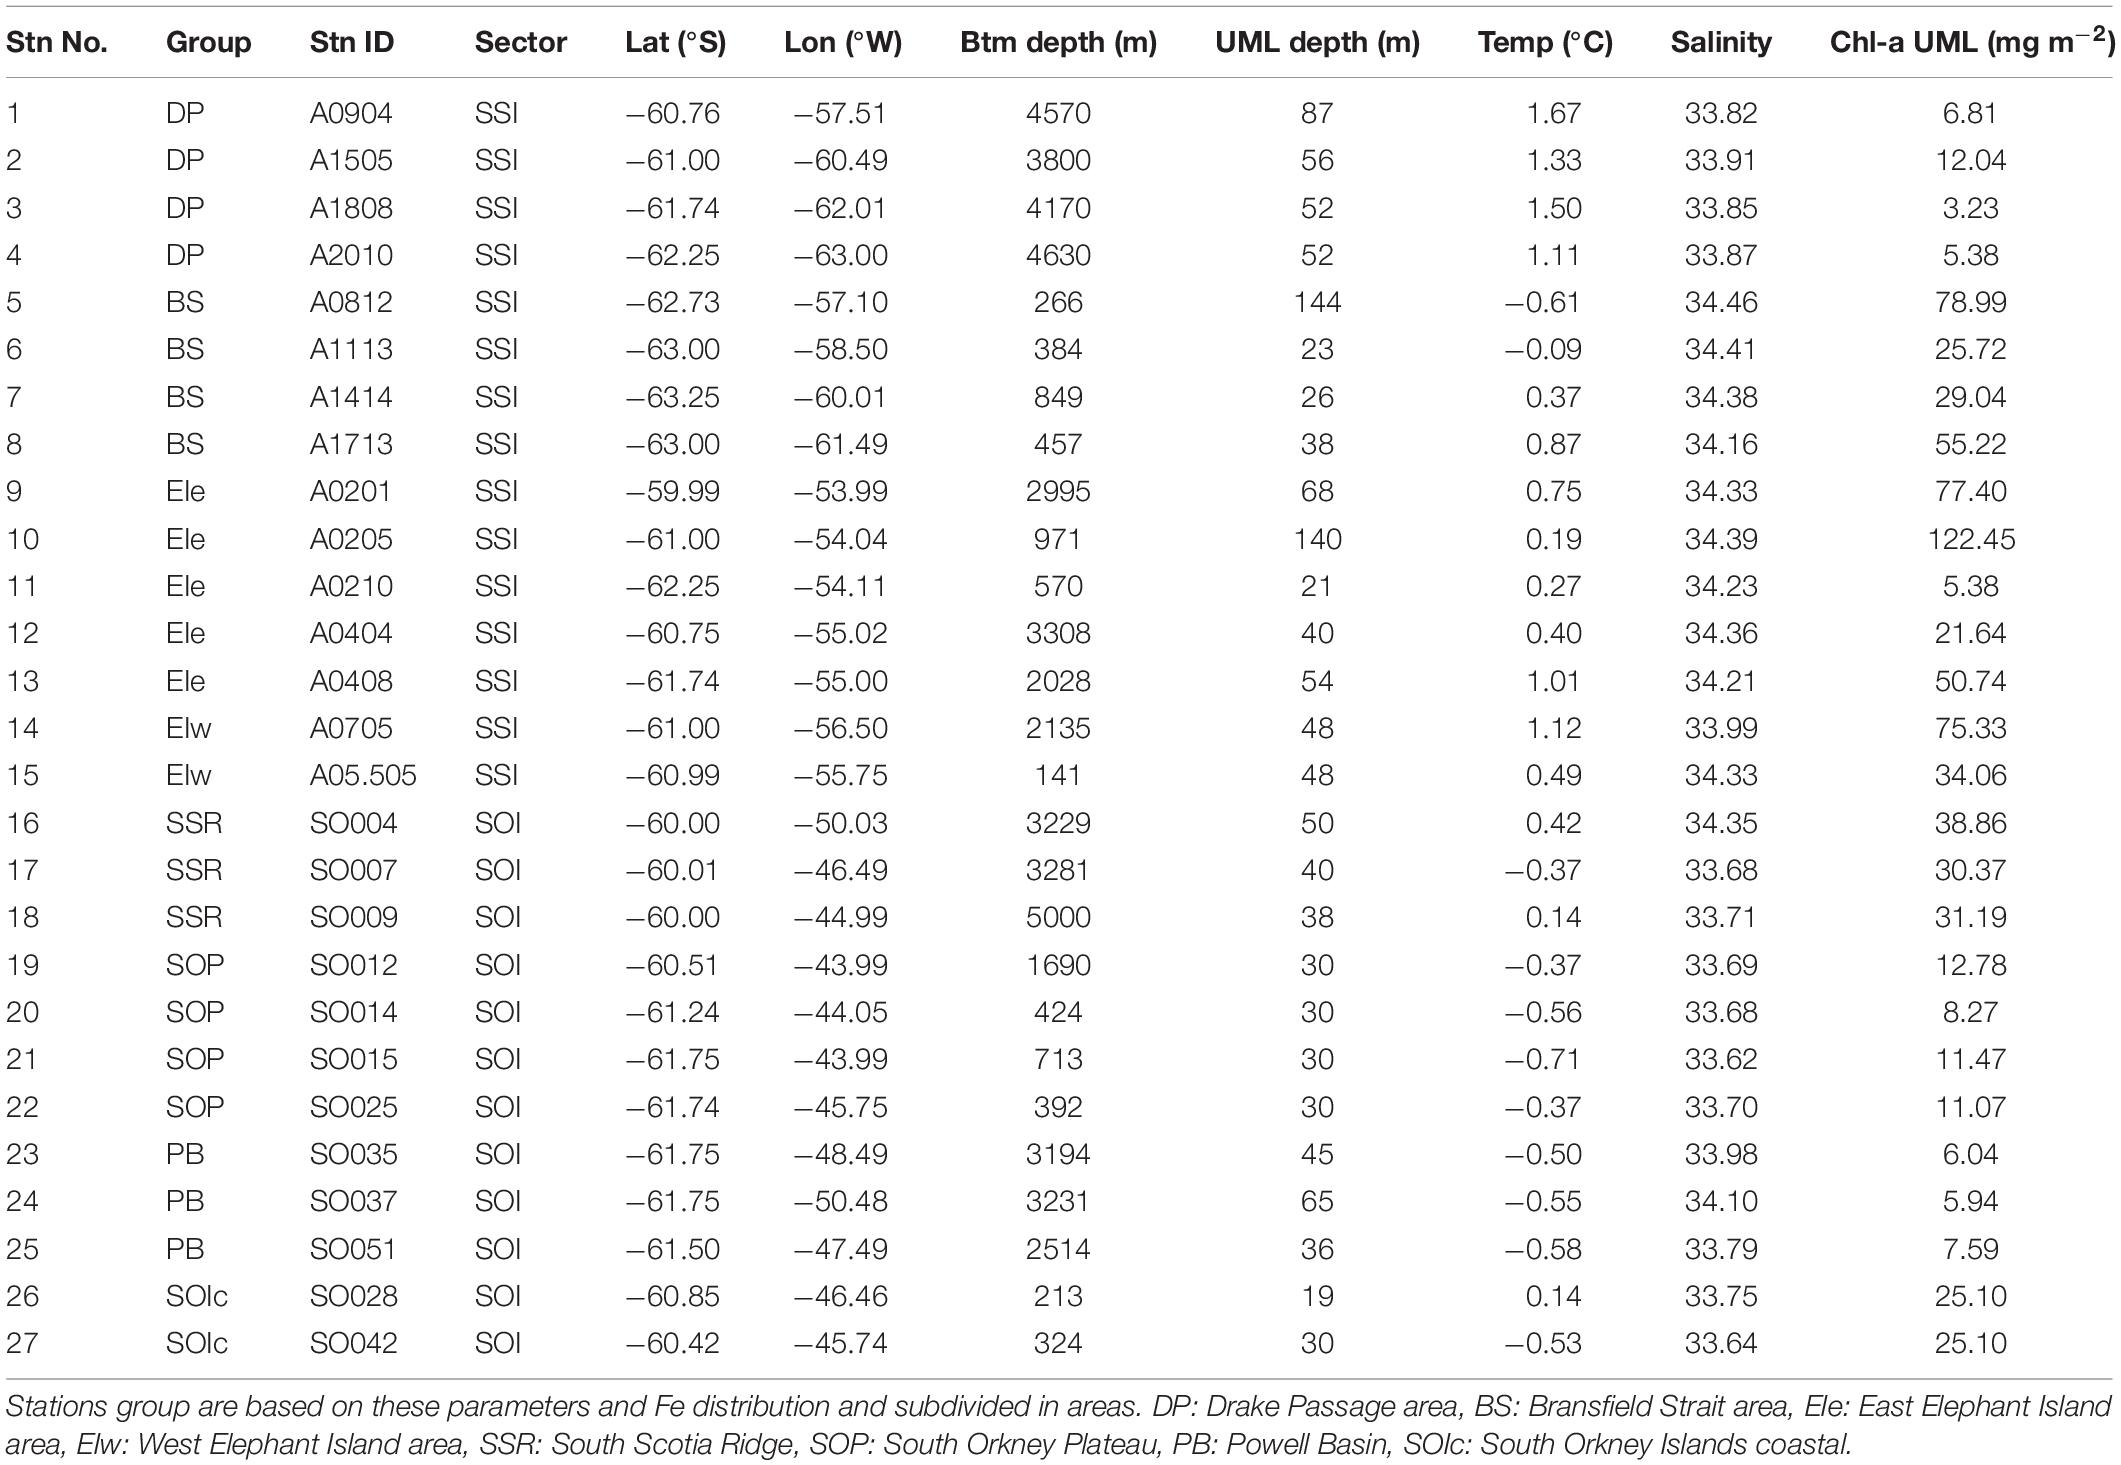
Table 1. Main bio-oceanographic parameters for the 27 Fe stations.
Within the SSI sector (Figures 1, 2), three main regions were defined: (1) the DP region located offshore, including four stations located off the continental shelf and corresponding to waters mainly influenced by the Antarctic Circumpolar Deep Water; (2) the BS region, including four stations located in BS, corresponding to shallow stations (<500 m) located over the continental shelf; and (3) the EI region in the northeast section of the SSI, including seven stations that were within and beyond the continental shelf break. Because of the influence of topographical features and the complex mixing of water masses in the region, the stations in EI are divided as EI west (EIw), grouping the stations located west of the Shackleton Transverse Ridge (STR), and EI east (EIe) for the other stations.
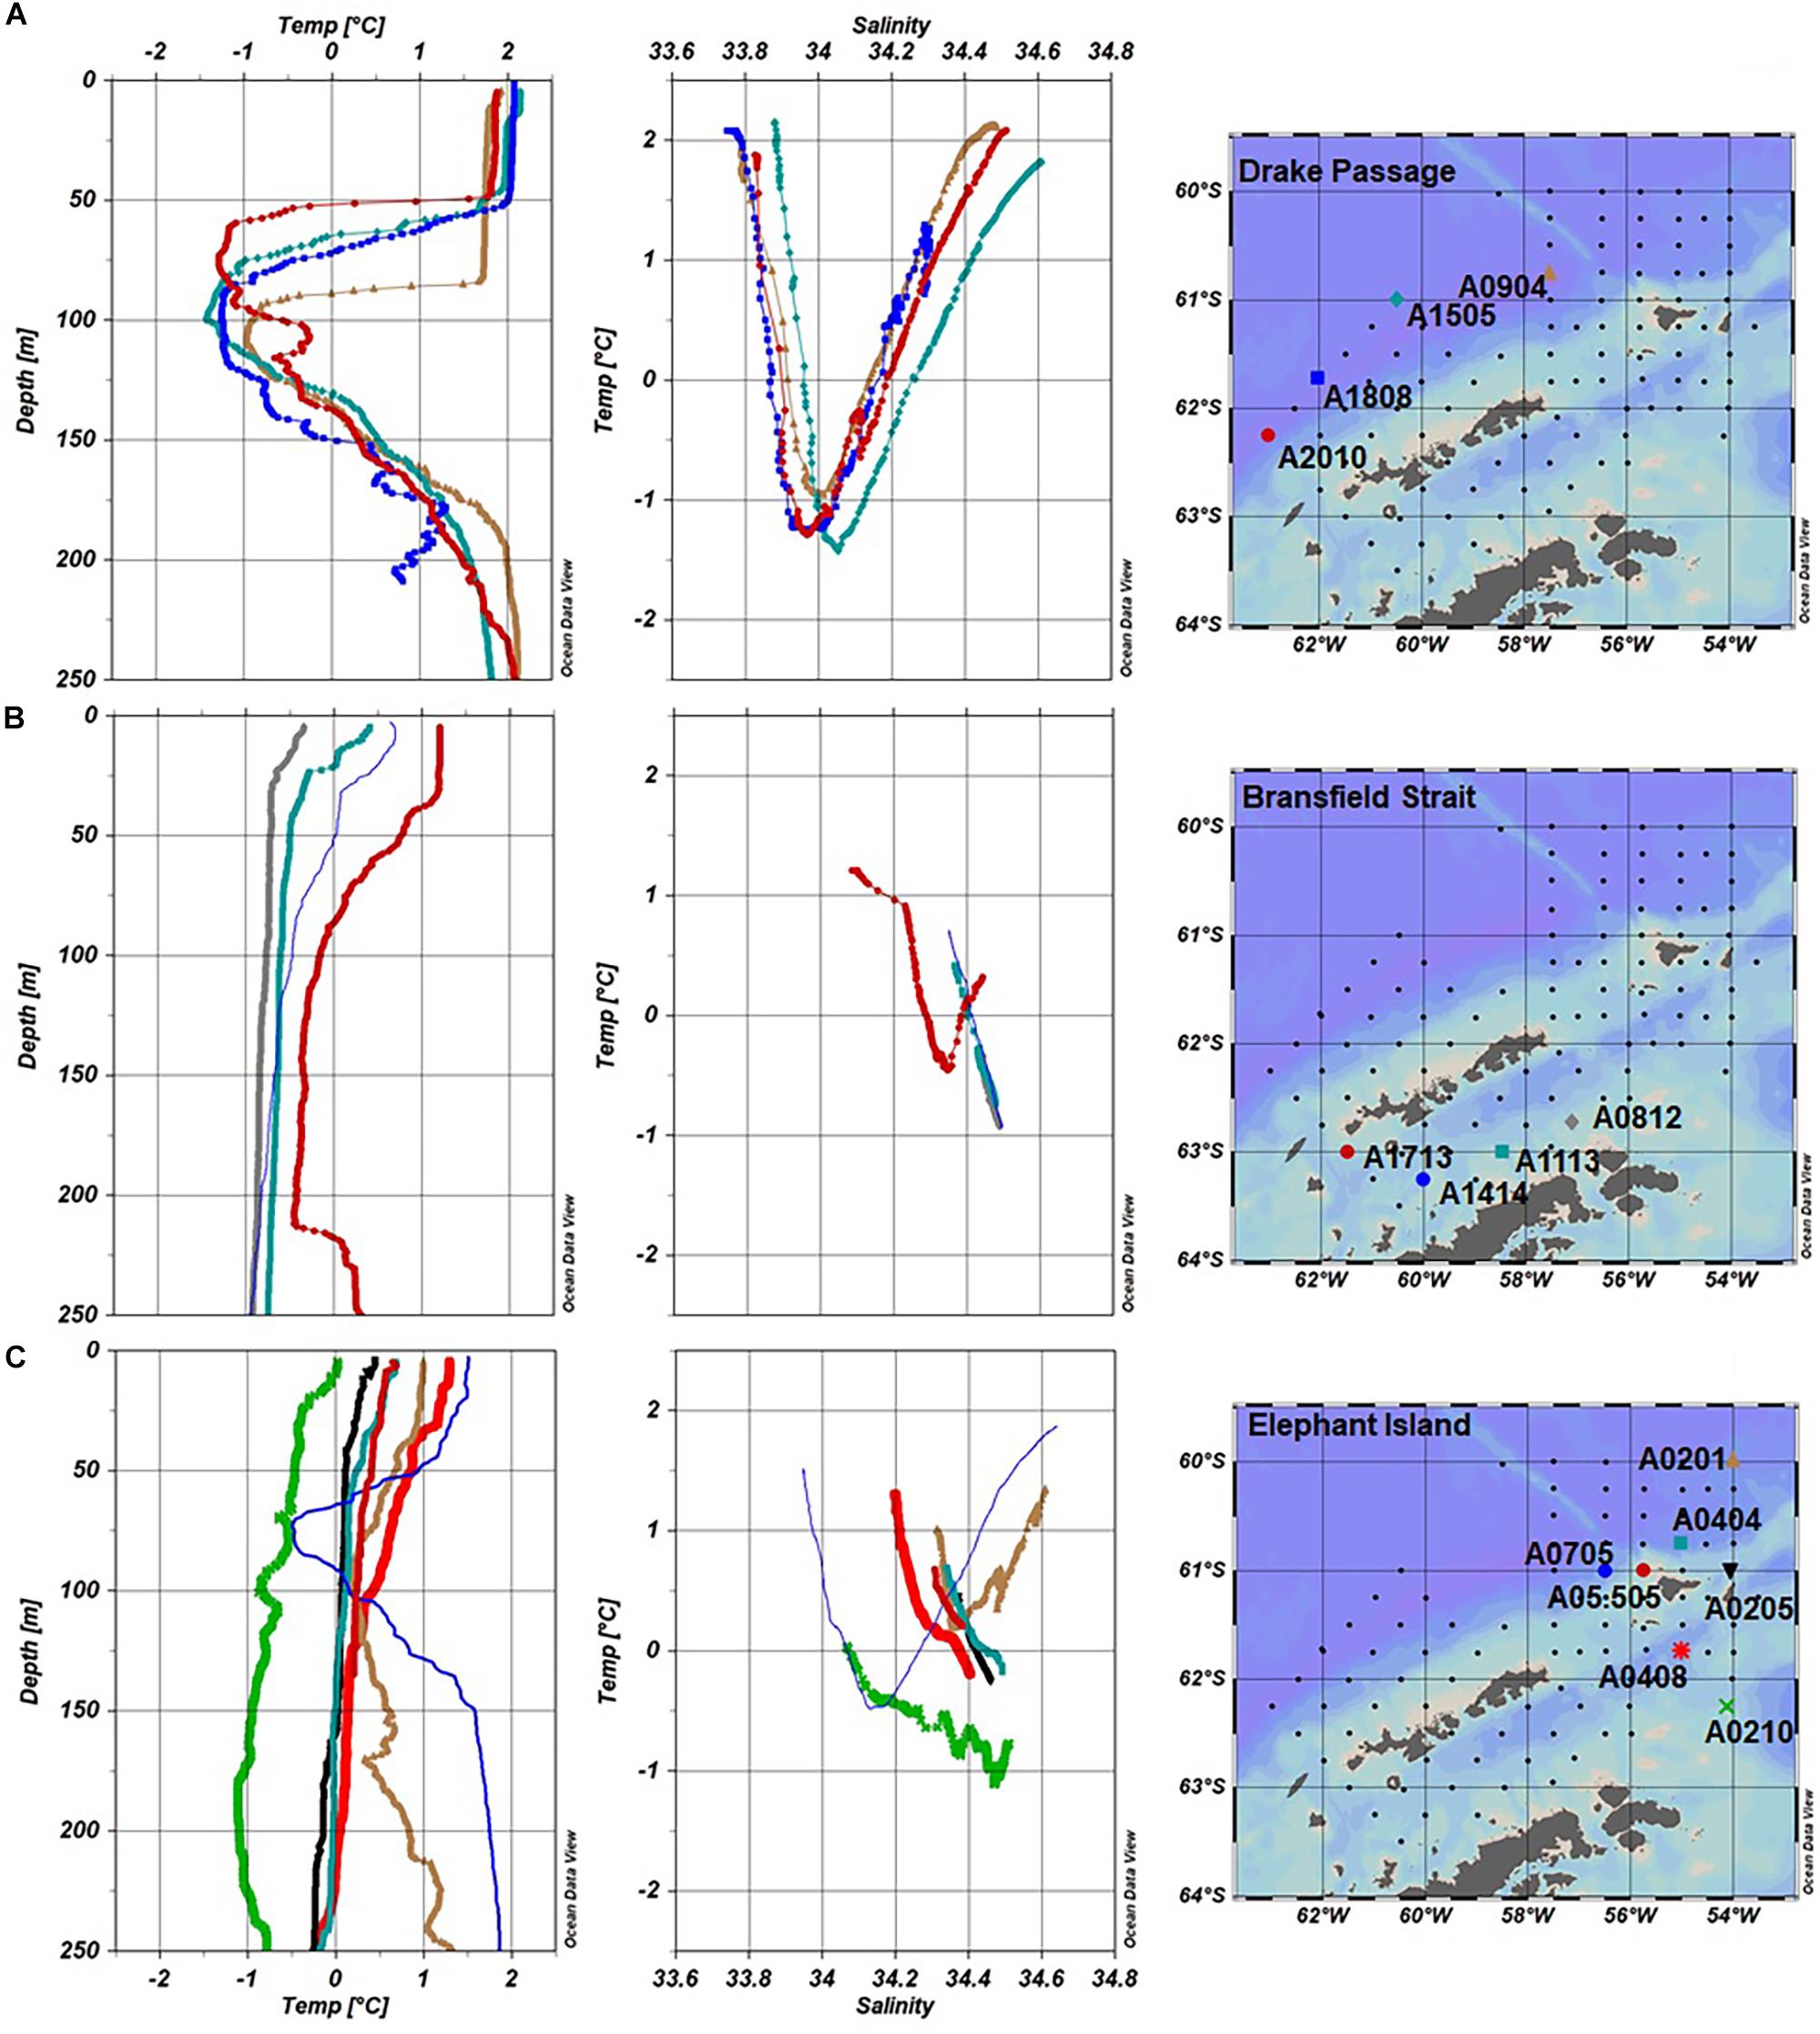
Figure 2. Water type (T/S profiles) and temperature depth profiles for Fe stations in the SSI 2007 divided in groups. (A) Drake Passage (A0904, A1505, A1808, and A2010), (B) Bransfield Strait (A0812, A1113, A1414, and A17-13), and (C) Elephant Island (EIe: A0201, A0205, A0404, A0210, and A0408; EIw: A05.505 and A0705).
Within the SOI sector (Figures 1, 5), the three main regions were also defined as: (1) the South Scotia Ridge (SSR) region, comprising deep stations on a west-to-east transect north of the SSR (60°N) and the Hesperides Trough; (2) the SOP region, including six stations, four stations were east of the SOI, several stations in relative shallow water, and one station located over the shelf break. Two additional stations were west of the SOI and nearer to shore in waters <350 m deep and were labeled SOIc; and (3) the third series of stations were sampled in the PB region, comprising three deep stations located southwest from the SOP shelf break, on a longitudinal transect (61°N) into the basin.
Dissolved Labile (DFe) and Total Acid Leachable Fe
Water samples were collected with acid-washed Teflon coated (5 L) GO-FLO bottles (General Oceanics) deployed on a polymer rope (New England ropes) and then taken into a built-in clean room to be processed under a Class-100 laminar flow hood. More details on the sampling can be found in Ardelan et al. (2010). Samples for total acid leachable Fe (TaLFe) determination were collected directly into acid-washed low-density PE bottles (1 L) without filtration. The dissolved labile Fe (DFe) fraction was defined operationally by the 0.2 μm nominal pore size, and was collected by filtering seawater through Sartorius filters (0.45 + 0.2 μm pore size filtration) by using acid-washed Tygon tubes. All samples for DFe and TaLFe were acidified (pH 1.7–1.8) with ∼14.7 M double quartz distilled HNO3 (UP HNO3), then transported, and stored at NTNU (>1 year) until analysis.
The laboratory work was carried out in a Class-1000 clean laboratory at the Department of Chemistry at NTNU, and the processing of the samples was performed under Class-100 laminar flow hood (AirClean-600 PCR Workstation). The pre-concentration, extraction, and analysis of DFe and TaLFe were following Ardelan et al. (2010). First, the Toyopearl AF-650 resin (Tosoh) with imminodiacetic acid functionality was carefully cleaned by repetitive washes with 3 M Supra Pure HCl (Fluka), and deionized water (DW, 18.4 mΩ). Before adding the resin slurry to the acidified sample (∼250 mL for coastal or ∼500 mL for oceanic), the sample pH was brought to 5.7–6.0 by addition of 5–6 mL 1.4 M ultra-pure ammonium acetate (UP NH4Ac.) buffer. The latter was prepared with SP NH4OH (Merck) and Ultra-Pure Glacial Acetic Acid (Fluka). An aliquot (0.4 mL) of the resin slurry (0.2–0.3 g dry weight) was added to the sample, and then, the sample was put on a shaker (∼70 r/min for 12–24 h at room temperature). Each sample was then poured into a PE funnel attached to an acid-washed Poly-prep chromatography column with a built-in PE frit (pore size 100–300 μm, Bio-Rad Laboratories) and allowed to run at a rate of ∼2 mL min–1. Afterward, the column was washed with 20 mL of DW and 10 mL 0.1 M UP NH4Ac solution to remove the residue of the seawater matrix. For the Fe extraction, 1 mL of 2 M UP HNO3 was added to the column and allowed to react for 10 min. The UP HNO3 extract in the column was then carefully transferred into an acid-washed 10 mL PE tube. The same procedure was repeated with 2.5 mL of 0.25 M UP HNO3 added to the column. The final volume (3.5 mL) represents a pre-concentration factor between 71 and 142 times.
Dissolved labile Fe and TaLFe were measured by using a high resolution inductive coupled plasma mass spectrometer (HR-ICP-MS) Element 2 (Thermo-Finnigan) with PFA-Schott type spray parameters were optimized daily at a medium resolution of r: 4000. The mass window was 100%. Flushing the sampler tube and sample loop was done with 0.6 M UP HNO3.
TaLFe to DFe Ratio and Other Fe Features by Region
The ratio between TaLFe and DFe fractions (TaLFe:DFe) was used to examine the potential Fe sources (e.g., upwelling or horizontal advection). This ratio varies in relation to the distance from shore and the depth of the water column. Because the particulate Fe fraction decreases exponentially with distance from the coast (Ardelan et al., 2010), decreasing ratios provide an idea of the relative strength of local and remote Fe inputs for specific areas. These ratios and other Fe descriptive statistics for each region within the SSI and the SOI are presented in Table 2.
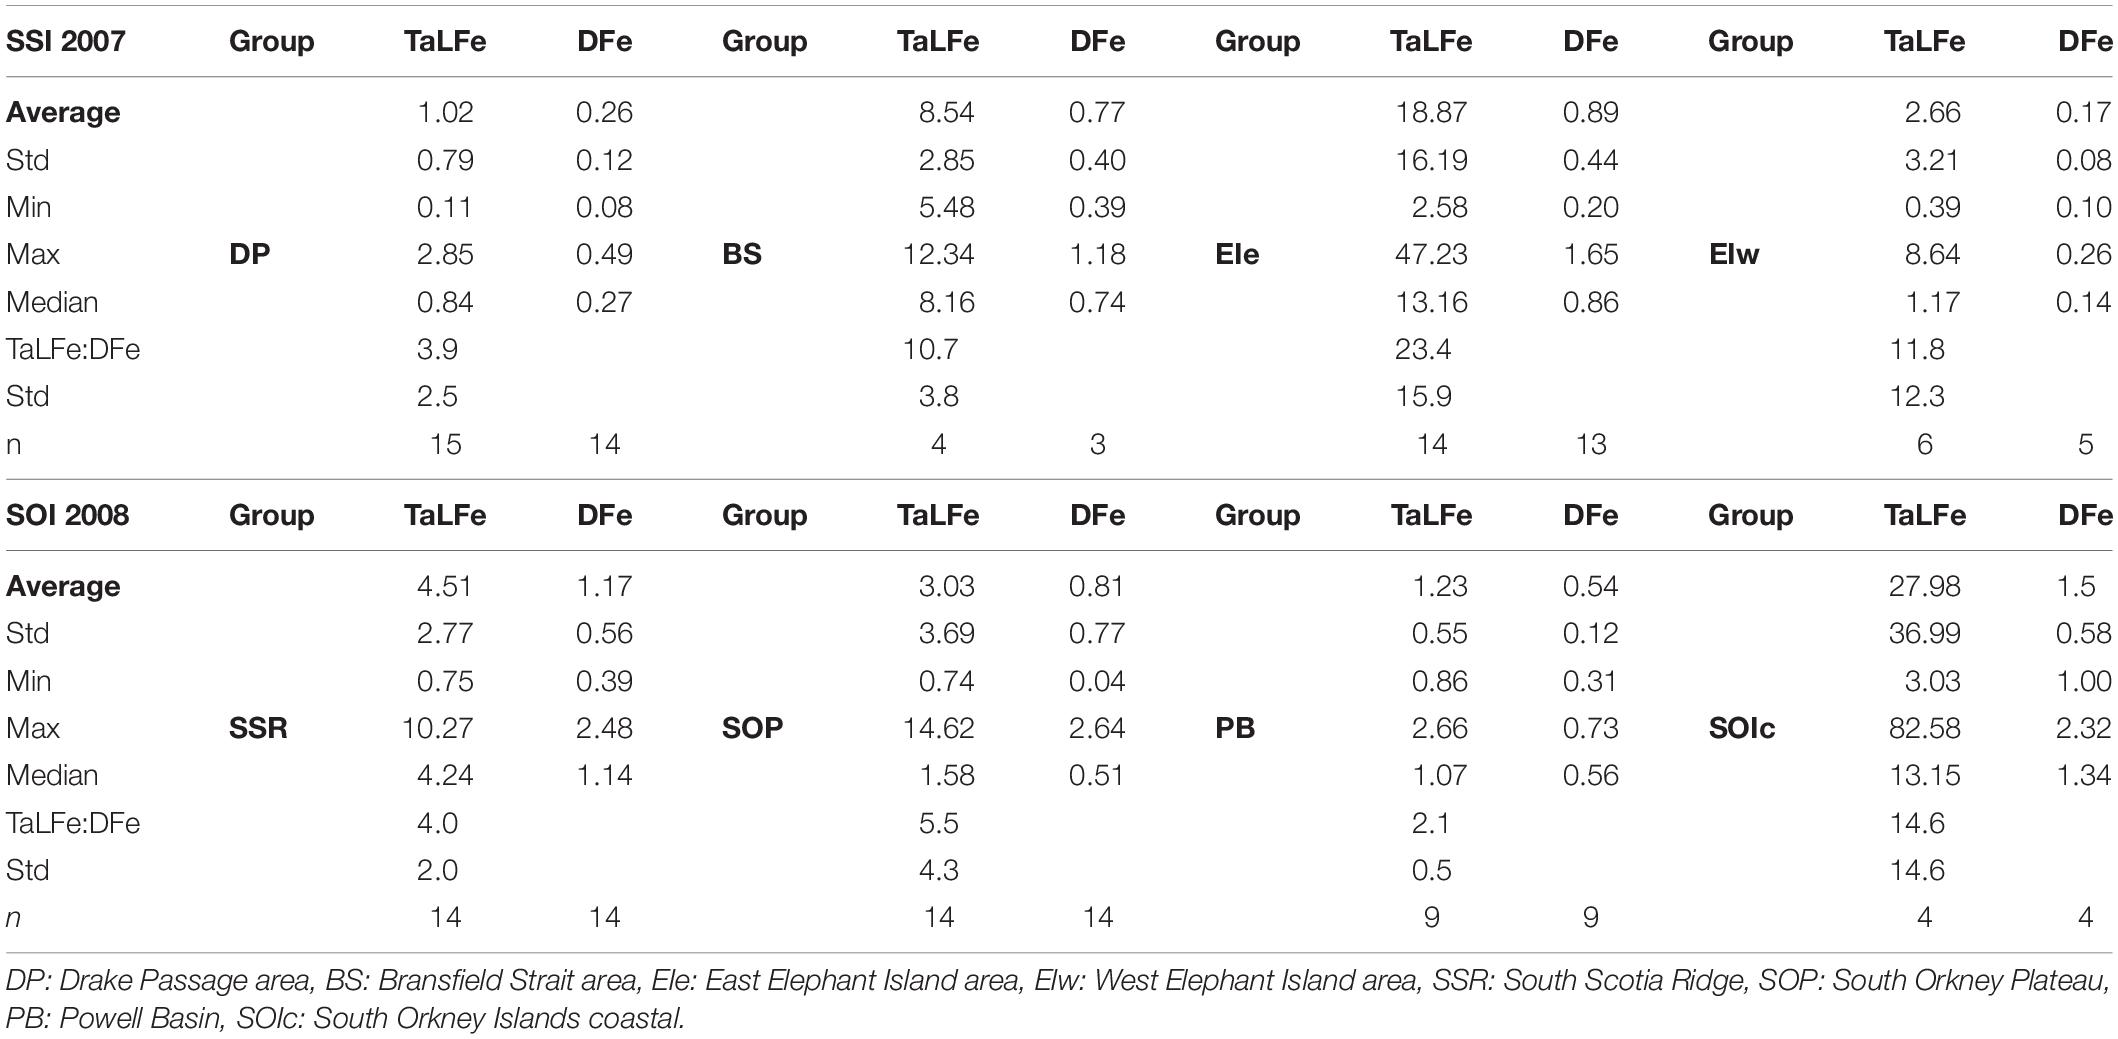
Table 2. Descriptive statistics and TaLFe to DFe ratio for all the groups of stations within the SSI and SOI. Concentration in nM.
Procedural Blanks and Fe Detection Limits
Table 3 shows the accuracy and the precision of the method for Fe determination, performed by using a certified reference material from the National Research Council of Canada (NASS-6) and the reference sample SAFe-D2 with consensus values (Johnson et al., 2007). The data reported in this paper represent total concentrations of dissolved Fe and the acid-leachable (pH ∼1.8) fraction of the total Fe.
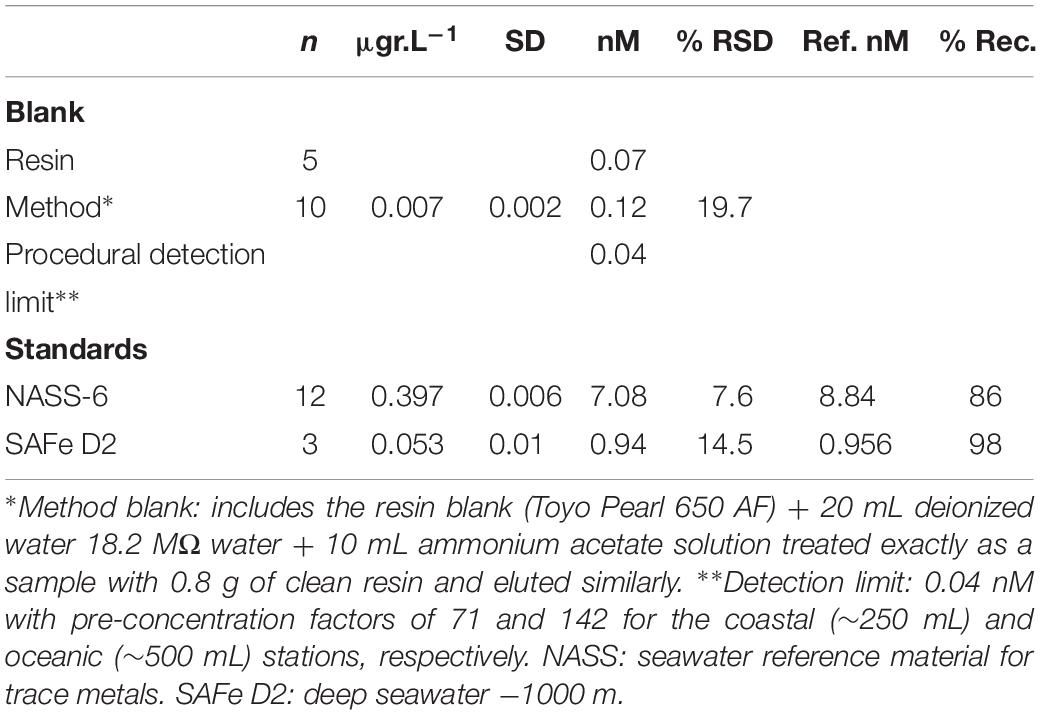
Table 3. Blanks and standard values.
Results
Hydrography, DFe, and TaLFe in the Upper Water Column in the SSI in 2007
Waters in the DP region exhibited the highest mean temperature at surface (∼2°C), and a minimum (−1°C) at ∼100 m (Figure 2A). Chl-a concentrations were low (< 0.3 mg m–3) and were not correlated with neither salinity nor macronutrients. In contrast, the macronutrient concentrations and the salinity followed the same trend (Figures 3A,C). These conditions reflect the influence of ACC waters (WZ-1) evident in a stratified profile (pycnocline between 50 and 100 m) due to the presence of warmer Antarctic Surface Water above the remnant of cold winter water. Stations in this group located off the continental shelf had the lowest concentrations for DFe (0.26 ± 0.12 nM) and TaLFe (1.02 ± 0.79 nM), and concentrations generally increased with depth and with increasing salinity (Figures 3D–I). The TaLFe:DFe in this group was the lowest (3.9 ± 2.5) in the SSI, and together with the low concentrations, showed the low inputs from coastal areas characteristic of the ACC waters (Figure 4A).
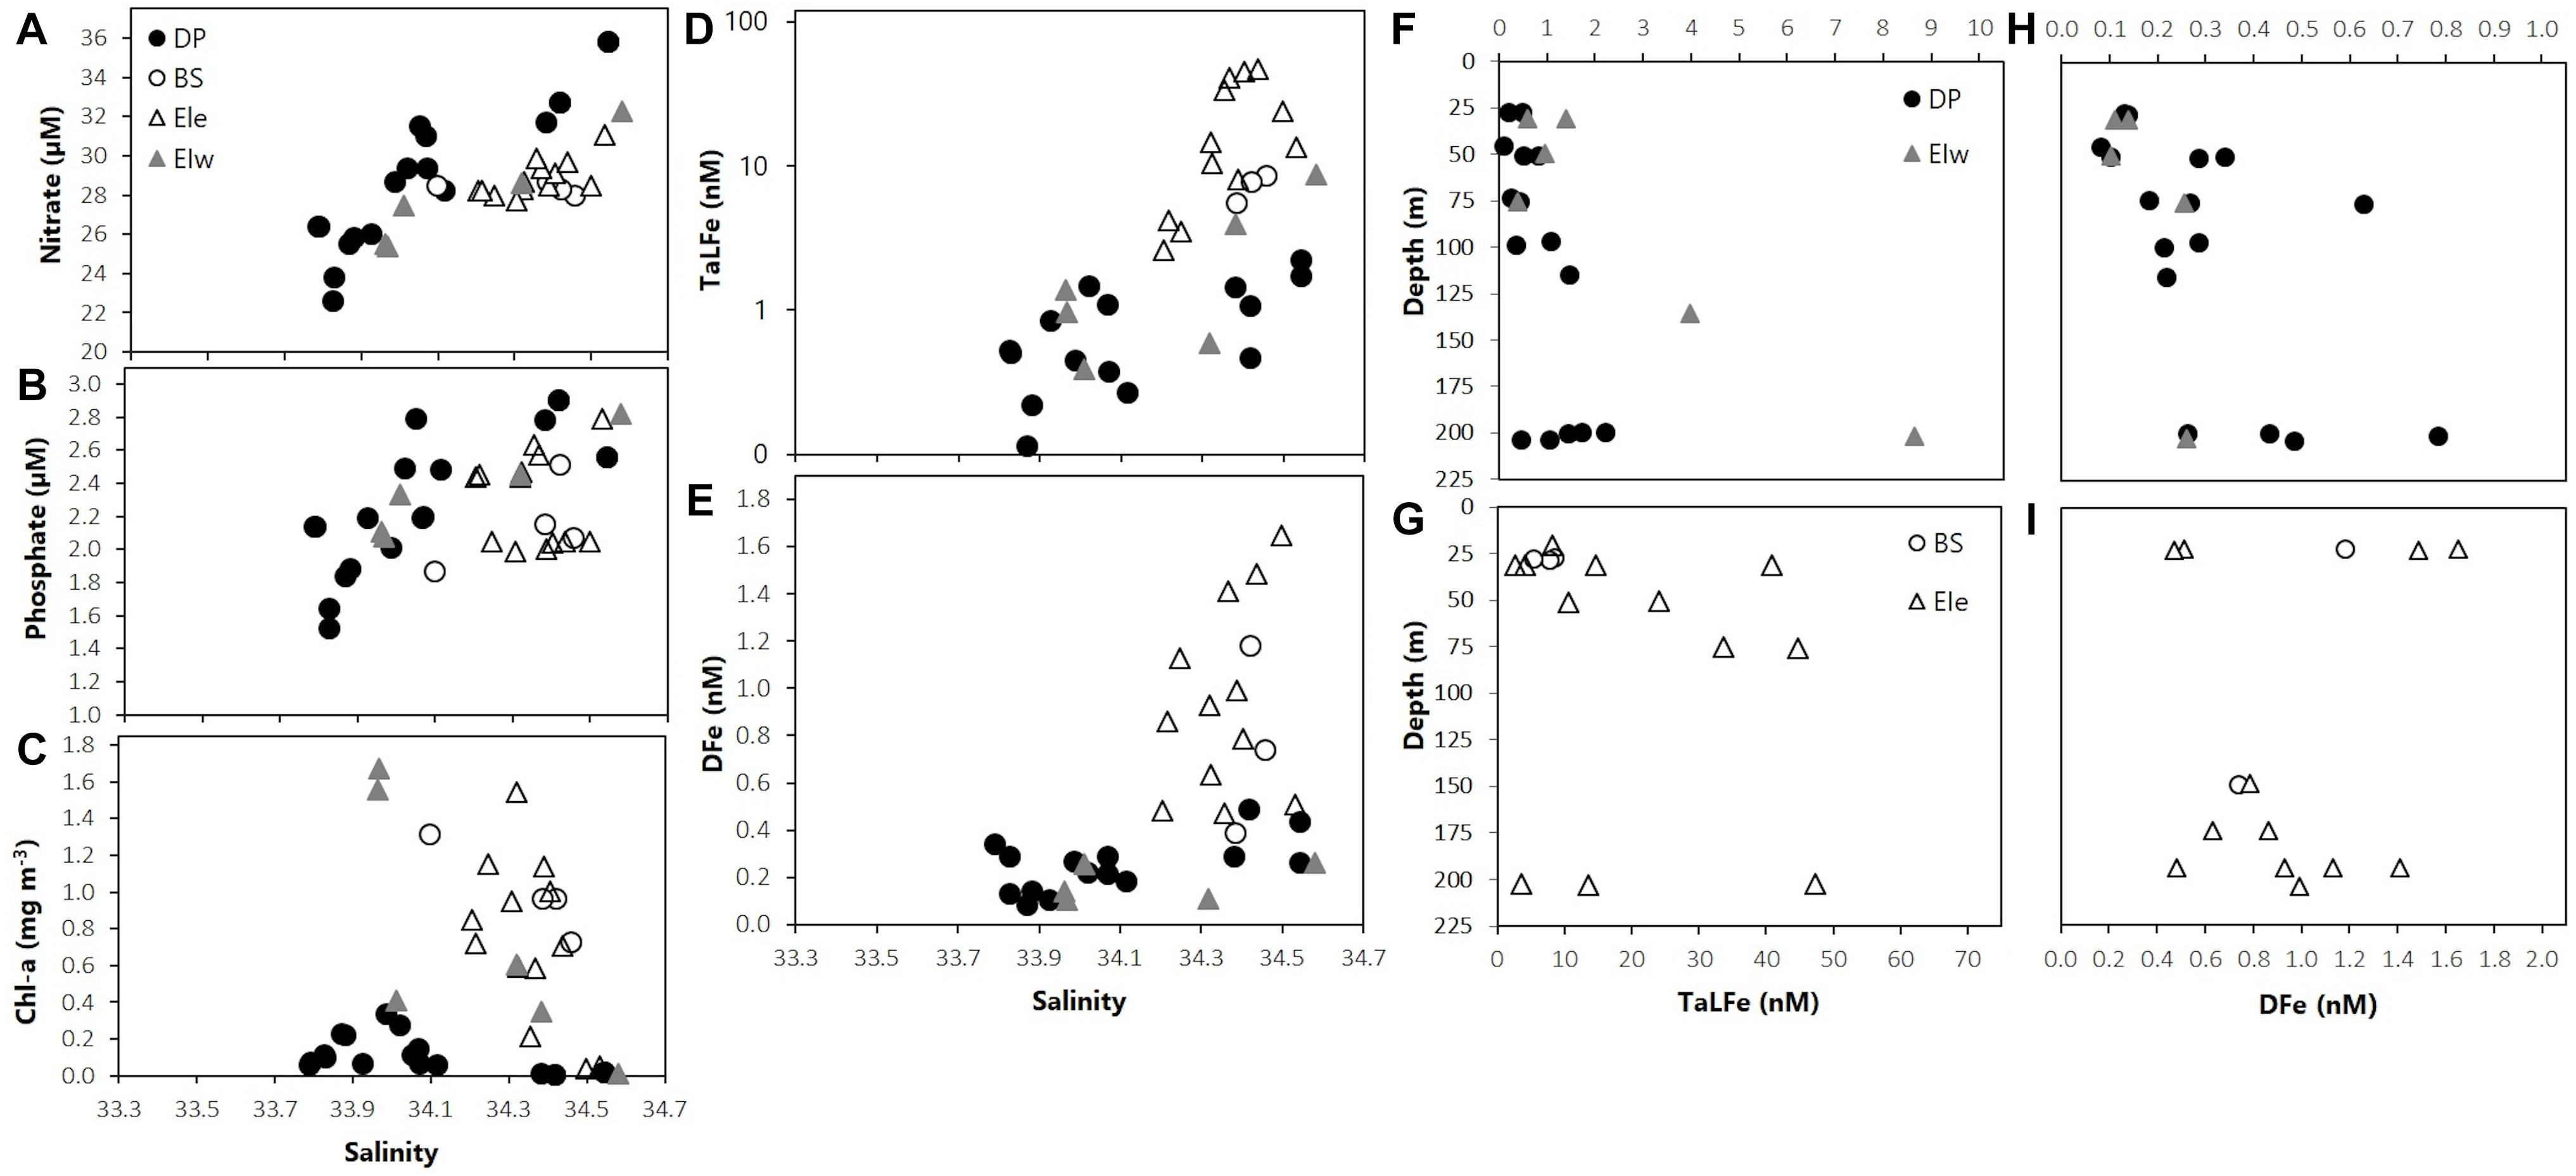
Figure 3. (A) Nitrate (μM), (B) phosphate (μM), (C) Chl-a (mg m–3), (D) TaLFe (nM), and (E) DFe (nM) distribution in relation to salinity; (F,G) TaLFe (nM) and (H,I) DFe (nM) distribution in relation to depth (m) for all groups of stations in the SSI 2007. Note logarithmic scale for panel (D). DP, Drake Passage area; BS, Bransfield Strait area; EIe, East Elephant Island area; EIw, West Elephant Island area.
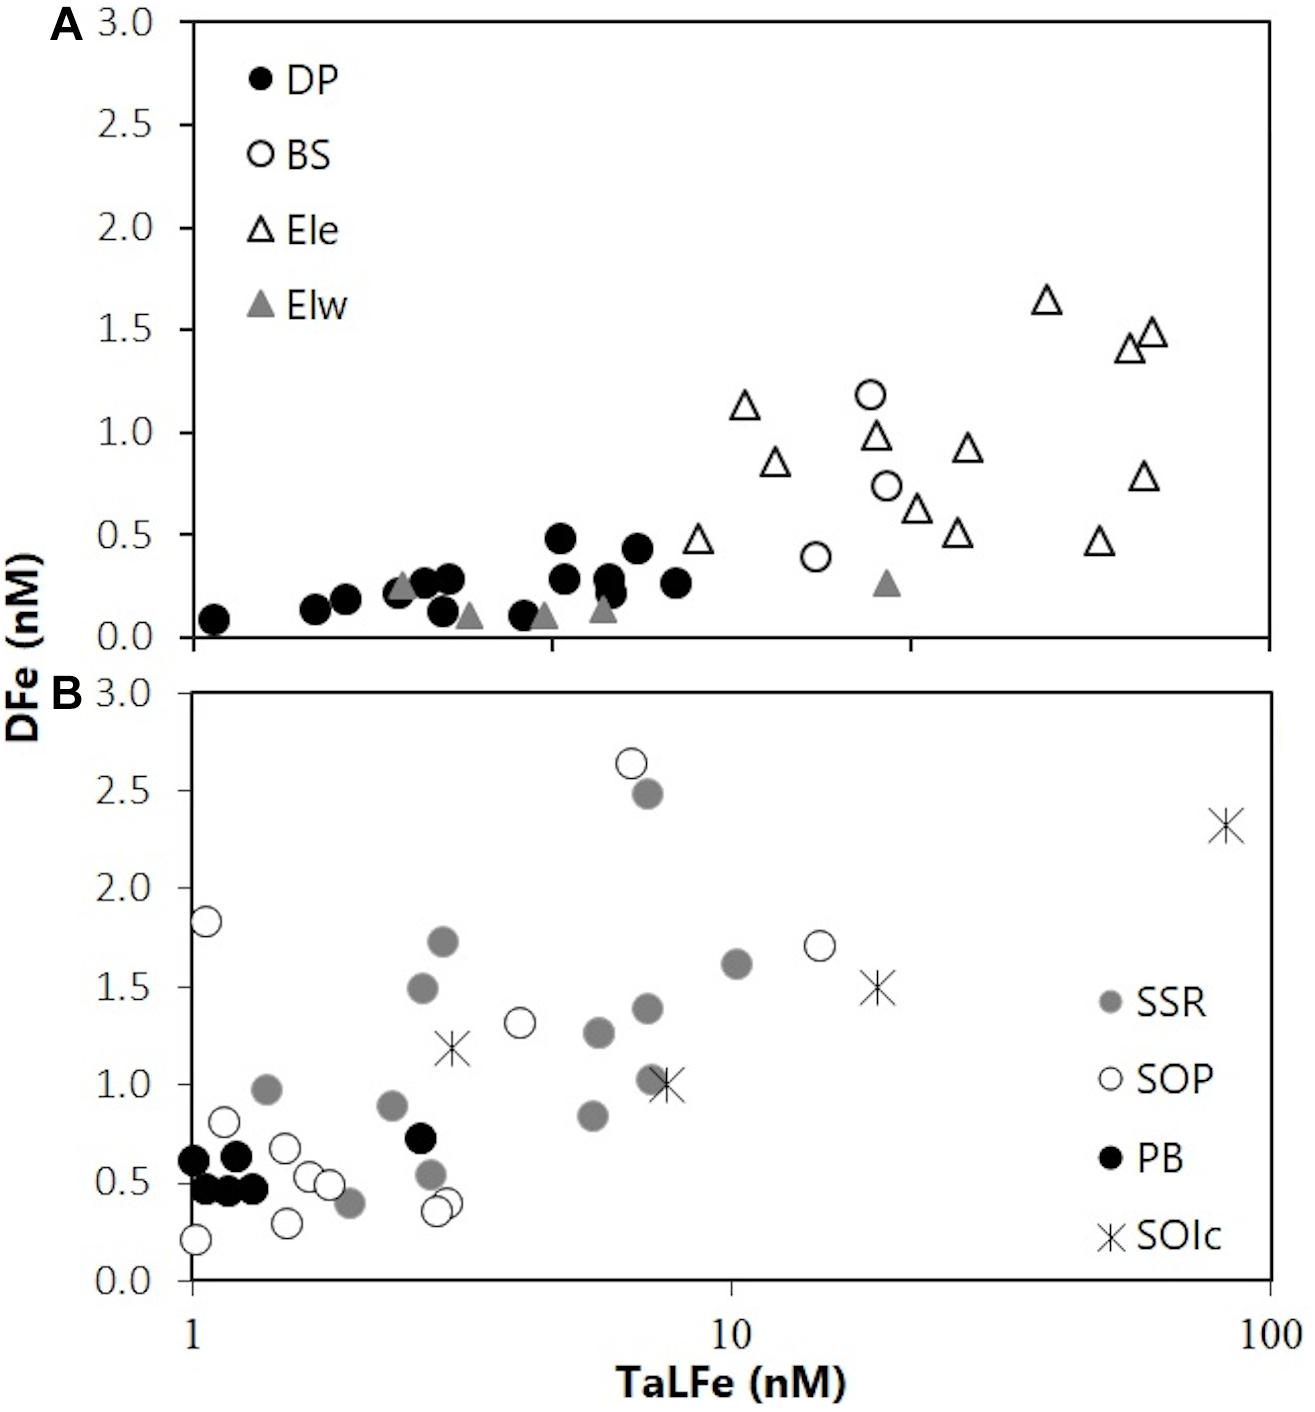
Figure 4. TaLFe:DFe ratio for all groups of stations in (A) the SSI 2007 and (B) the SOI 2008 (note logarithmic scale).
The BS waters had intermediate concentrations of nitrate and phosphate associated with both relatively high salinities and high Chl-a values (Figure 3). These BS waters had intermediate-to-high DFe and TaLFe concentrations ranging from 0.39 to 1.18 nM, and from 5.48 to 12.34 nM, respectively. However, the number of stations samples in this region was too low to allow for any further analysis.
The stations around the EI region exhibited complex hydrographic properties within the upper 250 m (Figure 2C). Waters temperatures ranged from a surface maximum of 0°C to a deep minimum of −1°C (200 m) in EIe, to waters with ACC influence (WZ-1) in EIw, showing the effect of the distinct water masses in the region. The trend observed between the macronutrient concentrations and salinity was more evident for EIw, whereas for EIe, these parameters were clustered in a narrow range at higher salinities (Figures 3A–C). Remarkably, the station A0705 in EIw, presented the two highest Chl-a values (25 and 50 m) within the SSI sector (Figure 3C). However, when integrated to UML, the stations in EIe presented the highest Chl-a within the SSI sector (Table 1). Overall, in all EI region, DFe and TaLFe concentrations increased with depth, although in different magnitudes (Figures 3F–I). Stations in EIw presented both very low DFe (0.02–0.19 nM) and TaLFe (0.59–3.97 nM) concentrations (Figures 3D,E). This group included station A05.505, the shallowest (141 m) and nearest to shore (∼30 km), but with very low TaLFe values despite its shallow depth and proximity to shore. A0705 located over the shelf break (∼2135 m) can be compared (similar distance to shore) with A0404 (EIe), also over the shelf break. Regarding TaLFe concentrations at 30 m, the latter had a more than one order of magnitude higher concentration (40.71 nM) than that in A0705 (Figure 3G). EIe presented the highest TaLFe and among the highest DFe concentrations (Figures 3D,E). The TaLFe:DFe for EIw showed a trend similar to that in DP, whereas the values in EIe showed a high dispersion, indicative of decoupling of TaLFe and DFe inputs, signaling the WSSW intrusion (Figure 4A).
Hydrography, DFe, and TaLFe in the Upper Water Column in the SOI in 2008
The stations occupied in the SOI sector presented a more uniform picture in the hydrography compared to that in the SSI sector. This was due primarily to the influence of the Weddell Sea outflow which determined a general mixed transition water type (WZ-3). Overall, these stations presented lower salinities at the surface and some evidence of a temperature minimum between 50 and 150 m (Figure 5). The nitrate distribution for all stations in the SOI showed a positive trend related to salinity, but the trend observed between phosphate and salinity was less clear (Figures 6A,B). Despite the more homogenous hydrographic conditions in the SOI sector, the Chl-a distribution patterns differed significantly. The SSR group, with the deepest stations, presented the highest Chl-a values decreasing from west to east. In the SOP group, despite having shallower stations than those in the SSR, intermediate-to-low concentrations of Chl-a were observed. Finally, contrasting with the SSR transect to the north, the transect into PB had the lowest Chl-a values (Figure 6C).
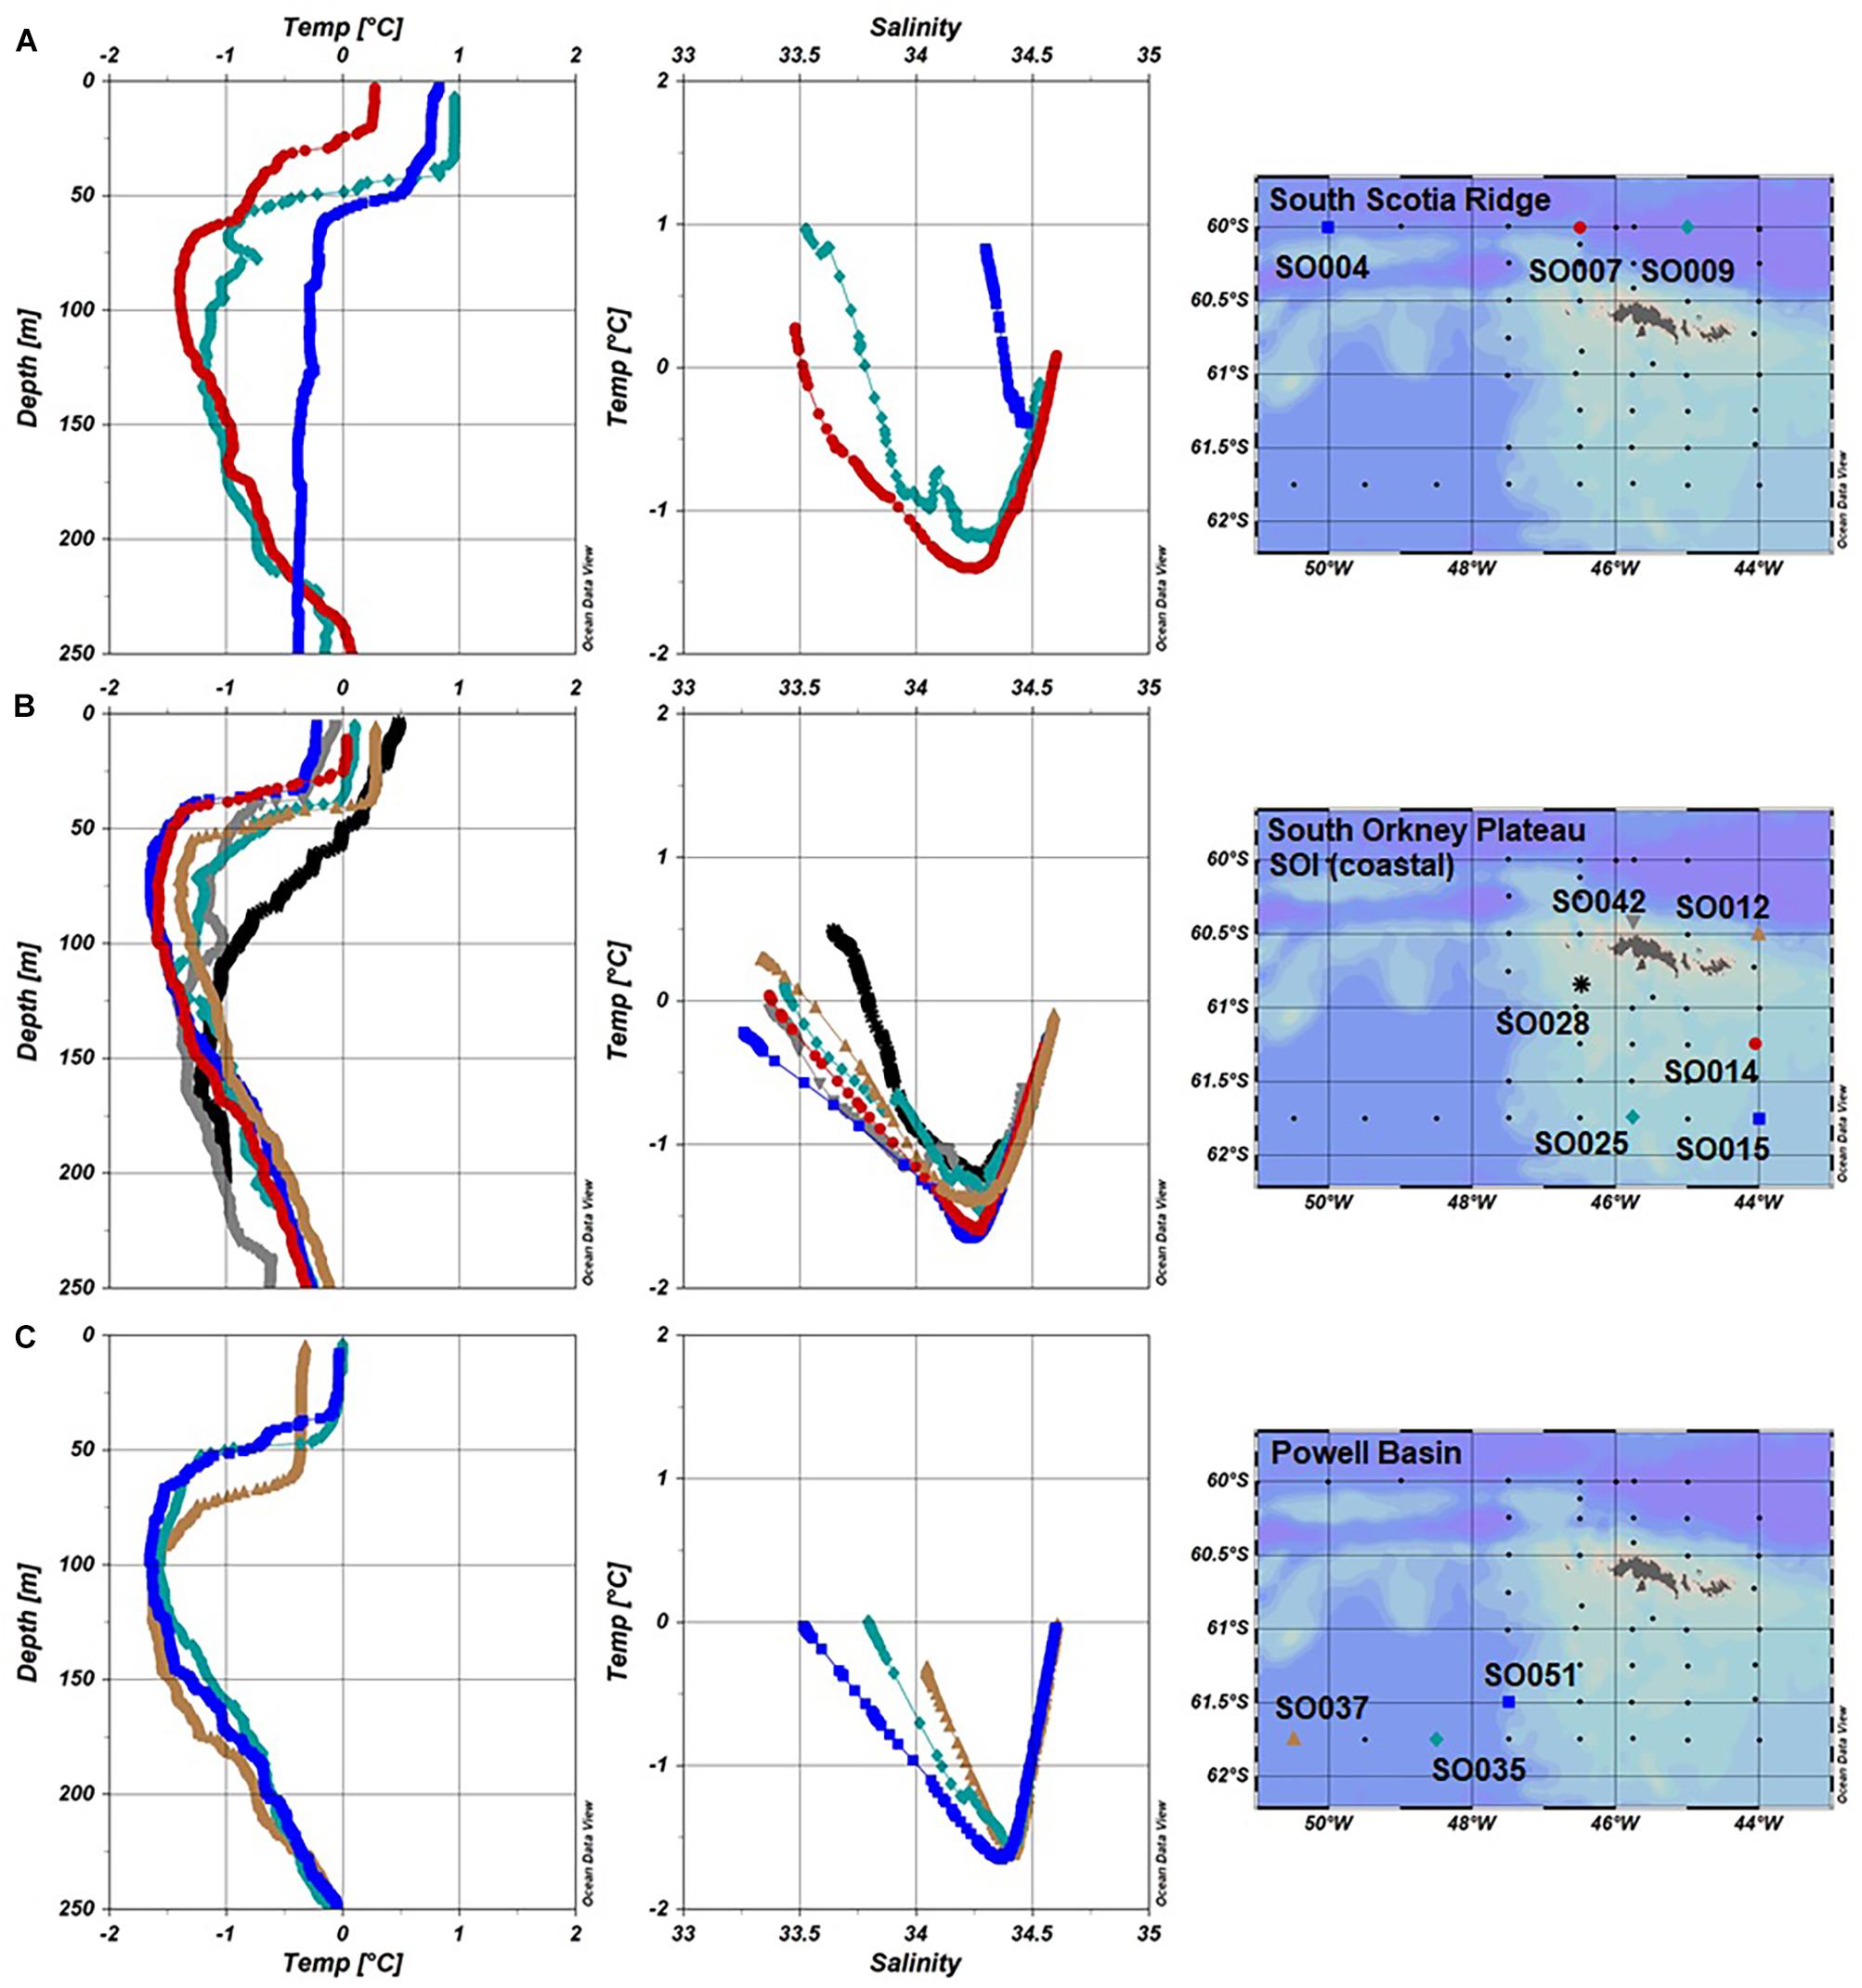
Figure 5. Water type (T/S profiles) and temperature depth profiles for Fe stations in the SOI 2008 divided in groups. (A) South Scotia Ridge (SO004, SO007, and SO009), (B) South Orkney Plateau (SO012, SO0014, SO015, and SO025), and (C) Powell Basin (SO035, SO037, and SO051) and South Orkney Islands-Coastal (SO028 and SO042).
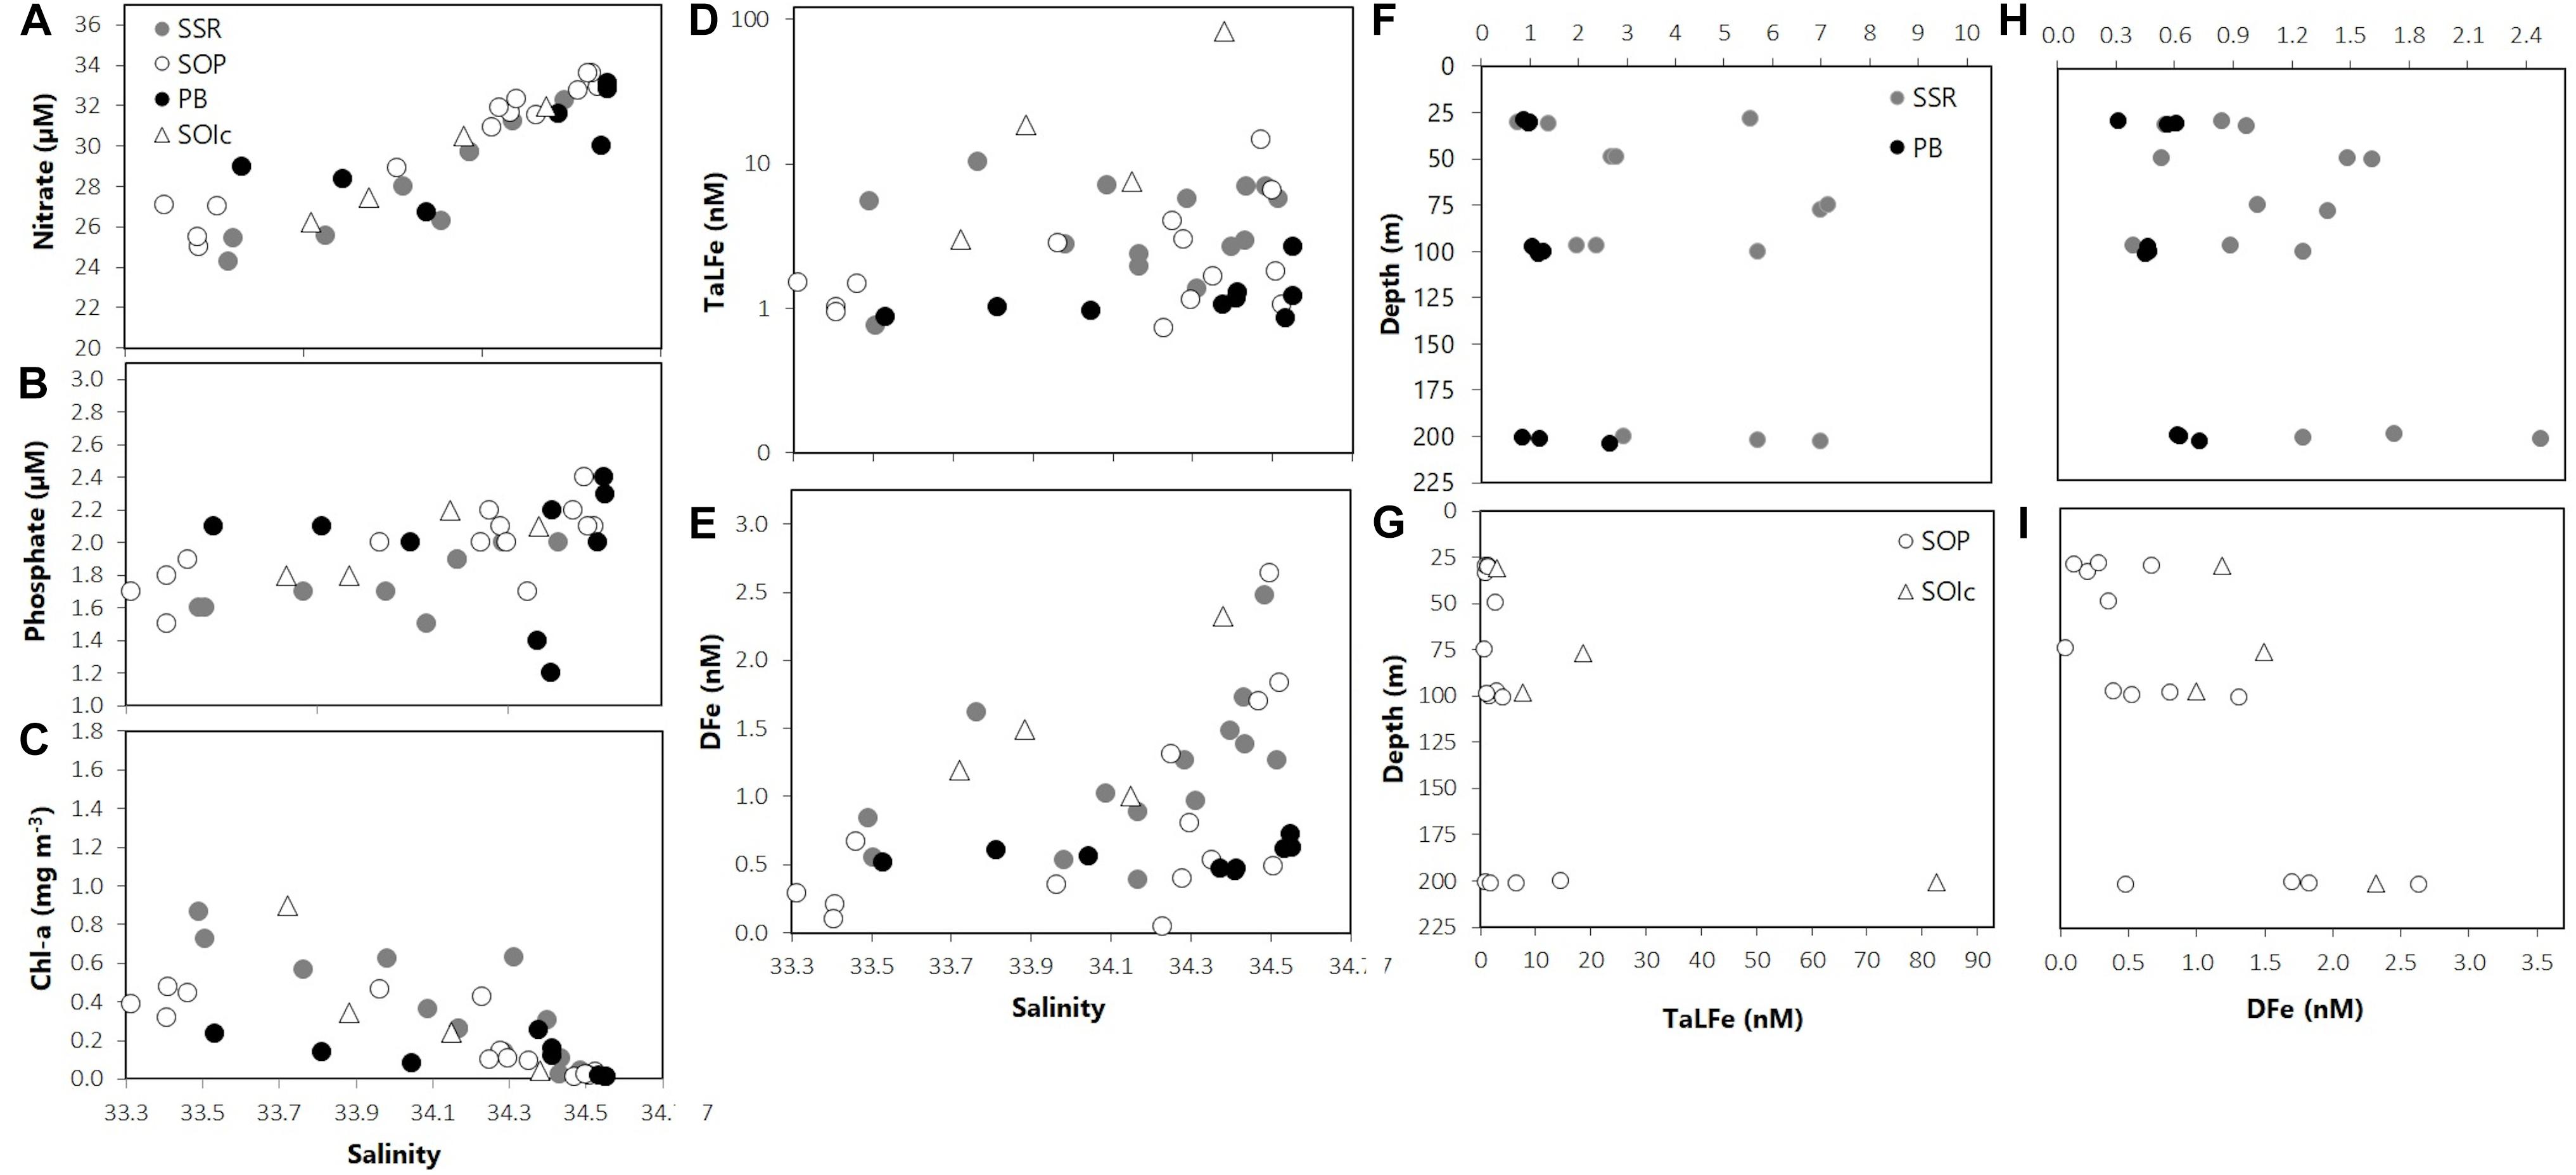
Figure 6. (A) Nitrate (μM), (B) phosphate (μM), (C) Chl-a (mg m–3), (D) TaLFe (nM), and (E) DFe (nM) distribution in relation to salinity; (F,G) TaLFe (nM) and (H,I) DFe (nM) distribution in relation to depth (m) for all groups of stations in the SOI 2008. Note logarithmic scale for D. SSR: South Scotia Ridge, SOP: South Orkney Plateau, PB: Powell Basin, SOIc: South Orkney Islands coastal.
Overall, the DFe and TaLFe distribution patterns within the stations occupied in the SOI sector, followed those of Chl-a. This was expressed in a positive correlation between the mean DFe and the mean Chl-a within the UML (Figure 7). For the stations located off the continental shelf and over the SSR, DFe and TaLFe distributions were the highest. The SOP group presented intermediate values, and the stations in PB presented the lowest values (Figures 6D,E). Similar to the SSI, overall DFe and TaLFe concentrations increased with depth (Figures 6F–I). Because of the proximity to shore, DFe and TaLFe values for the SOIc stations were not within this distribution pattern particularly for the high TaLFe concentration. In this area, the highest TaLFe (82.6 nM) was observed just above the sea bottom (213 m) at station SO028, showing the influence from sediment resuspension. Except for this value, TaLFe concentrations in the SOI were lower and within a narrower range compared to those in the SSI (Figure 4B). If also excluding the SOIc, the TaLFe:DFe ratios in the SOI were lower than in the SSI, of which the one in PB was the lowest of the entire survey area. The highest observed ratios in the SOI (SSR and SOP) were only ∼27% higher than the lowest SSI ratio in DP (Table 2).
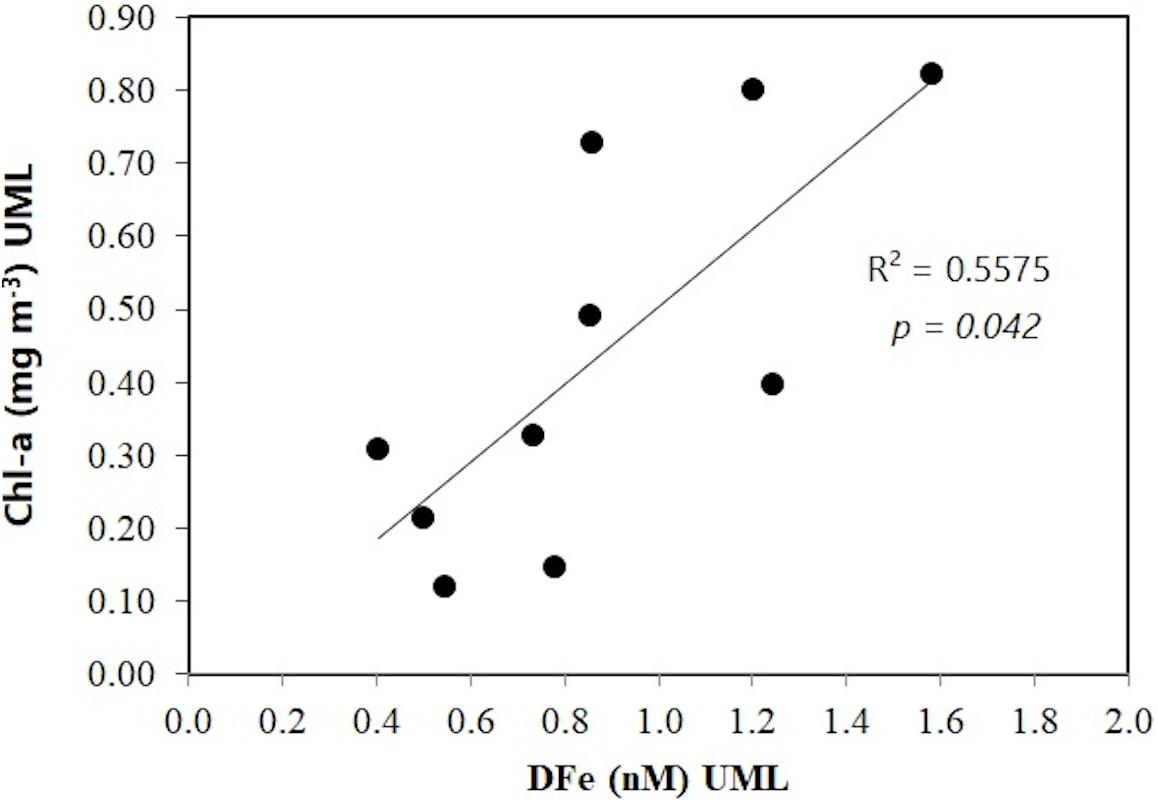
Figure 7. Mean Chl-a (mg m–3) in the UML relative to mean DFe (nM) in the UML in the SOI sector. SOI-coastal stations are not included.
Discussion
Bio-Oceanographic Conditions in the SSI and the SOI During 2007 and 2008
Contrary to the overall lack of long-term Fe data, the bio-oceanographic conditions in the waters around EI and the SSI have been widely studied during the austral summer period for more than two decades (Holm-Hansen et al., 1997; Hewes et al., 2009; Reiss et al., 2009). Records for previous years showed that the bio-oceanographic conditions in 2007 in this region were close to average (Lipsky, 2007). DP waters, known to be Fe limited (Martin et al., 1990), had the lowest Chl-a concentrations, whereas the highest Chl-a values were found over or close to the continental shelves. Contrastingly, the physical water properties and the high phytoplankton biomasses reached in 2006 were considered exceptional, whereas certain areas in the SSI exhibited significantly lower Chl-a values during 2008 (Van Cise, 2008). These differences between consecutive years, which highlight the variability observed in the region, can be partially attributed to changes in the Weddell Sea outflow (Lipsky, 2007; Van Cise, 2008; Jiang et al., 2013). Variations such as the intrusion of the WSSW in the SSI can lead to changes in the depth of the UML as well as in the inputs of nutrients such as Fe, which are crucial factors determining fluctuations in productivity (Hewes et al., 2008, 2009), therefore having a significant impact in the entire WSC region.
East of the AP, the hydrographic conditions around the SOI are mainly determined by the outflow from the Weddell Sea (Fahrbach et al., 1995), with less influence from the ACC. This is evident northwest of the SOI sector (Figure 5A), where the water profiles (WZ-5) represented the major influence of the Weddell Sea water (Heywood et al., 2004). Notwithstanding, the circulation patterns in these transition zones between the different basins in the region are still complex (Figure 1). These water masses are influenced by a rough topography, which determines their pathways within the WSC in the vicinity of the AP (Von Gyldenfeldt et al., 2002; Heywood et al., 2004; Thompson and Heywood, 2008; Thompson et al., 2009). Variations in the flows of the different water masses are likely to influence the physical forcing in the water column as well the nutrient inputs. The variability in this region can be highlighted in the bio-oceanographic conditions, such as the phytoplankton abundance and distribution around the SOI in 2008, which were vastly different from previous surveys in relation to the hydrographic conditions (Van Cise, 2008).
Fe Distribution West of the Weddell Water Outflow (SSI Area)
On the basis of the flow patterns of ACC waters from the west and the Weddell Sea waters to the southeast of the AP, a simplified Fe-distribution scheme has been established for this area (Holm-Hansen and Hewes, 2004; Hewes et al., 2008, 2009; Ardelan et al., 2010). In this scheme, the Fe concentration and distribution reflect the effect of the general circulation pattern in the region resulting from the interaction of these the two major waters sources. The results presented here increase the data resolution and support the conclusions of previous studies focusing on the Fe supply dynamics of the EI region (Ardelan et al., 2010; Frants et al., 2013; Jiang et al., 2013; Measures et al., 2013). Besides the interaction of the water masses, the influence of the STR is considered a key factor in the differences observed in the waters west and east of EI (Holm-Hansen et al., 2004b; Kahru et al., 2007; Hewes et al., 2008; Measures et al., 2013). The main effects of these combined factors are twofold: (1) the Shackleton Gap, south of the STR, constrains and accelerates the eastward flow of a branch of the ACC causing off-shelf transport into the Ona Basin (Zhou et al., 2010) and (2) the WSSW influence on waters east of the STR, sets up a general counter-clockwise circulation around EI (Hewes et al., 2009), which together with complex jet-eddy systems, promotes westward transport of waters past the STR (Zhou et al., 2010).
The Fe distribution in EIw showed marked differences compared to that of EIe (Figures 3D,E), and corresponded with the west–east increasing gradient in DFe concentrations found by Measures et al. (2013). The low TaLFe and associated lowest TaLFe:DFe of the SSI sector at the shallowest station (A05.505) in EIw provides additional indirect evidence for the relevance of the STR in affecting the Fe distribution downstream of the STR. This implies that the effect on the TaLFe concentrations (through upwelling over shallow topography and sediment resuspension) of the ACC on the west margin of EI has less influence on the Fe distribution compared to the effect of the STR as observed downstream and the horizontal intrusion of WSSW in EIe.
The Fe vertical distribution found in station A0705 (EIw), with higher (∼28%) DFe and TaLFe concentrations at 25 m than at 50 m (Figures 3F,H), together with the high Chl-a concentrations (see section “Fe Supply in Relation to Nutrients, Chl-a, and the UML”), suggest of the counter-clockwise circulation effect around EI. This implies a westward transport of Fe-enriched surface waters and with higher Chl-a concentrations, found in EIe, into the Fe-poor and low Chl-a biomass DP waters in EIw. This can be observed in the T/S profile for A0705 (Figure 2C), which despite matching the pattern of the ACC Fe-poor waters (Holm-Hansen et al., 2005; Hopkinson et al., 2007; Ardelan et al., 2010), this station had among the highest Chl-a (integrated in UML) concentration (Table 1).
Fe Distribution East of the Weddell Water Outflow (SOI Area)
The most prominent feature in the SOI sector was the contrasting Fe concentrations found north in the SSR compared with those south in PB. The SSR and PB transects were ∼195 km apart and presented similar bathymetry (∼3500–5000 m). When considering that both the SSR and PB groups corresponded to deep stations, the additional contrasting TaLFe:DFe found in the upper water column may be indicative of a different water source, each type with a different degree of sediment input through the contact time with coastal sediments.
Advection of shelf waters (WSSW) is among the physical processes that contribute to the significantly different water mass properties in the WSC compared with those of the adjacent water masses (Gordon and Nowlin, 1978; Whitworth et al., 1994). It is in this region that cross-frontal and cross-shelf processes involving eddies and isopycnal mixing become relevant for the lateral transport of biota and nutrients such as Fe to open ocean waters (Kahru et al., 2007; Heywood et al., 2014). Within the WSSW, these processes involve mainly the Antarctic Coastal Current (CC) and the Antarctic Slope Front (ASF). The former flows over the continental shelf and is deflected westward into the BS, whereas the latter flows between the 1000 and 1600 m isobaths east into the SSR and PB (Heywood et al., 2004). It is proposed that the ASF splits in two, the shallower portion crossing over the SSR following a topographically complicated route out through the WSC into the ACC, and the other portion composed of deeper waters that will form the Weddell Front (WF) flowing into PB (Heywood et al., 2004). Because of the weak stratification in this region, it is proposed that the depth-averaged circulation is similar to the surface circulation determined by drifter studies (Thompson et al., 2009). On the basis of this proposed circulation, the ASF shallower waters, flowing through the SSR and then deflected eastward into the ACC, could influence Fe concentrations in the upper water column downstream north and northeast of the SOI sector. It is remarkable that the overall ASF path matches the west-east decreasing Fe-concentration gradient observed in the SSR transect in this study. Furthermore, the more turbulent path of the ASF followed along the complex topographic features such as the Hesperides Trough may increase the mixing and dynamic flow of the water masses and hence the possibility to hold more suspended material (Thompson et al., 2009). The latter would support the observed higher TaLFe:DFe values in the SSR. On the other hand, the ASF deeper waters that form the WF, and flow into PB, may exert no effect over the Fe concentrations in the upper water column in waters around PB. Additionally, slower drifter velocity measurements in PB, possibly reflecting weaker topographic forcing due to the greater depth of the water column (Thompson and Heywood, 2008), may further support the argument that the circulation dynamics of waters associated to the WF have no impact in the upper water column.
To our knowledge, there is not yet systematic deep Fe data for either PB or the SSR region that confirm the proposed mechanism for the Fe distribution patterns observed. Among the few data available, Klunder et al. (2014) found relatively high Fe concentrations (their stn 222: > 0.8 nM) over the continental shelf south west of PB, but even higher concentrations (their stn 226: > 1nM) between 600 and 1000 m depth, north of the SSR and east of Clarence Island (east of EI). These data confirm that concentrations are elevated in the shallow ASF component that influences the Fe concentration in the SSR region. The even higher concentrations north of the SSR indicate an enrichment after the SSR, in agreement with our proposed mechanism, but more detailed full water column data are needed to verify this. More recently, and on the basis of sparse empirical data, a model approach by Jiang et al. (2019) proposed that in the southern Scotia Sea, in the region between the SSI and the SOP, ∼70% of off-shelf Fe transport occurs below the surface mixed layer and is then re-supplied to the surface by vertical mixing. The model simulations consider up to 500 m depth, therefore showing that vertical mixing, indeed could be the mechanism to supply Fe from these depths to the upper water column via the ASF shallow component in the SSR.
Fe Variability, Sources, and Transport on the Weddell-Scotia Confluence
Because of its continuity to the Weddell Sea, the southern portion of the WSC has been surveyed more extensively for the distribution and concentrations of Fe and other important bioactive trace metals. Yet, the data resolution available in both the temporal (interannual to seasonal variability) and the spatial (vertical and horizontal distribution) scales falls short when it comes to the address the high variability observed in the region. This constrains the possibility to establish clear trends with the ample range of Fe concentrations found in the literature for the region. Among the factors adding variability are the following ones. (1) The direction of the transect or area covered; most surveys have been conducted north to south (Nolting et al., 1991; Loscher et al., 1997; Nielsdóttir et al., 2012) or in a transverse direction from the pack ice in the Weddell Sea to the open waters of the DP (Westerlund and Öhman, 1991; Sanudo-Wilhelmy et al., 2002; Lin et al., 2011; Klunder et al., 2014). (2) The period or season covered (Nolting et al., 1991; De Jong et al., 2012; Nielsdóttir et al., 2012): particularly, the spring versus summer periods, the former corresponding with the period of seasonal sea ice retreat, is likely to have a major impact on the relatively higher concentrations observed in spring (Nolting et al., 1991; De Jong et al., 2012), compared to summer concentrations observed in this study.
Waters in the WSC are subjected to the advance and retreat of the seasonal sea ice and icebergs, making these some of the import sources of Fe to the region on a seasonal basis. Although sea ice constitutes an important Fe source, its effect is more relevant during the spring period, whereas phytoplankton often can be limited at later stages (Alderkamp et al., 2015). It has been observed that phytoplankton can rapidly utilize the winter DFe stock, therefore causing Fe limitation at least on a seasonal basis in certain areas (Sedwick et al., 2011). In the case of icebergs, because of circulation patterns, drifting icebergs tend to converge in the west margin of the Weddell Sea to then be advected to the northeast toward PB and Scotia Sea (Schodlok et al., 2006). In PB, Lin et al. (2011) observed a weak correlation between lower surface salinities and higher DFe concentrations. The very low surface salinities observed in the SOI area suggest the effect of ice melt, and it can therefore be expected that surface concentrations of Fe could have been influenced by iceberg inputs. However, only two stations in PB presented higher surface DFe concentrations and only one station over the SOP had both higher surface DFe and TaLFe concentrations. The latter was among the stations with the lowest surface salinities, suggesting higher freshwater input from melting icebergs. Yet, the overall data showed no correlation between salinity and Fe concentration in the SOI sector. When considering that, within the upper water column, most DFe concentrations increased with depth and that the highest concentrations were found north of the SSR farther from the icebergs route, it may be suggested that Fe input from icebergs was of minor relevance. Nevertheless, the depth resolution achieved for Fe in this study does not allow us to discard a possible higher Fe in the very surface, as the decreasing concentrations are observed from 25 m down. In the same way, the possibility for the resulting profiles to be affected by Fe removal because of biological uptake is not precluded.
With respect to lateral transport, model-based and DFe flux estimations of the overall Fe supply to phytoplankton in the Southern Ocean propose that continental shelves are the primary Fe source, driving from 50 to 90% of the simulated Chl-a in the austral summer period (Lancelot et al., 2009; Wadley et al., 2014). Concretely for the WSC, on the basis on radium isotopes and its Fe ratio, and/or considering distance to the coast, estimations of the eastward DFe flux, indicated contributions of around 54–70% by horizontal advection of the total summer input (Dulaiova et al., 2009; De Jong et al., 2012; Jiang et al., 2019). Following the proposed circulation path for the ASF after passing through the SSR (Heywood et al., 2004; Thompson et al., 2009), the mean DFe and TaLFe for the upper water column were plotted for the stations in the SOI, in a downstream direction from the AP (Figure 8). Although no significant correlation was obtained, the plot shows what can be suggested as two different Fe distributions. Although TaLFe data were more scattered than for DFe, both parameters for the SSR and SOP showed general decreasing concentration with distance from the continent, while the Fe in PB showed no clear trend for DFe. Remarkably, concentrations over the SOP are on average lower than those at the SSR transect despite its proximity to the SOI compared to stations in the SSR. As suggested above, the most relevant Fe source in the SOI sector, at least in the SSR, may be ASF waters following the eastwardly pattern, that ultimately decreases in concentration presumably because of biological uptake and dilution by mixing with ACC in the WSC.
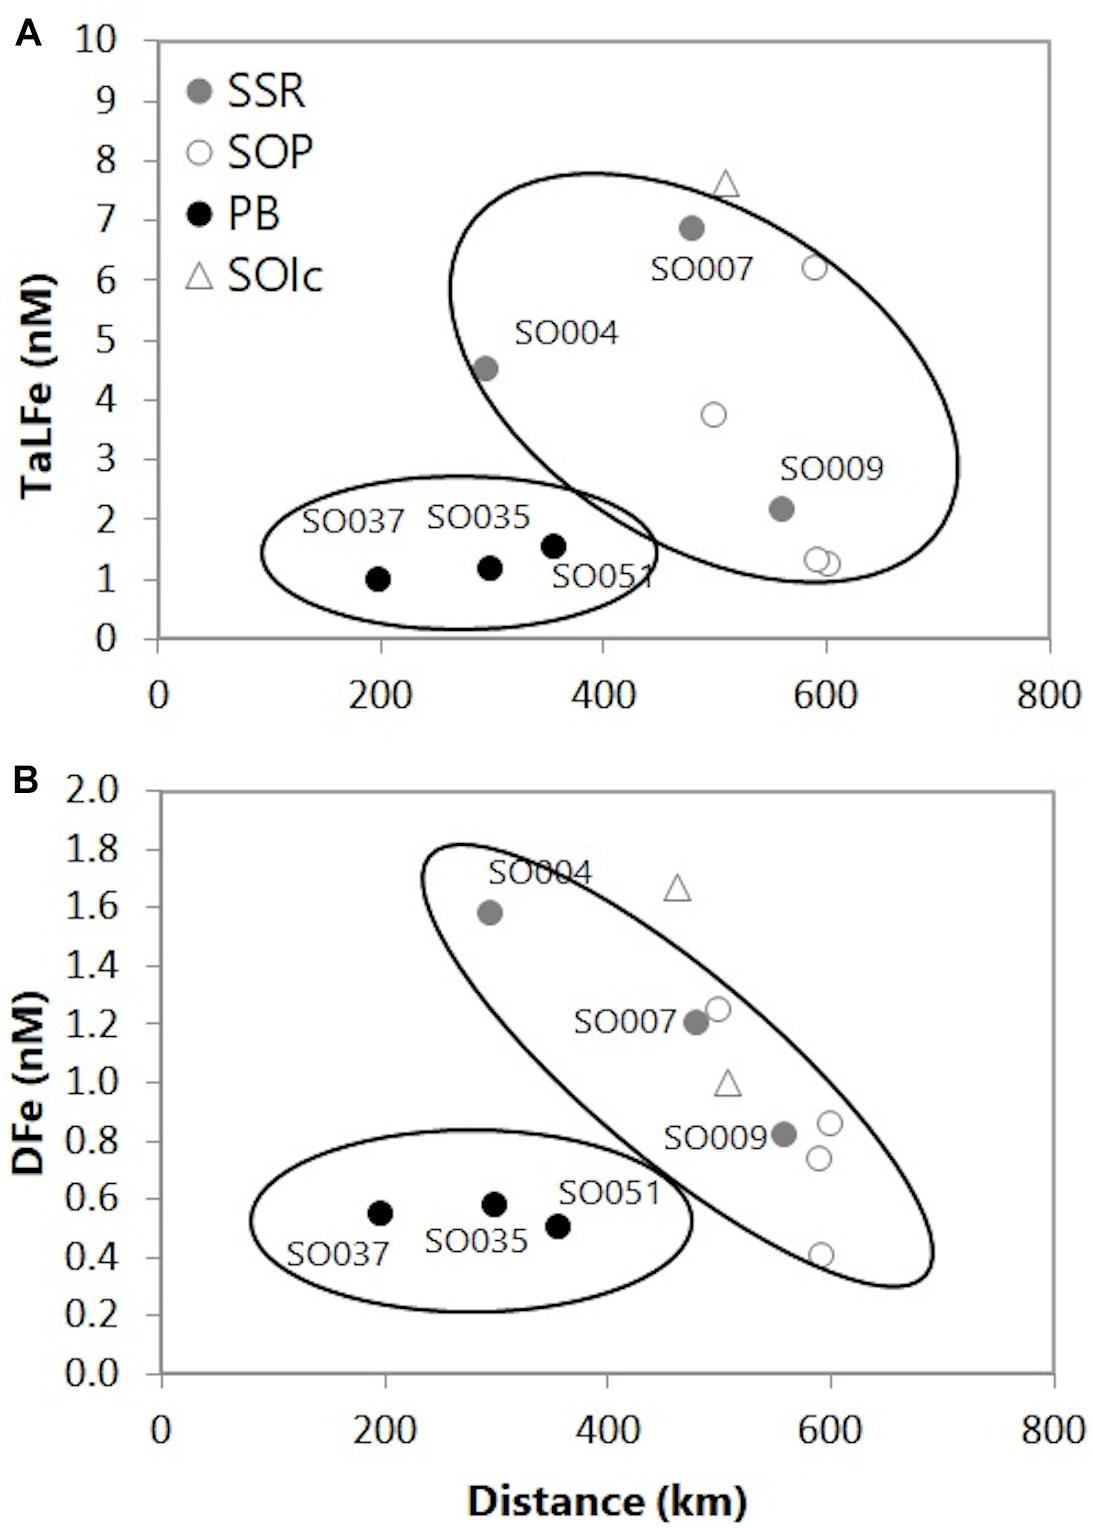
Figure 8. (A) Average TaLFe (nM) and (B) DFe (nM) for the upper water column (225 m) for the stations in the SOI, in relation to the distance to Antarctic Peninsula (based on 54.5°W). SSR: South Scotia Ridge, SOP: South Orkney Plateau, PB: Powell Basin, SOIc: South Orkney Islands coastal.
Fe Supply in Relation to Nutrients, Chl-a, and the UML
The phytoplankton biomass (>1.5 mg Chl-a m–3) measured northeast of EI, regarded as bloom conditions, is outside of the average conditions in the region during the austral summer period (Holm-Hansen et al., 2004a). This persistent bloom is attributed to the effects of vertical (diapycnal) mixing together with mixed-layer entrainment (Zhou et al., 2010; Frants et al., 2013), constituting a case where the combined effect of two types of physical forcing combined enables a quasi-permanent Fe supply to maintain relatively high autotrophic biomass well into the summer. Parameters such as autotrophic biomass (Chl-a) and DFe concentrations are generally not correlated, because of the interaction of both top-down and bottom-up factors (Planquette et al., 2007). Fe supply in the SSI sector as well as the primary production controlled by the interaction of different currents and topographic features (in addition to top-down factors) may reflect these conditions, as no correlation between DFe and the Chl-a concentrations integrated within the UML was observed. On the other hand, the correlation between the moderate Chl-a concentrations reached offshore in the SSR transect and DFe (Figure 7) could suggest a more direct coupling between the main Fe sources and the phytoplankton community response in this region, compared to the SSI region. It is plausible that, during the austral summer period in the SOP region, Fe supply downstream of the AP by horizontal advection might not be enough to meet Fe requirements in areas such as PB where other significant Fe inputs such as seasonal ice melt are suggested to be of minor influence. Decreasing Chl-a concentrations observed toward the summer in the SOI, compared to regions such as the SSI (Holm-Hansen et al., 2004a), are in agreement with the observed Fe distribution.
Light limitation within the depth of the UML, product of deep mixing, is one of the factors accounting for the autotrophic biomass distribution in the Southern Ocean (Mitchell and Holm-Hansen, 1991; Llort et al., 2019). This has been observed in regions around the SSI such as Joinville Island along the peninsular coast, where the deep mixing of the Fe-rich waters is associated with relatively low Chl-a concentrations (Holm-Hansen and Hewes, 2004; Hewes et al., 2008). To further explore this in the SOI sector, the UML depths between sectors can be compared. In the SSI in 2007, the mean UML was ∼64 m, whereas in the SOI, it was on average 37 m for all stations and ∼48 m for stations in the PB only. On the basis of this UML depth (Zuml) and the depth of the euphotic zone (Zeu), the Zeu:Zuml index can be estimated. This index can relate the capacity for the water column to support high potential rates of photosynthesis in nutrient-rich environments, and it have been associated with low Chl-a values in zones with deep UML depths (Zeu:Zuml < 1) and vice versa. The stations in PB had Zeu:Zuml values > 1 suggesting that deep mixing and therefore possible light limitation was not the primary cause of the low Chl-a concentrations (Van Cise, 2008). Because of the occurrence of the lowest Chl-a in the same area as the lowest DFe, it could add to the indirect evidence [section “Fe Distribution East of the Weddell Water Outflow (SOI Area)”] that shelf waters (Fe-enriched) forming the WF, and driving the general water column circulation in PB (Thompson et al., 2009), have no impact on the Fe concentrations in the upper water column. Therefore, in the absence of other significant Fe inputs, primary production around PB could be potentially Fe limited, thus explaining the decreasing Chl-a concentrations along the productive season (Holm-Hansen et al., 2004a).
To evaluate the potential of Fe as a limiting nutrient, the relation of the vertical distribution of DFe and phosphate (PO43–) was used (Figures 9A,B). The processes determining DFe and PO43– vertical distributions are subjected to the effect of several biotic and abiotic factors (Boyd and Ellwood, 2010; Boyd et al., 2017). For the data here included (<200 m), it can be assumed that processes such as remineralization are overall more relevant below the surface-mixed layer (Boyd and Ellwood, 2010). Nevertheless, depending on the phytoplankton community structure, it can be observed faster remineralization for phosphorus in relation to Fe in the upper 200 m, which could lead to the potential underestimation of the Fe:P ratio (Twining et al., 2014). Additionally, abiotic factors such as physical mixing by different water masses can also affect the relation between the nutrient distributions. However, in PB where the water column structure was determined by one water type (WZ-3), such effect can be neglected. Considering these limitations, the values obtained here were assumed to reflect mostly the biological uptake ratio of Fe with respect to PO43– observed in the upper water column in these regions. It is in fact for the stations in DP and PB that the covariation for these parameters was evident. The correlation obtained through the linear relationship between these nutrient concentrations, presented slopes values of 0.165 and 0.162 for DP and PB, respectively. Current Fe:P (mmol mol–1) values in the literature cover a broad range depending on the region and the phytoplankton community structure, yet the values obtained here are close to the Fe:P values for the Southern Ocean (Twining and Baines, 2013). On the basis of the DFe: PO43– ratios for the DP and PB waters, the Fe∗ value ([DFe]-RFe:P × [PO43–]) can be estimated as a tracer for potential Fe limitation indicated by negative values (Parekh et al., 2005). The obtained distribution showed low or negative values associated to the DP and PB regions (Figure 9C), but also included the adjacent southeast portion over the SOP. This result further supports the argument for potential Fe limitation in PB during the austral summer period.
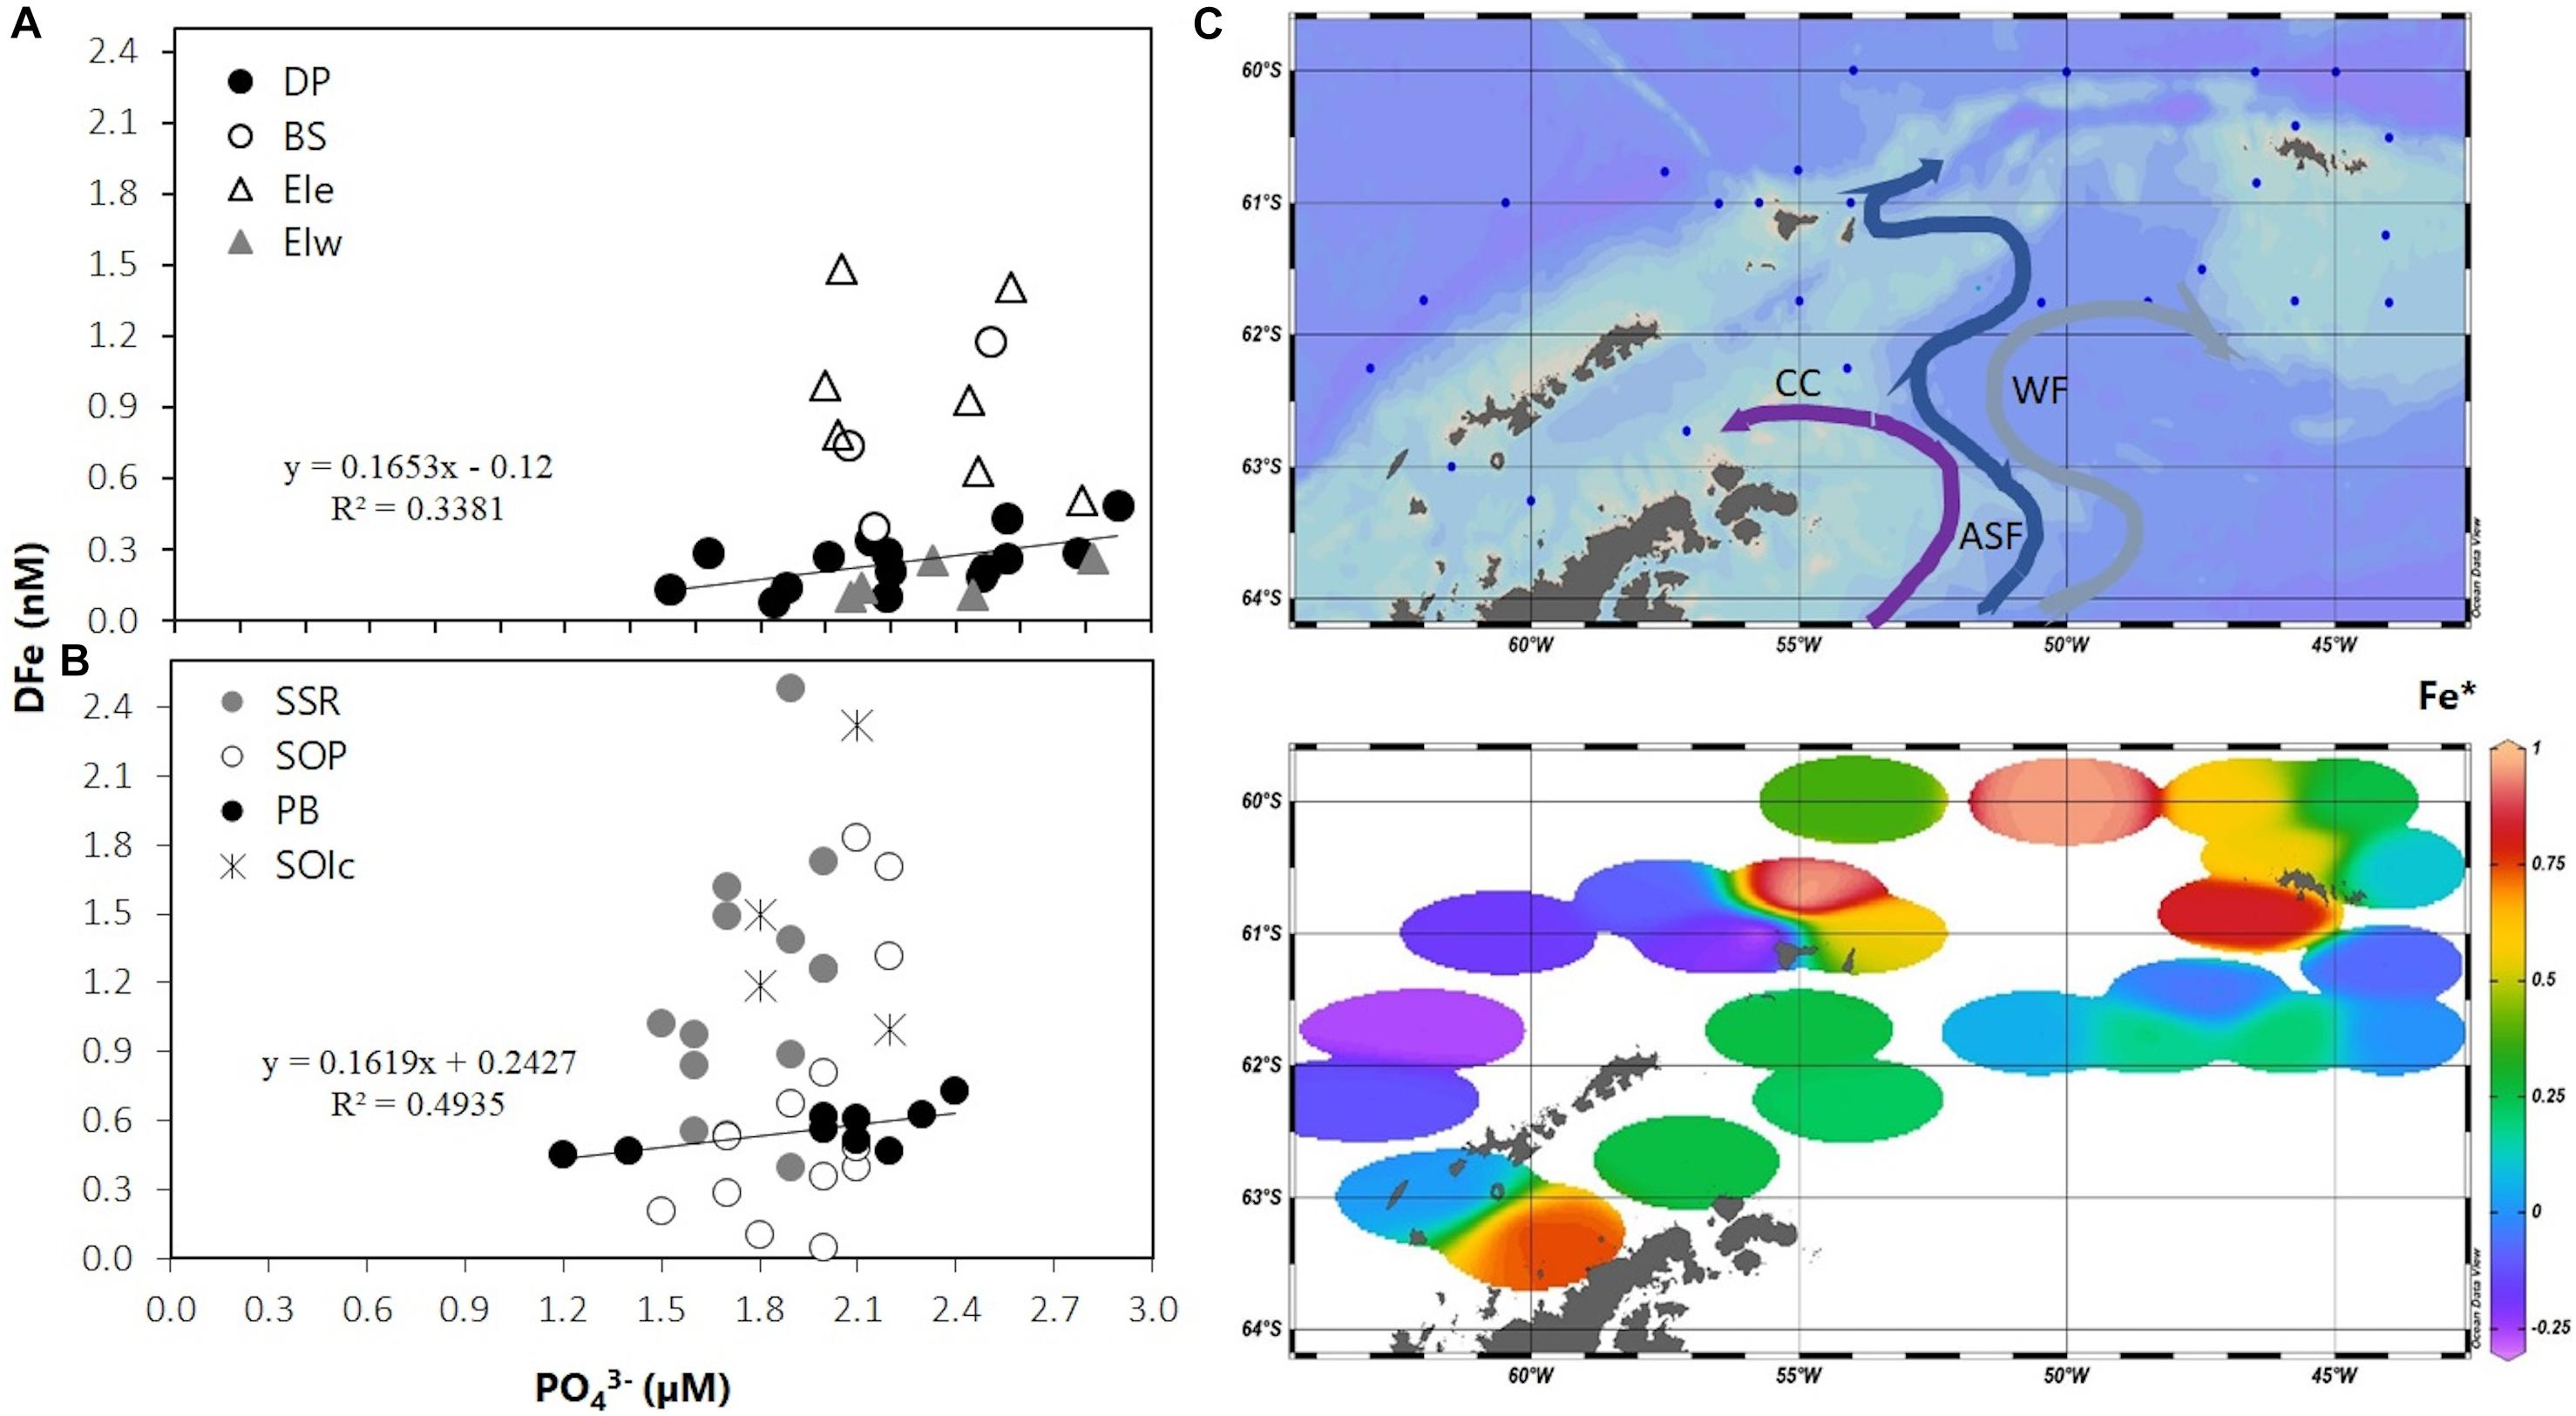
Figure 9. DFe (nM) in relation to phosphate (μM) for all groups of stations in (A) the SSI 2007 and (B) the SOI 2008. (C) Distribution of Fe∗ for the surveyed area based on mean DFe and PO43– concentrations in the UML. Antarctic Slope Front (ASF) and Weddell Front (WF) schematic flow paths are depicted in the upper section. DP: Drake Passage area, BS: Bransfield Strait area, EIe: East Elephant Island area, EIw: West Elephant Island area, SSR: South Scotia Ridge, SOP: South Orkney Plateau, PB: Powell Basin, SOIc: South Orkney Islands coastal.
Conclusion
The bio-oceanographic variability observed between the 2 years highlights the role of the outflow of the Weddell Sea as one of the essential factors determining the variability in the Fe distribution and concentration in the waters west (SSI) and east (SOI) of the WSC, and thus influencing the overall productivity within the region.
The Fe distribution pattern observed around the EI provides additional support to the patterns described by previous studies in the area. This indicates that the lateral transport of water coming from the Weddell Sea (mainly southeast of EI) is a more effective vector for Fe input compared to the role of upwelling caused by topographic features west of the island.
The Fe distribution observed around the SOI, with lower TaLFe:DFe ratios compared to those in the SSI, and with the Fe decreasing west–east gradient, suggests that Fe concentrations in the upper water column may have an important contribution from a source upstream, different to the coastal inputs expected over the SOP. The differences observed in the Fe distribution pattern north and east of the SSR compared to that in PB suggest that the transport from the Weddell Sea is likely to have different Fe inputs, depending on the component of the WSSW involved. That is, ASF waters with shallower origin may carry a larger Fe input that is enhanced by its path through rough topography over the SSR. By contrast, deeper ASF waters over the shelf break that forms the WF and flows into PB are likely not to contribute Fe to the upper water column.
The overall Fe concentrations in the SOI are relatively higher than those in other areas in the Southern Ocean where the productivity is Fe-limited. Nevertheless, the estimation of the Fe∗ values in the UML suggests that even in this area of relatively higher Fe input, there is potential for the primary production to become Fe limited, during the austral summer period in PB region, as it is the case in other areas in the Southern Ocean.
Data Availability Statement
The datasets generated for this study are available on request to the corresponding author.
Author Contributions
Experimental design and fieldwork were conceived by MA, OH-H, and CR. MA, NS, and KB carried out the fieldwork, sample collection, and analysis. Writing was performed mainly by NS with comments and discussion of the results with all other authors.
Funding
This work was supported by the Department of Chemistry, Faculty of Natural Sciences, Norwegian University of Science and Technology (NTNU). The US AMLR Program, administered by the Antarctic Ecosystem Research Division at NOAA’s Southwest Fisheries Research Center, La Jolla, CA, United States.
Conflict of Interest
The authors declare that the research was conducted in the absence of any commercial or financial relationships that could be construed as a potential conflict of interest.
Acknowledgments
Thanks to the officers and crew of R/V Yuzhmorgeologiya for their assistance provided during the cruises, and the NOAA US AMLR Program team that made this study possible with logistics support and help in collecting samples: Lasse Olsen, Maria Jose Calderon, Cristina Carrasco, and Nitza Vera Santana. Thanks to S. Lierhagen from the Chemistry Department at NTNU, for his contribution in performing the HR-ICP-MS analysis. Thanks to the reviewers for their valuable insights and comments which helped improve this manuscript.
References
Alderkamp, A.-C., Van Dijken, G. L., Lowry, K. E., Connelly, T. L., Lagerström, M., Sherrell, R. M., et al. (2015). Fe availability drives phytoplankton photosynthesis rates during spring bloom in the Amundsen Sea Polynya, Antarctica. Elem. Sci. Anth. 3:000043. doi: 10.12952/journal.elementa.000043
Ardelan, M., Holm-Hansen, O., Hewes, C., Reiss, C. S., Silva, N., Dulaiova, H., et al. (2010). Natural iron enrichment around the ANTARCTIC Peninsula in the Southern Ocean. Biogeosciences 7, 11–25. doi: 10.5194/bg-7-11-2010
Atlas, E. L., Gordon, L., Hager, S., and Park, P. K. (1971). A Practical Manual for use of the Technicon Autoanalyzer in Seawater Nutrient Analyses. Corvallis, OR: Oregon State University.
Blain, S., Quéguiner, B., Armand, L., Belviso, S., Bombled, B., Bopp, L., et al. (2007). Effect of natural iron fertilization on carbon sequestration in the Southern Ocean. Nature 446, 1070–1074.
Blain, S., Sarthou, G., and Laan, P. (2008). Distribution of dissolved iron during the natural iron-fertilization experiment Keops (Kerguelen Plateau, Southern Ocean). Deep Sea Res. Part I Top. Stud. Oceanogr. 55, 594–605. doi: 10.1016/j.dsr2.2007.12.028
Boyd, P., and Ellwood, M. (2010). The biogeochemical cycle of iron in the ocean. Nat. Geosci. 3, 675–682. doi: 10.1038/ngeo964
Boyd, P., Laroche, J., Gall, M., Frew, R., and Mckay, R. M. L. (1999). Role of iron, light, and silicate in controlling algal biomass in subantarctic waters Se of New Zealand. J. Geophys. Res. 104, 13395–13408. doi: 10.1029/1999jc900009
Boyd, P. W. (2002). Environmental factors controlling phytoplankton processes in the Southern Ocean1. J. Phycol. 38, 844–861. doi: 10.1046/j.1529-8817.2002.t01-1-01203.x
Boyd, P. W., Ellwood, M. J., Tagliabue, A., and Twining, B. S. (2017). Biotic and abiotic retention, recycling and remineralization of metals in the ocean. Nat. Geosci. 10, 167–173. doi: 10.1038/ngeo2876
Boyd, P. W., Jickells, T., Law, C. S., Blain, S., Boyle, E. A., Buesseler, K. O., et al. (2007). Mesoscale iron enrichment experiments 1993-2005: synthesis and future directions. Science 315, 612–617. doi: 10.1126/science.1131669
Bucciarelli, E., Blain, S., and Tréguer, P. (2001). Iron and manganese in the wake of the Kerguelen Islands (Southern Ocean). Mar. Chem. 73, 21–36. doi: 10.1016/s0304-4203(00)00070-0
Chisholm, S., and Morel, F. (1991). What Controls Phytoplankton Production in Nutrient-Rich Areas of the Open Sea. Washington, DC: U.S. Environmental Protection Agency.
De Baar, H., Buma, A., Nolting, R., Cadee, G., Jacques, G., and Treguer, P. (1990). On iron limitation of the Southern Ocean: experimental observations in the Weddell and Scotia Seas. Mar. Ecol. Prog. Ser. 65, 105–122. doi: 10.3354/meps065105
De Baar, H. J., De Jong, J. T., Bakker, D. C., Löscher, B. M., Veth, C., Bathmann, U., et al. (1995). Importance of iron for plankton blooms and carbon dioxide drawdown in the Southern Ocean. Nature 373, 412–415. doi: 10.1038/373412a0
De Baar, H. J. W., Boyd, P. W., Coale, K. H., Landry, M. R., Tsuda, A., Assmy, P., et al. (2005). Synthesis of iron fertilization experiments: from the Iron Age in the Age of Enlightenment. J. Geophys. Res. 110:C09S16.
De Jong, J., Schoemann, V., Lannuzel, D., Croot, P., De Baar, H., and Tison, J.-L. (2012). Natural iron fertilization of the Atlantic sector of the Southern Ocean by continental shelf sources of the Antarctic Peninsula. J. Geophys. Res. 117:G01029.
Dulaiova, H., Ardelan, M. V., Henderson, P. B., and Charette, M. A. (2009). Shelf-derived iron inputs drive biological productivity in the southern Drake Passage. Glob. Biogeochem. Cycles 23:GB4014.
Edwards, R., and Sedwick, P. (2001). Iron in East Antarctic snow: implications for atmospheric iron deposition and algal production in Antarctic waters. Geophys. Res. Lett. 28, 3907–3910. doi: 10.1029/2001gl012867
Fahrbach, E., Rohardt, G., Scheele, N., Schröder, M., Strass, V., and Wisotzki, A. (1995). Formation and discharge of deep and bottom water in the northwestern Weddell Sea. J. Mar. Res. 53, 515–538. doi: 10.1357/0022240953213089
Frants, M., Gille, S. T., Hatta, M., Hiscock, W. T., Kahru, M., Measures, C. I., et al. (2013). Analysis of horizontal and vertical processes contributing to natural iron supply in the mixed layer in southern Drake Passage. Deep Sea Res. Part I Top. Stud. Oceanogr. 90, 68–76. doi: 10.1016/j.dsr2.2012.06.001
Gordon, A. L., and Nowlin, W. D. Jr. (1978). The basin waters of the Bransfield Strait. J. Phys. Oceanogr. 8, 258–264. doi: 10.1175/1520-0485(1978)008<0258:tbwotb>2.0.co;2
Hatta, M., Measures, C., Selph, K., Zhou, M., and Hiscock, W. (2013). Iron fluxes from the shelf regions near the South Shetland Islands in the drake passage during the austral-winter 2006. Deep Sea Res. Part I Top. Stud. Oceanogr. 90, 89–101. doi: 10.1016/j.dsr2.2012.11.003
Hawkings, J. R., Wadham, J. L., Tranter, M., Raiswell, R., Benning, L. G., Statham, P. J., et al. (2014). Ice sheets as a significant source of highly reactive nanoparticulate iron to the oceans. Nat. Commun. 5:3929. doi: 10.1038/ncomms4929
Hewes, C., Reiss, C., and Holm-Hansen, O. (2009). A quantitative analysis of sources for summertime phytoplankton variability over 18 years in the South Shetland Islands (Antarctica) region. Deep Sea Res. Part I Oceanogr. Res. Pap. 56, 1230–1241. doi: 10.1016/j.dsr.2009.01.010
Hewes, C., Reiss, C., Kahru, M., Mitchell, B., and Holm-Hansen, O. (2008). Control of phytoplankton biomass by dilution and mixed layer depth in the western Weddell-Scotia Confluence. Mar. Ecol. Prog. Ser. 366, 15–29. doi: 10.3354/meps07515
Heywood, K. J., Garabato, A. C. N., Stevens, D. P., and Muench, R. D. (2004). On the fate of the Antarctic Slope Front and the origin of the Weddell Front. J. Geophys. Res. 109:C06021.
Heywood, K. J., Schmidtko, S., Heuzé, C., Kaiser, J., Jickells, T. D., Queste, B. Y., et al. (2014). Ocean processes at the Antarctic continental slope. Philos. Trans. A Math. Phys. Eng. Sci. 372:20130047. doi: 10.1098/rsta.2013.0047
Hodson, A., Nowak, A., Sabacka, M., Jungblut, A., Navarro, F., Pearce, D., et al. (2017). Climatically sensitive transfer of iron to maritime Antarctic ecosystems by surface runoff. Nat. Commun. 8:14499. doi: 10.1038/ncomms14499
Holm-Hansen, O., and Hewes, C. D. (2004). Deep chlorophyll-a maxima (Dcms) in Antarctic waters. Pol. Biol. 27, 699–710. doi: 10.1007/s00300-004-0641-1
Holm-Hansen, O., Hewes, C. D., Villafañe, V. E., Helbling, E. W., Silva, N., and Amos, T. (1997). Distribution of phytoplankton and nutrients in relation to different water masses in the area around Elephant Island. Antarctica. Pol. Biol. 18, 145–153. doi: 10.1007/s003000050169
Holm-Hansen, O., Kahru, M., and Hewes, C. D. (2005). Deep chlorophyll a maxima (Dcms) in pelagic Antarctic waters. Ii. relation to bathymetric features and dissolved iron concentrations. Mar. Ecol. Prog. Ser. 297, 71–81. doi: 10.3354/meps297071
Holm-Hansen, O., Kahru, M., Hewes, C. D., Kawaguchi, S., Kameda, T., Sushin, V. A., et al. (2004a). Temporal and spatial distribution of chlorophyll-a in surface waters of the Scotia Sea as determined by both shipboard measurements and satellite data. Deep Sea Res. Part I Top. Stud. Oceanogr. 51, 1323–1331. doi: 10.1016/s0967-0645(04)00082-7
Holm-Hansen, O., Naganobu, M., Kawaguchi, S., Kameda, T., Krasovski, I., Tchernyshkov, P., et al. (2004b). Factors influencing the distribution, biomass, and productivity of phytoplankton in the Scotia Sea and adjoining waters. Deep Sea Res. Part I Top. Stud. Oceanogr. 51, 1333–1350. doi: 10.1016/s0967-0645(04)00083-9
Hopkinson, B. M., Mitchell, B., Reynolds, R. A., Wang, H., Selph, K. E., Measures, C. I., et al. (2007). Iron limitation across chlorophyll gradients in the southern Drake Passage: phytoplankton responses to iron addition and photosynthetic indicators of iron stress. Limnol. Oceanogr. 52, 2540–2554. doi: 10.4319/lo.2007.52.6.2540
Jiang, M., Charette, M. A., Measures, C. I., Zhu, Y., and Zhou, M. (2013). Seasonal cycle of circulation in the antarctic peninsula and the off-shelf transport of shelf waters into southern Drake Passage and Scotia Sea. Deep Sea Res. Part II Top. Stud. Oceanogr. 90, 15–30. doi: 10.1016/j.dsr2.2013.02.029
Jiang, M., Measures, C. I., Barbeau, K. A., Charette, M. A., Gille, S. T., Hatta, M., et al. (2019). Fe sources and transport from the Antarctic Peninsula shelf to the southern Scotia Sea. Deep Sea Res. Part I Oceanogr. Res. Pap. 150:103060. doi: 10.1016/j.dsr.2019.06.006
Johnson, K. S., Elrod, V., Fitzwater, S., Plant, J., Boyle, E., Bergquist, B., et al. (2007). Developing standards for dissolved iron in seawater. Trans. Am. Geophys. Union 88, 131–132.
Kahru, M., Mitchell, B., Gille, S., Hewes, C., and Holm-Hansen, O. (2007). Eddies enhance biological production in the Weddell-Scotia Confluence of the Southern Ocean. Geophys. Res. Lett. 34:L14603. doi: 10.1029/2007GL030430
Klunder, M. B., Laan, P., De Baar, H. J. W., Middag, R., Neven, I., and Van Ooijen, J. (2014). Dissolved Fe across the weddell sea and drake passage: impact of Dfe on nutrient uptake. Biogeosciences 11, 651–669. doi: 10.5194/bg-11-651-2014
Lancelot, C., Montety, A. D., Goosse, H., Becquevort, S., Schoemann, V., Pasquer, B., et al. (2009). Spatial distribution of the iron supply to phytoplankton in the Southern Ocean: a model study. Biogeosciences 6, 2861–2878. doi: 10.5194/bg-6-2861-2009
Lannuzel, D., Schoemann, V., De Jong, J., Chou, L., Delille, B., Becquevort, S., et al. (2008). Iron study during a time series in the western Weddell pack ice. Mar. Chem. 108, 85–95. doi: 10.1016/j.marchem.2007.10.006
Lannuzel, D., Schoemann, V., De Jong, J., Tison, J.-L., and Chou, L. (2007). Distribution and biogeochemical behaviour of iron in the East Antarctic sea ice. Mar. Chem. 106, 18–32. doi: 10.1016/j.marchem.2006.06.010
Lin, H., Rauschenberg, S., Hexel, C. R., Shaw, T. J., and Twining, B. S. (2011). Free-drifting icebergs as sources of iron to the Weddell Sea. Deep Sea Res. Part I Top. Stud. Oceanogr. 58, 1392–1406. doi: 10.1016/j.dsr2.2010.11.020
Lipsky, J. D. (2007). Amlr 2006/2007 Field Season Report. Objectives, Accomplishments and Tentative Conclusions. Silver Spring, MA: NOAA.
Llort, J., Lévy, M., Sallée, J.-B., and Tagliabue, A. (2019). Nonmonotonic response of primary production and export to changes in mixed-layer depth in the Southern Ocean. Geophys. Res. Lett. 46, 3368–3377. doi: 10.1029/2018gl081788
Loscher, B., De Baar, H., De Jong, J., Veth, C., and Dehairs, F. (1997). The distribution of Fe in the Antarctic circumpolar current. Deep Sea Res. Part I Top. Stud. Oceanogr. 44, 143–187.
Martin, J. H., Fitzwater, S. E., and Gordon, R. M. (1990). Iron deficiency limits phytoplankton growth in Antarctic waters. Glob. Biogeochem. Cycles 4, 5–12. doi: 10.1029/gb004i001p00005
Measures, C., Brown, M., Selph, K., Apprill, A., Zhou, M., Hatta, M., et al. (2013). The influence of shelf processes in delivering dissolved iron to the Hnlc waters of the Drake Passage. Antarctica. Deep Sea Res. Part I Top. Stud. Oceanogr. 90, 77–88. doi: 10.1016/j.dsr2.2012.11.004
Mitchell, B. G., Brody, E. A., Holm-Hansen, O., Mcclain, C., and Bishop, J. (1991). Light limitation of phytoplankton biomass and macronutrient utilization in the Southern Ocean. Limnol. Oceanogr. 36, 1662–1677. doi: 10.4319/lo.1991.36.8.1662
Mitchell, B. G., and Holm-Hansen, O. (1991). Observations of modeling of the Antartic phytoplankton crop in relation to mixing depth. Deep Sea Res. Part A Oceanogr. Res. Pap. 38, 981–1007. doi: 10.1016/0198-0149(91)90093-u
Nielsdóttir, M. C., Bibby, T. S., Moore, C. M., Hinz, D. J., Sanders, R., Whitehouse, M., et al. (2012). Seasonal and spatial dynamics of iron availability in the Scotia Sea. Mar. Chem. 130, 62–72. doi: 10.1016/j.marchem.2011.12.004
Nolting, R., De Baar, H., Van Bennekom, A., and Masson, A. (1991). Cadmium, copper and iron in the Scotia Sea, Weddell Sea and Weddell/Scotia Confluence (Antarctica). Mar. Chem. 35, 219–243. doi: 10.1016/s0304-4203(09)90019-6
Parekh, P., Follows, M. J., and Boyle, E. A. (2005). Decoupling of iron and phosphate in the global ocean. Glob. Biogeochem. Cycles 19:GB2020.
Planquette, H., Statham, P. J., Fones, G. R., Charette, M. A., Moore, C. M., Salter, I., et al. (2007). Dissolved iron in the vicinity of the Crozet Islands, Southern Ocean. Deep Sea Res. Part I Top. Stud. Oceanogr. 54, 1999–2019. doi: 10.1016/j.dsr2.2007.06.019
Pollard, R., Sanders, R., Lucas, M., and Statham, P. (2007a). The Crozet natural iron bloom and export experiment (Crozex). Deep Sea Res. Part I Top. Stud. Oceanogr. 54, 1905–1914. doi: 10.1038/nature07716
Pollard, R., Venables, H., Read, J., and Allen, J. (2007b). Large-scale circulation around the Crozet Plateau controls an annual phytoplankton bloom in the Crozet Basin. Deep Sea Res. Part I Top. Stud. Oceanogr. 54, 1915–1929. doi: 10.1016/j.dsr2.2007.06.012
Raiswell, R., Hawkings, J. R., Benning, L. G., Baker, A. R., Death, R., Albani, S., et al. (2016). Potentially bioavailable iron delivery by iceberg-hosted sediments and atmospheric dust to the polar oceans. Biogeosciences 13, 3887–3900. doi: 10.5194/bg-13-3887-2016
Read, J., Pollard, R., and Allen, J. (2007). Sub-mesoscale structure and the development of an eddy in the Subantarctic Front north of the Crozet Islands. Deep Sea Res. Part I Top. Stud. Oceanogr. 54, 1930–1948. doi: 10.1016/j.dsr2.2007.06.013
Reiss, C. S., Hewes, C. D., and Holm-Hansen, O. (2009). Influence of atmospheric teleconnections and Upper Circumpolar Deep Water on phytoplankton biomass around Elephant Island, Antarctica. Mar. Ecol. Prog. Ser. 377, 51–62. doi: 10.3354/meps07840
Sanudo-Wilhelmy, S., Olsen, K., Scelfo, J., Foster, T., and Flegal, A. (2002). Trace metal distributions off the Antarctic Peninsula in the Weddell Sea. Mar. Chem. 77, 157–170. doi: 10.1016/s0304-4203(01)00084-6
Sarmiento, J. Á, Gruber, N., Brzezinski, M., and Dunne, J. (2004). High-latitude controls of thermocline nutrients and low latitude biological productivity. Nature 427, 56–60. doi: 10.1038/nature02127
Schlitzer, R. (2016). Ocean Data View. Available at: http://odv.awi.de
Schodlok, M., Hellmer, H., Rohardt, G., and Fahrbach, E. (2006). Weddell Sea iceberg drift: five years of observations. J. Geophys. Res. 111:C06018.
Sedwick, P. N., Marsay, C. M., Sohst, B. M., Aguilar-Islas, A. M., Lohan, M. C., Long, M. C., et al. (2011). Early season depletion of dissolved iron in the Ross Sea polynya: implications for iron dynamics on the Antarctic continental shelf. J. Geophys. Res. 116, 1–19.
Sullivan, C., Arrigo, K., Mcclain, C., Comiso, J., and Firestone, J. (1993). Distributions of phytoplankton blooms in the Southern Ocean. Science 262, 1832–1837. doi: 10.1126/science.262.5141.1832
Thompson, A. F., and Heywood, K. J. (2008). Frontal structure and transport in the northwestern Weddell Sea. Deep Sea Res. Part I Oceanogr. Res. Pap. 55, 1229–1251. doi: 10.1016/j.dsr.2008.06.001
Thompson, A. F., Heywood, K. J., Thorpe, S. E., Renner, A. H., and Trasviña, A. (2009). Surface circulation at the tip of the Antarctic Peninsula from drifters. J. Phys. Oceanogr. 39, 3–26. doi: 10.1175/2008jpo3995.1
Twining, B. S., and Baines, S. B. (2013). The trace metal composition of marine phytoplankton. Annu. Rev. Mar. Sci. 5, 191–215. doi: 10.1146/annurev-marine-121211-172322
Twining, B. S., Nodder, S. D., King, A. L., Hutchins, D. A., Lecleir, G. R., Debruyn, J. M., et al. (2014). Differential remineralization of major and trace elements in sinking diatoms. Limnol. Oceanogr. 59, 689–704. doi: 10.4319/lo.2014.59.3.0689
Van Cise, A. M. (2008). Amlr 2005/2006 Field Season Report. Objectives, Accomplishments and Tentative Conclusions. Silver Spring, MA: NOAA.
Von Gyldenfeldt, A. B., Fahrbach, E., GarcıìA, M. A., and Schröder, M. (2002). Flow variability at the tip of the Antarctic Peninsula. Deep Sea Res. Part I Top. Stud. Oceanogr. 49, 4743–4766.
Wadley, M. R., Jickells, T. D., and Heywood, K. J. (2014). The role of iron sources and transport for Southern Ocean productivity. Deep Sea Res. Part I Oceanogr. Res. Pap. 87, 82–94. doi: 10.1016/j.dsr.2014.02.003
Watson, A., Bakker, D., Ridgwell, A., Boyd, P., and Law, C. (2000). Effect of iron supply on Southern Ocean Co2 uptake and implications for glacial atmospheric Co2. Nature 407, 730–733. doi: 10.1038/35037561
Westerlund, S., and Öhman, P. (1991). Iron in the water column of the Weddell Sea. Mar. Chem. 35, 199–217. doi: 10.1016/s0304-4203(09)90018-4
Whitworth, T., Nowlin, W., Orsi, A., Locarnini, R., and Smith, S. (1994). Weddell Sea shelf water in the Bransfield Strait and Weddell-Scotia confluence. Deep Sea Res. Part I Oceanogr. Res. Pap. 41, 629–641. doi: 10.1016/0967-0637(94)90046-9
Zhou, M., Niiler, P. P., Zhu, Y., and Dorland, R. D. (2006). The western boundary current in the Bransfield Strait. Antarctica. Deep Sea Res. Part I Oceanogr. Res. Pap. 53, 1244–1252. doi: 10.1016/j.dsr.2006.04.003
Keywords: iron, Antarctic Peninsula, Weddell-Scotia Confluence, Weddell gyre, Scotia Sea, natural fertilization
Citation: Sanchez N, Reiss CS, Holm-Hansen O, Hewes CD, Bizsel KC and Ardelan MV (2019) Weddell-Scotia Confluence Effect on the Iron Distribution in Waters Surrounding the South Shetland (Antarctic Peninsula) and South Orkney (Scotia Sea) Islands During the Austral Summer in 2007 and 2008. Front. Mar. Sci. 6:771. doi: 10.3389/fmars.2019.00771
Received: 16 May 2019; Accepted: 28 November 2019;
Published: 12 December 2019.
Edited by:
Antonio Tovar-Sanchez, Spanish National Research Council (CSIC), SpainReviewed by:
Matthieu Bressac, University of Tasmania, AustraliaRob Middag, Royal Netherlands Institute for Sea Research (NIOZ), Netherlands
Copyright © 2019 Sanchez, Reiss, Holm-Hansen, Hewes, Bizsel and Ardelan. This is an open-access article distributed under the terms of the Creative Commons Attribution License (CC BY). The use, distribution or reproduction in other forums is permitted, provided the original author(s) and the copyright owner(s) are credited and that the original publication in this journal is cited, in accordance with accepted academic practice. No use, distribution or reproduction is permitted which does not comply with these terms.
*Correspondence: Nicolas Sanchez, bmljb2xhcy5zYW5jaGV6QG50bnUubm8=