 Rónadh Cox1,2*
 Fabrice Ardhuin3
 Frédéric Dias2,4
 Ronan Autret5
 Nicole Beisiegel2,4
 Claire S. Earlie6
 James G. Herterich2,4
 Andrew Kennedy7Raphaël Paris8Alison Raby9
 Pál Schmitt10
 Robert Weiss11,12
- 1Department of Geosciences, Williams College, Williamstown, MA, United States
- 2Earth Institute, University College Dublin, Dublin, Ireland
- 3Université Brest, CNRS, IRD, IFREMER, Laboratoire d'Océanographie Physique et Spatiale, Brest, France
- 4School of Mathematics and Statistics, University College Dublin, Dublin, Ireland
- 5Laboratoire de Dynamique et de Gestion Intégrée des Zones Côtières, Université du Québec à Rimouski, Rimouski, QC, Canada
- 6School of Earth and Ocean Sciences, Cardiff University, Cardiff, United Kingdom
- 7College of Engineering, Notre Dame University, Notre Dame, IN, United States
- 8Université Clermont Auvergne, CNRS, IRD, OPGC, Laboratoire Magmas et Volcans, Clermont-Ferrand, France
- 9School of Engineering, University of Plymouth, Plymouth, United Kingdom
- 10Marine Research Group, Queen's University Belfast, Belfast, United Kingdom
- 11Department of Geosciences, Virginia Tech, Blacksburg, VA, United States
- 12Center for Coastal Studies, Virginia Tech, Blacksburg, VA, United States
Coastal boulder deposits (CBD), transported by waves at elevations above sea level and substantial distances inland, are markers for marine incursions. Whether they are tsunami or storm deposits can be difficult to determine, but this is of critical importance because of the role that CBD play in coastal hazard analysis. Equations from seminal work by Nott (1997), here referred to as the Nott Approach, are commonly employed to calculate nominal wave heights from boulder masses as a means to discriminate between emplacement mechanisms. Systematic review shows that this approach is based on assumptions that are not securely founded and that direct relationships cannot be established between boulder measurements and wave heights. A test using an unprecedented dataset of boulders moved by storm waves (with associated sea-state data) shows a lack of agreement between calculations and actual wave heights. The equations return unrealistically large heights, many of which greatly exceed sea states occurring during the boulder-moving storms. This underscores the finding that Nott-Approach wave-height calculations are unreliable. The result is general, because although the field data come from one region (the Aran Islands, Ireland), they represent a wide range of boulder masses and topographic settings and present a valid test of hydrodynamic equations. This analysis demonstrates that Nott Approach equations are incapable of distinguishing storm waves from tsunami transport and that wave heights hindcast from boulder masses are not meaningful. Current hydrodynamic understanding does not permit reliable computation of wave height from boulder measurements. A combination of field, numerical, and experimental approaches is required to quantify relationships between wave power and mass transport onshore. Many CBD interpreted as tsunami deposits based on Nott-Approach analysis may in fact have been emplaced during storms and should therefore be re-evaluated. This is especially important for CBD that have been incorporated into long-term coastal risk assessments, which are compromised if the CBD are misinterpreted. CBD dynamics can be better determined from a combination of detailed field measurements, modeling, and experiments. A clearer understanding of emplacement mechanisms will result in more reliable hazard analysis.
Introduction
Coastal boulder deposits (CBD) occur above sea level and at considerable distance inland (Figure 1) and can include megagravel clasts weighing 10s or 100s of tons (Nott, 1997; Mastronuzzi and Sansò, 2004; Williams and Hall, 2004; Etienne and Paris, 2010; Switzer and Burston, 2010). They are emplaced by intense waves that surge onto coastal platforms as land-crossing bores, in some cases flowing as much as a quarter-kilometer inland, and in others flooding the tops of high cliffs, tractioning large boulders as they go. Thus, CBD preserve a record of extreme wave energies, which—if decoded correctly—can unlock the understanding of coastal hazards and reconstruction of event histories. Increasingly, CBD are being incorporated into coastal risk analyses and predictions, primarily as proxies for tsunami histories (Mastronuzzi et al., 2013; Terry et al., 2015, 2018; Torab and Dalal, 2015; Main et al., 2018; Papathoma-Köhle et al., 2019).
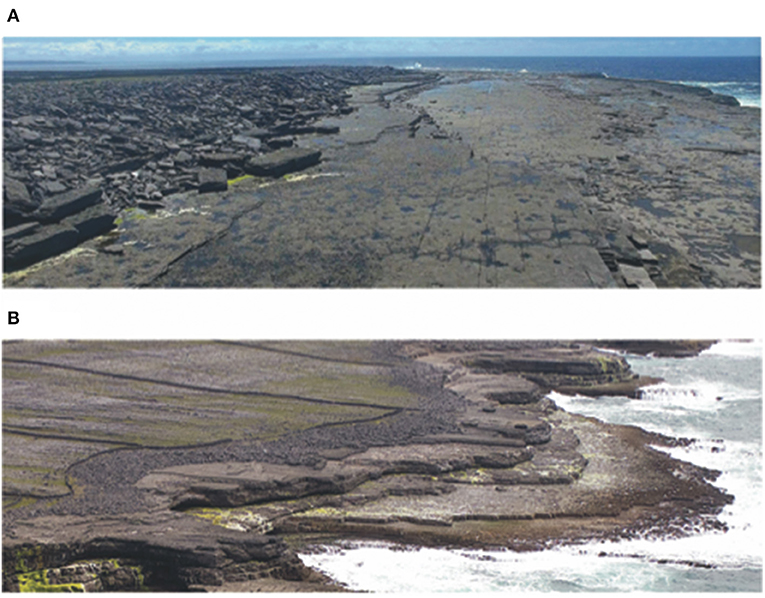
Figure 1. Aerial images showing two examples of CBD on the Aran Islands. In both images, west is to the right. (A) Broad coastal platform on Inishmaan, locations 60–62 (Supplementary Table 1). The large boulder in the mid-ground is about 8 m long and sits 17 m above high water. The platform is ≈110 m wide. (B) Stepped coast on Inishmore, locations 27–29 (Supplementary Table 1). The upper platform is 45 m wide at its widest point in the mid-ground. The tide is not full, and the dark brown portion of the lower platform is the exposed intertidal zone. The front edge of the boulder ridge is 18 m above and 95 m inland of the high tide mark.
However, because energetic bores on coastal platforms can be generated by storm waves as well as by tsunami, correctly interpreting the boulder emplacement mechanism is of the first importance. If storm deposits are wrongly attributed to tsunami or tsunami deposits are misinterpreted as storms the reliability of event catalogs is compromised. A key question, therefore, is whether the CBD incorporated into risk analyses have been correctly interpreted; and recent work suggests that in many cases, they have not (Marriner et al., 2017; Cox et al., 2019).
Interpreting CBD emplacement mechanisms is difficult, especially for older deposits. Whereas, direct observations of boulder movement in the last decade have provided clarity in some cases (e.g., Paris et al., 2009; Bourgeois and MacInnes, 2010; Goto et al., 2011, 2012; May et al., 2015; Kennedy et al., 2017; Cox et al., 2018a; Lau et al., 2018), primary evidence is lacking in most cases, and so other approaches are necessary to determine the boulder emplacement mechanism.
The most commonly used method derives the nominal tsunami and storm wave heights necessary for boulder transport by plugging field measurements of boulder dimensions into hydrodynamic equations developed originally by Nott (1997, 2003b). Nott (2003b) equations were a valuable first attempt to assess boulder transport dynamics, drawing attention to CBD, and highlighting the dilemma of how to interpret their depositional mechanics. All Nott Approach studies follow the same basic procedure: clast dimensions are plugged into equations that return nominal storm wave heights and tsunami heights required to move the boulders. If these calculated wave heights seem in keeping with the local wave climate (usually extracted from offshore buoy records), then the CBD are interpreted as storm deposits. But if they exceed local maxima, the boulders are generally interpreted as tsunamigenic (e.g., Nott, 2003a; Whelan and Kelletat, 2005; Kennedy et al., 2007; Mastronuzzi et al., 2007; Scicchitano et al., 2007; Barbano et al., 2010; Costa et al., 2011; Boulton and Whitworth, 2017; Roig-Munar et al., 2019). Several subsequent modifications of the Nott equations are also in common use (e.g., Pignatelli et al., 2009; Barbano et al., 2010; Benner et al., 2010; Engel and May, 2012), as well as versions that reconfigure the velocity equations of Nandasena et al. (2011b) as a basis for wave-height determinations (e.g., Mottershead et al., 2014; Deguara and Gauci, 2017). We refer to this family of equations collectively as the Nott Approach.
The problem is that the Nott Approach equations have never been validated. There are no field or modeling studies that can corroborate assertions about the equations' interpretive power. On the contrary: many workers have pointed out their shortcomings. Numerous papers mention that the original Nott equations and their descendants contain unrealistic assumptions and that they fail to incorporate relevant environmental variables (e.g., Morton et al., 2006, 2008; Goto et al., 2009, 2010; Switzer and Burston, 2010; Lorang, 2011; Weiss, 2012; Engel et al., 2016; Terry and Lau, 2018). The equations have been shown to return unreliable results when applied to known storm or tsunami deposits, in particular underestimating storm wave power (e.g., Bourgeois and MacInnes, 2010; Switzer and Burston, 2010; Gandhi et al., 2017; Piscitelli et al., 2017). Despite these cautions, however, the Nott Approach continues to be applied for wave-height hindcasting (e.g., Vacchi et al., 2012; Mottershead et al., 2014; Biolchi et al., 2016; Boulton and Whitworth, 2017; Deguara and Gauci, 2017; Dewey and Ryan, 2017; Pepe et al., 2018; Kennedy et al., 2019; Roig-Munar et al., 2019). In consequence, the conversation about CBD is dominated by interpretations that, at best, are based on flawed methodology and, at worst, may be incorrect.
Setting the record straight is critical. Boulder deposits interpreted (based on the Nott Approach) to record tsunami events are included in review articles about tsunami history and risk (e.g., Mastronuzzi et al., 2004; Papadopoulos et al., 2014; Scourse et al., 2018) as well as in compilations for public outreach and education (e.g., Coratza and De Waele, 2012). They are assimilated into regional tsunami catalogs (e.g., Maramai et al., 2014; De Martini et al., 2016; Long, 2018) designed to be integrated into assessments of coastal hazard and inundation risk. Detailed tsunami inundation hazard maps are being created based on these catalogs. Tsunami intensity maps incorporate CBD as markers, giving them equal weight with historical records of inundation (e.g., Papadopoulos, 2016; Papadopoulos et al., 2017). Papathoma-Köhle et al.'s (2019) calculation of tsunami vulnerability and Schneider et al.'s (2016) tsunami flooding risk assessment are both supported by interpretations of CBD based on the Nott Approach. These examples demonstrate the extent to which tsunami interpretations of CBD have become normalized, and they testify to the widespread acceptance of this methodology, which we will demonstrate is flawed.
In this study, we show that the Nott Approach equations are invalid. We explain the embedded flaws in the hydrodynamic reasoning, and—using the Cox et al. (2018a) database of boulders on the Aran Islands moved by recent storms—demonstrate that the equations return wave height values that are unrealistic and contradicted by data. This study provides the first large-scale field-validated analysis of the Nott Approach, showing the extent to which these equations misrepresent relationships between boulder movements and storm wave conditions. The Nott equations cannot hindcast storm waves, and they cannot be used to differentiate between storm waves and tsunami. In cases where the CBD depositional mechanism has been interpreted based on Nott Approach calculations, the determination should be re-evaluated.
The Nott Approach has served a useful and valuable purpose in raising awareness of the importance of CBD and in stimulating inquiry. We appreciate the work and thought that underlay the equations, while moving forward to a better appreciation of wave hydrodynamics and coastal boulder transport. Of key importance is the realization that the current understanding of wave dynamics and boulder transport mechanisms is insufficient to provide reliable equations directly relating wave height and boulder transport. This study aims to unpack the problems with the Nott Approach and to point a way forward to the integrative field, experimental, and numerical approaches that are required to develop dependable and verifiable quantitative relationships.
The Nott Approach
Nott (2003b) made fundamental contributions to CBD studies by kickstarting the conversation about relationships between boulder size and force required for transport, in terms of both flow velocity and the height of the impinging wave (whether storm or tsunami). Given a boulder—or a field of boulders—deposited by an unknown mechanism at some time in the past, Nott's aim was to use hydrodynamic characteristics—assumed to differ systematically between the different kinds of waves—to evaluate the relative likelihood of transport by storm waves vs. tsunami.
The mechanics of hydrodynamic forcing and large-object transport used by Nott are fundamentally sound, but onshore flows—particularly those generated by storm waves—include time-varying parameters and complex fluid-structure interactions, which were not well-understood at the time (and still are not). Nott's model was therefore underpinned by assumptions rather than established facts, and those assumptions, which became deeply embedded in the method, are shown to be wrong in many cases, making the method inappropriate as a tool for distinguishing the origins of CBD.
Setting Up the Equations
There are two steps to Nott (2003b) approach. First, boulder characteristics (mass, dimensions, exposure to flow) are used to calculate a threshold flow velocity (U), expressed as
where a, b, and c are boulder dimensions (long, intermediate, and short axes), ρs and ρw are the density of the solid (boulders) and water, respectively, and CD and CL are coefficients of drag and lift, respectively, given as constants (their values are discussed in the next section).
In Nott (2003b) second step, velocity is used to calculate wave height based on two simplifications; first, that flow velocity in a shallow-water wave is
and second, that the velocity of a tsunami surging across a dry surface is
Equations (2) and (3) are classic expressions (Friedrichs, 1948; Keulegan, 1950; Nistor et al., 2009) in which U is velocity, g is the acceleration due to gravity, and H is water depth. Nott (2003b), however, defines H as wave height. He then generalizes these relationships as
defining δ as a “wave type parameter, which differs as a function of the difference in speed between various wave heights.” Then, rearranging this as U2 = δgH, and substituting δgH for U2 in Equation (1), he arrives at
By introducing the “wave type parameter” δ, Nott (2003b) was able to construct an equation that—if δ is known—permits “wave height” to be estimated simply from boulder dimensions.
Nott (2003b) comes to this point through some mathematical sleight of hand, having transformed water depth in the shallow-water wave Equation (2) to a wave height in Equation (5). However, in the context of Ritter's (1892) dam-break flow (on which this approach is also based), the wave height at the shoreline that Nott defines can be considered as a pre-collapse water depth. He errs also in Equation (4), failing to signal that δ should actually be √δ for the rearrangement and generation of Equation (5) to work as he has written it.
Nott (2003b) uses Equation (5) as the basis for more detailed consideration of hydrodynamics in specific circumstances: i.e., when the pre-transport location of the boulder is subaerial or joint-bounded in the bedrock. Equation (5) is also the jumping-off point from which subsequent workers (e.g., Pignatelli et al., 2009; Barbano et al., 2010; Benner et al., 2010; Lorang, 2011; Nandasena et al., 2011b; Engel and May, 2012) extended and refined the analysis of boulder hydrodynamics. It is important to realize, however, that what Nott (2003b) characterizes as “wave height” (and bearing in mind that this usage is perpetuated in subsequent applications of the Nott Approach) must, in reality, be some modified water depth, more akin to flow thickness than to orbital wave height. Nott's (2003b) use of the shallow-water wave equation to drive his derivation of flow velocity and wave height ignores the fact that, especially in the sub-aerial setting, the waves have shoaled and/or broken, and the flow surging across the dry-land platform is no longer a wave. Nott assumes an identity between the onshore flow thickness and the offshore wave height, which is misleading.
To render Equation (5) a diagnostic tool for distinguishing between tsunami and storm deposits, Nott (2003b) further asserts that δ = 4 for tsunami and δ = 1 for flow associated with breaking storm waves. So, he sets up Equation (5) in two forms: one in which is replaced by 0.25 (for tsunami) to yield tsunami height Ht,
and one in which it is replaced by 1 (for storm waves) to yield storm-wave height Hs.
Thus, the “wave type parameter,” δ, is baked into the Nott Approach, and its status as a potential variable is papered over. The δ values having been specified, all subsequent operations result in a 4-fold difference in wave heights for storm waves vs. tsunami (Switzer and Burston, 2010; Kennedy et al., 2017). Nott goes on to derive three different versions of Equation (5) (Nott, 2003b, his equations 13, 26, and 34), with slight modifications specific to different pre-transport settings (submerged, subaerial, and joint-bounded). But in each case—no matter what the input—Nott Approach equations are pre-conditioned to return the answer that a storm wave must be four times larger than a tsunami to do the same amount of work.
Nott's Storm Wave Height (Hs) vs. Significant Wave Height (Hs): Term Confusion and Its Consequences
In the original equations (Nott, 2003b), storm wave height at breaking point is given as Hs. In choosing this term, Nott overlooked the fact that “Hs” is an internationally recognized term for significant wave height, the standard metric used to describe sea states (e.g., Forristall, 2000; Schiller and Brassington, 2011; Ardhuin et al., 2019). The unfortunate duplication of nomenclature appears to have caused confusion. The Nott Hs appears to have been conflated with meteorological Hs in many subsequent studies that directly compare Hs (significant wave height) from wave data with calculated Nott Hs (storm wave height).
Individual waves can be much larger than the significant wave height, both in the deep-water wave spectrum and also because of amplification that can occur during shoaling. Using unmodified buoy data as a proxy for maximum wave height, therefore, systematically underestimates the possible heights of storm waves by a factor of at least two (Appendix). Simply taking this fact into consideration would be sufficient to force a re-analysis of many CBD for which storm deposition was rejected based on insufficient wave heights in the buoy record.
Inconstant Constants: Drag (CD) and Lift (CL)
The coefficients of lift (CL) and of drag (CD) are prominent in the Nott (2003b) equations and their descendants (e.g., Pignatelli et al., 2009; Barbano et al., 2010; Benner et al., 2010; Lorang, 2011; Nandasena et al., 2011b; Engel and May, 2012).
Variability in CD is well-known from numerous laboratory tests and will be affected by environmental factors including substrate roughness and flow turbulence. This is acknowledged in the values used by Nott (1997, 2003a,b), which range from 1.2 to 3.0. It is difficult, however, to tell which value is correct in any given situation. Clast shape will also affect drag, and in the case of natural irregular objects, this will vary depending on how the boulder is oriented in the flow. Nott (2003b) pointed out that his equations were sensitive to small variations in CD. For larger boulders, a factor of 2 difference in CD can result in a several meter difference in projected wave height.
The value for CL ubiquitously used in CBD studies is 0.178, which originally comes from measurements of fine pebbles (≈7 cm diameter) (Einstein and El-Samni, 1949). This now-standard value has become largely detached from its original, restricted context; its continued application in a wide range of situations is justified by citing previous usage rather than through a consideration of whether the number is actually applicable (Rovere et al., 2017). In fact, calculation and numerical simulations (Weiss and Diplas, 2015; Rovere et al., 2017; Herterich and Dias, in press) indicate that CL for boulders is about an order of magnitude greater and more likely to be in the range 1.5–4. Including this variability would make a big difference in the calculated wave heights for boulder transport: increasing CL from 0.178 to 2 substantially decreases the estimated wave height required to mobilize boulders.
Problems With Nott's “Wave Parameter” δ—a Froude Number in Disguise
The deep flaw in the Nott Approach is that Nott (2003b) “wave type parameter” δ (Equation 4) is, in fact, simply the square of the Froude number (Fr):
Thus Nott (2003b), by imposing specific δ values for tsunami and storm waves, is making strong presuppositions about their hydrodynamic states: i.e., that tsunami flows are supercritical, with Fr = 2 in all cases, and that wave-derived flows have Fr = 1.
We now know that such categorical statements are inappropriate. Tsunami flows commonly have Fr < 2, with values well below 1 in many cases (Matsutomi et al., 2006; Nandasena et al., 2013; Tang and Weiss, 2015; Montoya et al., 2017; Chen et al., 2018; Montoya and Lynett, 2018). Likewise, storm waves generate onshore flows that are supercritical: Fr > 1 is not uncommon (e.g., Tsai et al., 2004; Kuiry et al., 2010), and increasing numbers of studies show that wave overwash can have Fr > 2 (Holland et al., 1991; Matias et al., 2014, 2016).
Since both tsunami and storm-wave flows can have a wide range of Fr values, Nott (2003b) “wave type parameter” δ is a gross oversimplification, and the Nott equations cannot discriminate between storm waves and tsunami. But despite subsequent re-evaluations and modifications of Nott (2003b) equations (e.g., Pignatelli et al., 2009; Barbano et al., 2010; Benner et al., 2010; Lorang, 2011; Nandasena et al., 2011b; Engel and May, 2012), the core approach and implementation have remained the same. The parameter δ has persisted largely unchallenged.
The Test Case: Boulders Moved by Storms in Winter 2013-2014
To illustrate the ineffectiveness of the Nott Approach, we apply a series of wave-height equations (Nott's original, and several derivatives) to boulders on Ireland's Aran Islands (Figure 2) that were moved by storm waves in winter 2013–2014 (Cox et al., 2018a; Cox, 2019).
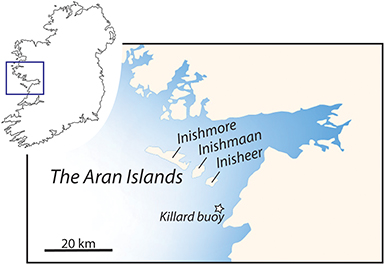
Figure 2. Location of the Aran Islands, off the west coast of Ireland. Map base© maproom.net. Coastal boulder deposits (Figure 1) occur along the Atlantic-facing coasts of all three islands.
Aran Islands' Coastal Boulder Deposits
CBD on the Aran Islands (Figure 1) are well-documented, and the reader is referred to the literature for details on their geomorphology (e.g., Williams and Hall, 2004; Hall et al., 2010; Cox et al., 2012, 2018b). Boulder transport was recorded using before-and-after photography (Figure 3), at surveyed sites for which elevation and inland distance were also measured. The dataset (Supplementary Table 1) includes more than a thousand boulders, ranging in mass from 0.01 to 620 t, dislodgement of which during winter 2013–2014 is fully documented (Cox et al., 2018a).
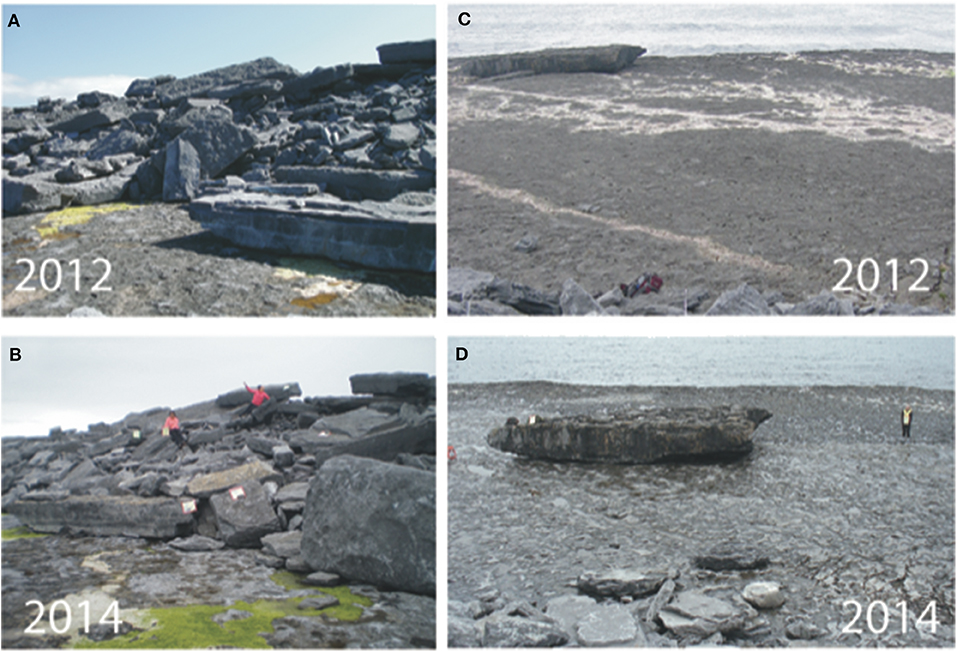
Figure 3. Examples of Aran Islands CBD that underwent change during the 2013-2014 storms. (A,B) show repeat photography of a site on Inishmaan, at the far end of the coastline in Figure 1A. There are many differences in clast configuration between the two images, but the tagged boulders in (B) are clasts 754, 757, 759, 761, 762, and 763 (location 60) in Supplementary Table 1. (C,D) show a site on Inishmore, close to the area shown in Figure 1B. This is location 16 in Supplementary Table 1, boulder number 261. The boulder weights about 210 t and, from a starting location 10 m above sea level and 27 m inland, it moved 22 m in the 2013-2014 storms to its current location 49 m inland (Cox, 2019).
Boulder movement occurred all along the islands' 13 linear km of CBD. Before-and-after measurements from hundreds of locations, regularly spaced along the deposits (Cox et al., 2018a), demonstrate that we are not looking at the effects of a few locally-focused monstrous waves. In addition, the boulders that moved in the 2013–2014 storms were a representative subset of clasts at each location: the recorded size distributions (Cox et al., 2018a) were similar to background clast population statistics for the same locations (Cox et al., 2012). Thus, we consider that boulder transport during the winter of 2013–2014 was not the aberrant effect of one or two waves but records storm interaction with the boulder deposits, doing sedimentologic work comparable to that which had been done in the past.
The Aran Islands (Figure 1) represent an ideal test case for the Nott Approach, such that the results are generalizable to other locations. Among the ~100 locations where boulders were measured, there is a wide range of topographies (sea level up to 26 m elevation, and shoreline to 220 m inland), as well as boulder masses spanning four orders of magnitude (0.01–620 t) (Cox et al., 2018a). The boulders occur as isolated clasts, as clusters, and as fully developed boulder ridges, and the islands' coastlines include cliffs, stepped coasts, and broad, gently inclined shore platforms (Williams and Hall, 2004). The coastlines range from linear to deeply embayed, so that waves approach and interact with the coast in various ways; and a range of data on sea states in winter 2013–2014 are available (Janjić et al., 2018; Janjić, 2019).
Wave Conditions in Winter 2013–2014
The winter of 2013–2014 was the stormiest on record in the Ireland-UK region (Matthews et al., 2014; Kendon and McCarthy, 2015; Masselink et al., 2015), with numerous Atlantic storms scourging the Irish seaboard. Winter-averaged Hs was ≈ 40% higher than average, and off the west coast of Ireland, there was a 5-fold increase (relative to the 67-year average) in the number of days with extreme sea states (defined as Hs greater than the average annual 0.5% percentile value; Masselink et al., 2016). Central pressures for several events were <950 hPa (equivalent to category 3 hurricanes), and one reached as low as 927 hPa (Kendon and McCarthy, 2015), putting it in the category 4 hurricane equivalent range. In combination with the substantial storm duration and the large effective fetch, which predispose the North Atlantic region to extreme wave building (Hanafin et al., 2012), the stage was set for dramatic conditions.
The storms produced a substantial geomorphic response. Extensive erosion of sediment and bedrock occurred along northwestern European coastlines (Kandrot et al., 2016; Masselink et al., 2016). Significant infrastructural impacts included severing of a major railway line at Dawlish (UK), as well as damage to harbors, buildings, and coastal defense works. Out to sea, geophones on the Eddystone lighthouse registered ≈3,000 structure-shaking events during the winter (Raby et al., 2016).
Indeed, the ocean waves produced by these storms were impressive. Meteorological and research buoys in the Atlantic Ocean, northwest and west of Ireland, recorded more than 60 h with Hs ≥ 10 m between October 27, 2013, and March 3, 2014 (INFOMAR, 2018; Janjić et al., 2018; O'Brien et al., 2018). The maximum buoy Hs was 15 m (at the 62093/M4 location, on January 26, 2014: Janjić et al., 2018), which coincided with a record individual wave height of 23.4 m measured by the same buoy (Tiron et al., 2015; O'Brien et al., 2018). The extreme sea states took their toll on marine meteorological instruments: the 62093/M4 buoy was non-operational for much of the winter (Janjić et al., 2018), and 62095/M6 broke its moorings after recording a 13.6 m Hs on January 6, 2014 (Marine Institute, personal communication). Luckily, satellite altimetry data (Queffeulou, 2004, 2013; Ardhuin et al., 2019) provides additional sea-state information (Figure 4): at the 62095/M6 location; on February 1, 2014, satellite data indicate Hs of 17.6 m (IFREMER wave height product; Queffeulou, 2013).
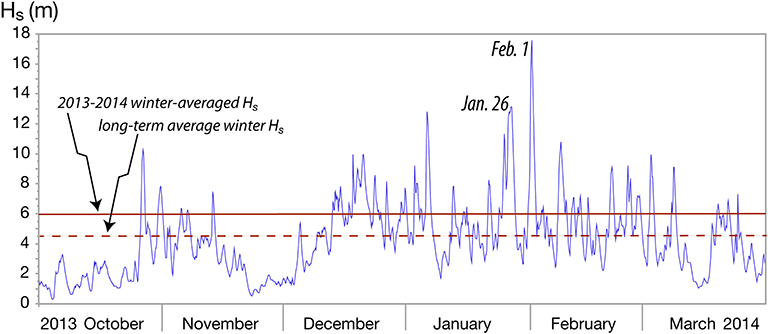
Figure 4. Sea states at the 62095/M6 location in winter 2013-2014 (October-March), derived from satellite data available at ftp.ifremer.fr/ifremer/cersat/products/swath/altimeters/waves. (Database is described in Queffeulou, 2013). Average winter Hs values are from Masselink et al. (2016).
The wave heights of greatest interest, however—those that impacted the Aran Islands in winter 2013–2014—are not measured by the off-shelf deepwater buoys. Waves may attenuate when crossing a shallow continental shelf (Ardhuin et al., 2003), so heights are expected to diminish on approach to land. We therefore use wave model outputs (Janjić, 2019), in conjunction with inshore buoy data (collected by a Waverider buoy 3.7 km from Killard Co. Clare: Atan et al., 2016; Janjić et al., 2018), to infer likely wave heights at the Aran Islands.
The largest coastal waves probably occurred during the strongest events: January 26 and February 1, 2014 (Janjić et al., 2018; Janjić, 2019). For the January 26 event, model outputs for the peak of the storm—when Hs at the 62095/M6 buoy was >13 m—indicate a maximum Hs for the Aran Islands of 11 m (at northwestern Inishmore). Modeled Hs ranged from 5.5 to 9.5 m along the western coast of Inishmaan and from 6 and 8.5 m around the southern tip of Inisheer (Janjić et al., 2018; Janjić, 2019). More extreme conditions occurred during the February 1 storm, when satellites measured a maximum Hs >17 m at the 62095/M6 location (Figure 4: IFREMER wave height product; Queffeulou, 2013). This storm generated a maximum modeled Hs at the Aran Islands of ≈12 m (again at the northwestern end of Inishmore). Elsewhere around the islands, the waves were less extreme, with modeled Hs in the range 7–10.5 m along western Inishmaan, and 9–11 m off southern Inisheer (Figure 5).
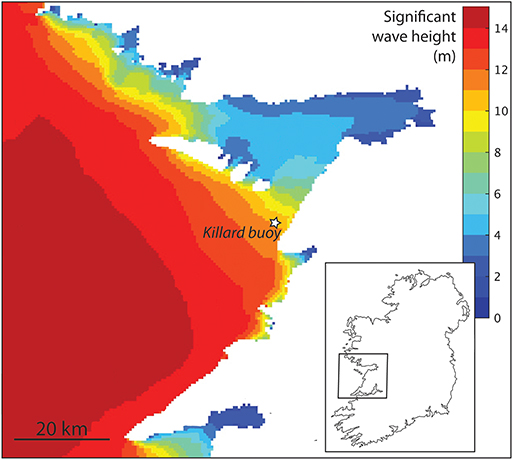
Figure 5. WAVEWATCH III model outputs showing Hs from the peak of the February 1, 2014, storm, which generated the largest seas of winter 2013-2014. From Janjić (2019).
Analysis of the difference between Hs measured at the Killard buoy (Figure 2) and model outputs indicate that the model under-represents the inshore wave heights by about 0.3 m (Janjić et al., 2018). Rounding our estimates to the nearest half-meter, we therefore estimate that during winter 2013-2014, the Aran Islands experienced Hs as great as 12.5 m at the northwest tip of Inishmore (Figure 5). The majority of the Aran Islands coastline had Hs around 10 m, and in some places (southeastern Inishmore and southern Inisheer) it was only about 9 m.
Maximum Possible Wave Heights at the Aran Islands
Maximum wave height (Hmax) can be predicted from Hs and storm duration (Krogstad, 1985), and although the statistics are complicated and poorly constrained for strong sea states and for storms of relatively short duration, the value 2Hs is the most commonly used operational predictor for Hmax. We ignore the nearshore reduction of wave height due to breaking (Thornton and Guza, 1983) to maximize estimated Hmax (thus providing the greatest opportunity for overlap with estimates developed using the Nott Approach). Therefore, we estimate that the Aran Islands might (emphasis on “might”) have experienced maximum wave heights in the range 18–25 m, with the largest values at the most northwesterly sites.
We stress that these maximal waves are rare events within a storm sea and that few are to be expected. Moreover, the existence of a maximal wave does not imply that the wave arrived ashore at that height: interference in the nearshore area, particularly reflection from the islands' cliffed coasts, can enhance but can also damp waves (Earlie et al., 2015).
Non-linear interactions with steep coastal bathymetry may have locally amplified some waves (Viotti et al., 2014; Akrish et al., 2016; Brennan et al., 2017), and height fluctuations may be enhanced by stronger depth variations (Viotti and Dias, 2014). But these effects will be distributed across the wave spectrum, and it is statistically very unlikely that the largest waves (few in number in any storm) would experience significant height increase. This is borne out by the statistics of freak waves, for which the typical probability is of order 10−4. For example, wave data from areas with steep bathymetry give an occurrence probability <8.5 × 10⁻⁴ for waves >2Hs (Chien et al., 2002). This indicates that even where conditions are conducive to wave amplification, the largest waves are unlikely to be the ones that grow taller.
It takes only one wave to move a set of boulders at any given location, but very large boulders at or near the limit of local transport competence were moved all along the Aran Islands coastline during the winter of 2013-2014 (Cox et al., 2018a; Cox, 2019). It is difficult to imagine that hypermagnified maximal waves were so frequent as to be responsible for all the transport events.
We focus, therefore, on likely Hmax based on the sea state and take wave heights from the February 1 model (Figure 5; Janjić, 2019) as the best estimate of extreme wave conditions at the Aran Islands in winter 2013-2014. In aggregate, these data indicate that deepwater seas had Hs in the range 13–17 m on several occasions in winter 2013-2014 and that those seas, transmitted landward across the continental shelf, experienced some attenuation. In consequence, Hs at the Aran Islands did not exceed 13 m, and large lengths of the coastline had Hs of less than that (Figure 5). Wave statistics predict a small possibility that a few individual waves at the coast may have reached pre-breaking heights in the range 18–25 m.
The modeled wave heights near the Aran Islands (Figure 5), and our inferred likely Hmax values, are far from precise. They provide some sense of possible conditions at the coast but should be taken as indicator values only. Seas at some locations may have been more intense; other places will have seen lower wave activity. Bathymetric and topographic variation below the scale of the model will have focused and intensified wave heights in some areas and dampened them in others. The take-home point, however, is that all data—buoy, satellite, and model—converge to produce a picture of intense but not extreme wave energy at the coast.
Estimating Wave Heights Required to Move Aran Island Boulders Using the Nott Approach
We calculate nominal wave heights for the Aran Islands dataset (Cox et al., 2018a) using two equations: the original Nott (2003b) version, and a widely-used modification based on the work of Nandasena et al. (2011b). Other widely cited Nott-Approach equations—(e.g., Pignatelli et al., 2009; Barbano et al., 2010; Benner et al., 2010; Lorang, 2011; Engel and May, 2012)—produce similar or in some cases greater values; therefore, our discussion and the conclusions we draw apply equally to all versions of the Nott Approach.
Nott (2003b) provides equation variants for three different pre-transport settings (submerged, subaerial, and joint-bounded), but we consider only the subaerial case because the Aran Islands boulders were already sitting on the supratidal platform prior to the 2013-2014 storms (Cox et al., 2018a; Cox, 2019). Equation (9) (Nott wave height H) is from Nott (2003b, his equation 26)1. Equation 10 (Nandasena wave height H) is from Mottershead et al. (2014, their equation 2)2.
Rock density ρs is 2.66 t/m3 (the mean of 6 hand samples, measured by volume displacement; range 2.45–2.70); water density ρw is 1.025 t/m3 (representative value for seawater); a, b, and c are the long, intermediate and short axes of the boulders (measured in the field); ü is instantaneous flow acceleration (given a value of 1 m/s2 by Nott, 2003b); g is the acceleration due to gravity (9.81 m s−2); Cm is the coefficient of mass (2, as recommended by Nott, 2003b) CD is the drag coefficient (1.5, as recommended by Nott, 2003b); CL is the lift coefficient [0.178, as used by Nott (2003b) and many others]; θ is the platform slope. (Note that for this exercise, we apply the equations with parameter values as recommended by their authors, but, per the discussion above, the values for CL and CD are questionable). The data are shown in Supplementary Table 1.
Supplementary Table 1 shows calculated H values, both the raw outputs from Equations (9) and (10) (given as Nott H and Nandasena H) and the topographically adjusted values (given as H+ elevation), to account for the fact that many boulders are located well above sea level. The adjustment was a simple addition of boulder elevation to the raw computed H to approximate an incident wave height that would be needed to produce the required water elevation at the boulder location. Although many boulders are not only above sea level but also far inland, we did not apply any additional correction for the wave height decrease or energy loss that would of course occur as the shoaling wave crossed the shore platform and surged against gravity. Thus, the Nott H + elevation and Nandasena H + elevation values are minimum estimates for illustrative purposes (as described below).
Results and Interpretation
Wave heights calculated from Equation (9) (Nott H) range as high as 45 m, and those from Equation (10) (Nandasena H) range to 22 m (Figure 6). More than half the Nandasena H values and about two-thirds of the Nott H values exceed the maximum Hs for winter 2013-2014. Numerous values also exceed the likely Hmax.
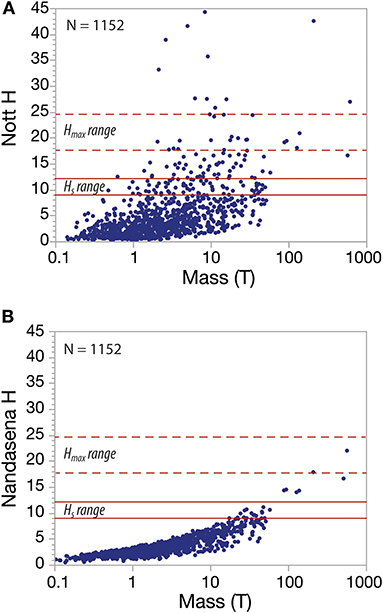
Figure 6. Raw hindcast wave heights for the Aran Islands in winter 2013-2014, plotted as a function of boulder mass. (A) shows results from the original Nott (2003b) formula (Equation 9), and (B) shows those from the variant based on Nandasena et al. (2011b) (Equation 10). Red horizontal lines show the range of Hs (solid red: model outputs from Figure 5) and Hmax (dashed red: estimated as 2 Hs). The largest waves in (A) are not associated with the largest boulders because of the shape dependency built into the Nott (2003b) equation, which predicts that slab-like boulders will be more difficult to move. The Nandasena-based version has a different shape dependency. The original Nott equations return wave heights up to 45 m, whereas those from the Nandasena-based equations are generally significantly lower.
Equation (9) (Figure 6A) returns large wave heights for small clasts, and small heights for some quite massive boulders, because it is tuned for shape: clasts presenting a proportionally small cross-sectional area to flow (small c-axis relative to a- and b-axes) are predicted to be more difficult to move. Nandasena H (Figure 6B), in contrast, is a fairly simple function of clast mass. In addition, because of differences in how lift force is derived (Nott, 2003a; Nandasena et al., 2011a), the a-axis plays a strong role in the Nott H numerator (Equation 9), whereas in Nandasena H (Equation 10) that prominence falls to the c-axis. Thus, for most boulders, Nott H will be larger than Nandasena H, sometimes by a factor of almost twenty.
The majority of wave heights returned by the equations may seem reasonable at first glance, as ~90% of them are ≤ 20 m, within the ballpark of Hmax estimates for the Aran Islands that winter (Figure 6, Supplementary Table 1). But it is not that simple. Hmax is an estimate, not a measurement, and it is statistically rare. Waves that large would be few, if they occurred at all.
It takes only one big wave to move a big boulder; but because boulders were moved at multiple locations strung all along the Aran Islands coastline (as well as at other sites on the mainland not included in this dataset: Cox et al., 2018a), the transport events cannot simply have been the work of one or two outsize waves; multiple waves must have been involved in the transport events. And the likelihood that they could all have been Hmax is highly unlikely.
Furthermore, many of the boulders, including some very large ones, were located at considerable elevation above sea level, and/or tens of meters inland. The calculated Nott and Nandasena H values are predicated on the full height of the wave being elevated above the boulder transport surface (Nott, 2003b; Nandasena et al., 2011b). Thus, for locations that are inland and above sea level (which is where the majority of coastal boulder deposits are found), deposit elevation must also be factored in (e.g., Lorang, 2011; Shah-Hosseini et al., 2011, 2013).
When adjusted for elevation (Supplementary Table 1), and, seen in the context of boulder locations relative to sea level (Figure 7), the wave-height calculations are clearly problematic. Even disregarding the two dozen or so Nott H outliers that return wave heights 35–60 m, many of the values (~10% for the Nandasena equation and 20% for the Nott equation) exceed the 25 m estimated Hmax for that winter (Figures 7A,C).
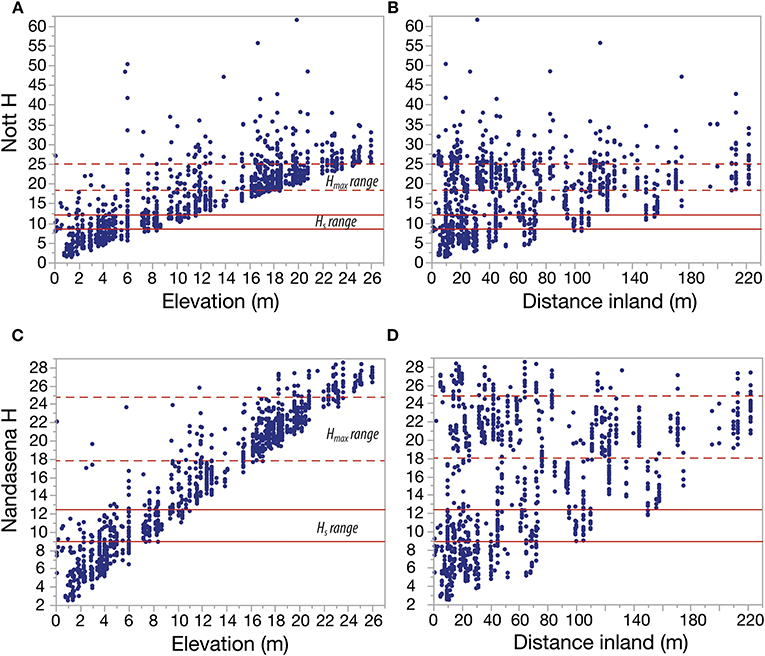
Figure 7. Hindcast wave heights for the Aran Islands in winter 2013-2014, adjusted for topography by adding boulder elevation to the wave height. (A,B) show results for the original Nott (2003b) equation as a function of boulder elevation (A) and location inland of the shoreline (B). (C,D) show the same relationships for the Nandasena-based equation. The results are displayed as a function of boulder elevation and distance inland. Note that the data have not been corrected for inland decay of wave energy; thus, the heights shown are “minima.” Red horizontal lines show the range of Hs (solid red: model outputs from Figure 5) and Hmax (dashed red: estimated as 2 Hs). Note that the Hs and Hmax values would apply only at the coast (i.e., at or near 0 m inland on the x-axes in B,D) and are relative to sea level.
The shortcomings of the equations become more obvious when examined in the context of inland distribution (Figures 7B,D). For example, Nandasena H values are 19–27 m for boulders with initial locations 190–220 m inland. These results are conservative estimates of the disconnect between estimated wave heights and reality, because inland decay in height would also obviously apply (Cox and Machemehl, 1986; Shao et al., 2006). Applying additional corrections for runup elevation (e.g., Cox and Machemehl, 1986; Noormets et al., 2004; Barbano et al., 2010; Engel and May, 2012; Mottershead et al., 2014) would further exaggerate the wave height misfit.
Equations (9) and (10) return reasonable values in only about 15% of cases (where “reasonable” is generously defined as an elevation-adjusted wave height within a few m of the regional Hmax estimate, ≤ 20 m inland of the shoreline). With greater distance inland, things are more complicated. In cases of extreme storm inundation, wave heights up to several m might be within the realm of possibility even at many 10s of m inland. But wave heights of 18–45 m at distances 160–220 m inland (Figures 7B,D) are clearly impossible. Even in cases where the results seem plausible—possibly reflecting conditions where waves of the expected height produced onshore flows with Froude numbers consistent with the δ parameter—the acceptable output is purely accidental.
It is important to note also that we did not vary CD or CL in this test case: changing those to reflect the likely range of values would create an even larger range of outcomes. The effects of wave period and storm surge are likewise not included in the analysis. This further underscores the fact that Nott Approach equations do not provide meaningful estimation of the wave conditions required to move CBD.
Discussion
Nott Approach equations for wave height, which purport to distinguish between storm wave and tsunami transport of CBD, depend on a central premise: that flows generated by storm waves and tsunami are hydrodynamically entirely distinct from one another, such that one can assume a characteristic Froude number for each. Systematic review shows that premise, codified in the δ parameter (Equations 4, 5, 9, 10), to be invalid. Therefore, there is no hydrodynamic basis for using the Nott equations—or any of their derivations—as a mechanism for determining wave height from boulder dimensions.
The ways in which waves interact with the coast are determined not simply by the wave-generating mechanism but also by complex interplay with bathymetry and wave-wave interactions during shoaling (e.g., Weiss and Sheremet, 2017). In many cases, infragravity waves and/or surf beat will add additional long-period components to storm-wave activity (Holman et al., 1978; Bricker et al., 2014; Castelle et al., 2015; Roeber and Bricker, 2015). Thus, onshore flows generated by storm waves and by tsunami overlap considerably in terms of key parameters such as Froude number, flow-front velocity, and their power to dislodge boulders (Weiss, 2012; Weiss and Diplas, 2015). But by ignoring the overlaps and asserting specific Froude numbers for tsunami and storm-wave flows, the Nott Approach systematically undervalues the power of storm waves. And—particularly when the comparison data come from significant wave height records—it downplays or ignores the importance of extreme wave events and their potential impacts on coasts.
These problems have been addressed by previous workers, as reviewed in the Introduction; and many Nott Approach users incorporate some kind of statement acknowledging deficiencies in the equations. But there is a prevailing view that although the Nott Approach is imperfect, it can provide some kind of baseline indicator of the likely wave heights required for clast emplacement, and so it continues to be used, known flaws and lack of field validation notwithstanding.
However, the test case analyzed in this paper—applying Nott Approach equations to boulders moved by storm waves in winter 2013-2014—reveals the discordance between a real-world event and Nott-Approach predictions (Figures 6, 7). Although the boulders (and associated wave data) come from a single location (the Aran Islands), the results are not site-specific but general: the mismatch between equation outputs and actual wave conditions—to say nothing of the extravagantly large wave heights nominally required to move some of the boulders—is directly attributable to flaws in the modeling assumptions. Results clearly illustrate that there is no analytical value in the Nott Approach: given that the equations over-estimate the storm wave heights needed to move boulders—by radical amounts, in some cases (Figures 6, 7)—then clearly they cannot be used as a diagnostic tool in areas where the storm and tsunami histories are unknown. Indeed, they cannot be used for any reliable wave-height calculation.
This has particularly large implications for the application of Nott Approach equations to ancient deposits. The δ parameter is an insurmountable barrier to wave height interpretation in these cases, because the Froude numbers of flows that emplaced boulders in the past are unknowable. There is no way to test whether the δ values built into Equations (6) and (7) are appropriate for boulders deposited in the past. Wave heights hindcast from boulder masses via these equations are, therefore, essentially meaningless.
Amid the criticism, we emphasize that Nott (2003b) equations were seminal, in that they did provide a leap forward in unpacking dynamical controls on boulder transport. They were the springboard for many subsequent studies, and almost all recent work on CBD traces back in some way to Nott's original work. As a thought experiment on boulder-wave hydrodynamics, the equations were a useful first step.
But, at this point, the Nott Approach is doing more harm than good, because the more often these equations are used, the greater apparent authority they acquire. Ongoing use has normalized the equations, so that their bona fides are rarely questioned, and this becomes self-reinforcing. As a case in point, one recent study (Kennedy et al., 2019) implemented wave hindcasting equations based on the extent to which they had been applied in previous work and provided a table of Google Scholar citations in support of the choices. The ease of application of the Nott Approach, and the citation capital it has built up, fuel its continued use.
Because of the deep flaws in the Nott Approach, coupled with faulty incorporation of Hs data, existing interpretations of boulder emplacement mechanism may be incorrect in some cases. This analysis shows that storms cannot simply be dismissed as unlikely based on boulder size. Therefore, there is a substantial catalog of CBD currently interpreted as tsunami deposits that might in fact record storm events.
We stress “might.” Although we focus on the under-appreciated role that storms can play in the genesis and evolution of CBD, we are not asserting that all CBD are storm generated. Some may indeed be tsunami deposits or may have a tsunami component in their history. We emphasize, however, that storms should be considered the default interpretation, which needs to be refuted before a tsunami interpretation can be preferred.
Future Directions: the Need for Integrated Multidisciplinary Analysis
CBD can play a central role in understanding storm wave runup and power, but the research focus must move away from the flawed association between boulder size and emplacement wave height. Simply knowing that the equations are unreliable is in itself a step forward if it deters workers from applying them as an analytical tool. But to arrive at a full understanding and to develop reliable quantitative relationships down the road, three things are important: re-evaluation of existing Nott-Approach-based interpretations of CBD, establishing comprehensive, replicable methodologies for field studies of CBD, and pushing forward with modeling and experimental studies in which dynamic interactions between waves and boulders can be evaluated and measured in a systematic way.
Work in recent years reveals that there is substantial hydrodynamic overlap between tsunami bores and those generated by extreme coastal storm waves. In the particular case of boulder dislodgement and motion, multiple sensitivities—including mass, slope, and roughness— are difficult to quantify. Although analyses indicate that it may be possible to develop techniques to reliably differentiate storm from tsunami transport, the discipline is not yet at that point, and careful field, numerical, and laboratory experiments are required to identify and quantify relevant parameters and reduce uncertainties (Weiss and Diplas, 2015; Zainali and Weiss, 2015; Jaffe et al., 2016; Bressan et al., 2018).
CBD Currently Interpreted as Tsunami Deposits Should Be Revisited
In cases where a tsunami origin for CBD has been posited based on Nott Approach analysis, we invite authors to look more closely at the constraints and reconsider whether extreme storm waves might be implicated. Some CBD are doubtless due to tsunami transport, but the disconnect demonstrated here between wave heights returned by Nott Approach equations and the ability of storm waves to transport large boulders means that in cases where the interpretation of depositional mechanism hinges on the Nott Approach, that interpretation should be revisited in light of the findings presented here.
Best Practices for Field Measurement of CBD Are Important
Future investigations of CBD should include precise topographic contexts for the boulders (via differential GPS or quantitative photogrammetry), connections to offshore bathymetric profiles, clear articulation of the available wave data and understanding of whether it represents significant wave height or individual wave heights, and geochronologic control where possible. Some studies currently incorporate some or all of these elements, but we propose that they should be standard practice for all field analysis of CBD.
In addition to fully characterizing the topographic and geomorphic context of CBD, studies should aim to determine the local wave climate, in terms of decadal and centennial significant wave height, with statistical analysis of millennial recurrence intervals for maximal sea states, the likely Hmax on decadal, centennial, and millennial time scales, a consideration of the effects of wave period and storm surge, and an evaluation of the potential for amplification over the local bathymetric profile.
Experiments and Modeling Should Be Key Components of Future Studies
Field measurement of boulders after deposition is important, but full understanding requires hydrodynamic and fluid mechanics analysis of the active system. The lack of physical understanding of shoaling high-energy waves, of wave-boulder interactions, and of the effects of platform surface roughness, is a great barrier to understanding CBD emplacement. This realization was at the core of Nott's (1997; 2003b) original analysis, but it continues to be an open issue. Given that simplistic linear approaches are largely invalid, more integrative and nuanced scaled wave-tank experiments (e.g., Bressan et al., 2018; Cox et al., 2019) and numerical models (e.g., Akrish et al., 2016; Herterich et al., 2018a,b) can fill that gap, which will also help constrain field observations.
Among the unknowns is the role of impulse in initiating motion. The short-lived but very large pressures and accelerations generated by wave impact can contribute to boulder transport (Cox and Cooker, 1999), but the specifics are poorly known. For example, a trapped air pocket in a plunging breaker enhances the pressure impulse (Wood et al., 2000; Dias and Ghidaglia, 2018), but laboratory measurements of the aerated region are difficult to make, and so data are lacking (Ryu and Chang, 2008). Turbulent flow conditions fluctuate rapidly, with velocities that vary widely in space and time (Ryu et al., 2007); and while time-averaged velocities and stresses may be below the threshold, the fluctuating forces can briefly produce impulses large enough for initiation of motion (Diplas et al., 2008).
Another major component of ongoing investigations should be thorough quantification of lift and drag coefficients and analysis of controls on their magnitudes and variability (Diplas et al., 2008). Not only is this central to full understanding of boulder transport, but it is important for evaluating the stability (or lack thereof) of coastal infrastructure—seawalls, breakwaters, piers, and promenades—especially those involving rubble, riprap, or concrete slabs (e.g., Kobayashi, 2016; Losada et al., 2016; Guler et al., 2018).
In Conclusion
Because CBD preserve records of extreme wave activity—and are therefore important for coastal hazard analysis—it is crucial that their emplacement mechanisms are not misinterpreted. This systematic review shows the shortcomings of existing hydrodynamic approaches and reveals that many CBD currently interpreted as tsunami deposits may in fact record maximal effects of storm water incursion. CBD that have been attributed to tsunami based on boulder size and local wave climate should therefore be re-examined and considered as possible storm indicators.
Climate is changing, sea level is rising, and 10% of the world's population lives in the low-elevation coastal zone, less than 10 m above current sea level (McGranahan et al., 2007; Neumann et al., 2015). Thus, the establishment of critical storm thresholds for inundation (e.g., Armaroli et al., 2012) and coastal vulnerability maps (e.g., Kantamaneni et al., 2019) is becoming imperative. Understanding the extremes of storm behavior—now and in past centuries—will help us better prepare for the storms of the future, and including dynamic coastal processes in both short- and long-term hazard planning is essential (Barnard et al., 2019). CBD provide pinning points for the elevations and distances achieved by high-energy seawater incursions.
Storm-flooding data points from CBD can go beyond the limitations of the instrumental record and should therefore be viewed as a cornerstone archive for understanding long-term coastal risk and vulnerability. A fundamental step is to decode the relationship between clast size, flow velocity, and the heights of associated waves so that we can (a) properly test whether uncategorized CBD worldwide are records of storminess rather than tsunami and (b) use CBD to help us understand the nature of storm wave activity at coasts. It is equally important to re-examine—through a properly calibrated hydrodynamic lens—CBD that have been attributed to tsunami based on boulder size and local wave climate.
The consequences of storm deposits being wrongly attributed to tsunami are substantial. First, incorrect data relating to event energy, runup distance, and timing are assimilated into tsunami hazard evaluations. Second, those same data then fail to be incorporated into storm hazard models. Building models from inappropriate datasets undermines both forward planning and, potentially, public trust in the underlying science. It is therefore of the first importance that the scientific community be aware of this problem. We must work to test existing interpretations, revising them if necessary, and apply more robust approaches moving forward.
Data Availability Statement
All datasets generated for this study are included in the article/Supplementary Material.
Author Contributions
RC carried out literature and data analysis and wrote the paper. FA and FD participated in developing the ideas and organizing the manuscript. FA also provided satellite wave height data. Concepts and ideas in foundational discussions at the XWaves 2018 conference (Les Treilles, Tourtour, France) were contributed by RA, NB, CE, JH, AK, RP, AR, PS, and RW. All authors read manuscript drafts and contributed content to the developing paper.
Funding
Research was supported under the US-Ireland R&D Partnership Programme, by National Science Foundation award 1529756 (RC); Science Foundation Ireland (SFI) award 14/US/E3111 (FD, NB, and JH); and Department for the Economy Northern Ireland Grant USI801 (PS). FD also acknowledges SFI award 12/RC/2302 through the SFI Centre for Marine and Renewable Energy (MaREI), and RC acknowledges additional support from a World Faculty Fellowship through Williams College. AK acknowledges National Science Foundation award 1661015.
Conflict of Interest
The authors declare that the research was conducted in the absence of any commercial or financial relationships that could be construed as a potential conflict of interest.
Acknowledgments
This paper resulted from discussions at the XWaves 2018 conference (Les Treilles, Tourtour, France) https://lestreilles.hypotheses.org/1093. The authors gratefully acknowledge support from the Fondation des Treilles, which hosted the conference that brought together this international multi-disciplinary group of observational geoscientists and theoretical modelers. We thank Jelena Janjić for providing high-resolution versions of wave model maps from her doctoral thesis and Laura Cooke for reducing data from the Killard wave buoy.
Supplementary Material
The Supplementary Material for this article can be found online at: https://www.frontiersin.org/articles/10.3389/fmars.2020.00004/full#supplementary-material
Footnotes
1. ^The difference between Equations (7) and (9) is the addition of an inertia term for the subaerial case (see Nott, 2003b).
2. ^Nandasena et al. (2011b) did not calculate wave heights; they presented modified versions of the Nott velocity equations only. Subsequent workers, however (e.g., Mottershead et al., 2014; Biolchi et al., 2016; Deguara and Gauci, 2017; Dewey and Ryan, 2017; Pepe et al., 2018) have reorganized the Nandasena et al. (2011b) velocity equations using Nott's relationship (Equation 6), and so they are now widely used to calculate wave height and are commonly referred to as the Nandasena equations.
References
Akrish, G., Rabinovitch, O., and Agnon, Y. (2016). Extreme run-up events on a vertical wall due to nonlinear evolution of incident wave groups. J. Fluid Mech. 797, 644–664. doi: 10.1017/jfm.2016.283
Ardhuin, F., O'Reilly, W. C., Herbers, T. H. C., and Jessen, P. F. (2003). Swell transformation across the continental shelf. Part I: attenuation and directional broadening. J. Phys. Oceanogr. 33, 1921–1939. doi: 10.1175/1520-0485(2003)033<1921:STATCS>2.0.CO;2
Ardhuin, F., Stopa, J. E., Chapron, B., Collard, F., Jensen, R. E., Johannessen, J., et al. (2019). Observing sea states. Front. Mar. Sci. 6:124. doi: 10.3389/fmars.2019.00124
Armaroli, C., Ciavola, P., Perini, L., Calabrese, L., Lorito, S., Valentini, A., et al. (2012). Critical storm thresholds for significant morphological changes and damage along the Emilia-Romagna coastline, Italy. Geomorphology 143–144, 34–51. doi: 10.1016/j.geomorph.2011.09.006
Atan, R., Goggins, J., Harnett, M., Agostinho, P., and Nash, S. (2016). Assessment of wave characteristics and resource variability at a 1/4-scale wave energy test site in Galway Bay using waverider and high frequency radar (CODAR) data. Ocean Eng. 117, 272–291. doi: 10.1016/j.oceaneng.2016.03.051
Barbano, M. S., Pirrotta, C., and Gerardi, F. (2010). Large boulders along the south-eastern Ionian coast of Sicily: storm or tsunami deposits? Mar. Geol. 275, 140–154. doi: 10.1016/j.margeo.2010.05.005
Barnard, P. L., Erikson, L. H., Foxgrover, A. C., Hart, J. A. F., Limber, P., O'Neill, A. C., et al. (2019). Dynamic flood modeling essential to assess the coastal impacts of climate change. Sci. Rep. 9:4309. doi: 10.1038/s41598-019-40742-z
Benner, R., Browne, T., Brückner, H., Kelletat, D., and Scheffers, A. (2010). Boulder transport by waves: progress in physical modelling. Zeitschrift Geomorphol. 54(Suppl. 3), 127–146. doi: 10.1127/0372-8854/2010/0054S3-0022
Biolchi, S., Furlani, S., Antonioli, F., Baldassini, N., Deguara, J. C., Devoto, S., et al. (2016). Boulder accumulations related to extreme wave events on the eastern coast of Malta. Nat. Hazards Earth Syst. Sci. 16, 719–756. doi: 10.5194/nhess-16-737-2016
Boulton, S. J., and Whitworth, M. R. Z. (2017). Block and boulder accumulations on the southern coast of Crete (Greece): evidence for the 365 CE tsunami in the Eastern Mediterranean. Geol. Soc. London Spec. Publ. 456, 105–125. doi: 10.1144/SP456.4
Bourgeois, J., and MacInnes, B. (2010). Tsunami boulder transport and other dramatic effects of the 15 November 2006 central Kuril Islands tsunami on the island of Matua. Zeitschrift Geomorphol. 54, 175–195. doi: 10.1127/0372-8854/2010/0054S3-0024
Brennan, J., Clancy, C., Harrington, J., Cox, R., and Dias, F. (2017). Analysis of the pressure at a vertical barrier due to extreme wave run-up over variable bathymetry. Theor. Appl. Mech. Lett. 7, 269–275. doi: 10.1016/j.taml.2017.11.001
Bressan, L., Guerrero, M., Antonini, A., Petruzzelli, V., Archetti, R., Lamberti, A., et al. (2018). A laboratory experiment on the incipient motion of boulders by high-energy coastal flows. Earth Surf. Process. Landforms 43, 2935–2947. doi: 10.1002/esp.4461
Bricker, J. D., Takagi, H., Mas, E., Kure, S., Adriano, B., Yi, C., et al. (2014). Spatial variation of damage due to storm surge and waves during Typhoon Haiyan in the Philippines. J. Jpn. Soc. Civil Eng. Ser. B2 70, I_231–I_235. doi: 10.2208/kaigan.70.I_231
Castelle, B., Marieu, V., Bujan, S., Splinter, K. D., Robinet, A., Sénéchal, N., et al. (2015). Impact of the winter 2013–2014 series of severe Western Europe storms on a double-barred sandy coast: Beach and dune erosion and megacusp embayments. Geomorphology 238, 135–148. doi: 10.1016/j.geomorph.2015.03.006
Cattrell, A. D., Srokosz, M., Moat, B. I., and Marsh, R. (2018). Can rogue waves be predicted using characteristic wave parameters? J. Geophys. Res. Oceans 123, 5624–5636. doi: 10.1029/2018JC013958
Chen, C., Melville, B. W., Nandasena, N. A. K., and Farvizi, F. (2018). An experimental investigation of tsunami bore impacts on a coastal bridge model with different contraction ratios. J. Coastal Res. 34, 460–469. doi: 10.2112/JCOASTRES-D-16-00128.1
Chien, H. W. A., Kao, C.-C., and Chuang, L. Z. H. (2002). On the charactieristics of observed coastal freak waves. Coast. Eng. J. 44, 301–319. doi: 10.1142/S0578563402000561
Coratza, P., and De Waele, J. (2012). Geomorphosites and natural hazards: teaching the importance of geomorphology in society. Geoheritage 4, 195–203. doi: 10.1007/s12371-012-0058-0
Costa, P. J., Andrade, C., Freitas, M. C., Oliveira, M. A., da Silva, C. M., Omira, R., et al. (2011). Boulder deposition during major tsunami events. Earth Surf. Process. Landforms 36, 2054–2068. doi: 10.1002/esp.2228
Cox, J. C., and Machemehl, J. (1986). Overload bore propagation due to an overtopping wave. J. Waterway Port Coastal Ocean Eng. 112, 161–163. doi: 10.1061/(ASCE)0733-950X(1986)112:1(161)
Cox, R. (2019). Very large boulders were moved by storm waves on the west coast of Ireland in winter 2013-2014. Mar. Geol. 412, 217–219. doi: 10.1016/j.margeo.2018.07.016
Cox, R., Jahn, K. L., Watkins, O. G., and Cox, P. (2018a). Extraordinary boulder transport by storm waves, and criteria for analysing coastal boulder deposits. Earth Sci. Rev. 177, 623–636. doi: 10.1016/j.earscirev.2017.12.014
Cox, R., Lopes, W. A., and Jahn, K. L. (2018b). Roundness measurements in coastal boulder deposits. Mar. Geol. 396, 114–141. doi: 10.1016/j.margeo.2017.03.003
Cox, R., O'Boyle, L., and Cytrynbaum, J. (2019). Imbricated coastal boulder deposits are formed by storm waves, and can preserve a long-term storminess record. Sci. Rep. 9:10784. doi: 10.1038/s41598-019-47254-w
Cox, R., Zentner, D. B., Kirchner, B. J., and Cook, M. S. (2012). Boulder ridges on the Aran Islands (Ireland): recent movements caused by storm waves, not tsunami. J. Geol. 120, 249–272. doi: 10.1086/664787
Cox, S. J., and Cooker, M. J. (1999). The motion of a rigid body impelled by sea-wave impact. Appl. Ocean Res. 21, 113–125. doi: 10.1016/S0141-1187(99)00005-X
De Martini, P. M., Orefice, S., Patera, A., Paris, R., Terrinha, P., Noiva, J., et al. (2016). The ASTARTE paleotsunami deposits data base-a web-based reference for tsunami research around Europe. Geophys. Res. Abstracts 18, EGU2016-6324.
Deguara, J. C., and Gauci, R. (2017). Evidence of extreme wave events from boulder deposits on the south-east coast of Malta (Central Mediterranean). Nat. Hazards 86, 543–568. doi: 10.1007/s11069-016-2525-4
Dewey, J. F., and Ryan, P. D. (2017). Storm, rogue wave, or tsunami origin for megaclast deposits in western Ireland and North Island, New Zealand? Proc. Natl. Acad. Sci. U.S.A. 114, E10639–E10647. doi: 10.1073/pnas.1713233114
Dias, F., and Ghidaglia, J.-M. (2018). Slamming: recent progress in the evaluation of impact pressures. Annu. Rev. Fluid Mech. 50, 243–273. doi: 10.1146/annurev-fluid-010816-060121
Diplas, P., Dancey, C. L., Celik, A. O., Valyrakis, M., Greer, K., and Akar, T. (2008). The role of impulse on the initiation of particle movement under turbulent flow conditions. Science 322:717. doi: 10.1126/science.1158954
Earlie, C. S., Young, A. P., Masselink, G., and Russell, P. E. (2015). Coastal cliff ground motions and response to extreme storm waves. Geophys. Res. Lett. 42, 847–854. doi: 10.1002/2014GL062534
Einstein, H. A., and El-Samni, E.-S. A. (1949). Hydrodynamic forces on a rough wall. Rev. Mod. Phys. 21, 520–524. doi: 10.1103/RevModPhys.21.520
Engel, M., and May, S. M. (2012). Bonaire's boulder fields revisited: evidence for Holocene tsunami impact on the Leeward Antilles. Quat. Sci. Rev. 54, 126–141. doi: 10.1016/j.quascirev.2011.12.011
Engel, M., Oetjen, J., May, S. M., and Brückner, H. (2016). Tsunami deposits of the Caribbean – towards an improved coastal hazard assessment. Earth Sci. Rev. 163, 260–296. doi: 10.1016/j.earscirev.2016.10.010
Etienne, S., and Paris, R. (2010). Boulder accumulations related to storms on the south coast of the Reykjanes Peninsula (Iceland). Geomorphology 114, 55–70. doi: 10.1016/j.geomorph.2009.02.008
Forristall, G. Z. (2000). Wave crest distributions: observations and second-order theory. J. Phys. Oceanogr. 30, 1931–1943. doi: 10.1175/1520-0485(2000)030<1931:WCDOAS>2.0.CO;2
Friedrichs, K. O. (1948). “On the derivation of the shallow water theory,” in The Formation of Breakers and Bores, Appendix. Communications on Pure and Applied Mathematics, Vol. 1, ed J. J. Stoker, 81–85.
Gandhi, D., Chavare, K. A., Prizomwala, S. P., Bhatt, N., Bhatt, N. Y., Mohan, K., et al. (2017). Testing the numerical models for boulder transport through high energy marine wave event: an example from southern Saurashtra, Western India. Quatern. Int. 444, 209–216. doi: 10.1016/j.quaint.2016.05.021
Goto, K., Miyagi, K., Kanawa, T., Takahashi, J., and Imamura, F. (2011). Emplacement and movement of boulders by known storm waves—field evidence from the Okinawa Islands, Japan. Mar. Geol. 283, 66–78. doi: 10.1016/j.margeo.2010.09.007
Goto, K., Miyagi, K., Kawamata, H., and Imamura, F. (2010). Disrimination of boulders deposited by tsunamis and storm waves at Ishigaki Island, Japan. Mar. Geol. 269, 34–45. doi: 10.1016/j.margeo.2009.12.004
Goto, K., Okada, K., and Imamura, F. (2009). Characteristics and hydrodynamics of boulders transported by storm waves at Kudaka Island, Japan. Mar. Geol. 262, 14–24. doi: 10.1016/j.margeo.2009.03.001
Goto, K., Sugawara, D., Ikema, S., and Miyagi, T. (2012). Sedimentary processes associated with sand and boulder deposits formed by the 2011 Tohoku-oki tsunami at Sabusawa Island, Japan. Sediment. Geol. 282, 188–198. doi: 10.1016/j.sedgeo.2012.03.017
Guler, H. G., Baykal, C., Arikawa, T., and Yalciner, A. C. (2018). Numerical assessment of tsunami attack on a rubble mound breakwater using OpenFOAM®. Appl. Ocean Res. 72, 76–91. doi: 10.1016/j.apor.2018.01.005
Hall, A. M., Hansom, J. D., and Williams, D. M. (2010). Wave-emplaced coarse debris and megaclasts in Ireland and Scotland: boulder transport in a high-energy littoral environment: a discussion. J. Geol. 118, 699–704. doi: 10.1086/656357
Hanafin, J. A., Quilfen, Y., Ardhuin, F., Sienkiewicz, J., Queffeulou, P., Obrebski, M., et al. (2012). Phenomenal Sea States and Swell from a North Atlantic Storm in February 2011: a comprehensive analysis. Bull. Am. Meteorol. Soc. 93, 1825–1832. doi: 10.1175/BAMS-D-11-00128.1
Herterich, J., Cox, R., and Dias, F. (2018a). “Dynamic cliff-top beam response to wave impact,” in Proceedings of the 13th International Conference on Hydrodynamics, ed Y. Kim (Incheon), 129–137.
Herterich, J. G., Cox, R., and Dias, F. (2018b). How does wave impact generate large boulders? Modelling hydraulic fracture of cliffs and shore platforms. Mar. Geol. 399, 34–46. doi: 10.1016/j.margeo.2018.01.003
Herterich, J. G., and Dias, F. (in press). Potential flow over a submerged rectangular obstacle: consequences for initiation of boulder motion. Eur. J. Appl. Math. 1–36. doi: 10.1017/S0956792519000214
Holland, K. T., Holman, R. A., and Sallenger, A. H. (1991). “Estimation of overwash bore velocities using video techniques,” in Coastal Sediments '91, eds N. C. Kraus, K. C. Gingrich, and D. L. Kriebel (Ann Arbor, MI:Univ. of Michigan; American Society of Civil Engineers), 489–497.
Holman, R., Huntley, D., and Bowen, A. (1978). Infragravity waves in storm conditions. Coast. Eng. Proc. 1, 268–284. doi: 10.9753/icce.v16.13
INFOMAR (2018). Data Viewer. Available online at: https://maps.marine.ie/infomarbathymetry/
Jaffe, B., Goto, K., Sugawara, D., Gelfenbaum, G., and La Selle, S. (2016). Uncertainty in tsunami sediment transport modeling. J. Disaster Res. 11, 647–661. doi: 10.20965/jdr.2016.p0647
Janjić, J. (2019). Wave energy resource of the northeast atlantic ocean (Ph.D.). University College Dublin, Dublin, Ireland.
Janjić, J., Gallagher, S., and Dias, F. (2018). Case study of the winter 2013/2014 extreme wave events off the west coast of Ireland. Adv. Sci. Res. 15, 145–157. doi: 10.5194/asr-15-145-2018
Kandrot, S., Farrell, E., and Devoy, R. (2016). The morphological response of foredunes at a breached barrier system to winter 2013/2014 storms on the southwest coast of Ireland. Earth Surf. Process. Landforms 41, 2123–2136. doi: 10.1002/esp.4003
Kantamaneni, K., Gallagher, A., and Du, X. (2019). Assessing and mapping regional coastal vulnerability for port environments and coastal cities. J. Coast. Conserv. 23, 59–70. doi: 10.1007/s11852-018-0636-7
Kendon, M., and McCarthy, M. (2015). The UK's wet and stormy winter of 2013/2014. Weather 70, 40–47. doi: 10.1002/wea.2465
Kennedy, A. B., Mori, N., Yasuda, T., Shimozono, T., Tomiczek, T., Donahue, A., et al. (2017). Extreme block and boulder transport along a cliffed coastline (Calicoan Island, Philippines) during Super Typhoon Haiyan. Mar. Geol. 383, 65–77. doi: 10.1016/j.margeo.2016.11.004
Kennedy, D. M., Tannock, K. L., Crozier, M. J., and Rieser, U. (2007). Boulders of MIS 5 age deposited by a tsunami on the coast of Otago, New Zealand. Sediment. Geol. 200, 222–231. doi: 10.1016/j.sedgeo.2007.01.005
Kennedy, D. M., Woods, J. L. D., Naylor, L. A., Hansom, J. D., and Rosser, N. J. (2019). Intertidal boulder-based wave hindcasting can underestimate wave size: Evidence from Yorkshire, UK. Mar. Geol. 411, 98–106. doi: 10.1016/j.margeo.2019.02.002
Keulegan, G. H. (1950). “Wave motion,” in Engineering Hydraulics ed C. Brown (New York, NY: John Wiley & Sons, Inc.), 711–768.
Kobayashi, N. (2016). Coastal sediment transport modeling for engineering applications. J. Waterway Port Coastal Ocean Eng. 142:03116001. doi: 10.1061/(ASCE)WW.1943-5460.0000347
Krogstad, H. E. (1985). Height and period distributions of extreme waves. Appl. Ocean Res. 7, 158–165. doi: 10.1016/0141-1187(85)90008-2
Kuiry, S. N., Ding, Y., and Wang, S. S. Y. (2010). Modelling coastal barrier breaching flows with well-balanced shock-capturing technique. Comput. Fluids 39, 2051–2068. doi: 10.1016/j.compfluid.2010.07.015
Lau, A. Y. A., Terry, J. P., Ziegler, A., Pratap, A., and Harris, D. (2018). Boulder emplacement and remobilisation by cyclone and submarine landslide tsunami waves near Suva City, Fiji. Sediment. Geol. 364, 242–257. doi: 10.1016/j.sedgeo.2017.12.017
Long, D. (2018). Cataloguing tsunami events in the UK. Geol. Soc. London Spec. Publ. 456, 143–165. doi: 10.1144/SP456.10
Lorang, M. S. (2011). A wave-competence approach to distinguish between boulder and megaclast deposits due to storm waves versus tsunamis. Mar. Geol. 283, 90–97. doi: 10.1016/j.margeo.2010.10.005
Losada, I. J., Lara Javier, L., and del Jesus, M. (2016). Modeling the interaction of water waves with porous coastal structures. J. Waterway Port Coastal Ocean Eng. 142:03116003. doi: 10.1061/(ASCE)WW.1943-5460.0000361
Main, G., Schembri, J., Gauci, R., Crawford, K., Chester, D., and Duncan, A. (2018). The hazard exposure of the Maltese Islands. Nat. Hazards 92, 829–855. doi: 10.1007/s11069-018-3227-x
Maramai, A., Brizuela, B., and Graziani, L. (2014). The euro-mediterranean tsunami catalogue. Ann. Geophys.57:S0435. doi: 10.4401/ag-6437
Marriner, N., Kaniewski, D., Morhange, C., Flaux, C., Giaime, M., Vacchi, M., et al. (2017). Tsunamis in the geological record: making waves with a cautionary tale from the Mediterranean. Sci. Adv. 3:e1700485. doi: 10.1126/sciadv.1700485
Masselink, G., Castelle, B., Scott, T., Dodet, G., Suanez, S., Jackson, D., et al. (2016). Extreme wave activity during 2013/2014 winter and morphological impacts along the Atlantic coast of Europe. Geophys. Res. Lett. 43, 2135–2143. doi: 10.1002/2015GL067492
Masselink, G., Scott, T., Poate, T., Russell, P., Davidson, M., and Conley, D. (2015). The extreme 2013/2014 winter storms: hydrodynamic forcing and coastal response along the southwest coast of England. Earth Surf. Process. Landforms 41, 378–392. doi: 10.1002/esp.3836
Mastronuzzi, G., Ferrilli, S., Marsico, A., Milella, M., Pignatelli, C., Piscitelli, A., et al. (2013). “Tsunami maximum flooding assessment in GIS environment,” in Tsunami: From Fundamentals to Damage Mitigation, ed S. Mambretti (Southampton: WIT Press), 61–80.
Mastronuzzi, G., Pignatelli, C., and Sansò, P. (2004). “Assessment of catastrophic wave impact in Apulia region (Southern Italy),” in Risk Analysis IV:WIT Transactions on Ecology and the Environment, Vol. 77, ed C. A. Brebbia (Ashurst: WIT Press), 681–689.
Mastronuzzi, G., Pignatelli, C., Sanso, P., and Selleri, G. (2007). Boulder accumulations produced by the 20th of February, 1743 tsunami along the coast of southeastern Salento (Apulia region, Italy). Mar. Geol. 242, 191–205. doi: 10.1016/j.margeo.2006.10.025
Mastronuzzi, G., and Sansò, P. (2004). Large boulder accumulations by extreme waves along the Adriatic coast of southern Apulia (Italy). Quatern. Int. 120, 173–184. doi: 10.1016/j.quaint.2004.01.016
Matias, A., Blenkinsopp, C. E., and Masselink, G. (2014). Detailed investigation of overwash on a gravel barrier. Mar. Geol. 350, 27–38. doi: 10.1016/j.margeo.2014.01.009
Matias, A., Masselink, G., Castelle, B., Blenkinsopp, C. E., and Kroon, A. (2016). Measurements of morphodynamic and hydrodynamic overwash processes in a large-scale wave flume. Coast. Eng. 113, 33–46. doi: 10.1016/j.coastaleng.2015.08.005
Matsutomi, H., Sakakiyama, T., Nugroho, S., and Matsuyama, M. (2006). Aspects of inundated flow due to the 2004 Indian Ocean Tsunami. Coast. Eng. J. 48, 167–195. doi: 10.1142/S0578563406001350
Matthews, T., Murphy, C., Wilby, R. L., and Harrigan, S. (2014). Stormiest winter on record for Ireland and UK. Nat. Clim. Chang. 4, 738–740. doi: 10.1038/nclimate2336
May, S. M., Engel, M., Brill, D., Cuadra, C., Lagmay, A. M. F., Santiago, J., et al. (2015). Block and boulder transport in Eastern Samar (Philippines) during Supertyphoon Haiyan. Earth Surf. Dyn. 3, 739–771. doi: 10.5194/esurfd-3-739-2015
McGranahan, G., Balk, D., and Anderson, B. (2007). The rising tide: assessing the risks of climate change and human settlements in low elevation coastal zones. Environ. Urban. 19, 17–37. doi: 10.1177/0956247807076960
Montoya, L., and Lynett, P. (2018). Tsunami versus infragravity surge: comparison of the physical character of extreme runup. Geophys. Res. Lett. 45, 982–12, 990. doi: 10.1029/2018GL080594
Montoya, L., Lynett, P., Thio, H. K., and Li, W. (2017). Spatial statistics of tsunami overland flow properties. J. Waterway Port Coastal Ocean Eng. 143:04016017. doi: 10.1061/(ASCE)WW.1943-5460.0000363
Morton, R. A., Richmond, B. M., Jaffe, B. E., and Gelfenbaum, G. (2006). “Reconnaissance investigation of Caribbean extreme wave deposits—preliminary observations, interpretations, and research directions,” in USGS Open-File Report 2006–1293.
Morton, R. A., Richmond, B. M., Jaffe, B. E., and Gelfenbaum, G. (2008). Coarse-clast ridge complexes of the Caribbean: a preliminary basis for distinguishing tsunami and storm-wave origins. J. Sediment.Res. 78, 624–637. doi: 10.2110/jsr.2008.068
Mottershead, D., Bray, M., Soar, P., and Farres, P. J. (2014). Extreme wave events in the central Mediterranean: geomorphic evidence of tsunami on the Maltese Islands. Zeitschrift Geomorphol. 58, 385–411. doi: 10.1127/0372-8854/2014/0129
Nandasena, N. A. K., Paris, R., and Tanaka, N. (2011a). Numerical assessment of boulder transport by the 2004 Indian ocean tsunami in Lhok Nga, West Banda Aceh (Sumatra, Indonesia). Comput. Geosci. 37, 1391–1399. doi: 10.1016/j.cageo.2011.02.001
Nandasena, N. A. K., Paris, R., and Tanaka, N. (2011b). Reassessment of hydrodynamic equations: minimum flow velocity to initiate boulder transport by high energy events (storms, tsunamis). Mar. Geol. 281, 70–84. doi: 10.1016/j.margeo.2011.02.005
Nandasena, N. A. K., Tanaka, N., Sasaki, Y., and Osada, M. (2013). Boulder transport by the 2011 Great East Japan tsunami: comprehensive field observations and whither model predictions? Mar. Geol. 346, 292–309. doi: 10.1016/j.margeo.2013.09.015
Neumann, B., Vafeidis, A. T., Zimmermann, J., and Nicholls, R. J. (2015). Future coastal population growth and exposure to sea-level rise and coastal flooding-a global assessment. PLoS ONE 10:e0118571. doi: 10.1371/journal.pone.0118571
Nistor, I., Palermo, D., Nouri, Y., Murty, T., and Saatcioglu, M. (2009). “Tsunami-induced forces on structures,” in Handbook of Coastal and Ocean Engineering ed Y. C. Kim (Singapore: World Scientific), 261–286.
Noormets, R., Crook, K. A. W., and Felton, A. (2004). Sedimentology of rocky shorelines: 3. Hydrodynamics of megalast emplacement and transport on a shore platform, Oahu, Hawaii. Sediment. Geol. 172, 41–65. doi: 10.1016/S0037-0738(04)00235-0
Nott, J. (1997). Extremely high-energy wave deposits inside the Great Barrier Reef, Australia: determining the cause—tsunami or tropical cyclone. Mar. Geol. 141, 193–207. doi: 10.1016/S0025-3227(97)00063-7
Nott, J. (2003a). Tsunami or storm waves?—determining the origin of a spectacular field of wave emplaced boulders using numerical storm surge and wave models and hydrodynamic transport equations. J. Coastal Res. 19, 348–356.
Nott, J. (2003b). Waves, coastal boulder deposits and the importance of the pre-transport setting. Earth Planet. Sci. Lett. 210, 269–276. doi: 10.1016/S0012-821X(03)00104-3
O'Brien, L., Renzi, E., Dudley, J. M., Clancy, C., Dias, F., and Dias, F. (2018). Catalogue of extreme wave events in Ireland: revised and updated for 14680 BP to 2017. Nat. Hazards Earth Syst. Sci. 18, 729–758. doi: 10.5194/nhess-18-729-2018
Oliveira, T. C., Neves, M. G., Fidalgo, R., and Esteves, R. (2018). Variability of wave parameters and Hmax/Hs relationship under storm conditions offshore the Portuguese continental coast. Ocean Eng. 153, 10–22. doi: 10.1016/j.oceaneng.2018.01.080
Papadopoulos, G. (2016). Tsunamis in the European-Mediterranean Region: From Historical Record to Risk Mitigation. Amsterdam: Elsevier.
Papadopoulos, G. A., Gràcia, E., Urgeles, R., Sallares, V., De Martini, P. M., Pantosti, D., et al. (2014). Historical and pre-historical tsunamis in the Mediterranean and its connected seas: geological signatures, generation mechanisms and coastal impacts. Mar. Geol. 354, 81–109. doi: 10.1016/j.margeo.2014.04.014
Papadopoulos, G. A., Lorrito, S., Løvholt, F., Rudloff, A., and Schindelé, F. (2017). “Geophysical risk: tsunami,” in Science for Disaster Risk Management 2017: Knowing Better and Losing Less, eds K. Poljansek, M. Marín Ferrer, T. De Groeve, and I. Clark (Luxembourg: Publications Office of the European Union), 162–188.
Papathoma-Köhle, M., Cristofari, G., Wenk, M., and Fuchs, S. (2019). The importance of indicator weights for vulnerability indices and implications for decision making in disaster management. Int. J. Disaster Risk Reduc. 36:101103. doi: 10.1016/j.ijdrr.2019.101103
Paris, R., Wassmer, P., Sartohadi, J., Lavigne, F., Barthomeuf, B., Desgages, E., et al. (2009). Tsunamis as geomorphic crises: lessons from the December 26, 2004 tsunami in Lhok Nga, West Banda Aceh (Sumatra, Indonesia). Geomorphology 104, 59–72. doi: 10.1016/j.geomorph.2008.05.040
Pepe, F., Corradino, M., Parrino, N., Besio, G., Presti, V. L., Renda, P., et al. (2018). Boulder coastal deposits at Favignana Island rocky coast (Sicily, Italy): litho-structural and hydrodynamic control. Geomorphology 303, 191–209. doi: 10.1016/j.geomorph.2017.11.017
Pignatelli, C., Sansò, P., and Mastronuzzi, G. (2009). Evaluation of tsunami flooding using geomorphologic evidence. Mar. Geol. 260, 6–18. doi: 10.1016/j.margeo.2009.01.002
Piscitelli, A., Milella, M., Hippolyte, J.-C., Shah-Hosseini, M., Morhange, C., and Mastronuzzi, G. (2017). Numerical approach to the study of coastal boulders: the case of Martigues, Marseille, France. Quatern. Int. 439, 52–64. doi: 10.1016/j.quaint.2016.10.042
Queffeulou, P. (2004). Long-term validation of wave height measurements from altimeters. Mar. Geodesy 27, 495–510. doi: 10.1080/01490410490883478
Queffeulou, P. (2013). “Merged altimeter wave height data base. An update,” in Proceedings of ESA Living Planet Symposium, Paper No. 851822 722, 1–5. Available online at: ftp.ifremer.fr/ifremer/cersat/products/swath/altimeters/waves (accessed December 2019).
Raby, A., Bullock, G. N., Banfi, D., Rafiq, Y., and Cali, F. (2016). Wave loading on rock lighthouses. Proc. Inst. Civil Eng. Maritime Eng. 169, 15–28. doi: 10.1680/jmaen.15.00002
Ritter, A. (1892). Die fortpflanzung der wasserwellen. Zeitschrift Vereines Deutscher Ingenieure 36, 947–954.
Roeber, V., and Bricker, J. D. (2015). Destructive tsunami-like wave generated by surf beat over a coral reef during Typhoon Haiyan. Nat. Commun. 6:7854. doi: 10.1038/ncomms8854
Roig-Munar, F. X., Rodríguez-Perea, A., Vilaplana, J. M., Martín-Prieto, J. A., and Gelabert, B. (2019). Tsunami boulders in Majorca Island (Balearic Islands, Spain). Geomorphology 334, 76–90. doi: 10.1016/j.geomorph.2019.02.012
Roig-Munar, F. X., Vilaplana, J. M., Rodríguez-Perea, A., Martín-Prieto, J. Á., and Gelabert, B. (2018). Tsunamis boulders on the rocky shores of Minorca (Balearic Islands). Nat. Hazards Earth Syst. Sci. 18, 1985–1998. doi: 10.5194/nhess-18-1985-2018
Rovere, A., Casella, E., Harris, D. L., Lorscheid, T., Nandasena, N. A. K., Dyer, B., et al. (2017). Giant boulders and Last Interglacial storm intensity in the North Atlantic. Proc. Natl. Acad. Sci. U.S.A. 114:12144. doi: 10.1073/pnas.1712433114
Ryu, Y., and Chang, K.-A. (2008). Green water void fraction due to breaking wave impinging and overtopping. Exp. Fluids 45, 883–898. doi: 10.1007/s00348-008-0507-3
Ryu, Y., Chang, K.-A., and Mercier, R. (2007). Runup and green water velocities due to breaking wave impinging and overtopping. Exp. Fluids 43, 555–567. doi: 10.1007/s00348-007-0332-0
Samayam, S., Laface, V., Annamalaisamy, S. S., Arena, F., Vallam, S., and Gavrilovich, P. V. (2017). Assessment of reliability of extreme wave height prediction models. Nat. Hazards Earth Syst. Sci. 17, 409–421. doi: 10.5194/nhess-17-409-2017
Schiller, A., and Brassington, G. B. (2011). Operational Oceanography in the 21st Century. Dordrecht: Springer.
Schneider, B., Hoffmann, G., and Reicherter, K. (2016). Scenario-based tsunami risk assessment using a static flooding approach and high-resolution digital elevation data: an example from Muscat in Oman. Glob. Planet. Change 139, 183–194. doi: 10.1016/j.gloplacha.2016.02.005
Scicchitano, G., Monaco, C., and Tortorici, L. (2007). Large boulder deposits by tsunami waves along the Ionian coast of south-eastern Sicily (Italy). Mar. Geol. 238, 75–91. doi: 10.1016/j.margeo.2006.12.005
Scourse, E. M., Chapman, N. A., Tappin, D. R., and Wallis, S. R. (2018). Tsunamis: geology, hazards and risks–introduction. Geol. Soc. London Spec. Publ. 456, 1–3. doi: 10.1144/SP456.13
Shah-Hosseini, M., Morhange, C., De Marco, A., Wante, J., Anthony, E. J., Sabatier, F., et al. (2013). Coastal boulders in Martigues, French Mediterranean: evidence for extreme storm waves during the Little Ice Age. Zeitschrift Geomorphol. Suppl. Issues 57, 181–199. doi: 10.1127/0372-8854/2013/S-00132
Shah-Hosseini, M., Morhange, C., Naderi Beni, A., Marriner, N., Lahijani, H., Hamzeh, M., et al. (2011). Coastal boulders as evidence for high-energy waves on the Iranian coast of Makran. Mar. Geol. 290, 17–28. doi: 10.1016/j.margeo.2011.10.003
Shao, S., Ji, C., Graham, D. I., Reeve, D. E., James, P. W., and Chadwick, A. J. (2006). Simulation of wave overtopping by an incompressible SPH model. Coast. Eng. 53, 723–735. doi: 10.1016/j.coastaleng.2006.02.005
Sverdrup, H. U., and Munk, W. H. (1947). Wind, Sea and Swell: Theory of Relations for Forecasting. Technical Report Number 1. Washington, DC: United States Navy Department Hydrographic Office, 44.
Switzer, A. D., and Burston, J. M. (2010). Competing mechanisms for boulder deposition on the southeast Australian coast. Geomorphology 114, 42–54. doi: 10.1016/j.geomorph.2009.02.009
Tang, H., and Weiss, R. (2015). A model for tsunami flow inversion from deposits (TSUFLIND). Mar. Geol. 370, 55–62. doi: 10.1016/j.margeo.2015.10.011
Terry, J. P., Goff, J., and Jankaew, K. (2018). Major typhoon phases in the upper Gulf of Thailand over the last 1.5 millennia, determined from coastal deposits on rock islands. Quatern. Int. 487, 87–98. doi: 10.1016/j.quaint.2018.04.022
Terry, J. P., Jankaew, K., and Dunne, K. (2015). Coastal vulnerability to typhoon inundation in the Bay of Bangkok, Thailand? Evidence from carbonate boulder deposits on Ko Larn island. Estuar. Coast. Shelf Sci. 165, 261–269. doi: 10.1016/j.ecss.2015.05.028
Terry, J. P., and Lau, A. Y. A. (2018). Magnitudes of nearshore waves generated by tropical cyclone Winston, the strongest landfalling cyclone in South Pacific records. Unprecedented or unremarkable? Sediment. Geol. 364, 276–285. doi: 10.1016/j.sedgeo.2017.10.009
Thornton, E. B., and Guza, R. T. (1983). Transformation of wave height distribution. J. Geophys. Res. Oceans 88, 5925–5938. doi: 10.1029/JC088iC10p05925
Tiron, R., Mallon, F., Dias, F., and Reynaud, E. G. (2015). The challenging life of wave energy devices at sea: a few points to consider. Renew. Sustain. Energy Rev. 43, 1263–1272. doi: 10.1016/j.rser.2014.11.105
Torab, M., and Dalal, N. (2015). “Natural hazards mapping of mega waves on the NW coast of Egypt,” in Geomorphometry for Geosciences (Poznan: Adam Mickiewicz University), 213–216.
Tsai, C.-H., Su, M.-Y., and Huang, S.-J. (2004). Observations and conditions for occurrence of dangerous coastal waves. Ocean Eng. 31, 745–760. doi: 10.1016/S0029-8018(03)00113-6
Vacchi, M., Rovere, A., Zouros, N., and Firpo, M. (2012). Assessing enigmatic boulder deposits in NE Aegean Sea: importance of historical sources as tool to support hydrodynamic equations. Nat. Hazards Earth Syst. Sci. 12, 1109–1118. doi: 10.5194/nhess-12-1109-2012
Viotti, C., Carbone, F., and Dias, F. (2014). Conditions for extreme wave runup on a vertical barrier by nonlinear dispersion. J. Fluid Mech. 748, 768–788. doi: 10.1017/jfm.2014.217
Viotti, C., and Dias, F. (2014). Extreme waves induced by strong depth transitions: fully nonlinear results. Phys. Fluids 26:051705. doi: 10.1063/1.4880659
Weiss, R. (2012). The mystery of boulders moved by tsunamis and storms. Mar. Geol. 295–298, 28–33. doi: 10.1016/j.margeo.2011.12.001
Weiss, R., and Diplas, P. (2015). Untangling boulder dislodgement in storms and tsunamis: Is it possible with simple theories? Geochem. Geophys. Geosyst. 16, 890–898. doi: 10.1002/2014GC005682
Weiss, R., and Sheremet, A. (2017). Toward a new paradigm for boulder dislodgement during storms. Geochem. Geophys. Geosyst. 18, 2717–2726. doi: 10.1002/2017GC006926
Whelan, F., and Kelletat, D. (2005). Boulder deposits on the southern Spanish Atlantic coast: possible evidence for the 1755 AD Lisbon tsunami? Sci. Tsunami Hazards 23, 25–38.
Williams, D. M., and Hall, A. M. (2004). Cliff-top megaclast deposits of Ireland, a record of extreme waves in the North Atlantic—storms or tsunamis? Mar. Geol. 206, 101–117. doi: 10.1016/j.margeo.2004.02.002
WMO (2008). Guide to Meteorological Instruments and Methods of Observation. Geneva: World Meteorological Organization (WMO).
Wood, D. J, Peregrine, D. H., and Bruce, T. (2000). Wave impact on a wall using pressure-impulse theory. I: trapped Air. J. Waterway Port Coastal Ocean Eng. 126, 182–190. doi: 10.1061/(ASCE)0733-950X(2000)126:4(182)
Zainali, A., and Weiss, R. (2015). Boulder dislodgement and transport by solitary waves: insights from three-dimensional numerical simulations. Geophys. Res. Lett. 42, 4490–4497. doi: 10.1002/2015GL063712
Appendix
Significant wave height Hs (sometimes given as SWH or H1/3) is a generalized measure of sea state. The term was coined to characterize the bigger waves in a sea—i.e., those that are significant—and was originally defined as the average height of the largest third of waves (Sverdrup and Munk, 1947). A more precise definition, in this era of detailed spectral data, is four times the standard deviation of the surface elevation spectrum (WMO, 2008; Ardhuin et al., 2019). Both definitions produce approximately the same value.
Marine weather buoys generally record significant wave height, not the heights of individual waves (e.g., Samayam et al., 2017), so the largest values in wave databases are not maximum wave heights. Unfortunately, many CBD studies either wrongly report buoy data as maximum wave heights or report significant wave heights but treat them as maxima (e.g., Kennedy et al., 2007; Scicchitano et al., 2007; Shah-Hosseini et al., 2011; Engel and May, 2012; Mottershead et al., 2014; Deguara and Gauci, 2017; Roig-Munar et al., 2018, 2019). These studies are all well-cited, indicating that this approach, and the underlying misconceptions, are deeply embedded in the community and in the literature.
The distinction matters, because maximum wave height (Hmax) is substantially greater than significant wave height. It is difficult to know Hmax with precision because although the population of waves approximates a Rayleigh distribution, the upper tail does not conform (e.g., Krogstad, 1985), and the Hmax/Hs ratio varies with the number of waves considered (Michel, 1999). Generally, however, when computed on intervals of 20 min to an hour (the common integration time for buoy data), Hmax is approximately 2 Hs (Krogstad, 1985; Cattrell et al., 2018; Oliveira et al., 2018).
This realization— that the maximum wave height in a given area over a given time is likely to be about twice the significant wave height—is missing from many studies that employ the Nott equations to analyze boulder emplacement mechanisms, resulting in a factor-of-two underestimate of the likely maximum storm wave heights in a region.
We do not think that authors are deliberately misrepresenting wave climates; rather, we think that they are misled. Repositories do not characteristically provide term definitions along with the data, and if unfamiliar with the terminology of physical oceanography, it would be not unreasonable to conflate storm-wave height Hs given by Nott (2003b) with significant wave height Hs from buoy records. The problem lies with Nott's original choice to use international shorthand for significant wave height (Hs) as the term for his calculated storm wave height.
Keywords: coastal boulder deposits, storm waves, tsunami, hydrodynamic equations, coastal erosion, coastal hazard, coastal geomorphology, wave modeling
Citation: Cox R, Ardhuin F, Dias F, Autret R, Beisiegel N, Earlie CS, Herterich JG, Kennedy A, Paris R, Raby A, Schmitt P and Weiss R (2020) Systematic Review Shows That Work Done by Storm Waves Can Be Misinterpreted as Tsunami-Related Because Commonly Used Hydrodynamic Equations Are Flawed. Front. Mar. Sci. 7:4. doi: 10.3389/fmars.2020.00004
Received: 01 November 2019; Accepted: 07 January 2020;
Published: 05 February 2020.
Edited by:
Juan Jose Munoz-Perez, University of Cádiz, SpainReviewed by:
Giovanni Besio, Polytechnic School, University of Genoa, ItalyFrancisco Javier Gracia, University of Cádiz, Spain
Copyright © 2020 Cox, Ardhuin, Dias, Autret, Beisiegel, Earlie, Herterich, Kennedy, Paris, Raby, Schmitt and Weiss. This is an open-access article distributed under the terms of the Creative Commons Attribution License (CC BY). The use, distribution or reproduction in other forums is permitted, provided the original author(s) and the copyright owner(s) are credited and that the original publication in this journal is cited, in accordance with accepted academic practice. No use, distribution or reproduction is permitted which does not comply with these terms.
*Correspondence: Rónadh Cox, cmNveEB3aWxsaWFtcy5lZHU=