 David A. Clague
 Jennifer B. Paduan
 David W. Caress
 James McClain2
 Robert A. Zierenberg
- 1Monterey Bay Aquarium Research Institute, Moss Landing, CA, United States
- 2Department of Geology, University of California, Davis, Davis, CA, United States
The northernmost segment of the Gorda mid-ocean ridge is the site of a small-volume eruption in 1996 and the persistent off-axis Sea Cliff hydrothermal vent field. To better understand the geologic setting and formation of these features, 1-m resolution bathymetric mapping using autonomous underwater vehicles was completed in 2016. The mapped region covers 35 km2 and 15.6 km of the volcanic axis from south of the 1996 lava flows, and a cross section for ∼4.5 km perpendicular to the axis, that extends beyond the Sea Cliff hydrothermal vent field. A proposed 1996 flow ∼7 km south of previously mapped flows is an artifact from a poor pre-eruption survey. The 1996 flows consist of three discrete steep hummocky mounds of pillows and syneruptive talus. The Sea Cliff hydrothermal field is located a few km north of the narrowest, shallowest section of the ridge segment, 2.6 km east of the center of the neovolcanic zone, and ∼370 m above the average depth of the axial graben on the largest offset ridge-parallel fault. No evidence supports the prior hypothesis that the site is located where two fault systems intersect. The axial graben is asymmetrical with larger fault offsets on the east side. The ridge axis below the hydrothermal field and to the south toward the 1996 flows is constructed dominantly of hummocky flows of pillow basalt, many unusually steep-sided, with syneruptive talus at the base of their steep slopes. Three channelized flows ponded between steep hummocky flows, and then partially drained. Some low-eruption-rate hummocky flows and high-eruption-rate channelized flows have nearly identical compositions, supporting the idea that eruption rates on mid-ocean ridges vary because of different dike widths. Four volcanic structures with volumes between 0.18 and 0.25 km3 occur in the axial graben south of the 1996 flows. Two are flat-topped cones, another is a 1.5-km diameter inflated hummocky flow with 7 pit craters that demonstrate that the flow had a molten interior during growth. The fourth voluminous structure is a steep ridge with abundant syneruptive talus on its lower slopes. The North Gorda segment is an end-member, structurally and volcanically, compared with other Pacific intermediate-rate spreading ridges.
Introduction
Construction of the oceanic crust requires frequent eruptions along the 65,000 km-long mid-ocean ridge system. Yet, such eruptions are infrequently documented or studied in detail (Rubin et al., 2012) to decipher how the crust is constructed and then modified as it migrates away from the neovolcanic axis of the ridge. What are the volumes, rates, styles, and frequency of eruptions at mid-ocean ridges with different spreading rates? What percent of eruptions produce hummocky flows of pillow lavas and what percent channelized flows of sheet lava? Is talus formed along younger axis-parallel normal faults or is some syneruptive? These are volcanological questions that have been addressed for decades (e.g., Perfit and Chadwick, 1998). Subsequent modification of the crust introduces more questions. What controls the location of on-and off-axis hydrothermal venting? Sediment accumulates on new lava flows, but how quickly does it subdue the surface morphology of the flows and bury them? As crustal accretion continues, how and where is the newly formed crust faulted?
Answers to these and other questions about crustal formation and modification require detailed observations and sampling at a range of ridge segments spreading at different rates and with different axial morphologies. Most such studies have been done at faster spreading segments of the East Pacific Rise (e.g., White et al., 2000, 2002; Fornari et al., 2004; Soule et al., 2005, 2007, 2009; Fundis et al., 2010; Waters et al., 2013; Le Saout et al., 2014) or the slow spreading Mid-Atlantic Ridge (MAR) (e.g., Ballard and van Andel, 1977; Smith and Cann, 1992, 1993; Bideau et al., 1998; Yeo et al., 2012; Yeo and Searle, 2013). Similar high-resolution studies are published for some intermediate-spreading ridges in the Pacific that range from full-spreading rates of 4.9 to 6.0 cm/yr, including the southern Juan de Fuca Ridge (Stakes et al., 2006), the Galapagos Spreading Center (Colman et al., 2012), the Endeavor Segment of the Juan de Fuca Ridge (Clague et al., 2014), and the northernmost segment of the East Pacific Rise named Alarcon Rise (Clague et al., 2018a).
Observations and sampling are expensive and time-consuming to acquire, and much of what has been collected on the Gorda Ridge, the intermediate-spreading-rate mid-ocean ridge offshore southern Oregon and northern California (Figure 1), was acquired prior to availability of reliable GPS ship navigation or with bathymetric control too poor to define their geological setting. These older data can be repurposed to constrain modern studies if they can be placed into a spatial and temporal framework, such as provided by 1–1.5 m resolution bathymetry collected by autonomous underwater vehicles (AUVs). Here, we combine newly acquired AUV maps with mostly published dive observations and hydrothermal deposit and lava flow samples collected between 1983 and 2005 on the North Gorda segment of the Gorda Ridge. These data provide new insights into an eruption that occurred in 1996, crustal accretion processes, petrology and ridge structure along and across the segment, variables that control eruption rates and therefore lava flow morphology, and the geology and setting of the off-axis Sea Cliff hydrothermal site.
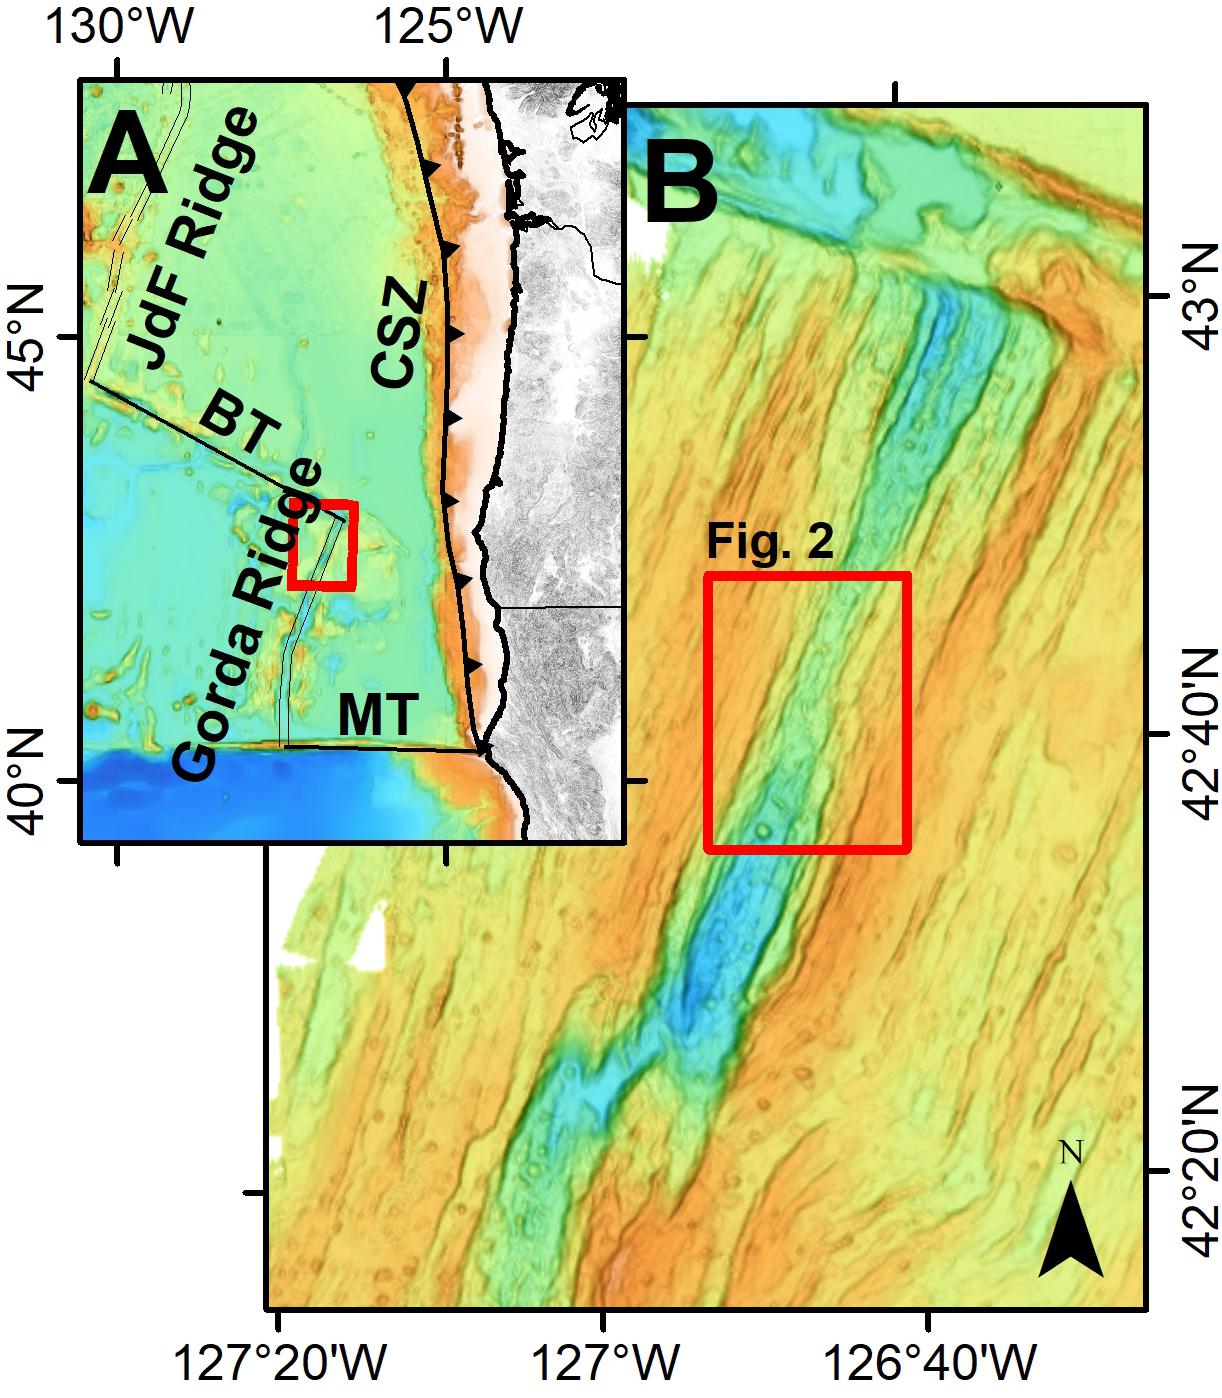
Figure 1. (A) Regional map showing the location of North Gorda Segment of the Gorda mid-ocean ridge spreading center. BT is Blanco Transform, MT is Mendocino Transform, and CSZ is Cascade Subduction Zone. Depth ranges from –5000 (deep blue) to 0 m (white) and red box shows extent of part B. (B) Ship bathymetry of North Gorda segment. Red box encompasses central part of segment where high-resolution AUV bathymetric surveys shown in Figure 2 were collected. Depth range is from –4500 m (blue) to –1500 m (orange).
Geologic Setting
The Gorda Ridge is an intermediate-rate ridge with a full-spreading rate of 55 mm/yr, roughly the middle of the 49–60 mm/yr range of spreading rates of Pacific intermediate-rate ridges (DeMets et al., 2010). Despite its average intermediate spreading rate, the Gorda Ridge is a structural end-member because its unusually deep, wide axial graben resembles those on slower-spreading ridges such as the MAR (e.g., Murton and Rona, 2015), as noted by Clague and Holmes (1987) and Chadwick et al. (1998). The Gorda Ridge graben, at up to 700 m deeper than the surrounding seafloor and 20 km wide, is neither as deep nor as wide as the MAR axial graben, but is still wider and deeper than axial graben at other intermediate-rate ridges such as the Endeavor segment of the Juan de Fuca Ridge (Clague et al., 2014). The Gorda Ridge is divided into five offset segments named North Gorda, Jackson, Central, Phoenix and Escanaba from north to south (Chadwick et al., 1998). An eruption occurred in 1996 less than 10 km south of the narrowest, shallowest part of the North Gorda segment, but still where the spreading rate is fastest and the magma supply is most robust on Gorda Ridge (Chadwick et al., 1998). The North Gorda segment is 65 km long and has a narrow (2 km wide), 3000 m below sea level deep axial valley in the central part, widening to 5–10 km wide and 3500–4000 m deep to the north and south.
Most work on Gorda Ridge has been conducted on the North Gorda (Figure 1) and Escanaba segments where active hydrothermal vent fields named, respectively, Sea Cliff or alternately, GR 14 (Rona et al., 1990; Von Damm et al., 2006) and NESCA (Zierenberg et al., 1994; Von Damm et al., 2005) are located. An additional hydrothermal discharge site near the Blanco Transform existed in 1985 and is termed the GR 15 site (Rona et al., 1992), but the vents have never been pin-pointed nor sampled. The Sea Cliff vent field is located ∼3 km north of the narrowest, shallowest portion of the North Gorda axis, but is unusual in being located 2.2 km east of and ∼350 m above the axial valley at −2720 m depth (distances and depths modified from Rona et al., 1990; Von Damm et al., 2006).
Prior Work
Most geological studies on the North Gorda segment of the Gorda mid-ocean ridge were completed prior to introduction of GPS navigation, in contrast to many other parts of the global ridge system. The first such study focused on dredging of lava samples along the entire Gorda Ridge in 1983 (Davis and Clague, 1987). This was closely followed by hydrocast surveys to assess the potential for hydrothermal discharge (Baker et al., 1987). Camera tows, coring, and dredging surveys (Howard and Fisk, 1988; Rona and Clague, 1989; Clague and Rona, 1990; Davis and Clague, 1990) pinpointed a likely hydrothermal source high on the east wall of the axial graben after a water column anomaly was discovered. Active high-temperature venting was discovered during a series of five dives using the U.S. Navy’s Sea Cliff manned submersible in 1988 and named the Sea Cliff hydrothermal field (Rona et al., 1990). Recovered samples consisted of silicified volcaniclastic rocks (Zierenberg et al., 1995). Hydrothermal fluids were not collected during the Sea Cliff dives, but the clear ∼305°C hydrothermal fluids collected during ROV Tiburon dives from 2000 to 2004 had lower Cl contents than seawater and contained extremely low transition metal concentrations (Von Damm et al., 2006). The inference was that the metals had precipitated out below the seafloor due to the slightly elevated pH of the fluids. The elevated pH was attributed to dissolution of calcite in the ocean crust during the roughly 100,000 years since the host lavas erupted on the ridge axis. The hydrothermal fluids at the Sea Cliff site were analyzed by in situ Raman spectroscopy during four ROV Tiburon dives in 2004 (White et al., 2006), and showed removal of seawater sulfate in the subsurface, leading to formation of anhydrite that hydrates to gypsum in the chimney samples. Fluid samples from one of these dives are the most recently collected vent fluids (Von Damm et al., 2006). The vent-specific biological community contains many of the same animals as seen at the NESCA site on the Escanaba Trough segment of the ridge (Van Dover et al., 1990; Clague et al., 2001). A new vent field 775 m north of Sea Cliff field was discovered in 2019 during Ocean Exploration Trust’s R/V Nautilus cruise NA108 and named Apollo (C. German, personal communication). It is at 2727 m depth along the same fault bench and has similar characteristics to the Sea Cliff site (Figure 2).
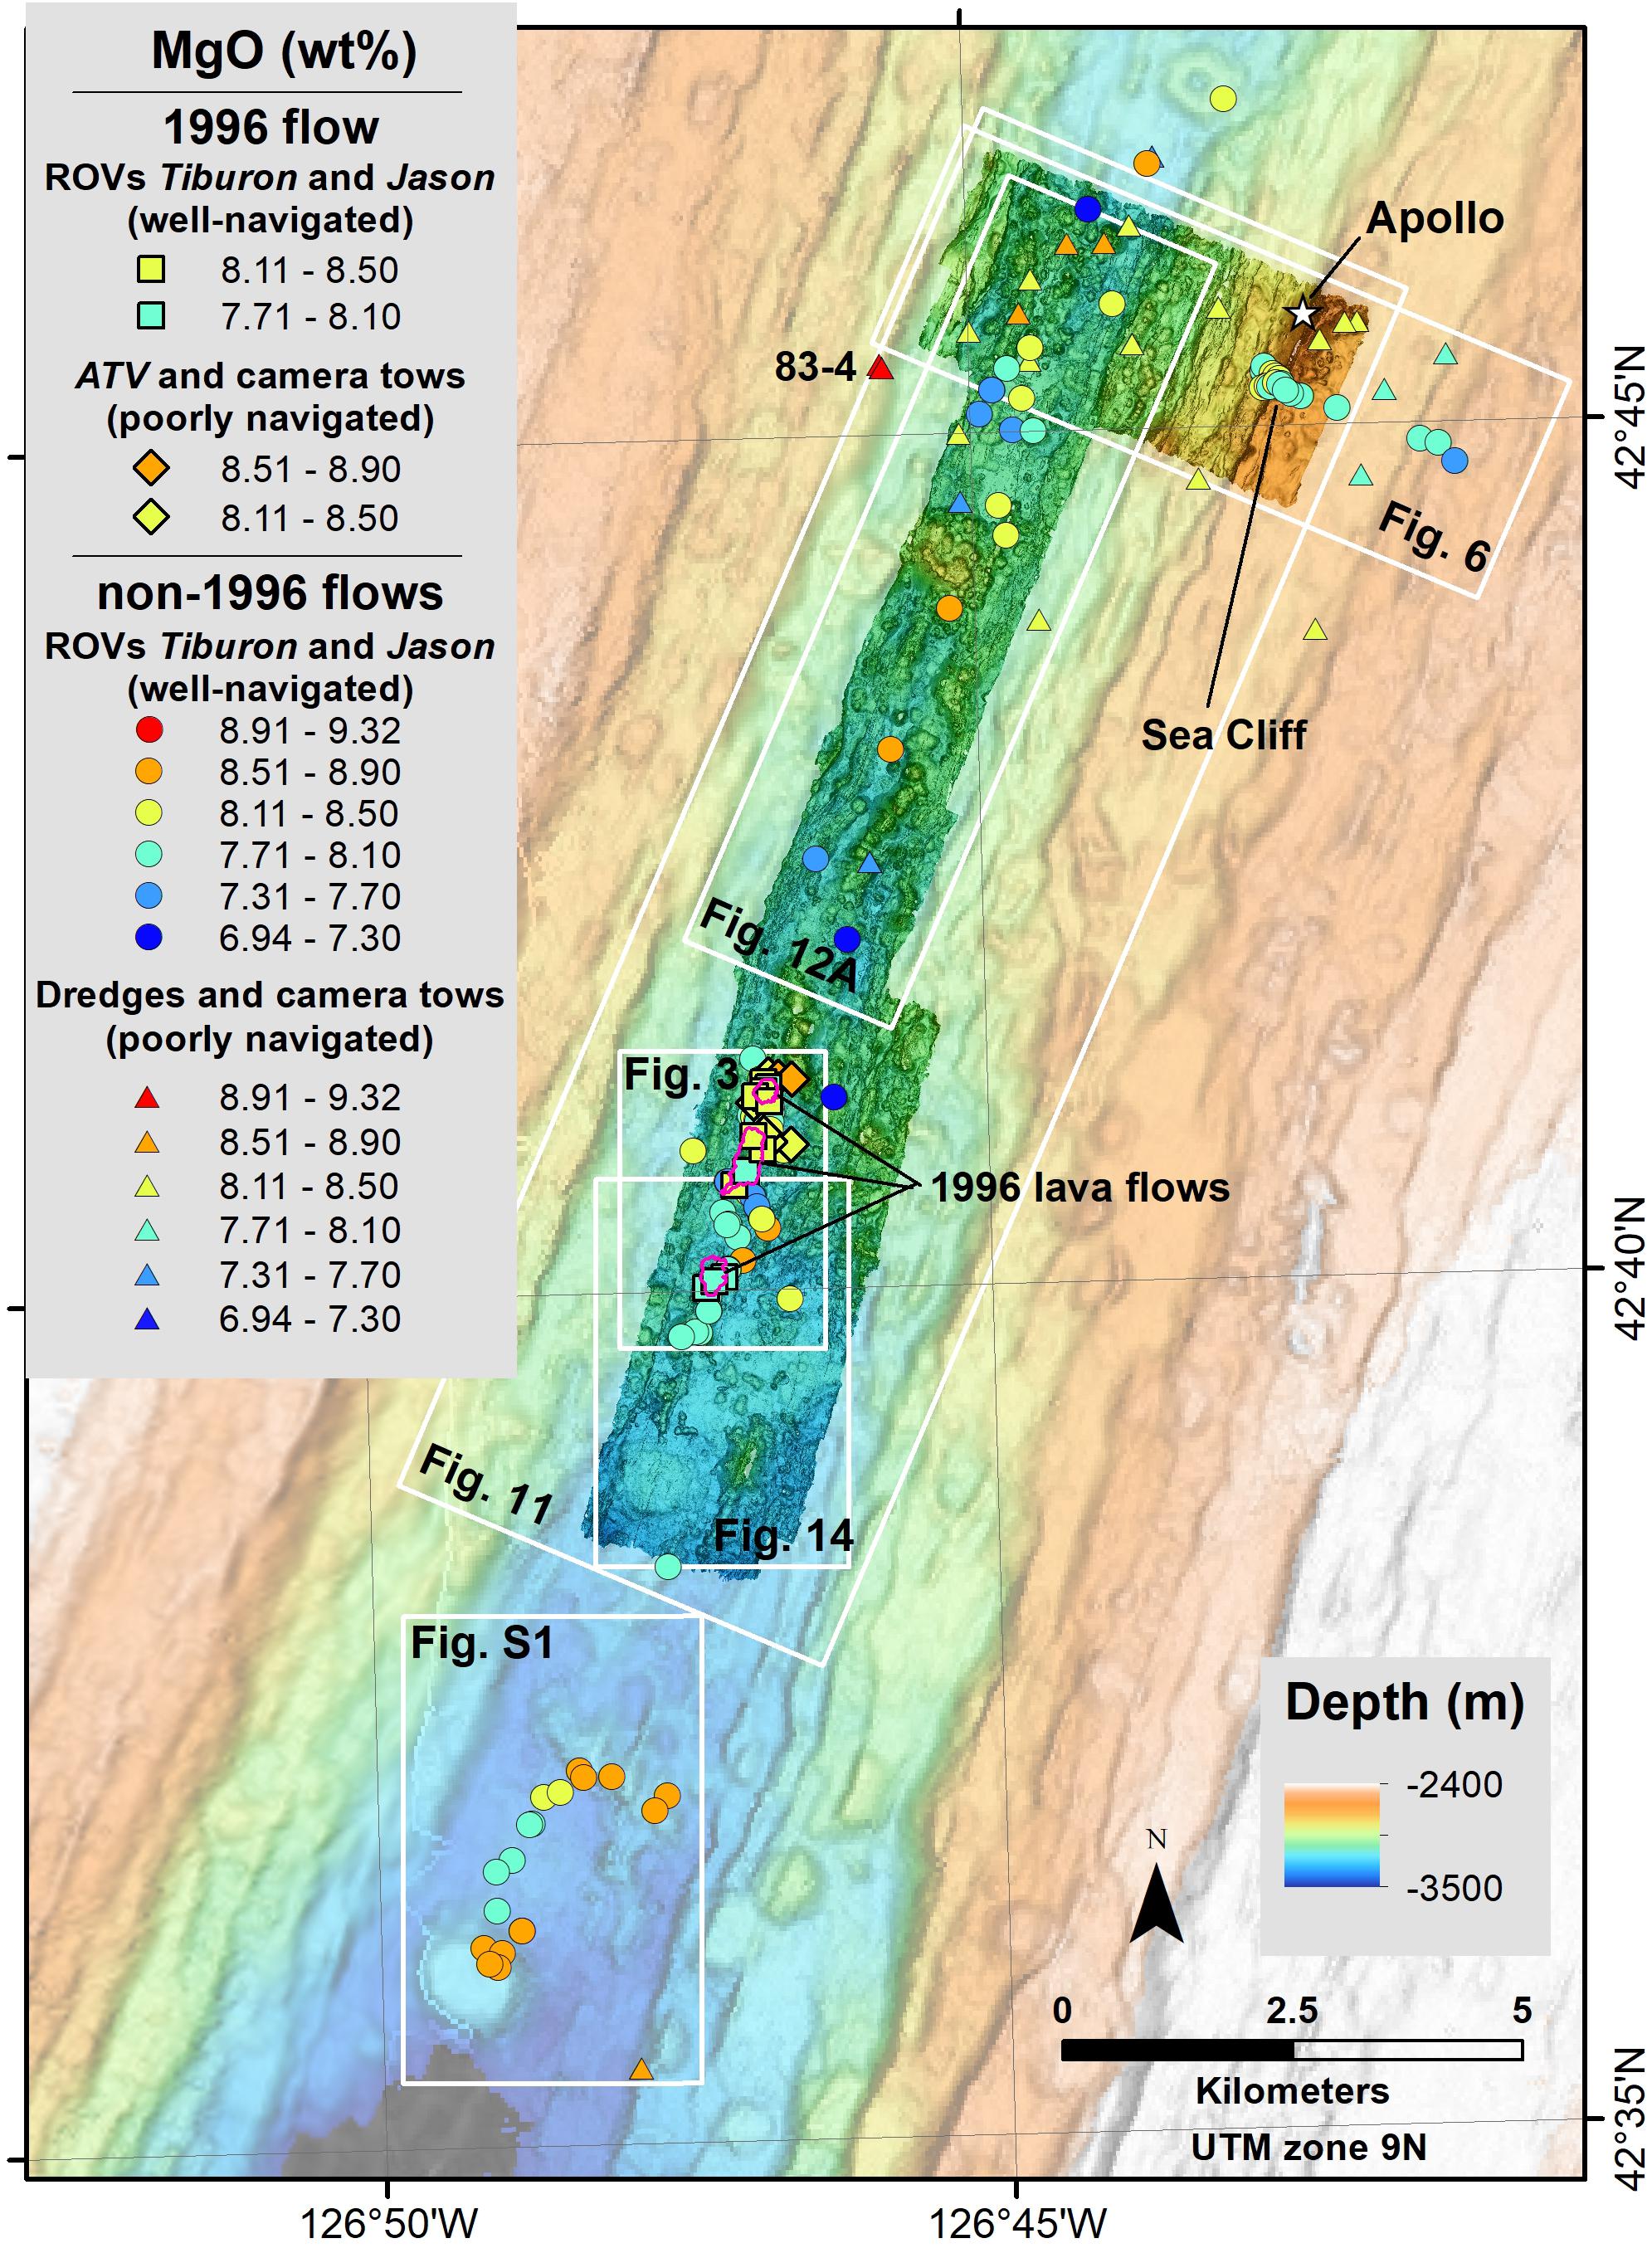
Figure 2. Map of AUV 1-m resolution coverage on top of faded Simrad EM300 and EM302 bathymetry on top of regional multibeam survey data. Lava samples are color-coded by MgO content (using values from Supplementary Table S1) with different symbols for 1996 and older samples depending on the reliability of the navigation during collection (Rubin et al., 1998; Davis et al., 2008). Dredged sample 83-4 (Davis and Clague, 1987) has sheet-flow morphology and is the most-MgO-rich lava recovered from the Gorda Ridge. The 1983–1986 dredged samples are plotted at the center of the dredge tracks, and samples recovered on camera sleds that collided with the bottom are located where the camera was inferred to be when it crashed (Davis and Clague, 1987, 1990; Rubin et al., 1998). White boxes indicate the extents of Figures 3, 6, 11, 12A, 14, and Supplementary Figure S1. The locations of the Sea Cliff hydrothermal field, newly discovered Apollo vent field (white star) and the 1996 lava flows (with red outline) are labeled.
In February 1996, seismic activity (Fox and Dziak, 1998) ∼11 km south of the Sea Cliff hydrothermal site was detected with the Navy’s SOSUS hydrophone array. Several rapid response cruises using hull-mounted multibeam sonar, towed camera, and the remotely operated vehicles (ROV) ATV and Jason discovered, mapped, and sampled a new lava flow (Chadwick et al., 1998; Cowen and Baker, 1998; Rubin et al., 1998). MBARI began exploration and sampling of the lava flows along the entire Gorda Ridge using ROV Tiburon in 2000 (Clague et al., 2003, 2009; Davis et al., 2008; Yeo et al., 2013), including the 1996 pillow mounds in 2005. Davis et al. (2008) reported on the major and trace element and radiogenic isotopic compositions of axial basalt samples from the length of the North Gorda segment and evaluated their petrogenesis, but did not focus on their spatial or temporal variability, nor identify which of their samples were from the 1996 flows.
Methods
The 1-m resolution bathymetric data were collected by MBARI using Dorado class AUVs equipped for seafloor mapping with multibeam sonar, chirp sidescan sonar, and chirp sub-bottom profiler (Caress et al., 2008). A single survey in 2009 was centered over the 1996 flows (Yeo et al., 2013). Two additional surveys in 2016 expanded the coverage to include the Sea Cliff hydrothermal site and the ridge axis between the 1996 flows and Sea Cliff site (Figure 2). The three surveys mapped 35 km2, of which 26.2 km2 is of the graben floor along the axis, and the remainder is of a series of fault blocks to the east of the axis. Prior lava sample locations (Davis and Clague, 1987, 1990: Rubin et al., 1998; Davis et al., 2008) are also shown on Figure 2, subdivided by the MgO content of the recovered glasses.
The 2009 survey was conducted using the AUV D. Allan B. operated from R/V Zephyr; at that time the AUV fielded a 200 kHz Reson 7125 multibeam, dual frequency 110 kHz/410 kHz Edgetech chirp sidescan sonar, and a 2–16 kHz sweep Edgetech sub-bottom profiler. The 2016 surveys were collected using two mapping AUVs operated simultaneously from R/V Rachel Carson; these vehicles each fielded a 400 kHz Reson 7125 multibeam, a 110 kHz Edgetech chirp sidescan, and a 1–6 kHz swap Edgetech sub-bottom profiler. All three AUV survey missions were conducted using a 50 m altitude and a 1.5 m/s (5.4 km/hr) speed for a 16–17 h duration. The AUVs also carry SeaBird SBE-49 fastCat CTD and Paroscientific pressure sensors; during the 2009 survey the AUV also carried Eh, optical backscatter, and magnetometer sensors.
The 200 kHz multibeam used in 2009 produced 256 1°× 1° beams across a 135° swath, and the 400 kHz sonars used in 2016 produced 512 1°× 0.5° beams across a 165° swath (though generally about a 140° swath is achieved in volcanic terrain). A 1°× 1° beam at nadir corresponds to a 0.7 m diameter footprint from a 50 m altitude, and the footprints spread out larger toward the outer swath, yielding an average resolution scale of about 1 m. Following tidal correction, the repeatable bathymetric vertical precision is 0.1 m.
MBARI mapping AUV realtime navigation derives from a Kearfott SeaDevil inertial navigation system (INS) which integrates a 24 cm ring laser gyro, accelerometers, and a 300 kHz Doppler Velocity Log (DVL) through an embedded Kalman filter. The INS is initialized by GPS at the surface and aided during descent by a Sonardyne ultra short baseline (USBL) acoustic tracking system with position fixes transmitted to the vehicles by acoustic telemetry. The INS achieves a position accuracy of 0.05% of distance traveled as long as DVL bottom lock is maintained. In cases where the AUV altitude becomes too small (typically in rugged terrain), the propeller shuts off and the AUV floats up to a safe altitude before resuming the mission. Often DVL lock is lost during these altitude abort events, resulting in discrete jumps in INS positioning that can be in excess of 100 m, resulting in degradation of the mission navigation.
The AUV survey on the eastern slope of the axial graben was designed to cover the Sea Cliff site with a diagonal crossing line and to survey parallel to the slope, starting at the top of the slope (Figure 2). This design was to minimize altitude aborts by having all slope-parallel lines end with a turn away from the slope. The steep terrain nevertheless resulted in multiple altitude aborts and loss of DVL bottom lock despite this planning. The combination of steep terrain and altitude aborts led to multiple gaps in coverage and to areas, including the Sea Cliff hydrothermal site, with degraded coverage.
Multibeam Data Processing
The mapping data were processed using the open source MB-System software package (http://www.mbari.org/data/mbsystem/; Caress and Chayes, 1996). After editing of outliers, navigation adjustment was performed to match features in overlapping and crossing swaths and to set the starting points of each of the three AUV surveys to be global fixed points in the navigation inversion.
The multibeam bathymetry were gridded at 1-m resolution using an algorithm that incorporates the variable beam footprints. Multibeam backscatter maps were constructed by correcting the snippet backscatter samples for grazing angle using the three-dimensional topographic model and the average variation of amplitude with grazing angle for the entire survey.
The outlines of the 1996 lava flows were drawn in GIS to surround flow morphologies in the AUV maps while incorporating dive observation and sample locations from the one ROV Jason dive in 1996 and from MBARI ROV Tiburon dives T885 and T886 in 2005 (Yeo et al., 2013). The 1996 ROV ATV sample locations were poorly constrained and were not utilized. The location of the Sea Cliff hydrothermal vent site was re-determined based on navigation of ROV Tiburon T695–698 in 2004 and T884 in 2005, which had the best navigation of the MBARI dives.
Geochemical Data
Compositions of glasses collected during cruises in 1983, 1985, 1986, 2000, 2002, 2004, and 2005 (Davis and Clague, 1987, 1990; Rubin et al., 1998; Clague et al., 2003, 2009; Davis et al., 2008) are mostly published. These papers discuss the petrogenesis of the lavas in detail, whereas here we focus on combining the compositional data with mapped flow morphology to evaluate emplacement processes. Glass sampling during the three MBARI ROV dives in 2005 included collection of rock samples using the manipulator arm (Davis et al., 2008), and previously unpublished glass samples collected using a 29-jar carousel suction sampler (Clague et al., 2009), and glass recovered in ten 30-cm long push cores collected in small sediment ponds between pillow lobes on older (non-1996) flows (Clague et al., 2003, 2009; Supplementary Table S1). Clague et al. (2013) describe the equipment and sampling methodologies employed. Six of 28 samples collected with the suction sampler, wax-tip rock core GR00RC7, and all push cores contained glass shards have more than one composition. Normal and transitional mid-ocean ridge basalt (N-MORB and T-MORB) are subdivided by K2O/TiO2 with N-MORB < 0.10 and T-MORB > 0.10, as proposed by Dreyer et al. (2013) for Juan de Fuca MORBs.
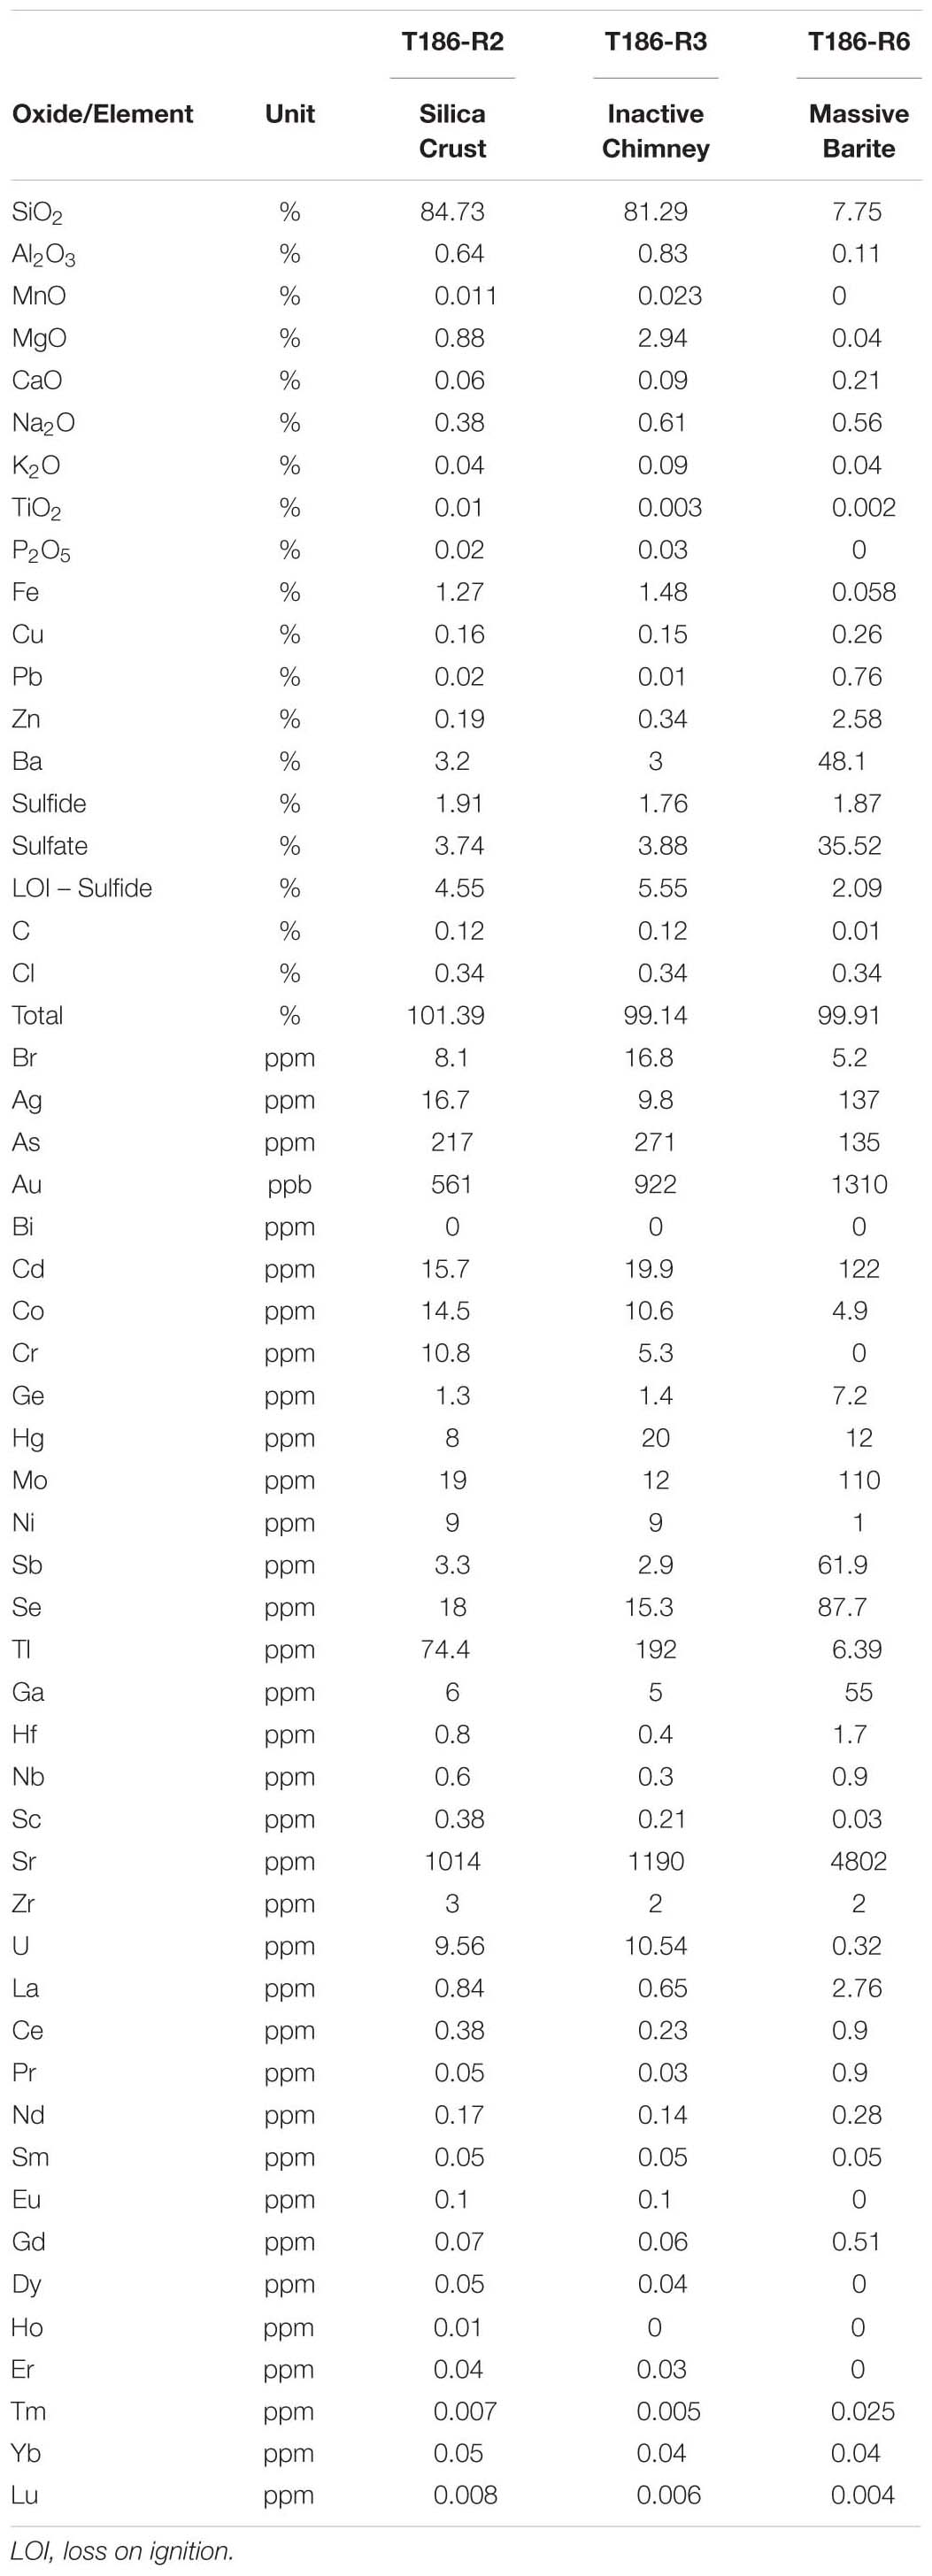
Table 1. Composition of hydrothermal samples from sea cliff vent field.
Davis and Clague (1987, 1990) used a value of 6.96 wt% for MgO in Smithsonian glass standard VG2 determined against other standards in the 1980s and 1990s, but the data in Davis et al. (2008) and Clague et al. (2003, 2009) used the reported standard value of 6.72 wt%. The analyses in all these papers and new data in Supplementary Table S1 have been adjusted based on reassessment of the MgO content of glass standard VG2 to 7.07 wt% (Clague et al., 2018b) and their MgO values are now internally consistent and consistent with secondary standard ALVIN 2392-9 from the East Pacific Rise. The electron microprobe equipment and settings, methods, and standards are described in Davis and Clague (1987) and Davis et al. (2008).
Three samples of deposits from the Sea Cliff hydrothermal site were analyzed at ActLabs using a variety of techniques that are outlined in Paduan et al. (2019), which also includes analyses of standards and analytical precision and accuracy. The analytical data (Table 1) are for a fragment from an inactive chimney, a silica-rich crust, and a barite-rich crust.
Results
The 1996 Eruption Site
The 1996 flow boundaries were mapped by Chadwick et al. (1998) based on comparison of pre-eruption and post-eruption ship-based multibeam surveys, camera tows, and visual observations and lava flow sampling during two ROV dives done soon after the eruption took place. They identified a single elongate lava flow a little less than 3 km long. At the same time, Chadwick et al. (1998) suggested another possible 1.5-km long flow located nearly 7 km south of the southernmost end of the established 1996 flows. Yeo et al. (2013) used the AUV data presented here, and observations and samples from ROV dives T885 and T886 done in 2005, to redefine the flow margins and to show that the 1996 flows comprised three discrete steep-sided mounds (Figure 3). The contacts are clearly identifiable with black lava flows (Figure 4A) draped on older flows covered with sediment and hosting extensive animal communities. These mounds occupy the sites of the thickest depth anomalies mapped by Chadwick et al. (1998) in their Figure 6B. The pillow mounds were still covered in part by tan deposits of hydrothermal sediment/bacterial mats 9 years after the eruption (Figure 4B). The regions with smaller depth anomalies that were thought to connect the thicker mounds turn out to be older, pre-1996 lava flows. Yeo et al. (2013) compared the new flow outline (also used here in Figure 3) with that of Chadwick et al. (1998). The three 1996 hummocky flows cover just 0.31 km2 and the three mounds have a combined volume of 0.007 km3 (Yeo et al., 2013), both just 39% of the area and volume estimated soon after the eruption (Chadwick et al., 1998). The thickest of the pillow mounds is ∼114 m tall, although the pre-eruption surface depth is uncertain due to lack of high-resolution pre-eruption bathymetric data.
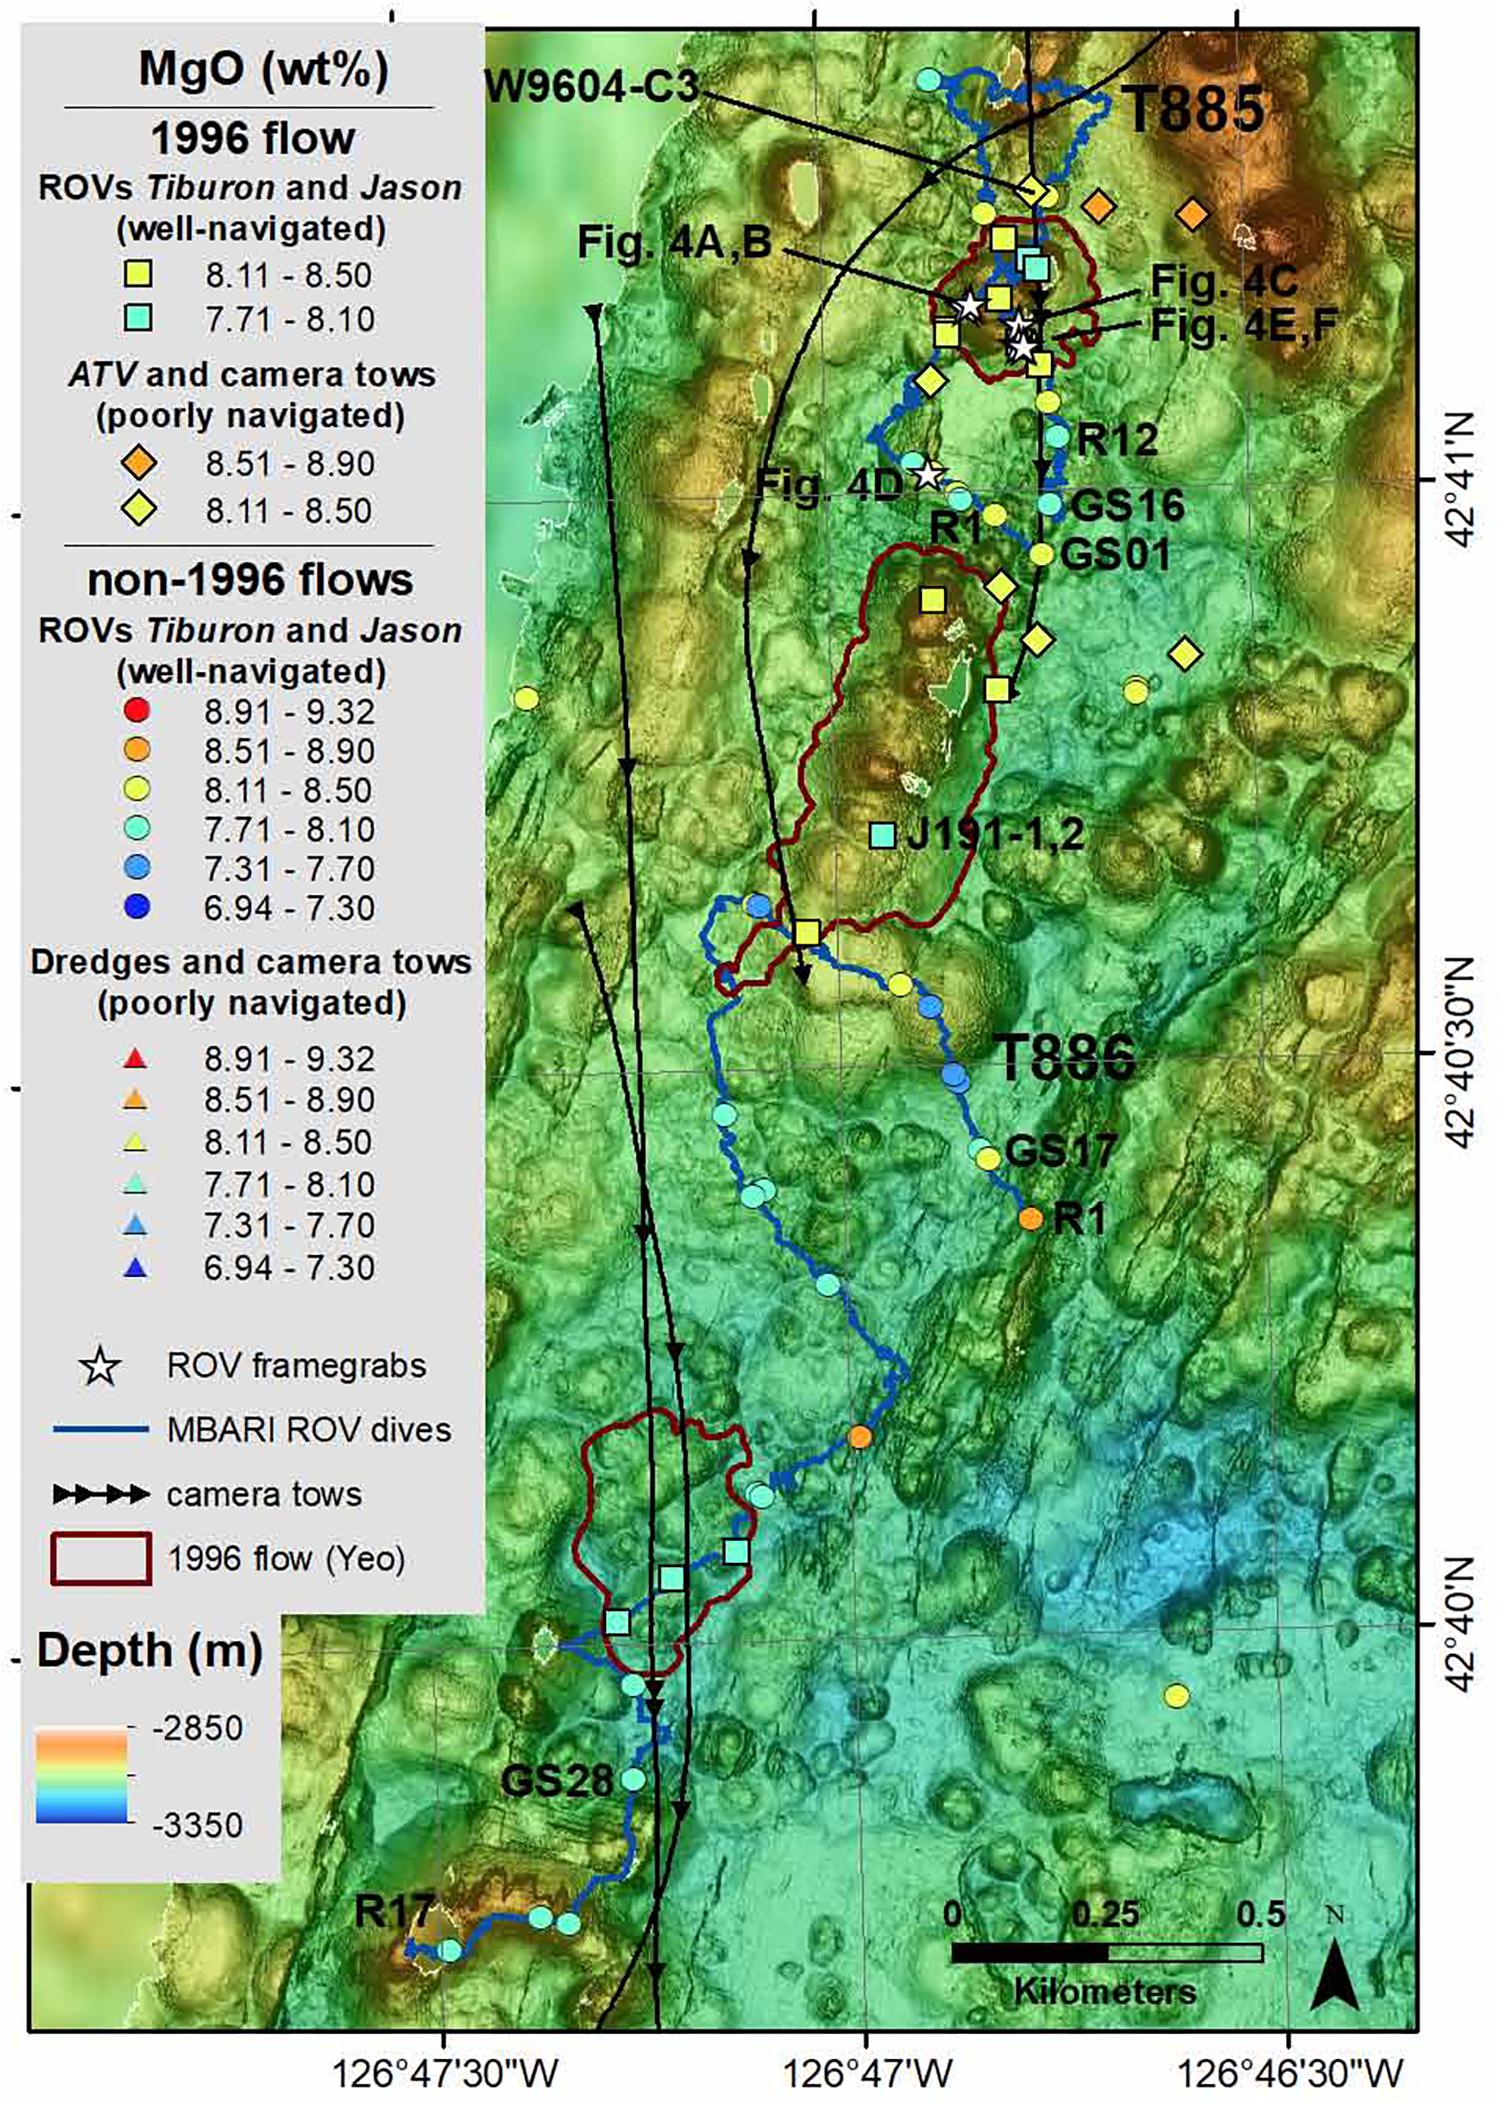
Figure 3. Map of 1996 lava flows with flow extent from Yeo et al. (2013) as red outline. Blue lines are tracks of ROV Tiburon dives T885 and T886 (Davis et al., 2008; Supplementary Table S1) with some rock (R) and glass suction (GS) samples labeled. Fifteen 1996 flow samples from Rubin et al. (1998) include seven well-located ROV Jason samples, seven poorly located ROV ATV samples, and one sample recovered on a camera sled (black curved lines show camera tow tracks from Chadwick et al., 1998, note that the camera tow sample – yellow diamond near N end of map – does not plot within the AUV mapped 1996 flow). Locations of video framegrabs from dive T885 in Figure 4 are labeled.
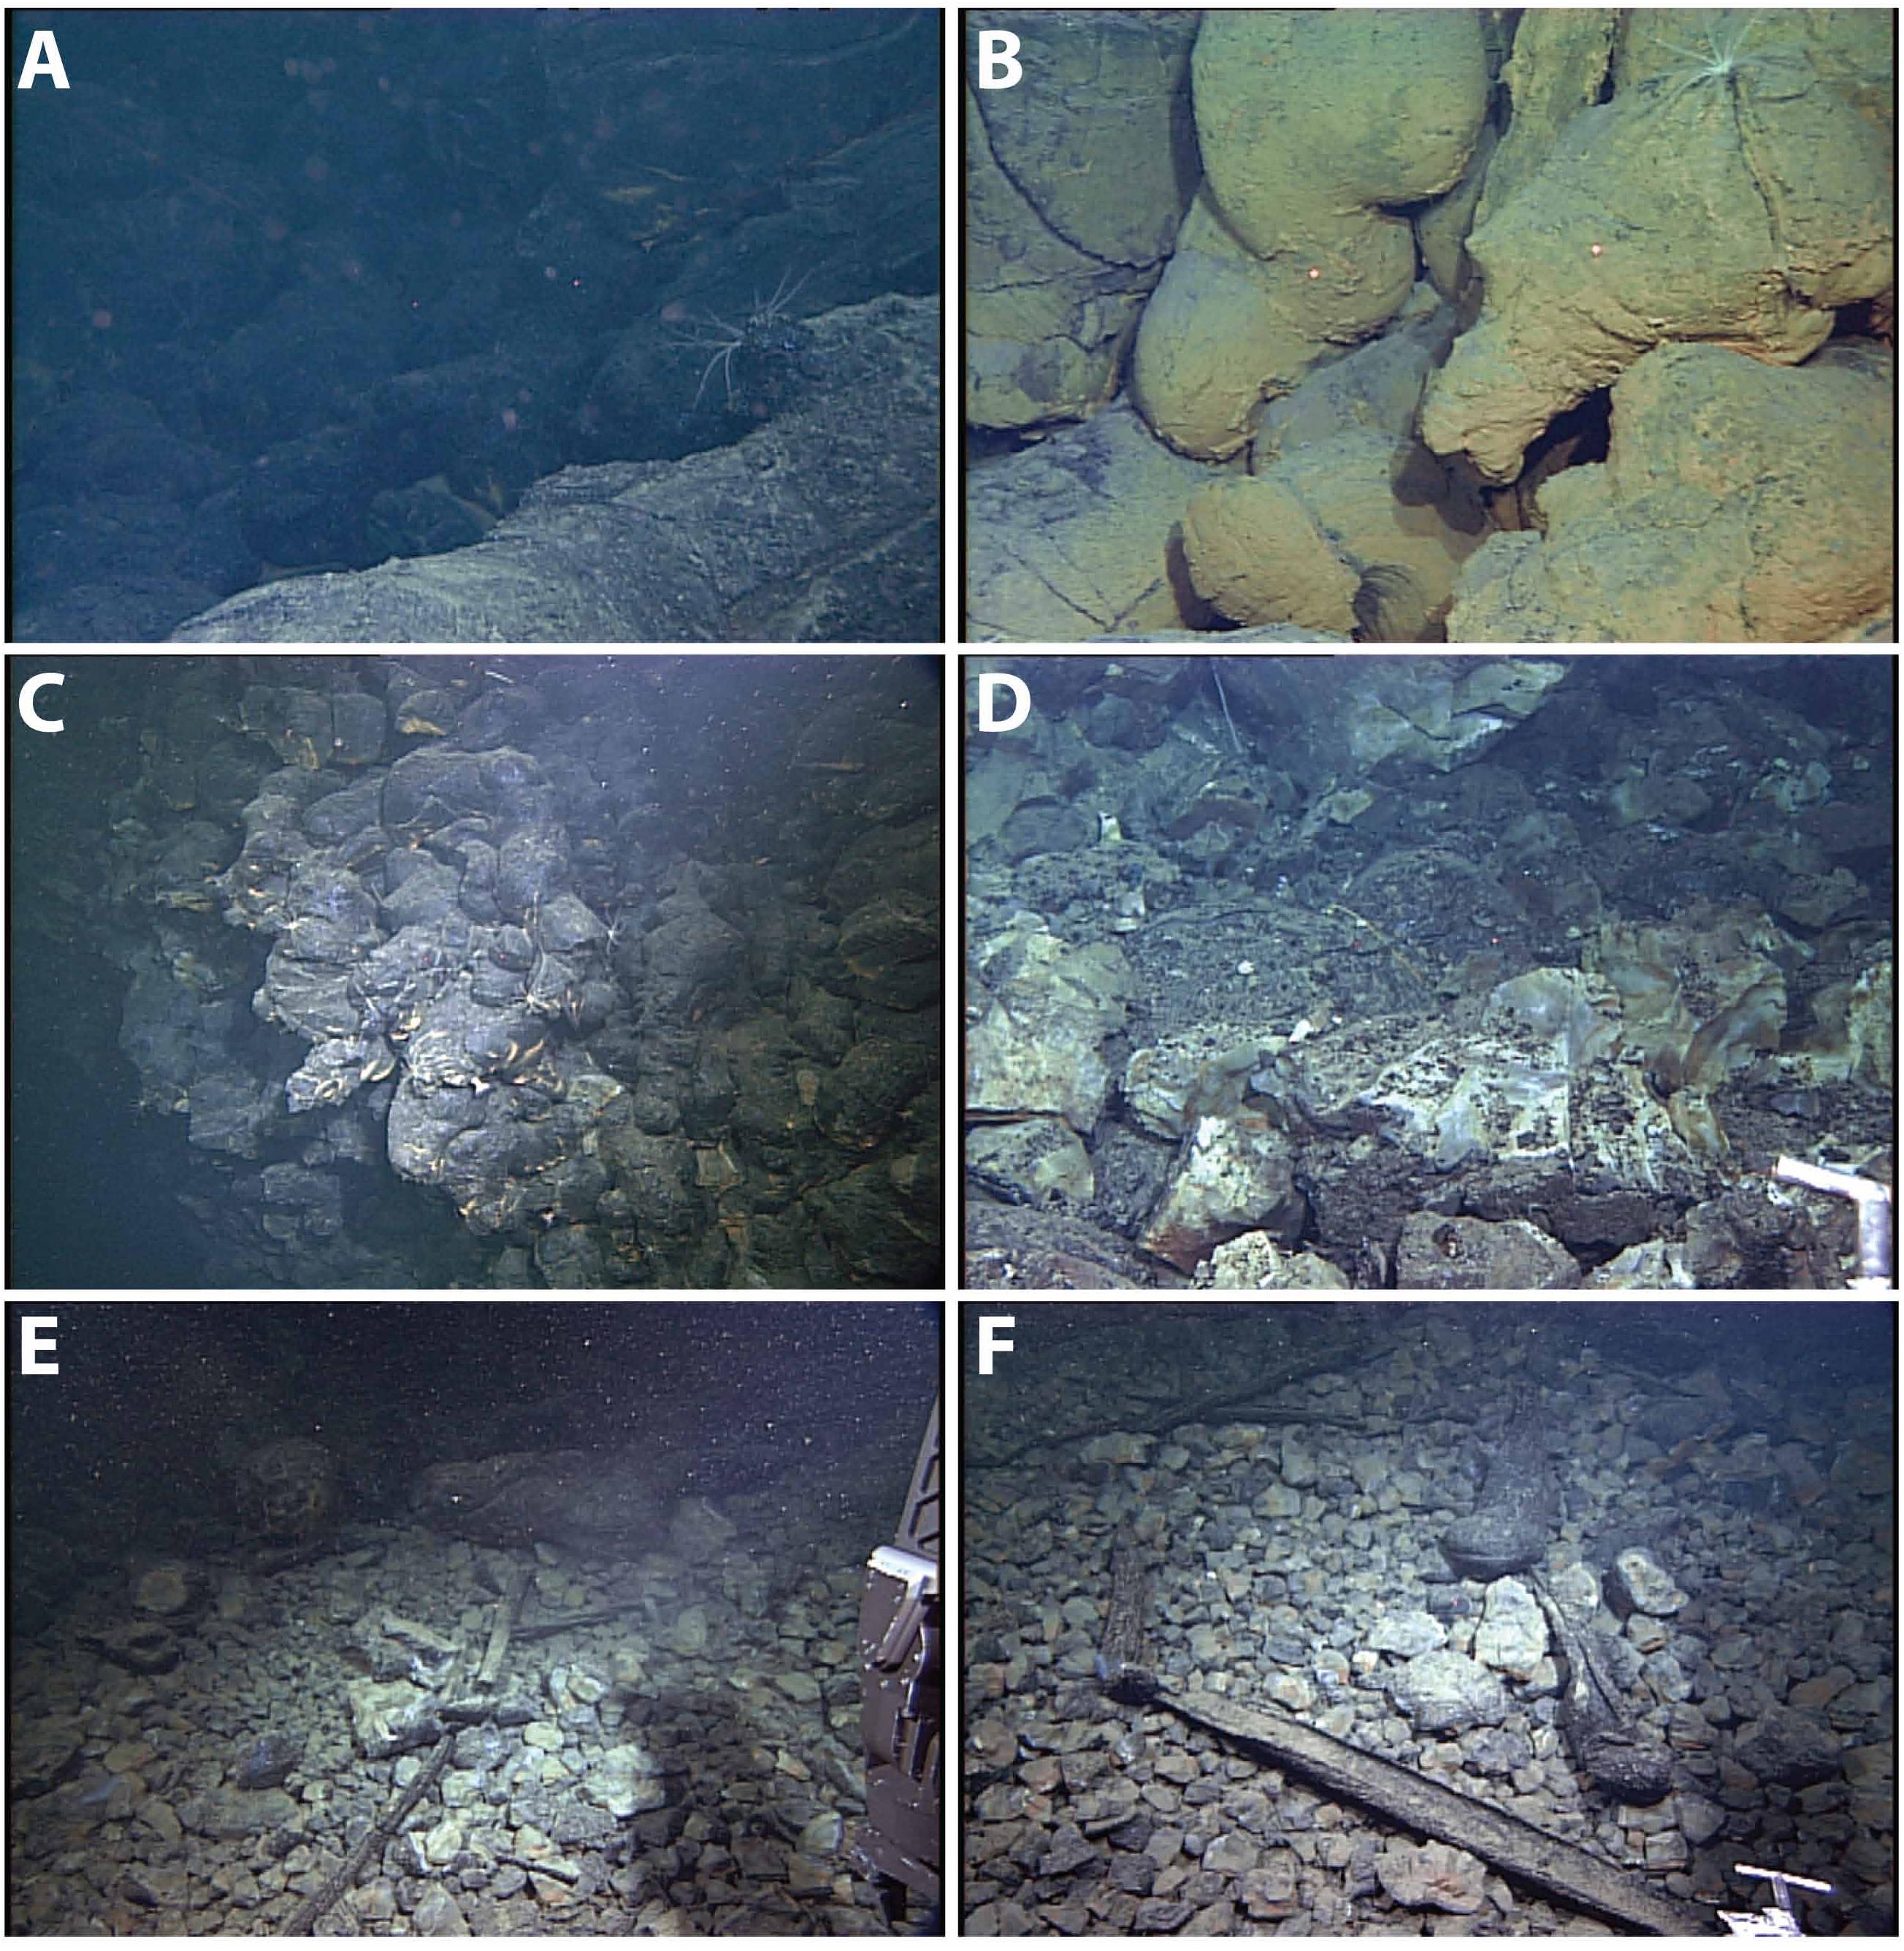
Figure 4. Video framegrabs from dive T885; images B, D, and F are 2–3 m across and A, C, and E are 4–5 m across. (A) Contact showing black 1996 lava pillows (upper left) on top of slightly altered and sediment-covered older flow (lower right). Image taken at 3058 m depth at 42.686030°, –126.780538°. (B) Elongate 1996 pillow lavas with thin yellow-brown hydrothermal deposits. Photo taken 9 years after the eruption. Image taken at 3052 m depth at 42.686072°, –126.7804625°. (C) Upper surface of northern pillow mound with vertical to overhanging scarp to left. Image taken at 3053 m depth at 42.685767°, –126.7795013°. (D) Pillow talus at base of scarp with scattering of glass shards produced when pillow fragments fall down scarp and glass rinds spall off. Image taken at 3115 m depth at 42.683628°, –126.781378°. (E) Lavacicles found on top of talus at base of vertical scarp. These form as molten lava cascades over the scarp and drip as vertical cylinders of lava. Image taken at 3101 m depth at 42.685471°, –126.779523°. (F) Lavacicles showing teardrop shapes formed at bottom of lavacicles. Some lavacicles have slightly bent ends showing that they were still plastic when they fell to the talus slope. Image taken at 3101 m depth at 42.685447°, –126.779418°.
The hummocky flows erupted in 1996 form composite pillow mounds with near-vertical outer upper margins (Figure 4C) and extensive talus deposits at the base of the steep to vertical slopes. Talus deposits have a distinctive smooth texture on sloping topography in the AUV data (Clague et al., 2011, 2014, 2018b). Within a few m of the margin of the talus, pillow fragments have loose shards of glass (Figure 4D) on their surfaces. Some of the talus fragments are elongate “lavacicles” ∼10-cm in diameter and as long as several meters (Figure 4E), and some are tear-drop shaped at one end (Figure 4F). Clague et al. (2018b) describe lava forms similar to the lavacicles from the base of the steep pillow ridge that formed on the distal southern rift zone of Axial Seamount in 2011.
Twelve lava samples identified by Rubin et al. (1998) as 1996 flow samples were collected during the three 1996 event response cruises. Fifteen additional samples (8 Rocks and 7 Glass Suction samples identified as 1996 flow samples (Supplementary Table S1) were collected during two 2005 MBARI ROV dives and are plotted on Figure 3. Many of the ROV ATV samples identified by Rubin et al. (1998) as 1996 flow samples are located significantly outside the mapped flow margins. Of the seven ATV178 samples only ATV178-7R and ATV178-1R1 are unequivocally established as 1996 flow samples by 210Po-210Pb dating (Rubin et al., 1998) and mis-identification of samples as 1996 lavas is possible, but poor navigation of the ATV dive is a more likely explanation for the plotted positions. The 1996 lavas are normal-MORB (N-MORB with average K2O/TiO2 = 0.079, MgO in glass between 7.87 and 8.65% (average of 8.27%), and with relatively high Na2O content, averaging ∼2.8%. The variability is significantly greater than precision of the analyses; the analyses from Rubin et al. (1998) average 0.18% higher MgO than those from Davis et al. (2008) and Supplementary Table S1. The compositions are not randomly distributed as those with the lowest MgO contents are from the tops of several mounds, and presumably extruded near the end of the eruption.
Pre-1996 lava flow compositions (MgO, K2O/TiO2, and Na2O) of samples collected within the axial valley and lavas with 1996 flow compositions are plotted as function of latitude (Figure 5). Along the ridge, MgO content (Figure 5A), an indicator of degree of fractionation, varies from∼7% to 8.8%, although almost half that range is displayed by the 1996 flow samples. At the southern end of the study area, all samples have > 7.9% MgO. The K2O/TiO2, an indicator of enrichment, varies from 0.06 to 0.16, so includes N-MORBs with ratios < 0.10 and T-MORBS with ratios > 0.10 (Figure 5B). The 1996 lava flows are N-MORB with similar K2O/TiO2 to surrounding older lava flows. The 1996 samples have a narrow range of Na2O values (Figure 5C) that is roughly the analytical uncertainty. The 1996 flows and the older flows surrounding them have a similar range of values. Most of the southernmost samples (dive T187) have low Na2O (< ∼2.4%) whereas the samples from the rest of the study area have higher Na2O (generally >2.5%).
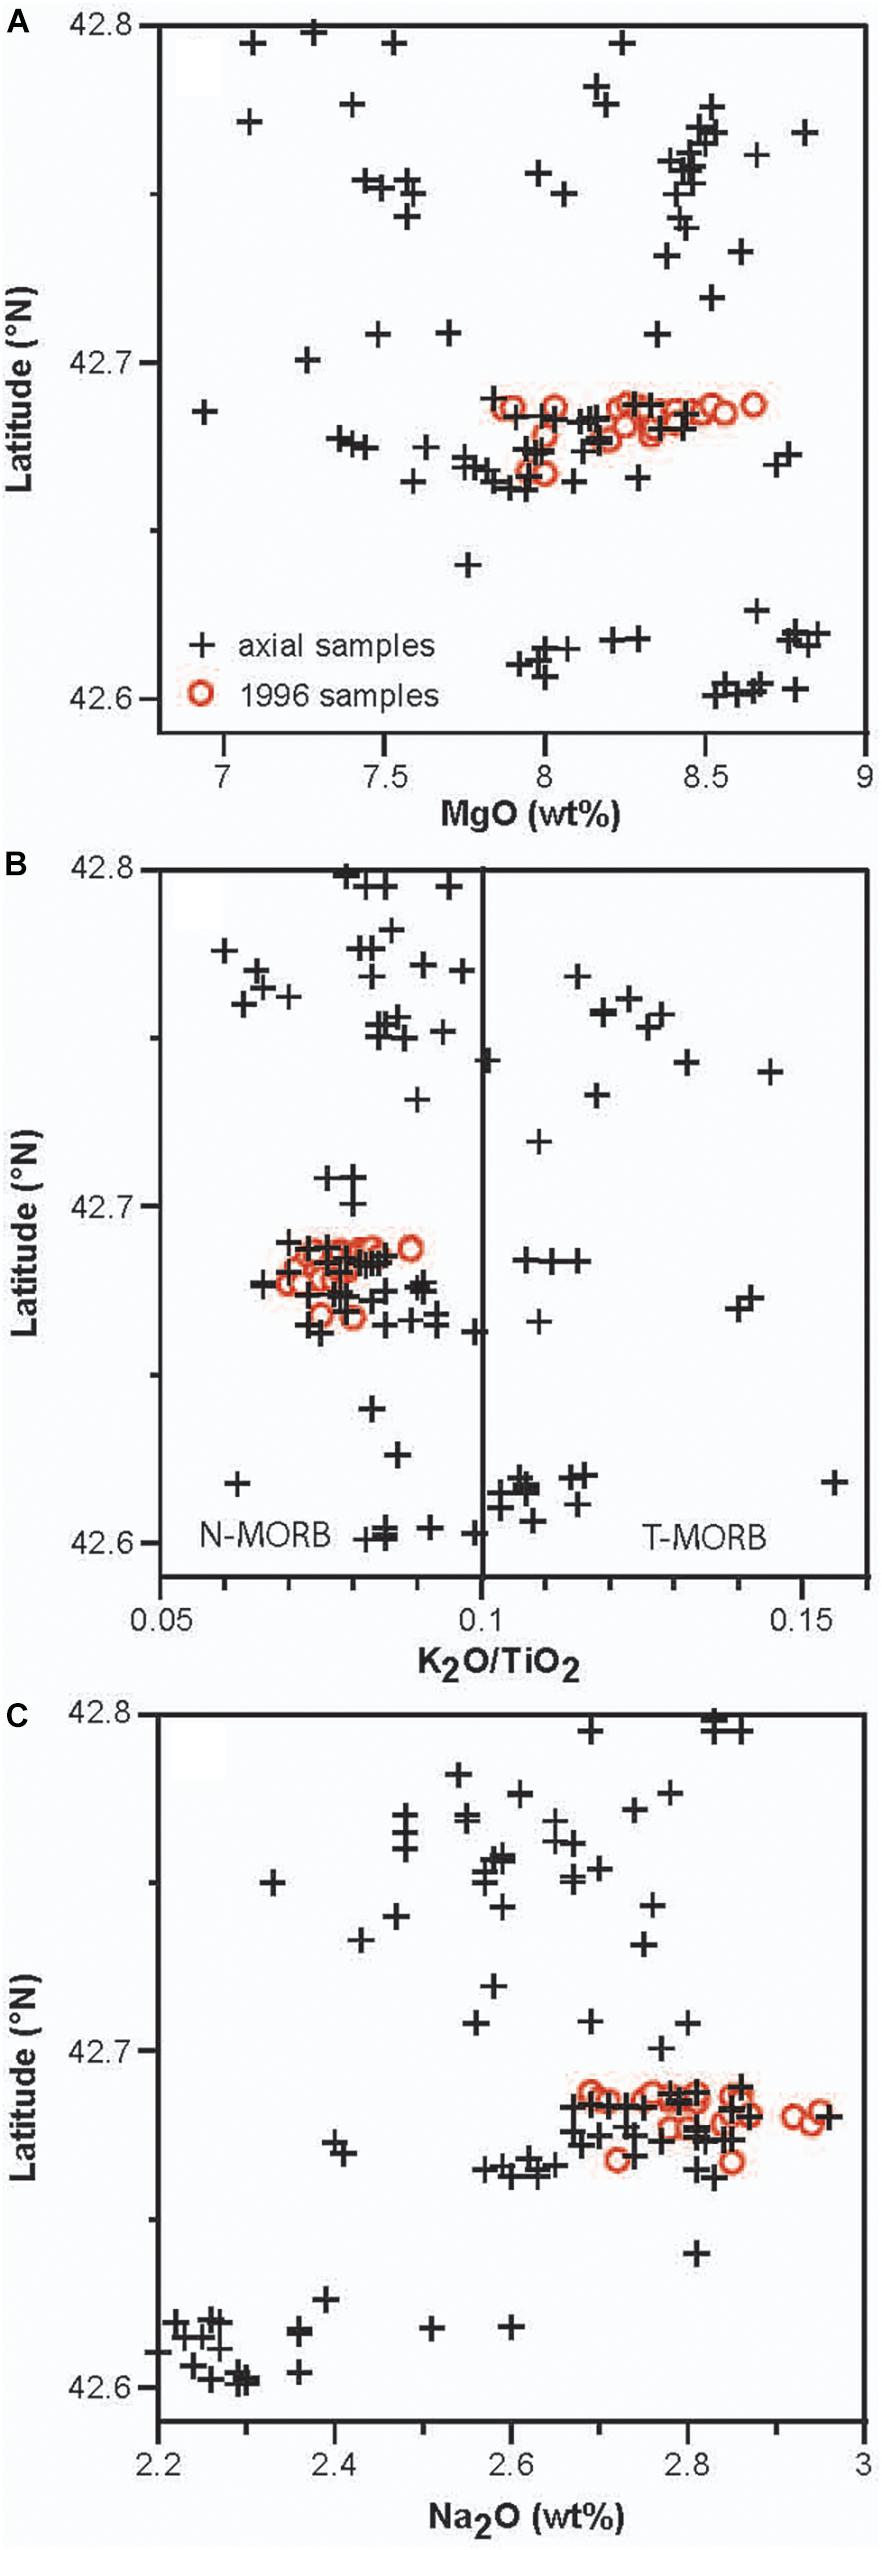
Figure 5. Lava geochemistry as a function of latitude for samples collected from the axial valley and divided into 1996 flow samples and older flow samples. (A) MgO, (B) K2O/TiO2 with values < 0.10 classified as N-MORB and values > 0.10 classified as T-MORB, (C) Na2O.
The site of a proposed more southerly 1996 flow (Chadwick et al., 1998, their Figure 7) was explored and sampled during ROV Tiburon dive T187 in 2000 (Supplementary Figure S1), but all flows observed and sampled had moderate to thick sediment cover and sessile animal communities and were therefore much older than 4 years. This proposed flow is probably an artifact of the poorly located swath bathymetry that predated the eruption, as noted by Chadwick et al. (1998). Sample W9604-C2 (Rubin et al., 1998) was recovered on a towed camera sled about 8 km south of the southern end of the 1996 flows; its location is replotted on the eastern axial valley wall (Figure 2 and Supplementary Figure S1). It contains Na2O of 2.39%, similar to most samples from T187 (Supplementary Table S1) and distinctly lower than samples from further north along the camera tow (Figure 3).
A 4.5-km Transect Across and East of the Axis
Sampling and observations were made on a cross section of the ridge near 42°45′N, extending ∼4.5 km from the center of the axial graben up the eastern flank of the ridge centered on the Sea Cliff hydrothermal site (Rona et al., 1990; Von Damm et al., 2006). One AUV survey mapped this area, establishing high-resolution bathymetry of the axial graben and major fault blocks to the east (Figure 6A). A profile of the ridge was constructed (Line X-X′ in Figures 6B,C) from the AUV 1-m bathymetry and, farther to the east, from a hull-mounted multibeam EM300 (MBARI Mapping Team, 2001) and EM302 collected in 2019 during Ocean Exploration Trust’s R/V Nautilus cruise NA108.
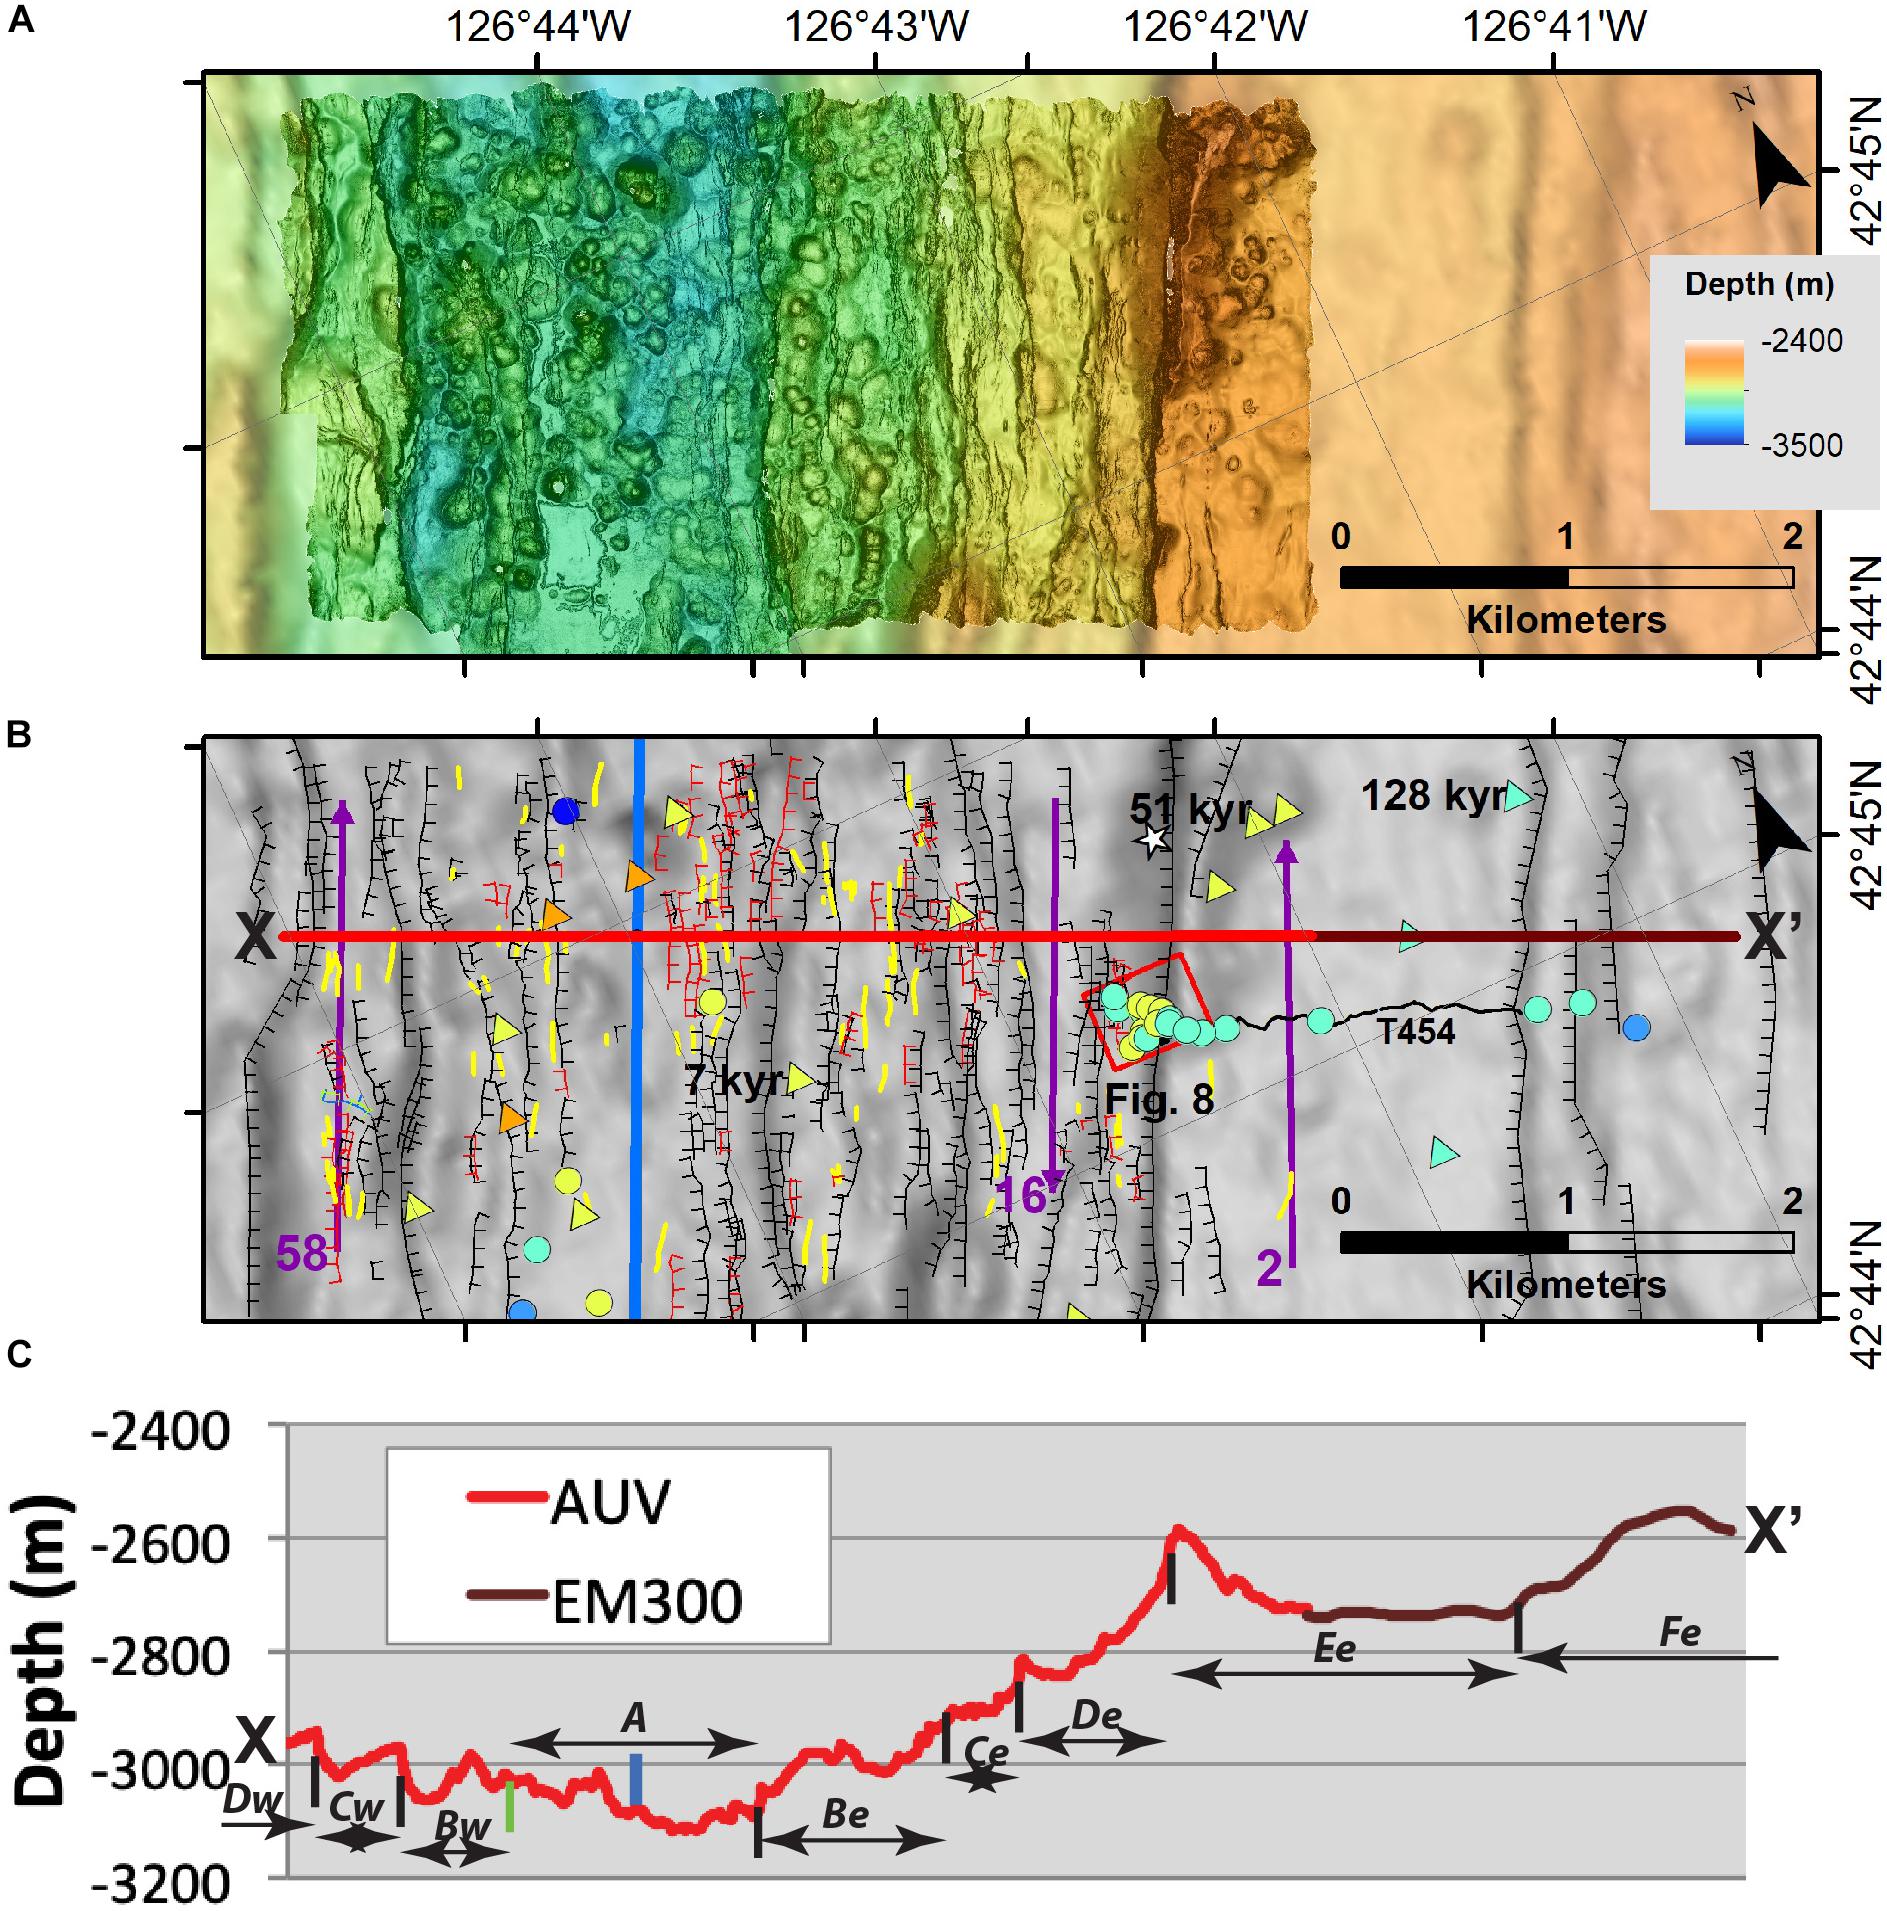
Figure 6. (A) Maps and interpretations of a transect across the narrowest, shallowest part of the North Gorda segment east beyond the Sea Cliff hydrothermal vent field. All maps are rotated 23°clockwise and at the same scale. AUV bathymetry is shown on top of Simrad EM300 and EM302 bathymetry. (B) Locations of lava samples are indicated on faded bathymetry from map A, with symbols as in Figure 2. Sea Cliff hydrothermal field is within the box outlining the location of Figure 8 and the newly discovered Apollo field is the white star. Line labeled X-X′ is the location of the cross section in panel C. Three NNE-SSW purple lines labeled 2, 16, and 58 are the locations of sub-bottom seismic profiles in Supplementary Figure S2. Blue line is the estimated center of the axial graben (labeled A in panel C), and used to measure distance that samples are located off-axis in Figure 7. Linework shows inward-facing fault scarps in black, outward-facing fault scarps in red, fissures in yellow, and a pair of north- and south-facing scarps in green and blue. The numbers 7, 51, and 128 show the ages (in kyr) and locations of three lava samples dated by 238U/230Th disequilibria (Goldstein et al., 1991). Track of ROV Tiburon dive T454 is labeled. (C) Profile across the North Gorda segment, constructed from AUV survey data (red line) and Simrad EM300 ship data (brown line) to the east of the AUV survey, along the cross-section X to X′ in panel B. The profile has 2.5X vertical exaggeration and extends from ∼ 1 km west of the axis to 3 km east of the Sea Cliff hydrothermal site. Normal faults with 30–70 m vertical offsets are indicated by vertical black lines. Boundary between A and Bw (green vertical line) is where a major-offset fault should occur (to mirror the eastern blocks) but only a cluster of small offset faults are observed. The fault blocks labeled Dw, Cw, Bw, A, Be, Ce, De, Ee, and Fe from west (w) to east (e) are labeled.
The bathymetric data show numerous faults, which we have subdivided into major faults based on their having 30–70 m of throw, to minor faults with smaller vertical offsets. Both types are mapped in Figure 6B, which shows the complexity of the faulting. The faults are mostly normal faults with the downthrown side toward the axis, as expected. However, a few small-offset normal faults have the opposite throw. Such faults especially occur in a zone southeast of the axis and northwest of the cross-section (Line X-X′ in Figure 6B). Major faults with larger throw or clusters of faults with larger combined vertical offsets are identified in the cross section of Figure 6C.
The major faults nearest the axis are asymmetrical. The first major fault east of the axis (between fault blocks A and Be in Figure 6C) has no single counterpart west of the axis with a similar throw. On closer inspection, the axial graben includes the unfaulted neovolcanic zone (through which the blue line is drawn in Figure 6B), symmetrically increasingly faulted flows away from that zone (which are included in the block labeled A in Figure 6C), and an inferred block, Bw to the west. The similar appearance of block Be to Bw, supported by the matching morphology of the eastern and western blocks of C and D, suggests the counterpart to Bw is the uplifted fault block Be, despite its being at a similar depth to the axial zone A. The overall faulting balances out over longer time periods, however, as there are blocks with similar structures and depths as Ee and Fe beyond the AUV coverage west of the axis (Figure 2) and the total accumulated rift valley depth is equal on both sides (Figure 2). This suggests the asymmetry may shift over time. Furthermore, the axis has a slight shift to the west in the shallow area (Figures 1, 6A). This shift is accommodated by the major faults that define a series of ridge-parallel blocks that step up from the axis and are between 350 m to 1750 m wide (blocks Ce and Ee, respectively, Figure 6C). Block Be and its inferred western counterpart Bw differ in width by about a factor of two, whereas blocks Ce and Cw are similar in width. Without high-resolution data farther to the NW, comparisons of blocks NW and SE of the axis are less reliable as the smaller faults are not detected in the lower-resolution ship data.
The bathymetric data (Figure 6A) also show a marked smoothing of the bathymetry on the fault blocks more distal from the axis. AUV sub-bottom profile data (Supplementary Figure S2) show that the easternmost block Ee (line 2 on Figure 6B and Supplementary Figure S2A) above the Sea Cliff hydrothermal site is buried by up to 0.005 s two-way travel time (TWTT) of sediment, or ∼5 m, which is consistent with ROV Tiburon dive T454 observations (Figure 6B) of complete burial of the lava flows. Continuing west toward the axis, block De (line 16 on Figure 6B and Supplementary Figure S2B) just below the Sea Cliff site is buried by up to 0.002–0.003 s TWTT of sediment, or ∼2–3 m. Block Be has no detected sediment in the sub-bottom records (A on Figure 6C). Continuing west, away from the axis, fault block Cw (Figure 6C) has up to 0.003 s TWTT of sediment (line 58 on Figure 6B and Supplementary Figure S2C) or 3 m, similar to that on block De just below Sea Cliff.
There are also differences in the flow morphology of the fault blocks progressing away from the axis (Figure 6A). A, Bw and Be have abundant small, hummocky flows. Ponded channelized flows are found only on block A. Fault blocks Cw and Ce are more fractured than A, Bw and Be, and consist of low-relief hummocky flows dissected by faults. Block Ee, east of the steep flows truncated by the fault that Sea Cliff lies on, is even smoother due to the thick sediment cover, although several small steep hummocky flows constructed of pillow lava with summit collapse craters can still be identified.
Three samples from this transect were dated using 238U/230Th disequilibrium (Goldstein et al., 1991) and are plotted on Figure 6B. A MORB sample from block Be, dredged 0.7 ± 0.3 km from the axis center (dredge L585NC-13), yielded an age of 7 ± 10 ka. A second MORB sample from near the western margin of block Ee, dredged 2.7 ± 0.1 km from the axis center [L585NC-7; labeled 85-7 in Supplementary Table S1)] yielded an age of 51 ± 12 ka. This age is significantly younger than the 98 ± 4 ka age predicted based on half-spreading rate and the sample is from a shallower portion of block Ee with thinner sediment cover (NE end of line 2 in Supplementary Figure S2). A third MORB sample from the distal part of block Ee was dredged 3.9 ± 0.4 km from the axis center (L585NC-4) and yielded an age of 128 ± 13 ka, within error of the predicted age of 142 ± 16 ka based on the half-spreading rate. Combining this age and the roughly 5 m of sediment on block Ee observed on dive T454 to the south (Figure 6B) suggests a sediment accumulation rate of ∼3.9 cm/kyr, less than the 5–14 cm/kyr estimated for the Holocene in Escanaba Trough (Karlin and Zierenberg, 1994).
Lava samples were collected along this transect as a combination of dredged rocks from 21 sites (Davis and Clague, 1987, 1990), two Sea Cliff submersible samples, 20 ROV Tiburon samples, and, in the axial graben only, 13 wax-tipped rock core samples (Davis et al., 2008). The MgO content and K2O/TiO2 are plotted in Figure 7 as a function of distance from the center of the axial graben (blue line in Figure 6B) projected onto the cross section (red X-X′ line in Figure 6B). The axial graben samples have MgO between 7.1 and 8.8% (∼40% crystallization) and range from N-MORB with K2O/TiO2 of 0.06 to T-MORB with K2O/TiO2 up to 0.15. The observed variations in lava compositions along the axis (Figure 5, left edge of Figure 7) are not observed back in time in the cross section east of the axis (Figure 7) where increasing distance from the axis is taken to mean increasing age of the lavas. Instead, the off-axis lavas < 3.5 km from the axis are mostly uniform N-MORB with MgO contents mostly in a narrow range from 7.8 to 8.25% (< ∼15% crystallization) and in K2O/TiO2 from 0.05 to 0.09, with two T-MORB with K2O/TiO2 of 0.12 and 0.19 collected about 4 km east of the axis. Primitive melts (with MgO > 8.3%) and samples that have undergone more extensive crystal fractionation (with MgO < 7.6%) are not represented among the off-axis samples. Lavas from farther away include one T-MORB with K2O/TiO2 as high as 0.19 (Figure 7B), although all but one (the most distant sample in the study) of these more distal lavas have similar MgO contents as those closer to the axis. The sampling off-axis is not as dense as along-axis, but dredged (Davis and Clague, 1990) and ROV-collected (Davis et al., 2008) samples have similar patterns, with more T-MORBs among the dredged samples. The least fractionated (MgO = 9.3%) and most depleted (K2O/TiO2 = 0.042) lava from the Gorda Ridge (Davis and Clague, 1987) is a poorly located dredge sample from west of the AUV mapped region.
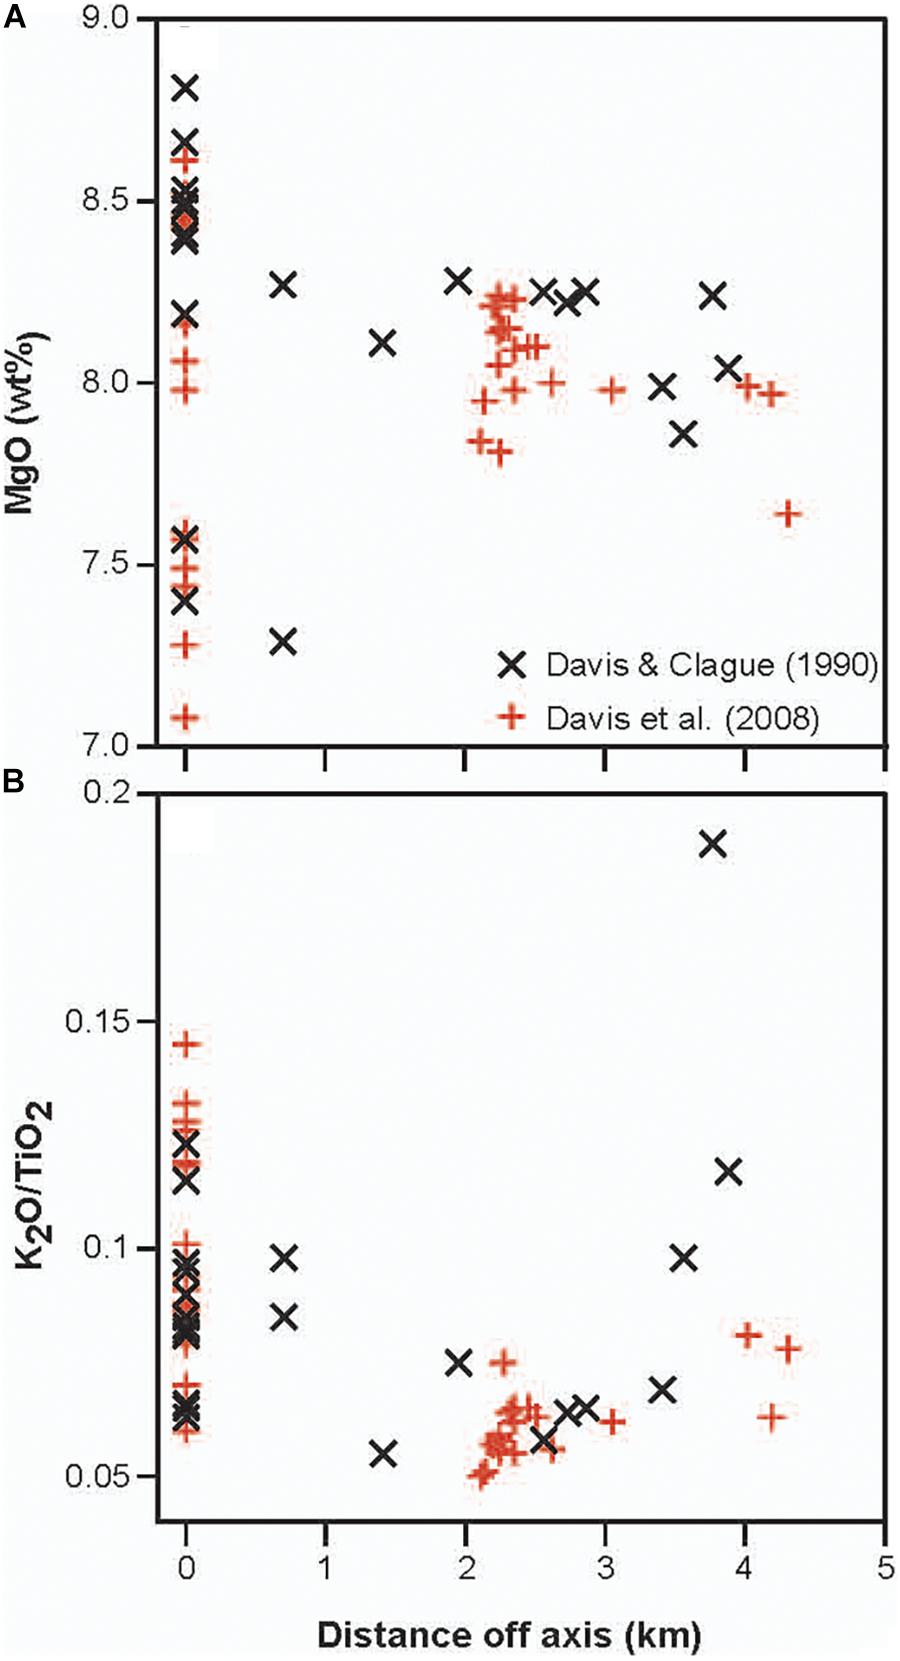
Figure 7. Geochemistry of samples from east side of axial valley projected onto cross section in Figure 6C. Distance is from the center of the axial graben. Dredge samples from Davis and Clague (1990) are plotted in the middle of the dredge track. (A) MgO vs. distance from center of axis. (B) K2O/TiO2 vs. distance from center of axis.
In summary, the youngest axial lavas include more fractionated and more primitive samples than the flank, and many of them also are T-MORBs not seen on the flank closer than ∼4 km from the axis. The most distal, presumably oldest samples include more enriched T-MORB compositions, but have a narrow range of fractionation with neither strongly fractionated nor primitive compositions. In addition, the most depleted and the most enriched MORBs (highest and lowest K2O/TiO2) from the Gorda Ridge north of Escanaba Trough are from opposite sides of the axis (Davis and Clague, 1987, 1990; Davis et al., 2008).
Sea Cliff Hydrothermal Site
An AUV mapping survey in 2016 added 1-m bathymetry over the Sea Cliff hydrothermal vent field. Here we present new details about the geologic setting of the Sea Cliff vents based on the AUV mapping, an improved map of the vent field and high- and low-temperature deposits (Figure 8), new observations from the ROV Tiburon dives (Figure 9), and three new bulk analyses of the deposits (Supplementary Table S2).
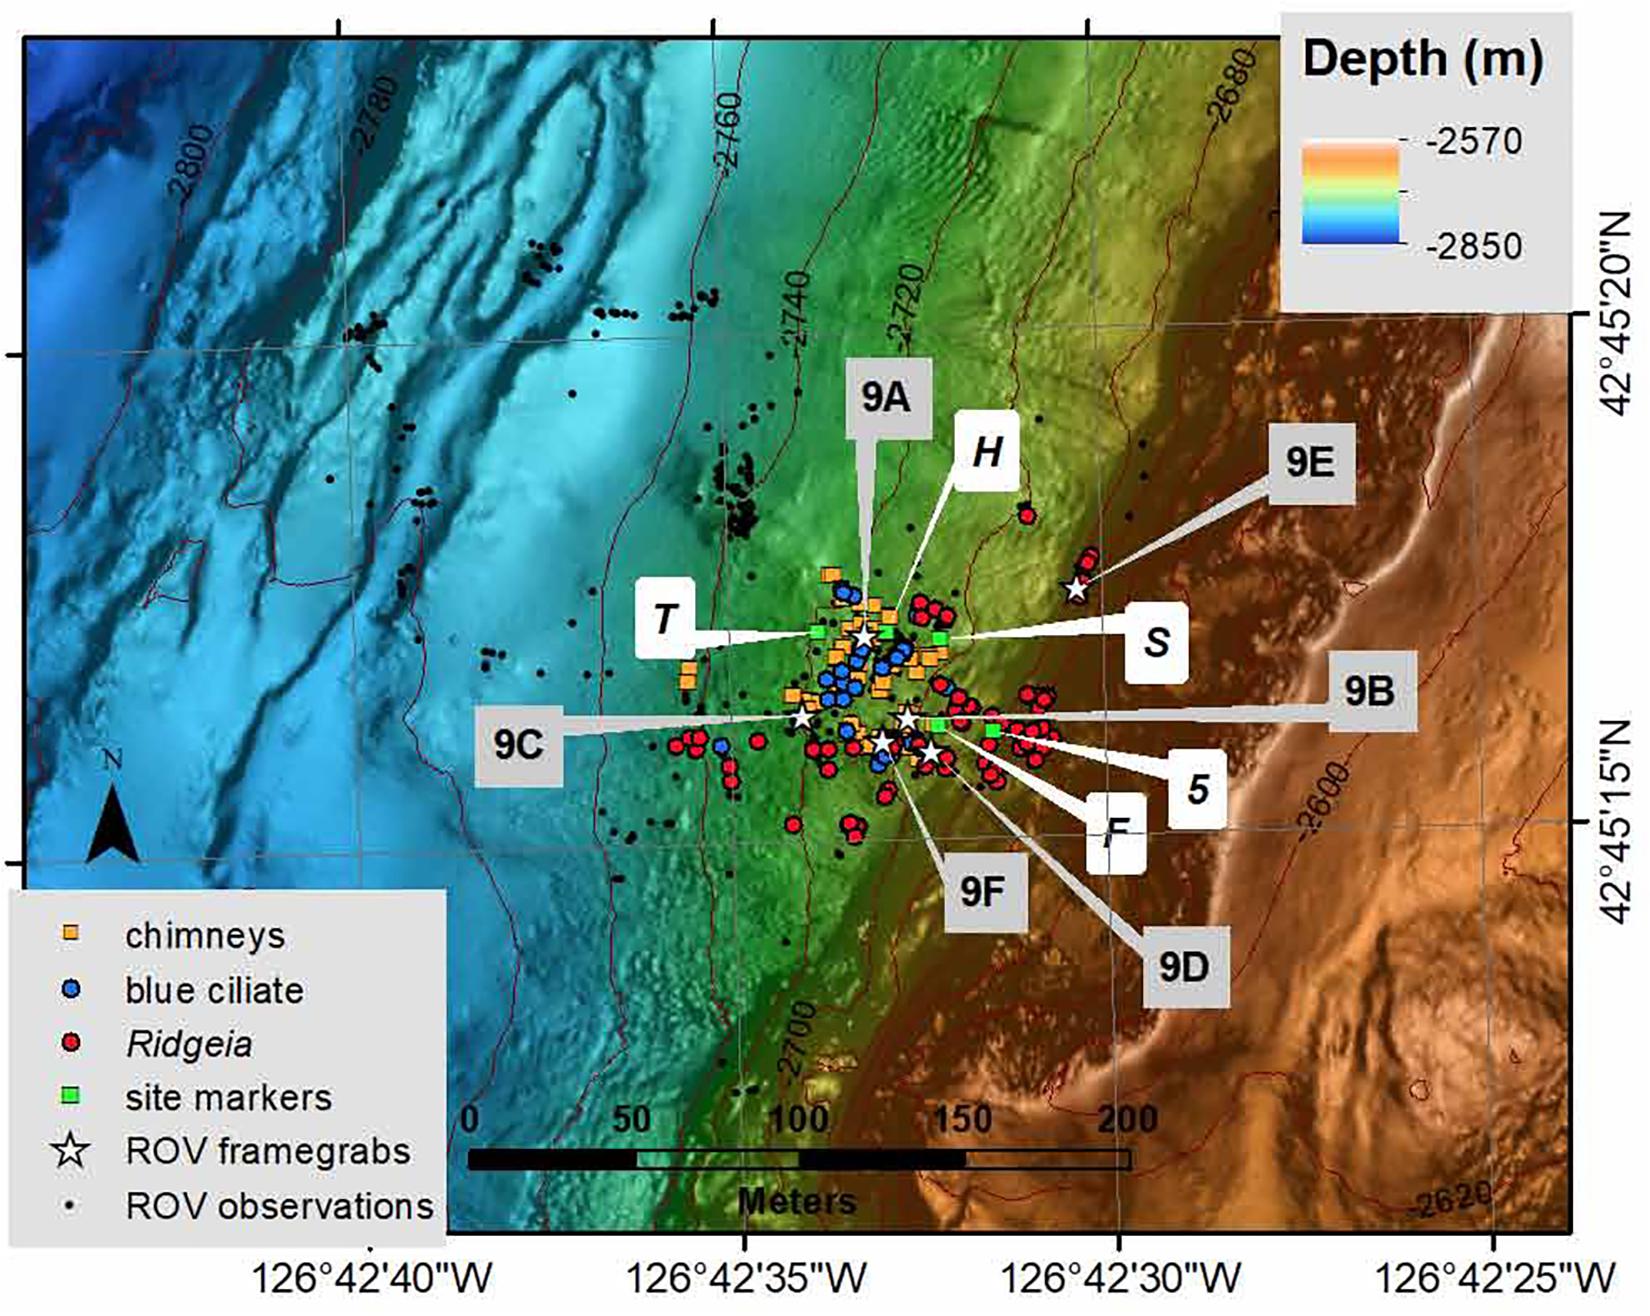
Figure 8. Map of the Sea Cliff hydrothermal site based on dive observations from dive T884 in 2005. All video annotations are shown as small black dots, and observations of Ridgeia piscesae tube worms (red dots), blue ciliate mat (blue dots), hydrothermal chimneys (gold squares), and markers deployed on 2000 and 2002 dives (green squares) shown. The symbols are the location of the ROV when a specific feature was observed in the video, so a single feature can result in multiple observations. Locations of video framegrabs in Figure 9 are labeled, as are site markers. The S “marker” is two Sea Cliff submersible steel plate dive weights located about 2 m apart. The cluster of video annotations on the –2740 m contour are an area with abundant brooding octopuses.
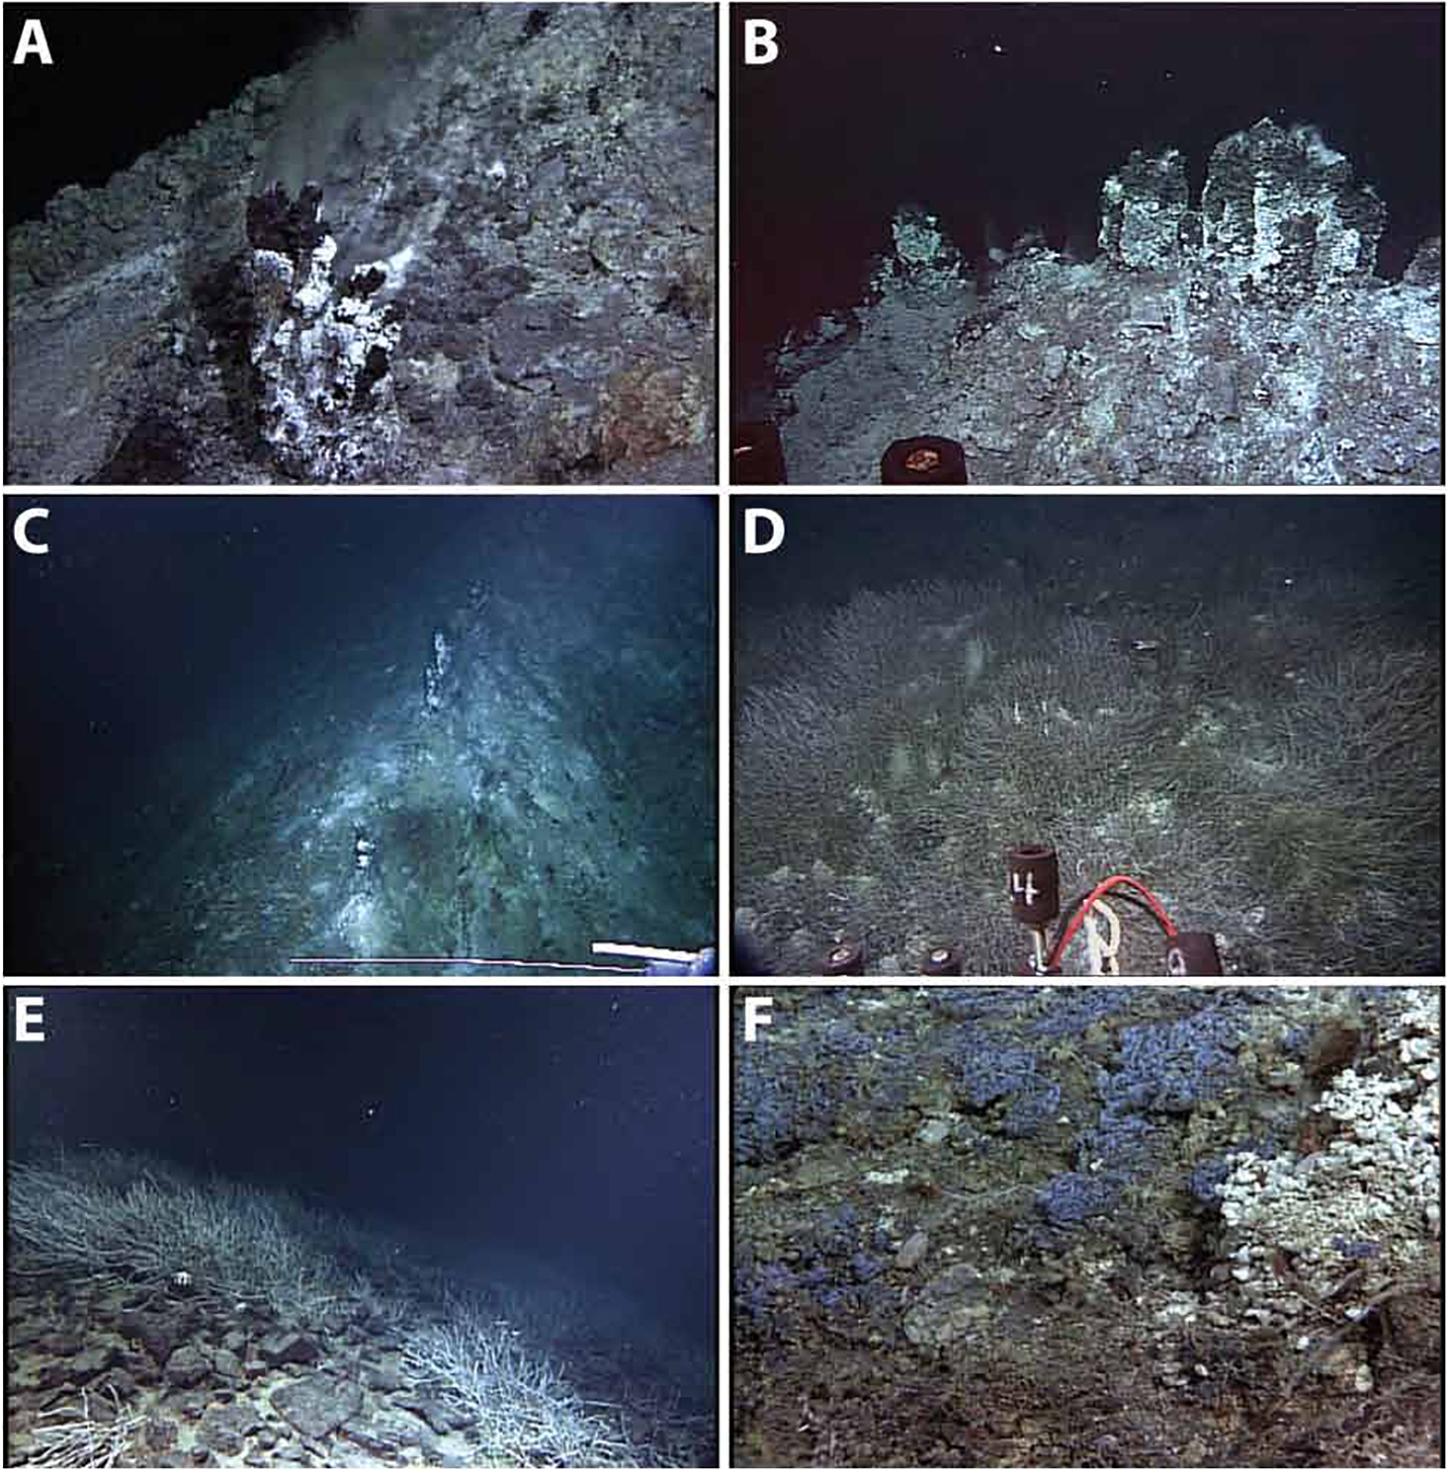
Figure 9. Video framegrabs of features at the Sea Cliff hydrothermal vent field. Images A, B, D, and F are ∼2–3 m across and images C and E are ∼5–10 m across. Locations are indicated on Figure 8. (A) Active anhydrite/saponite/amorphous silica chimney. Clear venting fluid is ∼305°C. Image taken at 2721 m depth at 42.754725°, –126.709302°. (B) Chimneys are aligned in an upslope-downslope array along crests of low ridges of collapsed chimney fragments. Image taken at –2718 m at 42.754501°, –126.709152°. (C) View looking upslope along the low-relief ridge of chimney debris with small chimneys along crest. Image taken at 2728 m depth at 42.754513°, –126.709544°. (D) Area with abundant Ridgeia piscesae tube worm clumps on hydrothermal crust over talus blocks. Image taken at 2700 m depth at 42.754406°, –126.709066°. (E) Scattered clumps of Ridgeia piscesae tube worms among talus blocks. Sediment partly buries the talus blocks. Image taken at 2694 m depth at 42.754844°, –126.708510°. (F) Mats of blue ciliate Eufolliculina caerulea (Pasulka et al., 2017) and white limpets Lepidodrilus fucensis on low-temperature hydrothermal crusts composed dominantly of amorphous silica, although barite-rich crusts are also present. Image taken at 2716 m depth at 42.754437°, –126.709246°.
Of the 11 ROV Tiburon dives at the Sea Cliff site, six in 2000 and 2002 suffered from poor navigation and four in 2004 did limited exploration beyond the immediate area of active venting. Observations from dive T884 in 2005 were therefore used to construct the new map of the vent field. Vent animal communities and vent locations observed during dives T685-T688 in 2004 are consistent with locations based on T884 observations, adding confidence to the location and extent of the vent field and its surrounding biologic footprint. The early dives collected fluids (Von Damm et al., 2006) from active vents located adjacent to markers deployed in the 2000 and 2002 dives. The vent field is centered at 2720 ± 10 m and the axial depth directly dowslope from the vent field ranges from 2983 to 3108 m, so Sea Cliff is ∼330 ± 60 m above the average depth of the axis. The location of the vent field is roughly 120 m south and 45 m east of the locations shown in Rona et al. (1990), which is remarkable considering that the three Sea Cliff submersible dives that discovered and explored the vent field in 1988 lacked GPS navigation and lost the transponder signals when it was near the bottom.
The volcanic axis, as defined in the previous section, is the eastern 2/3 of the axial graben (blue line on Figure 6B), and the vent field is ∼2.6 km east of the center of the volcanic axis. At a 5.5 cm/yr full spreading rate, the ocean crust under the vent field should be slightly less than 100 kyr old, as noted in Von Damm et al. (2006). The ridge-parallel fault immediately above Sea Cliff vent field has the largest throw of the many ridge-parallel faults on the east side of the volcanic axis (Figures 6B,C). Outcrops above the Sea Cliff site are volcanic breccia (Rona et al., 1990) and most of the vent field is among talus blocks and fragments of pillow lavas. It appears that the breccia is impermeable, except where isolated fractures occur. Small amounts of warm hydrothermal fluids seep through, as evidenced by the presence of abundant mollusks along the fractures. It is possible that the breccia prevents most of the fluids from migrating upslope in the subsurface. They then may rise to the surface in the Sea Cliff field.
The vent field (Figure 8) includes several rows of active anhydrite/amorphous silica/Mg-rich clay chimneys (Von Damm et al., 2006) oriented up-down slope (Figures 9A,B). These chimneys are perched atop low ridges (Figure 9C) of collapsed chimney debris, as the chimneys are fragile and collapse before they grow taller than a few m. The ridges and chimneys are noticeably devoid of vent fauna, but large areas more distant from the active high-temperature chimneys have broad, dense clumps of Ridgeia piscesae tube worms (Figure 9D). Even more distant from the active chimneys, Ridgeia piscesae become scattered clumps in fields of talus blocks (Figure 9E). The extent of the tube worm clumps is ∼140 m by ∼90 m, elongate parallel to the axis. The nearest vent fauna to the active chimneys are mats (Figure 9F) of blue ciliate Eufolliculina caerulea (Pasulka et al., 2017), and white limpets Lepidodrilus fucensis on hydrothermal crusts consisting mainly of amorphous silica and clays or of barite.
Nineteen samples of the hydrothermal chimneys and crusts were collected during the 11 ROV Tiburon dives in 2000, 2002, and 2005. Many of these samples are remarkably similar so only three representative samples were analyzed. These analyses of an inactive chimney, a silica-rich crust and a massive barite crust (Table 1) reflect the paucity of sulfides of Fe (0.58–1.48 wt%), Cu (0.15–0.26 wt%), Zn (0.19–2.58 wt%), and Pb (0.01–0.76 wt%). The samples contain 9.8–135 ppm Ag and 561–1310 ppb Au, with the barite crust having the highest Au and Ag. Anhydrite, which forms a major component of the active chimneys, has dissolved from the inactive chimney, leaving behind mainly amorphous silica as seen in the 81.3–84.7% SiO2 of the silica-rich crust and inactive chimney fragment as described by Zierenberg et al. (1995) and Von Damm et al. (2006). The chimney fragment with 2.94% MgO has more abundant Mg-rich clay than the silica crust with only 0.88% MgO.
Chondrite normalized REE (McDonough and Sun, 1995) from the collapsed chimney and silica crust (Figure 10 and Table 1) match the pattern of hydrothermal fluids, whereas REE concentrations of northern Gorda Ridge basalts (Davis et al., 2008), inferred source rocks for the Sea Cliff hydrothermal system, show relatively smooth REE patterns (Figure 10). REE are relatively immobile during hydrothermal alteration, so REE patterns are often used to infer protoliths for hydrothermally altered rocks, although extensively altered basalt hyaloclastites sometimes show light REE depletion and negative Eu anomaly due to selective loss of some of the REE to the altering hydrothermal fluid (Fowler and Zierenberg, 2015). Chondrite normalized REE concentrations from basalt-hosted seawater recharged hydrothermal fluids show enrichment of the light REE and a strong positive Eu anomaly (e.g., Klinkhammer et al., 1994; Mitra et al., 1994; Fowler et al., 2019). Hydrothermal precipitates in vein minerals inherit this pattern (Fowler and Zierenberg, 2015), as do the Sea Cliff deposits.
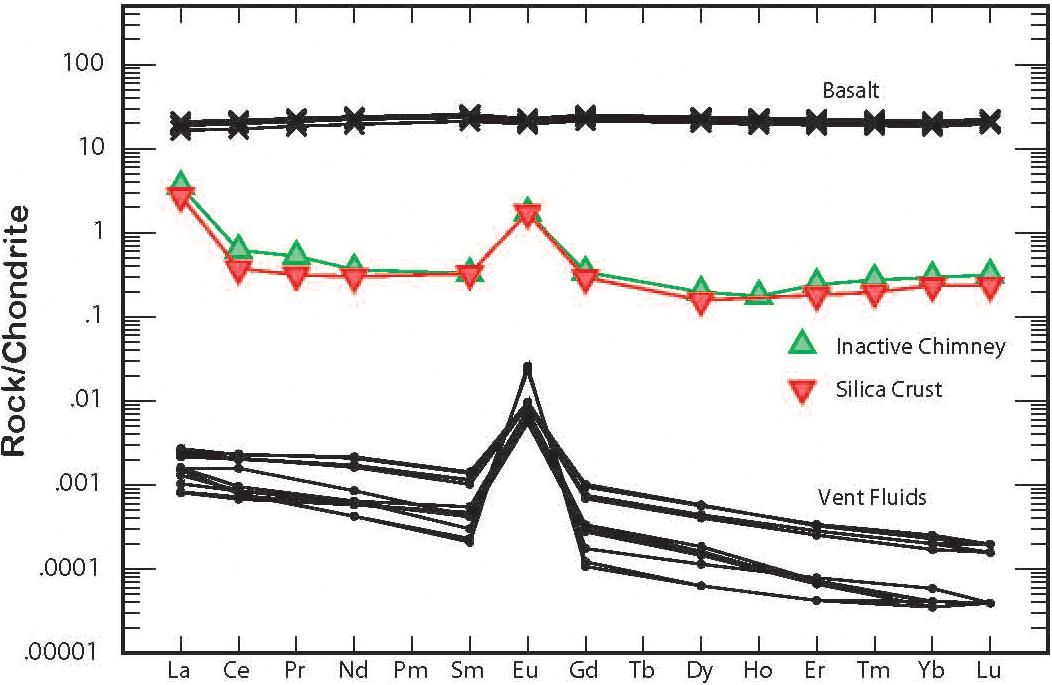
Figure 10. Chondrite-normalized rare earth patterns for Sea Cliff hydrothermal deposits (green and red symbols, from Table 1), hydrothermal fluids (black dots, from Fowler et al., 2019) and a range of patterns for North Gorda basalt samples (Xs, from Davis et al., 2008). The deposit samples mirror the fluid compositions in having positive Eu anomalies.
Hummocky Flows of Pillow Lava
The most abundant flow morphology on the northern Gorda Segment are hummocky flows of pillows that form mounds smaller than ∼200 m in diameter and usually < 100 m tall. The tallest are almost 150 m tall and the smallest are < 25 m across. Such hummocky flows are abundant within the axial graben and on the fault blocks mapped east and west of the axis, and the 1996 lava flows consist of three such mounds. Within the mapped 35 km2 area, there are hundreds of hummocky flows forming isolated mounds or chains of mounds. Many have faults and fissures cutting them, especially away from the axis. Some hummocky flows have some special attributes, described below.
Steep-Sided Hummocky Flows Surrounded by Talus
Talus like that observed at the base of steep-sided pillow mounds that comprise the 1996 flows is a common landform around most steep-sided mounds along the ridge axis. Talus covers 1.57 km2 of the 26.2 km2 of axial graben mapped by AUVs, or 6% by area. The extent of such deposits is illustrated in Figure 11 and contrasted with talus deposits along steep fault scarps. Calculations done in ArcGIS on the shapefiles of talus deposits indicate talus at the base of steep-sided cones and volcanic ridges comprises ∼4.6% of the axial graben floor and is far more common than talus along fault scarps, which covers just ∼0.8% of the axial valley (the remaining 0.6% could be either along faults or at the base of steep cones). Additional talus is produced along ridge-parallel faults off-axis, and small, rare, talus slopes may form due to faulting that cuts hummocky flows soon after their formation. As blocks are faulted during uplift outside the axial graben, fault-related talus increases. Lavacicles were not observed in any of these other talus deposits.
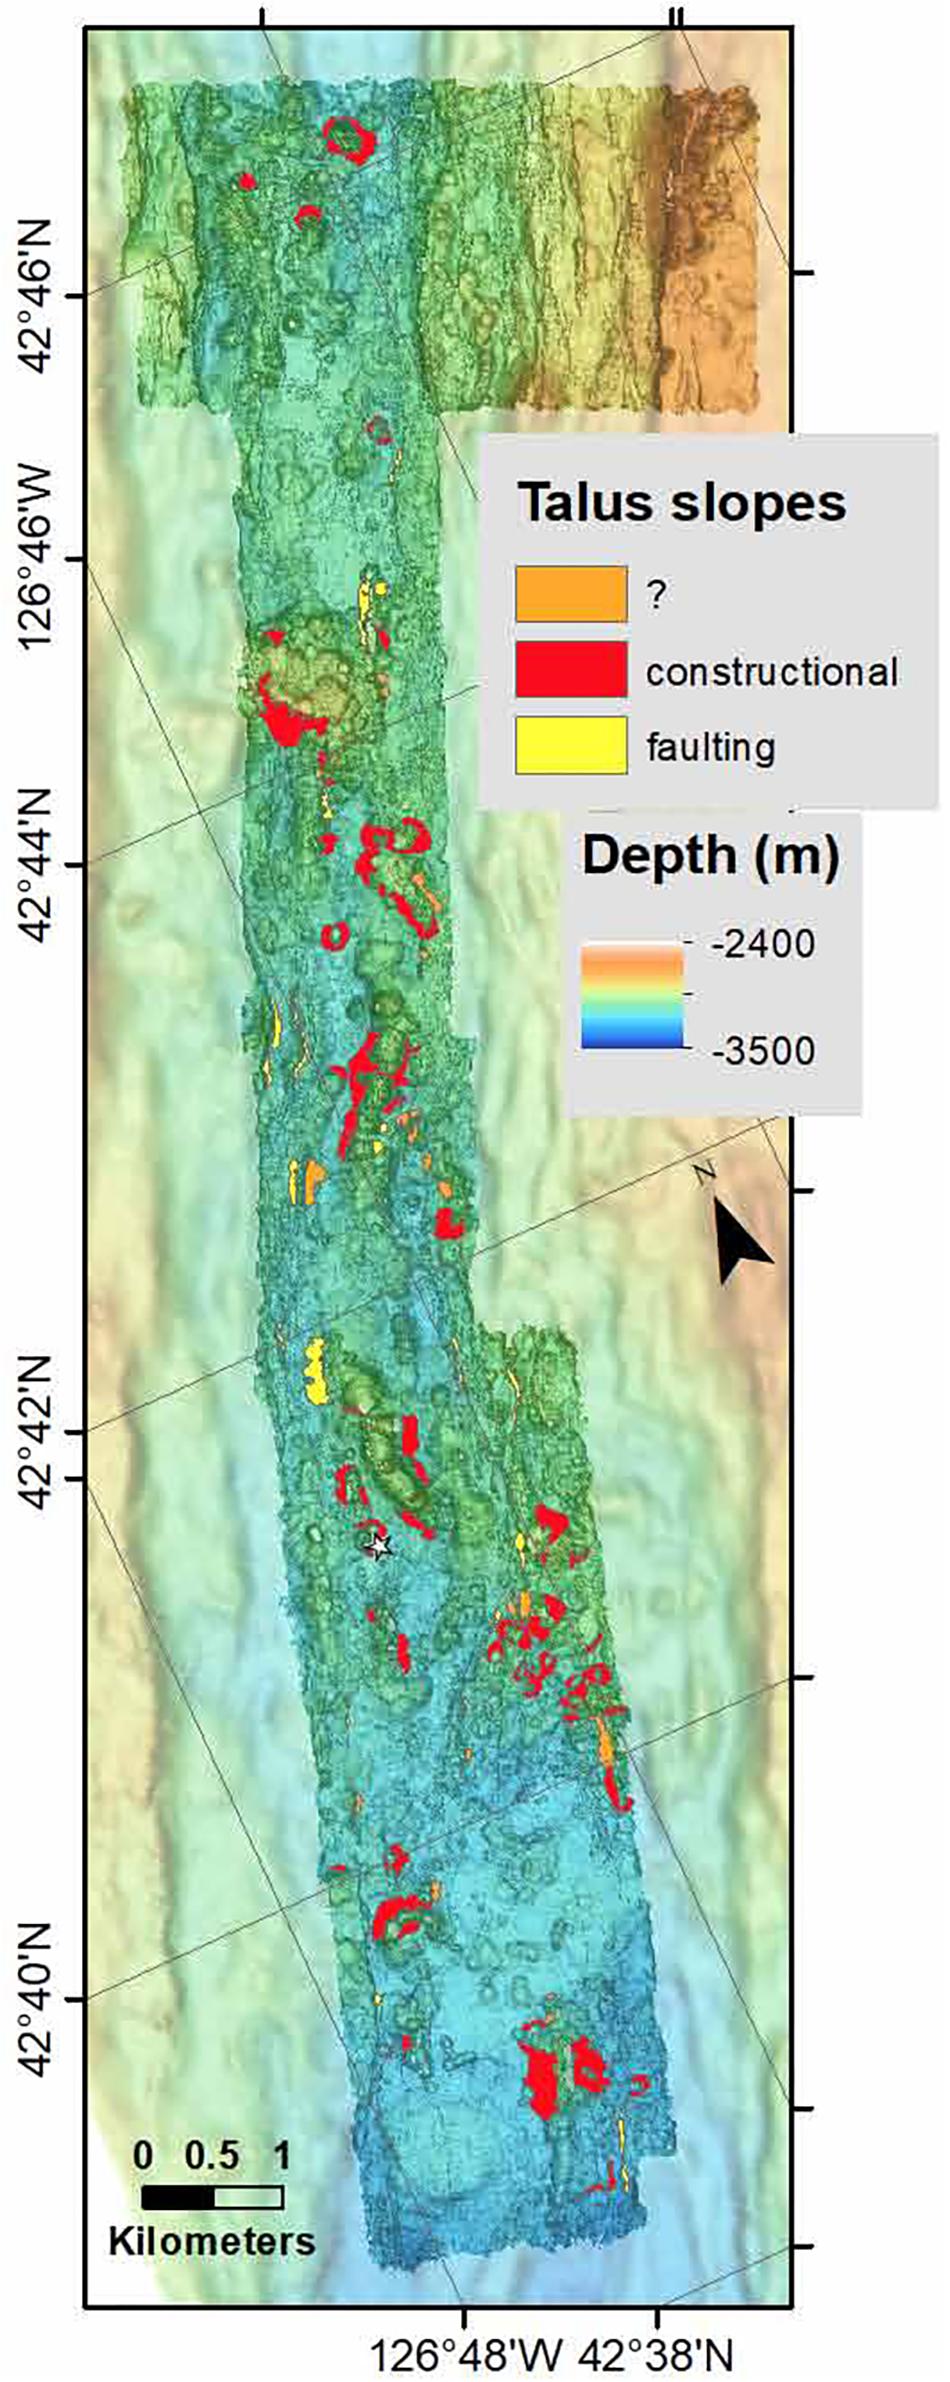
Figure 11. Map showing the distributions of syn-eruptive talus and talus along fault scarps in the axial graben. Talus around the 1996 flow contains lavacicle fragments formed during the eruption as lava cascaded over near-vertical scarps (location marked with white star). This constructional talus forms a sloping surface around the base of steep-sided hummocky flows and constitutes the majority of talus in the mapped area. Talus accumulated at the base of fault scarps is also shown, as are some talus deposits that could be either constructional or fault-related. Map is rotated 23°counterclockwise.
Hummocky Flows With Summit Collapses
In the entire AUV-mapped region there are just four hummocky flows (three 150–200 m across and one 100 m across) that have summit collapse pits. These are in a north-south row east of the southern part of the extensive ponded channelized flow described below (cc on Figure 12B). Hummocky flows with summit craters are common on Axial Seamount, including some that formed in 2015 (Clague et al., 2018b).
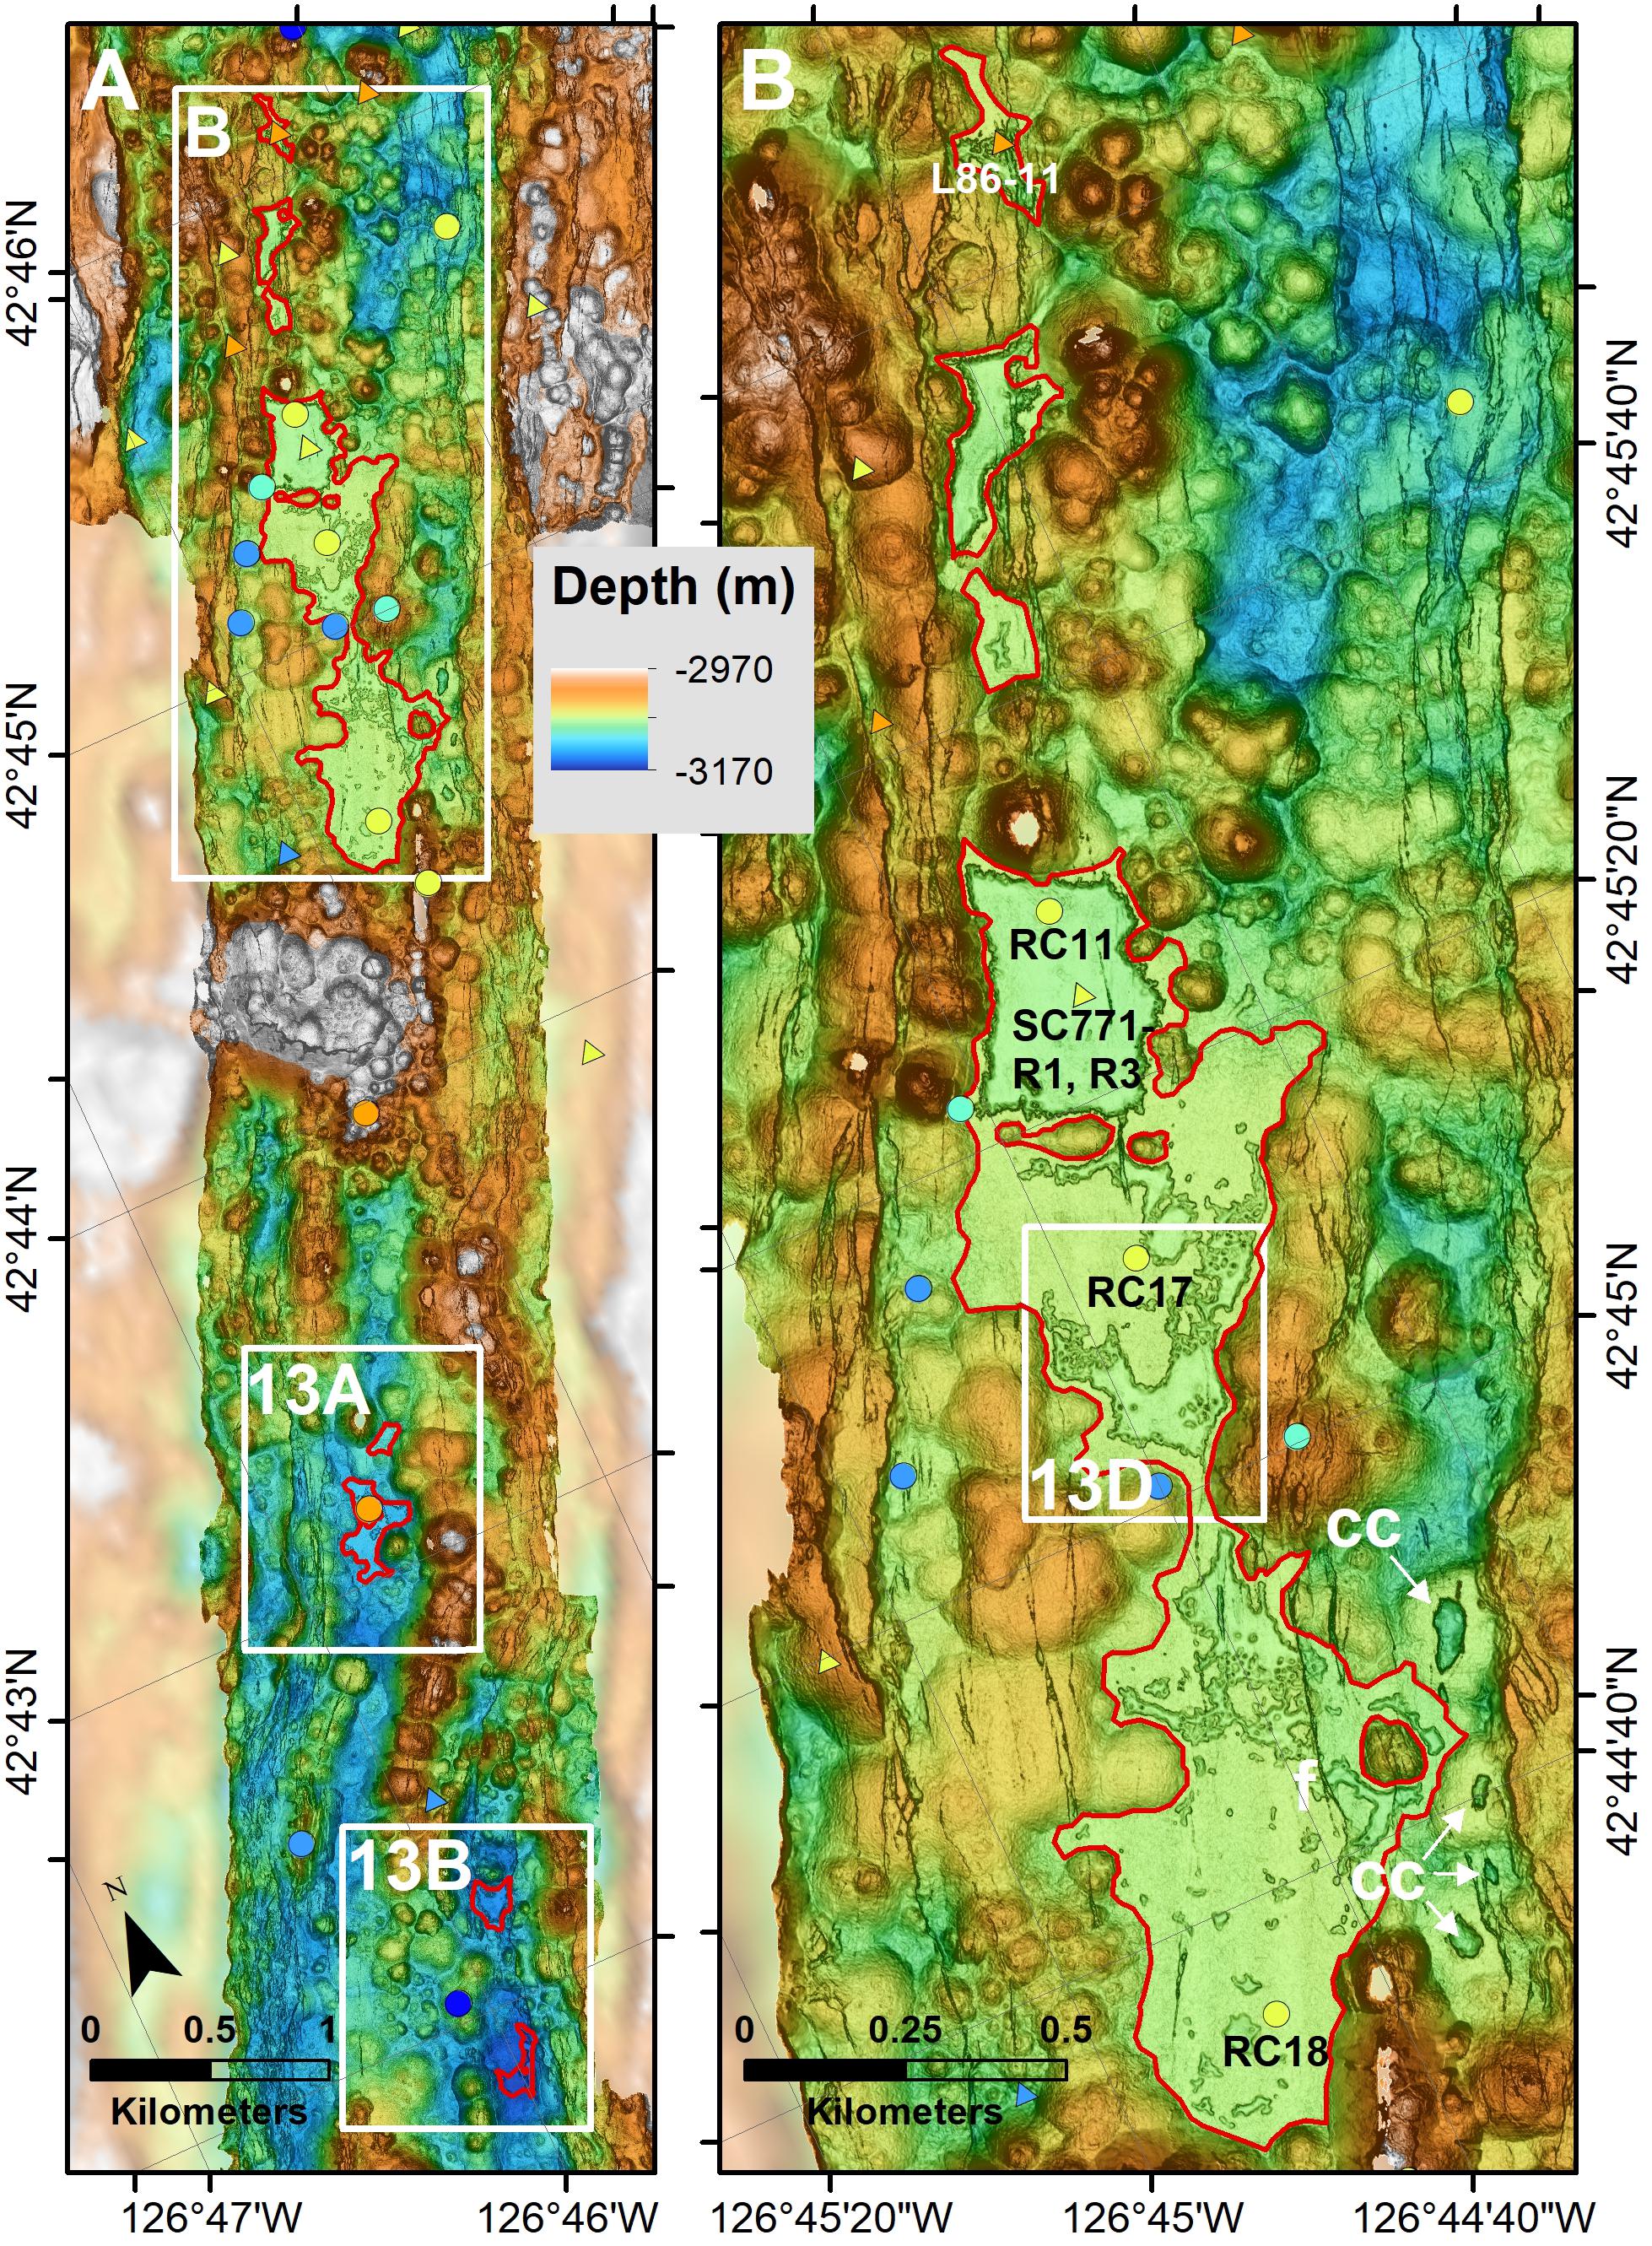
Figure 12. (A) Map showing the distribution of ponded channelized flows. At least three eruptions produced ponded channelized flows in the axis (outlined by red lines), each with two or more separate flows. The locations of Figures 12B, 13A,B are shown as white boxes. (B) The four northern flows were sampled twice during Sea Cliff dive 771 (Rona et al., 1990) and by three rock cores (Davis et al., 2008). The flows are younger than the older surrounding hummocky flows they ponded against, but are cut by a fault (f) and have thin sediment cover as observed during the Sea Cliff dive (Rona et al., 1990) and in several camera tows (Clague and Rona, 1990). Four inflated hummocky flows with summit craters (cc) are labeled. The location of Figure 13D is shown by the white box. Maps A and B are rotated counterclockwise 23°.
Ponded Channelized Flows
The AUV maps reveal channelized flows (Figures 12A,B) with ponded and drained sheet flow morphology as described based on AUV data in Clague et al. (2011, 2013, 2018a,b) and Chadwick et al. (2013, 2016). Such flows appear to be rare on the Gorda Ridge, with the only other known occurrences being the extensive flows at NESCA and SESCA in the Escanaba Trough (Ross and Zierenberg, 1994) that erupted through ring faults surrounding sills that uplifted sediment hills.
The ponded channelized flows on North Gorda cover 0.79 km2 of 26.2 km2 of the axis mapped by the AUVs or 3.0% of the axial graben. The four northern channelized flows on North Gorda may have formed during a single eruption, as their lake levels are similar (Figure 12B). They are relatively undisrupted by faults and fissures, although one fault, downthrown to the east by 2.7–9 m (greater offset to the north), cuts the eastern edge of the flows (f on Figure 12B). In addition, rare linear fissures cut through the ponded flows. The drained ponds are 3–11 m deep (dp on Figures 13C,D), and the shallowest one has numerous lava pillars near its margin (p on Figure 13D). The combined volume is < 0.06 km3, and much of that volume eventually drained out and the ponds collapsed, leaving the original lava lake surface as bath-tub rings against adjacent flows (ll in Figures 13C,D). The shapes of the bath-tub rings mirror the shapes of the mounds they ponded against, so relative ages can be established. The ponded flows are younger than almost all surrounding flows, except the southern-most flow (Figure 13C) where hummocky flows (hfy) over-rode the surface of the lava lake. Talus has predated and postdated the lakes (to and ty, respectively, on Figure 13D). Despite their relative youth, they are still older than several hundreds of years as deduced from observations of sediment cover and sessile animal abundance during Sea Cliff dive 771 in 1988 (Rona et al., 1990) and USGS camera tows collected in 1985–1986 (Figure 3.13 in Clague and Rona, 1990). In addition, a fault with vertical offset as great as 9 m cuts the largest flow (f on Figure 12B) and attests to its relative old age. The surface of this flow deepens by ∼7 m from north to south.
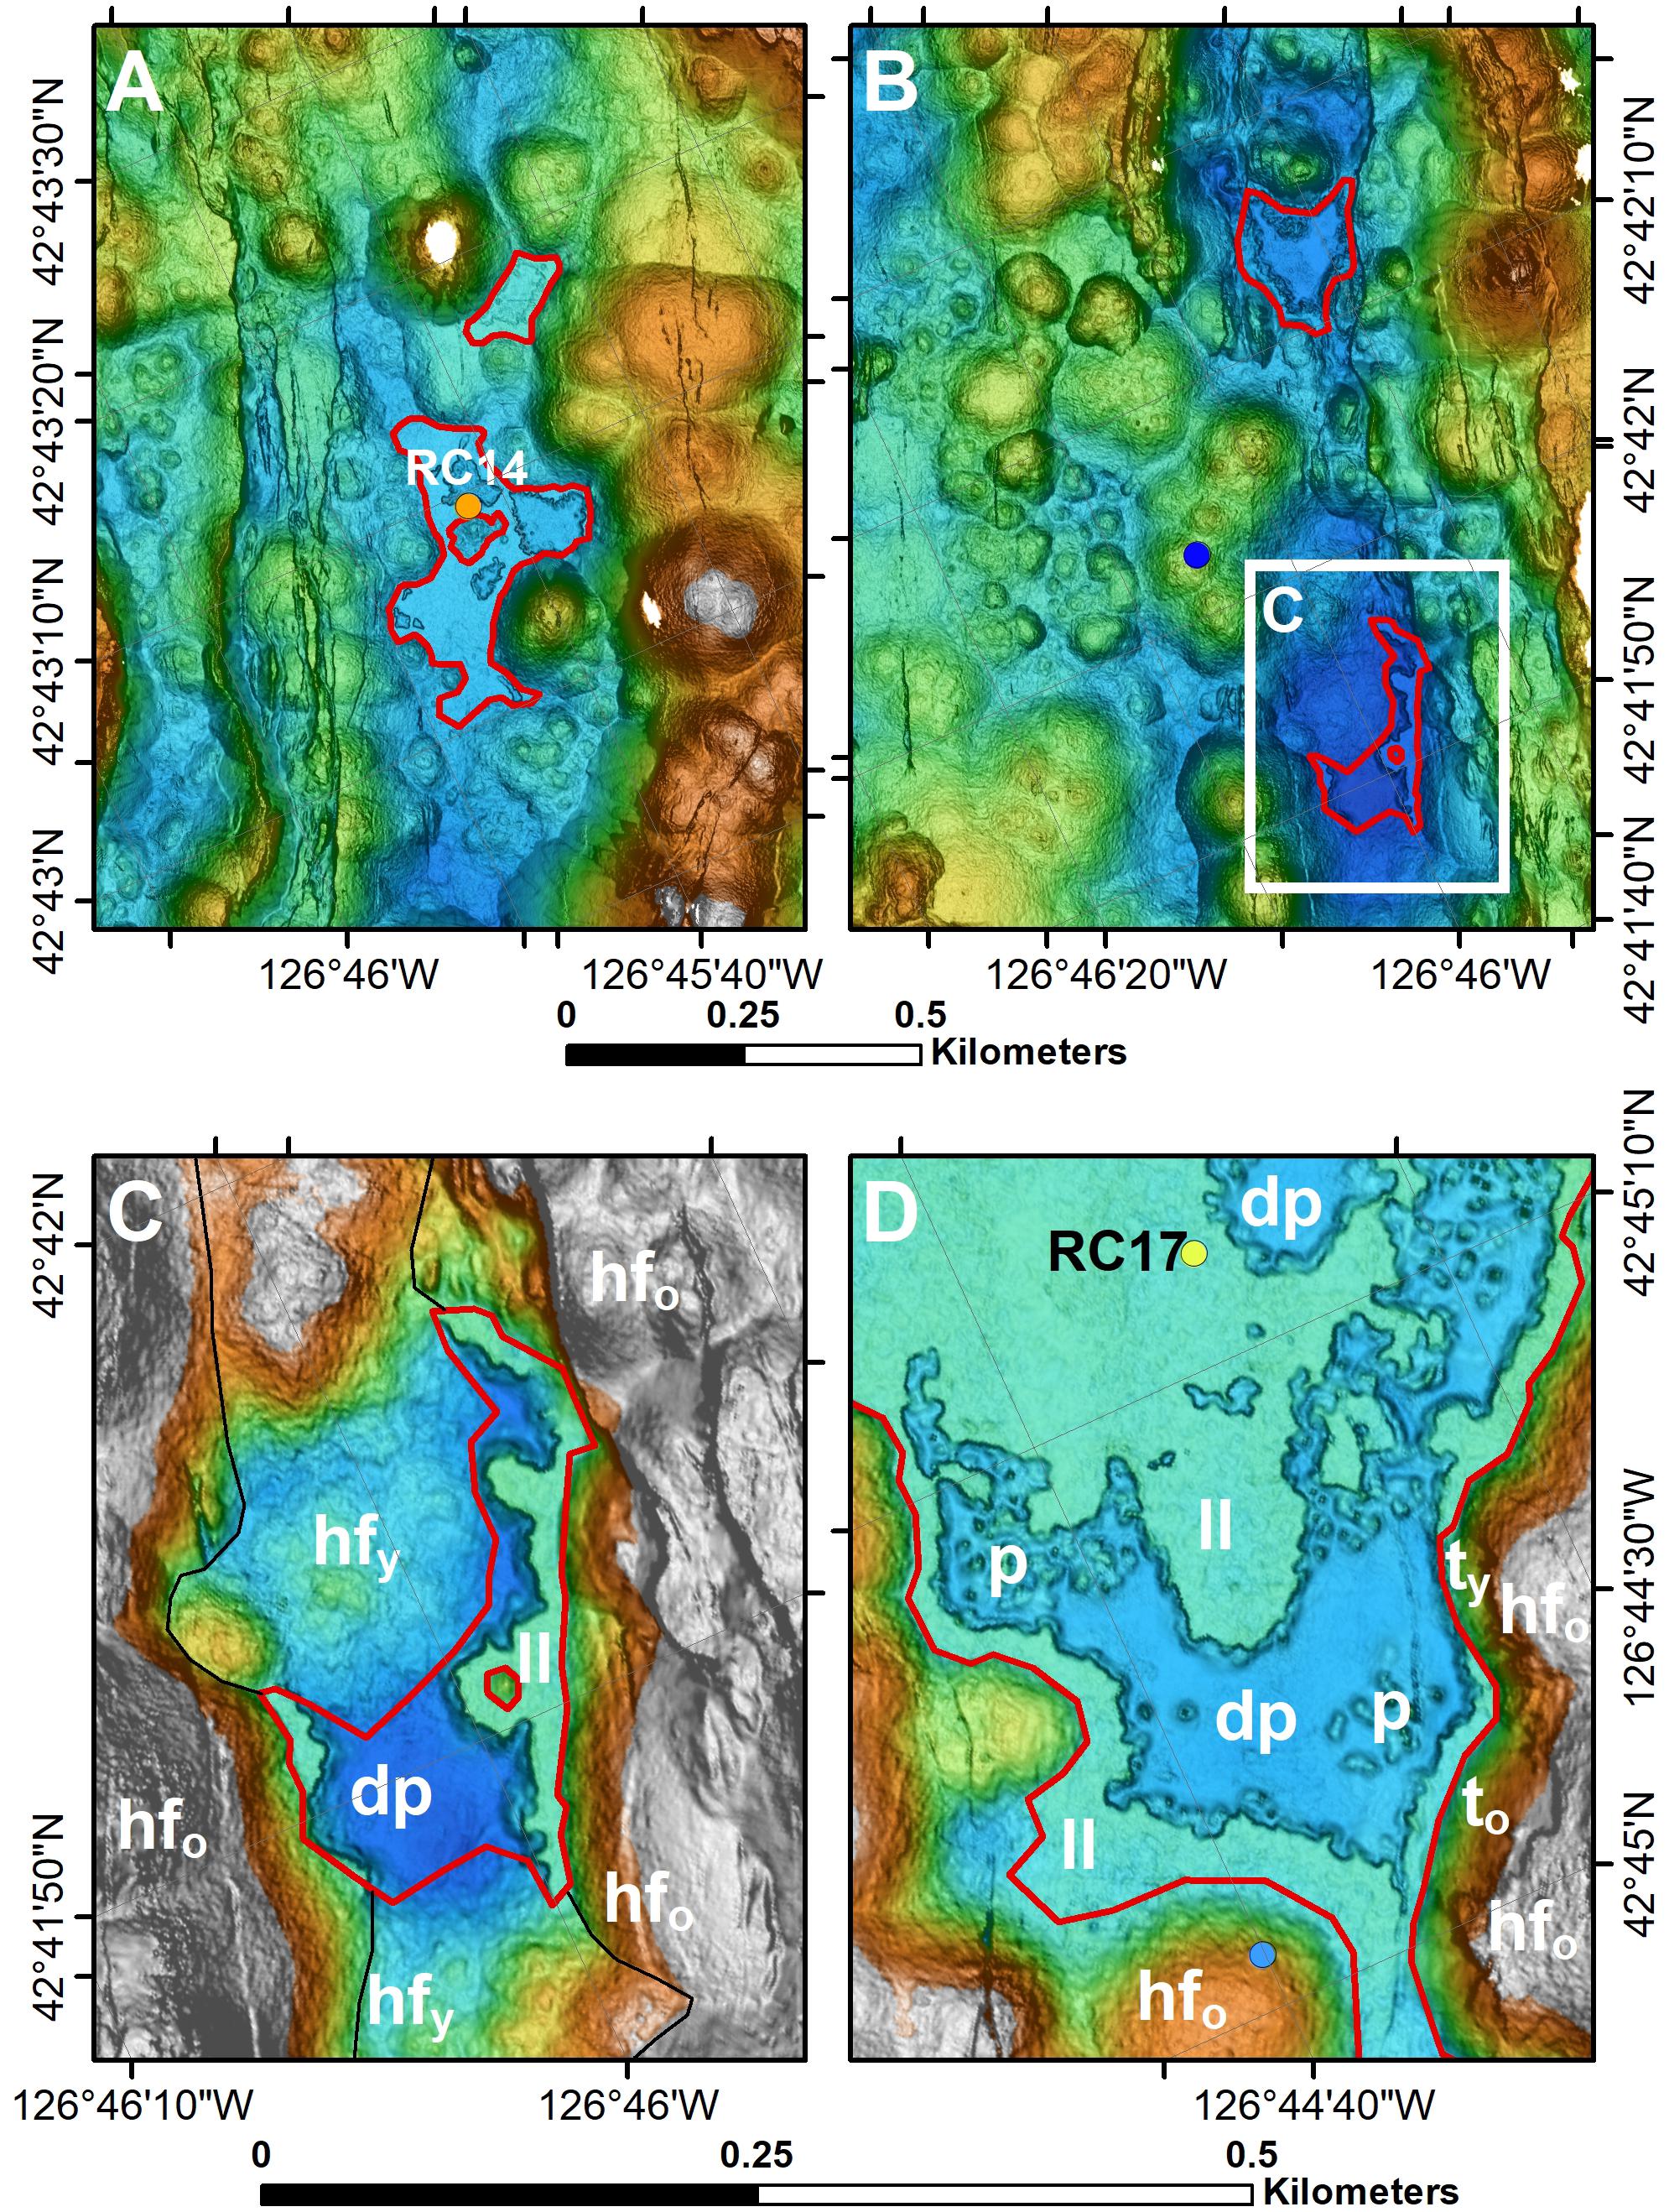
Figure 13. (A) The central two small flows ponded between older hummocky flows and are of unknown age. The sampled (RC14) southern one is chemically and mineralogically distinct from the northern flows in Figure 12B. (B) The southern flows also ponded between older hummocky flows. The location of the close-up view of this flow remnant shown in Figure 13C is indicated by the white box. Color ramp for A and B is blue = −3170 m and orange = −2970 m. (C) Small remnants of a ponded channelized flow that filled in between older hummocky flows (hfo) to east and west. The drained pond (dp) is partially filled in by younger hummocky flows (hfy) from both the north and south. The margins of the pond record the original lake level (ll). Color ramp is blue = –3165 m to orange = –3130 m, white is shallower than –3130 m. (D) Close-up view of the largest ponded channelized flow, showing the drained pond (dp) with lava pillars (p) near the margins, and the original lake level (ll) that formed as a levee adjacent to older hummocky flows (hfo). Talus emplaced prior to the pond on the flank of a hummocky flow (hfo) to the east is labeled to, whereas talus that fell later and covers a portion of the lava pond levee is labeled ty. Color ramp of blue = –3080 m to orange = –3040m. Maps A to D are all rotated counterclockwise 23°.
This largest flow (Figure 12B) was sampled as R1 and R3 during Sea Cliff dive 771 and by three wax-tip rock cores in 2000 (GR00-RC11, RC17, and RC18) using ship-based bathymetry to guide the core deployment. These five samples have statistically identical T-MORB compositions (Davis et al., 2008; Supplementary Table S1) with 8.42–8.46 wt% MgO and K2O/TiO2 of 0.12 to 0.13. The flow is sparsely plagioclase microphyric. The northern RC11 sample contains common, mostly round, vesicles compared to the other two samples which have only rare vesicles in the glass rinds. Dredge 86-11 (Davis and Clague, 1990) is located on the northernmost part of the flow, but the recovered fragments are pillow basalt and the chemistry does not match the southern samples of what are most likely flows from the same eruption.
Sample GR00-RC14 (Davis et al., 2008) is from the southern of two separate ponded channelized flows (Figure 13A). It is an aphyric T-MORB with common vesicles and has similar composition to the northern flow with 8.52% MgO and K2O/TiO2 of 0.11. RC14 is from a distinct flow that is slightly more primitive (Mg# = 100Mg/(Mg + 0.85Fe) = 67.7) compared to Mg#s = 66.6–67.4 for the more northern ponded channelized flow. The glass contains more abundant plagioclase compared to the 5 samples from the extensive ponded channelized flows to the north. The two remaining small areas of ponded channelized flows (Figure 13B) remain unsampled. The temporal relationships of flows are clear at this site with the ponded channelized flow occurring both before and after emplacement of hummocky flows of pillow lava. The ponded flow abuts older hummocky flows and left a bathtub ring along the contact (Figure 13D) and then younger hummocky flows filled most of the drained pond. All sampled ponded channelized flows and the one dredged flow (83-4 on Figure 2) that recovered lava fragments with sheet-flow morphology have MgO contents > 8.4%.
ROV video during dive T885 imaged a lobate flow with a collapsed channel just NW of the northernmost 1996 hummocky flow. The drained channel displayed a series of lava shelves formed as the channel drained. This drained lobate flow and the channel collapse are too small to identify in the AUV maps. However, it demonstrates that fluid channelized flows erupted over a larger region than identified from the AUV maps.
High-Volume Volcanic Structures
Almost all channelized and hummocky flows have volumes that are estimated at < 0.05 km3, like the 1996 flows. Several volcanic structures, however, are estimated to have volumes 3–5 times larger. These high-volume structures formed during long-duration moderate effusion-rate eruptions, not high enough rates to form channelized flows, but higher than eruptions forming steep hummocky flows. The high-volume constructs are located near the southern end of the mapped area, south of the 1996 lava flows (Figure 14A), within the axial graben. The southwestern one (Figure 14C) is similar to, but not as flat-topped nor as steep sided as, flat-topped volcanic cones (Clague et al., 2000) that are common on mid-ocean ridges and on the submarine flanks of Hawaiian volcanoes. This low flat-topped cone is ∼1.4 × 1.6 km in diameter at the base and the flat top is ∼800 by 950 m across. The cone is ∼ 90 m tall with a volume estimated at ∼0.24 km3, with large uncertainty because there was no pre-eruptive survey so the basal horizon is simply an average of the depths around the base. The summit contains a 5-m deep depression (Figure 14C). The cone is unsampled.
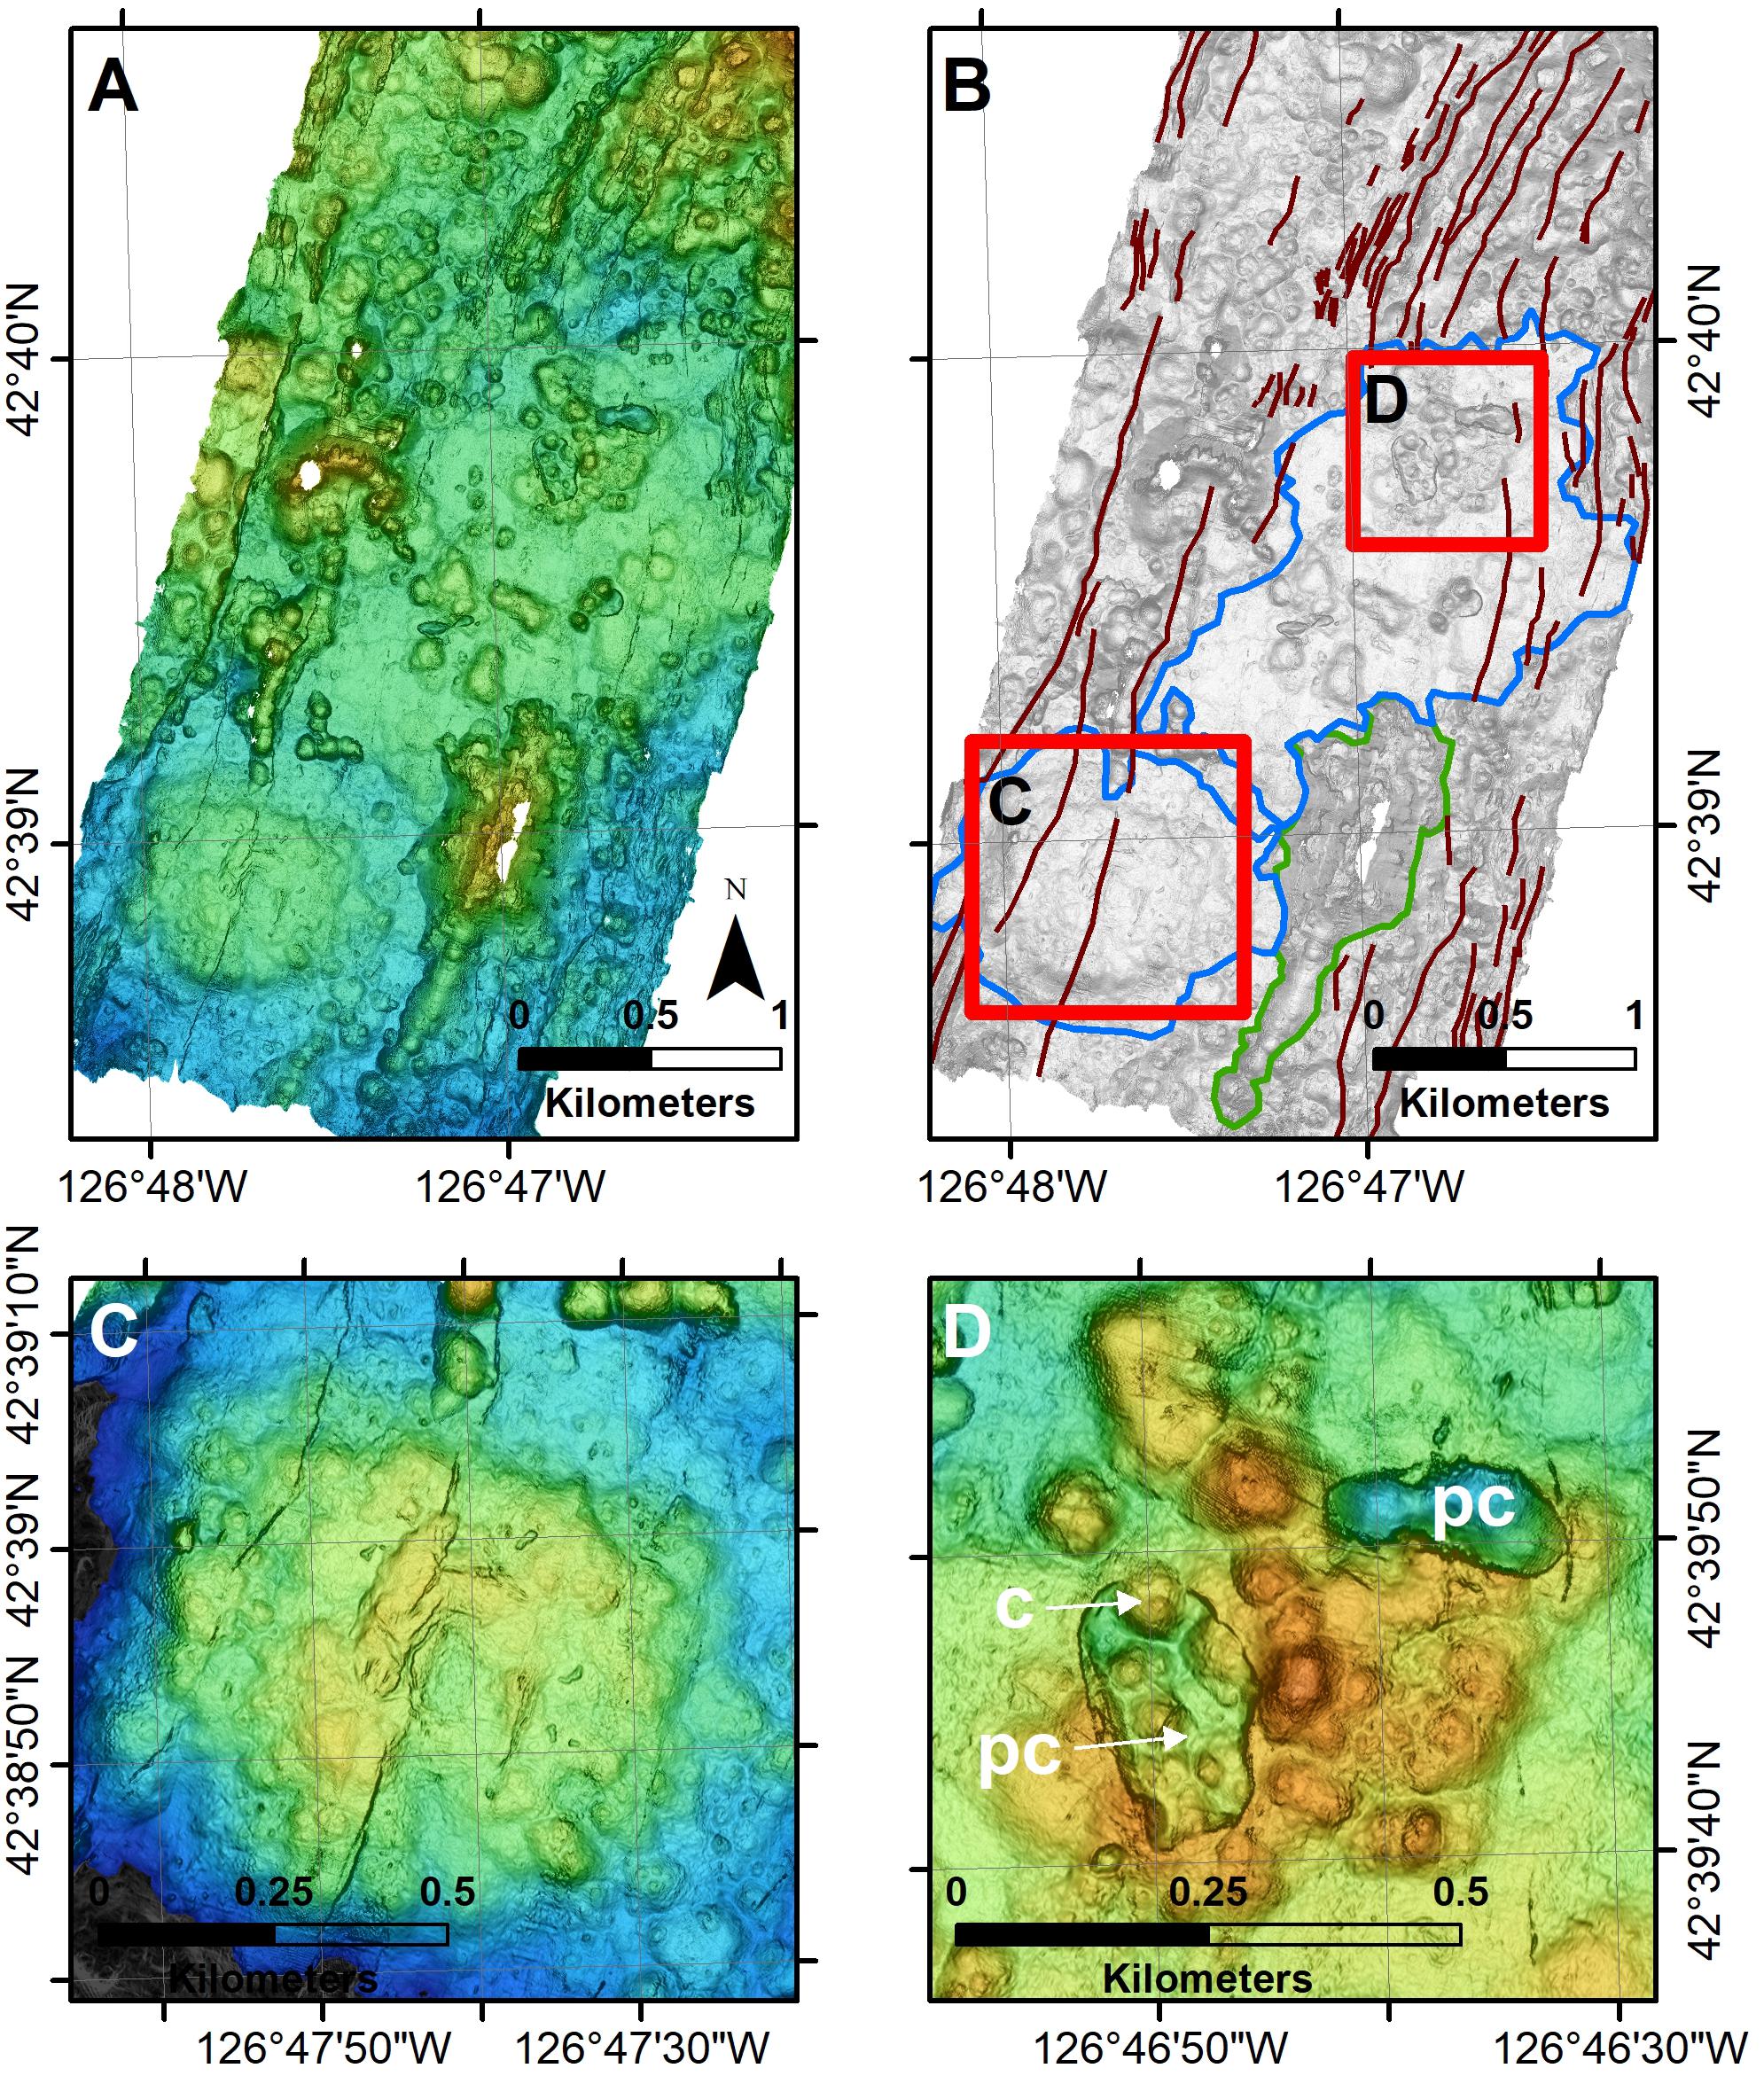
Figure 14. (A) Regional view of inflated hummocky flow, flat-topped cone, and large-volume elongate ridge at southern end of the surveyed area. Color ramp of blue = –3400 m to orange = –2800 m. (B) Same area with blue outlines of flat-topped cone (C) and inflated hummocky flow (D), and green outline of elongate ridge. Linework of faults showing that they bend eastward around northern inflated hummocky flow. The elongate ridge has abundant syneruptive talus on its lower slopes. Red boxes show the extents of maps in C and D. (C) Summit of flat-topped cone showing cross-cutting fissures, tumuli, channels and small drained lava ponds around a shallow central depression. (D) Close-up of two of seven pit craters on the complex inflated hummocky flow. The pit craters cross-cut some hummocky flow mounds, and younger hummocky flow mounds (north end of southwest crater) bury the ring fault bounding the crater. Both C and D have color ramp of blue = –3225 m to orange = –3075 m.
A second high-volume structure is an inflated hummocky flow (nomenclature from Clague et al., 2017; Figure 14D) ∼1500 m across and ∼100 m tall. It has a rough volume estimate of 0.18 km3. This structure is an amalgamation of numerous hummocky pillow flows. It is unusual in that the central part has seven irregular pit crater-like collapses (with the two largest shown in Figure 14D). The pits range from 15 m across and 7 m deep to 270 × 150 m across with near-vertical walls up to 54 m tall. The wall of one crater is partly buried by a subsequent small pillow mound (labeled c on Figure 14D) that is similar in size to numerous other mounds that decorate the surface of the inflated hummocky flow that is also cut by numerous narrow and discontinuous fissures. A single wax-tipped rock core sample (GR00-RC08) of T-MORB collected near its center contains 7.82% MgO and has K2O/TiO2 = 0.109.
A third voluminous structure is an elongate volcanic ridge (green outline in Figure 14B) that is oriented parallel to the axis and is surrounded by abundant talus (see Figure 11). It is located south of the inflated hummocky flow and east of the flat-topped cone. This ridge has a similar estimated volume of 0.25 km3 but formed during a different style of long-duration low-effusion rate eruption, similar to the 1996 hummocky flows. It was sampled by a wax-tip rock core GR00RC7 that recovered glass chips with three distinct compositions, making it uncertain which, if any, represents the underlying ridge and which are pyroclastic glass shards deposited on top of the cone (Clague et al., 2003, 2009). Four chips of each of the two more MgO-rich composition were analyzed, and two of the lowest MgO composition (Supplementary Table S1). Neither of the more-MgO rich compositions (GR00-RC7a and 7c) match analyses of other samples recovered from the area, whereas GR00-RC7b is similar to a number of analyses of sediment and glass suction samples from dives T885 and T886 on and around the 1996 flows. It is likely that the ridge is built of MORB on the boundary between N- and T-MORB with 8.38% MgO or T-MORB with 8.78% MgO.
A fourth voluminous structure, mapped using a ship-based EM300 (MBARI Mapping Team, 2001) and EM302 (Ocean Exploration Trust cruise NA108) multibeams, is a flat-topped cone at the southern end of dive T187 (Supplementary Figure S1). It is ∼1.4 × 1.2 km in diameter at the base and the flat top is ∼700 by 900 m across. The cone is ∼180 m tall (250 m maximum), covers 1.89 km2, and has a rough volume of 0.23 km3. Dive T187 recovered six N-MORB samples from the north side of the cone with MgO = 8.5–8.78% and K2O/TiO2 = 0.082 to 0.092.
Discussion
The 1996 Eruption and Lava Flows
The 1996 eruption produced three hummocky flows with a volume of just 0.007 km3 spread along eruption fissures that extended 1.3 km with gaps of 0.3 and 0.8 km between the three hummocks (Yeo et al., 2013). The hypothesized southern flow located five km south of the southern of the three confirmed 1996 hummocks (Supplementary Figure S1; Chadwick et al., 1998) was not a young flow. The seismic activity associated with the eruption lasted for 523 h starting on February 28, 1996 (Fox and Dziak, 1998), so the eruption rate, assuming the seismic activity marks the start and end of activity, is ∼13,000 m3/hr (Yeo et al., 2013) distributed along ∼1.3 km of eruptive fissure (Figure 3). The eruption rate is therefore just 10 m3hr–1m–1 of active fissure, so at the low end of the range explored by Gregg and Fink (1995), and consistent with the morphology of the flows. If the eruption either started after the seismic swarm or ended before the swarm ended, then the rate would increase.
One result of such a slow eruption rate is that the hummocky flows are extremely steep-sided pillow mounds, shaped like haystacks. The mounds were so steep that advancing pillow flows broke off to form talus blocks of pillow fragments. As the top of the mound grew upwards, lava poured over the margin of the mound and cascaded vertically down to the talus slope below forming lavacicles, first observed here. They form in a manner analogous to lava stream “firehose” flow from truncated tubes at ocean-entries observed on Kilauea Volcano during the Pu’u O’o eruption (Hawaiian Volcano Observatory, 2017). The lava was rapidly quenched in the cold bottom seawater, but many lavacicles were still plastic when they landed as one end is commonly bent (Figure 4F). The lavacicles are an extreme form of “elephant trunk” lava morphology and more elongate than those reported from the 2011 Axial south rift pillow ridge (Clague et al., 2018b). Their significance is that they demonstrate that the talus at the base of the steep scarps around hummocky flows formed during the eruption that formed the hummocky flows.
The 1996 flows are geochemically heterogeneous N-MORB (Figure 5) with MgO content from ∼7.8 to 8.6%, Na2O content from ∼2.7 to 2.95%, and K2O/TiO2 from ∼0.07 to 0.09, but overlap in composition with other prior lava flows erupted in the same portion of the North Gorda segment (Davis et al., 2008), although they are at the high end of the range for Na2O. Rubin et al. (1998, 2001) calculated that the 12 samples had a Homogeneity Index (HI) of 2.06, roughly twice the variability expected from analytical uncertainty alone and on trend for the spreading rate at North Gorda. A HI for the combined 27 samples cannot be readily calculated since the analyses were done in different laboratories that have different analytical uncertainties, but the similar standard deviations of the different data sets (Supplementary Table S1) suggest that the 1996 flows are moderately heterogeneous. The significant new finding is that lavas with nearly identical compositions erupted previously in the same areas as the 1996 flows. Eruption of such similar lavas in the same location makes it even more important to sample new lava flows within a matter of years, as composition alone, even distinctive compositions like that of the 1996 flows, will not distinguish them from earlier flows.
Variations Along Axis in the Axial Graben
The petrogenesis of the lavas along the North Gorda Segment was described in Davis et al. (2008). MORB recovered from the neovolcanic zone are variable compared to other NE Pacific ridge segments ranging from near-primary melts with Mg# (100Mg/(0.85Fe + Mg) of 68 (8.8% MgO) to melts that have Mg# as low as 57 (MgO as low as 6.9%). Endeavor Segment lavas are even more variable in degree of fractionation and enrichment (Gill et al., 2016), The North Gorda magmas underwent between ∼4% and ∼40–45% crystal fractionation, based on simple enrichment factors of incompatible elements. Likewise, the lavas range in K2O/TiO2 from 0.06 to 0.15 and so from N-MORB to T-MORB. There are no obvious trends in either MgO content or K2O/TiO2 along the axis away from the shallowest point along the segment at about 42.75°N. The only trend in MgO is that the lavas from the southern part of the segment (near 42.6°N) are lacking samples that are more fractionated (none with < 7.9% MgO). On the other hand, Na2O contents vary with the southernmost lavas having lower Na2O than those closer to the shallowest part of the segment at 42.75°N. The higher, but variable, Na2O contents of the lavas from the shallowest point along the axis indicate that these magmas are derived from a deeper depth range (Klein and Langmuir, 1987). The high variability in compositions on small spatial scales is consistent with, but does not require, a lack of mixing between small chemically distinct magma batches (e.g., Bohrson et al., 2014). The heterogeneity of magmas along the axis is in turn consistent with absence of a crustal axial magma lens and the magma-starved deep-axial-valley morphology of the Gorda Ridge (e.g., Buck et al., 2005) discussed in a later section.
The Cross-Section to the East of the Axis
As expected, but rarely demonstrated, the fault blocks have thicker sediment cover away from the axis. Sediment thickness (as indicated by bottom smoothness in the multibeam bathymetry, sub-bottom seismic lines, and direct observations) appears to increase in steps defined by wide fault blocks (Be, Ce, De, Ee, and Fe on Figure 6). The 230Th/238U disequilibrium ages (Goldstein et al., 1991) increase in age with increasing distance from the center of the axis, although sample 85-7 at 51 kyr (from the inner part of block Ee) is half that expected from the spreading rate and distance to the axis. Even if the flows erupted along the eastern margin of an axial block the same width as block A (Figure 6C), this flow is still too young by ∼35 ka. The area has not been directly observed, but the steep hummocky flows also have less sediment than the southwestern part of the same fault block (Supplementary Figure S2A). This may be a site of off-axis volcanism, as documented elsewhere along the MOR (e.g., Reynolds and Langmuir, 2000). However, the volcanic activity, if it occurred off-axis, still took place 51 ± 12 ka ago (Goldstein et al., 1991) and is therefore not the current source of heat driving the off-axis hydrothermal activity at the Sea Cliff site.
The Sea Cliff hydrothermal site is located on the off-axis fault with the largest throw. The site is not located at the intersection of two cross-cutting fault systems as originally proposed by Rona and Clague (1989) and Rona et al. (1990). The same geological setting was also proposed for the TAG hydrothermal field on the MAR (Rona, 1988; Karson and Rona, 1990), but the concept of cross-cutting faults localizing fluid flow has also been supplanted there (Canales et al., 2007) who proposed the heat is derived from hot mantle rocks that underlie a low-angle fault (Canales et al., 2007). Such a mechanism does not seem feasible for the Sea Cliff site where such low-angle faults are not evident. At Sea Cliff, the hydrothermal fluids are apparently heated beneath the ridge axis and flow upward along the off-axis normal fault with the largest throw, which may also have the deepest crustal penetration. This large-offset normal fault also produced volcanic breccia (Rona et al., 1990).
The increasing thickness of sediment cover off-axis that we have documented at North Gorda segment may also seal the crust on these older off-axis fault blocks, forcing fluid flow along the faults. The sediment also buries and subdues the fine-scale topography of volcanic features in this high-sediment-rate region (∼5–6 cm/kyr) and crust as young as perhaps 50 kyr has 2–3 m of sediment, which may be enough to seal the crust.
Abundances of Different Lava Morphologies on the Intermediate-Rate North Gorda Segment
The North Gorda Segment is characterized by abundant small-volume hummocky flows. Many hummocky flow mounds can be produced during single eruptions, as occurred during the 1996 North Gorda eruption, which produced 29 pillow mounds that coalesced into just three larger composite mounds (Yeo et al., 2013). A more extreme example is the 1986 eruption on the North Cleft Segment of the Juan de Fuca Ridge which produced 130 mounds, coalesced into 17 ridges and composite mounds (Yeo et al., 2013). To determine which mounds are part of each eruption most likely requires sampling each mound and hoping that each eruption has a distinct composition or compositional range. Mapping historical flows soon after they erupt is the only feasible way to determine which mounds formed during single eruptions, and therefore the volume of lava erupted and the eruptive fissure length, so that eruption rates can be estimated.
The axial graben of the North Gorda Segment consists of 91% hummocky flows including a high-volume inflated hummocky flow, large elongate ridge and a flat-topped cone; 3% channelized flows that are ponded between hummocky flows; and 6% talus, with most talus formed during eruptions that formed the hummocky flows. Of the roughly 96% of the surface produced during low-rate eruptions that produce these hummocky flows, all but three eruptions were brief and produced small-volume hummocky flows comprised of pillow lava. The three largest-volume eruptions (Figure 14) each produced hummocky flows that had volumes estimated at 0.18 to 0.25 km3, but make up only 1% of the area mapped. These larger-volume eruptions occurred distal from the shallowest point on the axis. The highest eruption rate flows, the channelized flows, occurred within 5 km of the shallowest point along the segment. The largest of the channelized flows (Figure 12B) erupted < 0.06 km3, but a large portion drained back down either the eruptive fissures or older open fissures when the eruption ended, leaving areas of drained ponds (dp on Figures 12E,F) that are surrounded by hummocky flow mounds. There are also rare hummocky flows that erupted more rapidly than most hummocky flows and therefore maintained molten cores, as described for flows from the 2015 eruption at Axial Seamount (Clague et al., 2017). Such flows are rare on North Gorda, with just four small hummocks with summit craters, the flat-topped cone with channels on the summit (Figure 14C), and the low inflated hummocky flow with seven pit craters (Figures 13B,D). The vast majority of North Gorda hummocky flows show no evidence of having had molten cores and are inferred to have erupted at low rates or, for the steeper mounds, at very low rates.
The large-volume volcanic edifices exert structural control on the locations of faults and fissures in the axial graben. These faults and fissures bend around the eastern inflated hummocky flow with the 7 pit craters (Figure 14B) suggesting that such volcanic units form thick, coherent material that is not easily fractured during extension events, such that the faults bend to capitalize on less rigid adjacent crust.
Channelized flows, inferred from their morphology to have erupted at high rates (Griffiths and Fink, 1992; Gregg et al., 1996), are rare and geochemically within the range of melt MgO contents and crystal contents of that of the hummocky flows, including those erupted in 1996. Since viscosity in low-volatile MORBs is largely determined from melt temperature and crystal content (Shaw, 1972), their rapid eruption rates are not caused by their having lower viscosities than the hummocky flows. Their high eruption rates are therefore caused by either wider dikes or more buoyant magma (Head et al., 1996), presumably caused by higher bubble abundances. Higher bubble contents are associated with the sections of fissure that had the highest eruption rates during the 2011 eruption of channelized flows on Axial Seamount (Jones et al., 2018) and one of the samples of the ponded channelized flows on North Gorda also has abundant vesicles. This difference may have contributed to more rapid eruption of the channelized flows, but we suspect that the width of the feeder dike is the primary control on eruption rate since that rate per m of eruptive fissure increases by a factor of 1000 as a dike widens from 0.2 to 2.2 m (Table 1 in Head et al., 1996). A wider dike with higher eruption rate could occur when eruptions are less frequent, whereas a narrower dike with lower eruption rate would be consistent with more frequent eruptions. The change in frequency of eruptions does not need to vary by large amounts to result in large differences in dike width and eruption rates since eruption rate per m of fissure varies as the cube of dike width but linearly with changes in viscosity (equation 2 in Head et al., 1996).
Changes in the Sea Cliff Hydrothermal Field
Data on the vent fluid chlorinity collected in 2000, 2002, and 2004 showed a slight increase with time, but the magnitude of the increase was small enough to be within the error of individual measurements, and Von Damm et al. (2006) concluded that the fluid composition was stable over the 4-year period. A linear regression of the Von Damm et al. (2006) data indicates, however, increasing salinity with time with an r2 value of 0.71. Extrapolating this fit to the data predicts that the chlorinity of the vent fluid will have increased from an average 454 ± 2 mmol/kg Cl in 2000 to slightly > 500 mmol/kg Cl by mid-2019 and to seawater values by ∼2040. Resampling of the vents to determine fluid composition changes can test this extrapolation.
Seafloor markers were deployed where hydrothermal fluids were sampled (Von Damm et al., 2006). Comparison of photos that include the markers show that some chimneys became inactive and collapsed during the 5 years of observation and that the most active venting shifted with time.
Samples of hydrothermal crusts from the vent field collected in 1988 consisted mostly of highly altered and silicified hyaloclastite breccia (Zierenberg et al., 1995). Samples of active chimneys collected on later expeditions showed that the chimneys are dominantly composed of anhydrite with less abundant Mg-saponite, amorphous silica and minor pyrite, chalcopyrite and sphalerite (Von Damm et al., 2006). As the chimneys collapse, anhydrite is selectively dissolved, but evidence of its former presence is often preserved due to overgrowth and/or pseudomorphic replacement of the anhydrite by amorphous silica and saponite, as observed in sample T186-R3. This process of repeated chimney growth, collapse, and dissolution forms the low ridges that host the active vents (Figure 9C). Continued diffuse flow of hydrothermal fluid through the collapsed chimney rubble, coupled with conductive cooling, leads to further precipitation of amorphous silica forming hydrothermal silica crusts with a clastic texture that appear similar to the highly altered hyaloclastite crusts (i.e., T186-R2).
Zierenberg et al. (1995), used relatively immobile trace elements to establish the basaltic parentage of the silicified hyaloclastites. The relatively immobile rare earth elements (REE) demonstrate that much of the material in the vent field is a residual product of hydrothermal chimney collapse (Figure 10), i.e., the material formed mostly by hydrothermal precipitation, not leaching and silicification of volcaniclastites.
The North Gorda Segment Compared With Other Pacific Intermediate-Rate Ridges
The volcanic terrain along the axial zone consists mainly of hummocky flows with only rare channelized flows. Axial volcanic ridges characteristic of the slow-spreading MAR (e.g., Yeo and Searle, 2013) are absent in the axial graben, although one similar ridge occurs off-axis immediately upslope from the Sea Cliff hydrothermal site. Parameters such as axial graben width and depth at the segment center, eruption rates that produce different volcanic landforms, volumes of eruptions, and homogeneity or heterogeneity of lava compositions (as measured by Mg#, K2O/TiO2, or trace element ratios such as La/Sm) in the axis vary among the limited number of mapped and sampled Pacific intermediate-rate spreading centers (Table 2). In almost all of these parameters, the North Gorda segment is an end-member among intermediate-rate ridges in the Pacific. For example, the North Gorda axial graben at the shallowest point near the center of the segment is ∼18 km wide and ∼700 m deep, compared to 3.2 km wide and 100 m deep on the Cleft segment (Stakes et al., 2006), > 2 km wide and ∼200 m deep at the low-magma supply portion of the Galapagos Spreading Center at −94°50′ longitude (Colman et al., 2012), and ∼1 km wide and 200 m deep on the Endeavor segment (Clague et al., 2014). Axial highs are found on the Alarcon Rise (Clague et al., 2018a), the high-magma-supply portion of the Galapagos Spreading Center at −91°55′ to −92° longitude (Colman et al., 2012), and the older flanks of the Endeavor (Clague et al., 2014) and North Gorda (Figure 1) segments. The intermediate-rate ridges with a high-magma supply portion are cut by a narrow axial cleft, that at Galapagos is 10–40 m deep, on the Cleft segment is 30–90 m wide and 10–15 m deep (Stakes et al., 2006), and at Alarcon Rise is an en echelon fissure system ∼9 km long (Clague et al., 2018a). For comparison, the slow-spreading MAR commonly has an axial graben > 20 km wide, although at the TAG site it is only 8–10 km wide (Karson and Rona, 1990), and the axial graben structure is complicated by the abundance of detachment faults that commonly occur on one side of the axis or the other, but rarely on opposing sides (Cann et al., 2015). None of the intermediate-rate ridges in the Pacific share a history of detachment faulting with the slower-spreading ridges of the Atlantic, Indian, and Arctic Oceans.
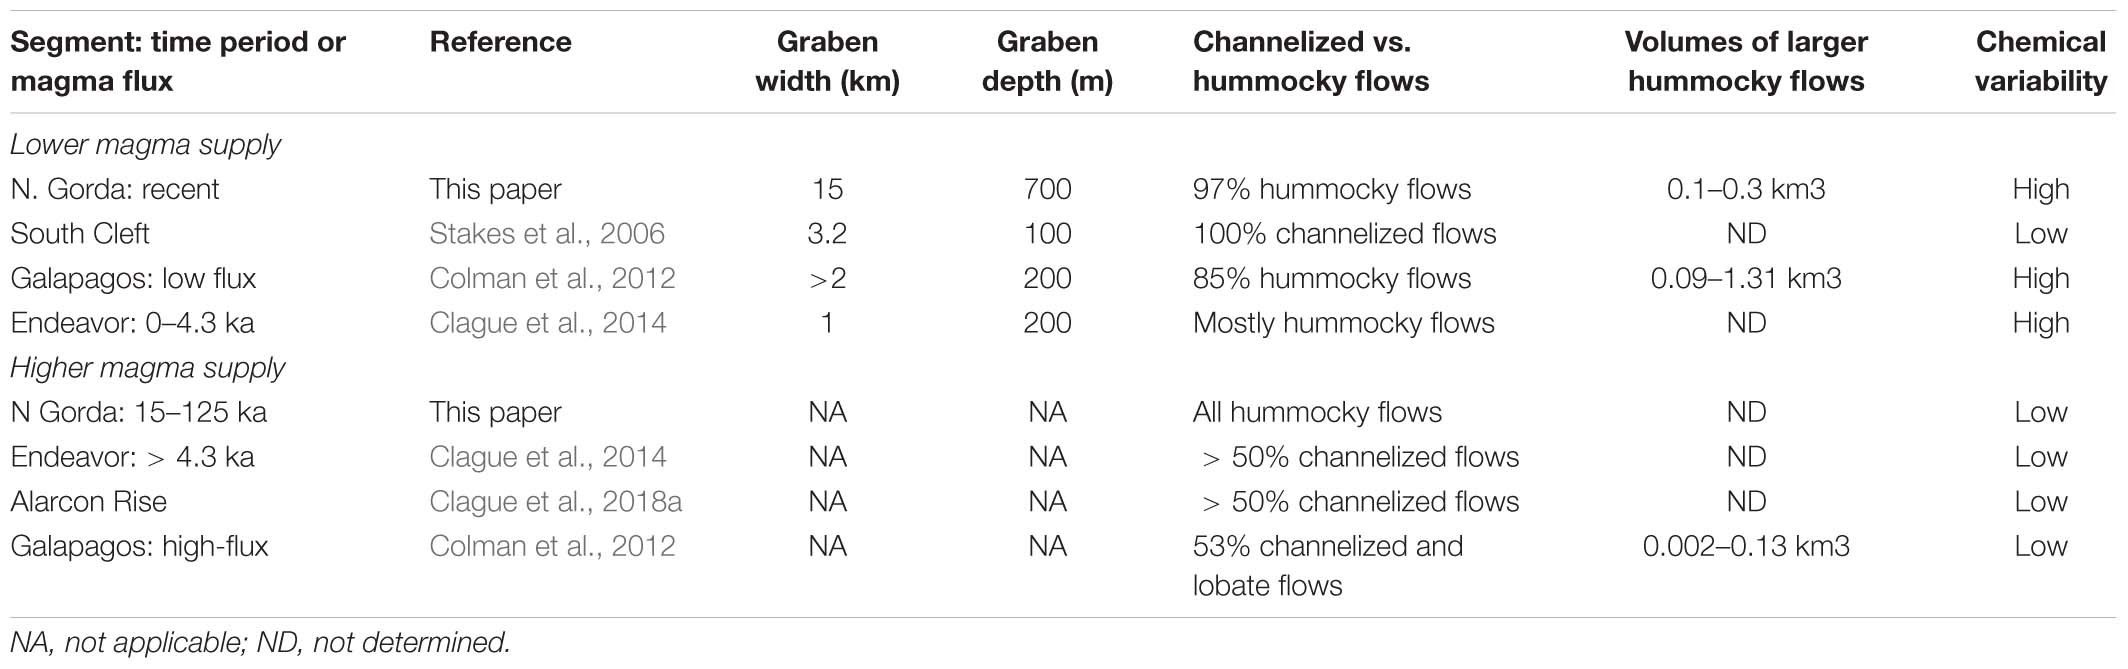
Table 2. Intermediate-rate pacific ridge comparison.
At Pacific intermediate-rate ridges, many of the morphologic and geologic features depend largely on magma supply rates (Table 2). As magma supply can vary at similar spreading rates, eruptions also vary in magma flux, volume, and uniformity in lava composition (e.g., Colman et al., 2012). The present day North Gorda segment is constructed by mostly small-volume, low-flux eruptions having a range of melt compositions, both in terms of enrichment (e.g., K2O/TiO2) and residence times in the crust (MgO contents). The limited sampling of off-axis, older, lavas at North Gorda have a much narrower compositional range. Endeavor segment also has a wide range of lava compositions (Gill et al., 2016) and few channelized flows within the axial graben, erupted while the magma supply was low. Flank lavas, erupted when the segment was in a high-volume magmatic phase, are more compositionally homogeneous (Clague et al., 2014). The North Gorda segment may be entering a period of increasing magma supply, marked by eruption of a few brief, higher-effusion rate channelized flows near the shallowest portion of the neovolcanic zone, and a few larger-volume volcanic structures (inflated hummocky flow, flat-topped cones, and more voluminous ridges) that indicate equally rare longer-lived eruptions. Off-axis, lavas are hummocky flows formed during low-flux eruptions that apparently were also mostly short-lived as few large-volume edifices were constructed. The lavas have more homogeneous evolved compositions, so may have been more thoroughly mixed in sub-axial magma reservoirs and cooled longer or more efficiently (perhaps at shallower depths). Even further off-axis, when the segment may have been characterized by an axial high (Figure 1), mapping and sampling are inadequate to determine the eruption rates, eruption durations, or variability of the flow compositions.
It is tempting to try to arrange all these different intermediate-rate ridges into the Kappel and Ryan (1986) model of alternating tectonic and magmatic cycles. Furthermore, the three-phase cycle of magmatism, tectonism, and hydrothermalism proposed for the Endeavor segment (Clague et al., 2014) may only apply to that segment as none of the other intermediate-rate segments have a phase dominated by hydrothermal discharge when magma supply begins to increase at the beginning of the next magmatic phase. The segments listed in Table 2 are roughly organized in terms of width and depth of the axial graben, percent high- and low flux lava flows, volumes of larger flows, and chemical variability (Table 2). These variations in parameters indicate that, at nearly constant spreading rates, magma supply rate provides the primary control on ridge structure, but other unidentified factors must also exert secondary control.
Faulting on North Gorda consists of sub-parallel normal faults with larger-throw faults spaced about 1 km apart, but with additional small-throw normal faults in between (Figure 6B). This axial structure is distinct from that at some slow spreading ridges (e.g., Smith et al., 2012; Cann et al., 2015) that develop detachment faults that expose lower crust or mantle rocks. North Gorda faulting is also distinct from the broad axial bulge, commonly with a small summit graben, that characterized fast-spreading ridges (e.g., Buck et al., 2005). Numerical modeling (Lavier and Buck, 2002) suggests extension of brittle thick lithosphere, or lithosphere with efficient hydrothermal cooling, can produce a rift with multiple graben structures, such as observed at North Gorda.
Conclusion
The 1996 eruption on the North Gorda segment produced three small hummocky lava flows that erupted at extremely low rates, thereby producing hummocks with near-vertical margins. Flows cascading over the edge of these steep-sided hummocks produced abundant syneruptive talus and rare lavacicles when molten lava fell vertically.
Individual lava flows that construct the North Gorda crust have small volumes from 0.007 km3 for the 1996 flows to 0.25 km3 for the largest flat-topped cones and inflated hummocky flows. Lava flows with similar chemical compositions erupted at a range of rates to produce highly varied volcanic landforms. These landforms range from rapidly erupted channelized flows that ponded in the axial graben to very slowly erupted steep-sided hummocky flows like the 1996 hummocky flows. These observations indicate that dike width rather than physical lava properties or magmatic gas content is the primary control on eruption rate.
The Sea Cliff hydrothermal site is located 2.6 km east of the center of the axial graben, and 370 m above the floor of the axial graben where the graben-bounding fault with the largest throw is located. The hydrothermal system emits 305°C colorless fluids that mainly precipitate anhydrite and Mg-rich smectite, with only traces of sulfide phases. Observations in 2019 (C. German, personal communication) suggest minimal changes in the system since last observed and sampled in 2005, or since discovery in 1988. The active vent site is not located where two fault systems intersect, as proposed previously.
Sub-bottom seismic profiles and multibeam bathymetric data collected from the AUV show that sediment thickness increases with distance to the axial graben, as expected but rarely shown on such a small scale. Sediment cover close to the axis that is too thin to detect seismically smooths the bathymetry. The normal faults bounding the axial graben are asymmetrical with limited uplift on the west side of the graben compared with the east side.
Comparison with other Pacific intermediate-spreading rate ridges indicates that North Gorda, following a period of tectonic extension, may be re-entering a more magmatically robust phase with eruption of some larger-volume flows and volcanic constructs, as well as more rapidly erupted channelized flows in the axial graben.
Addition of 1-m resolution mapping data collected by AUVs enhances the value of legacy data sets and enables reinterpretation of the history of spreading and volcanism on mid-ocean ridges. A large amount of such legacy data exists along the global mid-ocean ridge system that will yield new insights if it can be placed in a high-resolution spatial framework. The only requirement is that the legacy data must be well-navigated, have features that allow co-registration with the new high-resolution mapping data, or have sampled large features.
Data Availability Statement
The AUV multibeam and sub-bottom seismic data can be found in the IEDA seafloor bathymetry archives.
Author Contributions
DAC was chief scientist on the cruises in 2000, 2002, and 2005, managed the sample analysis and processing of the multibeam data, and wrote most of the manuscript. JP participated on the ROV dive cruises in 2002 and 2005, processed the multibeam data, prepared most of the figures, and edited the manuscript. DWC collected the AUV multibeam data and did the initial data processing. JM obtained funding for the dives at the Sea Cliff hydrothermal site, participated on the cruises in 2000 and 2002, and discussed the setting and character of the site with coauthors. RZ participated on the cruises in 2000 and 2002 and interpreted the analytical data on the hydrothermal samples.
Funding
The ROV dives at Sea Cliff site in 2000 and 2002 were supported by a grant from the West Coast NURP office of NOAA. The remaining ROV dives and collection of the AUV data were funded by a grant to the Monterey Bay Aquarium Research Institute from the David and Lucile Packard Foundation, which also supported the salaries of DAC, JP, and DWC.
Conflict of Interest
The authors declare that the research was conducted in the absence of any commercial or financial relationships that could be construed as a potential conflict of interest.
Acknowledgments
Samples and observations were collected in 2000, 2002, and 2005 during ROV Tiburon dives done from the R/V Western Flyer. The mapping AUV surveys were completed in 2009 from the R/V Zephyr and in 2016 from the R/V Rachel Carson. The dedication and skill of the captains, ships crews, ROV pilots, and AUV team at MBARI are reflected in the high-quality data available for this study. We thank Chris German and Ocean Exploration Trust for sharing regional EM302 bathymetric data collected by the R/V Nautilus during cruise NA108 in 2019. Observations from their NASA- and NOAA-funded ROV program confirm that the Sea Cliff vent field remains active in 2019 and expands the area of active vent along strike 775 m to the north with discovery of the Apollo vent field.
Supplementary Material
The Supplementary Material for this article can be found online at: https://www.frontiersin.org/articles/10.3389/fmars.2020.00027/full#supplementary-material
FIGURE S1 | Map of proposed southern 1996 flow (Chadwick et al., 1998) and track of ROV Tiburon dive T187 with samples coded by MgO content as in Figure 2 and the first and last rock samples labeled. The orange triangle in the SE corner is the inferred location of W9604-C2 (Rubin et al., 1998) plotted on the track of the towed camera survey. The hypothesized flow (Chadwick et al., 1998) is defined by depth anomalies (shown with maximum difference of 60 m and contour interval of 5 m) determined by difference from pre- and post-1996 bathymetric maps. It is an artifact as no young flows were encountered on T187. Color ramp is −3550 m (dark blue) to −3000 m (orange).
FIGURE S2 | Three ridge-parallel seismic profiles collected by the AUV mounted Edgetech FS-AU sonar 2–16 kHz chirp sub-bottom profilers showing thicker sediment on distal line 2 than more proximal line 16, which has similar sediment cover to that on line 58 on the opposite side of the axis. The locations of the lines are shown in Figure 6B with line 2 from fault block Ee, line 16 from block De, and line 58 from block Cw. The maximum sediment thickness decreases from 5 to 7 m on block Ee to 2–3 m on blocks De and Cw to undetected sediment on blocks A, Bw, and Be.
TABLE S1 | Microprobe glass compositions.
References
Baker, E. T., Massoth, G. J., Collier, R. W., Trefry, J. H., Kadko, D., Nelson, T. A., et al. (1987). Evidence for high-temperature hydrothermal venting on the Gorda Ridge, northeast Pacific Ocean. Deep Sea Res. 34, 1461–1476. doi: 10.1016/0198-0149(87)90137-3
Ballard, R. D., and van Andel, T. H. (1977). Morphology and tectonics of inner rift valley at lat 36°50’N on Mid-Atlantic Ridge. Geol. Soc. Am. Bull. 88, 507–530.
Bideau, D., Hekinian, R., Sichler, B., Gracia, E., Bollinger, C., Constantin, M., et al. (1998). Contrasting volcanictectonic processes during the past 2Ma on the Mid-Atlantic Ridge: submersible mapping, petrological and magnetic results at lat. 34°52’ N and 33°55’ N. Mar. Geophys. Res. 20, 425–458.
Bohrson, W. A., Spera, F. J., Ghiorso, M. S., Brown, G. A., Creamer, J., and Mayfield, A. (2014). Thermodynamic model for energy-constrained open system evolution of crustal magma bodies undergoing simultaneous assimilation, recharge, and crystallization: the magma chamber simulator. J. Petrol. 55, 1685–1717. doi: 10.1093/petrology/egu036
Buck, W. R., Lavier, L. L., and Poliakov, A. N. B. (2005). Modes of faulting at mid-ocean ridges. Nature 434, 719–723.
Canales, J. P., Sohn, R. A., and deMartin, B. J. (2007). Crustal structure of the Trans-Atlantic Geotraverse (TAG) segment (Mid-Atlantic Ridge, 26°10′N): Implications for the nature of hydrothermal circulation and detachment faulting at slow spreading ridges. Geochem. Geophys. Geosyst. 8, 1–18. doi: 10.1029/2007GC001629
Cann, J. R., Smith, D. K., Escartin, J., and Shouten, H. (2015). Tectonic evolution of 200 km of Mi-Atlantic ridge over 10 million years: interplay of volcanism and faulting. Geochem. Geophys. Geosyst. 16, 2303–2331. doi: 10.1002/2015GC005797
Caress, D. W., and Chayes, D. N. (1996). Improved processing of hydrosweep DS multibeam data on the R/V Maurice Ewing. Mar. Geophys. Res. 18, 631–650. doi: 10.1007/BF00313878
Caress, D. W., Thomas, H., Kirkwood, W. J., McEwen, R., Henthorn, R., Clague, D. A., et al. (2008). “High-resolution multibeam, sidescan, and subbottom surveys using the MBARI AUV D. Allan B,” in Marine Habitat Mapping Technology for Alaska, eds J. R. Reynolds and H. G. Greene, (Fairbanks: University of Alaska), 47–69. doi: 10.4027/mhmta.2008.04
Chadwick, W. W. Jr., Clague, D. A., Embley, R. W., Perfit, M. R., Butterfield, D. A., Caress, D. W., et al. (2013). The 1998 eruption of Axial Seamount: new insights on submarine lava flow emplacement from high-resolution mapping. Geochem. Geophys. Geosyst. 14, 3939–3968. doi: 10.1002/ggge.20202
Chadwick, W. W. Jr., Embley, R. W., and Shanks, T. M. (1998). The 1996 Gorda Ridge eruption: geologic mapping, sidescan sonar, and SeaBeam comparison results. Deep Sea Res. II 45, 2547–2569. doi: 10.1016/s0967-0645(98)00083-6
Chadwick, W. W. Jr., Paduan, J. B., Clague, D. A., Dreyer, B. M., Merle, S. G., Bobbitt, A. M., et al. (2016). Voluminous eruption from a zoned magma body after and increases in supply rate at Axial Seamount. Geophys. Res. Lett., 43, 12:70. doi: 10.1002/2016GL071327
Clague, D. A., Caress, D. W., Dreyer, B. M., Lundsten, L., Paduan, J. B., Portner, R. A., et al. (2018a). Geology of the Alarcon Rise, Southern Gulf of California. Geochem. Geophys. Geosyst. 19, 807–837. doi: 10.1002/2017GC007348
Clague, D. A., Davis, A. S., and Dixon, J. E. (2003). “Submarine strombolian eruptions along the Gorda mid-ocean ridge,” in Explosive Subaequeous Volcanism, American Geophysical Union Monograph, eds J. D. L. White, J. L. Smellie, and D. A. Clague, (Hoboken, NJ: Wiley), 11–12.
Clague, D. A., Dreyer, B. M., Paduan, J. B., Martin, J. F., Caress, D. W., Gill, J. B., et al. (2014). Eruptive and tectonic history of the Endeavour Segment of the Juan de Fuca Ridge based on AUV mapping and lava flow ages. Geochem. Geophys. Geosyst. 15, 1–28. doi: 10.1002/2014GC005415
Clague, D. A., Dreyer, B. M., Paduan, J. B., Martin, J. F., Chadwick, W. W. Jr., Caress, D. W., et al. (2013). Geologic history of the summit of Axial Seamount, Juan de Fuca Ridge. Geochem. Geophys. Geosyst. 14, 4403–4443. doi: 10.1002/ggge.20240
Clague, D. A., and Holmes, M. L. (1987). “Geology, petrology, and mineral potential of the Gorda Ridge,” in Geology and Resource Potential of the Continental Margin of Western North America and Adjacent Ocean Basins—Beaufort Sea to Baja California: Circum-Pacific Council for Energy and Mineral Resources, Circum-Pacific Earth Science Series, eds D. W. Scholl, A. Grantz, and J. G. Vedder, (Berelin: Springer), 563–580.
Clague, D. A., Moore, J. G., and Reynolds, J. R. (2000). Formation of submarine flat-topped volcanic cones in Hawaii. Bull. Volcanol. 62, 214–233. doi: 10.1007/s004450000088
Clague, D. A., Paduan, J. B., Caress, D. W., Chadwick, W. W. Jr., Le Saout, M., Dreyer, B., et al. (2017). High-resolution AUV mapping and targeted ROV observations of three historical lava flows at Axial Seamount. Oceanography 30, 82–99. doi: 10.5670/oceanog.2017.426
Clague, D. A., Paduan, J. B., Caress, D. W., Thomas, H., Chadwick, W. W. Jr., and Merle, S. G. (2011). Volcanic morphology of West Mata Volcano, NE Lau basin, based on high-resolution bathymetry and depth changes. Geochem. Geophys. Geosyst. 12:QOAF03. doi: 10.1029/2011GC003791
Clague, D. A., Paduan, J. B., and Davis, A. S. (2009). Widespread strombolian eruptions of mid-ocean ridge basalt. J. Volcanol. Geother. Res. 180, 171–188. doi: 10.1016/j.jvolgeores.2008.08.007
Clague, D. A., Paduan, J. B., Dreyer, B. M., Chadwick, W. W. Jr., Rubin, K. R., Perfit, M. R., et al. (2018b). Chemical variations in the 1998, 2011, and 2015 lava flows from Axial Seamount, Juan de Fuca Ridge: cooling during ascent, lateral transport, and flow. Geochem. Geophys. Geosyst. 19, 2915–2933. doi: 10.1029/2018GC007708
Clague, D. A., and Rona, P. (1990). “Geology of the GR-14 site on the northern Gorda Ridge,” in Gorda Ridge: A frontier area in the United States Exclusive Economic Zone, ed. G. R. McMurray, (New York: Springer-Verlag), 31–50. doi: 10.1007/978-1-4612-3258-2_3
Clague, D. A., Zierenberg, R. A., Davis, A., Goffredi, S., McClain, J., Maher, N., et al. (2001). MBARI’s 2000 expedition to the Gorda Ridge. Newslett. U.S. Ridge Initiat. 11, 5–12.
Colman, A., Sinton, J., White, S. M., McClinton, J. T., Bowles, J. A., Rubin, K. H., et al. (2012). Effects of variable magma supply on mid-ocean ridge eruptions: constraints from mapped lava flow fields along the Galápagos Spreading Center. Geochem. Geophys. Geosyst. 13:Q08014. doi: 10.1029/2012GC004163
Cowen, J. P., and Baker, E. T. (1998). The 1996 Gorda Ridge event detection and response activities: historical perspective and future implications. Deep Sea Res. II 45, 2503–2511.
Davis, A. S., and Clague, D. A. (1987). Geochemistry, mineralogy, and petrogenesis of lava from the Gorda Ridge between latitude 43°N and 41.4°N. J. Geophys. Res. 92, 467–410.
Davis, A. S., and Clague, D. A. (1990). Gabbroic xenoliths from the Northern Gorda Ridge: implications for magma chamber processes under slow-spreading centers. J. Geophys. Res. 95, 885–810.
Davis, A. S., Clague, D. A., Cousens, B. L., Keaten, R., and Paduan, J. B. (2008). Geochemistry of basalt from the North Gorda segment of the Gorda Ridge: evolution toward ultra-slow spreading ridge lavas due to decreasing magma supply. Geochem. Geophys. Geosyst. 9:Q04004. doi: 10.1029/2007GC001775
DeMets, C., Gordon, R. G., and Argus, D. F. (2010). Geologically current plate motions. Geophys. J. Int. 181, 1–80. doi: 10.1111/j.1365-246x.2009.04491.x
Dreyer, B. M., Clague, D. A., and Gill, J. (2013). Petrological variability of recent magmatism at Axial Seamount summit, Juan de Fuca ridge. Geochem. Geophys. Geosyst. 14, 4306–4333. doi: 10.1002/ggge.20239
Fornari, D. J., Tivey, M. A., Schouten, H., Perfit, M. R., Yoerger, D., Bradley, A., et al. (2004). “Submarine lava flow emplacement at the East Pacific Rise 9°50’N: implications for uppermost ocean crust stratigraphy and hydrothermal fluid circulation,” in Mid-Ocean Ridges: Hydrothermal Interactions between the Lithosphere and Oceans, Geophysical Monograph Series, eds C. R. German, J. Lin, and L. M. Parson, (Washington, DC: American Geophysical Union), 187–218.
Fowler, A. P. G., and Zierenberg, R. A. (2015). “Rare earth element concentrations in geothermal fluids and epidote from the Reykjanes geothermal system, Iceland,” in Proceedings World Geothermal Congress 2015, Melbourn.
Fowler, A. P. G., Zierenberg, R. A., Reed, M., Palandri, J., Óskarsson, F., and Gunnarson, I. (2019). Rare earth element systematics in boiled fluids from basalt-hosted geothermal systems. Geochim. Cosmochim. Acta 244, 129–154. doi: 10.1016/j.gca.2018.10.001
Fox, C. G., and Dziak, R. P. (1998). Hydroacoustic detection of volcanic activity on the Gorda Ridge, February-March 1996. Deep Sea Res. II 45, 2513–2530. doi: 10.1016/s0967-0645(98)00081-2
Fundis, A. T., Soule, S., Fornari, D. J., and Perfit, M. R. (2010). Paving the seafloor: Volcanic emplacement processes during the 2005–2006 eruptions at the fast spreading East Pacific Rise, 9°N. Geochem. Geophys. Geosyst. 11:Q08024. doi: 10.1029/2010GC003058
Gill, J. B., Michaels, P., Woodcock, J., Ramos, F., Dreyer, B. M., Clague, D. A., et al. (2016). Origins of enriched MORB at the Endeavour Segment, Juan de Fuca Ridge. J. Petrol. 57, 863–896. doi: 10.1093/petrology/egw024
Goldstein, S. J., Murrel, M. T., Janceky, D. R., Delaney, J. R., and Clague, D. A. (1991). Geochronology and petrogenesis of young MORB from the Juan de Fuca and Gorda Ridges by 238U - 230Th disequilibrium. Earth Planet. Sci. Lett. 107, 25–41. doi: 10.1016/0012-821x(91)90041-f
Gregg, T. K. P., and Fink, J. H. (1995). Quantification of submarine lava-flow morphology through analog experiments. Geology 23, 73–76.
Gregg, T. K. P., Fornari, D. J., Perct, M. R., Haymon, R. M., and Fink, J. H. (1996). Rapid emplacement of a mid-ocean ridge lava flow on the East Pacific Rise at 9° 46°51’N. Earth Planet. Sci. Lett. 144, E1–E7.
Griffiths, R. W., and Fink, J. H. (1992). Solidification and morphology of submarine lavas: a dependence on extrusion rate. J. Geophys. Res. 97, 19729–19737.
Hawaiian Volcano Observatory (2017). Kîlauea Volcano’s Kamokuna Ocean Entry Reaches its One-Year Anniversary. Hawaii: Hawaiian Volcano Observatory.
Head, J. W. Jr., Wilson, L., and Smith, D. K. (1996). Mid-ocean ridge eruptive vent morphology and substructure: evidence for dike widths, eruptive rates, and evolution of eruptions and axial volcanic ridges. J. Geophys. Res. 101, 28265–28280. doi: 10.1029/96jb02275
Howard, K. J., and Fisk, M. R. (1988). Hydrothermal alumina-rich clays and boehmite on Gorda Ridge. Geochem. Cosmochem. Acta 52, 2269–2279. doi: 10.1016/0016-7037(88)90129-9
Jones, M. R., Soule, S. A., Gonnermann, H., LeRoux, V., and Clague, D. A. (2018). Ascent and emplacement rates during the 2011 Axial Seamount eruption based on CO2 degassing. Earth Planet. Sci. 494, 32–41. doi: 10.1016/j.epsl.2018.04.044
Kappel, E. S., and Ryan, W. B. F. (1986). Volcanic episodicity and a non-steady state rift valley along northeast Pacific spreading centers: evidence from Sea MARC I. J. Geophys. Res. 91, 13925–13940. doi: 10.1029/JB091iB14p13925
Karlin, R. E., and Zierenberg, R. A. (1994). “Sedimentation and neotectonism in the SESCA area, Escanaba Trough, southern gorda ridge,” in Geologic, Hydrothermal, and biologic studies at Escanaba Trough, Gorda Ridge, Offshore Northern California, U.S. Geological Survey Bulletin 2022, eds J. L. Morton, R. A. Zierenberg, and C. A. Reiss, (Reston, VA: USGS), 131–141.
Karson, J. A., and Rona, P. A. (1990). Block-tilting, transfer faults, and structural control of magmatic and hydrothermal processes in the TAG area, Mid-Atlantic Ridge 26°N. Geol. Soc. Am. Bull. 102, 1635–1645. doi: 10.1130/0016-7606(1990)102<1635:bttfas>2.3.co;2
Klein, E. M., and Langmuir, C. H. (1987). Global correlations of mid-ocean ridge basalt chemistry with axial depth and crustal thickness. J. Geophys. Res. 92, 8089–8115. doi: 10.1038/s41598-019-57344-4
Klinkhammer, G. P., German, C. R., Elderfield, H., Greaves, M. J., and Mitra, A. (1994). Rare earth elements in hydrothermal fluids and plume particulates by inductively coupled plasma mass spectrometry. Mar. Chem. 45, 179–186. doi: 10.1016/0304-4203(94)90001-9
Lavier, L. L., and Buck, W. R. (2002). Half-graben versus large-offset low-angle normal fault: importance of keeping cool during normal faulting. J. Geophys. Res. 107, ETG8–1–ETG8–13.
Le Saout, M., Deschamps, A., Soule, S. A., and Gente, P. (2014). Segmentation and eruptive activity along the East Pacific Rise at 16°N, in relation with the nearby Mathematician hotspot. Geochem. Geophys. Geosyst. 15, 4380–4399. doi: 10.1002/2014GC005560
MBARI Mapping Team (2001). MBARI West Coast Seamounts and Ridges Multibeam Survey. Moss Landing, CA: MBARI.
Mitra, A., Elderfield, H., and Greaves, M. J. (1994). Rare earth elements in submarine hydrothermal fluids and plumes from the Mid-Atlantic Ridge. Mar. Chem. 45, 217–235. doi: 10.1016/0304-4203(94)90079-5
Murton, B. L., and Rona, P. A. (2015). Carlsberg Ridge and Mid-Atlantic Ridge: comparison of slow spreading centre analogues. Deep Sea Res. II 121, 71–84. doi: 10.1016/j.dsr2.2015.04.021
Paduan, J. B., Zierenberg, R. A., Clague, D. A., Caress, D. W., Thomas, H., Troni, G., et al. (2019). Hydrothermal vent fields on Alarcon Rise and in the southern Pescadero Basin, southern Gulf of California. Geochem. Geophys. Geosyst. 19, 4788–4819. doi: 10.1029/2018GC007771
Pasulka, A. L., Goffredi, S. K., Tavormina, P. L., Dawson, K. S., Levin, L. A., Rouse, G. W., et al. (2017). Colonial tube-dwelling ciliates influence methane cycling and microbial diversity within methane seep ecosystems. Front. Mar. Sci. 3:276. doi: 10.3389/fmars.2016.00276
Perfit, M. R., and Chadwick, W. W. Jr. (1998). “Magmatism at mid-ocean ridges: Constraints from volcanological and geochemical investigations,” in Faulting and magmatism at Mid-Ocean Ridges, Geophysical Monograph Series, ed. W. R. Buck, (Washington DC: American Geophysical Union), 59–115. doi: 10.1029/gm106p0059
Reynolds, J. R., and Langmuir, C. H. (2000). Identification and implications of off-axis lava flows around the East Pacific Rise. Geochem. Geophys. Geosyst. 1:1019. doi: 10.1029/1999GC000033
Rona, P. A., and Clague, D. A. (1989). Geologic controls of hydrothermal discharge on the northern Gorda Ridge. Geology 17, 1097–1101.
Rona, P. A., Denlinger, R. P., Fisk, M. R., Howad, K. J., Taghon, G. L., Klitgord, K. D., et al. (1990). Major off-axis hydrothermal activity on the northern Gorda Ridge. Geology 18, 493–496.
Rona, P. A., Meis, P. J., Beaverson, C. A., Embley, R. W., and Fox, C. G. (1992). Geological setting of hydrothermal activity at the northern Gorda Ridge. Mar. Geol. 106, 189–201. doi: 10.1016/0025-3227(92)90129-6
Ross, S. L., and Zierenberg, R. A. (1994). “Volcanic geomorphology of the SESCA and NESCA sites, Escanaba Trough,” in Geologic, Hydrothermal, and Biologic Studies at Escanaba Trough, Gorda Ridge, Offshore Northern California, U.S. Geological Survey Bulletin 2022, eds J. L. Morton, R. A. Zierenberg, and C. A. Reiss, (Los Angeles, CA: UGSC), 143–151.
Rubin, K. H., Smith, M. C., Bergmanis, E. C., Perfit, M. R., Sinton, J. M., and Batiza, R. (2001). Geochemical heterogeneity within mid-ocean ridge lava flows: insights into eruption, emplacement and global variations in magma generation. Earth Planet. Sci. Lett. 188, 349–367. doi: 10.1016/s0012-821x(01)00339-9
Rubin, K. H., Smith, M. C., Perfit, M. R., Christie, D. M., and Sacks, L. F. (1998). Geochronology and geochemistry of lavas from the 1996 north Gorda Ridge eruption. Deep Sea Res. II 45, 2571–2597. doi: 10.1016/s0967-0645(98)00084-8
Rubin, K. H., Soule, S. A., Chadwick, W. W. Jr., Fornari, D. J., Clague, D. A., Embley, R. W., et al. (2012). Volcanic eruptions in the deep sea. Oceanogr. Magaz. 25, 142–157.
Shaw, H. R. (1972). Viscosities of magmatic silicate liquids: an empirical method of prediction. Am. J. Sci. 272, 870–893. doi: 10.2475/ajs.272.9.870
Smith, D. K., and Cann, J. R. (1992). The role of seamount volcanism in crustal construction at the Mid-Atlantic Ridge (24°-30°N). J. Geophys. Res. 97, 1645–1658. doi: 10.1029/91jb02507
Smith, D. K., and Cann, J. R. (1993). Building the crust at the Mid-Atlantic Ridge. Nature 365, 707–715. doi: 10.1038/365707a0
Smith, D. K., Escartín, J., Schouten, H., and Cann, J. R. (2012). Active long-lived faults emerging along slow-spreading mid-ocean ridges. Oceanography 25, 94–99. doi: 10.5670/oceanog.2012.07
Soule, S. A., Escartın, J., and Fornari, D. J. (2009). A record of eruption and intrusion at a fast spreading ridge axis: axial summit trough of the East Pacific Rise at 9–10°N. Geochem. Geophys. Geosyst. 10:Q10T07. doi: 10.1029/2008GC002354
Soule, S. A., Fornari, D. J., Perfit, M. R., and Rubin, K. H. (2007). New insights into mid-ocean ridge volcanic processes from the 2005–2006 eruption of the East Pacific Rise, 9°46’N–9°56’N. Geology 35, 1079–1082. doi: 10.1130/G23924A.1
Soule, S. A., Fornari, D. J., Perfit, M. R., Tivey, M. A., Ridley, W. I., and Schouten, H. (2005). Channelized lava flows at the East Pacific Rise crest 9°–10°N: the importance of off-axis lava transport in developing the architecture of young oceanic crust. Geochem. Geophys. Geosyst. 6:Q08005. doi: 10.1029/2005GC000912
Stakes, D. S., Perfit, M. R., Tivey, M. A., Caress, D. W., Ramirez, T. M., and Maher, N. (2006). The Cleft revealed: geologic, magnetic, and morphologic evidence for construction of the upper oceanic crust along the southern Juan de Fuca Ridge. Geochem. Geophys. Geosyst. 7:Q04003. doi: 10.1029/2005GC001038
Van Dover, C. L., Grassle, J. F., and Boudrias, M. (1990). “Hydrothermal vent fauna of Escanaba Trough,” in Gorda Ridge: A Frontier Area in the United States Exclusive Economic Zone, ed. G. R. McMurray, (New York, NY: Springer-Verlag), 285–287. doi: 10.1007/978-1-4612-3258-2_21
Von Damm, K. L., Parker, C. M., Lilley, M. D., Clague, D. A., Zierenberg, R. A., Olson, E. J., et al. (2006). Chemistry of vent fluids and its implications for subsurface conditions at Sea Cliff hydrothermal field, Gorda Ridge. Geochem. Geophys. Geosyst. 7:Q05005. doi: 10.1029/2005GC001034
Von Damm, K. L., Parker, C. M., Zierenberg, R. A., Lilley, M. D., Olsen, E. J., Clague, D. A., et al. (2005). The Escanaba Trough, Gorda Ridge hydrothermal system: temporal stability and subseafloor complexity. Geochim. Cosmochim. Acta 69, 4971–4984. doi: 10.1016/j.gca.2005.04.018
Waters, C. L., Sims, K. W. W., Soule, S., Blichert-Toft, J., Dunbar, N. W., Plank, T., et al. (2013). Recent volcanic accretion at 98N–108N East Pacific Rise as resolved by combined geochemical and geological observations. Geochem. Geophys. Geosyst. 14, 2547–2574. doi: 10.1002/ggge.20134
White, S. M., Haymon, R. M., Fornari, D. J., Perfit, M. R., and Macdonald, K. C. (2002). Correlation between volcanic and tectonic segmentation of fast-spreading ridges: evidence from volcanic structures and lava morphology on the East Pacific Rise, 9°–10°N. J. Geophys. Res. 107:2173. doi: 10.1029/2001JB000571
White, S. M., Macdonald, K. C., and Haymon, R. M. (2000). Basaltic lava domes, lava lakes, and volcanic segmentation on the southern East Pacific Rise. J. Geophys. Res. 105, 23519–23536. doi: 10.1029/2000JB900248
White, S. N., Dunk, R. M., Peltzer, E. T., Freeman, J. J., and Brewer, P. G. (2006). In situ Raman analysis of deep-sea hydrothermal and cold seep systems (Gorda Ridge and hydrate ridge. Geochem. Geophys. Geosyst. 7:1204. doi: 10.1029/2005GC001204
Yeo, I., and Searle, R. C. (2013). High-resolution remotely operated vehicle (ROV) mapping of the slow-spreading ridge: mid-Atlantic ridge 45°N. Geochem. Geophys. Geosyst. 14, 1693–1702. doi: 10.1002/ggge.20082
Yeo, I., Searle, R. C., Achenbach, K. L., Le Bas, T. P., and Murton, B. J. (2012). Eruptive hummocks, building blocks of the upper crust. Geology 40, 91–94. doi: 10.1130/G31892.1
Yeo, I. A., Clague, D. A., Martin, J. F., Paduan, J. B., and Caress, D. W. (2013). Pre-eruptive flow focusing in dikes feeding historic pillow ridges on and Juan de Fuca and Gorda Ridges. Geochem. Geophys. Geosyst. 14, 3586–3599. doi: 10.1002/ggge.20210
Zierenberg, R. A., Morton, J. L., Koski, R. A., and Ross, S. L. (1994). “Geologic setting of massive sulfide mineralization in Escanaba Trough,” in Geologic, Hydrothermal, and Biologic Studies at Escanaba Trough, Gorda Ridge, Offshore Northern California, U.S. Geological Survey Bulletin 2022, eds J. L. Morton, and CA Reiss, (Los Angeles, CA: UGSC), 171–197.
Keywords: mapping AUV, hydrothermal vent field, mid-ocean ridge volcanism, Gorda Ridge, MORB
Citation: Clague DA, Paduan JB, Caress DW, McClain J and Zierenberg RA (2020) Lava Flows Erupted in 1996 on North Gorda Ridge Segment and the Geology of the Nearby Sea Cliff Hydrothermal Vent Field From 1-M Resolution AUV Mapping. Front. Mar. Sci. 7:27. doi: 10.3389/fmars.2020.00027
Received: 30 May 2019; Accepted: 16 January 2020;
Published: 03 March 2020.
Edited by:
Stephen Hammond, Office of Oceanic and Atmospheric Research (NOAA), United StatesReviewed by:
Colin Devey, GEOMAR Helmholtz Centre for Ocean Research Kiel, GermanyRoger Searle, Durham University, United Kingdom
Copyright © 2020 Clague, Paduan, Caress, McClain and Zierenberg. This is an open-access article distributed under the terms of the Creative Commons Attribution License (CC BY). The use, distribution or reproduction in other forums is permitted, provided the original author(s) and the copyright owner(s) are credited and that the original publication in this journal is cited, in accordance with accepted academic practice. No use, distribution or reproduction is permitted which does not comply with these terms.
*Correspondence: David A. Clague, Y2xhZ3VlQG1iYXJpLm9yZw==