 Gianmaria Califano
 Michiel Kwantes1
 Rodrigo Costa
 Thomas Wichard
- 1Institute for Inorganic and Analytical Chemistry, Friedrich Schiller University Jena, Jena, Germany
- 2ALGAplus Lda, Ílhavo, Portugal
- 3Institute for Bioengineering and Biosciences, Instituto Superior Técnico, Universidade de Lisboa, Lisbon, Portugal
- 4Centre of Marine Sciences, University of Algarve, Faro, Portugal
- 5Lawrence Berkeley National Laboratory, U.S. Department of Energy Joint Genome Institute, University of California, Berkeley, Berkeley, CA, United States
- 6Jena School for Microbial Communication, Jena, Germany
Ulva is a ubiquitous macroalgal genus of commercial interest. Integrated Multi-Trophic Aquaculture (IMTA) systems promise large-scale production of macroalgae due to their high productivity and environmental sustainability. Complex host–microbiome interactions play a decisive role in macroalgal development, especially in Ulva spp. due to algal growth- and morphogenesis-promoting factors released by associated bacteria. However, our current understanding of the microbial community assembly and structure in cultivated macroalgae is scant. We aimed to determine (i) to what extent IMTA settings influence the microbiome associated with U. rigida and its rearing water, (ii) to explore the dynamics of beneficial microbes to algal growth and development under IMTA settings, and (iii) to improve current knowledge of host–microbiome interactions. We examined the diversity and taxonomic composition of the prokaryotic communities associated with wild versus IMTA-grown Ulva rigida and surrounding seawater by using 16S rRNA gene amplicon sequencing. With 3141 Amplicon Sequence Variants (ASVs), the prokaryotic richness was, overall, higher in water than in association with U. rigida. Bacterial ASVs were more abundant in aquaculture water samples than water collected from the lagoon. The beta diversity analysis revealed distinct prokaryotic communities associated with Ulva collected in both aquacultures and coastal waters. Aquaculture samples (water and algae) shared 22% of ASVs, whereas natural, coastal lagoon samples only 9%. While cultivated Ulva selected 239 (8%) host-specific ASVs, wild specimens possessed more than twice host-specific ASVs (17%). Cultivated U. rigida specimens enriched the phyla Cyanobacteria, Planctomycetes, Verrucomicrobia, and Proteobacteria. Within the Gammaproteobacteria, while Glaciecola mostly dominated the microbiome in cultivated algae, the genus Granulosicoccus characterized both Ulva microbiomes. In both wild and IMTA settings, the phylum Bacteroidetes was more abundant in the bacterioplankton than in direct association with U. rigida. However, we observed that the Saprospiraceae family within this phylum was barely present in lagoon water but very abundant in aquaculture water. Aquaculture promoted the presence of known morphogenesis-inducing bacteria in water samples. Our study suggests that IMTA significantly shaped the structure and composition of the microbial community of the rearing water and cultivated U. rigida. Detailed analysis revealed the presence of previously undetected taxa associated with Ulva, possessing potentially unknown functional traits.
Introduction
Green, brown, and red seaweeds are currently receiving increasing research attention about the development of a more sustainable (blue) economy (Kim et al., 2017; FAO, 2018). Their exploitation as sources of novel biomolecules (Barzkar et al., 2019) and materials is an active and multidisciplinary field of research, which is currently gaining momentum. With its broad environmental plasticity, high growth rate, and multipurpose biomass usage, green macroalgae provide novel and reusable sources of compounds and materials of potential applicability in several sectors (Hafting et al., 2015). In particular, members of the widespread genus Ulva are already playing an essential role in the food (Colombo et al., 2006; Abreu et al., 2014; Santos et al., 2015), pharmaceutical, and cosmetic industries (Barzkar et al., 2019) as well as in fish aquaculture (Neori et al., 2004; Naidoo et al., 2006; Shpigel et al., 2017) to and for the generation of biofuels (Chen et al., 2015; Abomohra et al., 2018).
Integrated multi-trophic aquacultures (IMTA) are characterized by an increase in the diversity of the selected breeding species compared to traditional monocultures (Chopin et al., 2012), where organisms occupying different trophic levels use the same limited physical space or occupy neighboring areas. They share water bodies (and with them nutrients) via water movements (open ocean) or artificial current systems (inland basins or ponds). In this way, the by-products (organic and inorganic nutrients) of one or more organisms become resources for a lower cultivated trophic level (Chopin et al., 2008). Non-multitrophic systems, otherwise, would rely on costly biofiltration apparatuses to control water quality and avoid the release of nutrient-rich waters directly into the natural environment, which would likely affect ecosystem functioning negatively (Mineur et al., 2015), for example, by favoring the increment of opportunistic species eventually promoting algal blooms (Smetacek and Zingone, 2013). Additionally, a more energy-balanced ecosystem has the advantage of preventing or combating disease outbreaks, as seen in the open ocean IMTA of Atlantic salmon, blue mussels (Mytilus edulis), and kelp forest (Skår and Mortensen, 2007; Molloy et al., 2011). Benefits were also highlighted in land-based IMTAs, such as high productivity and reduced variability of the protein content of macroalgae, which were related to the constant supply of nutrients between the different compartments in culture and reduced grazing of the algae (Schuenhoff et al., 2003; Mata et al., 2010). Taken together, this and the cultivation of more high-value species within the system are often thought to promote economic sustainability and societal acceptability of IMTA initiatives (Chopin, 2010). Although IMTA is widely applied, it is still unclear whether the implementation of IMTA substantially affects the structure of microbial communities associated with economically valuable species.
As already seen in humans, apes, and invertebrates (Moeller et al., 2013; Mikaelyan et al., 2015), in macroalgae (Egan et al., 2012), host-associated microbiomes differ according to a wide range of factors. Microbiome profiles were different along geographical and temporal gradients (Bengtsson et al., 2010; Burke et al., 2011a; Michelou et al., 2013; Campbell et al., 2015), as well as along a variation of abiotic factors such as temperature and nutrients () (Florez et al., 2019). In some cases, there were pieces of evidence of species-specific microbial community structures among macroalgae (Lachnit et al., 2009) but in other cases, individuals belonging to the same species (U. australis) showed severe differences in the microbial profiles (Burke et al., 2011b), which was used to suggest the “competitive lottery model” to explain the process of bacterial community assembly on macroalgal surfaces (Burke et al., 2011a; Ghaderiardakani et al., 2017). There were further indications that microbial community structure and composition can be driven by changes in the physiological and morphological traits showed during the life cycle phases of the host, as seen in the case of brown and red algal species, such as Laminaria hyperborea and Mastocarpus spp. (Bengtsson et al., 2010; Lemay et al., 2018). Another important structuring factor is the physiological condition of the host (such as healthy or stressed), as it can influence microbial community assembly processes to a larger extent than the environmental variables do, described for the brown alga Ecklonia radiata (Marzinelli et al., 2015, 2018). Altogether, the evidence gained from recent studies suggests that the host selects a microbial community that is different in structure and composition from the surrounding environment such as water and substrate (Bengtsson et al., 2010; Burke et al., 2011a; Michelou et al., 2013). Model studies have further suggested that Ulva is gardening its microbial community through released chemoattractants and carbon sources (Kessler et al., 2018). Despite the wide interest into the macroalgal holobiont from both an ecological and biotechnological standpoint, many functional and molecular relationships between bacteria and their hosts remain to be unraveled (Wichard and Beemelmanns, 2018).
Species belonging to the Ulva genus have extraordinary phenotypic plasticity (Fries, 1975; Wichard, 2015). Even environmental factors might induce differences in their morphology, making the establishment of robust morphology-based and numerical taxonomy procedures complicated (Malta et al., 1999; Woolcott and King, 1999; Hayden and Waaland, 2004; Messyasz and Rybak, 2010). Molecular tools are thus necessary to solve taxonomic and cladistic hurdles such as the unification of the Ulva and Enteromorpha clades or, at the species level, Ulva compressa with Ulva mutabilis (Hayden et al., 2003; Steinhagen et al., 2019a, b). Although Ulva can be cultivated under standardized, small-scale laboratory conditions in the presence of a designed microbiome with just two essential bacterial strains (Wichard, 2015), macroalgae show variations in its associated natural microbiome along the different developmental stages of their complex life cycles (Lemay et al., 2018).
As Ulva–microbiome interactions can play an essential role in sustainable aquaculture conditions (Ghaderiardakani et al., 2019), we have hypothesized that an IMTA system can affect bacterial communities and their interactions with the host. Insights into microbial dynamics will allow us optimizing algal aquaculture efficiency and its impact on the environment. We aimed to decipher the microbiomes associated with Ulva rigida in cultivated (reared) versus natural conditions to determine how the microbiome was shaped by the surrounding environment and by Ulva.
Materials and Methods
Algal Aquaculture
The land-based cultivation of the algae analyzed in this study was performed at ALGAplus Lda, located at the Aveiro coastal lagoon (Portugal). IMTA-based algal production at ALGAplus relies on a unique flow system in which fish and macroalgae are integrated (Figure 1). Fish farming (seabream and seabass) works in a semi-intensive regime, at a low production density (1–2 kg m–3) and with artificial feeding accounting only for 10–20% of the fish diet (natural food, as crabs, shrimps, and algae accounts for the rest). Fish feeding happens twice a day, typically, early in the morning and late in the afternoon. The water flow is unidirectional, entering the production system at each high tide and flowing back to the lagoon (Boco River) at low tides. The fish production units consist of an entrance water pond that feeds several fish ponds (4000–5000 m2) individually controlled by gates; the fish effluents flow out to sedimentation ponds and then back to the lagoon. The macroalgae tanks (max. 20,000 L per tank) were set to receive water that is pumped from two fish ponds mechanically filtered to remove particulate matter (>40 μm) and then continuously distributed across several macroalgae tanks in an open-flow regime. Each tank was individually controlled regarding water exchange rates. The outflow from all macroalgae tanks was discharged to the sedimentation pond and back to the lagoon. A previous snapshot study has determined several abiotic factors on the site. At various sampling points of the IMTA, the levels of , , , and metals, which can act as micronutrients or have a toxic effect, depending on their concentration, were determined (Ghaderiardakani et al., 2019). Essential nutrients such as and were not depleted, although was significantly reduced in macroalgae tanks.
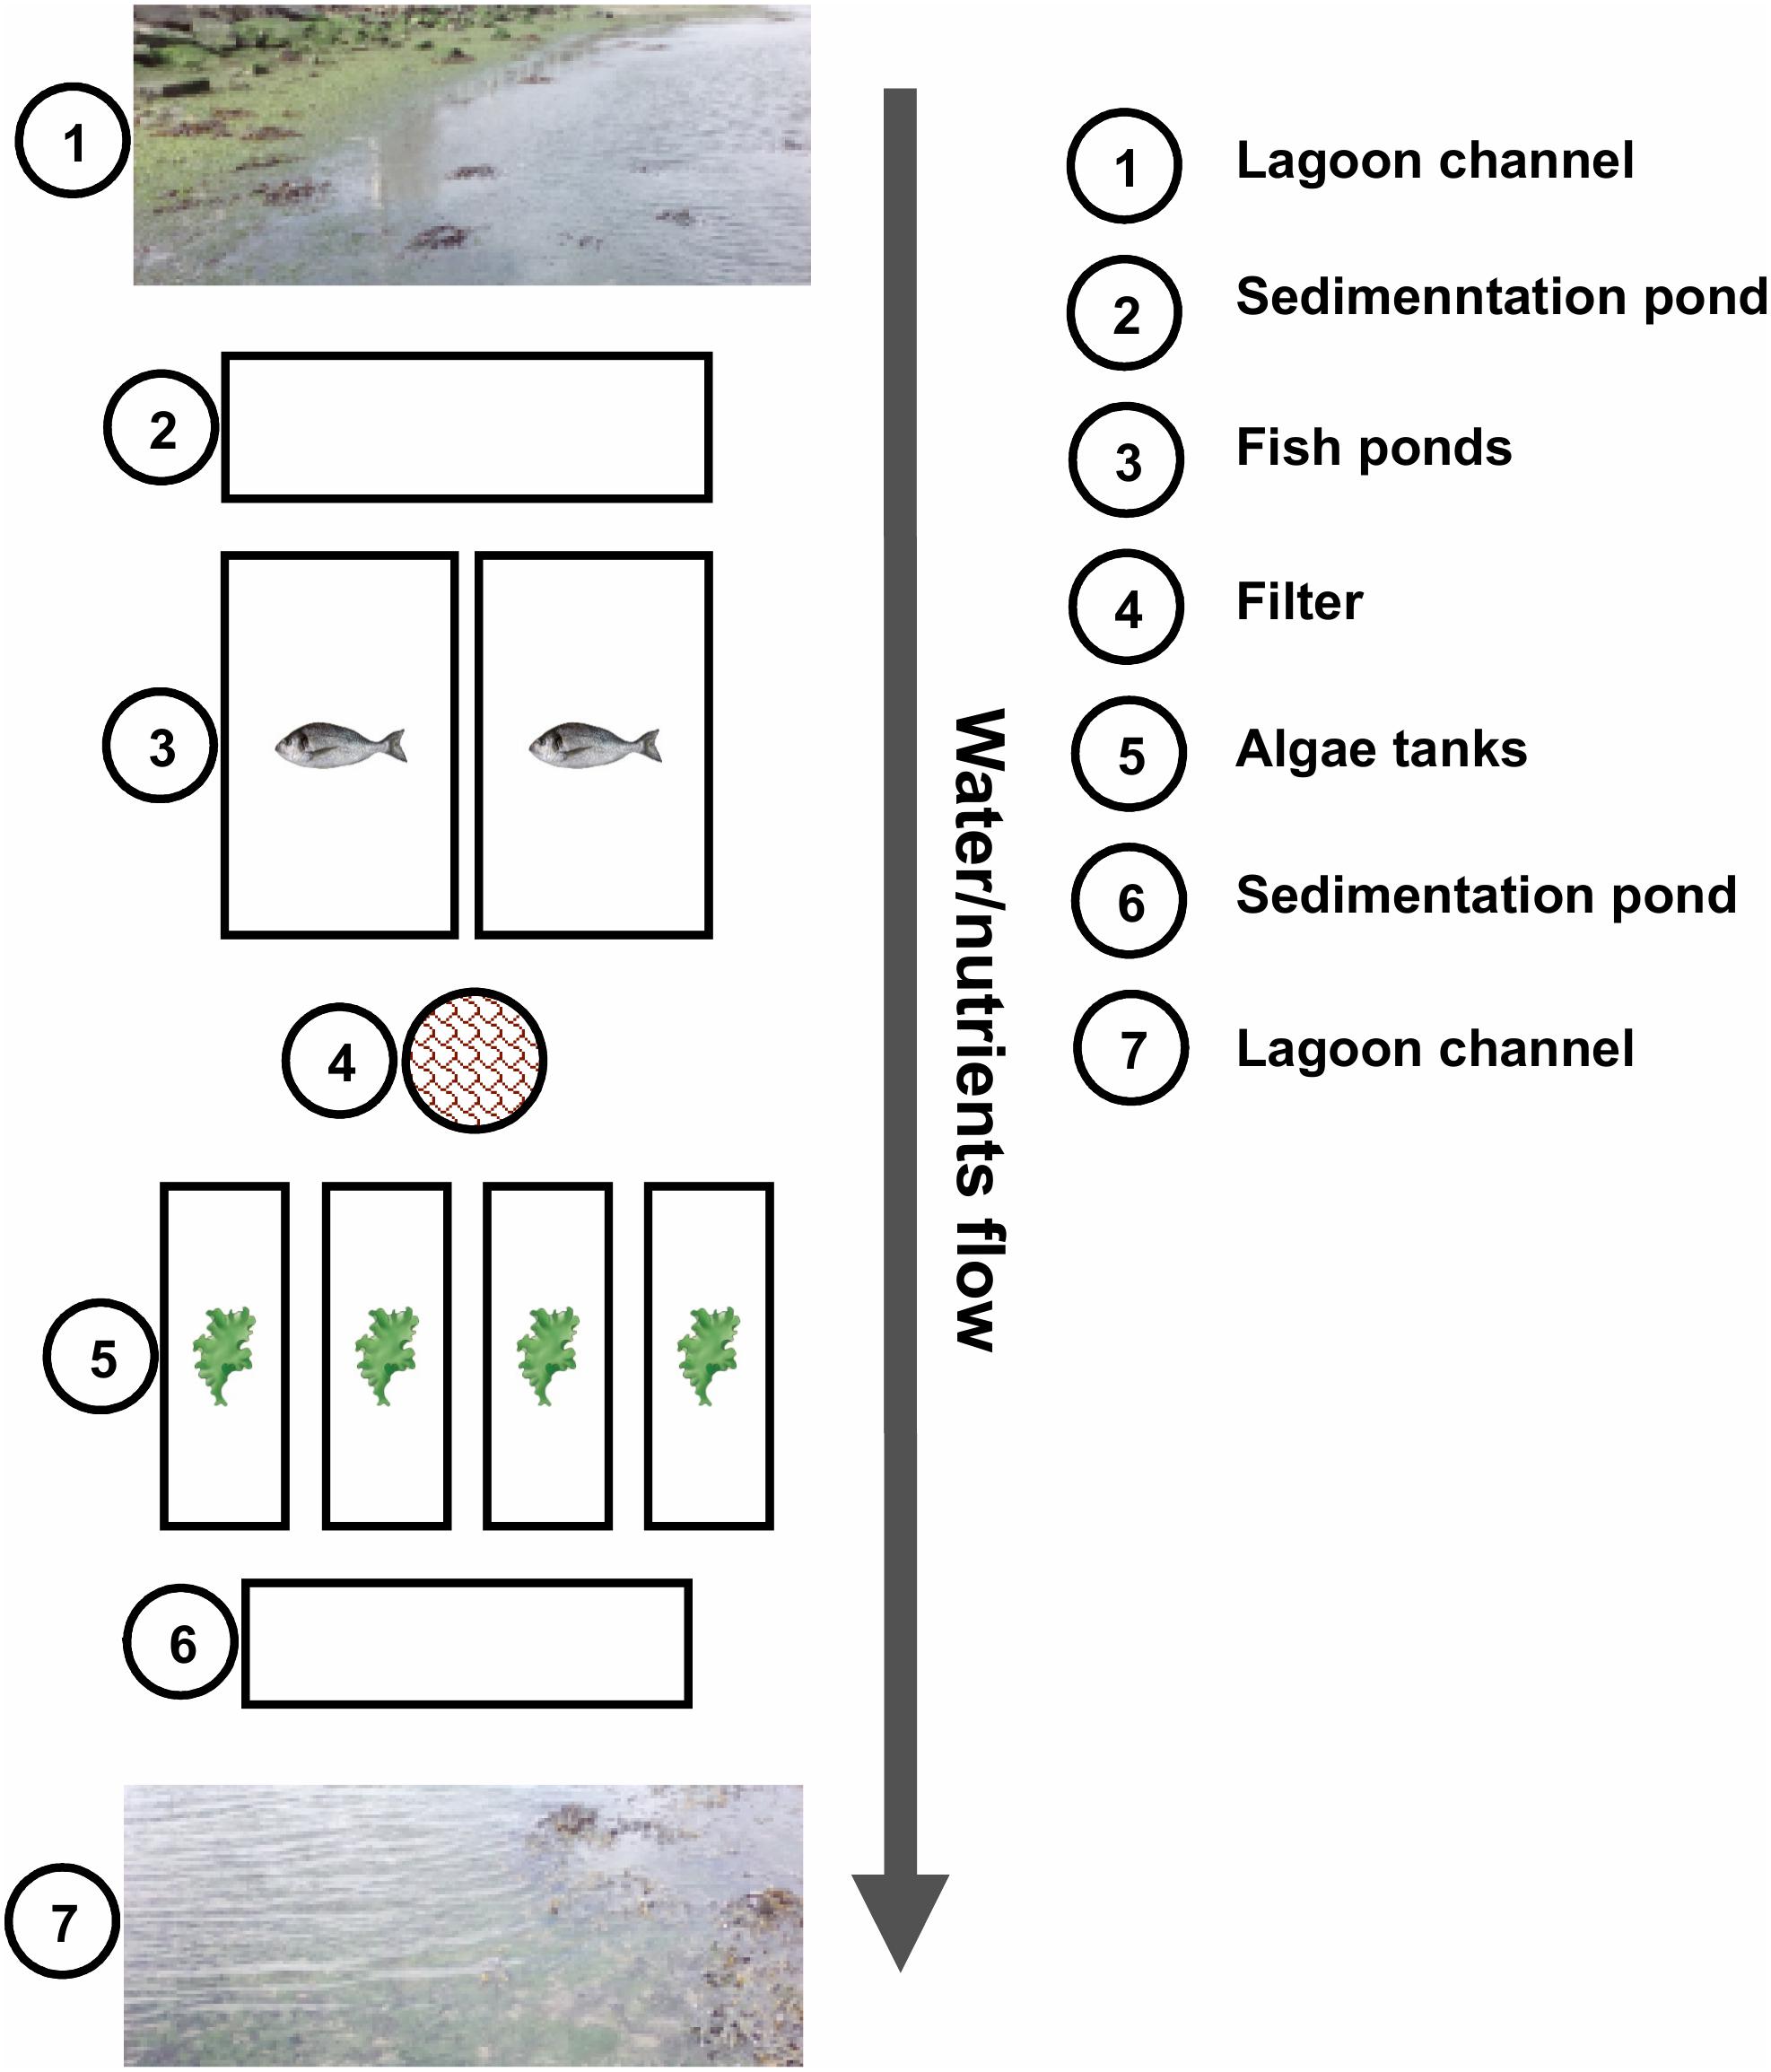
Figure 1. Schematic representation of ALGAplus production site. The image was taken and modified with permission from Ghaderiardakani et al. (2019) under the terms of the Creative Commons Attribution License (CC-BY). The scheme does not show the total number of macroalgae tanks of the company installation.
Sampling and DNA Extraction
For this study, 25 samples were collected, encompassing algal tissue and water samples from both the IMTA system and the Aveiro coastal lagoon (surrounding environment). Analyses of the lagoon samples were included to enable assessment of how the IMTA microbiome differs from the wild microbiome and determine the extent to which aquaculture and coastal lagoon water serve as the source of bacteria for seaweed-associated microbial communities in both settings. From the aquaculture system, algal (five biological replicates) and water (five biological replicates) samples were collected randomly from different tanks (independent samples) (Figure 1). Five water and 10 algal lagoon samples were further collected randomly from salt-marsh ponds and mainstream, along 1 km of the Boco River, which is the water source for the IMTA system. Two liters of water were collected into a 3 L sterile plastic bag (Ziploc®, SC Johnson, Germany) and transported in an insulated box to the laboratory. Under aseptic conditions, each seawater sample was passed through sterile 0.22 μm (pore size) mixed cellulose ester membrane filters (ME 24/21 ST, WhatmanTM/GE Healthcare, United States) using a vacuum pump. The filters were subsequently cut into small pieces and stored at −80°C until DNA extraction. Algae were also placed in Ziploc® bags containing surrounding water and transported as above to the laboratory. The algal tissue was then systematically checked for sessile organisms, which, if present, were carefully removed with a sterile scraper. The cleaned algal tissue was then rinsed three times in autoclaved artificial seawater (ASW: 23.38 g L–1 NaCl, 2.41 g L–1 MgSO4⋅7H2O, 1.90 g L–1 MgCl2⋅6H2O, 1.11 g L–1 CaCl2⋅2H2O, 0.75 g L–1 KCl, and 0.17 g L–1 NaHCO3) to remove unattached surface bacteria. Equivalent biomass of 200 mg of algal tissue was cut down into small pieces, rapidly frozen with liquid nitrogen and stored at −80°C until DNA extraction. The microbial metagenomic DNA was extracted using the DNeasy® Power Soil® Kit (QIAGEN®, Germany) according to the manufacturer’s protocol.
Furthermore, from each algal sample, extra tissue was collected for DNA extraction followed by molecular host species identification. Algal DNA was isolated with the GenEluteTM Plant Genomic DNA kit (Sigma–Aldrich, Germany) after a grinding step: 100 mg of algal tissue was frozen and ground using steel beads in a TissueLyser II apparatus (QIAGEN®, Germany) at maximum speed for 30″ twice, with each grinding step intercalated by a freezing step of 1 min in liquid nitrogen. The DNA quality was assessed with gel electrophoresis using 0.8% agarose gel, and DNA concentrations were quantified using a Qubit® 3.0 Fluorometer (Life Technologies, United States).
Algal Genotyping and Phylogenetic Analysis
Two short genetic markers that could discriminate between different species allowed to identify the algae via DNA barcoding. The first was the nuclear ribosomal internal transcribed spacer DNA (ITS rn DNA) (White et al., 1990), and the second was the chloroplast-encoded RuBisCo gene (rbcL). The nuclear primers used were ITS1 5′-TCCGTAGGTGAACCTGCGG-3′ and ITS4 5′-TCCTCCGCTTATTGATATGC-3′. This fragment contained, in the 5′ → 3′ direction, the ITS1 locus (internal transcribed spacer 1), the 5.8S rRNA gene (which is a non-coding RNA region of the large subunit of the eukaryotic ribosome), and the ITS2 locus (internal transcribed spacer 2) (White et al., 1990). The primers used to partially amplify the partial RuBisCo gene were SH F1 5′-CCGTTTAACTTATTACACGCC-3′ (forward) and SH R4 5′-TTACATCACCACCTTCAGATGC-3′ (reverse) (Heesch et al., 2009). Each PCR amplification consisted of PrimeStar GC Buffer (12.5 μL), DMSO (1.25 μL), dNTPs (2 μL at 2.5 mM of each one), primers (1 μL each at 10 mM), TAQ PrimeSTAR® GLX polymerase (0.25 μL) DNA template (0.5 μL), and ultrapure water (6.75 μL) for a total volume of 25 μL. Thermal cycling consisted of initial denaturation at 98°C for 10″, followed by 32 cycles of 98°C for 10″, 55°C for 10″, 72°C for 1′ 30″ and the final elongation step of 3′ 30″ at 72°C. Sanger sequencing was performed at GATC/Eurofins (Konstanz, Germany) using the forward primer. The obtained sequences were uploaded into the MEGA (version 7.0.4) software (Kumar et al., 2016) together with the closely related sequences available on the NCBI database and aligned using the Muscle (default parameters) algorithm (Edgar et al., 2004). Low-quality nucleotides and reads were discarded before the phylogenetic analyses. Sequences were truncated for a final length of 283 nucleotides for the ITS marker and 478 nucleotides for the rbcL marker. Phylogenetic trees were obtained with MEGA 7 and were inferred with the maximum-likelihood (ML) method using the general time reversible (GTR) model. The trees with the highest log likelihood (−1025.73 for rbcL and −941.5 for ITS) were plotted (Figure 2). The raw sequences were deposited in GenBank under the following accession codes: MN444712–MN444720 (ITS sequences) and MN450419–MN450427 (rbcL sequences).
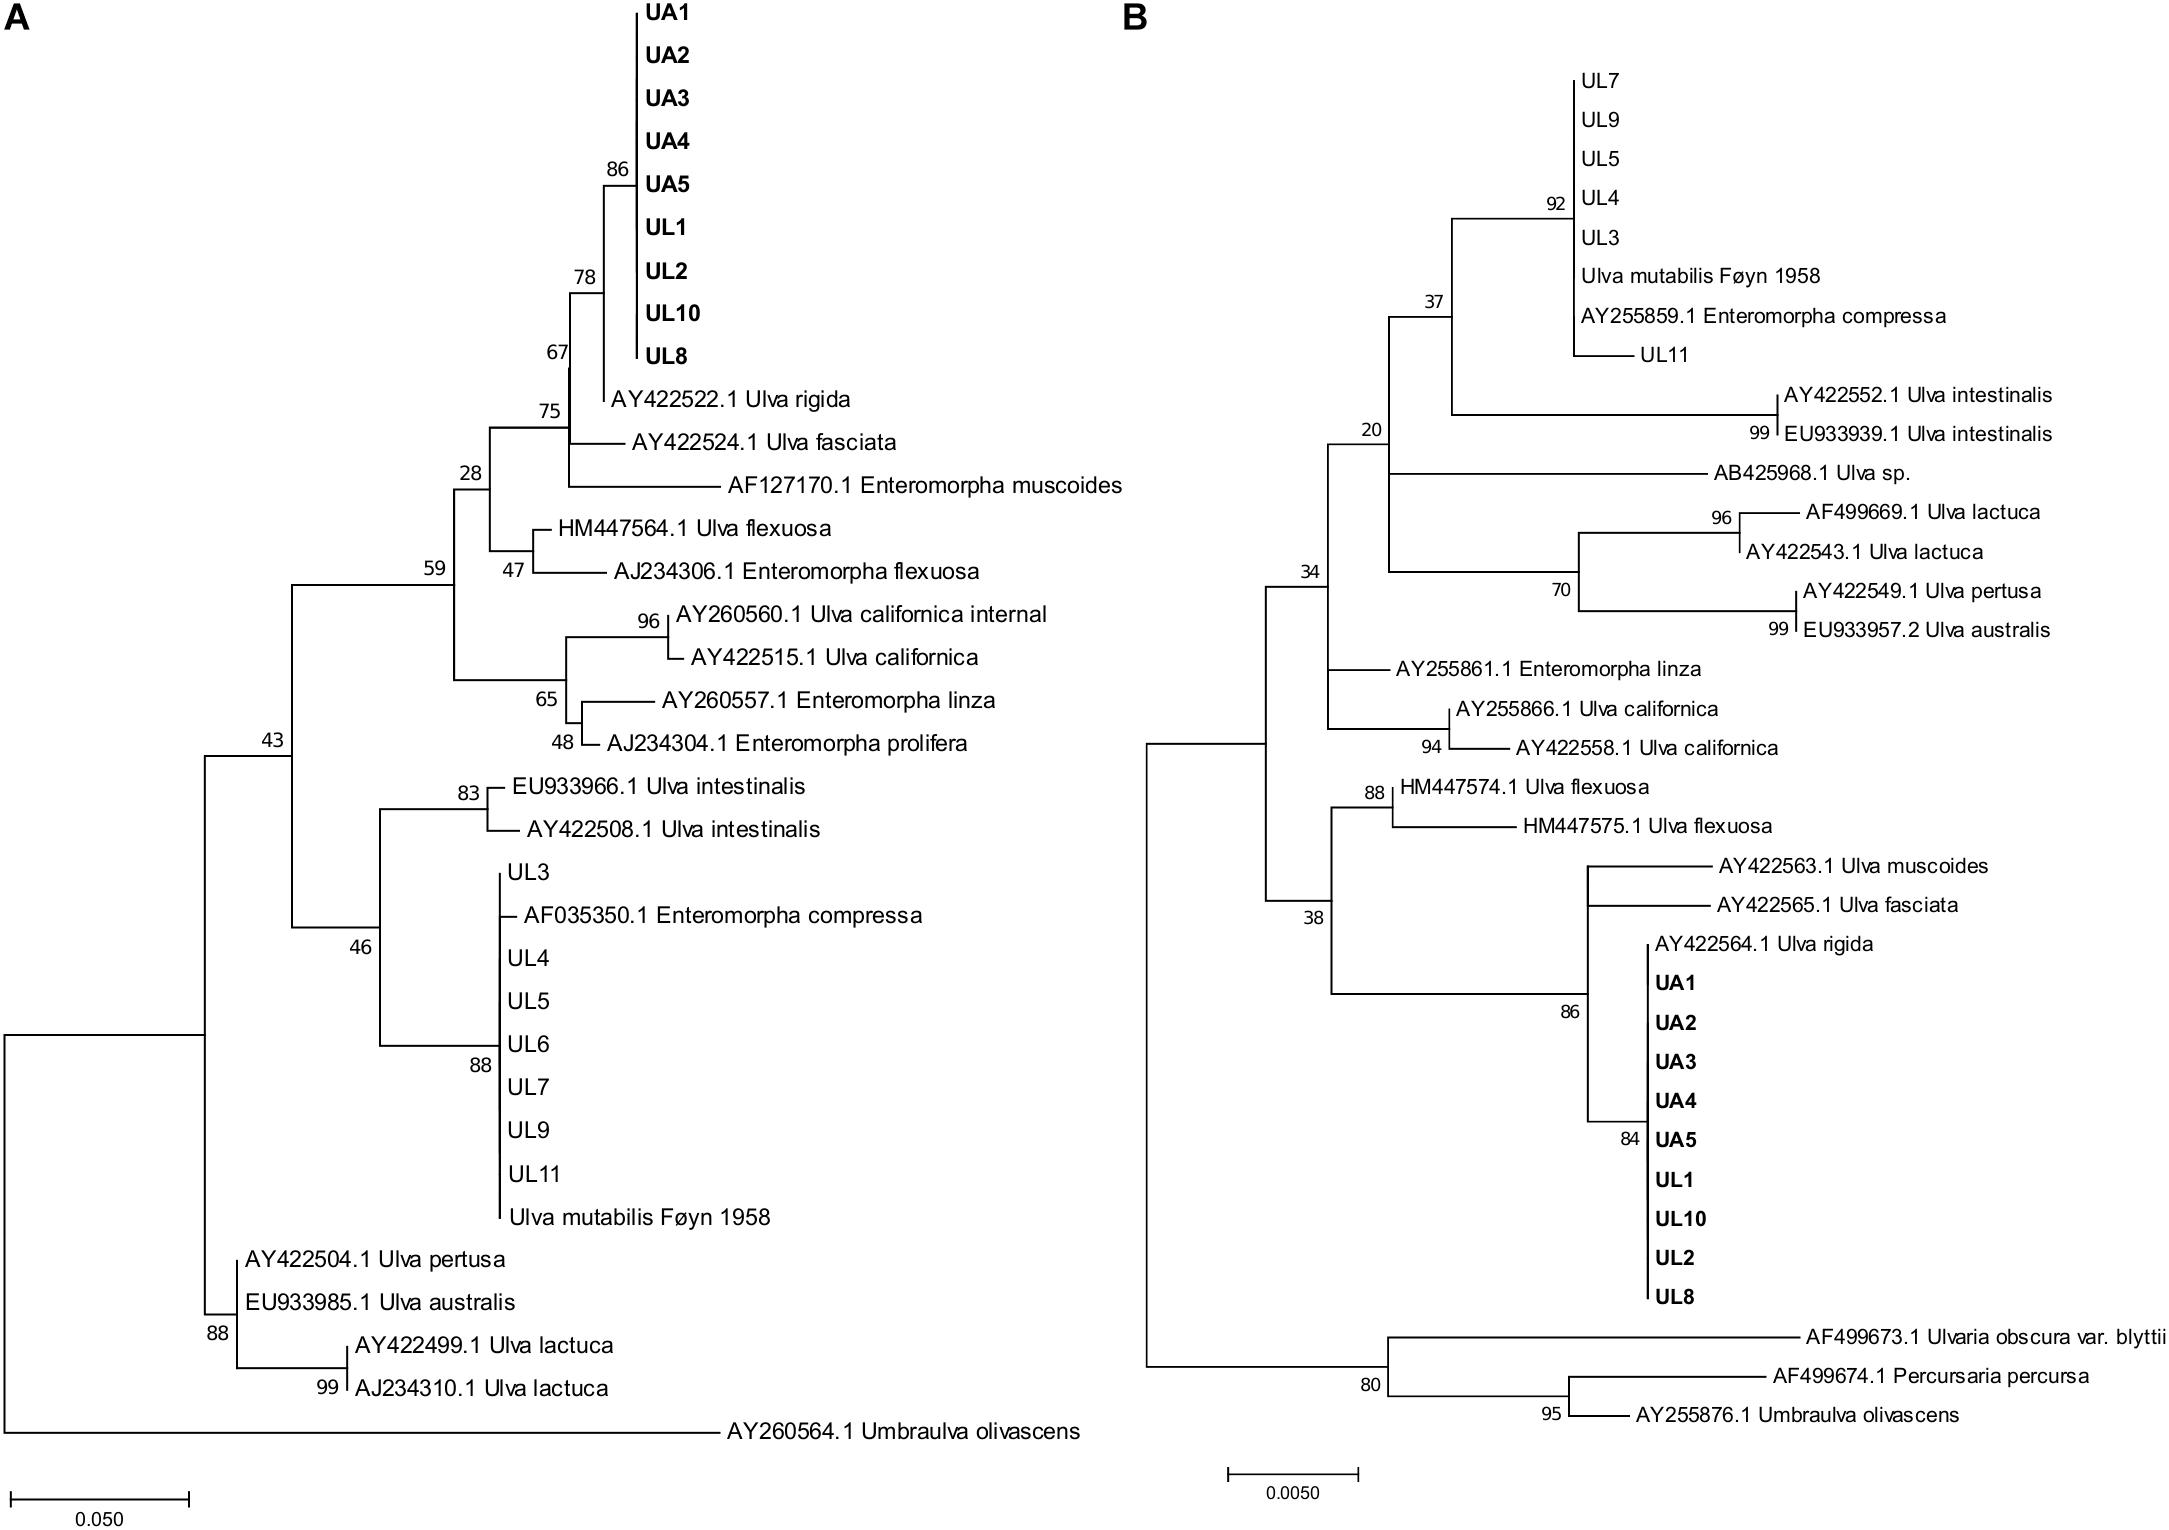
Figure 2. Maximum-likelihood phylogenetic trees of ITS (A) and rbcL (B) DNA fragments. The trees are drawn to each independent scale, with branch lengths measured in the number of substitutions per site; the numbers at nodes refer to bootstrap values (1000 replication). For the ITS fragments tree (A) the analysis involved 34 sequences and 283 nucleotides positions. For the rbcL fragments tree (B) the analysis involved 35 sequences and 478 nucleotide positions. UL, Ulva specimens analyzed in this study from coastal lagoon; UA, Ulva specimens analyzed in this study from aquaculture tanks. Type strain “Ulva mutabilis (Føyn)” is still available in culture. Strains in bold were selected for microbiome analysis. The original names in the database were retained.
Microbiome Analysis
Metagenomic DNA samples with high quality and sufficient concentration were used to generate 16S rRNA gene amplicons by next-generation sequencing. For algal samples, only those identified as U. rigida by DNA barcoding were selected. As a result, four replicates from Ulva specimens reared in aquaculture, four from aquaculture water, four from lagoon water, and five replicates from wild Ulva specimens were used for microbiome taxonomic profiling, summing up 17 samples in total. For the microbiome analyses, the V4 hypervariable region (515–806) of the 16S rRNA gene was amplified at MR DNA1 (Shallowater, TX, United States) using the primers 515F (5′-GTG CCA GCM GCC GCG GTA A-3′) (Caporaso et al., 2011) and 806RB (5′-GGA CTA CNV GGG TWT CTA AT-3′) (Apprill et al., 2015) and the sequencing was performed on an Illumina MiSeq platform to generate paired-end sequences of 300 bp in length.
The microbiome data analyses were performed almost entirely using QIIME 2 (Quantitative Insights into Microbial Ecology) (Bolyen et al., 2019). Fastq files were converted with “fastqprocessor” to be imported into QIIME 2. Quality control was performed on demultiplexed sequences with “DADA2” software (Callahan et al., 2016), which filters low-quality and chimeric sequences and allows sequence trimming on forward and reverse reads. Within this step, forward and reverse reads were merged, obtaining fragments ranging from 213 to 345 nucleotides, with 91% of the reads being 254 nucleotides long. Sequences were grouped by 100% similarity generating unique exact Amplicon Sequence Variants (ASVs). Taxonomy was assigned to ASVs using the pre-trained Naive Bayes classifier on the SILVA database (Silva_132_99% OTUs for V4 region 515–806) and the “q2-feature-classifier” plugin (Pedregosa et al., 2011; Bokulich et al., 2018) (“scikit-learn” version: 0.20.2). ASVs <70% identity were considered as unclassified at the domain level and not included in the final classification. Features identified as Eukaryota, chloroplasts, and mitochondria were present in different amounts across the samples (Table 1) and removed from further analyses. The entire dataset can be retrieved from ENA (European Nucleotide Archive) through the following URL: http://www.ebi.ac.uk/ena/data/view/PRJEB34347.
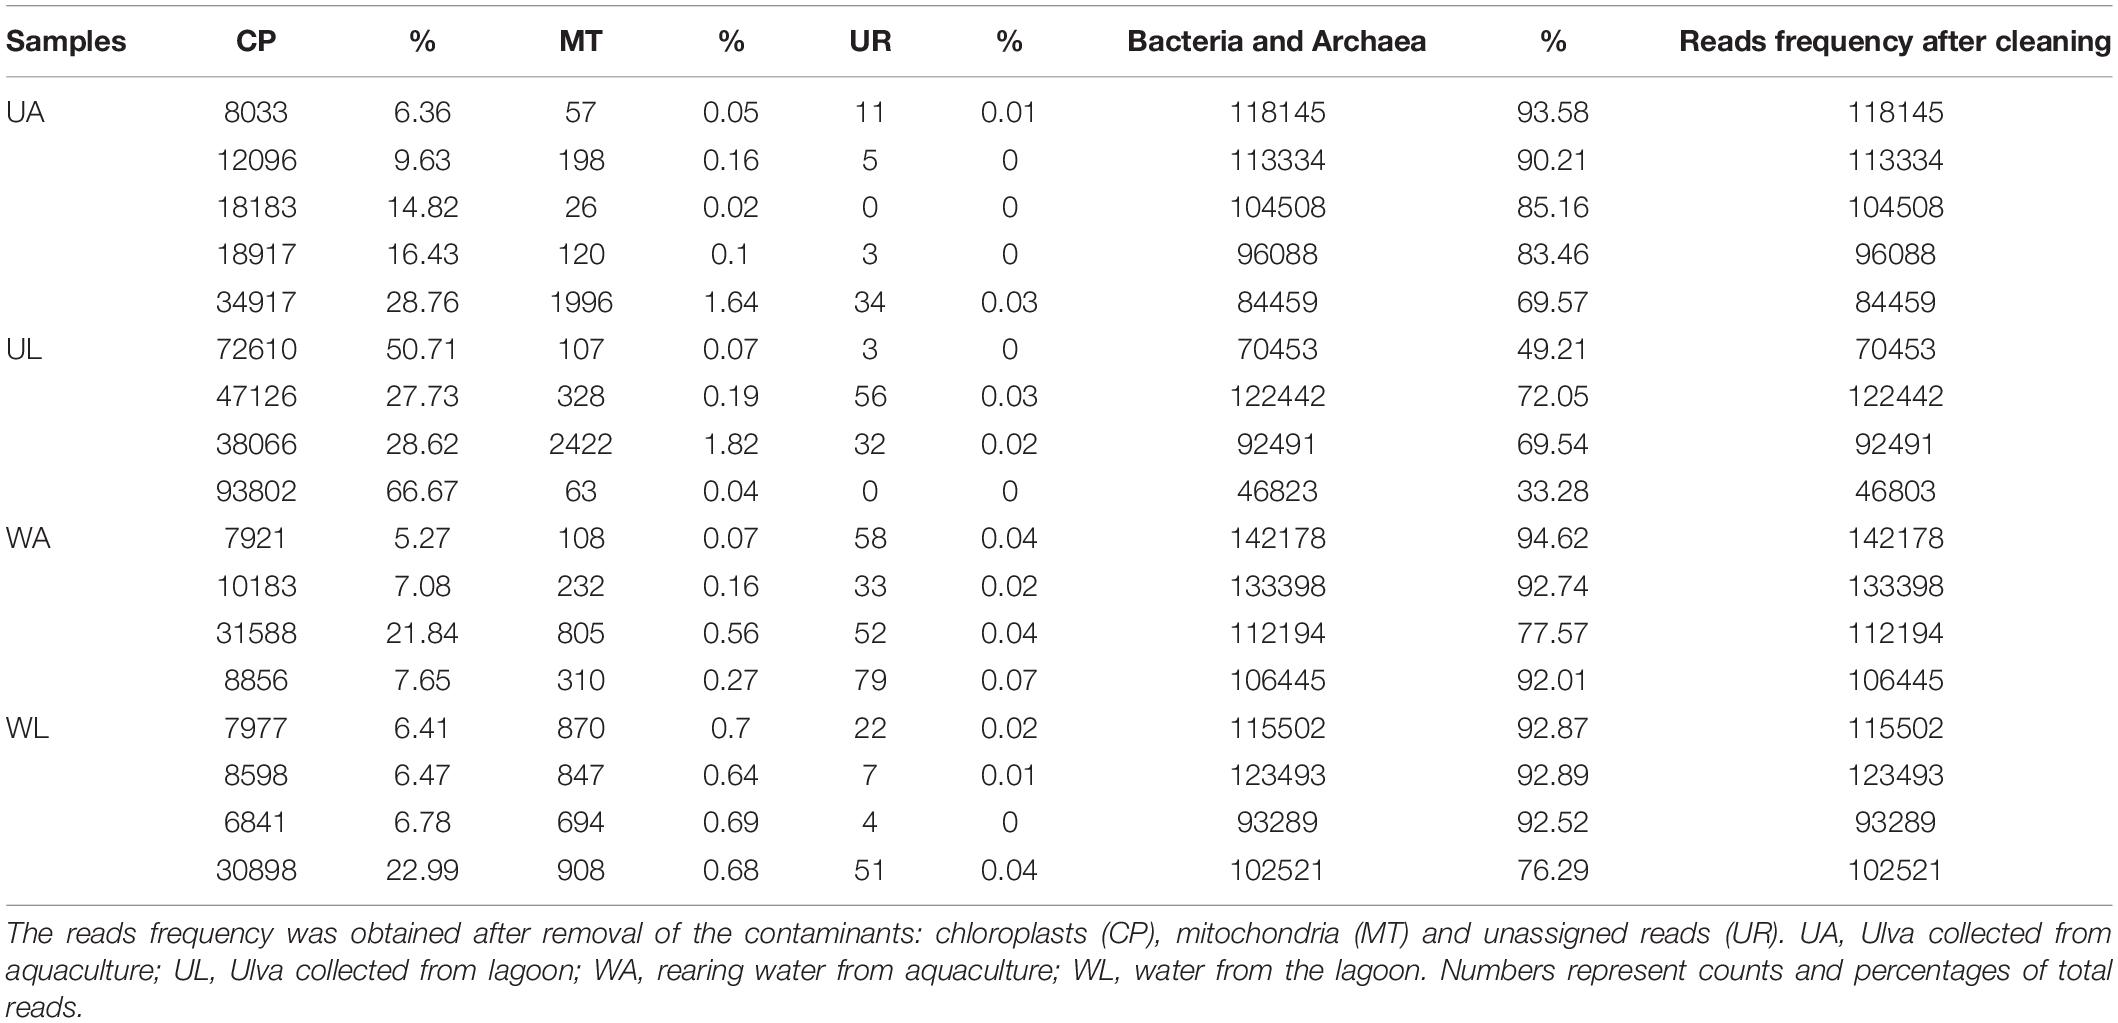
Table 1. Overview of contaminations in the reads after taxonomic assignment.
Microbiome Statistical Analyses
To determine whether the microbial community structure and composition shift across the microhabitats inspected, in this study, we performed the following analyses: (1) Estimation of bacterial species richness (CHAO1) and diversity (Shannon index) based on a rarefied (46803 reads) dataset: microhabitats have been tested for differences in estimated richness with the Kruskal–Wallis significance test for all pairwise combinations. (2) Beta diversity assessment performed with Bray–Curtis metrics and Unweighted and Weighted Unifrac (Lozupone and Knight, 2005; Lozupone et al., 2011): the resulting distance/dissimilarity matrices were then subjected to ordination using principal coordinate analyses (PCoA). The results were cross-validated with Permanova (999 random permutations) (Anderson, 2001; Anderson and Walsh, 2013). Phylogenetic analyses were performed to obtain unweighted and weighted UniFrac matrices. To this end, sequences were aligned with mafft, and ambiguous and uninformative bases were masked. The fast-tree software was used to infer the approximately ML unrooted tree, and the root was found from the midpoint (QIIME2 default). (3) Assessment of taxonomic composition, which was carried out at three different classification levels: phylum, class, and genus. The features (or ASVs) with a total (over the whole dataset) frequency <5000 reads (0.5%) for the Class level and 14000 reads (1.3%) for the genus level were summed up in a unique group (“others”). (4) Determination of differentially abundant groups, at every taxonomic level, between lagoon and aquaculture settings for both algal and water samples: for this purpose, we used the ANCOM software (Mandal et al., 2015), which bases its algorithms on compositional analyses (Gloor and Reid, 2016) instead of absolute counts. A pseudocount of one was added to the count table to return valid values from the following log transformation. ANCOM compares the log ratio of the abundance of each taxon to the abundance of all the remaining taxa one at a time, and the Mann–Whitney U-test was then calculated on each log ratio (Mandal et al., 2015; Weiss et al., 2017b). This strategy avoids the increase of false negatives (lower sensitivity) caused by rarefying normalization as well as false positives generated by comparing abundances directly across samples (McMurdie and Holmes, 2014; Weiss et al., 2017b). For tasks (3) and (4), the whole dataset, not size-normalized, was used. For this purpose, the dataset was split according to sample type (water and algae) and collapsed at the taxonomic level, as mentioned before. (5) Unique and shared taxa (at “species”-level) of the non-rarefied dataset with and without low abundance taxa (ASVs with <10 reads across the whole dataset) between microhabitats were described with the “UpSet” (visualizing intersecting sets) diagram using the “R-bioconductor” package “UpSetR” (Lex et al., 2014). (6) Bacterial taxa with specific characteristics that were not highlighted by the ANCOM analyses were searched for in the ASVs table in order to look for the presence/absence of specific patterns. Nine taxa, with known morphogenetic bioactivity (active) and two negative controls (not inducing morphogenesis – inactive) (Grueneberg et al., 2016; Ghaderiardakani et al., 2017) were selected and tested for differences in abundance using the t-test. The absolute abundance values were Hellinger-transformed.
Results
Ulva Species Identification
The genus Ulva shows high morphological plasticity. Therefore, visual field identification is not sufficient to discriminate between species. Indeed, from the same morphology (lettuce-like flattened blades were identified during the collection), two monophyletic assemblages were obtained from the phylogenetic analysis (Figure 2), one associated with U. rigida reference sequences (ITS-AY422522.1, rbcL-AY422564.1) and the other with U. compressa (ITS-AF035350.1, rbc-L-AY255859.1). Gene phylogenies (ITS and rbcL) were congruent, resulting in similar tree typologies and corresponding phylogenetic clades. Only macroalgal samples that affiliated with the U. rigida phylogenetic clade (Figure 2) were considered for further microbiome analysis: five aquaculture samples (UA: Ulva Aquaculture) and four lagoon samples (UL: Ulva Lagoon).
Diversity of the Microbial Community
Alpha Diversity
Diversity indices were calculated for each sample, and the median values of the four microhabitats were plotted (Figure 3). CHAO1 richness estimates were highest in rearing water samples (833.5 ± 117.4) and significantly differed (q-value ≤ 0.05) from the estimates obtained for the lagoon water and, as expected, from the algal surface in both wild and aquaculture conditions (Figure 3A). In both alpha diversity tests (CHAO1 estimation and Shannon index), wild Ulva specimens (UL) showed the lowest value, but at the same time, also the largest variability (broadest standard deviation) within biological replicates. Unexpectedly, aquaculture samples (both water and Ulva tissue) displayed higher diversity and richness than the corresponding samples from the lagoon.
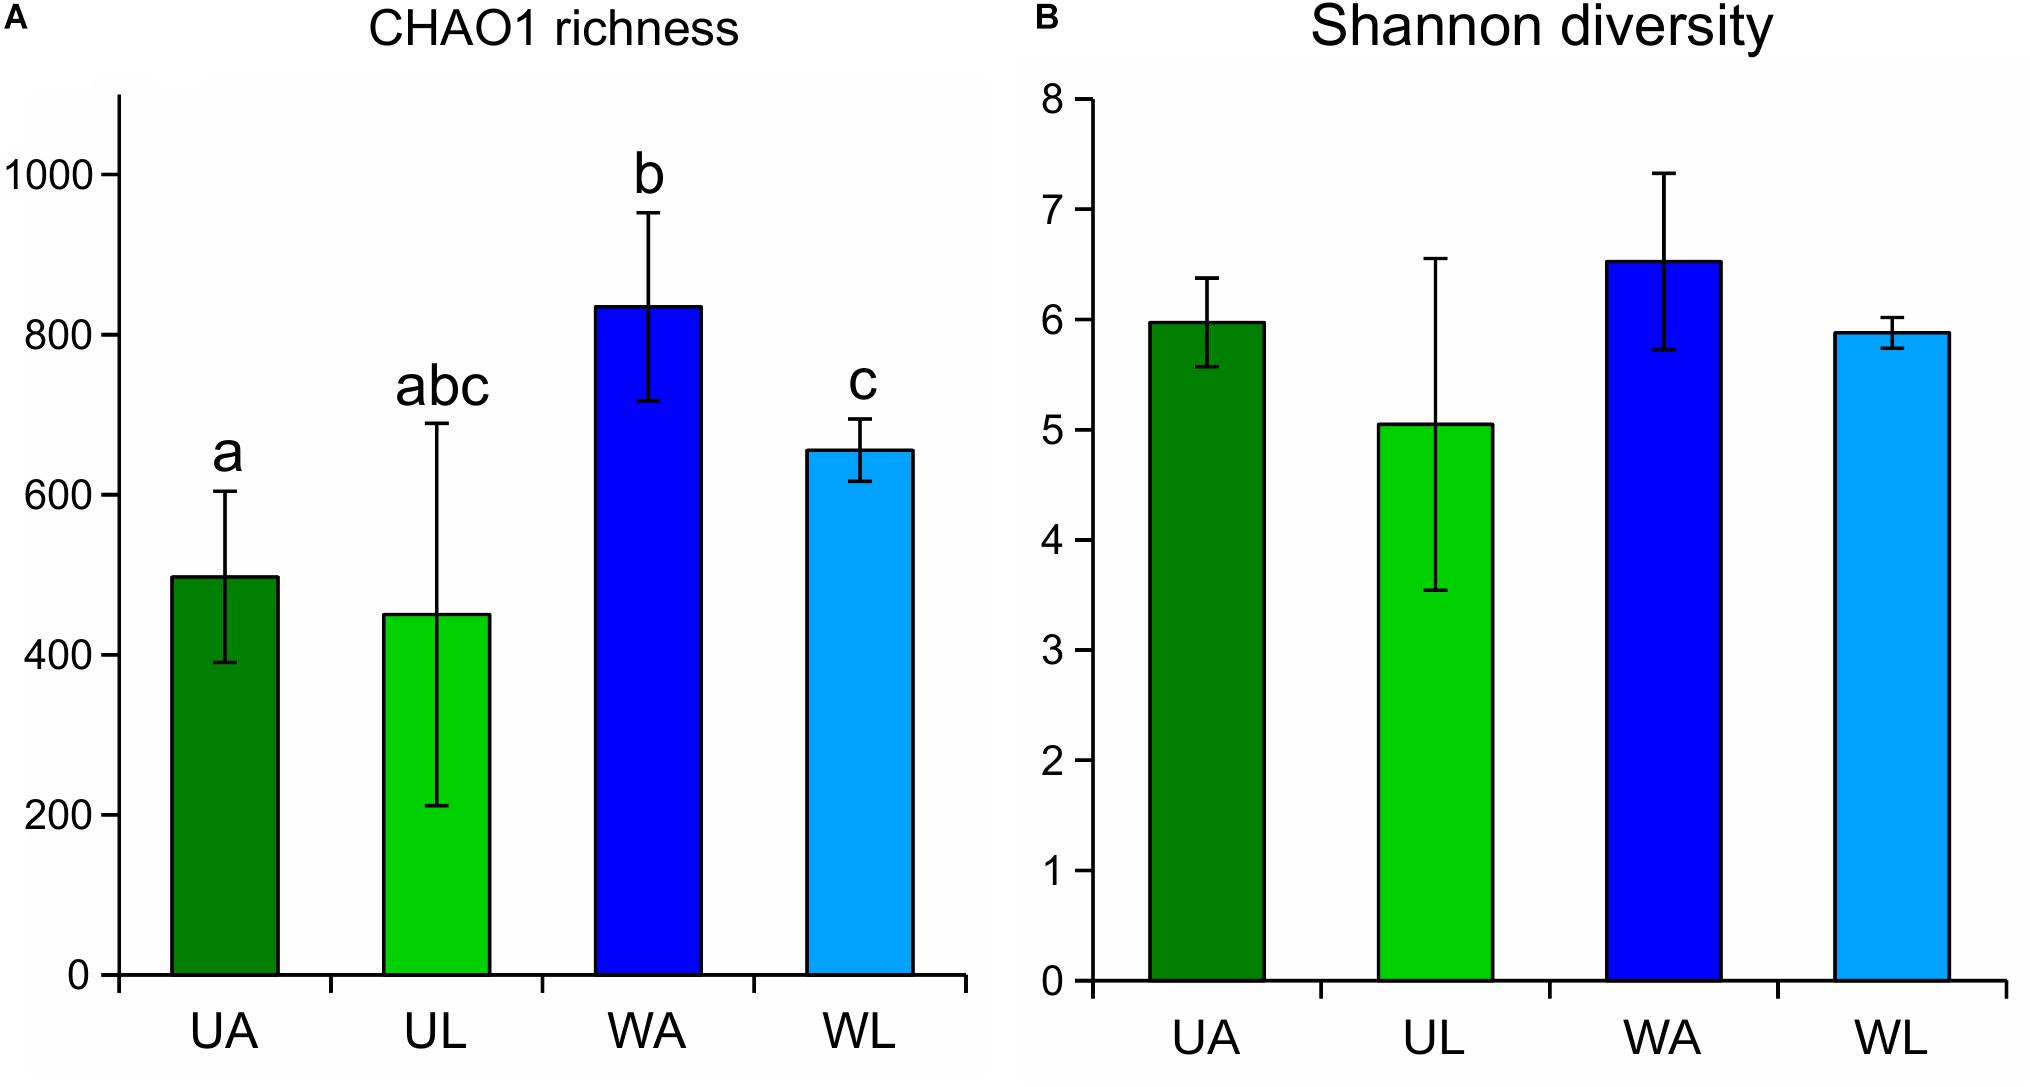
Figure 3. CHAO1 richness estimates (A) and Shannon diversity index (B) obtained for Ulva-associated and surrounding water microbiomes based on 16S rRNA gene. Estimates obtained for Ulva-associated (UL, Ulva from lagoon; UA, Ulva from aquaculture) and water samples (WL, water from lagoon; WA, water from aquaculture) prokaryotic communities are shown with corresponding standard deviation (error bars). Significant differences (p-value ≤ 0.05) between microhabitats are highlighted by different letters on top of the bars.
Similarly, water samples (both from aquaculture and lagoon) always displayed higher values of both alpha diversity tests than corresponding Ulva samples, although the difference was less pronounced. Differences in p-values were confirmed by the corrected q-values (Table 2). The Shannon diversity index considered both the species richness (e.g., number of ASVs) and the evenness (how evenly the sequences are distributed between species) of any given sample, being communities with higher dominance of few species less diverse than communities with higher evenness for any pair of communities sharing the same richness. In this study, Shannon diversity indices displayed similar patterns as those described above for the CHAO1 richness estimate, although the observed difference across the microhabitats was found not to be significant after Kruskal–Wallis tests were performed (Figure 3B and Table 2).
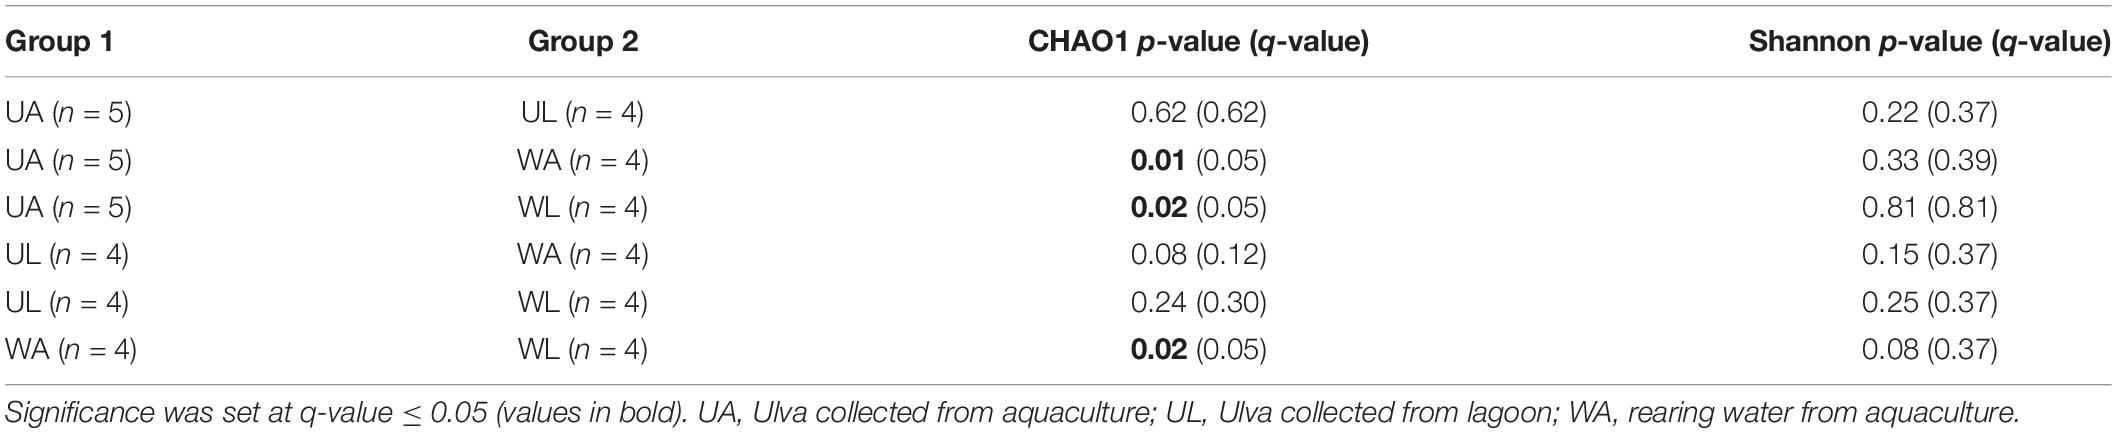
Table 2. Kruskal–Wallis pairwise tests on alpha-diversity indexes obtained for all combinations of samples.
Beta Diversity
With the ordination of the Bray–Curtis dissimilarity matrix, the two main axes (51 and 18%, the first and second axis, respectively) described 68% of the total variability in the dataset. The clustering into the four groups corresponded to the origin (i.e., microhabitats) of the sampling (Figure 4) supported by the statistical test (Permanova test: q-value ≤ 0.05) (Table 3). Unweighted UniFrac measured the phylogenetic distance between sets of taxa in a phylogenetic tree as the fraction of the branch length of the tree. The clustering was consistent with the Bray–Curtis matrix (Permanova test: p-value ≤ 0.05) (Table 3). Along the most explanatory axis, water lagoon samples were separated from the rest of the samples. Since this analysis solely considers the presence/absence of the ASVs, the differences between groups are mostly given by the number of low abundance ASVs (1% of abundance – in this case, reached 98% of the total ASVs classified at species level) that are present in the samples. Using the weighted UniFrac metric, algal and water samples were separated into two groups along this axis (Permanova test, q-value ≤ 0.05) (Table 3). Although cultivated and lagoon Ulva samples, on one side of the principal coordinate, and aquaculture and lagoon water samples, on the other side, were close together, all performed comparisons were statistically different (Permanova test, q-value ≤ 0.05) (Table 3). The variations among the most abundant ASVs could discriminate between microhabitats. Altogether, these results motivated further exploration of the differences in taxonomic composition between aquaculture and lagoon samples.
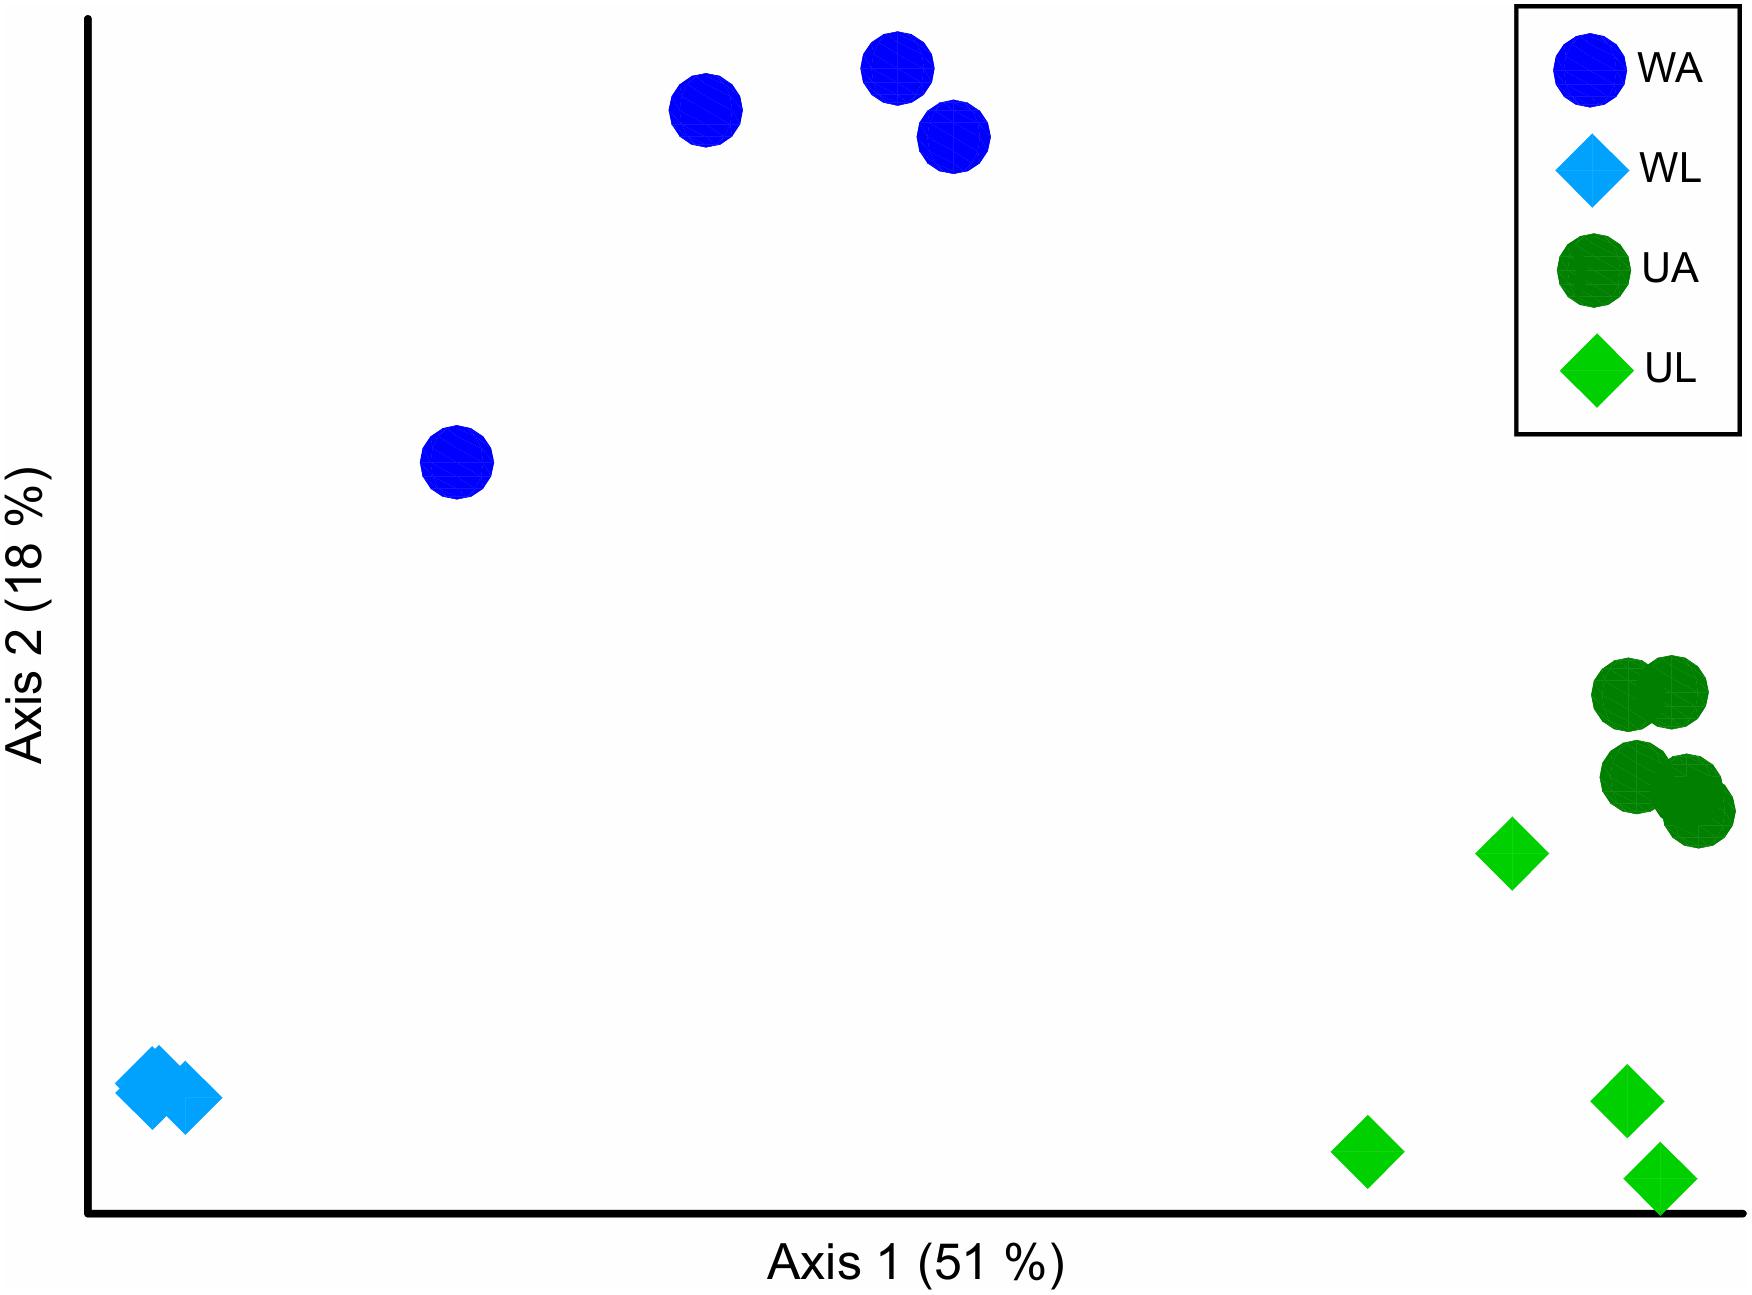
Figure 4. Beta diversity analysis in ordination plot (PCoA) of the Bray–Curtis dissimilarity matrix, of bacterial communities associated with Ulva [UA, Ulva from aquaculture (dark green circles); UL, Ulva from lagoon (light green diamonds)] and in seawater [WA, water from aquaculture (dark blue circles); WL, water from lagoon (light blue diamonds).
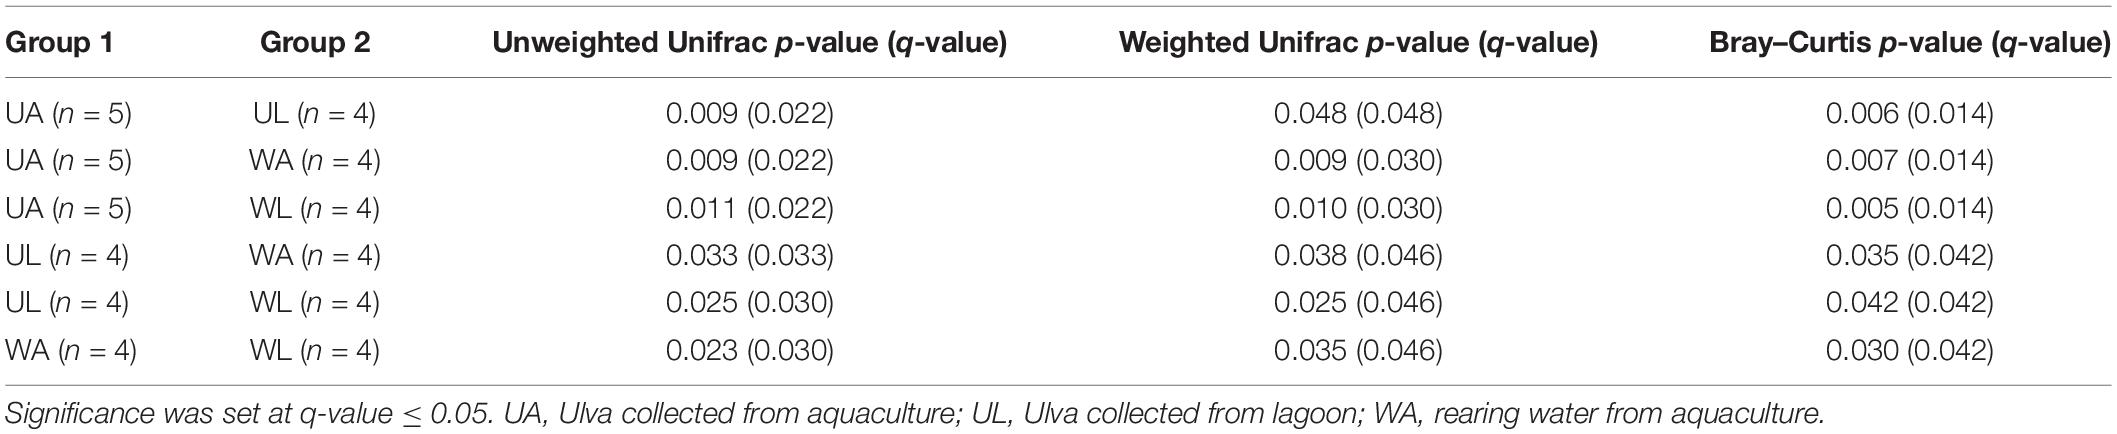
Table 3. Multiple pairwise Permanova (999 permutations) tests on beta-diversity indices obtained for all combinations of samples.
Taxonomy
The dataset, with 28 bacterial phyla, consisted of four phyla accounting for >95% of the total ASVs abundance in the following order: Proteobacteria, Bacteroidetes, Actinobacteria, and Planctomycetes. Proteobacteria and Bacteroidetes were showing two opposite trends in the comparison between water and algal samples: Proteobacteria were more abundant in algae (85%, mean value) than in water (63%) while Bacteroidetes were prominent in water samples (52%) rather than in algal samples (10.8%). In the comparison between aquaculture and lagoon, Proteobacteria abundance varied between 54% (mean value) for aquaculture water and 72% for lagoon water. It was also valid for the algal tissue to a lesser extent (86% for UA and 83% for UL), but still significant (Figure 5A and Table 4).
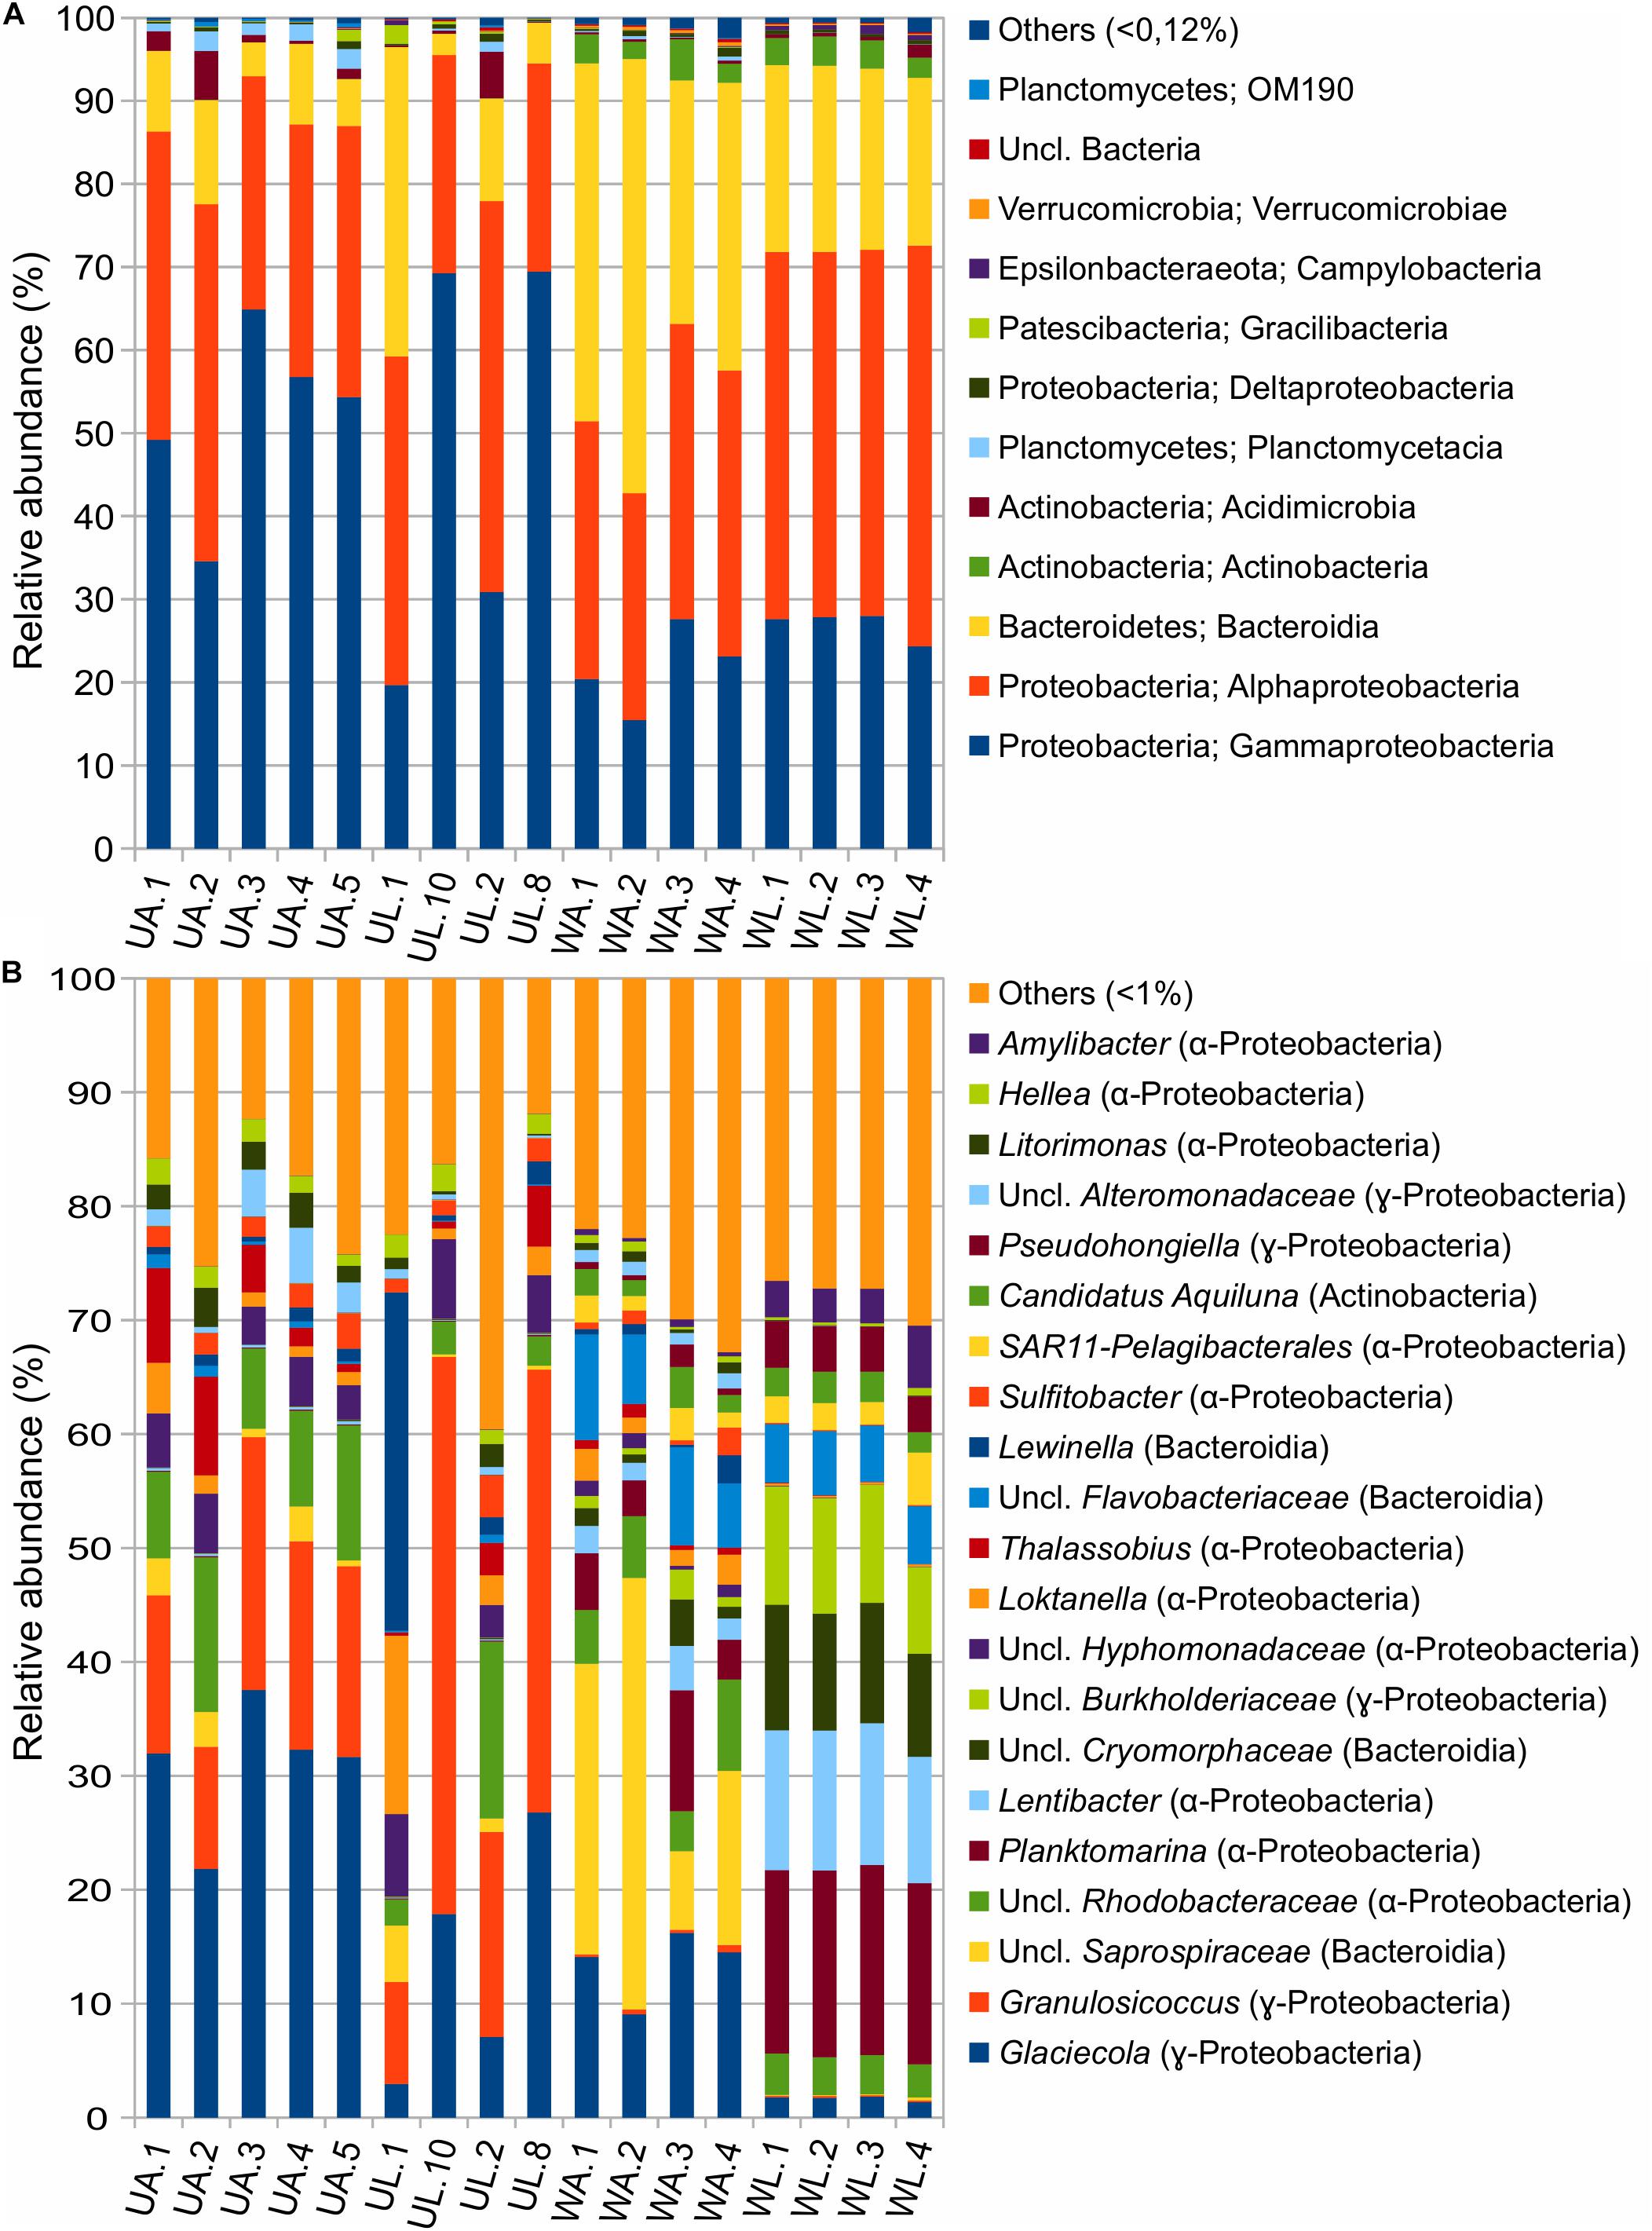
Figure 5. Taxonomic composition of prokaryotic communities associated with Ulva (UA, Ulva from aquaculture; UL, Ulva from lagoon) and in seawater (WA, water from aquaculture; WL, water from lagoon) at (A) class and (B) genus levels.
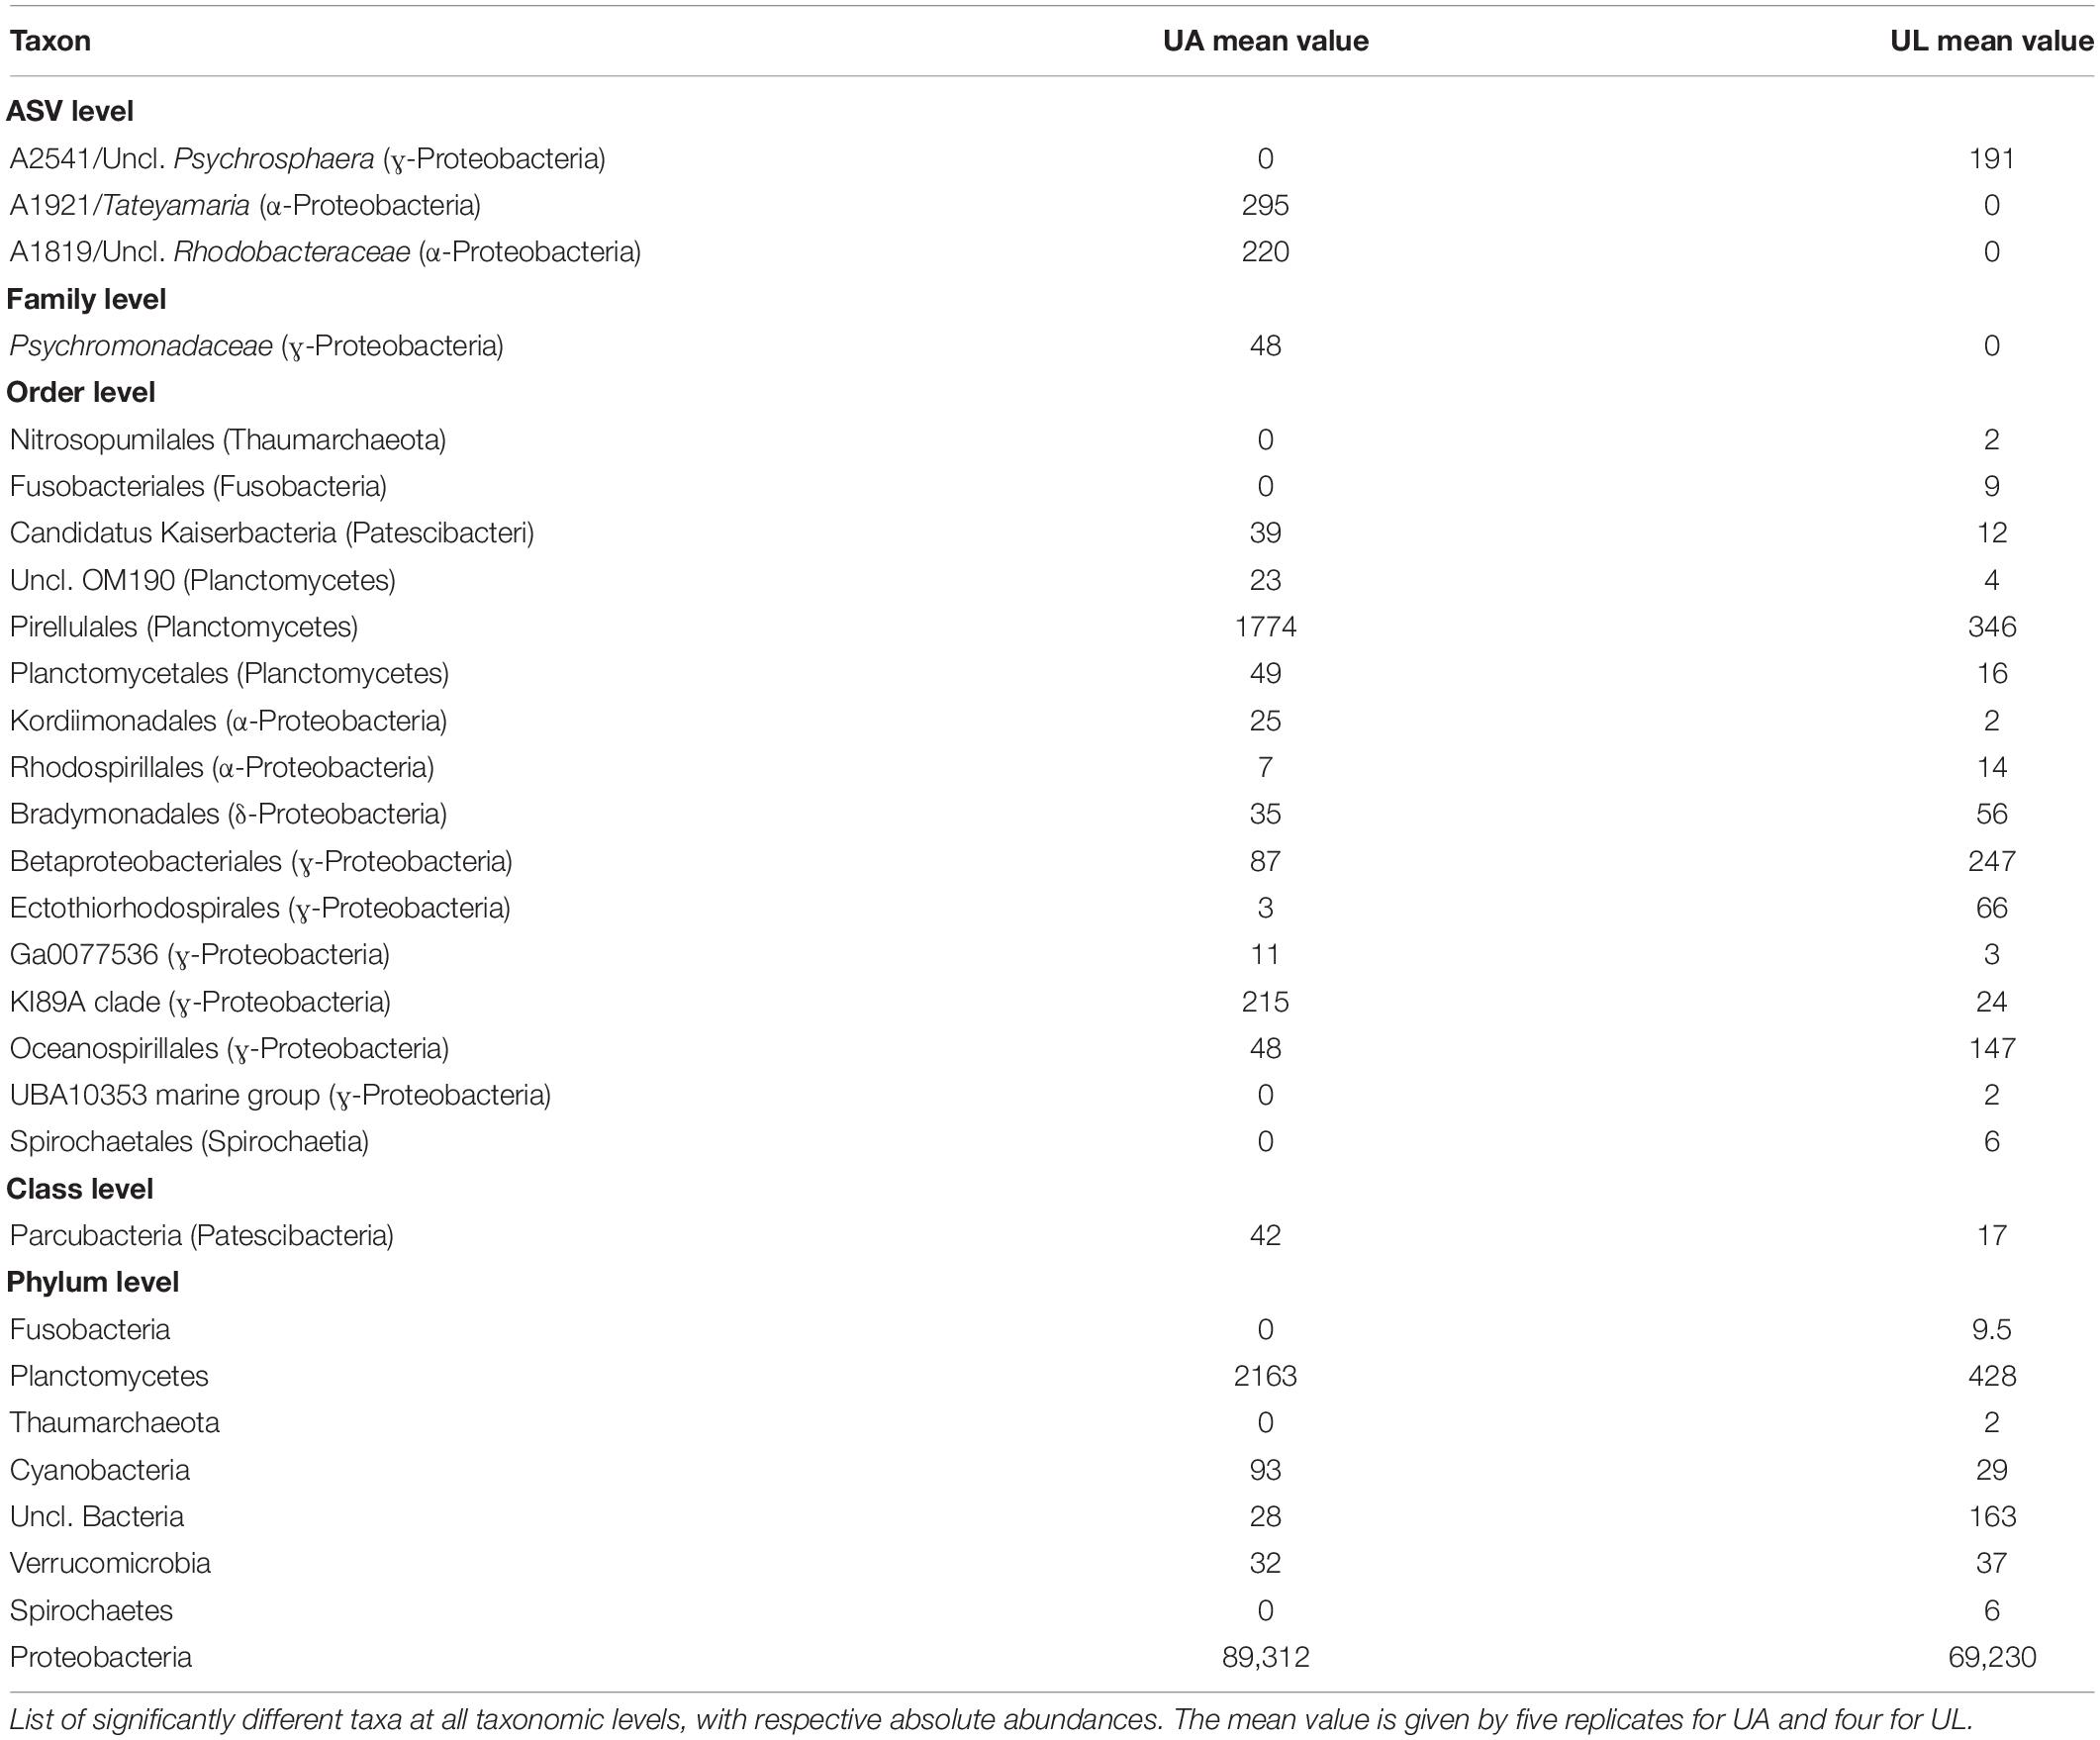
Table 4. ANCOM analysis of the comparison within Ulva’s microenvironments (UA, Ulva collected from aquaculture, versus UL, Ulva collected from the lagoon).
Also, the ANCOM testing revealed that Planctomycetes, Cyanobacteria, and Verrucomicrobia were significantly more abundant in reared than wild Ulva specimens. The classes Alpha- and Gamma-proteobacteria dominated the dataset with different preferences (Tables 4, 5). While Alphaproteobacteria showed higher abundances in lagoon water than in the other three microhabitats, Gammaproteobacteria appeared with higher abundance in Ulva-associated communities than in the respective water samples. Bacteroidetes (with Bacteroidia being the most abundant class) were more commonly present in aquaculture (41%) than in lagoon waters (22%), where the variation across replicates was remarkably low. In reared Ulva, <10% of the obtained reads were classified as Bacteroidia, while in lagoon Ulva, due to the high variability across replicates, one sample reached 30% abundance. The class Actinobacteria was more abundant in water (3%) than in Ulva samples (0.01%) (for both environments), but as an exception from the rule, Acidimicrobiia (belonging to Actinobacteria phylum) was more abundant in Ulva than in water samples. The class Planctomycetacia was found in all microhabitats but with a higher presence in association with cultivated Ulva (2%) than in all other tested microhabitats, where its relative abundance did not overcome 0.4%. The classes Deltaproteobacteria and Verrucomicrobiae showed higher prevalence in aquaculture water samples (0.36%) than in other samples where they reached similar abundances.
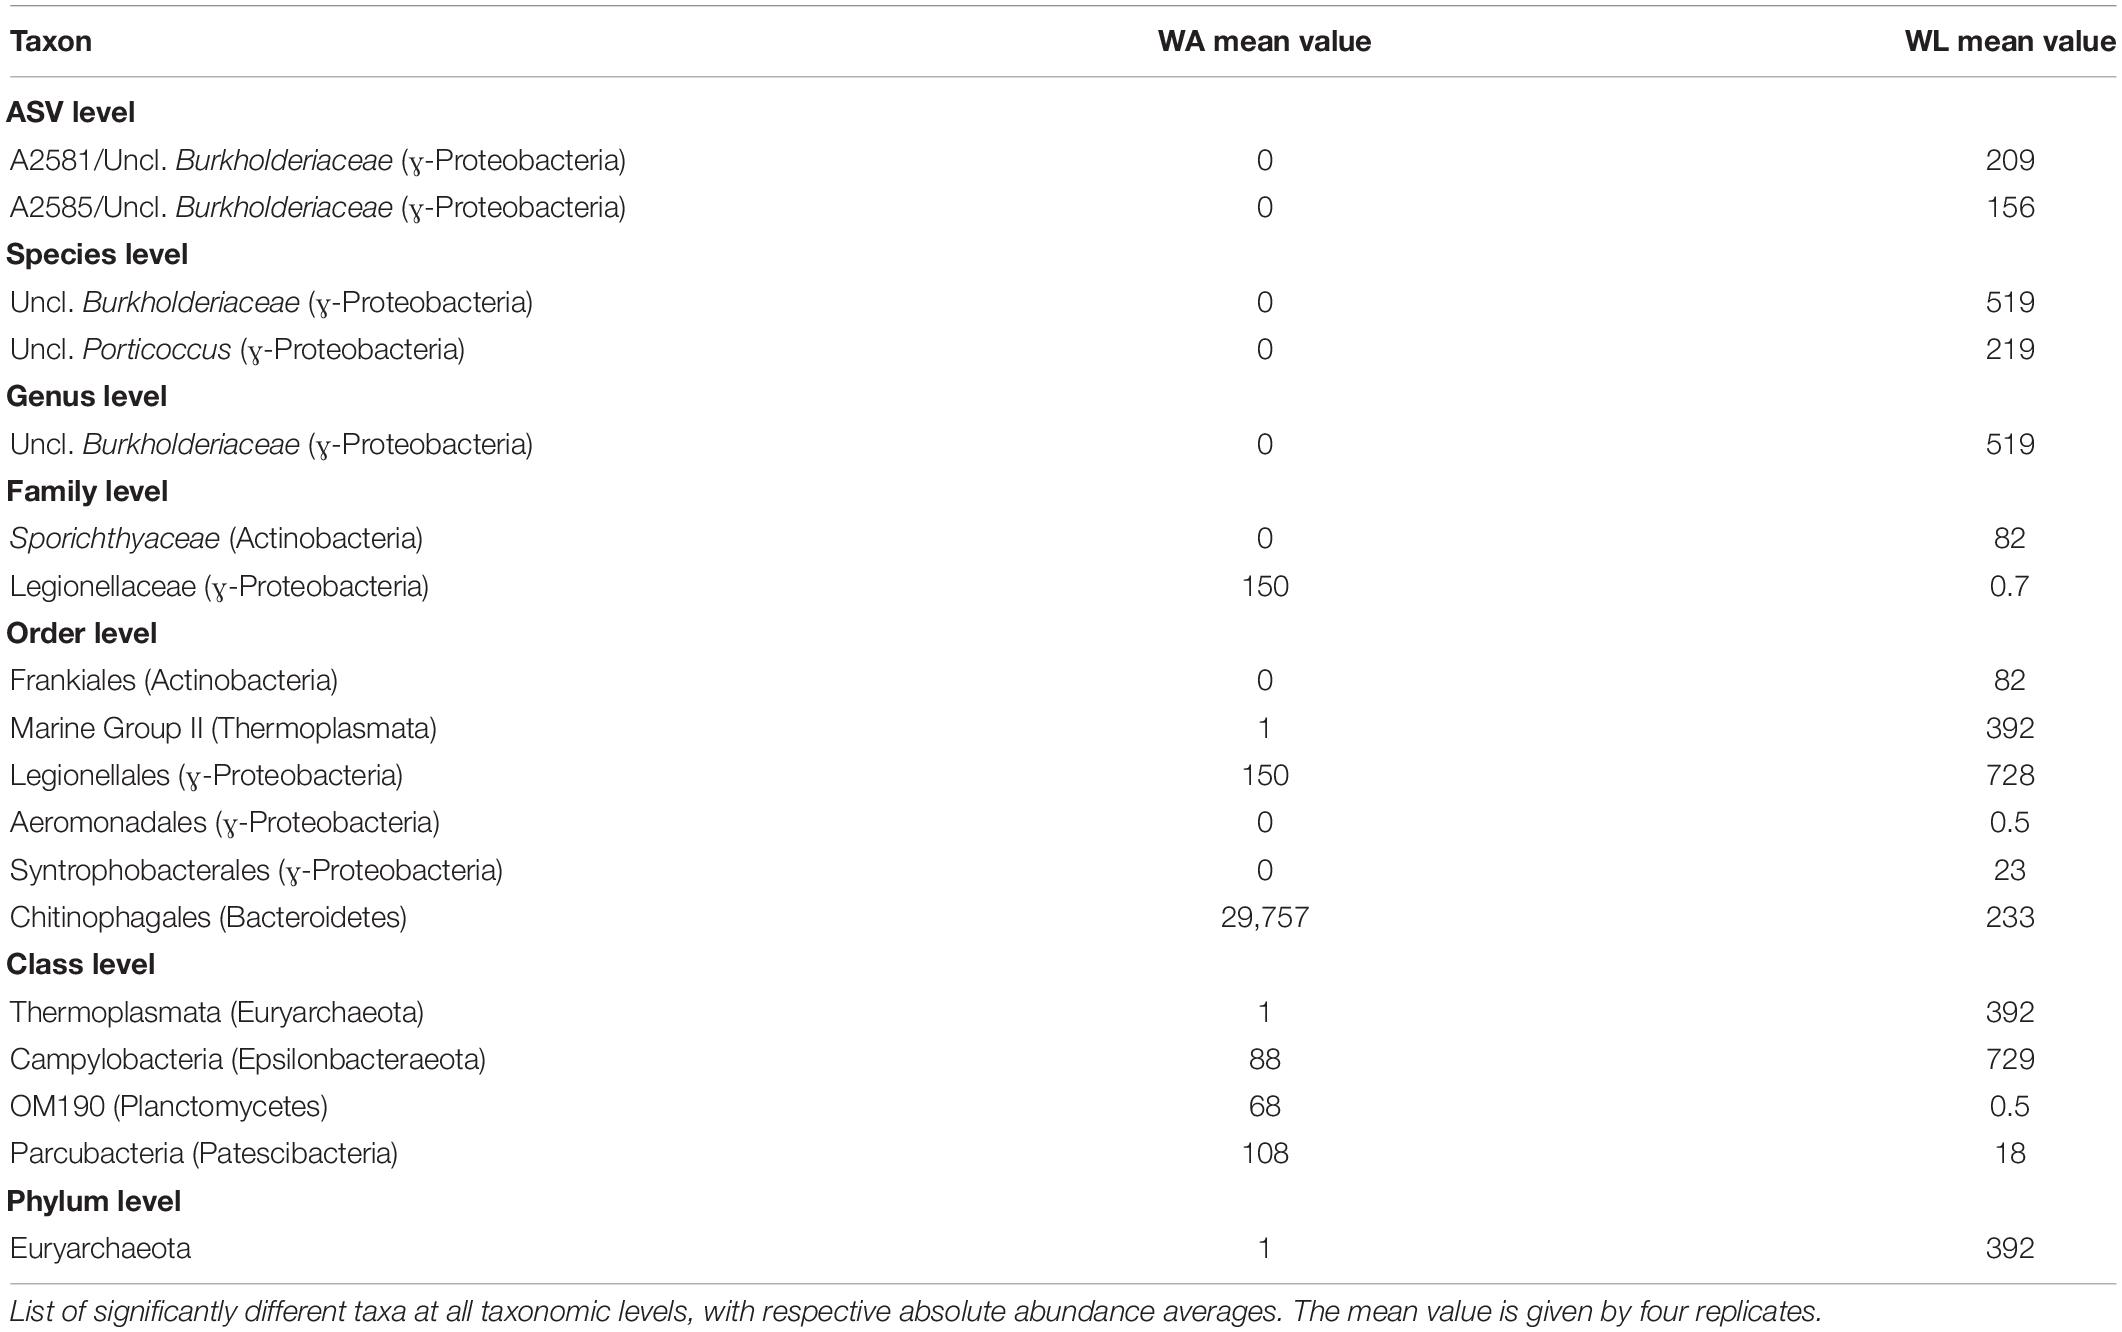
Table 5. ANCOM analysis of the comparison within water’s microenvironments (WA, water collected from aquaculture, versus WL, water collected from the lagoon).
Representatives of the domain Archaea were predominantly found in lagoon water with about 0.1% of the total ASVs abundance, including the phyla Euryarchaeota (395 reads), Nanoarchaeota (9 reads), and Thaumarchaeota (41 reads), but only Euryarchaeota appeared to be significantly enriched in lagoon water (Table 5).
Concerning the most abundant genera found throughout the dataset, lagoon water samples contained a larger number of taxa sharing similar abundances than in other microhabitats, such as the genera Planktomarina, Lentibacter, uncl. Cryomorphaceae, uncl. Burkholderiaceae, uncl. Flavobacteriaceae (from 4 to 16% of abundance). In cultivated Ulva specimens, Glaciecola (31.1 ± 5.7%), Granulosicoccus (16.4 ± 4.4%), and uncl. Rhodobacteraceae (9.70 ± 2.86%) showed dominance. In the lagoon, the Ulva samples were characterized by the same genera, with Granulosicoccus (13.7 ± 10.8%) being the most abundant followed by Glaciecola (28.7 ± 18.4%), uncl. Rhodobacteraceae (5.8 ± 6.5%), and uncl. Hyphomonadaceae (5.6 ± 2.0%) as a fourth dominant taxon worth of mention. Sample UL1 from coastal lagoon displayed a high abundance of the genera Lewinella (30%) and Loktanella (16%), but these values dropped sharply in the other Ulva replicates from the lagoon. Eight hundred eight distinct genera (97%) were pooled into one group (“others”) because they contained <1% (18 reads) of the total sequences. All the microhabitats showed an equivalent abundance of sequences distributed across low abundance taxa (19% in UA, 23% in UL, 27% in WA, 28%). In particular, Planktomarina (16.3 ± 0.3%), Lentibacter (12.0 ± 0.6%), uncl. Cryomorphaceae (10.2% ± 0.8), uncl. Burkholderiaceae (9.6 ± 1.4%), Pseudohongiella (3.8 ± 0.5%), and Amilibacter (3.7 ± 1.2%) were characteristic genera of the lagoon water samples since they were 10-fold more abundant than in all other microhabitats. Following the ANCOM analyses, only uncl. Burkholderiaceae genus was significantly enriched in lagoon water (Table 5). While water aquaculture samples were characterized by the Saprospiraceae genus with an abundance of 21 ± 13.4% (Figure 5), SAR11 (lately called Pelagibacterales), and Candidatus aquiluna genera, were shared between water samples with abundances ranging around 2% compared with the Ulva samples, where their abundances were <0.03%. In both aquaculture water and Ulva, Parcubacteria (Patescibacteria group) were significantly more abundant than in the corresponding lagoon microhabitats.
Exploration of Amplicon Sequence Variants Table
At the finest level of taxonomic classification, we determined the number of shared and unique ASVs across all microhabitats using “Intersecting sets diagrams”. In total, 3141 ASVs were detected in this study. Although the lagoon water did not hold the highest richness (Figure 3A), it harbored the highest number of unique ASVs equivalent to 24% (754 out 3141 ASVs), followed by the number of unique ASVs of the aquaculture water (17%: 542 ASVs), lagoon Ulva (17%: 535), and aquaculture Ulva with 8% (239) of the total ASVs (Figure 6). It was quite expected that the Ulva and water samples collected in the aquaculture system shared a higher number of ASVs (22%: 697) compared to the values derived from equivalent samples (9%: 293 ASVs). The proportion of common ASVs between Ulva grown in the lagoon and aquaculture was comparable to that of common ASVs between lagoon and aquaculture water samples, 14% (446) and 14% (431), respectively (Figure 6).
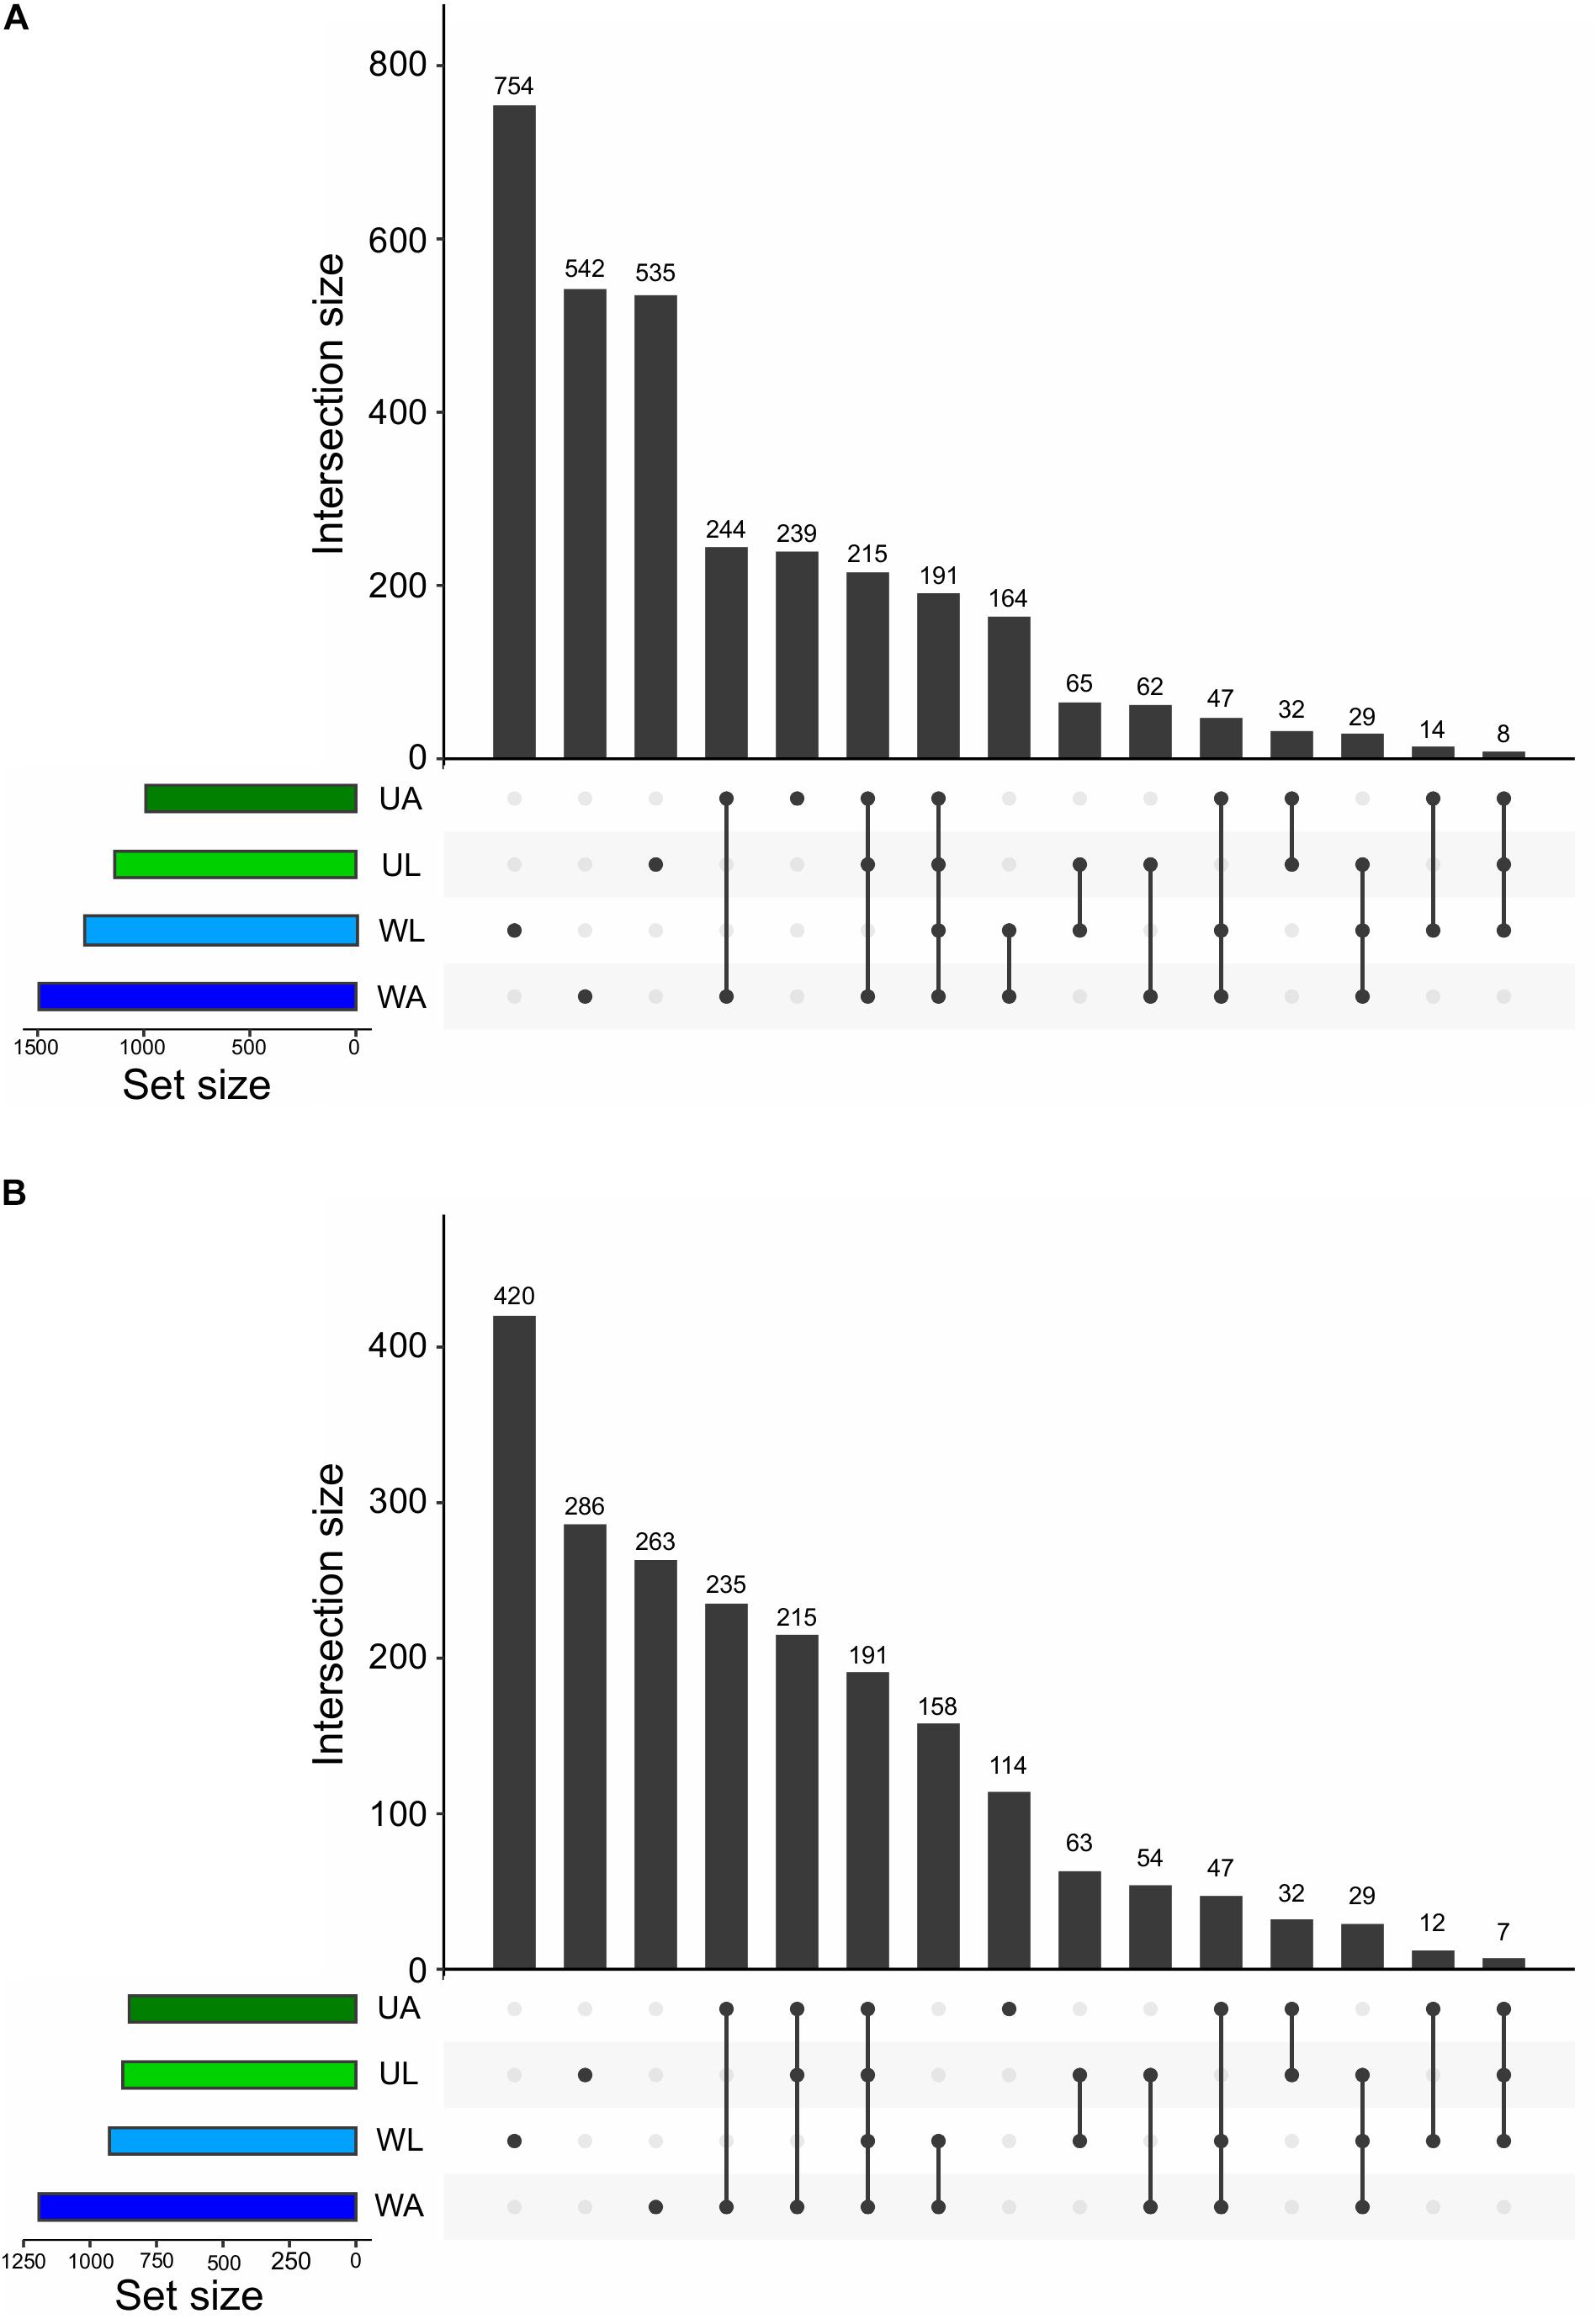
Figure 6. Intersection plot showing all the unique and common ASVs across all prokaryotic communities analyzed in this study (UL, Ulva from lagoon; UA, Ulva from aquaculture; WL, water from lagoon; WA, water from aquaculture). Values at the top of vertical bars refer to the number of ASVs common to the microenvironments linked underneath, which represent the intersections. The horizontal bars on the left show the size of each prokaryotic community in terms of ASV numbers. The two graphs show the microbiomes before (A) and after (B) the removal of low abundance ASVs (with less than 10 reads across the whole dataset).
A method to intuitively gain information on the distribution of the low abundance taxa across the microhabitats is to perform an intersection analysis before and upon removal of low abundance taxa. For that reason, the threshold was set to 10 reads across all samples. Using this cut-off to filter out extremely low abundant ASVs, 1015 (32%) ASVs were removed. Within the remaining 2126 ASVs the pool of ASVs specific to lagoon water, lagoon algae, and aquaculture water was drastically reduced. Each of these microhabitats lost 11, 8, and 9%, respectively, of their original pool of “specific” ASVs. In contrast, the number of ASVs specific to cultivated Ulva specimens was reduced by only 4% (125 ASVs).
It is important to note that the pool of common ASVs between the four microhabitats and the pool of common ASVs between aquaculture and lagoon Ulva contained only medium- or high-frequency taxa with more than 10 reads. Therefore, no reduction in the number of common ASVs was observed and the removal of rare ASVs has eliminated only the “specific” ones (Figure 6).
The described differences between the microhabitats highlighted above depend on the presence/absence of ASVs and the variation of abundance of ASVs. According to the ANCOM analysis, three ASVs were found to be significantly different when cultivated and wild Ulva microbiomes were compared. Uncl. Rhodobacteraceae and uncl. Tateyamaria were enriched in cultivated Ulva, while uncl. Psychrosphaera has enriched in lagoon Ulva (Table 4). In the aquatic habitat, however, only two Burkholderiaceae ASVs were significantly enriched in the lagoon (Table 5).
Taxa With Beneficial Activity for Macroalgal Growth
The ASVs table was examined for bacterial strains known to release compounds that induce the growth and morphogenesis of U. mutabilis or U. intestinalis in the laboratory (Grueneberg et al., 2016; Ghaderiardakani et al., 2017). The qualitative features, which were considered for healthy development, included normal thallus length, the absence of cell wall protrusions, and a differentiated rhizoidal zone (Spoerner et al., 2012).
Seven out of 11 taxa previously tested for morphogenetic activity in the laboratory were found in both water and Ulva-associated samples (Figure 7). Their relative frequencies within each biotope (i.e., lagoon vs. culture water and lagoon vs. reared Ulva) were then compared. The two most common morphogenetically active genera were Sulfitobacter spp. and Maribacter spp. with 1.4 and 0.8% of ASVs, respectively, in aquaculture Ulva. While these strains are known as producers of morphogens, Pseudoalteromonas spp. and Alteromonas spp. were also abundant (0.5% each in the lagoon Ulva), which do not influence the growth of U. mutabilis. We found that Maribacter spp., Sulfitobacter spp., and Roseobacter spp., which release morphogens, were significantly enriched in rearing water (Figure 7).
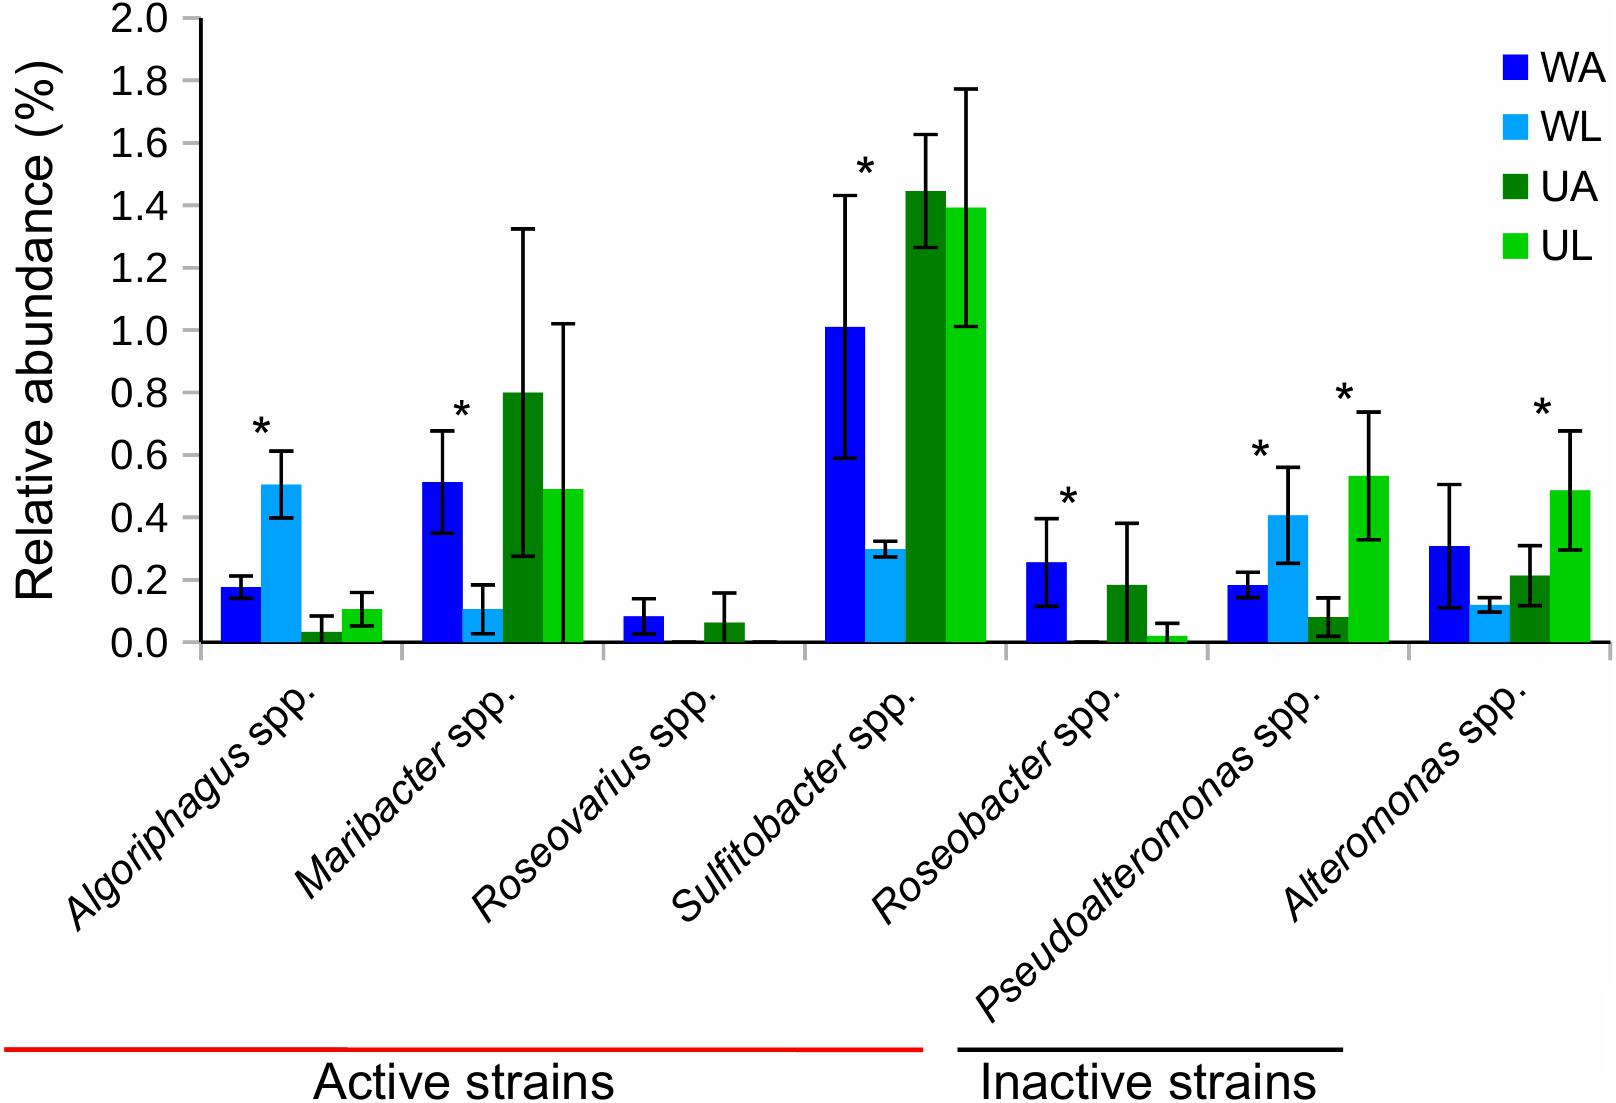
Figure 7. Bar chart shows relative abundances (in %) of 16S rRNA gene reads of taxa, that were tested for morphogenetic activity in previous studies (see the section “Materials and Methods”), associated with Ulva tissue (green) and in water (blue) samples. Bacterial strains that possess morphogenetic activity in bioassay were defined as “active strains,” otherwise as “inactive strains”. Values were Hellinger-transformed. Significant differences between the two compartments (aquaculture – dark color and lagoon – light color) are highlighted by an asterisk (p-value ≤ 0.05). UA, Ulva collected from aquaculture tanks; UL, Ulva strains from coastal lagoon; WA, water from aquaculture; WL, water from coastal lagoon.
Algoriphagus spp. (also morphogenetically active) and Pseudoalteromonas spp. were significantly more frequently found in lagoon water, while Alteromonas spp. and Pseudoalteromonas spp. were significantly enriched in connection with the lagoon Ulva (p-value ≤ 0.05) (Figure 7).
Discussion
Our study characterized the microbial community in macroalgal aquaculture compared to wild sea lettuce algae (U. rigida) living in the same geographical area. We discovered over 3000 ASVs across four microhabitats, all characterized by different bacterial taxonomic profiles. CHAO1 and the Shannon Index showed that the prokaryotic communities of Ulva in the lagoon were characterized by higher fluctuations in the presence/absence of species of medium/low frequency between replicates than Ulva in aquaculture. Accordingly, similar fluctuations in species uniformity were observed. The lagoon area (along a transect of 1 km) selected for sampling Ulva tissues was characterized by more varied environmental conditions in which algae grew and developed in situ than those controlled in the aquaculture system. The presence of surrounding macro- and microalgal assemblages, meio- and macro-fauna and sediment inputs that are absent (or much reduced) in the aquaculture tanks, all bear potential to influence the structure of bacterioplankton and algal-associated communities. Future studies might consider the contribution of the different microniches within the lagoon to the complexity of the observed microbiome and not assuming that the lagoon is a homogeneous source of bacteria for the IMTA system.
High Diversity of Microbiomes in Ulva’s Aquaculture
Although coastal water faces a complex environment, we found equivalent diversity (richness and evenness) of Ulva-associated microbiomes collected in lagoon and aquaculture samples. It is well known that marine hosts select a specific microbiome, but in cultivated species the richness of this microbiome tends to be lower than the same species in nature as described for the Atlantic cod (Gadus morhua) (Dhanasiri et al., 2011) and sea bream (Sparus aurata) (Kormas et al., 2014). The diversity of the farmed fish intestinal microbiota decreased in comparison with that of wild individuals. In our study, however, aquaculture water held higher richness compared with the lagoon water. These outcomes are in line with previous results, whereby the presence of U. prolifera in ponds of a shrimp farm led to higher water microbiome alpha diversity than the diversity of water of shrimp ponds free of Ulva (Lin et al., 2017). Bacterioplankton richness associated in fish larvae tanks (sea bream, S. aurata) at the beginning of cultivation (Califano et al., 2017) was as high as in aquaculture water of the IMTA in this study but decreased drastically during cultivation due to the selective pressures applied on microbial populations through the microbiome associated to the live feed and to the cultivated species itself. As in our study, the bacterioplankton richness of the fish larvae tanks was significantly higher than the microbiome associated with the host in culture (Califano et al., 2017). Compared to IMTA, the recirculating aquaculture system (RAS) can stabilize the microbial community in the selection of k-strategic bacteria and thus reduce the possibility of opportunistic bacteria (r-strategy) development (Attramadal et al., 2014). We thus argue that the IMTA system largely influences our results. The integration of fish and algae aquaculture promoted the complexity of the system (Figure 1), the diversity of the organic material available, and, consequently, the heterogeneity of the microhabitat that might promote microbial diversity. In an open ocean system, salmon farming did not influence the bacterioplankton community in a kelp forest (Florez et al., 2019). However, different results were registered considering macro-organisms assemblages in open ocean IMTAs (Chopin et al., 2012), showing that the increase in biodiversity could challenge the ecosystem functions. The effectiveness of IMTA in preventing disease outbreaks, as seen in Atlantic salmon (Skår and Mortensen, 2007; Chopin et al., 2012), can also be due to the increment of microbial richness and maintenance of the microbial diversity level as found in the wild. In line with these findings, the improvement of the microbial richness and its stability may be key elements to promote host fitness and the reduction of the pathogenic potential in RAS (Attramadal et al., 2012). However, in our study, we did not characterize specific bacterial input from the fish ponds. In the IMTA, the fish ponds are a transient passage for the water from the lagoon to the Ulva aquaculture. The fish ponds are maintained under a semi-intensive regime system. The low fish density and the low food input allow the development of an environment characterized by a diverse algal and invertebrate community, reproducing similarities to some lagoon niches. The IMTA’s pressure exerted on the microbiome of water and associated with the algae is the cumulative effect of all the variables involved in the aquaculture, such as fish ponds, the geographic location of the aquaculture, air born bacteria, and macro- and micronutrients input. Future studies may address, with adequate experimental designs, all additional factors to characterize each microbial input separately.
Even though aquaculture water held the highest ASVs richness in our study, it showed the lowest number of unique ASVs. Ulva tissue and water samples from aquaculture shared almost four times more ASVs than Ulva tissue and the water samples collected from the lagoon. Two main reasons can explain the discrepancy: First, the amount of biomass (kg/L of seawater) in macroalgae tanks was much higher than the biomass in lagoon ponds or channel per volume. Secondly, the effective water exchange in the lagoon is always much higher than that of the aquaculture tanks. The macroalgae tanks were fed with filtered waters, leaving out particulate matter and organisms bigger than 40 μm in size, allowing the algal prokaryotic community to be the major source of bacteria that influences the community structure directly as seen experimentally in a recent study (Chen and Parfrey, 2018).
In contrast, wild Ulva in the lagoon was in contact with a more diverse range of biotic and abiotic agents that shape bacterioplankton community structure and variability, which in turn will influence patterns of community assembly on macroalgal leaves. In fact, during low tide, algae were frequently laying on the hard substrate or other organisms as marine plants, macro- and micro-algae. They were surrounded by vertebrate and invertebrates and by losing sediment transported by tidal currents. Water samples were considered in this work regardless of their complexity in composition (microscopic particles-associated and free-living bacteria) (Rieck et al., 2015) because both parts can act as microbial sources for the Ulva holobiont.
IMTA Shapes the Structure of the Microbial Community
Alphaproteobacteria, Gammaproteobacteria, Bacteroidetes, Deltaproteobacteria, and Actinobacteria were the most abundant classes shared in all microhabitats. These results highlight that abundant ASVs are essential for Ulva in the lagoon and the aquaculture. Potentially, the systematic presence of these taxa is the result of the common functional interactions that exist between Ulva and its microbiome (Egan et al., 2012; Wichard, 2016; Kessler et al., 2018). A more detailed characterization of the microhabitats was performed by beta diversity and taxonomy plots. Principal coordinates analyses (PCoA) revealed differences between microhabitats or host-associated versus bacterioplankton communities (Figure 4), similar to previous studies on macroalgae (Burke et al., 2011b), sponges (Hardoim and Costa, 2014), corals (Keller-Costa et al., 2017), and fish aquaculture (Califano et al., 2017). This pattern of differentiation seems to be driven by the dominant phylotypes of each habitat (Hardoim and Costa, 2014). For instance, the genus Glaciecola (Gammaproteobacteria) was highly represented in cultivated Ulva in terms of abundance and diversity.
Glaciecola species have been previously isolated from brown macroalgae (Fucus vesiculosus and Laminaria sp.) (Wiese et al., 2009; Goecke et al., 2013), red macroalga Delisea pulchra in aquaria (Zozaya-Valdés et al., 2016), recently from other specimens of U. rigida (Ismail et al., 2018) and diverse marine environments, such as coastal seawater (Chen et al., 2009) and sea sediment (Zhang et al., 2011), antarctic diatom assemblages (Bowman et al., 1998) and marine invertebrates (Romanenko et al., 2003). With their physiological plasticity (psychrophilic behavior) Glaciecola spp. are involved in important biogeochemical processes, such as carbon and nitrogen cycles, being able to degrade high molecular weight compounds such as agar, starch, and lipids, synthesize extracellular polysaccharides and reduce nitrate into nitrite (Bowman et al., 1998; Park and Yoon, 2013). This genus has been described as a typical polysaccharide-degrading taxon because of its clear activity on the agar, carrageenan, and alginate substrates (Martin et al., 2015). For its enzymatic properties, it is very appealing for biotechnological applications, but due to the same reasons, their function in association with their hosts remains unclear. Theoretically, they could be detrimental to the macroalgae, providing openings for pathogenic bacteria (Egan et al., 2012). However, field and experimental studies observed that some genera of polysaccharide-degrading bacteria were more abundant in healthy than diseased tissue (Marzinelli et al., 2015; Zozaya-Valdés et al., 2016) leaving open the possibility that other metabolic capacities are beneficial for their host. Alteromonas (belonging to the same group), for example, showed antimicrobial activity against fish and human pathogens (Ismail et al., 2018), reinforcing the idea that those bacteria are part of the immunity defenses of the holobiont (Hollants et al., 2013).
One unclassified genus of the Saprospiraceae family (Bacteroidetes phylum) was one of the most abundant epiphytic taxa that characterized the U. australis microbiome, contrasting with their almost complete absence in water samples (Burke et al., 2011b). Similarly, in our study, the Saprospiraceae family was present in conspicuous abundance (10%) in association with lagoon Ulva specimens, while showing very low abundance in water (0.4%) samples. In aquaculture conditions, however, the trend was completely different. Saprospiraceae was the most abundant family in water (24%) but displayed lower abundance in association with Ulva (4%) even when compared with the lagoon algae (10%). Members of this family associated with activated sludge demonstrated to hydrolyze proteins and use the obtained small peptides and amino acids as energy and carbon source (Xia et al., 2008). In our aquaculture system, fish ponds are populated with low abundance fish and naturally occurring benthic organisms. Those tanks provide water and nutrients, with being the principal source of organic nitrogen, to the macroalgae tanks (Haas et al., 2011; Ghaderiardakani et al., 2019). Cardona et al. (2016) found a very high, positive correlation between the abundance of Saprospiraceae and concentrations in the water column, corroborating the hypothesis that this taxon can easily get energy from the organic substrate (Gao et al., 2012). Macroalgae exudates are high proportions of photosynthetic carbon forming the pool of dissolved organic matter (DOM) into the surrounding water (Wada et al., 2007), thus enriching specific bacterioplankton lineages (Nelson et al., 2013) and contributing potentially to the metal bioavailability (Wichard, 2016). It is expected that high densities of algae, together with low water renovation rates increase the availability of organic matter in aquaculture systems, consequently changing microbial structures compared to the water lagoon environment (Nelson et al., 2013). Across 192 ASVs belonging to nine genera from the Saprospiraceae family, one in aquaculture water gathered 19.2% (the second most abundant ASV in the whole dataset) of all read counts, driving the abundance values of the entire family. The same ASV in aquaculture Ulva was 0.7% in abundance, and <0.08% in both lagoon microhabitats. However, no better taxonomic classification than family level could be achieved for the same ASV.
Another phylum that was already found associated with macroalgae and that can catabolize the macroalgal deriving DOM, as well as the structural polysaccharides of cell walls, is Planctomycetes (Lachnit et al., 2010). Sulfatase coding genes that are involved in the catabolism of polysaccharides characterize it. Different genera of this phylum were characterized by distinct numbers of sulfatase genes that likely drive differential colonization patterns across macroalgal classes due to their differences in the cell wall molecular composition (Kim et al., 2016; Bondoso et al., 2017). In our study, Planctomycetes showed to be significantly more abundant in Ulva from aquaculture than from the lagoon. Planctomycetes abundance may be also related to the presence of ammonium and nitrite in the aquaculture waters, favoring the groups that perform anaerobic ammonium oxidation. However, a previous study on the same IMTA system has shown the fast depletion of ammonium in the presence of U. rigida (Ghaderiardakani et al., 2019).
During the decay of Ulva lactuca, sulfate-reducing bacteria play an important role in nutrient cycling (Nedergaard et al., 2002). In the present study, aquaculture tanks were characterized by strong and continuous aeration that did not allow the formation of anaerobic zones with anoxic or hypoxic conditions, even when high algal biomass is achieved at the end of the growing period. Consequently, sulfate-reducing bacteria (Desulfobacterales, Desulfovibrionales, and Desulfuromonadales) were not very abundant in aquaculture microhabitats. Their abundance increases randomly in wild Ulva collected in the lagoon but was more consistent in the water samples of the same environment.
The Potential Role of Different Bacterial Taxa in Cross-Kingdom Interactions
The Granulosicoccus genus (Gammaproteobacteria class), which was mostly found associated with algal tissue, showed two to three orders of magnitude higher abundances in algae (aquaculture and lagoon) than in the water samples. This genus has been described to be present all year long in brown algae such as Mastocarpus sp. (in gametophyte and sporophyte) and Nereocystis luetkeana (Chen and Parfrey, 2018; Lemay et al., 2018). One of the 24 ASVs belonging to the Granulosicoccus genus is the most abundant ASV (7.9%) in the whole dataset. Full genome sequencing of the putative strain Granulosicoccus antarcticus highlighted the presence of genes related to the lyase activity of algal polysaccharides such as alginate lyase, oligo alginate lyase, xylanase, endoglucanase, beta-glucanase, and xylosidase, which might provide carbon sources for the survival and growth of the strain. Interestingly, the dmdA gene (dimethylsulfoniopropionate demethylase), which performs the dimethylation of the DMSP released in high quantities by macroalgae, was also found in G. antarcticus. Kessler et al. (2018) suggested that bacteria with the dmdA gene use DMSP as a reliable signal indicating a food source and promote the subsequent development and morphogenesis through morphogens in Ulva. Here, we argue that high algal densities would lead to high abundances of symbiotic taxa, and a high amount of algal biomass would require more morphogenetic compounds to grow. Therefore, more bacterial partners in diversity and abundance, which can fulfill the ecological function, should be present. In this study, some of the bacteria known to possess morphogenesis-inducing activity were more abundant in the rearing water of the aquaculture than in the water of the lagoon. Roseobacter spp., Maribacter spp., and Sulfitobacter spp. are of high relevance in macroalgal aquaculture despite their low relative abundances of 0.08, 0.3, and 1.2% in rearing water. Indeed, previous studies highlighted their importance in the morphological development of germlings of U. mutabilis, U. intestinalis, and U. linza (Grueneberg et al., 2016; Ghaderiardakani et al., 2017; Weiss et al., 2017a) through the release of morphogens, such as thallusin, at low concentrations in the fg/ml range, but with high biological activity, that trigger algal growth and morphogenesis (Matsuo et al., 2005; Wichard, 2015; Alsufyani et al., 2020). As we did not test the bioactivity of the bacteria, other unknown taxa adapted to the aquaculture environment might also induce Ulva’s morphogenesis. Alternatively, morphogens can be released within the lagoon and transported into the aquaculture facilities through the water exchange (Ghaderiardakani et al., 2019). Indeed, water from the lagoon and aquaculture could completely restore the normal growth and morphology of Ulva under axenic conditions (Ghaderiardakani et al., 2019). However, the high abundances of taxa that do not produce effects on the growth and development of Ulva germlings (Alteromonas and Pseudoalteromonas) implies other functions in response to factors that occur in the lagoon, rather than in aquaculture. For example, genomic analyses of Pseudomonas tunicata associated with macroalgae surfaces revealed its potential in organic matter degradation using extracellular digestion of polymeric molecules and uptake of the respective monomers. The ability to digest chitin (due to the presence of the chiABC gene cluster) (Thomas et al., 2008), for instance, might improve their adaptation to more diverse hosts of the lagoon. Rhodobacteraceae (Alphaproteobacteria) taxa, such as Sulfitobacter is known to enhance the growth rate of the diatom Pseudo-nitzschia multiseries up to 35% under strict lab medium conditions (Amin et al., 2015). It was demonstrated, for diatoms, that exogenous indole-3-acetic acid (IAA) and its precursor tryptophan were driving the mutualistic interaction. The bacteria present in the phycosphere of diatoms can acquire tryptophan, released by the algae, and convert it into IAA (Amin et al., 2015).
Red, brown, and green macroalgae showed production of some levels of phytohormones in their tissues (Tarakhovskaya et al., 2007), however for some lineages, exogenous phytohormones such as cytokinin- and auxin-like compounds are necessary for their development, and the co-evolution of these processes has been suggested (Ashen and Goff, 1998). Even though the application of several concentrations of synthetic phytohormones did not lead to the growth and development of U. mutabilis germlings (De Clerck et al., 2018), the possible effects of exogenous and endogenous auxin on adult Ulva under vegetative growth are still not apparent. Therefore, we speculate, following previous suggestions (Goecke et al., 2010; Spoerner et al., 2012; Ghaderiardakani et al., 2017), that significantly more abundant aquaculture Alphaproteobacteria taxa, such as Sulfitobacter spp. and Tateyamaria spp. (both are Rhodobacteraceae) can contribute to the vegetative growth of Ulva. However, further experimental studies are needed to test this hypothesis.
Conclusion
Our study approached the composition and structure of the microbiome in U. rigida at an IMTA site where the primary purpose is the production of high-quality fish and Ulva biomass that meets market requirements. We conclude that (i) the IMTA promotes visible changes in the prokaryotic community associated with cultivated Ulva species. (ii) Opposing aquaculture trends, the diversity of microbiomes in rearing water was improved and likely impacting positively the system. (iii) Beneficial bacteria, which can affect Ulva’s development, were enriched in the aquaculture, suggesting that knowledge of the microbiome of macroalgae in aquaculture is of paramount importance for the improvement of rearing methods and biomass yields.
Data Availability Statement
The raw sequences of the phylogenetic analysis of Ulva were deposited in GenBank under the following accession codes: MN444712–MN444720 (ITS sequences) and MN450419–MN450427 (rbcL sequences). The entire dataset for the microbiome analysis (PRJEB34347) can be retrieved from ENA (European Nucleotide Archive) through the following URL: http://www.ebi.ac.uk/ena/data/view/PRJEB34347.
Author Contributions
GC and TW contributed to the conception and design of the study. TW and RC supervised the study. GC measured and analyzed all data and wrote the first draft of the manuscript. GC, MK, RC, and TW interpreted the data. MA provided the resources and supervised the project at ALGAplus. All authors contributed to the manuscript revision, and read and approved the submitted version of the manuscript.
Funding
This work was funded by the European Union’s Horizon 2020 Research and Innovation Program under the Marie Skłodowska-Curie Grant Agreement No. 642575 – The ALgal Microbiome: Friends and Foes (ALFF) (to GC, MA, RC, and TW) and supported by the Deutsche Forschungsgemeinschaft (DFG, CRC 1127 ChemBioSys) (to GC, MK, and TW). The authors would like to acknowledge networking support by the COST Action “Phycomorph” FA1406 (to MA and TW).
Conflict of Interest
MA was employed by the company ALGAplus Lda.
The remaining authors declare that the research was conducted in the absence of any commercial or financial relationships that could be construed as a potential conflict of interest.
Acknowledgments
We thank Georg Pohnert (University Jena) and the ALGAplus team for their great support.
Footnotes
References
Abomohra, A. E.-F., El-Naggar, A. H., and Baeshen, A. A. (2018). Potential of macroalgae for biodiesel production: screening and evaluation studies. J. Biosci. Bioeng. 125, 231–237. doi: 10.1016/J.JBIOSC.2017.08.020
Abreu, M. H., Pereira, R., Sassi, J. F. (2014). “Marine algae and the global food industry”, in Marine Algae: Biodiversity, Taxonomy, Environmental Assessment, and Biotechnology, eds L. Pereira and J. Magalhaes Neto (Boca Raton, FL: CRC Press), 300–319. doi: 10.1201/b17540
Alsufyani, T., Califano, G., Deicke, M., Grueneberg, J., Weiss, A., Engelen, A. H., et al. (2020). Macroalgal-bacterial interactions: identification and role of thallusin in morphogenesis of the seaweed Ulva (Chlorophyta). J. Exp. Bot. (in press). doi: 10.1093/jxb/eraa066
Amin, S. A., Hmelo, L. R., Van Tol, H. M., Durham, B. P., Carlson, L. T., Heal, K. R., et al. (2015). Interaction and signalling between a cosmopolitan phytoplankton and associated bacteria. Nature 522, 98–101. doi: 10.1038/nature14488
Anderson, M. J. (2001). A new method for non-parametric multivariate analysis of variance. Austr. Ecol. 26, 32–46. doi: 10.1111/j.1442-9993.2001.01070.pp.x
Anderson, M. J., and Walsh, D. C. I. (2013). Permanova, anosim, mantel test face heterogeneous dispersions?: what null hypothesis are you testing? Ecol. Monogr. 83, 557–574. doi: 10.1890/12-2010.1
Apprill, A., Mcnally, S., Parsons, R., and Weber, L. (2015). Minor revision to V4 region SSU rRNA 806R gene primer greatly increases detection of SAR11 bacterioplankton. Aquat. Microb. Ecol. 75, 129–137. doi: 10.3354/ame01753
Ashen, J. B., and Goff, L. J. (1998). Galls on the marine red alga Prionitis lanceolata (Halymeniaceae): specific induction and subsequent development of an algal-bacterial symbiosis. Am. J. Bot. 85, 1710–1721. doi: 10.2307/2446505
Attramadal, K. J. K., Salvesen, I., Xue, R., Øie, G., Størseth, T. R., Vadstein, O., et al. (2012). Recirculation as a possible microbial control strategy in the production of marine larvae. Aquac. Eng. 46, 27–39. doi: 10.1016/j.aquaeng.2011.10.003
Attramadal, K. J. K., Truong, T. M. H., Bakke, I., Skjermo, J., Olsen, Y., and Vadstein, O. (2014). RAS and microbial maturation as tools for K-selection of microbial communities improve survival in cod larvae. Aquaculture 432, 483–490. doi: 10.1016/j.aquaculture.2014.05.052
Barzkar, N., Tamadoni Jahromi, S. T., Poorsaheli, H. B., and Vianello, F. (2019). Metabolites from marine microorganisms, micro, and macroalgae: immense scope for pharmacology. Mar. Drugs 17, 464. doi: 10.3390/md17080464
Bengtsson, M., Sjøtun, K., and Øvreås, L. (2010). Seasonal dynamics of bacterial biofilms on the kelp Laminaria hyperborea. Aquat. Microb. Ecol. 60, 71–83. doi: 10.3354/ame01409
Bokulich, N. A., Kaehler, B. D., Rideout, J. R., Dillon, M., Bolyen, E., Knight, R., et al. (2018). Optimizing taxonomic classification of marker-gene amplicon sequences with QIIME 2’s q2-feature-classifier plugin. Microbiome 6:90. doi: 10.1186/s40168-018-0470-z
Bolyen, E., Rideout, J. R., Dillon, M. R., Bokulich, N. A., Abnet, C. C., Al-Ghalith, G. A., et al. (2019). Reproducible, interactive, scalable and extensible microbiome data science using QIIME 2. Nat. Biotechnol. 37, 852–857. doi: 10.1038/s41587-019-0209-9
Bondoso, J., Godoy-Vitorino, F., Balagué, V., Gasol, J. M., Harder, J., and Lage, O. M. (2017). Epiphytic Planctomycetes communities associated with three main groups of macroalgae. FEMS Microbiol. Ecol. 93:fiw255. doi: 10.1093/femsec/fiw255
Bowman, J. P., McCamon, S. A., Brown, J. L., and McMeekin, T. A. (1998). Glaciecola punicea gen. nov., sp. nov. and Glaciecola pallidula gen. nov., sp. nov.: psychrophilic bacteria from Antarctic sea-ice habitats. Int. J. Syst. Bacteriol. 48, 1213–1222. doi: 10.1099/00207713-48-4-1213
Burke, C., Steinberg, P., Rusch, D., Kjelleberg, S., and Thomas, T. (2011a). Bacterial community assembly based on functional genes rather than species. Proc. Natl. Acad. Sci. U.S.A. 108, 14288–14293. doi: 10.1073/pnas.1101591108
Burke, C., Thomas, T., Lewis, M., Steinberg, P., and Kjelleberg, S. (2011b). Composition, uniqueness and variability of the epiphytic bacterial community of the green alga Ulva australis. ISME J. 5, 590–600. doi: 10.1038/ismej.2010.164
Califano, G., Castanho, S., Soares, F., Ribeiro, L., Cox, C. J., Mata, L., et al. (2017). Molecular taxonomic profiling of bacterial communities in a gilthead seabream (Sparus aurata) hatchery. Front. Microbiol. 8:204. doi: 10.3389/fmicb.2017.00204
Callahan, B. J., McMurdie, P. J., Rosen, M. J., Han, A. W., Johnson, A. J. A., and Holmes, S. P. (2016). DADA2: high-resolution sample inference from Illumina amplicon data. Nat. Methods 13:581. doi: 10.1038/nmeth.3869
Campbell, A. H., Marzinelli, E. M., Gelber, J., and Steinberg, P. D. (2015). Spatial variability of microbial assemblages associated with a dominant habitat-forming seaweed. Front. Microbiol. 6:230. doi: 10.3389/FMICB.2015.00230
Caporaso, J. G., Lauber, C. L., Walters, W. A., Berg-Lyons, D., Lozupone, C. A., Turnbaugh, P. J., et al. (2011). Global patterns of 16S rRNA diversity at a depth of millions of sequences per sample. Proc. Natl. Acad. Sci. 108, 4516–4522. doi: 10.1073/pnas.1000080107
Cardona, E., Gueguen, Y., Magré, K., Lorgeoux, B., Piquemal, D., Pierrat, F., et al. (2016). Bacterial community characterization of water and intestine of the shrimp Litopenaeus stylirostris in a biofloc system. BMC Microbiol. 16:157. doi: 10.1186/s12866-016-0770-z
Chen, H., Zhou, D., Luo, G., Zhang, S., and Chen, J. (2015). Macroalgae for biofuels production: progress and perspectives. Renew. Sustain. Energy Rev. 47, 427–437. doi: 10.1016/J.RSER.2015.03.086
Chen, L.-P., Xu, H.-Y., Fu, S.-Z., Fan, H.-X., Liu, Y.-H., Liu, S.-J., et al. (2009). Glaciecola lipolytica sp. nov., isolated from seawater near Tianjin city. China. Int. J. Syst. Evol. Microbiol. 59, 73–76. doi: 10.1099/ijs.0.000489-0
Chen, M. Y., and Parfrey, L. W. (2018). Incubation with macroalgae induces large shifts in water column microbiota, but minor changes to the epibiota of co-occurring macroalgae. Mol. Ecol. 27, 1966–1979. doi: 10.1111/mec.14548
Chopin, T. (2010). Integrated multi-trophic aquaculture. Adv. Aquac. Agenda 12, 195–217. doi: 10.1787/9789264088726-15-en
Chopin, T., Cooper, J. A., Reid, G., Cross, S., and Moore, C. (2012). Open-water integrated multi-trophic aquaculture: environmental biomitigation and economic diversification of fed aquaculture by extractive aquaculture. Rev. Aquac. 4, 209–220. doi: 10.1111/j.1753-5131.2012.01074.x
Chopin, T., Robinson, S. M. C., Troell, M., Neori, A., Buschmann, A. H., Fang, J. (2008). “Multitrophic integration for sustainable marine aquaculture,” in The Encyclopedia of Ecology, Ecological Engineering, Vol. 3 eds Jørgensen, S. E., and Fath, B. D. (Oxford: Elsevier), 2463–2475. doi: 10.1016/B978-008045405-4.00065-3
Colombo, M. L., Risè, P., Giavarini, F., Angelis, D. E. L., Galli, C., and Bolis, C. L. (2006). Marine macroalgae as sources of polyunsaturated fatty acids. Plant Foods Hum. Nutr. 61, 67–72. doi: 10.1007/s11130-006-0015-7
De Clerck, O., Kao, S.-M., Bogaert, K. A., Blomme, J., Foflonker, F., Kwantes, M., et al. (2018). Insights into the evolution of multicellularity from the sea lettuce genome. Curr. Biol. 28, 2921.e5-2933.e5. doi: 10.1016/j.cub.2018.08.015
Dhanasiri, A. K. S., Brunvold, L., Brinchmann, M. F., Korsnes, K., Bergh, Ø, and Kiron, V. (2011). Changes in the intestinal microbiota of wild Atlantic cod Gadus morhua L. upon captive rearing. Microb. Ecol. 61, 20–30. doi: 10.1007/s00248-010-9673-y
Edgar, R. C., Drive, R. M., and Valley, M. (2004). MUSCLE?: multiple sequence alignment with high accuracy and high throughput. Nucleic Acids Res. 32, 1792–1797. doi: 10.1093/nar/gkh340
Egan, S., Harder, T., Burke, C., Steinberg, P., Kjelleberg, S., and Thomas, T. (2012). The seaweed holobiont: understanding seaweed-bacteria interactions. FEMS Microbiol. Rev. 37, 462–476. doi: 10.1111/1574-6976.12011
Florez, J. Z., Camus, C., Hengst, M. B., Marchant, F., and Buschmann, A. H. (2019). Structure of the epiphytic bacterial communities of Macrocystis pyrifera in localities with contrasting nitrogen concentrations and temperature. Algal Res. 44:101706. doi: 10.1016/j.algal.2019.101706
Fries, L. (1975). Some observations on the morphology of Enteromorpha linza (L.) J. ag. and Enteromorpha compressa (L.) Grev. in axenic culture. Bot. Mar. 18, 251–253.
Gao, D., Tao, Y., and An, R. (2012). Digested sewage treatment using membrane-based process at different hydraulic retention times. Desalination 286, 187–192. doi: 10.1016/J.DESAL.2011.11.020
Ghaderiardakani, F., Califano, G., Mohr, J., Abreu, M., Coates, J., and Wichard, T. (2019). Analysis of algal growth- and morphogenesis- promoting factors in an integrated multi-trophic aquaculture system for farming Ulva spp. Aquac. Environ. Interact. 11, 375–391. doi: 10.3354/aei00319
Ghaderiardakani, F., Coates, J. C., and Wichard, T. (2017). Bacteria-induced morphogenesis of Ulva intestinalis and Ulva mutabilis (Chlorophyta): a contribution to the lottery theory. FEMS Microbiol. Ecol. 93, 1–12. doi: 10.1093/femsec/fix094
Gloor, G. B., and Reid, G. (2016). Compositional analysis: a valid approach to analyze microbiome high-throughput sequencing data. Can. J. Microbiol. 62, 692–703. doi: 10.1139/cjm-2015-0821
Goecke, F., Labes, A., Wiese, J., and Imhoff, J. F. (2010). Review chemical interactions between marine macroalgae and bacteria. Mar. Ecol. Prog. Ser. 409, 267–300. doi: 10.3354/meps08607
Goecke, F., Labes, A., Wiese, J., and Imhoff, J. F. (2013). Phylogenetic analysis and antibiotic activity of bacteria isolated from the surface of two co-occurring macroalgae from the Baltic Sea. Eur. J. Phycol. 48, 47–60. doi: 10.1080/09670262.2013.767944
Grueneberg, J., Engelen, A. H., Costa, R., and Wichard, T. (2016). Macroalgal morphogenesis induced by waterborne compounds and bacteria in coastal seawater. PLoS One 11:e0146307. doi: 10.1371/journal.pone.0146307
Haas, A. F., Nelson, C. E., Wegley Kelly, L., Carlson, C. A., Rohwer, F., Leichter, J. J., et al. (2011). Effects of coral reef benthic primary producers on dissolved organic carbon and microbial activity. PLoS One 6:e27973. doi: 10.1371/journal.pone.0027973
Hafting, J. T., Craigie, J. S., Stengel, D. B., Loureiro, R. R., Buschmann, A. H., Yarish, C., et al. (2015). Prospects and challenges for industrial production of seaweed bioactives. J. Phycol. 51, 821–837. doi: 10.1111/jpy.12326
Hardoim, C. C. P., and Costa, R. (2014). Temporal dynamics of prokaryotic communities in the marine sponge Sarcotragus spinosulus. Mol. Ecol. 23, 3097–3112. doi: 10.1111/mec.12789
Hayden, H. S., Blomster, J., Maggs, C. A., Silva, P. C., Stanhope, M. J., and Waaland, J. R. (2003). Linnaeus was right all along: Ulva and Enteromorpha are not distinct genera. Eur. J. Phycol. 38, 277–294. doi: 10.1080/1364253031000136321
Hayden, H. S., and Waaland, J. R. (2004). A molecular systematic study of Ulva (Ulvaceae, Ulvales) from the northeast Pacific. Phycologia 43, 364–382. doi: 10.2216/i0031-8884-43-4-364.1
Heesch, S., Broom, J. E. S., Neill, K. F., Farr, T. J., Dalen, J. L., and Nelson, W. A. (2009). Ulva, Umbraulva and Gemina: Genetic survey of New Zealand taxa reveals diversity and introduced species. Eur. J. Phycol. 44, 143–154. doi: 10.1080/09670260802422477
Hollants, J., Leliaert, F., De Clerck, O., and Willems, A. (2013). What we can learn from sushi: a review on seaweed-bacterial associations. FEMS Microbiol. Ecol. 83, 1–16. doi: 10.1111/j.1574-6941.2012.01446.x
Ismail, A., Ktari, L., Ahmed, M., Bolhuis, H., Bouhaouala-Zahar, B., Stal, L. J., et al. (2018). Heterotrophic bacteria associated with the green alga Ulva rigida: identification and antimicrobial potential. J. Appl. Phycol. 30, 2883–2899. doi: 10.1007/s10811-018-1454-x
Keller-Costa, T., Eriksson, D., Gonçalves, J. M. S., Gomes, N. C. M., Lago-Lestón, A., and Costa, R. (2017). The gorgonian coral Eunicella labiata hosts a distinct prokaryotic consortium amenable to cultivation. FEMS Microbiol. Ecol. 93, 1–14. doi: 10.1093/femsec/fix143
Kessler, R. W., Weiss, A., Kuegler, S., Hermes, C., and Wichard, T. (2018). Macroalgal-bacterial interactions: role of dimethylsulfoniopropionate in microbial gardening by Ulva (Chlorophyta). Mol. Ecol. 27, 1808–1819. doi: 10.1111/mec.14472
Kim, B. R., Shin, J., Guevarra, R. B., Lee, J. H., Kim, D. W., Seol, K. H., et al. (2017). Deciphering diversity indices for a better understanding of microbial communities. J. Microbiol. Biotechnol. 27, 2089–2093. doi: 10.4014/jmb.1709.09027
Kim, J. W., Brawley, S. H., Prochnik, S., Chovatia, M., Grimwood, J., Jenkins, J., et al. (2016). Genome analysis of Planctomycetes inhabiting blades of the red alga Porphyra umbilicalis. PLoS One 11:e0151883. doi: 10.1371/journal.pone.0151883
Kormas, K. A., Meziti, A., Mente, E., and Frentzos, A. (2014). Dietary differences are reflected on the gut prokaryotic community structure of wild and commercially reared sea bream (Sparus aurata). Microbiol. Open 3, 718–728. doi: 10.1002/mbo3.202
Kumar, S., Stecher, G., and Tamura, K. (2016). MEGA7: Molecular evolutionary genetics analysis version 7.0 for bigger datasets. Mol. Biol. Evol. 33, 1870–1874. doi: 10.1093/molbev/msw054
Lachnit, T., Blümel, M., Imhoff, J. F., and Wahl, M. (2009). Specific epibacterial communities on macroalgae: Phylogeny matters more than habitat. Aquat. Biol. 5, 181–186. doi: 10.3354/ab00149
Lachnit, T., Wahl, M., and Harder, T. (2010). Isolated thallus-associated compounds from the macroalga Fucus vesiculosus mediate bacterial surface colonization in the field similar to that on the natural alga. Biofouling 26, 247–255. doi: 10.1080/08927010903474189
Lemay, M. A., Martone, P. T., Hind, K. R., Lindstrom, S. C., and Wegener Parfrey, L. (2018). Alternate life history phases of a common seaweed have distinct microbial surface communities. Mol. Ecol. 27, 3555–3568. doi: 10.1111/mec.14815
Lex, A., Gehlenborg, N., Strobelt, H., Vuillemot, R., and Pfister, H. (2014). UpSet: visualization of intersecting sets. IEEE Trans. Vis. Comput. Graph. 20, 1983–1992. doi: 10.1109/TVCG.2014.2346248
Lin, G., Sun, F., Wang, C., Zhang, L., and Zhang, X. (2017). Assessment of the effect of Enteromorpha prolifera on bacterial community structures in aquaculture environment. PLoS One 12:e0179792. doi: 10.1371/journal.pone.0179792
Lozupone, C., and Knight, R. (2005). UniFrac: a new phylogenetic method for comparing microbial communities. Appl. Environ. Microbiol. 71, 8228–8235. doi: 10.1128/AEM.71.12.8228-8235.2005
Lozupone, C., Lladser, M. E., Knights, D., Stombaugh, J., and Knight, R. (2011). UniFrac: an effective distance metric for microbial community comparison. ISME J. 5, 169–172. doi: 10.1038/ismej.2010.133
Malta, E. J., Kamermans, P., and Draisma, S. (1999). Free-floating - Ulva in the southwest netherlands: species or morphotypes? A morphological, molecular and ecological comparison. Eur. J. Phycol. 34, 443–454. doi: 10.1080/09541449910001718801
Mandal, S., Van Treuren, W., White, R. A., Eggesbø, M., Knight, R., and Peddada, S. D. (2015). Analysis of composition of microbiomes: a novel method for studying microbial composition. Microb. Ecol. Heal. Dis. 26, 1–7. doi: 10.3402/mehd.v26.27663
Martin, M., Barbeyron, T., Martin, R., Portetelle, D., Michel, G., and Vandenbol, M. (2015). The cultivable surface microbiota of the brown alga Ascophyllum nodosum is enriched in macroalgal-polysaccharide-degrading bacteria. Front. Microbiol. 6:1487. doi: 10.3389/fmicb.2015.01487
Marzinelli, E. M., Campbell, A. H., Zozaya Valdes, E., Vergés, A., Nielsen, S., Wernberg, T., et al. (2015). Continental-scale variation in seaweed host-associated bacterial communities is a function of host condition, not geography. Environ. Microbiol. 17, 4078–4088. doi: 10.1111/1462-2920.12972
Marzinelli, E. M., Qiu, Z., Dafforn, K. A., Johnston, E. L., Steinberg, P. D., and Mayer-Pinto, M. (2018). Coastal urbanisation affects microbial communities on a dominant marine holobiont. NPJ Biofilms Microbiomes 4:1. doi: 10.1038/s41522-017-0044-z
Mata, L., Schuenhoff, A., and Santos, R. (2010). A direct comparison of the performance of the seaweed biofilters, Asparagopsis armata and Ulva rigida. J. Appl. Phycol. 22, 639–644. doi: 10.1007/s10811-010-9504-z
Matsuo, Y., Imagawa, H., Nishizawa, M., and Shizuri, Y. (2005). Isolation of an algal morphogenesis inducer from a marine bacterium. Science 307:1598. doi: 10.1126/science.1105486
McMurdie, P. J., and Holmes, S. (2014). Waste not, want not: why rarefying microbiome data is inadmissible. PLoS Comput. Biol. 10:e1003531. doi: 10.1371/journal.pcbi.1003531
Messyasz, B., and Rybak, A. (2010). Abiotic factors affecting the development of Ulva sp. (Ulvophyceae; Chlorophyta) in freshwater ecosystems. Aquat. Ecol. 45, 75–87. doi: 10.1007/s10452-010-9333-9
Michelou, V. K., Caporaso, J. G., Knight, R., and Palumbi, S. R. (2013). The ecology of microbial communities associated with Macrocystis pyrifera. PLoS One 8:e67480. doi: 10.1371/journal.pone.0067480
Mikaelyan, A., Dietrich, C., Köhler, T., Poulsen, M., Sillam-Dussès, D., and Brune, A. (2015). Diet is the primary determinant of bacterial community structure in the guts of higher termites. Mol. Ecol. 24, 5284–5295. doi: 10.1111/mec.13376
Mineur, F., Arenas, F., Assis, J., Davies, A. J., Engelen, A. H., Fernandes, F., et al. (2015). European seaweeds under pressure: consequences for communities and ecosystem functioning. J. Sea Res. 98, 91–108. doi: 10.1016/J.SEARES.2014.11.004
Moeller, A. H., Peeters, M., Ndjango, J.-B., Li, Y., Hahn, B. H., and Ochman, H. (2013). Sympatric chimpanzees and gorillas harbor convergent gut microbial communities. Genome Res. 23, 1715–1720. doi: 10.1101/gr.154773.113
Molloy, S. D., Pietrak, M. R., Bouchard, D. A., and Bricknell, I. (2011). Ingestion of Lepeophtheirus salmonis by the blue mussel Mytilus edulis. Aquaculture 311, 61–64. doi: 10.1016/J.AQUACULTURE.2010.11.038
Naidoo, K., Maneveldt, G., Ruck, K., and Bolton, J. J. (2006). A comparison of various seaweed-based diets and formulated feed on growth rate of abalone in a land-based aquaculture System. J. Appl. Phycol. 18, 437–443. doi: 10.1007/s10811-006-9045-7
Nedergaard, R. I., Risgaard-Petersen, N., and Finster, K. (2002). The importance of sulfate reduction associated with Ulva lactuca thalli during decomposition: a mesocosm experiment. J. Exp. Mar. Bio. Ecol. 275, 15–29. doi: 10.1016/S0022-0981(02)00211-3
Nelson, C. E., Goldberg, S. J., Wegley Kelly, L., Haas, A. F., Smith, J. E., Rohwer, F., et al. (2013). Coral and macroalgal exudates vary in neutral sugar composition and differentially enrich reef bacterioplankton lineages. ISME J. 7, 962–979. doi: 10.1038/ismej.2012.161
Neori, A., Chopin, T., Troell, M., Buschmann, A. H., Kraemer, G. P., Halling, C., et al. (2004). Integrated aquaculture: rationale, evolution and state of the art emphasizing seaweed biofiltration in modern mariculture. Aquaculture 231, 361–391. doi: 10.1016/J.AQUACULTURE.2003.11.015
Park, S., and Yoon, J. H. (2013). Glaciecola aquimarina sp. nov., a gammaproteobacterium isolated from coastal seawater. Antonie Van Leeuwenhoek 103, 1141–1148. doi: 10.1007/s10482-013-9896-2
Pedregosa, F., Varoquaux, G., Gramfort, A., Michel, V., Thirion, B., Grisel, O., et al. (2011). Scikit-learn: machine learning in python. J. Mach. Learn. Res. 12, 2825–2830.
Rieck, A., Herlemann, D. P. R., Jürgens, K., and Grossart, H.-P. (2015). Particle-associated differ from free-living bacteria in surface waters of the Baltic Sea. Front. Microbiol. 6:1297. doi: 10.3389/fmicb.2015.01297
Romanenko, L. A., Zhukova, N. V., Rohde, M., Lysenko, A. M., Mikhailov, V. V., and Stackebrandt, E. (2003). Glaciecola mesophila sp. nov., a novel marine agar-digesting bacterium. Int. J. Syst. Evol. Microbiol. 53, 647–651. doi: 10.1099/ijs.0.02469-0
Santos, S. A. O., Vilela, C., Freire, C. S. R., Abreu, M. H., Rocha, S. M., and Silvestre, A. J. D. (2015). Chlorophyta and Rhodophyta macroalgae: a source of health promoting phytochemicals. Food Chem. 183, 122–128. doi: 10.1016/j.foodchem.2015.03.006
Schuenhoff, A., Shpigel, M., Lupatsch, I., Ashkenazi, A., Msuya, F. E., and Neori, A. (2003). A semi-recirculating, integrated system for the culture of fish and seaweed. Aquaculture 221, 167–181. doi: 10.1016/S0044-8486(02)00527-6
Shpigel, M., Guttman, L., Shauli, L., Odintsov, V., Ben-Ezra, D., and Harpaz, S. (2017). Ulva lactuca from an Integrated Multi-Trophic Aquaculture (IMTA) biofilter system as a protein supplement in gilthead seabream (Sparus aurata) diet. Aquaculture 481, 112–118. doi: 10.1016/j.aquaculture.2017.08.006
Skår, C. K., and Mortensen, S. (2007). Fate of infectious salmon anaemia virus (ISAV) in experimentally challenged blue mussels Mytilus edulis. Dis. Aquat. Organ. 74, 1–6. doi: 10.3354/dao074001
Smetacek, V., and Zingone, A. (2013). Green and golden seaweed tides on the rise. Nature 504, 84–88. doi: 10.1038/nature12860
Spoerner, M., Wichard, T., Bachhuber, T., Stratmann, J., and Oertel, W. (2012). Growth and thallus morphogenesis of Ulva mutabilis (Chlorophyta) depends on a combination of two bacterial species excreting regulatory factors. J. Phycol. 48, 1433–1447. doi: 10.1111/j.1529-8817.2012.01231.x
Steinhagen, S., Barco, A., Wichard, T., and Weinberger, F. (2019a). Conspecificity of the model organism Ulva mutabilis and Ulva compressa (Ulvophyceae, Chlorophyta). J. Phycol 55, 25–36. doi: 10.1111/jpy.12804
Steinhagen, S., Weinberger, F., and Karez, R. (2019b). Molecular analysis of Ulva compressa (Chlorophyta, Ulvales) reveals its morphological plasticity, distribution and potential invasiveness on German North Sea and Baltic Sea coasts. Eur. J. Phycol. 54, 102–114. doi: 10.1080/09670262.2018.1513167
Tarakhovskaya, E. R., Maslov, Y. I., and Shishova, M. F. (2007). Phytohormones in algae. Russ. J. Plant Physiol. 54, 163–170. doi: 10.1134/S1021443707020021
Thomas, T., Evans, F. F., Schleheck, D., Mai-Prochnow, A., Burke, C., Penesyan, A., et al. (2008). Analysis of the Pseudoalteromonas tunicata genome reveals properties of a surface-associated life style in the marine environment. PLoS One 3:e3252. doi: 10.1371/journal.pone.0003252
Wada, S., Aoki, M. N., Tsuchiya, Y., Sato, T., Shinagawa, H., and Hama, T. (2007). Quantitative and qualitative analyses of dissolved organic matter released from Ecklonia cava Kjellman, in Oura Bay, Shimoda, Izu Peninsula, Japan. J. Exp. Mar. Bio. Ecol. 349, 344–358. doi: 10.1016/J.JEMBE.2007.05.024
Weiss, A., Costa, R., and Wichard, T. (2017a). Morphogenesis of Ulva mutabilis (Chlorophyta) induced by Maribacter species (Bacteroidetes, Flavobacteriaceae). Bot. Mar. 60, 197–206. doi: 10.1515/bot-2016-0083
Weiss, S., Xu, Z. Z., Peddada, S., Amir, A., Bittinger, K., Gonzalez, A., et al. (2017b). Normalization and microbial differential abundance strategies depend upon data characteristics. Microbiome 5:27. doi: 10.1186/s40168-017-0237-y
White, T. J., Bruns, T., Lee, S., and Taylor, J. (1990). “Amplification and direct sequencing of fungal ribosomal RNA genes for phylogenetics,” in PCR protocols: A guide to methods and applications, eds D. H. Gelfand, J. J. Sninsky, and T. J. White (San Diego: Academic Press), 315–322. doi: 10.1016/b978-0-12-372180-8.50042-1
Wichard, T. (2015). Exploring bacteria-induced growth and morphogenesis in the green macroalga order Ulvales (Chlorophyta). Front. Plant Sci. 6:86. doi: 10.3389/fpls.2015.00086
Wichard, T. (2016). Identification of metallophores and organic ligands in the chemosphere of the marine macroalga Ulva (Chlorophyta) and at land-sea interfaces. Front. Mar. Sci. 3:131. doi: 10.3389/fmars.2016.00131
Wichard, T., and Beemelmanns, C. (2018). Role of chemical mediators in aquatic interactions across the prokaryote-eukaryote boundary. J. Chem. Ecol. 44, 1008–1021. doi: 10.1007/s10886-018-1004-7
Wiese, J., Thiel, V., Nagel, K., Staufenberger, T., and Imhoff, J. F. (2009). Diversity of antibiotic-active bacteria associated with the brown alga Laminaria saccharina from the baltic sea. Mar. Biotechnol. 11, 287–300. doi: 10.1007/s10126-008-9143-4
Woolcott, G. W., and King, R. J. (1999). Ulva and Enteromorpha (Ulvales, Ulvophyceae, Chlorophyta) in eastern Australia: comparison of morphological features and analyses of nuclear rDNA sequence data. Aust. Syst. Bot. 12, 709–725. doi: 10.1071/SB97034
Xia, Y., Kong, Y., Thomsen, T. R., and Halkjaer Nielsen, P. (2008). Identification and ecophysiological characterization of epiphytic protein-hydrolyzing Saprospiraceae (CandidatusEpiflobacter spp.) in activated sludge. Appl. Environ. Microbiol. 74, 2229–2238. doi: 10.1128/AEM.02502-07
Zhang, Y.-J., Zhang, X.-Y., Mi, Z.-H., Chen, C.-X., Gao, Z.-M., Chen, X.-L., et al. (2011). Glaciecola arctica sp. nov., isolated from Arctic marine sediment. Int. J. Syst. Evol. Microbiol. 61, 2338–2341. doi: 10.1099/ijs.0.027326-0
Keywords: algal morphogenesis, blue economy, green algae, host–microbe interactions, IMTA, infochemicals, morphogen, sea lettuce
Citation: Califano G, Kwantes M, Abreu MH, Costa R and Wichard T (2020) Cultivating the Macroalgal Holobiont: Effects of Integrated Multi-Trophic Aquaculture on the Microbiome of Ulva rigida (Chlorophyta). Front. Mar. Sci. 7:52. doi: 10.3389/fmars.2020.00052
Received: 05 November 2019; Accepted: 27 January 2020;
Published: 12 February 2020.
Edited by:
Bernardo Antonio Perez Da Gama, Universidade Federal Fluminense, BrazilReviewed by:
Alejandro H. Buschmann, University of Los Lagos, ChileHenrique Fragoso Santos, Universidade Federal Fluminense, Brazil
Copyright © 2020 Califano, Kwantes, Abreu, Costa and Wichard. This is an open-access article distributed under the terms of the Creative Commons Attribution License (CC BY). The use, distribution or reproduction in other forums is permitted, provided the original author(s) and the copyright owner(s) are credited and that the original publication in this journal is cited, in accordance with accepted academic practice. No use, distribution or reproduction is permitted which does not comply with these terms.
*Correspondence: Thomas Wichard, VGhvbWFzLldpY2hhcmRAdW5pLWplbmEuZGU=