 Catalina Vásquez-Carrillo1,2*
 Carmen L. Noriega-Hoyos3
 Leidy Hernandez-Rivera3Guiomar Aminta Jáuregui-Romero3,4
 Kathleen Sullivan Sealey1
- 1Coastal Ecology Laboratory, Department of Biology, University of Miami, Coral Gables, FL, United States
- 2Miami Dade College, Miami, FL, United States
- 3Programa de Conservación de Tortugas y Mamíferos Marinos – ProCTMM, Acuario Mundo Marino – Universidad Jorge Tadeo Lozano, Magdalena, Colombia
- 4Departamento de Ciencias Naturales e Ingeniería, Universidad de Bogotá Jorge Tadeo Lozano, Bogotá, Colombia
The Atlantic green sea turtle Chelonia mydas is a migratory and endangered species with a network of nesting rookeries (NRs) and foraging grounds (FGs) in the Atlantic basin that needs elucidation. FGs are important areas for immature turtle’s feeding and growth after pelagic migrations. Aggregations of sea turtles at these grounds usually come from genetically distinct NRs; therefore, they are called mixed stocks. The northeastern coast of Colombia has extensive seagrass and macroalgae marine ecosystems that constitute FGs, and perhaps long-term developmental habitats for a significant number of immature C. mydas. However, it is unknown which C. mydas NRs may be using these ecosystems for feeding and development. This study estimated the genetic diversity and genetic origin of C. mydas mixed stocks at two FGs in northeastern Colombia (Santa Marta and La Guajira), and inferred their connections to NRs groups in the Atlantic basin using mitochondrial Control Region (mtCR) as a marker. A high genetic diversity, evidenced by the high nucleotide and haplotype diversities, was found in both studied mixed stocks and may be explained by different contributing NRs groups found with mixed stock analyses (MSAs). At least three genetically distinct groups from different sides of the Atlantic Basin contributed juveniles to the mixed stocks in Colombia. Observed demographic connectivity can be explained by the confluence of two major, opposite directions ocean currents by the study area, the Caribbean Current (westward) and the Panama-Colombia Countercurrent (eastward). The high diversity of turtles at Colombia’s FGs suggests that the area is an important link in the network of habitats used by C. mydas to be considered in management and transnational conservation planning for the species recovery.
Introduction
The Atlantic green sea turtle, Chelonia mydas, is a highly migratory, pantropically distributed marine species, currently listed as endangered (Seminoff, 2004). C. mydas was an abundant species with multiple nesting rookeries (NRs) (i.e., sandy beaches where colonies of females aggregate to nest) prior to the European arrival to the Tropical Western Atlantic (Wider Caribbean) (Jackson et al., 2001; McClenachan et al., 2006). However, the species has declined in size and number of NRs dramatically over the past 100 years. Reductions in size of populations often result in the loss of genetic diversity, a major component of biodiversity (within species diversity). Genetic diversity loss decreases the reproduction and survival rates (e.g., from inbreeding depression), and further reduces population sizes (Lacy, 1997; Frankham, 2005). This positive feedback loop between small population size and low genetic diversity coined “the vortex effect” can ultimately lead to extinction depending on the species life history traits (Gilpin and Soulé, 1986; Hughes et al., 2008).
Chelonia mydas has a complex life cycle with multiple habitat shifts and long migrations that increase its vulnerability to extinction (Arthur et al., 2008). During C. mydas’ life cycle, the hatchling rapidly disperses out of NRs to the pelagic environment with the help of rapid ocean current systems (Carr and Meylan, 1980; Luschi et al., 2003). The hatchling remains in the pelagic environment for long periods avoiding nearshore predation until it reaches the juvenile life stage (Lutz et al., 2002; Jensen et al., 2016). Once the juvenile has reached a certain size [∼20 cm straight carapace length (SCL)], it finds shallow coastal areas where food and shelter are available called foraging grounds (FGs) or developmental habitats if the turtle takes residence in the area (Lutz et al., 2002; Meylan et al., 2011). Juvenile and subadult (immature adult C. mydas) can use the same FG for several years and turtles using one FG can come from one, or more often, multiple NRs; Therefore, the aggregation of turtles at these grounds are called mixed stocks (Bolker et al., 2007; Bjorndal and Bolten, 2008). Once C. mydas reaches maturity, it migrates from FGs back to the same NR of birth for reproduction and nesting (Lutz et al., 2002; Meylan et al., 2011). However, C. mydas progression though its life cycle can be disrupted if mortality occurs during the long-lasting juvenile and subadult stages at FGs, affecting greatly its populations in the Atlantic Ocean (Heppell et al., 2003). Current threats to the survival of C. mydas at FGs include direct fishing and fishing bycatch, coastal habitat loss and fragmentation, and marine pollution (Bjorndal et al., 1994; Valiela et al., 2001; Campbell and Lagueux, 2005; Koch et al., 2006; Waycott et al., 2009; Gilman et al., 2010; Finkbeiner et al., 2011). Mortality of juvenile and or subadult C. mydas at FGs stops the immigration of adults to NRs for reproduction, reducing population reproductive rates and sizes. Due to the mixed origin of juvenile C. mydas at FGs, mortality at these grounds can affect different populations at NRs. The identification and clarification of which NRs are using which FGs, or what are the connectivity patterns of these two types of habitats can provide valuable information for the conservation of Atlantic C. mydas.
In the Atlantic basin, large-scale patterns of connectivity through dispersal between C. mydas NRs and their FGs have been elucidated using genetic markers such as the mitochondrial Control Region (mtCR) (Bass et al., 1998, 2006; Lahanas et al., 1998; Monzón-Argüello et al., 2010; Amorocho et al., 2012; Naro-Maciel et al., 2012). Matrilineally-inherited DNA such as the mtCR differs among NRs of C. mydas. Females and some males return to mate and nest to the same nesting areas of birth; therefore, turtles from the same NR are more genetically similar than they are to turtles from a different NR at this type of DNA (Bowen et al., 1992; Roberts et al., 2004); as such, mtCR DNA works as a natural mark on juvenile turtles to identify the NR they originate from (Bowen, 1995). These studies showed that a close-to-home pattern of connectivity between NRs and FGs occurs within Atlantic Ocean regions (Bass et al., 2006; Bolker et al., 2007). For instance, turtles born at NRs within the southeastern Atlantic are more likely to forage and/or develop at FGs found in this same region than in another (Bolker et al., 2007). This regional pattern of demographic connectivity can be explained by dispersion of hatchling turtles on major ocean current systems in which C. mydas hatchlings carried away from NRs by a given current system will more likely end up utilizing FGs influenced by the same current system (Bass et al., 2006; Monzón-Argüello et al., 2010).
However, patterns of NR-FG connectivity in the Atlantic are more difficult to determine within regions, in part due to the lack of knowledge about the location and size of many FGs, and because FGs at key areas of connectivity, such as boundary areas between ocean currents, have not been studied (Bolker et al., 2007). The northeastern Colombia in the southwestern Caribbean Sea harbors nearshore marine ecosystems such as seagrass and macroalgae beds that are suitable for C. mydas juvenile foraging and development (Díaz et al., 2003; Vasquez-Carrillo and Sullivan Sealey, 2018). The most extensive seagrass and macroalgae beds of Colombia occur in this region, along La Guajira peninsula (Gómez-Lopez et al., 2014). Juvenile and subadult C. mydas associate to these ecosystems, most likely in foraging activities (Ceballos-Fonseca, 2004; Vásquez-Carrillo, 2017). The region is located among two major opposite direction major Caribbean Sea currents, the Caribbean current and the Colombia-Panama Gyre (Johns et al., 2002; Invemar and Corpoguajira, 2012). Consequently, it is expected that juvenile C. mydas recruit to the northeastern Colombia to forage after pelagic migrations from several NRs in the Caribbean Sea and even from other regions of the Atlantic Ocean.
This study aimed to characterize the demographic connectivity (through dispersal) of two C. mydas FGs in northeastern Colombia, one in La Guajira peninsula and the other one in Ciénaga Grande de Santa Marta, to multiple NRs of the species throughout the Atlantic Ocean. This study employed the mtCR as marker to identify the NRs of origin of immature C. mydas sampled at the two studied FGs. If C. mydas from different regions in the Atlantic are recruiting into northeast Colombia FGs to feed and develop, high levels of genetic diversity are expected in the mixed stocks found in this area. Therefore, this study also aimed to assess the levels of genetic diversity of C. mydas mixed stocks in northeastern Colombia and tried to identify possible explanations to observed genetic diversity and connectivity patterns.
Materials and Methods
Study Area and Season
The study took place in the northeastern coast of Colombia, southern Caribbean Sea, which encloses two distinct oceanographic regions of the country according to Ricaurte-Villota and Bastidas Salamanca (2017): La Guajira-Tayrona and Ciénaga Grande de Santa Marta (Figure 1). These regions differ not only in their oceanographic conditions, but also ecologically. La Guajira-Tayrona has extensive, diverse, shallow seagrass, and mixed macroalgae beds with low anthropogenic disturbance (Gómez-Lopez et al., 2014; Ricaurte-Villota and Bastidas Salamanca, 2017). Conversely, the Ciénaga Grande de Santa Marta region, which is located between the Magdalena River and the Sierra Nevada de Santa Marta, is composed of a series of shallow bays and inlets with patchy disturbed seagrass and algae beds (Garzón-Ferreira and Cano, 1991; Díaz et al., 2003).
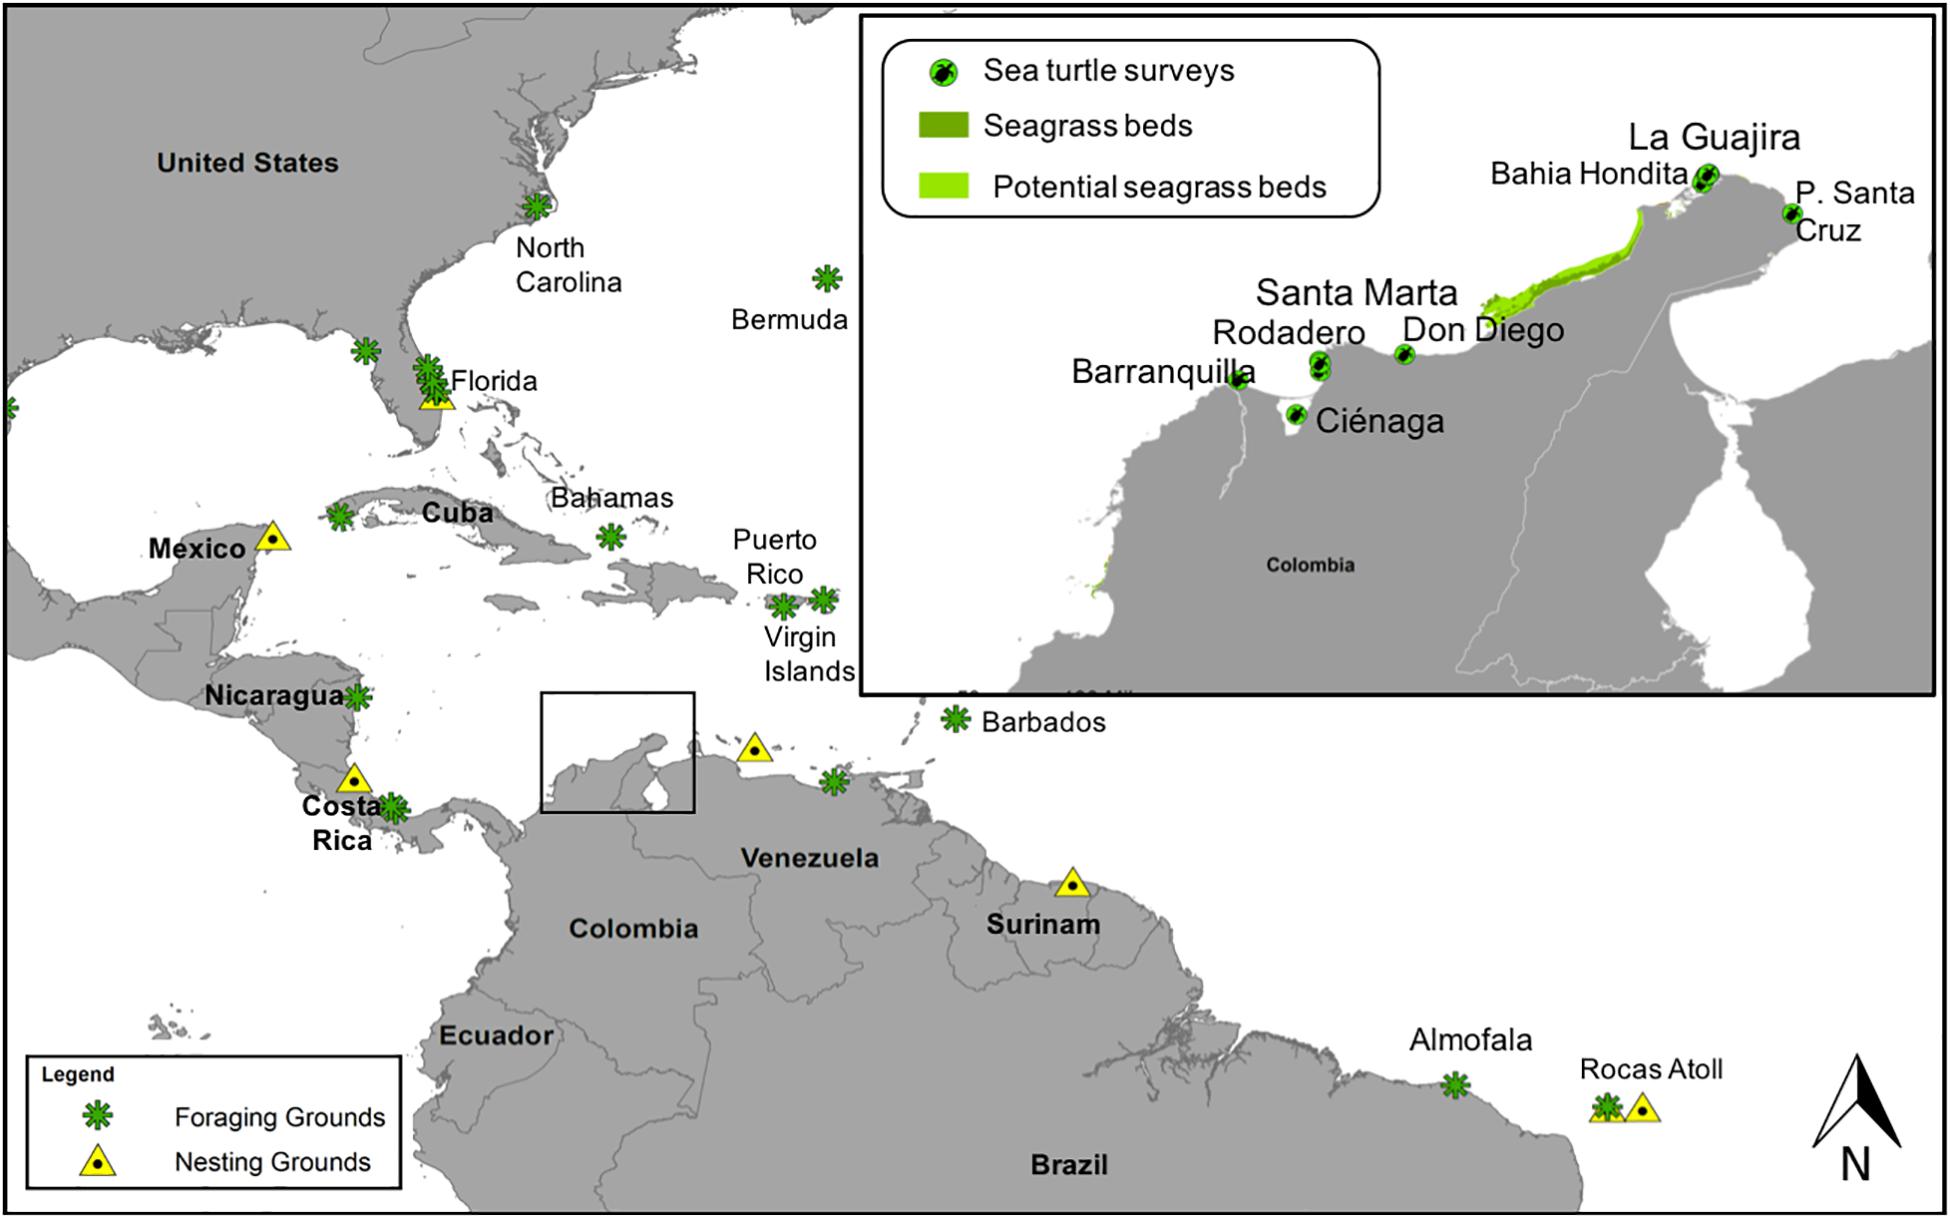
Figure 1. Location of two Chelonia mydas foraging grounds in northeastern Colombia, southern Caribbean Sea (square), Santa Marta, and La Guajira. Specific survey sites and the location of C. mydas nesting rookeries (yellow triangles) and other foraging grounds (green asterisks) are shown in the Atlantic Ocean (references at Supplementary Table 1).
Both La Guajira and Santa Marta are foci of the seasonal Southern Caribbean Upwelling System (Arévalo-Martínez and Franco-Herrera, 2008; Rueda-Roa and Muller-Karger, 2013). This coastal upwelling system is the result of the Caribbean Low-Level Jet of the north trade winds, which blows almost parallel to the coast of Colombia during the first third of the year (January to May), a period known as the “dry season” (Invemar and Corpoguajira, 2012). From July to December, there is no upwelling because the direction of the trade winds changes and the rain falls, so this period is coined the “wet season” (Invemar and Corpoguajira, 2012). Due to this coastal upwelling, variation in nutrient supply and thus in productivity may affect foraging sources and their availability for juvenile turtles (Arévalo-Martínez and Franco-Herrera, 2008; Paramo et al., 2011), as has been reported for other marine vertebrates such as dolphins (e.g., Farías-Curtidor et al., 2017; Barragán-Barrera et al., 2019). C. mydas feeds on seagrasses and marine macroalgae primarily but also on small marine invertebrates (Bjorndal, 1980; Mortimer, 1981; Seminoff et al., 2002; Makowski et al., 2006; Amorocho and Reina, 2007; Shimada et al., 2014). The high nutrient concentrations in upwelled waters may enhance growth rates of benthic microalgae, which become dominant during the upwelling season but not during the wet season (Díaz-Pulido and Garzón-Ferreira, 2002). Abundance of forage offer may attract sea turtles during the dry season. Also, the change in direction of the trade winds with seasons affects the direction and strength of current systems reaching the study area. Two fast current systems reach Colombian waters, the Caribbean current, which flows east to west, and the Panama-Colombia gyre which flows in the opposite direction (Andrade et al., 2003). Only during the wet season, the Panama-Colombia gyre is capable of reaching Santa Marta and La Guajira areas (Arévalo-Martínez and Franco-Herrera, 2008; Invemar and Corpoguajira, 2012). Consequently, the group of turtles observed in the study area may vary from dry to wet seasons. This study surveyed C. mydas from both wet and dry seasons and from both La Guajira and Santa Marta regions to assess their genetic diversity and populations of origin.
Sample Collection
Artisanal fishing activities take place in nearshore, shallow waters (<10 m deep) in the study area and often result in incidental catch of sea turtles—especially of C. mydas (Rueda et al., 1992). For this study, samples were obtained from local fishermen who allowed access to fishing bycaught C. mydas, at different fishing ports and at different times during the year, from years 2014 to 2017. Fishing ports in La Guajira included Bahia Hondita lagoon and Puerto Santa Cruz fishing port (see Figure 1). In the Santa Marta region, turtles surveyed came from fishing areas in Barranquilla, Ciénaga Grande de Santa Marta, Santa Marta, and Don Diego (see Figure 1).
The body size [curve and straight carapace length] of C. mydas turtles was measured on dead or alive bycaught turtles, in order to estimate the life stage of the turtle. Turtle’s life stage was estimated using a length-to-stage conversion scale obtained from published estimates of size at maturity of other Caribbean C. mydas populations (Rueda et al., 1992; Meylan et al., 2011). Only C. mydas that were at juvenile or subadult stages were analyzed in this study (n = 43). Following the protocol of Dutton and Balazs (1995), a 3 mm diameter tissue piece was taken from the edge of the back-flipper of the turtles, using a circular, plastic biopsy puncher. Tissue samples were stored in 70% ethanol until genetic laboratory procedures were performed at the Genetics laboratories of the Universidad Jorge Tadeo Lozano and the Universidad del Magdalena (Research protocol no. 14-142 approved by the University of Miami Institutional Animal Care and Use Committee). Samples were kept frozen until DNA extraction was performed.
Genetic Analyses
DNA Extraction, PCR Amplification, and Sequencing
Genomic DNA was extracted using either standard organic solvents-based procedures or specialized kits for which the manufacturer’s instructions were followed (i.e., DNeasy Blood and Tissue kit, Qiagen Inc., Germantown, MD, United States). The mtCR was amplified by standard PCR reactions using primers HL950 and LCM15382 (∼790 bp) (Abreu-Grobois et al., 2006), at an annealing temperature of 51°C. The PCR products were sequenced in both directions using automated Sanger sequencing (Sanger and Coulson, 1975), in an ABI PRISM 3500 sequencer at Universidad de Los Andes (Bogotá, Colombia). Forward and reverse DNA sequences were aligned and manually inspected for errors using software Geneious v.6 (Kearse et al., 2012).
Genetic Diversity and Population Structure
The species identity of 781 bp long mtCR obtained sequences was verified by comparison to sequences reported in Genbank1 using the Blast algorithm. The call IDs for mtCR haplotypes were obtained from a reference list compiled by the University of Florida’s Archie Carr Center for Sea Turtle Research for the Atlantic Ocean C. mydas2. The mtCR haplotype frequencies in Colombia’s mixed stocks were estimated using DnaSP v.6 (Rozas and Rozas, 1999). Both haplotype diversity (Hd) and nucleotide diversity (π) indices (Nei, 1972) were calculated using software DnaSP. The variation in mtCR allele sequences was used to estimate the genetic differentiation of FGs in northeastern Colombia from the rest of the Atlantic FGs and NRs, using pairwise Φst indices in software Arlequin v.3.5 (Excoffier et al., 2005). Global and pairwise population differentiation exact tests (Raymond and Rousset, 1995) were performed using mtCR allele frequencies for comparison and software Arlequin. Atlantic NRs and FGs included in these and following analyses [spatial molecular variance analysis (SAMOVA) and MSAs], as well as their literature references, are shown in Supplementary Table 1.
In order to identify which NRs are contributing sea turtles to the mixed stocks in Colombia’s FGs, mixed stock analyses (MSAs) were performed (Pella and Masuda, 2001). This method requires prior knowledge on the distribution of genetic variation of source populations, NRs in this case, in order to estimate the probability of contribution of each source population to a mixed stock at an FG of interest. Previous works on Atlantic C. mydas genetics have indicated that the structure of genetic variation concentrates among groups of NRs and not among NRs, with four spatially coherent, genetically different NRs groups inferred from mtDNA data (Bolker et al., 2007; Monzón-Argüello et al., 2010). Three of these four groups are found in each of three regions of juvenile turtle exchange between NRs and FGs proposed by Bolker et al. (2007) (Monzón-Argüello et al., 2010). After these findings, genetic information on several NRs and FGs in the Atlantic Ocean—including the two of this study—has been published. Thus, this study expanded previous works to include published observed mtCR allele frequencies data from FGs La Guajira, Bahamas, and five FGs in the southern Atlantic (see Supplementary Table 1), as well as one NRs (Cuba) (references in Supplementary Table 1). The structure of genetic variation was inferred using SAMOVA (Dupanloup et al., 2002). SAMOVA attempts to identify population groups by maximizing Fct, the genetic differentiation due to among-groups structure, which is the case in Atlantic C. mydas (Monzón-Argüello et al., 2010). Software SAMOVA v.2.0 (available at: http://cmpg.unibe.ch/software/samova2/) was used to perform this analysis with default parameters and testing multiple values of K, from K = 2–10.
Mixed Stock Analyses
The proportional contributions of genetically differentiated SAMOVA groups to the mixed stocks in northeast Colombia’s FGs (“La Guajira” and “Santa Marta”), and during different seasons (“Wet” vs. “Dry”), were estimated using several MSA methods. For all these methods, observed mtCR haplotype frequencies were employed. The first method performed was many-to-one Bayesian MSA which obtains the posterior probability of SAMOVA groups contributing individual turtles to the mixed stocks given the observed haplotype frequencies in the mixed stock (Pella and Masuda, 2001; Bolker et al., 2007). The confidence intervals of estimated contributions with this method were calculated with 10,000 Monte Carlo Markov chain iterations. A Gelman Rubin statistic of <1.2 was used to indicate convergence of all chains, a criterion for MSA estimates reliability. Many-to-one MSA-related statistics were performed using the “Mixstock” package (Bolker et al., 2007) in the software environment R 2.14.1 (R Core Team). Other traditional MSA methods applied here were conditional and unconditional maximum likelihood. These methods intend to maximize the likelihood function of the observed haplotype frequencies in the mixed sample (Pella and Masuda, 2001). The confidence intervals for the estimates of these two methods were calculated with standard (non-parametric) bootstrap method (1000 times), using the same software tools.
Results
Genetic Diversity of C. mydas at Northeast Colombia’s FGs
The genetic diversity of C. mydas’ mixed stocks at Colombia’s FGs was estimated from 43 juvenile and subadult turtles (size range 16.2–75.2 cm SCL, mean = 44.5 cm SCL) mtCR DNA sequences, 13 from Santa Marta FG and 30 from La Guajira FG. Twelve parsimony informative sites defined eleven different haplotypes in the sequence sample; these haplotypes had been previously described and annotated in Genbank (Supplementary Table 2). The haplotype diversity for the entire sample of Colombia was Hd = 0.800 (±0.039) and the nucleotide diversity was π = 0.008 (±0.001). La Guajira’s mixed stock had slightly higher nucleotide and haplotype diversities than Santa Marta’s mixed stock, although Santa Marta’s was a smaller sample (Table 1).
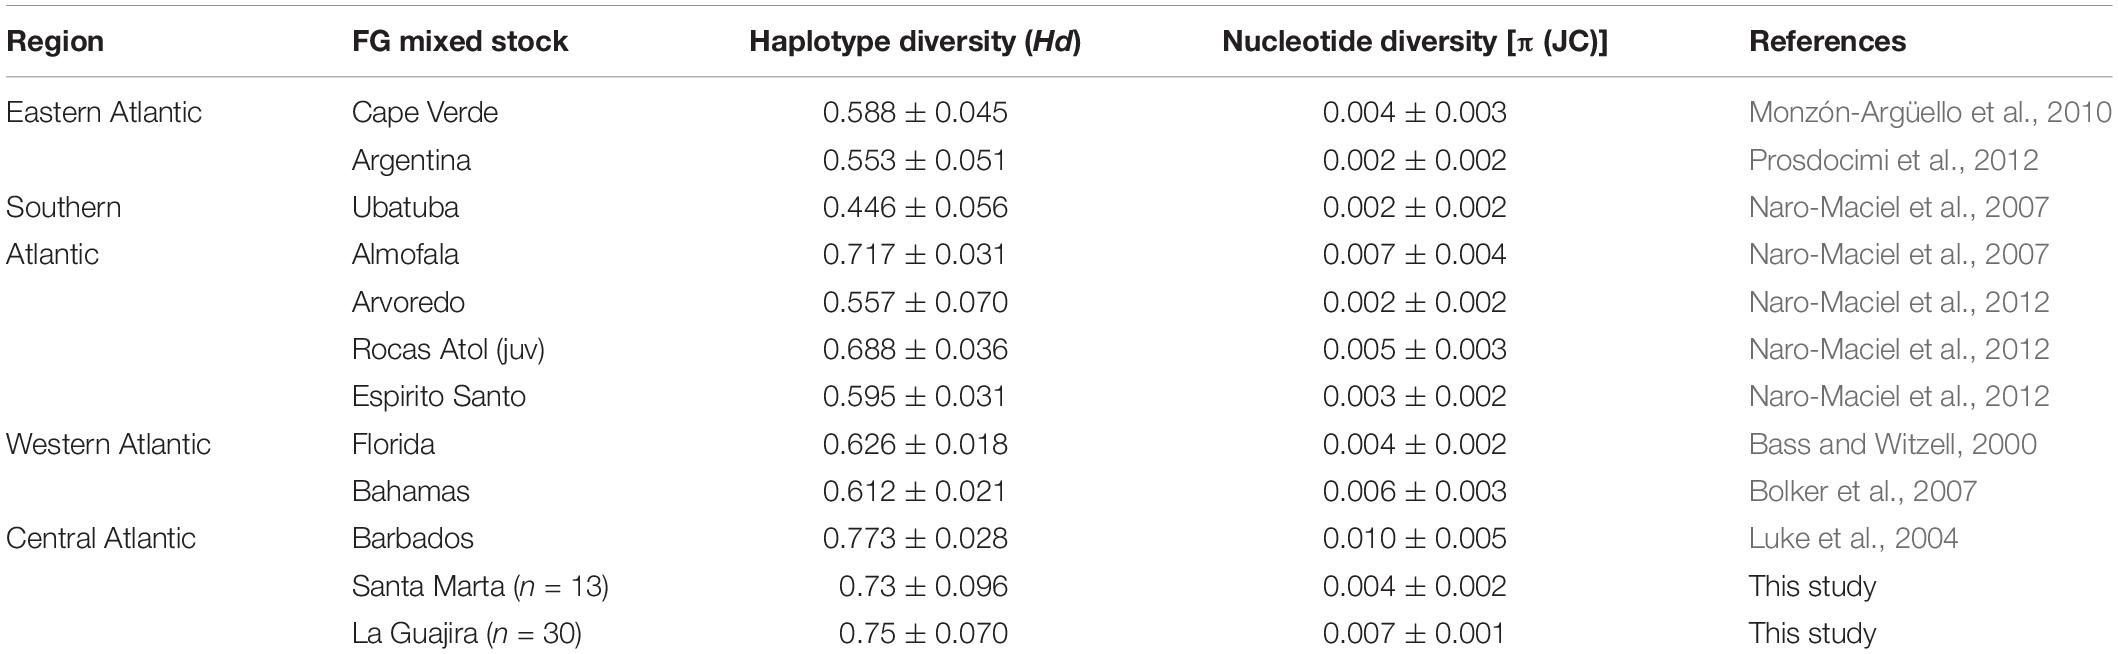
Table 1. Genetic diversity estimates of Atlantic Ocean foraging aggregations of juvenile Chelonia mydas surveyed in this study and other studies, based on the variation at the mitochondrial Control Region.
The mtCR haplotypes found in northeast Colombia mixed stocks differed in frequency, with some common haplotypes and a few other ones rare (Figure 2 and Supplementary Table 1). Also, haplotype frequencies differed between La Guajira and Santa Marta mixed stocks (Fisher’s exact test, p = 0.002). The most common haplotypes in La Guajira mixed stock were CM-A3 and CM-A5, which are very common in NRs of the Caribbean Sea. For instance, CM-A5 is the most common haplotype in Aves Island in Venezuela, whereas CM-A3 is very common in NRs of the western Caribbean including Costa Rica and Mexico. Conversely, the most common haplotypes in Santa Marta mixed stock were CM-A5 and CM-A8 (Figure 2). CM-A8 is more common in NRs outside of the Caribbean Sea, in the southern Atlantic, such as those in Brazil and off the west coast of Africa (e.g., Guinea Bissau) (Supplementary Table 1). Haplotype frequencies did not differ significantly between dry and wet weather seasons (Fisher’s exact test, p = 0.725). During both seasons, the most common haplotypes were CM-A3 and CM-A5.
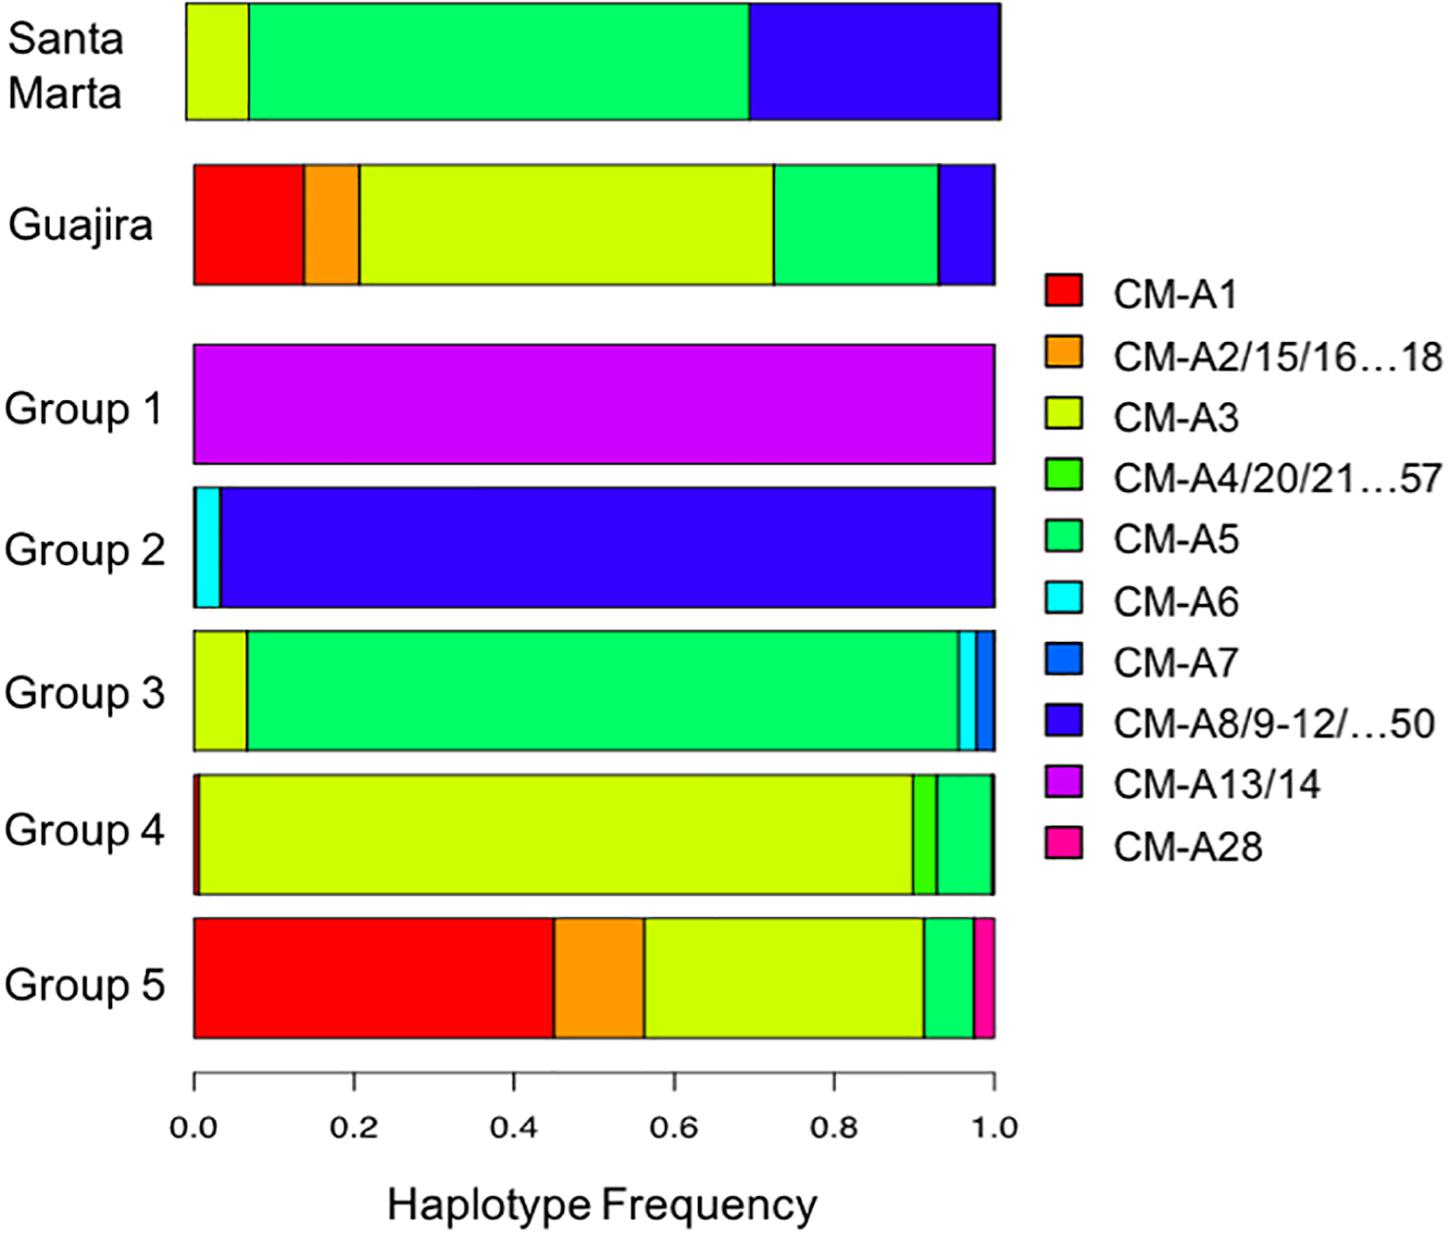
Figure 2. Mitochondrial Control Region haplotypes frequency of Chelonia mydas (NRs) groups and two foraging grounds (FGs) in northeastern Colombia according to SAMOVA. Horizontal axis shows the color of each C. mydas (CM) haplotype. Haplotypes with very low frequencies but of the same lineage were compiled within the same color code.
Considering the DNA polymorphism as well as the frequency distribution of mtCR haplotypes in the Colombian mixed stocks in comparison with other Atlantic Ocean’s mixed stocks and NRs, La Guajira was genetically different from all other Atlantic mixed stocks except Bahamas, and from all Atlantic NRs except Mexico (Table 2). When looking at the spatial arrangement of genetic variation with SAMOVA analysis, NRs of C. mydas were grouped into five genetically distinct groups, which corresponded to geographic regions within the Atlantic Ocean and Mediterranean Sea (outgroup) (SAMOVA K = 5, Fct = 0.673, p = 0.000) (Figure 3). Groups were (G1) Cyprus (in Mediterranean Sea), (G2) Florida and Mexico (in northern Caribbean Sea), (G3) Costa Rica and Cuba (in southern Caribbean Sea), (G4) Aves Island and Surinam (in central western Atlantic), and (5) Rocas Atoll, Trindade, Ascension, Guinea Bissau, Bioko, and Sao Tome (in southeastern and western Atlantic) (Figure 3). When pooling together all NRs (excluding Cyprus) and FGs, the minimum number of genetically differentiated and spatially homogenous groups obtained with SAMOVA analyses was six (K = 6, Fct = 0.472, p = 0.000) (Figure 3). Colombian FGs were grouped along with Barbados FGs in G1. Other groups were (G2) Florida and Mexico, (G3) Costa Rica, Cuba, and Bahamas, (G4) Aves Island and Surinam, (G5) Rocas Atoll, Trindade, Ascension Island, Argentina, Guinea Bissau, and Bioko, and (G6) Almofala, Fernando de Noronha, Bahia, Espirito Santo, Arvoredo, and Cape Verde (Figure 3).
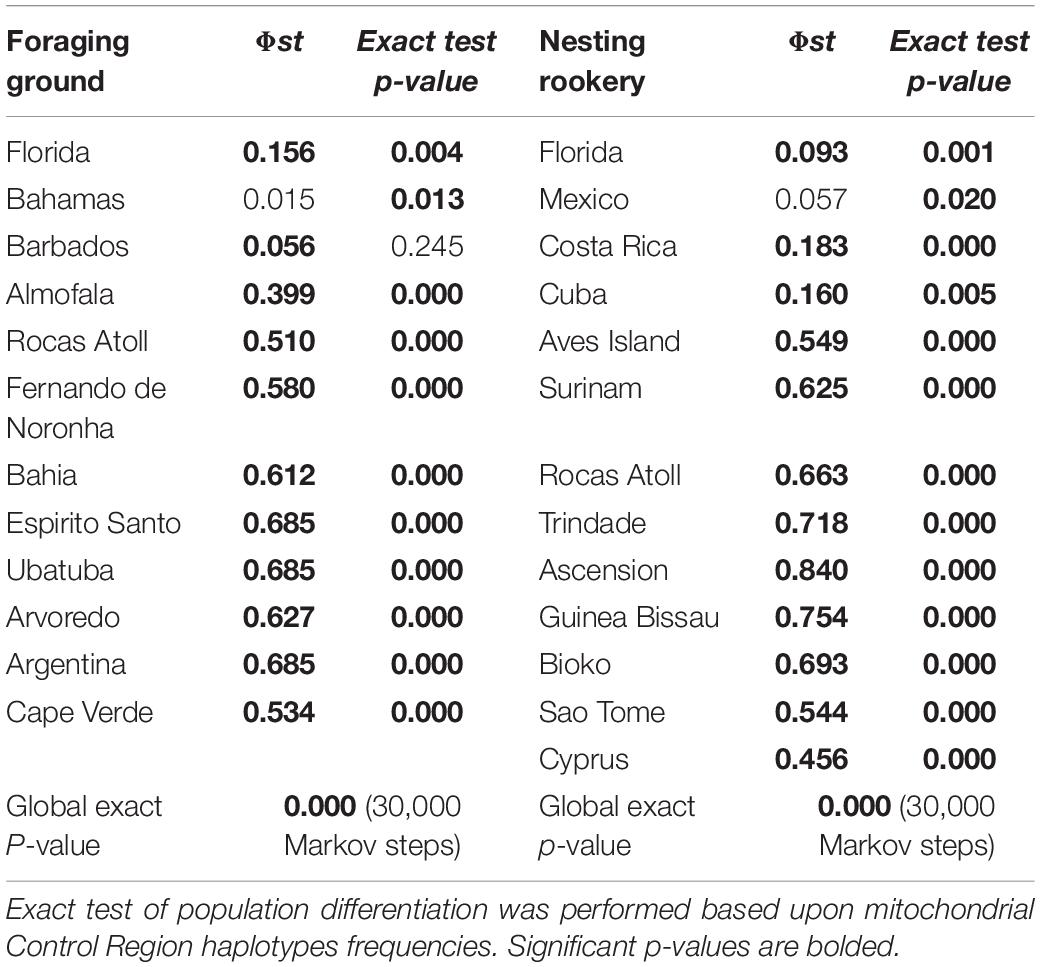
Table 2. Population differentiation (Φs) between Colombia’s stock of Chelonia mydas in La Guajira foraging ground (FG) and stocks in other FGs, as well as in nesting rookeries (NRs) in the Atlantic basin.
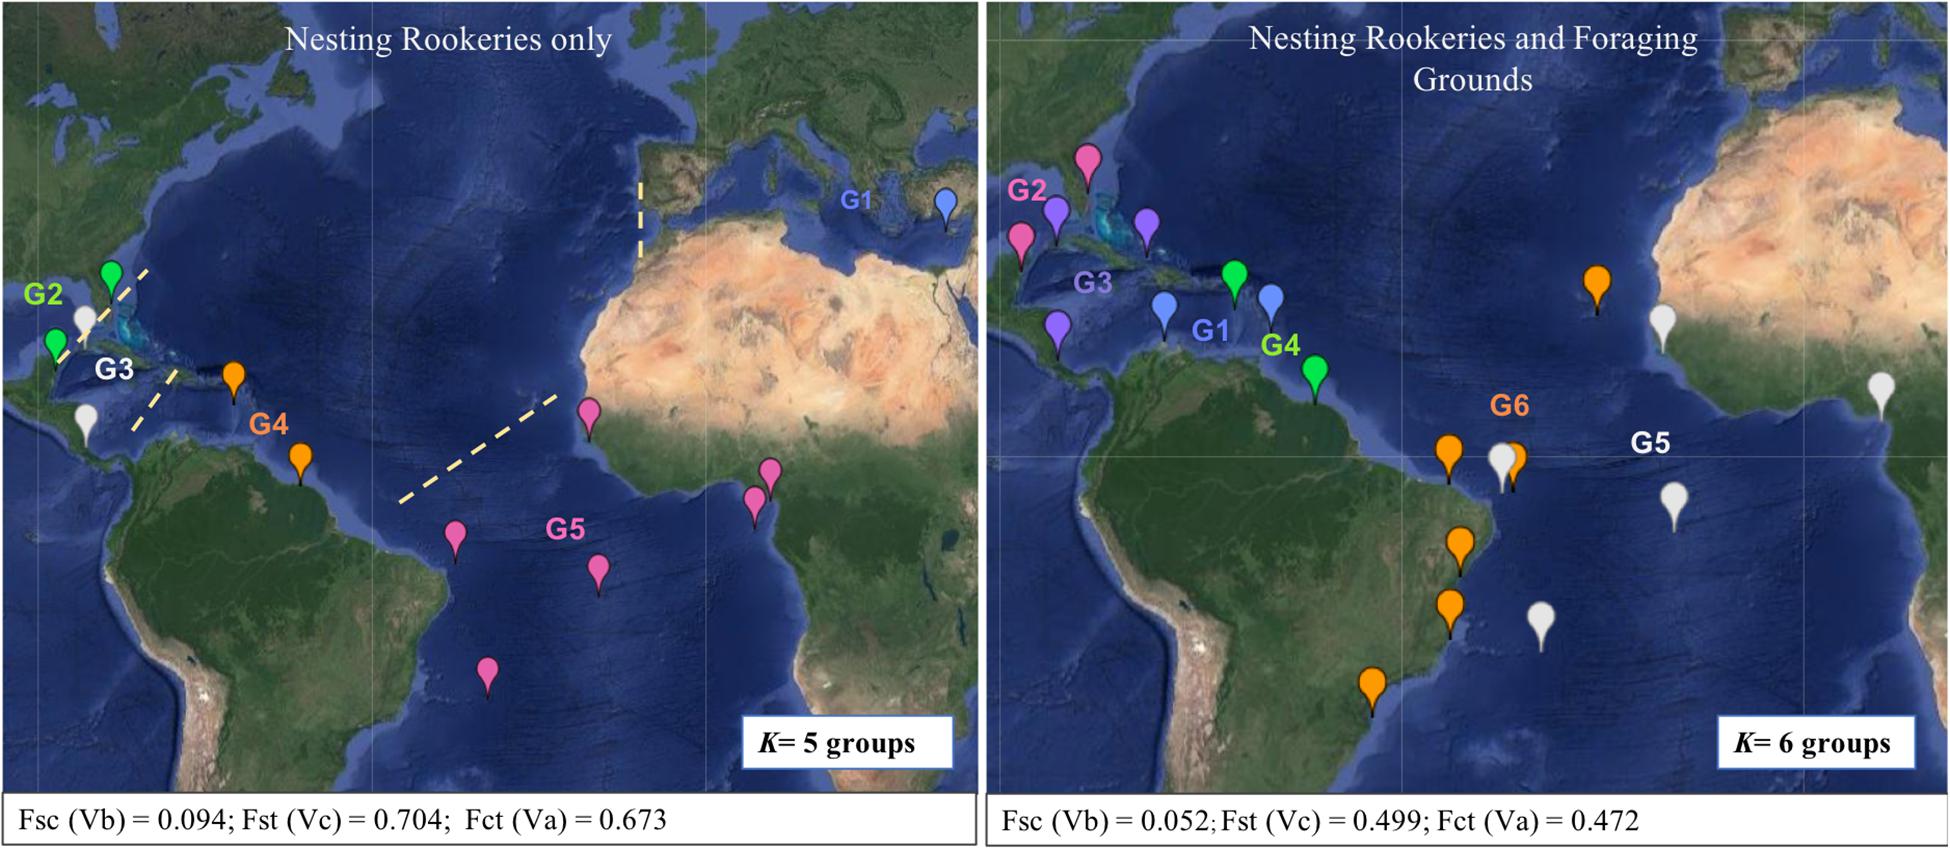
Figure 3. Geographic location of Chelonia mydas population groups (K) inferred by SAMOVA analyses (represented by different colors). In the left K = 5 considering nesting rookeries (NRs) only; and in the right K = 6 considering NRs and foraging grounds. Dashed lines indicate possible geographic barriers to dispersal between NRs.
NR Groups Contribution to C. mydas Mixed Stocks of Northeast Colombia
The estimated contributions of different SAMOVA NRs groups to the mixed stocks at FGs in Colombia were very similar among the analytic approaches conditional and unconditional maximum likelihoods and Bayesian, although confidence intervals of estimates were large (Table 3). All methods showed that four of the five groups (G2, G3, G4, and G5) are likely to contribute juvenile/immature turtles to the mixed stock in La Guajira FG although in different proportions. The greatest contributors were G2 (northern Caribbean Sea) and G3 (southern Caribbean Sea) with 36–45%, followed by G4 (central western Atlantic) with 14–17% and G5 (southeastern and western Atlantic) with 7%. Some differences in estimated contributions from groups G2 and G3 were observed among methods. For instance, using Bayesian MCMC, G2 had ∼10% greater contribution than the one estimated with maximum likelihood methods; G3 contribution was 10% greater with maximum likelihood methods than the with MCMC method (Table 3).
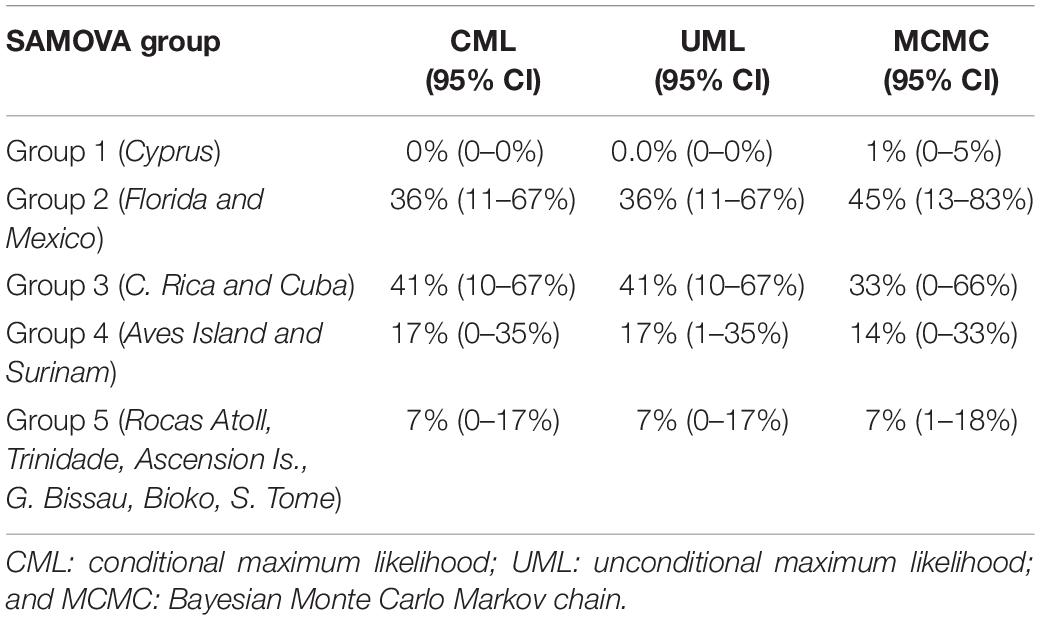
Table 3. Comparison of contributions from Chelonia mydas nesting rookeries groups estimated with SAMOVA analysis to the mixed stock in La Guajira, estimated with multiple inference methods.
Estimated percent contributions from SAMOVA groups differed between Colombian FGs (Fisher’s exact test, p < 0.001) (Figure 4). Using Bayesian MSA, the greatest contributors to La Guajira FG mixed stocks were groups G2 (45%) and G3 (33%), in the north and south of the western Caribbean Sea, respectively, whereas for Santa Marta FG, the greatest contributors were groups G4 (62%) (central western Atlantic) and G5 (30%) (central eastern and southern Atlantic) (Figure 4). Estimated contributions from SAMOVA groups to the mixed stocks in Colombia differed between wet and dry seasons, but these differences were non-significant (Fisher’s exact test, p = 0.07) (Figure 5). In both seasons, NRs groups in the Caribbean Sea G2 and G3, as well as in the central eastern and southern Atlantic G4 and G5, contributed to the mixed stocks in Colombia; however, their relative contributions differed. During the wet season, the southeastern and western Atlantic (G5) contributed more (52%) than in the dry season (20%), and the central western Atlantic group (G4) contributed less in the wet season (only 3%) than during the dry season (25%).
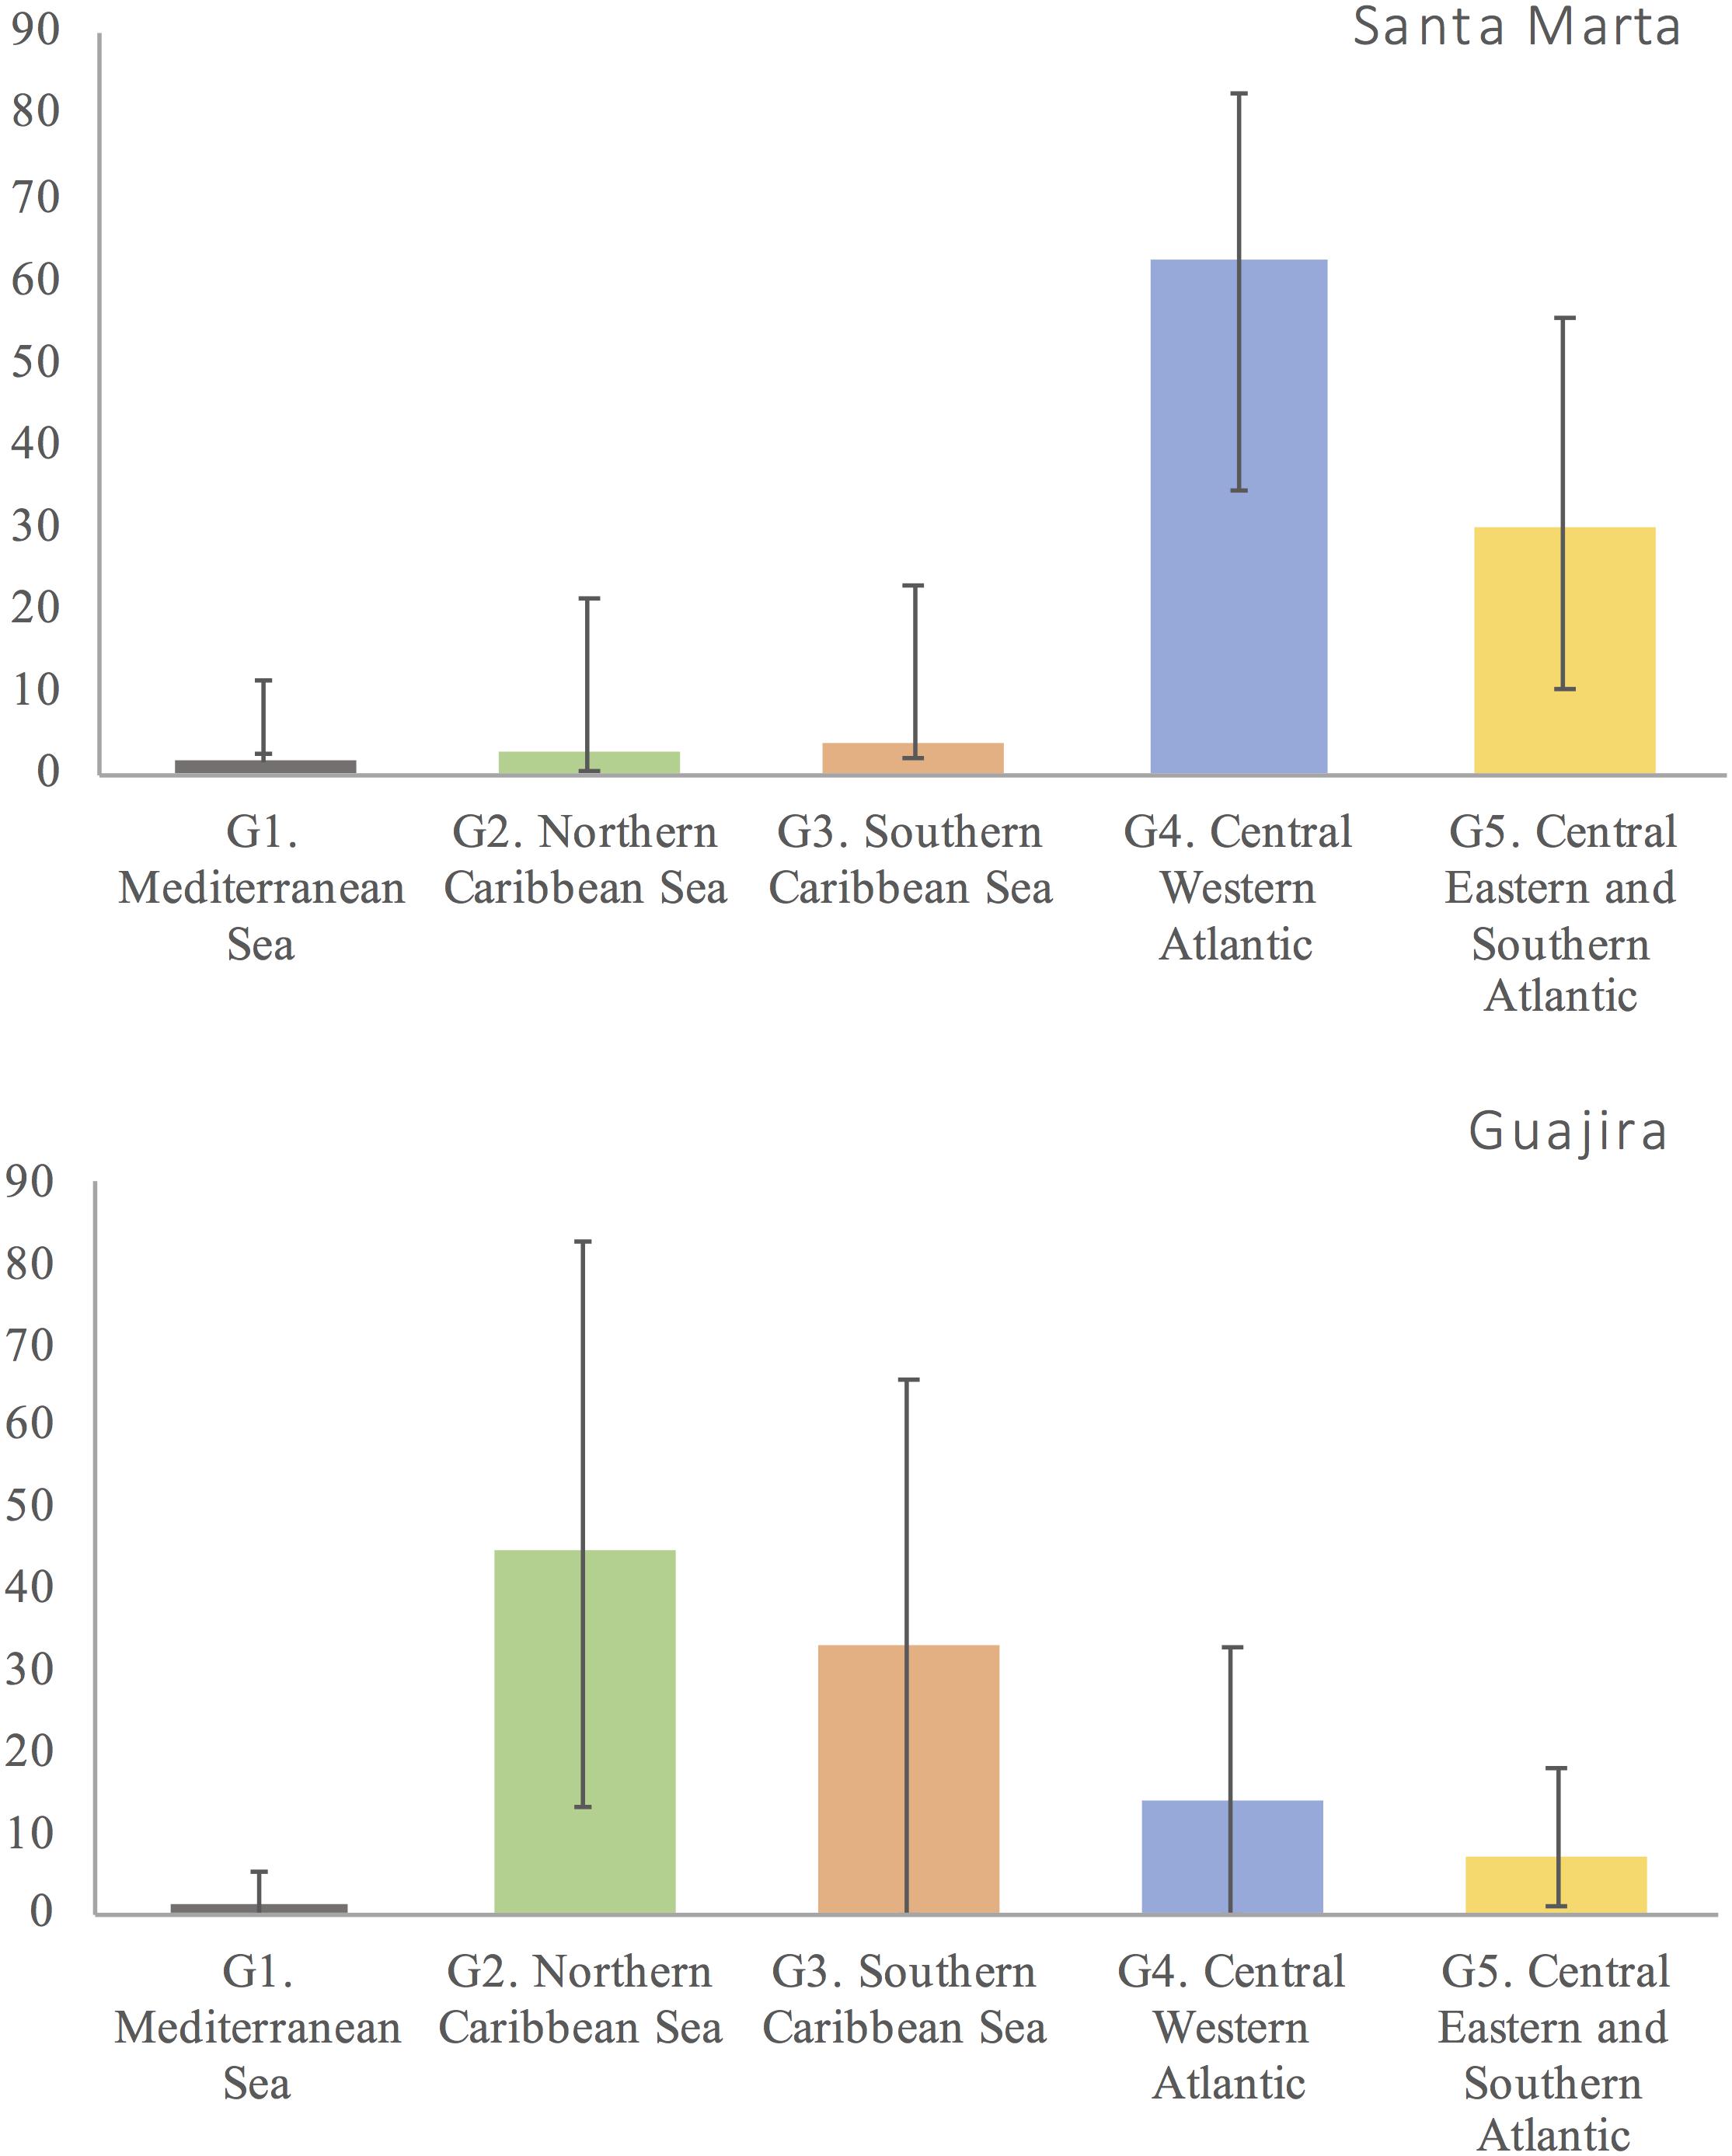
Figure 4. Contributions of genetically distinct Chelonia mydas nesting rookery (NR) groups in the Atlantic to the mixed stocks in northeastern Colombia foraging grounds (FGs) “Santa Marta” and “La Guajira,” inferred with Bayesian mixed stock analysis (Bolker et al., 2007).
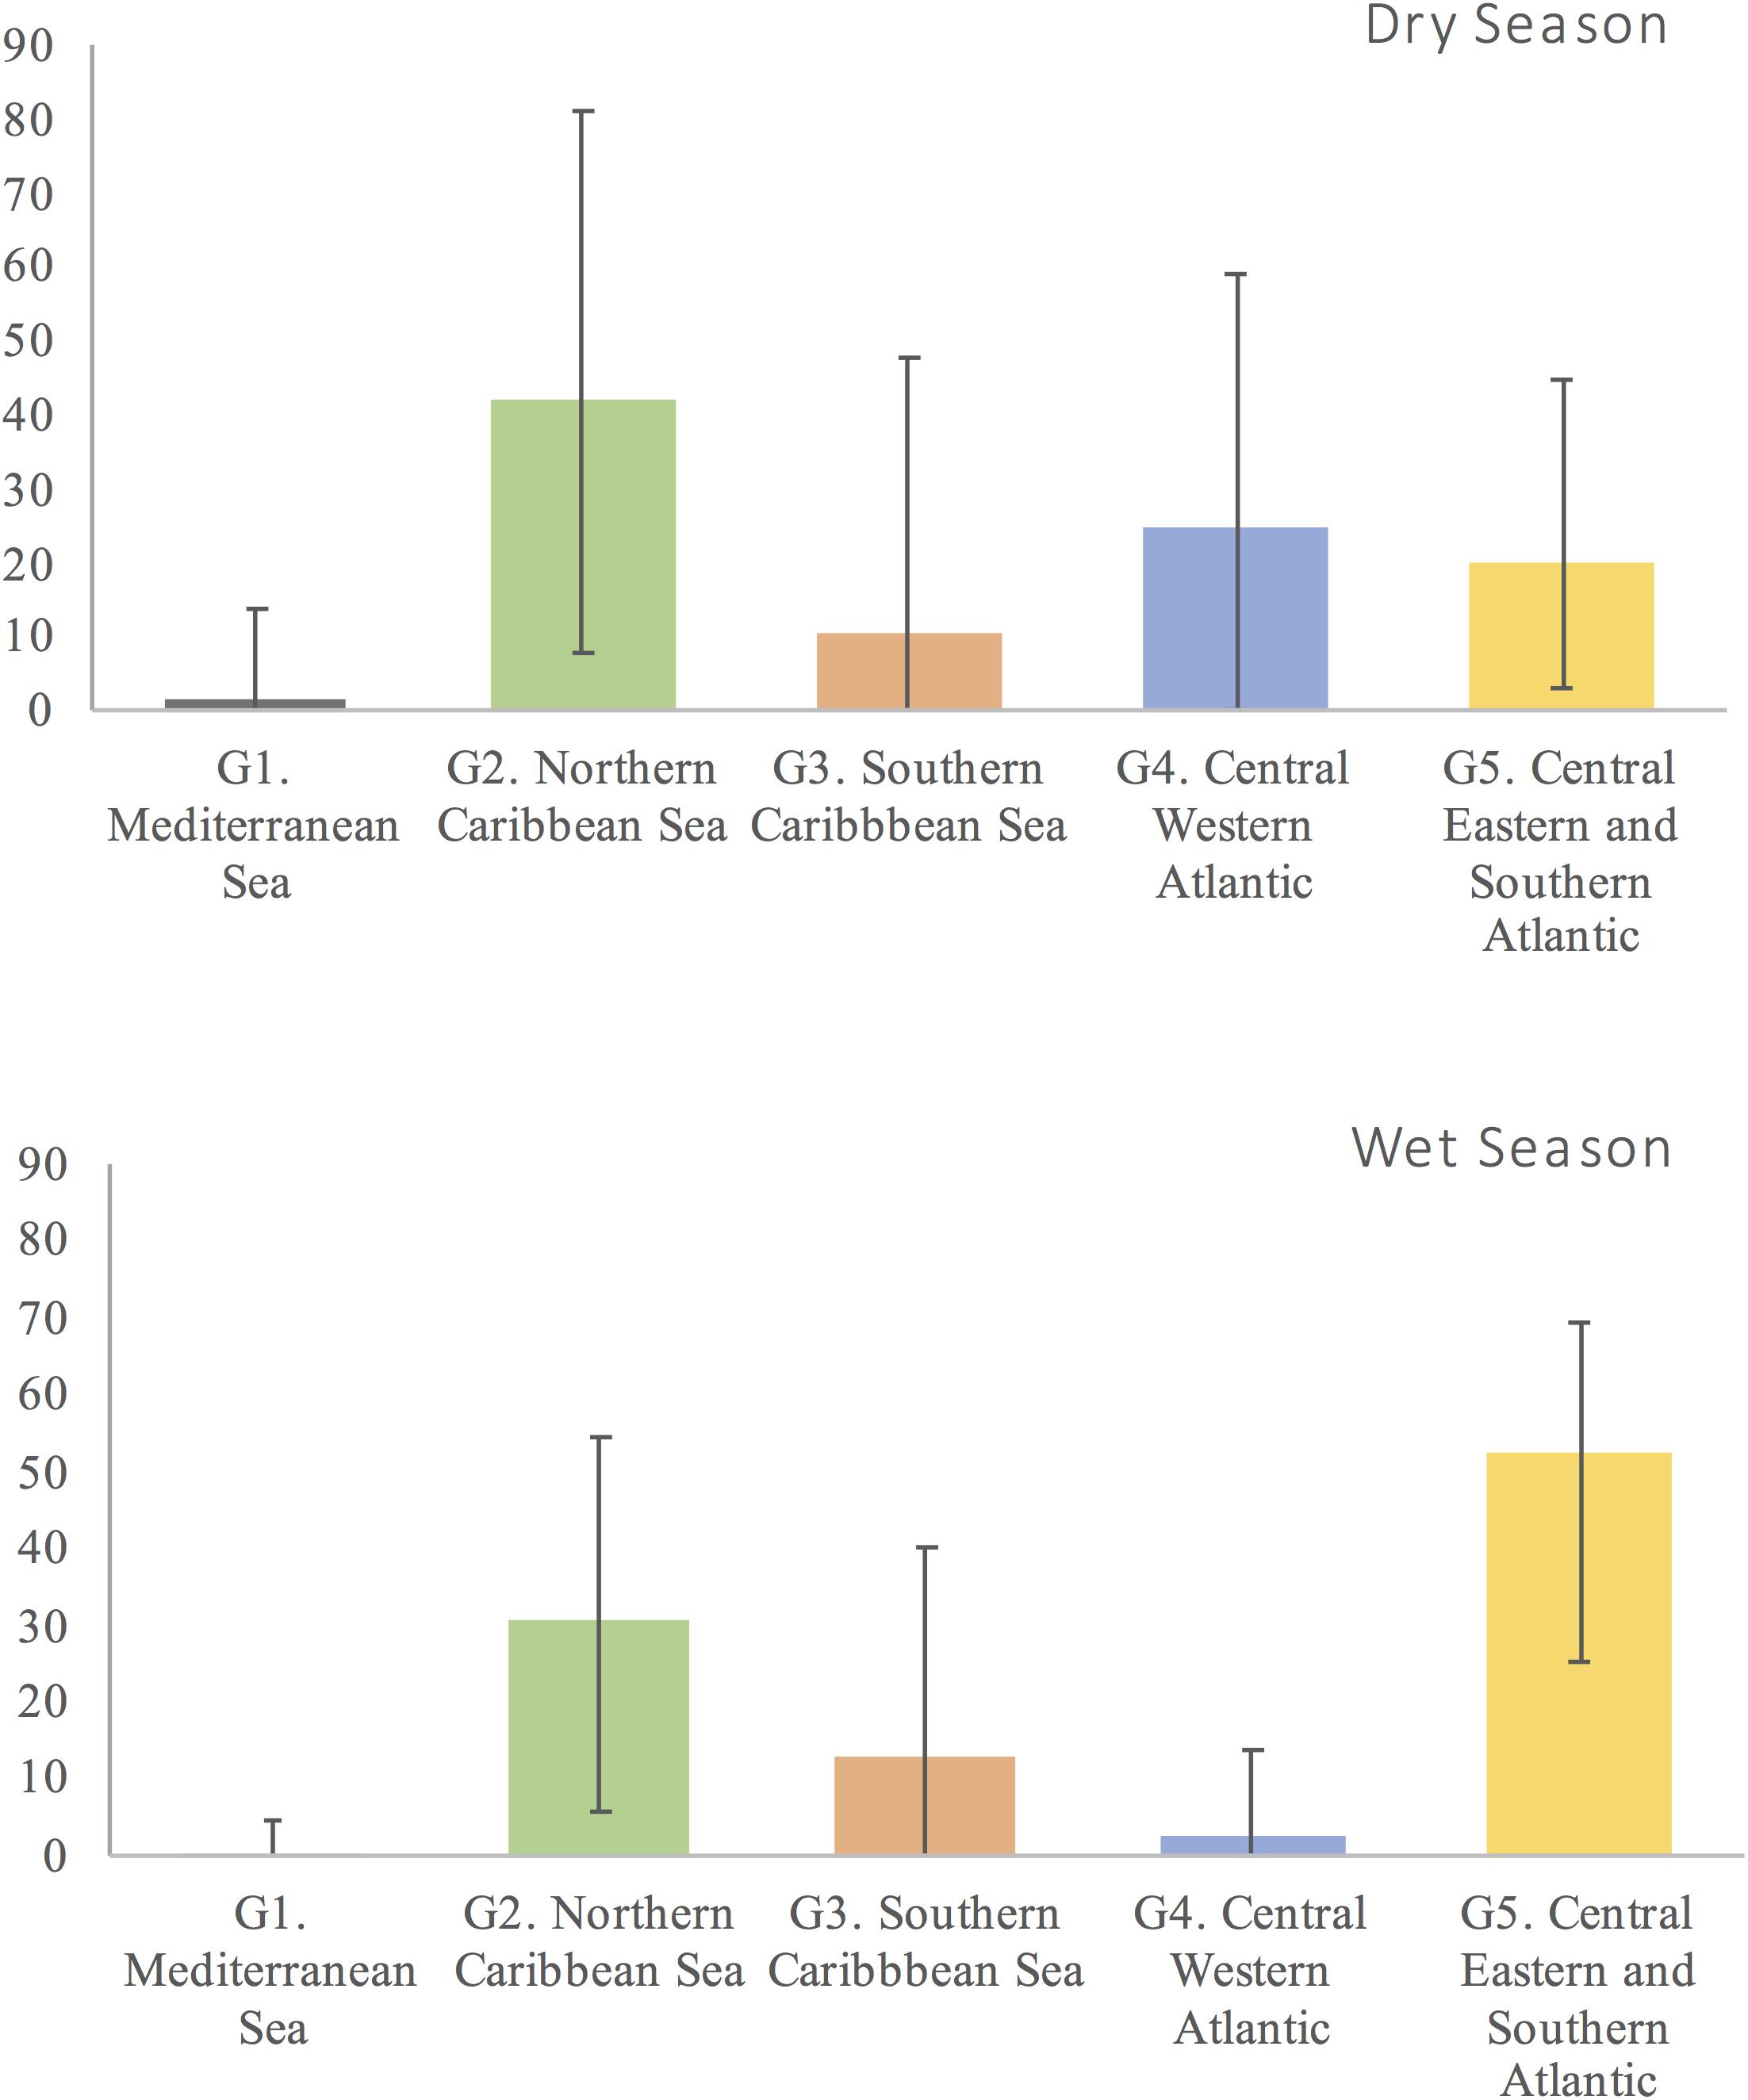
Figure 5. Contributions of genetically distinct Chelonia mydas nesting rookery groups in the Atlantic to the mixed stocks in northeastern Colombia during two seasons “wet” and “dry,” inferred with Bayesian mixed stock analysis (Bolker et al., 2007).
Discussion and Conclusion
Colombian C. mydas Mixed Stocks’ Genetic Diversity and Connectivity
This study provides the first description of the genetic diversity of immature C. mydas aggregations at two FGs, located by the coast of the northeastern portion of Colombia. The genetic diversity at Colombian FGs surpasses other C. mydas FGs in the Atlantic basin (e.g., Argentina, Bahamas, Cape Verde) except for Barbados (see values and references in Table 1). This high genetic diversity is consistent with a mixed stock of juvenile turtles recruiting from multiple, genetically distinct NRs, after pelagic migrations (Bass et al., 2006; Bolker et al., 2007; Naro-Maciel et al., 2007; Bjorndal and Bolten, 2008). C. mydas NRs form three genetically distinct and spatially coherent clusters in the Atlantic Ocean (excluding the Mediterranean Sea cluster): the north western Atlantic (NWA), the central western Atlantic, and the south western and eastern Atlantic (Encalada et al., 1996; Bolker et al., 2007; Monzón-Argüello et al., 2010). The spatial structure of genetic variation found in this study with SAMOVA analyses including the NR in Cuba is consistent with that of previous studies except for the NWA cluster; this cluster subdivides into two, one in the northern Caribbean Sea (containing Florida and Mexico) and a second one in the southern Caribbean Sea (containing Costa Rica and Cuba). This subdivision may correspond with oceanographic barriers to dispersal and gene flow acting at smaller scales within the Greater Caribbean, for instance, between the Gulf of Mexico and the Southern Caribbean Sea. The four clusters of NRs in the Atlantic Ocean observed in this study contribute immature turtles to the Colombian FGs, but in different proportions. The greatest contributors are the western and the central Atlantic clusters. These results are consistent and expand Bolker et al. (2007)’s observed regional pattern of connectivity for C. mydas in the Atlantic basin, in which NR and FGs from the same regions are more likely to be connected that with other regions, by looking at a boundary area between regions of connectivity. Colombia’s FGs are located between the central and western regions of connectivity, therefore immature C. mydas from any or both of these regions were expected to be found at Colombia’s grounds. The fact that juveniles from both connectivity regions were found in these FGs demonstrates their high level of connectivity trough juvenile dispersal with NRs.
Atlantic C. mydas FGs Oceanography and Connectivity
The high connectivity and diversity of C. mydas found in the northern portion of Colombia points to its relevance as a transit feeding area for multiple populations (Arthur et al., 2008). Indeed, previous studies have suggested La Guajira as an important transit area for other marine vertebrates in the Caribbean Sea, like dolphins (Farías-Curtidor et al., 2017; Barragán-Barrera et al., 2019). The dispersal mechanisms by which multiple C. mydas populations can contribute to the observed mixed stock diversity in Colombia are unknown. Bass et al. (2006) reported the highest genetic diversities at turtle foraging aggregations within the confluence of major current systems. Hatchling and early juvenile sea turtles entrain and passively disperse in sea surface currents from NRs to FGs for several months to a few years (Carr and Meylan, 1980; Luschi et al., 2003; Putman et al., 2010; Putman and Naro-Maciel, 2013). During these passive migrations, juvenile turtles’ behavior mirrors that of ocean surface drifters (artificially placed, ocean-floating devices that collect data) (Luschi et al., 2003; Monzón-Argüello et al., 2010; Proietti et al., 2012). Drifter trajectories (Lat/Lon position in time) of 32 satellite tracked sea surface drifters released in the Atlantic basin were recovered from the National Oceanic and Atmospheric Administration Global Drifter Program (GDP) (available at http://www.aoml.noaa.gov/phod/dac/index.php), and were displayed in a map of the Atlantic basin (Figure 6). Drifters released in all the major regions of the Atlantic basin considered in this study (the southern, the central, and the eastern Atlantic) were passing by and even ending up in the Colombian basin. Obtained drifters followed the direction and speed of two major, opposite direction, rapid ocean currents that converge nearby northeastern Colombia: the Caribbean Current and the Colombia-Panama Gyre (Invemar and Corpoguajira, 2012). The Caribbean Current is a branch of the South Equatorial Current that originates in the eastern Atlantic and flows east to west, toward the Gulf of Mexico (Johns et al., 2002). In contrast, the Colombia-Panama Gyre results from the reversing of the Caribbean current when it hits the continental shelf in Nicaragua, thus, it flows west to east in a circular fashion (Andrade et al., 2003). During the wet season, this gyre is capable of reaching Santa Marta and even La Guajira’s coastal waters (Arévalo-Martínez and Franco-Herrera, 2008; Invemar and Corpoguajira, 2012). If juvenile turtles entrain in these two rapid, opposite directions ocean current systems, as ocean drifters do, it is feasible that they reach Colombian waters from nesting beaches as far away as Guinea Bissau, Surinam, or from opposite sides of the Wider Caribbean, such as Costa Rica and Aves Island after pelagic migrations. Therefore, the observed mixed origin and high genetic diversity of C. mydas at Colombian FGs can be the result of juvenile dispersal in current systems converging in the southern Caribbean Sea.
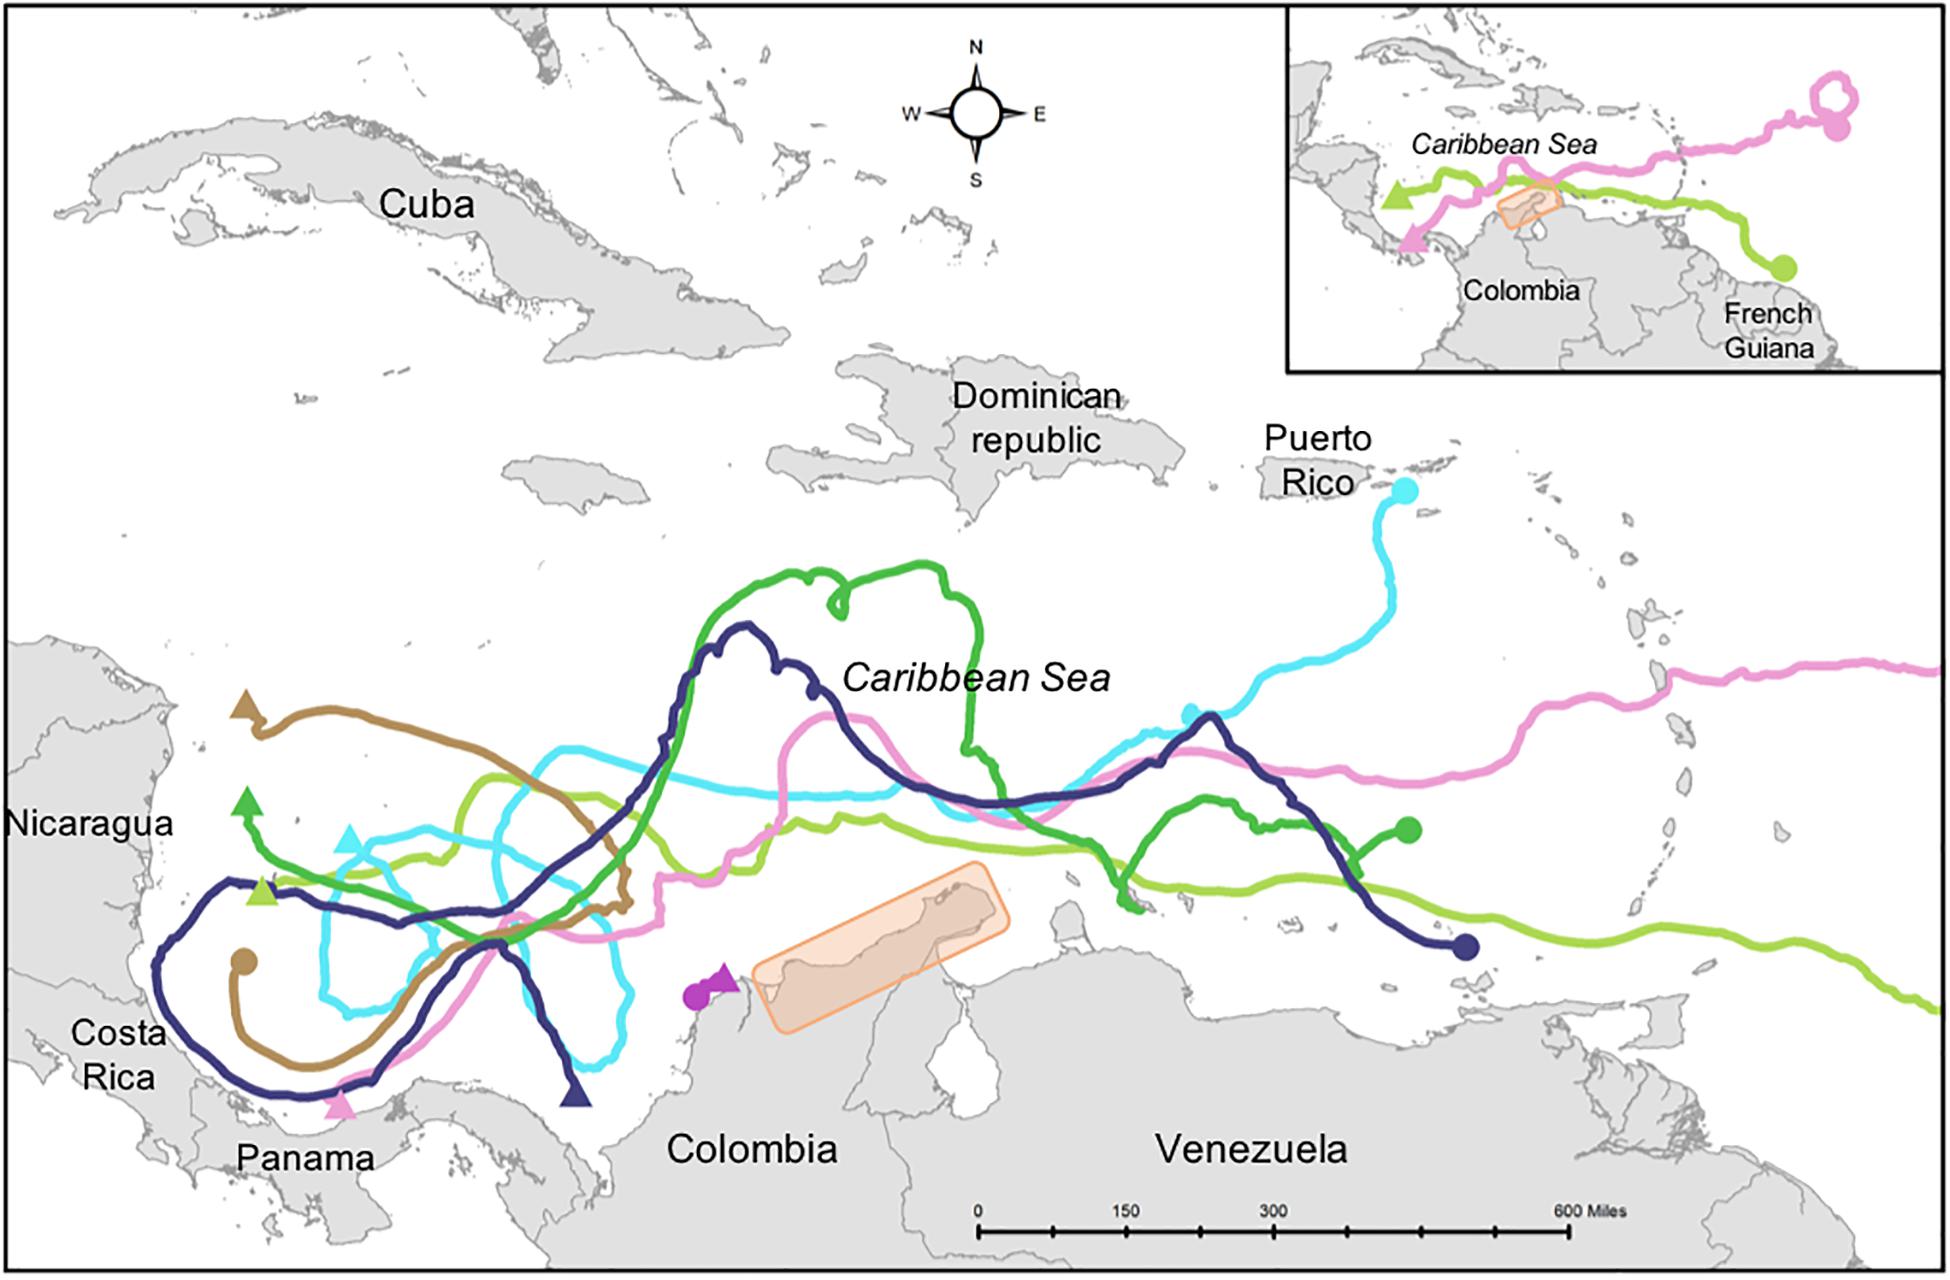
Figure 6. Trajectories of selected ocean surface drifters in Southern Caribbean (color curve lines) and western Atlantic Ocean (pink and light green curve lines). The figure exemplifies the feasibility of drifters released at different point locations (color dots) in the Atlantic Ocean to pass by the study area in northeastern Colombia (orange rectangle). Arrow tips represent direction of the trajectory.
Northeastern Colombia FGs and Atlantic Green Sea Turtle Conservation
Northeastern Colombia characterizes by having extensive and diverse coastal marine ecosystems that serve as FGs or even long-term habitats for immature C. mydas (Ceballos-Fonseca, 2004; Chasqui et al., 2013; Gómez-Lopez et al., 2014; Vasquez-Carrillo and Sullivan Sealey, 2018). Juvenile or subadult C. mydas feeds on seagrass and macroalgae found in these ecosystems, and some even remain associated to them for years (Ceballos-Fonseca, 2004; Vásquez-Carrillo, 2017). C. mydas found in these ecosystems are coming from a wide geographic range in the Wider Caribbean and even from the Eastern Atlantic Ocean, probably with the aid of large rapid, opposite direction current systems. Therefore, northeastern Colombia’s FGs stand out as stopover habitat for the growth and survival of immature C. mydas from multiple, genetically distinct populations, until migrating back to NRs of origin.
Numerous studies have shown that populations of C. mydas are extremely sensitive to mortality of large juvenile and subadult turtles (immature stages) (Heppell et al., 2003). The majority of C. mydas in a population occurs at immature stages, therefore, have not yet been able to reproduce in order to replace themselves or add more individuals to the population. Multiple threats to the survival of juvenile and subadult C. mydas located in FGs in the Wider Caribbean including the northeastern of Colombia (Campbell and Lagueux, 2005; Bell et al., 2006). These threats are direct extraction or harvesting, coastal pollution and degradation, and fishing bycatch (Rueda et al., 1992; Campbell and Lagueux, 2005; Bell et al., 2006; Barrios-Garrido et al., 2017). As such, the knowledge and protection of FGs such as the ones in northeastern Colombia is needed in order to increase survival and progression from juvenile to reproductive stage in the life cycle of C. mydas. Protecting vulnerable life stage habitat such as FGs complements long-term conservation efforts at multiple NRs throughout the Atlantic Ocean. For instance, considering the results presented here, conservation efforts on eggs and hatchlings at nesting beaches in the central eastern Atlantic can be complemented by the protection of the later-on juvenile and subadult C. mydas feeding or developing in Colombian FGs, because eventually these turtles will migrate back to these nesting beaches for reproduction (Bowen et al., 1992; FitzSimmons et al., 1997). Additionally, the conservation of FGs in Colombia hosting C. mydas from genetically distinct NRs has the potential to help maintaining the among-populations genetic diversity of Atlantic C. mydas.
Within Colombia, there are regional differences in estimated NR group contributions between Santa Marta and La Guajira. Santa Marta turtles were mostly from central western and eastern Atlantic NRs, whereas La Guajira turtles were mostly from the northwestern and southwestern Caribbean Sea. These differences may be due to an array of ecological or oceanographic factors ranging from juvenile turtle diet preference to local oceanographic features acting at smaller scales than major surface currents. However, observed differences may also be the result of sampling and estimation limitations. In this study, the sample size of the Santa Marta mixed stock was small and thus uncertainty in estimates becomes large. Greater sampling effort for this area during multiple years is recommended to find out whether genetic differences are maintained and are not an artifact of intrinsic variation associated with low sampling effort and what could be the ecological or oceanographic causes of these differences.
Ethics Statement
This study was carried out in accordance with the recommendations of the University of Miami Institutional Animal Use and Care Committee (IACUC). The research protocol number 14-142 was approved by the IACUC Committee.
Author Contributions
CV-C had the initial idea, designed the study, and wrote the manuscript. CV-C and KS obtained the funding for work in La Guajira. GJ-R, CN-H, and LH-R obtained funding for Santa Marta work. CV-C, KS, and CN-H performed the field work. CV-C and LH-R performed the laboratory work and the data analyses. KS and GJ-R edited the manuscript.
Funding
We thank the Waitt Foundation/National Geographic Society Scientific Grant W441-16 for the financial support for field exploration in La Guajira. We also thank the Ocean Foundation’s sea turtle grant for funding support for genetics laboratory analyses. We acknowledge the funding support from the Universidad Jorge Tadeo Lozano and Petrobras, which allowed work with the fishermen communities in the Santa Marta region.
Conflict of Interest
The authors declare that the research was conducted in the absence of any commercial or financial relationships that could be construed as a potential conflict of interest.
Acknowledgments
Thanks to the University of Miami and Colciencias, for supporting the principal investigator doctoral studies. We are grateful with the Wayuu fishermen communities of Bahia Hondita and Santa Cruz in La Guajira, for providing access to their fishing bycatch. We thank the Bahia Hondita Conservation Stewards group and biologist Luis Merizalde for their guidance and advice in the field. We give thanks to the Asociación de Pescadores de Don Diego fishermen from Santa Marta area for collaborating with us. Also, we thank our field assistants, biologists Manuela Pelaez, Kellys Iguarán, and Jacob Patus, as well as our simultaneous translator and field assistant Lorenzo Arends. We deeply thank the Wayuu indigenous families (Sapuana, Gonzales, and Iguarán) for hosting and supporting us in the field. We thank oceanographer Dr. Maria Olascoaga at the University of Miami for obtaining the ocean drifters data.
Supplementary Material
The Supplementary Material for this article can be found online at: https://www.frontiersin.org/articles/10.3389/fmars.2020.00096/full#supplementary-material
Footnotes
References
Abreu-Grobois, F. A., Horrocks, J., Formia, A., LeRoux, R., Velez-Zuazo, X., Dutton, P. H., et al. (2006). “New mtDNA D-loop primers which work for a variety of marine turtle species may increase the resolution of mixed stock analysis,” in Proceedings of the 26th Annual Symposium on Sea Turtle Biology and Conservation, eds M. Erick, A. Panagopoulous, A. F. Rees, and K. Williams (Athens: International Sea Turtle Society), 179.
Amorocho, D. F., Abreu-Grobois, F. A., Dutton, P. H., and Reina, R. D. (2012). Multiple distant origins for green sea turtles aggregating off Gorgona Island in the Colombian Eastern Pacific. PLoS One 7:e31486. doi: 10.1371/journal.pone.0031486
Amorocho, D. F., and Reina, R. D. (2007). Feeding ecology of the East Pacific green sea turtle Chelonia mydas agassizii at Gorgona National Park, Colombia. Endanger. Species Res. 3, 43–51. doi: 10.3354/esr003043
Andrade, C. A., Barton, E. D., and Mooers, C. N. K. (2003). Evidence for an eastward flow along the Central and South American Caribbean Coast. J. Geophys. Res. 108, 3185–3196. doi: 10.1029/2002JC001549
Arévalo-Martínez, D. L., and Franco-Herrera, A. (2008). Oceanographic features of the upwelling in front of Gaira’s Inlet, Magdalena Department, minor dry season of 2006. Bol. Invest. Mar. Cost. 37, 131–162.
Arthur, K. E., Boyle, M. C., and Limpus, C. J. (2008). Ontogenetic changes in diet and habitat use in green sea turtle (Chelonia mydas) life history. Mar. Ecol. Prog. Ser. 362, 303–311. doi: 10.3354/meps07440
Barragán-Barrera, D. C., Do Amaral, K. B., Chávez-Carreño, P. A., Farías-Curtidor, N., Lancheros-Neva, R., Botero-Acosta, N., et al. (2019). Ecological niche modeling of three species of Stenella dolphins in the Caribbean Basin, with application to the Seaflower Biosphere Reserve. Front. Mar. Sci. 6:10. doi: 10.3389/fmars.2019.00010
Barrios-Garrido, H., Espinoza-Rodríguez, N., Rojas-Cañizales, D., Palmar, J., Wildermann, N., Montiel-Villalobos, M. G., et al. (2017). Trade of marine turtles along the Southwestern Coast of the Gulf of Venezuela. Mar. Biodivers. Rec. 10:15.
Bass, A. L., Epperly, S. P., and Braun-McNeill, J. (2006). Green turtle (Chelonia mydas) foraging and nesting aggregations in the Caribbean and Atlantic: impact of currents and behavior on dispersal. J. Hered. 97, 346–354. doi: 10.1093/jhered/esl004
Bass, A. L., Lagueux, C. J., and Bowen, B. W. (1998). Origin of green turtles, Chelonia mydas, at “Sleeping Rocks” off the northeast coast of Nicaragua. Copeia 4, 1064–1069.
Bass, A. L., and Witzell, W. N. (2000). Demographic composition of immature green turtles (Chelonia mydas) from the east central Florida coast: evidence from mtDNA markers. Herpetologica 56, 357–367.
Bell, C. D., Blumenthal, J. M., Austin, T. J., Solomon, J. L., Ebanks-Petrie, G., Broderick, A. C., et al. (2006). Traditional Caymanian fishery may impede local marine turtle population recovery. Endanger. Species Res. 2, 63–69. doi: 10.3354/esr002063
Bjorndal, K. A. (1980). Nutrition and grazing behavior of the green turtle Chelonia mydas. Mar. Biol. 56, 147–154. doi: 10.1007/bf00397131
Bjorndal, K. A., and Bolten, A. B. (2008). Annual variation in source contributions to a mixed stock: implications for quantifying connectivity. Mol. Ecol. 17, 2185–2193. doi: 10.1111/j.1365-294X.2008.03752.x
Bjorndal, K. A., Bolten, A. B., and Lagueux, C. J. (1994). Ingestion of marine debris by juvenile sea turtles in coastal Florida habitats. Mar. Pollut. Bull. 28, 154–158. doi: 10.1016/0025-326x(94)90391-3
Bolker, B. M., Okuyama, T., Bjorndal, K. A., and Bolten, A. B. (2007). Incorporating multiple mixed stocks in mixed stock analysis: ‘many-to-many’ analyses. Mol. Ecol. 16, 685–695. doi: 10.1111/j.1365-294x.2006.03161.x
Bowen, B. W. (1995). Tracking marine turtles with genetic markers. Bioscience 45, 528–534. doi: 10.2307/1312697
Bowen, B. W., Meylan, A. B., Ross, J. P., Limpus, C. J., Balazs, G. H., and Avise, J. C. (1992). Global population structure and natural history of the green turtle (Chelonia mydas) in terms of matriarchal phylogeny. Evolution 46, 865–881. doi: 10.1111/j.1558-5646.1992.tb00605.x
Campbell, C. L., and Lagueux, C. J. (2005). Survival probability estimates for large juvenile and adult green turtles (Chelonia mydas) exposed to an artisanal marine turtle fishery in the western Caribbean. Herpetologica 61, 91–103. doi: 10.1655/04-26
Carr, A., and Meylan, A. B. (1980). Evidence of passive migration of green turtle hatchlings in sargassum. Copeia 1980, 366–368. doi: 10.2307/1444022
Ceballos-Fonseca, C. (2004). Distribución de playas de anidación y áreas de alimentación de tortugas marinas y sus amenazas en el Caribe colombiano. Bol. Invest. Mar. Cost. 33, 79–99.
Chasqui, L., Nieto, R., Rodríguez-Rincón, A., and Gil-Agudelo, D. L. (2013). Ambientes marinos de la plataforma somera de la Guajira, Caribe Colombiano. Bol. Invest. Mar. Cost. 42, 401–412.
Díaz, J. M., Gómez-López, D., Barrios, L., and Montoya, P. (2003). Las Praderas de Pastos Marinos en Colombia: Estructura y Distribución de un Ecosistema Estratégico. Santa Marta: INVEMAR, 160.
Díaz-Pulido, G., and Garzón-Ferreira, J. (2002). Seasonality in algal assemblages on upwelling-influenced coral reefs in the Colombian Caribbean. Bot. Mar. 45, 284–292.
Dupanloup, I., Schneider, S., and Excoffier, L. (2002). A simulated annealing approach to define the genetic structure of populations. Mol. Ecol. 11, 2571–2581. doi: 10.1046/j.1365-294x.2002.01650.x
Dutton, P. H., and Balazs, G. H. (1995). Simple biopsy technique for sampling skin for DNA analysis of sea turtles. Mar. Turtle Newsletter 69, 9–10.
Encalada, S. E., Lahanas, P. N., Bjorndal, K. A., Bolten, A. B., Miyamoto, M. M., and Bowen, B. W. (1996). Phylogeography and population structure of the Atlantic and Mediterranean green turtle Chelonia mydas: a mitochondrial DNA control region sequence assessment. Mol. Ecol. 5, 473–483. doi: 10.1111/j.1365-294x.1996.tb00340.x
Excoffier, L., Laval, G., and Schneider, S. (2005). Arlequin version 3.0: an integrated software package for population genetics data analysis. Evol. Bioinform. Online 1, 47–50.
Farías-Curtidor, N., Barragán-Barrera, D. C., Chávez-Carreño, P. A., Jiménez-Pinedo, C., Palacios, D. M., Caicedo, D., et al. (2017). Range extension for the common dolphin (Delphinus sp.) to the Colombian Caribbean, with taxonomic implications from genetic barcoding and phylogenetic analyses. PLoS One 12:e0171000. doi: 10.1371/journal.pone.0171000
Finkbeiner, E. M., Wallace, B. P., Moore, J. E., Lewison, R. L., Crowder, L. B., and Read, A. J. (2011). Cumulative estimates of sea turtle bycatch and mortality in USA fisheries between 1990 and 2007. Biol. Conserv. 144, 2719–2727. doi: 10.1016/j.biocon.2011.07.033
FitzSimmons, N. N., Limpus, C. J., Norman, J. A., Goldizen, A. R., Miller, J. D., and Moritz, C. (1997). Philopatry of male marine turtles inferred from mitochondrial DNA markers. Proc. Natl. Acad. Sci. U.S.A. 94, 8912–8917. doi: 10.1073/pnas.94.16.8912
Garzón-Ferreira, J., and Cano, M. (1991). Tipos, Distribución, Extensión y Estado de Conservación de los Ecosistemas Marinos Costeros del Parque Nacional Natural Tayrona. Santa Marta: INVEMAR, 82.
Gilman, E., Gearhart, J., Price, B., Eckert, S., Milliken, H., Wang, J., et al. (2010). Mitigating sea turtle bycatch in coastal passive net fisheries. Fish Fish. 11, 57–88. doi: 10.1111/j.1467-2979.2009.00342.x
Gilpin, M. E., and Soulé, M. E. (1986). Conservation Biology: The Science of Scarcity and Diversity. Sunderland, MA: Sinauer Associates, 584.
Gómez-Lopez, D., Díaz, C., Galeano, E., Munþoz, L., Millán, S., Bolanþos, J., et al. (2014). Proyecto de Actualización Cartográfica del Atlas de Pastos Marinos de Colombia: Sectores Guajira, Punta San Bernardo y Chocó: Extensión y Estado Actual. Technical Report PRY-BEM-005-13. Santa Marta: INVEMAR, 136.
Heppell, S. S., Snover, M. L., and Crowder, L. B. (2003). “Sea turtle population ecology,” in The Biology of Sea Turtles Vol. 2., eds P. L. Lutz, J. A. Musick, and L. Wyneken (Boca Raton, FL: CRC Press), 275–306. doi: 10.1201/9781420040807.ch11
Hughes, A. R., Inouye, B. D., Johnson, M. T., Underwood, N., and Vellend, M. (2008). Ecological consequences of genetic diversity. Ecol. Lett. 11, 609–623. doi: 10.1111/j.1461-0248.2008.01179.x
Invemar, and Corpoguajira (2012). Atlas Marino Costero de La Guajira, Serie de Publicaciones Especiales de Invemar No. 27. Santa Marta: INVEMAR, 188.
Jackson, J. B., Kirby, M. X., Berger, W. H., Bjorndal, K. A., Botsford, L. W., Bourque, B. J., et al. (2001). Historical overfishing and the recent collapse of coastal ecosystems. Science 293, 629–637. doi: 10.1126/science.1059199
Jensen, M. P., Bell, I., Limpus, C. J., Hamann, M., Ambar, S., Whap, T., et al. (2016). Spatial and temporal genetic variation among size classes of green turtles (Chelonia mydas) provides information on oceanic dispersal and population dynamics. Mar. Ecol. Prog. Ser. 543, 241–256. doi: 10.3354/meps11521
Johns, W. E., Townsend, T. L., Fratantoni, D. M., and Wilson, W. D. (2002). On the Atlantic inflow to the Caribbean Sea. Deep Sea Res. Part I 49, 211–243. doi: 10.1371/journal.pone.0081508
Kearse, M., Moir, R., Wilson, A., Stones-Havas, S., Cheung, M., Sturrock, S., et al. (2012). Geneious Basic: an integrated and extendable desktop software platform for the organization and analysis of sequence data. Bioinformatics 28, 1647–1649. doi: 10.1093/bioinformatics/bts199
Koch, V., Nichols, W. J., Peckham, H., and De la Toba, V. (2006). Estimates of sea turtle mortality from poaching and bycatch in Bahía Magdalena, Baja California Sur, Mexico. Biol. Conserv. 128, 327–334. doi: 10.1016/j.biocon.2005.09.038
Lacy, R. C. (1997). Importance of genetic variation to the viability of mammalian populations. J. Mammal. 78, 320–335. doi: 10.2307/1382885
Lahanas, P. N., Bjorndal, K. A., Bolten, A. B., Encalada, S. E., Miyamoto, M. M., Valverde, R. A., et al. (1998). Genetic composition of a green turtle (Chelonia mydas) feeding ground population: evidence for multiple origins. Mar. Biol. 130, 345–352. doi: 10.1007/s002270050254
Luke, K., Horrocks, J. A., Leroux, R. A., and Dutton, P. H. (2004). Origins of green turtle (Chelonia mydas) feeding aggregations around Barbados, West Indies. Mar. Biol. 144, 799–805. doi: 10.1007/s00227-003-1241-2
Luschi, P., Hays, G. C., and Papi, F. (2003). A review of long-distance movements by marine turtles, and the possible role of ocean currents. Oikos 103, 293–302. doi: 10.1034/j.1600-0706.2003.12123.x
Lutz, P. L., Musick, J. A., and Wyneken, J. (2002). The Biology of Sea Turtles. Boca Raton FL: CRC Press, 455.
Makowski, C., Seminoff, J. A., and Salmon, M. (2006). Home range and habitat use of juvenile Atlantic green turtles (Chelonia mydas L.) on shallow reef habitats in Palm Beach, Florida, USA. Mar. Biol. 148, 1167–1179. doi: 10.1007/s00227-005-0150-y
McClenachan, L., Jackson, J. B. C., and Newman, M. J. H. (2006). Conservation implications of historic sea turtle nesting beach loss. Front. Ecol. Environ. 4:290–296. doi: 10.1890/1540-9295(2006)4
Meylan, P. A., Meylan, A. B., and Gray, J. A. (2011). The ecology and migrations of Sea Turtles 8. Tests of the developmental habitat hypothesis. Bull. Am. Mus. Nat. Hist. 357, 1–70. doi: 10.1111/cobi.12325
Monzón-Argüello, C., López-Jurado, L. F., Rico, C., Marco, A., López, P., Hays, G. C., et al. (2010). Evidence from genetic and Lagrangian drifter data for transatlantic transport of small juvenile green turtles. J. Biogeogr. 37, 1752–1766. doi: 10.1111/j.1365-2699.2010.02326.x
Mortimer, J. A. (1981). The feeding ecology of the West Caribbean green turtle (Chelonia mydas) in Nicaragua. Biotropica 13, 49–58.
Naro-Maciel, E., Becker, J. H., Lima, E. H., Marcovaldi, M. A., and DeSalle, R. (2007). Testing dispersal hypotheses in foraging green sea turtles (Chelonia mydas) of Brazil. J. Hered. 98, 29–39. doi: 10.1093/jhered/esl050
Naro-Maciel, E., Bondioli, A. C., Martin, M., de Padua Almeida, A., Baptistotte, C., Bellini, C., et al. (2012). The interplay of homing and dispersal in green turtles: a focus on the southwestern Atlantic. J. Hered. 103, 792–805. doi: 10.1093/jhered/ess068
Paramo, J., Correa, M., and Núñez, S. (2011). Evidencias de desacople físico-biológico en el sistema de surgencia en La Guajira, Caribe colombiano. Rev. Biol. Mar. Oceanogr. 46, 421–430. doi: 10.4067/s0718-19572011000300011
Pella, J., and Masuda, M. (2001). Bayesian methods for analysis of stock mixtures from genetic characters. Fishery Bull. 99, 151–167.
Proietti, M. C., Reisser, J. W., Kina, P. G., Kerr, R., Monteiro, D. S., Marins, L. F., et al. (2012). Green turtle Chelonia mydas mixed stocks in the western South Atlantic, as revealed by mtDNA haplotypes and drifter trajectories. Mar. Ecol. Prog. Ser. 447, 195–209. doi: 10.3354/meps09477
Prosdocimi, L., Carman, V. G., Albareda, D. A., and Remis, M. I. (2012). Genetic composition of green turtle feeding grounds in coastal waters of Argentina based on mitochondrial DNA. J. Exp. Mar. Biol. Ecol. 412, 37–45. doi: 10.1016/j.jembe.2011.10.015
Putman, N. F., Bane, J. M., and Lohmann, K. J. (2010). Sea turtle nesting distributions and oceanographic constraints on hatchling migration. Proc. R. Soc. B Biol. Sci. 277, 3631–3637. doi: 10.1098/rspb.2010.1088
Putman, N. F., and Naro-Maciel, E. (2013). Finding the ‘lost years’ in green turtles: insights from ocean circulation models and genetic analysis. Proc. R. Soc. B Biol. Sci. 280:20131468. doi: 10.1098/rspb.2013.1468
Raymond, M., and Rousset, F. (1995). An exact test for population differentiation. Evolution 49, 1280–1283. doi: 10.1111/j.1558-5646.1995.tb04456.x
Ricaurte-Villota, C., and Bastidas Salamanca, M. L. (2017). Regionalización Oceanográfica: una Visión Dinámica del Caribe, Instituto de Investigaciones Marinas y Costeras José Benito Vives De Andréis (INVEMAR), Serie de Publicaciones Especiales de INVEMAR # 14. Santa Marta: INVEMAR, 180.
Roberts, M. A., Schwart, T. S., and Karl, S. A. (2004). Global population genetic structure and male-mediated gene flow in the green sea turtle (Chelonia mydas): analysis of microsatellite loci. Genetics 166, 1857–1870. doi: 10.1534/genetics.166.4.1857
Rozas, J., and Rozas, R. (1999). DnaSP version 3: an integrated program for molecular population genetics and molecular evolution analysis. Bioinformatics 15, 174–175. doi: 10.1093/bioinformatics/15.2.174
Rueda, J. V., Mayorga, J. E., and Ulloa, G. (1992). “Observaciones sobre la captura commercial de tortugas marinas en la península de la Guajira, Colombia,” in Contribución al Conocimiento de las Tortugas Marinas de Colombia, eds J. V. Rodriguez-Mahecha, and H. Sánchez-Paez (Bogotá: INDERENA), 133–153.
Rueda-Roa, D. T., and Muller-Karger, F. E. (2013). The Southern Caribbean Upwelling System: Sea surface temperature, wind forcing and chlorophyll concentration patterns. Deep Sea Res. Part I Oceanogr. Res. Pap. 78, 102–114. doi: 10.1016/j.dsr.2013.04.008
Sanger, F., and Coulson, A. R. (1975). A rapid method for determining sequences in DNA by primed synthesis with DNA polymerase. J. Mol. Biol. 94, 441–448. doi: 10.1016/0022-2836(75)90213-2
Seminoff, J. A. (2004). Chelonia mydas, The IUCN Red List of Threatened Species 2004. Cambridge: International Union for Conservation of Nature and Natural Resources.
Seminoff, J. A., Resendiz, A., and Nichols, W. J. (2002). Diet of East Pacific green turtles (Chelonia mydas) in the central Gulf of California, Mexico. J. Herpetol. 36, 447–453. doi: 10.1670/0022-1511(2002)036
Shimada, T., Aoki, S., Kameda, K., Hazel, J., Reich, K., and Kamezaki, N. (2014). Site fidelity, ontogenetic shift and diet composition of green turtles Chelonia mydas in Japan inferred from stable isotope analysis. Endanger. Species Res. 25, 151–164. doi: 10.3354/esr00616
Valiela, I., Bowen, J. L., and York, J. K. (2001). Mangrove Forests: One of the World’s Threatened Major Tropical Environments: at least 35% of the area of mangrove forests has been lost in the past two decades, losses that exceed those for tropical rain forests and coral reefs, two other well-known threatened environments. Bioscience 51, 807–815.
Vásquez-Carrillo, C. (2017). Role of an Upwelled Coastal Area in Northeastern Colombia in the Distribution, Population Dynamics and Genetic Diversity of the Migratory Habitat-Shifting Chelonia Mydas. Ph.D. thesis, University of Miami, Miami, FL.
Vasquez-Carrillo, C., and Sullivan Sealey, K. (2018). Diversity and extent of coastal submerged aquatic vegetation in an unexplored coastal upwelling region of the Caribbean Sea. Int. J. Biodivers. Endanger. Species IJBES-106. doi: 10.29011/IJBES-106.100006
Keywords: Chelonia mydas, mixed stock, developmental habitat, La Guajira, Santa Marta, mtDNA Control Region, northeastern Colombia
Citation: Vásquez-Carrillo C, Noriega-Hoyos CL, Hernandez-Rivera L, Jáuregui-Romero GA and Sullivan Sealey K (2020) Genetic Diversity and Demographic Connectivity of Atlantic Green Sea Turtles at Foraging Grounds in Northeastern Colombia, Caribbean Sea. Front. Mar. Sci. 7:96. doi: 10.3389/fmars.2020.00096
Received: 21 September 2018; Accepted: 05 February 2020;
Published: 21 February 2020.
Edited by:
Juan Armando Sanchez, University of Los Andes, ColombiaReviewed by:
Dalia C. Barragán-Barrera, Centro de Investigaciones Oceanográficas e Hidrográficas (CIOH), ColombiaVivian Patricia Páez, University of Antioquia, Colombia
Copyright © 2020 Vásquez-Carrillo, Noriega-Hoyos, Hernandez-Rivera, Jáuregui-Romero and Sullivan Sealey. This is an open-access article distributed under the terms of the Creative Commons Attribution License (CC BY). The use, distribution or reproduction in other forums is permitted, provided the original author(s) and the copyright owner(s) are credited and that the original publication in this journal is cited, in accordance with accepted academic practice. No use, distribution or reproduction is permitted which does not comply with these terms.
*Correspondence: Catalina Vásquez-Carrillo, Y3Zhc3F1ZXpjYXJAZ21haWwuY29t