 Achim Randelhoff1,2*
 Johnna Holding3,4
 Markus Janout5
 Mikael Kristian Sejr3,4
 Marcel Babin1,2
 Jean-Éric Tremblay1,2Matthew B. Alkire6†
- 1Takuvik Joint International Laboratory, Université Laval (QC, Canada) and CNRS (France)
- 2Département de Biologie and Québec-Océan, Université Laval, Québec, QC, Canada
- 3Arctic Research Centre, Aarhus University, Aarhus, Denmark
- 4Department of Bioscience, Aarhus University, Silkeborg, Denmark
- 5Alfred Wegener Institute, Helmholtz Centre for Polar and Marine Research, Bremerhaven, Germany
- 6Applied Physics Laboratory, University of Washington, Seattle, WA, United States
Arctic Ocean primary productivity is limited by light and inorganic nutrients. With sea ice cover declining in recent decades, nitrate limitation has been speculated to become more prominent. Although much has been learned about nitrate supply from general patterns of ocean circulation and water column stability, a quantitative analysis requires dedicated turbulence measurements that have only started to accumulate in the last dozen years. Here we present new observations of the turbulent vertical nitrate flux in the Laptev Sea, Baffin Bay, and Young Sound (North-East Greenland), supplementing a compilation of 13 published estimates throughout the Arctic Ocean. Combining all flux estimates with a Pan-Arctic database of in situ measurements of nitrate concentration and density, we found the annual nitrate inventory to be largely determined by the strength of stratification and by bathymetry. Nitrate fluxes explained the observed regional patterns and magnitudes of both new primary production and particle export on annual scales. We argue that with few regional exceptions, vertical turbulent nitrate fluxes can be a reliable proxy of Arctic primary production accessible through autonomous and large-scale measurements. They may also provide a framework to assess nutrient limitation scenarios based on clear energetic and mass budget constraints resulting from turbulent mixing and freshwater flows.
Introduction
Without upward mixing of nutrients, much of the ocean would harbor no life (Ambühl, 1959; Margalef, 1978); the Arctic Ocean is no exception. As dead algae and other particulate matter have the tendency to sink due to their higher density, nutrients are constantly removed from surface waters. Phytoplankton therefore relies on a resupply of nutrients to grow and re-build its standing stock every year. Consequently, primary production, occurring in the euphotic zone where light levels are sufficient to support net growth, is controlled by the vertical flux of new nutrients from below the photic zone each year and thus available to new production, i.e., uptake of allochthonous nitrate (see Supplementary Appendix and Dugdale and Goering, 1967).
While turbulence is an important factor for aquatic life everywhere, the Arctic Ocean is special in certain regards such as a ubiquitous sea ice cover and strong stratification (Aagaard and Carmack, 1989). Large summertime accumulation of meltwater from sea ice and terrestrial runoff has profound impacts on vertical mixing in the upper ocean (McPhee and Kantha, 1989; Randelhoff et al., 2017; Cole et al., 2018). In winter, brine rejection from freezing ice weakens stratification and creates turbulence (McPhee and Stanton, 1996). We will show throughout this paper that winter mixing is disproportionately important for setting mixed-layer properties.
Sea ice is often assumed to be a rather rigid lid (Padman, 1995) that shuts out a large portion of the sunlight as well as wind energy that could otherwise mix the ocean. With continued decline of sea ice extent and thickness in the 21st century (Comiso, 2012; Stroeve et al., 2012; Meier et al., 2014), the factors limiting Arctic marine growth will likely change. Such a transition in limiting factors usually leads to difficulties in predicting systems (Allen and Hoekstra, 2015). Indeed, Vancoppenolle et al. (2013) found that three different coupled biogeochemical general circulation models and their predictions for integrated Arctic Ocean primary production until the end of this century show diverging trajectories with opposite trends beyond a few decades from now. In their analysis, a prominent uncertainty concerned the evolution of the nitrogen pool in the photic zone. Yet since phytoplankton growth is a rate and not a stock, one should ideally measure the nitrogen flux, not its concentration at a given time, to determine primary production in the long term. Our lack of understanding of the vertical nitrate flux has resulted in the failure to consistently predict future Arctic Ocean primary production.
Stratification inhibits vertical mixing (Osborn, 1980) and consequently vertical turbulent nitrate fluxes. The Arctic Ocean can be divided into a weakly stratified Atlantic sector and a strongly stratified Pacific one (e.g., Carmack, 2007; Bluhm et al., 2015; Tremblay et al., 2015). Vertical turbulent nitrate fluxes are therefore routinely invoked to explain patterns of primary production across the Arctic, such as basin scale differences (Carmack et al., 2006; Tremblay et al., 2015; Randelhoff and Guthrie, 2016), but also an apparently increasing prevalence of fall blooms (Ardyna et al., 2014; Nishino et al., 2015) and even fjord scale differences depending on glacier morphology (Hopwood et al., 2018). These observations are mostly qualitative and rarely quantified with direct measurements. Whereas the vertical nitrate flux in the world ocean has received attention at least since the late 1980s (Lewis et al., 1986), dedicated measurements in the Arctic Ocean have only started to accumulate in the last dozen years. We use this opportunity to summarize the current state of knowledge and investigate the role of vertical turbulent nitrate fluxes in regulating Arctic marine productivity. Interestingly, we find that vertical mixing largely explains marine primary productivity at the pan-Arctic scale. Finally, we outline further research directions to unify physical constraints of Arctic Ocean primary production.
Materials and Methods
This study compiles measurements and estimates of the upward vertical turbulent flux of nitrate in different locations across the Arctic Ocean. We present four new estimates of the turbulent vertical nitrate flux, along with a dozen more values derived from the literature. We further supplement the nitrate fluxes with a collection of vertical profiles of seawater nitrate concentration.
Compilation of NO3– Concentrations
The Pan-Arctic data base carefully compiled by Codispoti et al. (2013) was downloaded from the NOAA website under NODC accession number 0072133. An additional database covered the Canadian Archipelago using various ArcticNet and Department of Fisheries and Oceans Canada cruises, compiled in 2019 by Pierre Coupel. We included more winter data, notoriously scarce in the Arctic, by downloading data from the Chukchi shelf as presented by Arrigo et al. (2017). For each profile, we derived (1) the Brunt-Väisälä buoyancy frequency in the depth interval from 30 to 60 m as an indicator of the strength of stratification and (2) the surface nitrate concentration. For the latter, only profiles were used where the depth of the shallowest nitrate measurement was at most 15 m. The shallowest nitrate measurement was then extrapolated to the surface (0 m depth), after which values were averaged over the interval 0–15 m.
Compilation of Turbulent Vertical Nitrate Fluxes
In order to compile previously published estimates of vertical turbulent nitrate fluxes in the Arctic Ocean, we relied mostly on our knowledge of the literature, given the small amount of relevant publications. Additionally, we performed a search on Web of Science (Clarivate Analytics) using the search term TS = [(nitr∗ AND suppl∗) OR (nitr∗ AND flux∗) OR (nitr∗ AND mix∗)] AND TS = [(Arctic OR Polar) AND Ocean] AND TS = (vertical OR turbulen∗) AND WC = Ocean∗, which resulted in 95 publications that were individually screened for relevance. We only included measurements and estimates based on in situ observations.
The resulting list comprised just above a dozen flux estimates going back to less than 10 publications. To improve data coverage, we present new vertical nitrate flux estimates from the Laptev Sea, Baffin Bay, and Young Sound, as well as a re-calculation of published observations from the Chukchi Sea (Nishino et al., 2015). In order to not disrupt the flow of the main text, details of the respective methods and field campaigns are deferred to the Supplementary Appendix.
Briefly, our 3-week-long summer sampling campaign in Young Sound (a North East Greenland fjord) sought to quantify turbulent mixing, vertical nitrate supply, and new (nitrate-based) production in a fjord strongly stratified by meltwater from the Greenland Ice Sheet. From the Laptev Sea, we present a small selection of representative vertical profiles of nitrate concentrations and oceanic microstructure, collected in the years 2008–2018. From Baffin Bay, we made use of a novel year-long 2017–2018 time series of autonomous profilers, so-called biogeochemical (BGC) Argo floats (Biogeochemical-Argo Planning Group, 2016). These were specially adapted in order to function under the ice cover lasting from November to July. Based on the evolution of the upper-ocean nitrate inventory, we inferred the part due to vertical mixing. We further used a data set of nitrate concentrations and turbulent microstructure in the Chukchi Sea (Nishino et al., 2015) to calculate another estimate of vertical nitrate fluxes during early fall.
For the majority of those experiments, turbulence (microstructure) data were measured; just as was the case for the literature values. In some cases, turbulent mixing was inferred from current finestructure; see also the Supplementary Appendix. Nitrate fluxes were calculated across the nitracline, meaning by combining a nitracline-average turbulent diffusivity with the strength of the nitrate gradient. Individual methodologies may, however, vary regarding, e.g., choice of vertical layer or averaging procedures. According to our personal experience, such choices may make a difference for individual calculations, but less so for large-scale averages, and therefore we take the fluxes recorded in the literature at face value. A systematic assessment of potential methodological errors has to our knowledge, however, not been conducted. For a more detailed discussion of how vertical nitrate fluxes are measured, and in particular the uncertainties and caveats that come with each method, see the Supplementary Appendix.
For each of the estimates of the vertical turbulent nitrate flux across the nitracline and into the surface layer, we extracted the end-of-winter surface nitrate concentration either from the same publication or from related studies. We also classified each nitrate flux value as either “perennial stratification” or “winter overturning.” The former means that surface layer stratification persisted year-round; the latter means that the winter mixed layer was significantly deeper than the meltwater-stratified summer surface layer. The classification was done based on perusal of the available literature. The full rationale with a detailed description of the vertical layering in relation to the nitrogen budget is given in the Supplementary Appendix.
The specific references for each data point are given in the Supplementary Material. Our entire data set is presented in Table 1; note that it mixes vertical nitrate fluxes across different seasons, vertical levels, regions, and sample sizes.
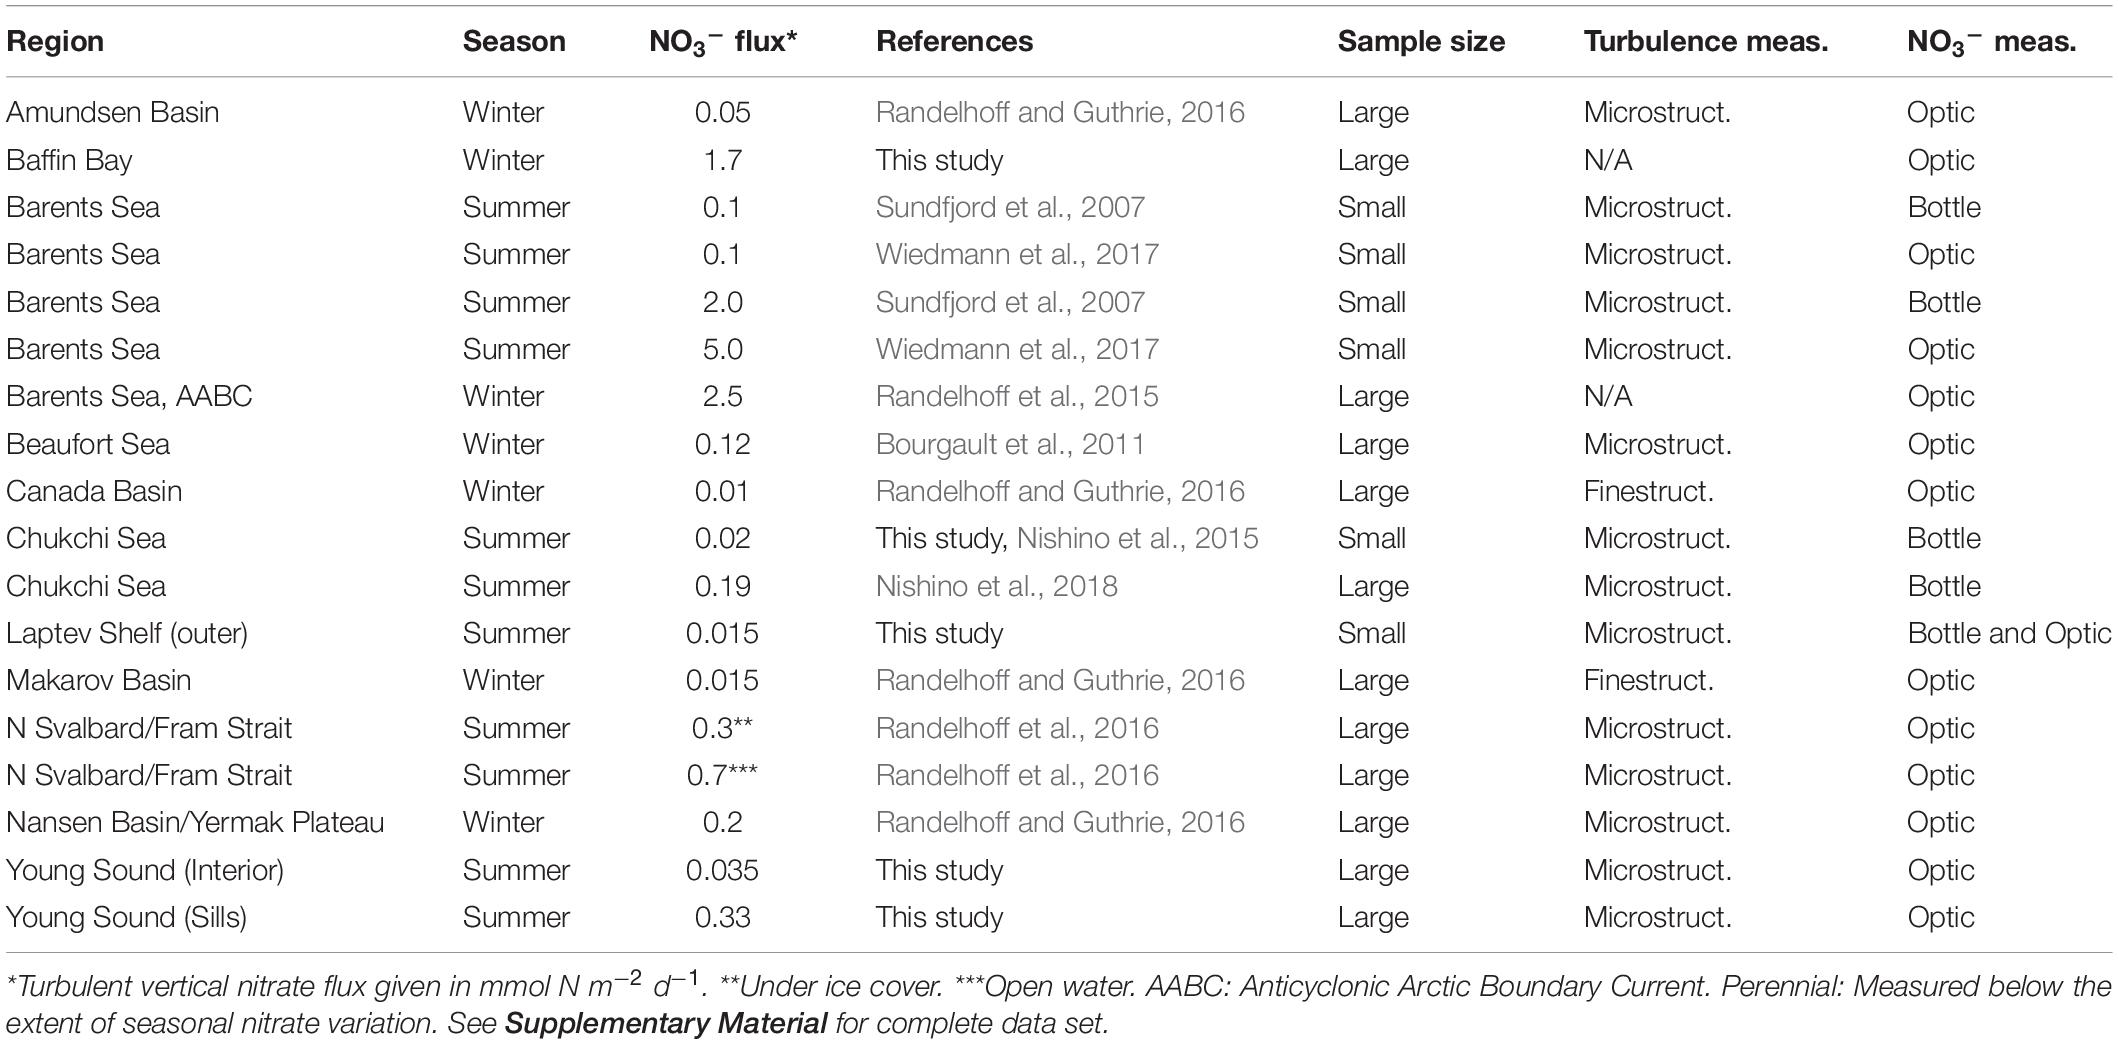
Table 1. Nitrate fluxes observed in the Arctic Ocean.
Comparison Between Nitrate Fluxes and Primary Production
We compared nitrate fluxes with new production (primary production based on assimilation of nitrate, see Dugdale and Goering, 1967) and export production. New production estimates were taken from Sakshaug (2004). Export production estimates were taken from Wiedmann (2015), who has compiled the vertical carbon export flux at 200 m depth. To enhance data coverage, we added measurements from two studies from the Central Arctic Ocean (Cai et al., 2010; Honjo et al., 2010). Details can be found in the Supplementary Material.
Both biomass and primary production are frequently given in units of carbon. To convert between units of carbon and nitrate fluxes, we employed a C:N ratio of 6.6 mol C: mol N, the so-called Redfield ratio (Redfield et al., 1963). This particular choice of C:N ratio may be criticized on the grounds that it varies depending on the type of organic matter and other environmental factors (Brzezinski, 1985; Tamelander et al., 2013), and that C:N ratios observed in the Arctic in particular are usually higher (Frigstad et al., 2014). However, turbulence measurements come with a much larger margin of error, with one detailed study giving the systematic bias between two different sets of microstructure probes, signal processing, and calibration procedures as within a factor of 2 (Moum et al., 1995). This is impressive for microstructure measurements but significantly larger than the precision with which the C:N ratio is frequently discussed in biogeochemical contexts. Therefore, by assuming a standard, constant C:N ratio, we make our results easy to adapt to other ratios should the reader want to change this number.
Results
Seasonal Cycle of Surface Nitrate Concentration
Winter surface nitrate concentrations in the Atlantic sector reached high values around 11 μM (Figure 1). In the Central Arctic Ocean, concentrations stayed constant at roughly 1–3 μM throughout the year, whereas in the coastal Beaufort Sea they occasionally reached intermediate values in winter. Most regions of the Arctic however became nitrate limited (<1 μM) during the summer, with the exception of the Eurasian Basin, the Makarov Basin, and some regions in Southern Fram Strait.
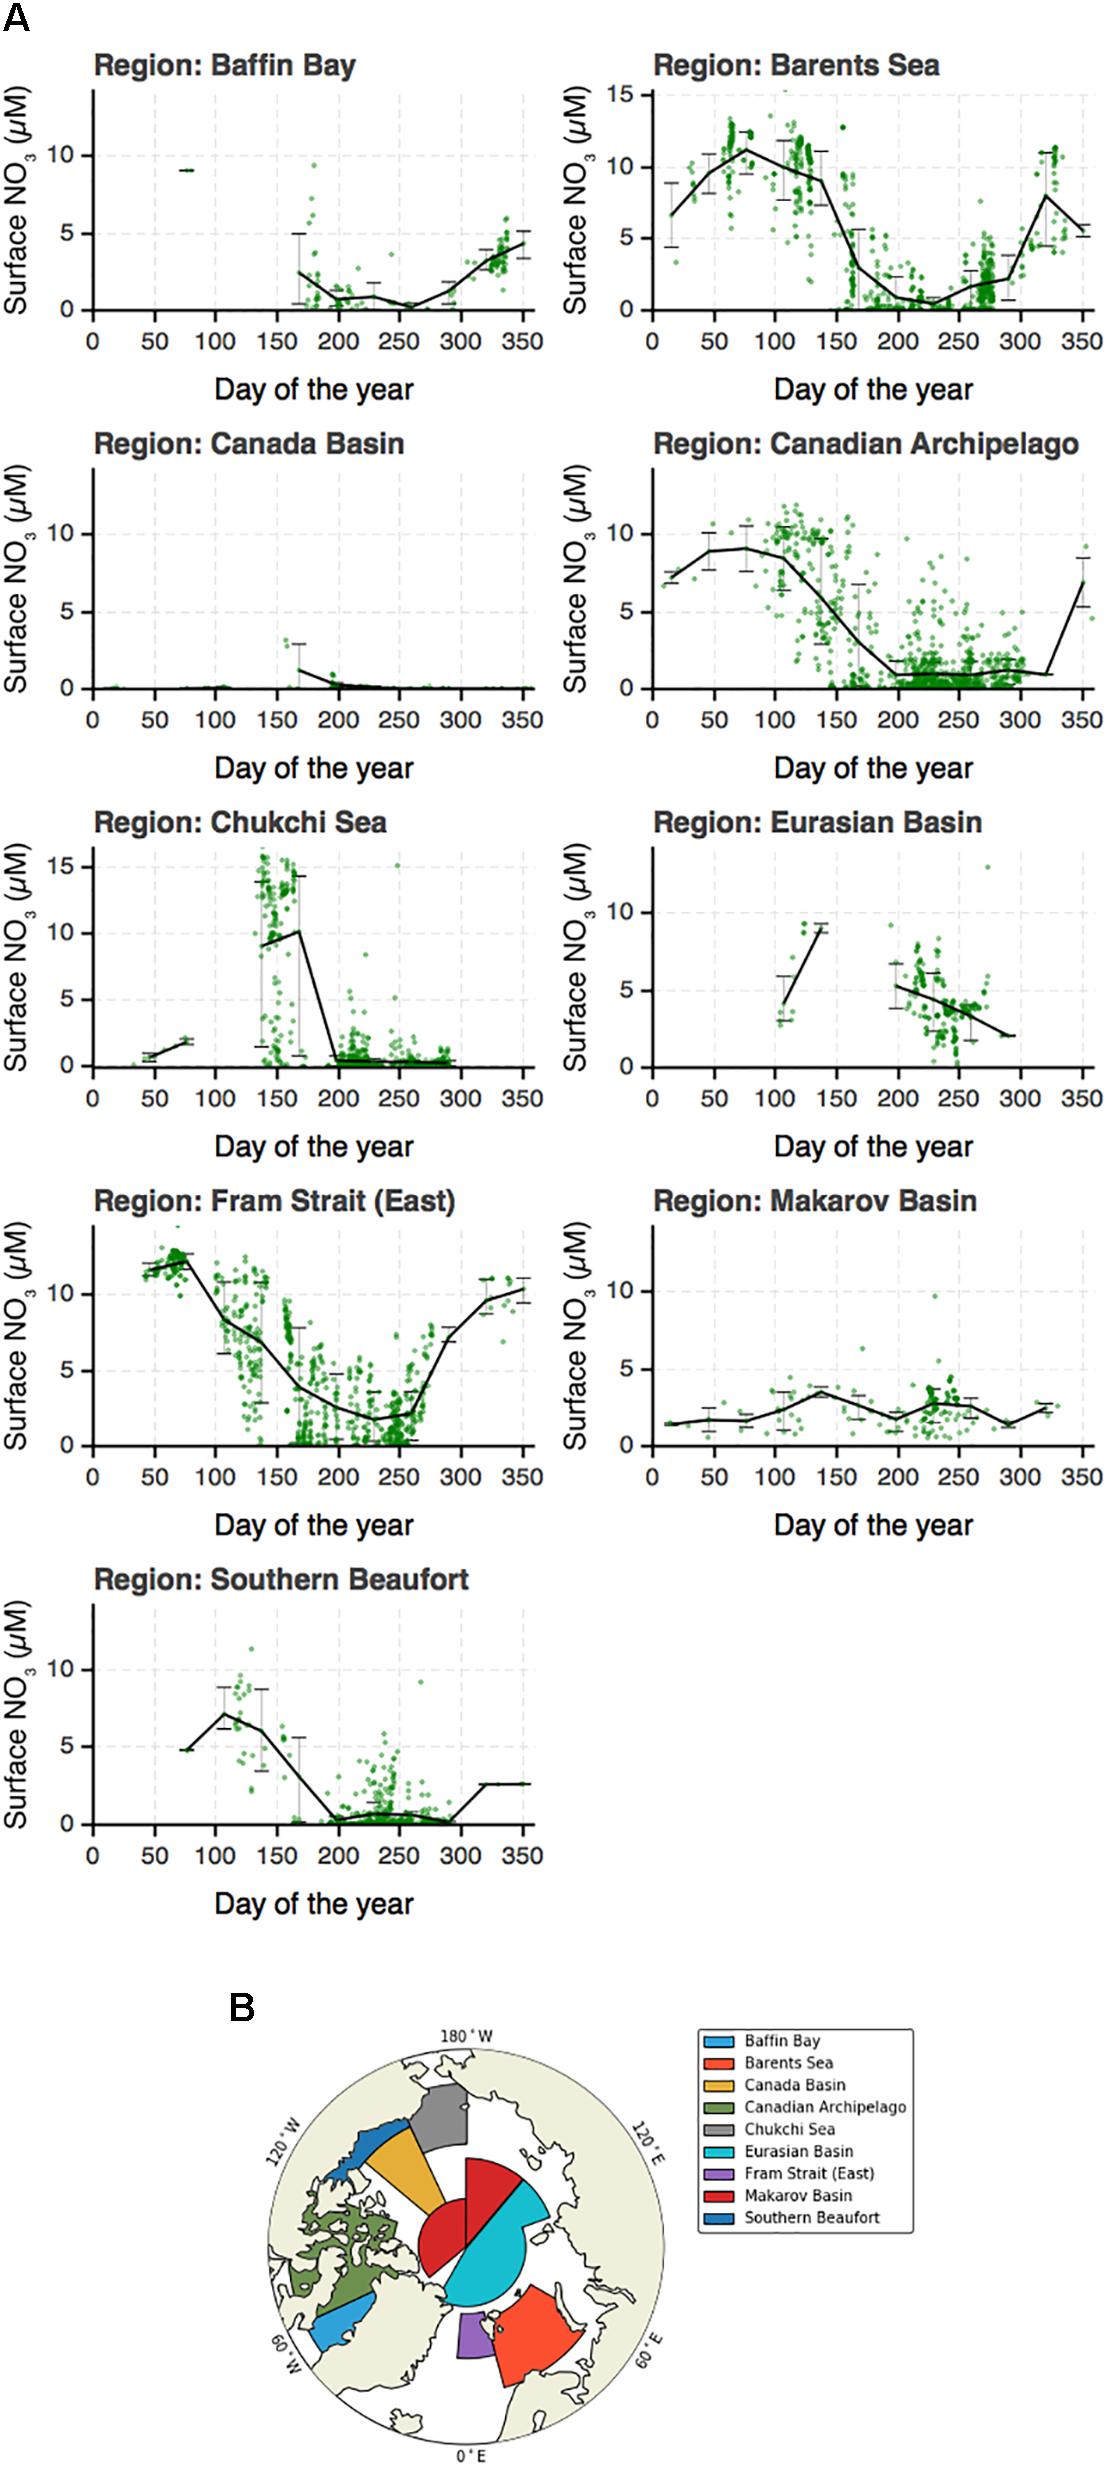
Figure 1. (A) Seasonal cycles of surface nitrate concentrations in different regions of the Arctic. (B) The delineation of these regions largely follows Codispoti et al. (2013) and Peralta-Ferriz and Woodgate (2015).
Nitrate Fluxes
Nitrate flux estimates are still scarce given that they require co-located measurements of both turbulence and nitrate concentrations; however, they approach Pan-Arctic coverage (Figure 2). Highest values (>1 mmol N m–2 d–1) were found in the Atlantic sector. The lowest values (<<0.1 mmol N m–2 d–1) occurred in the central basins (Canada Basin) and in Young Sound and the Laptev Sea, two locations strongly impacted by terrestrial freshwater.
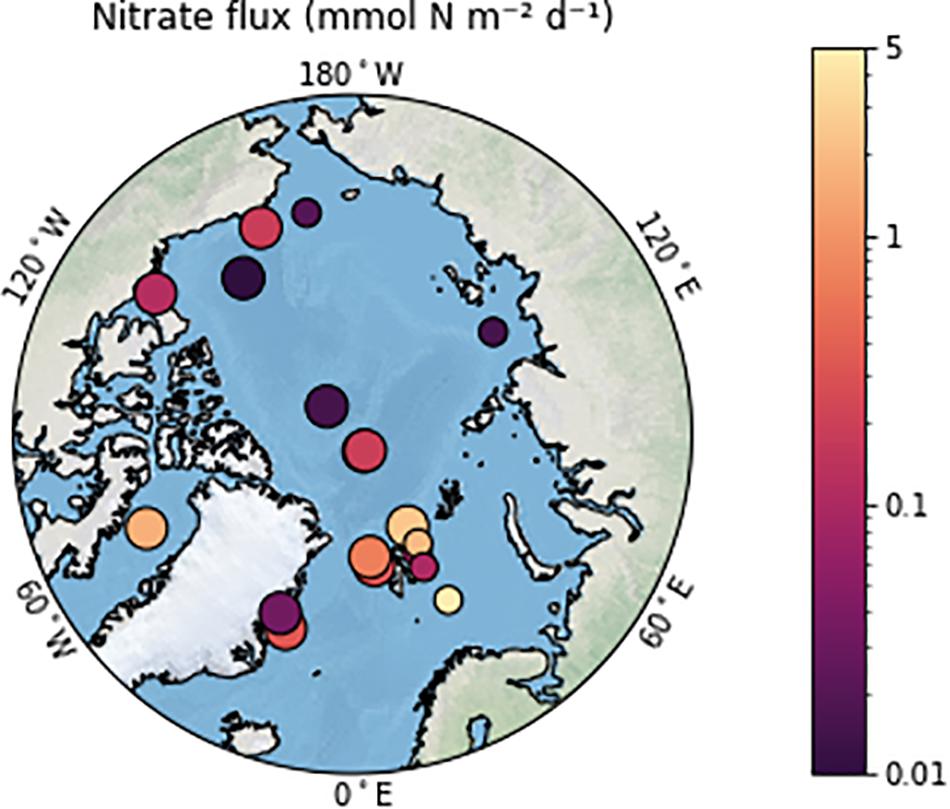
Figure 2. All nitrate flux compilation across the Arctic Ocean compiled for this study, irrespective of season and vertical levels. The smaller dots indicate single stations, whereas the big dots represent averages over larger time or space scales.
Nitrate Flux Seasonality
The seasonal cycle of surface nitrate concentration was also reflected in its upward fluxes (Figure 3). In areas where the water column overturned in winter, summer fluxes were an order of magnitude below winter values. A notable exception was observed at one station in the Barents Sea south of the polar front (Wiedmann et al., 2017), where the water was weakly stratified even in summer and hence nitrate fluxes were probably at least as high as in winter with 5 mmol N m–2 d–1 (Table 1), although sample size (N = 1) was not sufficient to draw further conclusions.
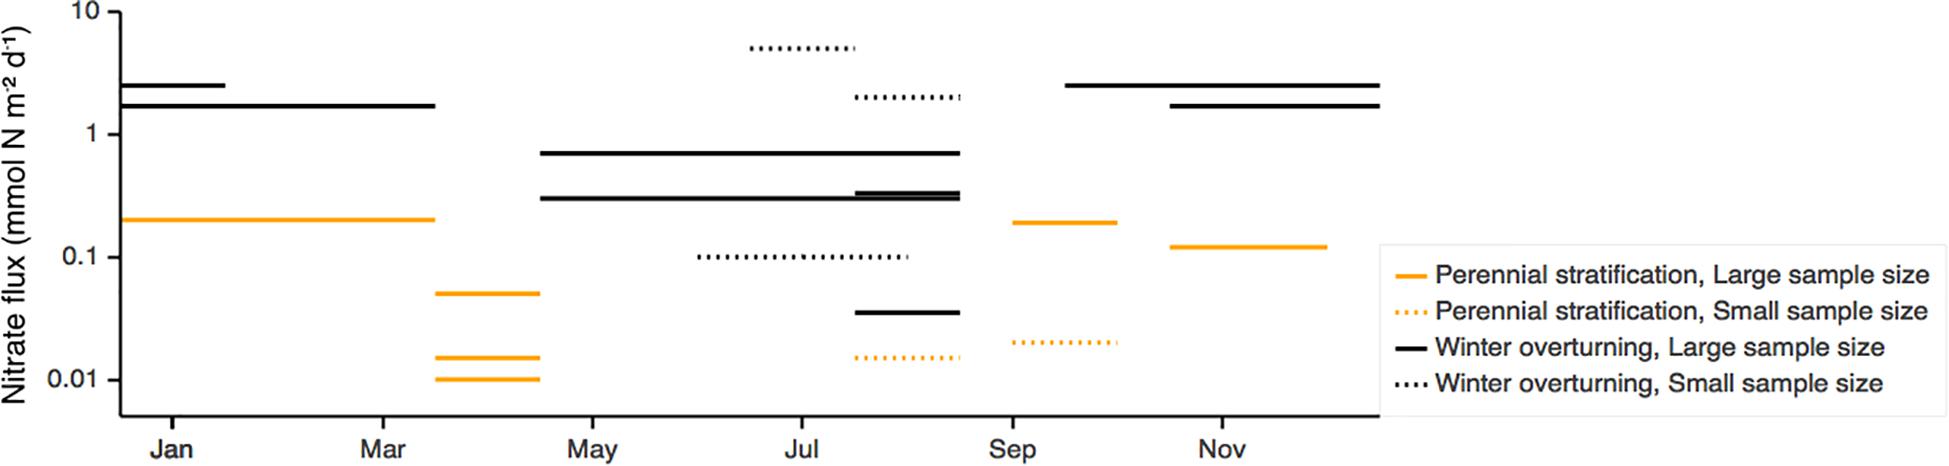
Figure 3. Vertical turbulent nitrate fluxes as a function of the month. Black lines mark the regions where the water column overturns in winter and orange those where it does not. Dotted lines reflect flux estimates based on small sample sizes (N), potentially not very representative of the regional or seasonal scale, whereas solid lines indicate data that are representative of a larger spatial or temporal scale.
Observations over a full seasonal cycle were only available in areas where the water column overturns, notably in the Barents sea and shelf slope area (Table 1). In contrast, in the non-overturning regions, fluxes were lower overall, but there is not enough data to test whether the seasonality itself is, in relative terms, really much weaker there.
Discussion
Nitrate Fluxes as a Function of Stratification and Seasonality
The vertical nitrate flux (FN) in winter was remarkably well correlated with the pre-bloom nitrate surface concentration [NO]0 (Figure 4A). A linear model [NO]0 = 7.6 μM + 3.4 μM ⋅ log10(FN/mmol N m–2 d–1) yielded an adjusted R2 = 0.85 and p = 0.002 for the linear coefficient. Consequently, deep winter mixing, where it occurs, likely is a controlling factor of the annual nitrate inventory, expanding on direct measurements of a full annual cycle over the Barents Sea shelf break (Randelhoff et al., 2015). Our results quantitatively support the perception that vertical nitrate fluxes explain the seasonality of the upper ocean nitrate inventory, as has been surmised multiple times in the literature (see e.g., Carmack and Wassmann, 2006; Tremblay et al., 2015) based on general considerations of stratification and bathymetry.
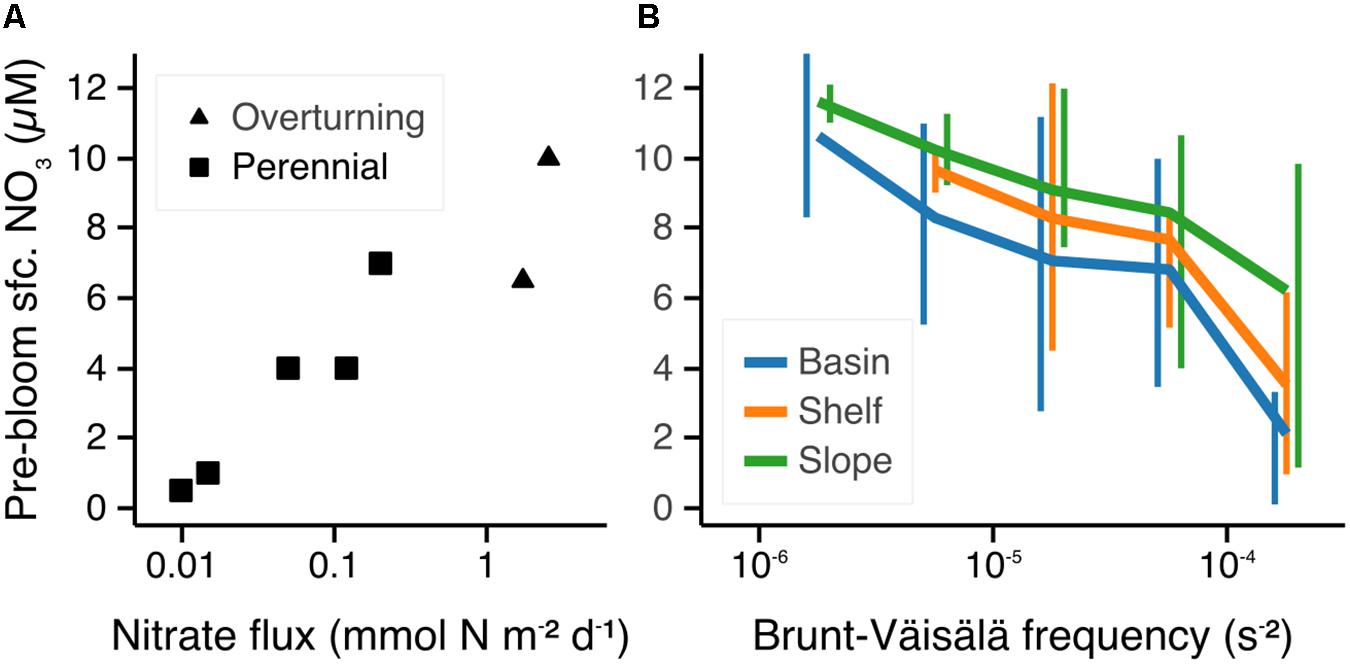
Figure 4. The surface nitrate inventory dominated by variations in turbulent mixing. The annual pre-bloom surface nitrate concentration graphed as a function of (A) the vertical nitrate flux during winter and (B) the strength of water column stratification in the upper 30–60 m depth interval. The bold curves show average nitrate concentration for a given strength of stratification for either of three bathymetry types. Vertical bars (horizontally slightly offset to increase readability) indicate the standard deviation of data for each bin. Data sources: (A) nitrate flux compilation, (B) nitrate profile database.
Stratification and bathymetry also governed pre-bloom surface nitrate concentrations (Figure 4B) and, by extension from the aforementioned, vertical nitrate fluxes. Stratification represents the resistance of the water column against overturning and vertical mixing, making its link to vertical nitrate fluxes explicit. As for bathymetry, locations with the same strength of upper-ocean stratification had on average consistently highest pre-bloom nitrate over the shelf slope (200 m < depth < 1500 m), lower on the shelves (<200 m), and lowest over the basins (>1500 m). These findings correspond to general expectations as rough or shallow topography lets currents interact with the bathymetry. Mixing in the Arctic has indeed been found to be especially elevated over the shelf slope (Rippeth et al., 2015). Tidal velocities are generally higher over the shelves than over the deep basins (Kowalik and Proshutinsky, 2013). The Arctic boundary current close to the shelf break may also provide opportunities for localized upwelling through interaction with topography or wind (Carmack and Chapman, 2003; Kämpf and Chapman, 2016).
Primary Production Constrained by Nitrate Fluxes
Annual Basin-Scale Productivity
Nitrate supply should constrain primary production. Regenerated production is a large if not dominant fraction of primary production where nitrogen is scarce and is therefore not directly related to nitrate fluxes, unlike new production, which relies on nitrate brought up from below the photic zone (Dugdale and Goering, 1967). In the absence of significant advection, new production is even stipulated to be similar to the upward nitrate flux based on conservation of mass alone (see Supplementary Appendix and Figure 9).
On annual time scales, both the upward nitrate flux in winter into the surface mixed layer, the particle export at 200 m depth, and new production (nitrate uptake) matched up reasonably well for Baffin Bay, the Barents Sea, the Southern Beaufort Sea, and the Central basin (Figure 5), both in regional patterns and order of magnitude. (Other regions lack estimates of the winter nitrate flux.) Indeed, annual budgets have to be closed if nitrate inventories are not to change in the long term. The relatively minor differences between export production, new production, and the vertical nitrate flux may reflect the extreme disparity of spatial and temporal scales of the different measurements. However, no study has systematically investigated all three quantities on annual to interannual time scales and at the same location.
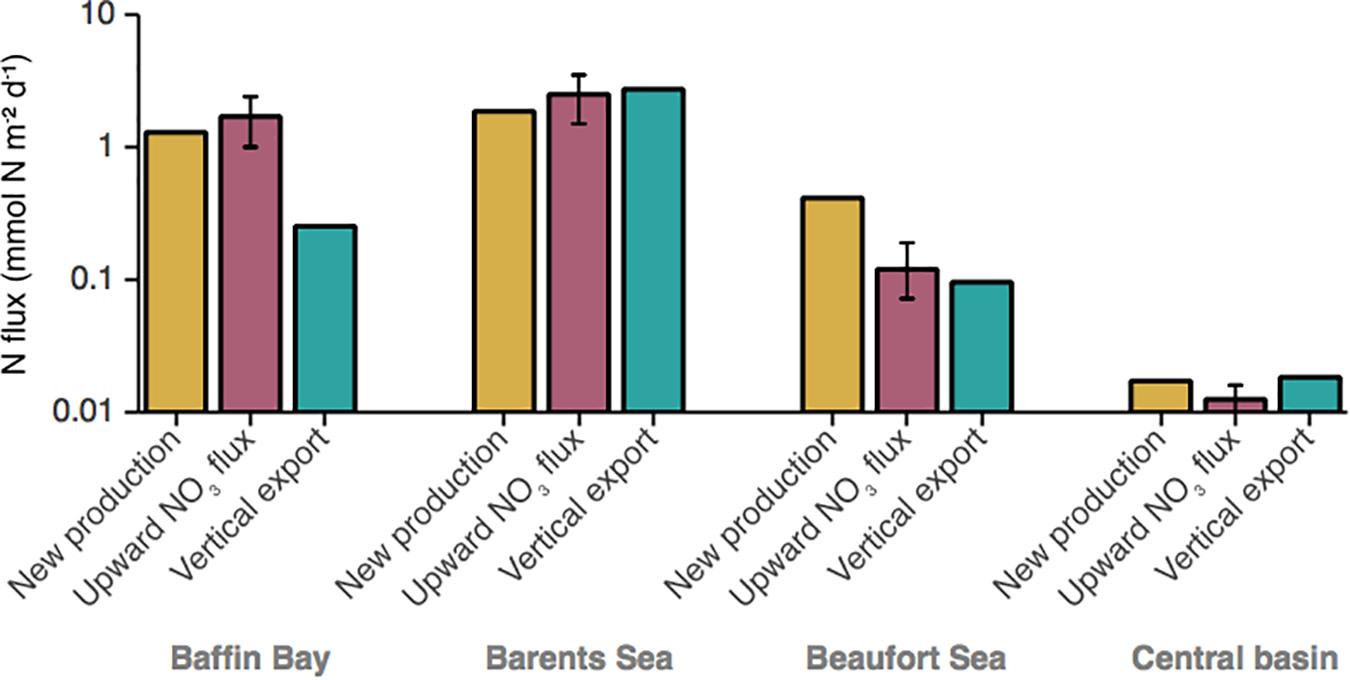
Figure 5. Annual nitrogen fluxes in the Arctic surface ocean. Winter average upward nitrate flux, new production, and vertical downward particle export (converted to nitrogen units using the Redfield ratio) at 200 m depth compared across four regions of the Arctic Ocean. Data sources: Nitrate fluxes, see Table 1; new production, Sakshaug (2004); export production, Cai et al. (2010), Honjo et al. (2010), and Wiedmann (2015). Error bars were systematically only available for nitrate fluxes.
Short-Term New Production
A different matter is whether or not during summer, upward mixing of nitrate limits the amount of new production in the short term. Here, the published literature gives a less clear picture (Figure 6A). Randelhoff et al. (2016) measured vertical nitrate flux and new production for both spring and summer in the marginal ice zone around northern Fram Strait. In spring, new production was considerably larger than vertical nitrate supply as nitrate was not yet depleted and hence did not limit photosynthesis. In summer, on the other hand, when the surface water was nitrate-depleted, new production was an order of magnitude smaller than nitrate supply, contrary to the hypothesis.
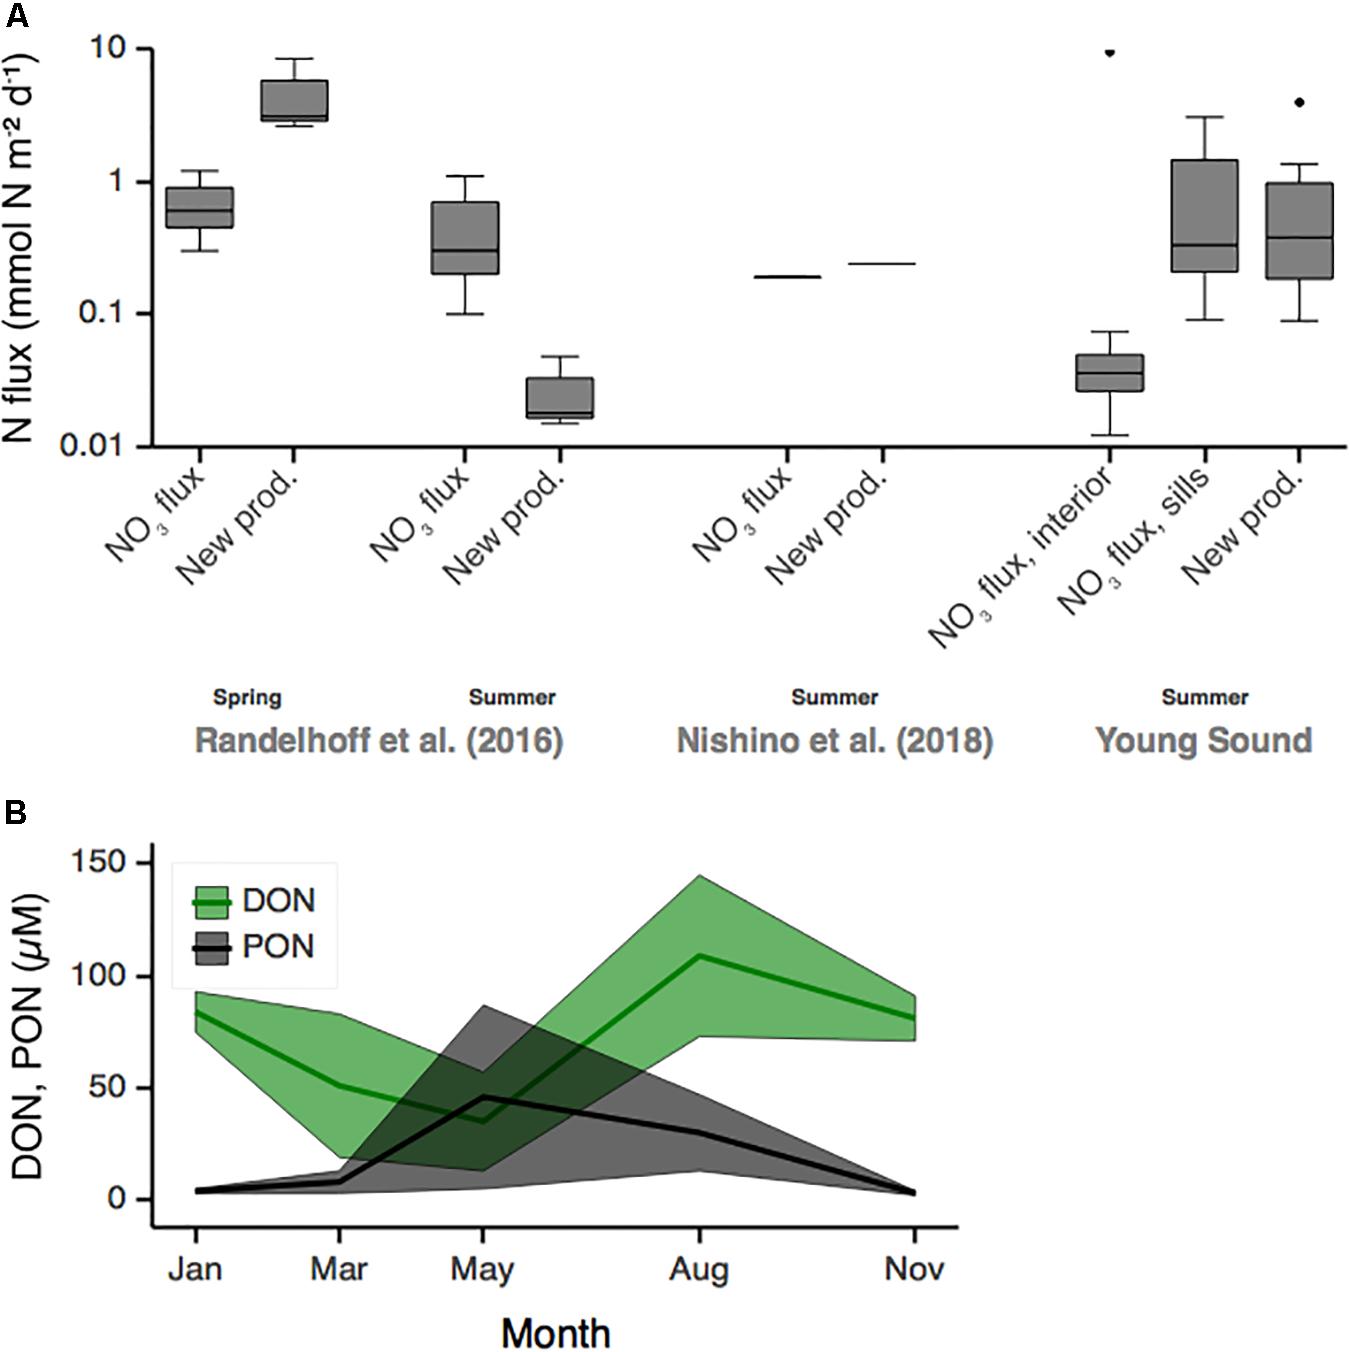
Figure 6. (A) New production incubations compared with upward nitrate flux for three case studies. Data sources: Nishino et al. (2018) and Randelhoff et al. (2016), this study (see Supplementary Appendix). (B) Annual cycle of dissolved (DON) and particulate organic nitrogen (PON) observed in the seasonal ice zone of Fram Strait. Shaded areas indicate the standard deviation. Data source: Paulsen et al. (2018), their Table 1.
A likely contribution to this discrepancy was the seasonal buildup of dissolved organic nitrogen (Figure 6B) observed during the same field campaigns by Paulsen et al. (2018). The nitrate uptake rate measurements by Randelhoff et al. (2016) only considered assimilation into the particulate pool due to methodological constraints. The simultaneous production of dissolved organic nitrogen could have diverted nitrate from the particulate to the dissolved production. However, even if there were an imbalance between supply and uptake of nitrate, the associated change in the nitrate concentration would be slow and necessitate Lagrangian measurements over weeks to detect them. Recycling of nitrogen in the microbial loop may turn out to be important when balancing nutrient fluxes with new production over short subseasonal time scales. Nishino et al. (2018) found good agreement between upward nitrate flux, nitrate uptake, and export of particulate organic matter, based on a case study in the Chukchi sea. This may represent geographic differences in the dynamics of the system, or even in the methodology. Nishino et al. (2018) used different methods from those of Randelhoff et al. (2016), even though they neglected assimilation into the dissolved nitrogen pool as well (Shiozaki et al., 2009).
Our measurements in Young Sound, North-East Greenland (see Supplementary Appendix), gave a diametrically opposed perspective: Here, vertically integrated new production was significantly above the vertical turbulent supply of new nitrate in this extremely quiescent fjord. Overall productivity in Young Sound is therefore likely limited by strong stratification and weak vertical mixing (Holding et al., 2019). Tidal mixing over the two shallow sills in concert with isopycnal mixing may contribute to overall upward nitrate supply (see e.g., Fer and Drinkwater, 2014), but terrestrial runoff may also contribute significantly to the nutrient cycling (Rysgaard et al., 2003) as nitrate concentrations in run-off water are higher than those measured in the sea surface (Paulsen et al., 2017). This scenario is likely specific to this fjord and cannot be generalized around Greenland as nitrate concentrations in Greenland Ice Sheet run-off often act to dilute surface nitrate concentrations (Meire et al., 2016; Hopwood et al., 2019).
In the same vein, but outside the Arctic Ocean, Law et al. (2001) and Rees et al. (2001) found that vertical mixing supplied only 33% of the nitrate demand at a North Atlantic site, in agreement with a study by Horne et al. (1996) in the Gulf of Maine. Even in the Mauritanian upwelling region, nitrate fluxes in excess of 100 mmol N m–2 d–1 accounted for only 10–25% of observed net community production (Schafstall et al., 2010). More extremely, Shiozaki et al. (2011) found that one location on the continental shelf of the East China Sea “exhibited a considerable discrepancy between the nitrate assimilation rate (1500 mmol N m–2 d–1) and vertical nitrate flux (98 mmol N m–2 d–1),” and they went so far as concluding that “the assumption of a direct relationship between new production, export production, and measured nitrate assimilation is misplaced, particularly regarding the continental shelf of the East China Sea.”
The scarcity of dedicated measurements that evaluate both nitrate fluxes, new production, and organic nitrogen pools at relevant space-time scales is a major impediment to evaluating the direct impact of nitrate fluxes on primary productivity in the Arctic on time scales of days. However, given the correspondence we observed between new production and vertical nitrate supply over annual Pan-Arctic scales, any mismatch between the two on sub-seasonal time scales may be caused by asynchronous evolution of the different nitrogen pools (Figures 6, 9B). Phytoplankton growth responses may also lag nutrient supply pulses, perhaps necessitating time series approaches when studying scales as short as weeks (Omand et al., 2012).
Nitrogen Limitation of Primary Production
Nitrogen scarcity plays a large role in constraining Arctic marine primary production (Moore et al., 2013; Tremblay et al., 2015). Nutrient limitation of phytoplankton growth is usually quantified in terms of a half-saturation constant (of a Michaelis-Menten kinetics), above which nutrient uptake rates benefit less and less from increasing ambient nutrient concentrations. Reported values of such half-saturation constants vary widely according to species and physiological state, but reasonable values usually range around orders of magnitude from 0.1 to 10 μM, but clustering around 1 μM (e.g., Eppley et al., 1969), with larger ones for larger cells (Chisholm, 1992) and values in the lower end for picophytoplankton (Cochlan and Harrison, 1991; Agawin et al., 2000). We infer that larger (usually bloom-forming) species are nitrate-limited in summer across large swaths of the Arctic, but not including some of the central basin, where summer surface concentrations are in excess of e.g., 5 μM in the Makarov and Nansen basins (Figure 7). These high nitrate concentrations in the Central Arctic are usually taken to indicate regionally important light limitation by perennial sea ice cover (Codispoti et al., 2013).
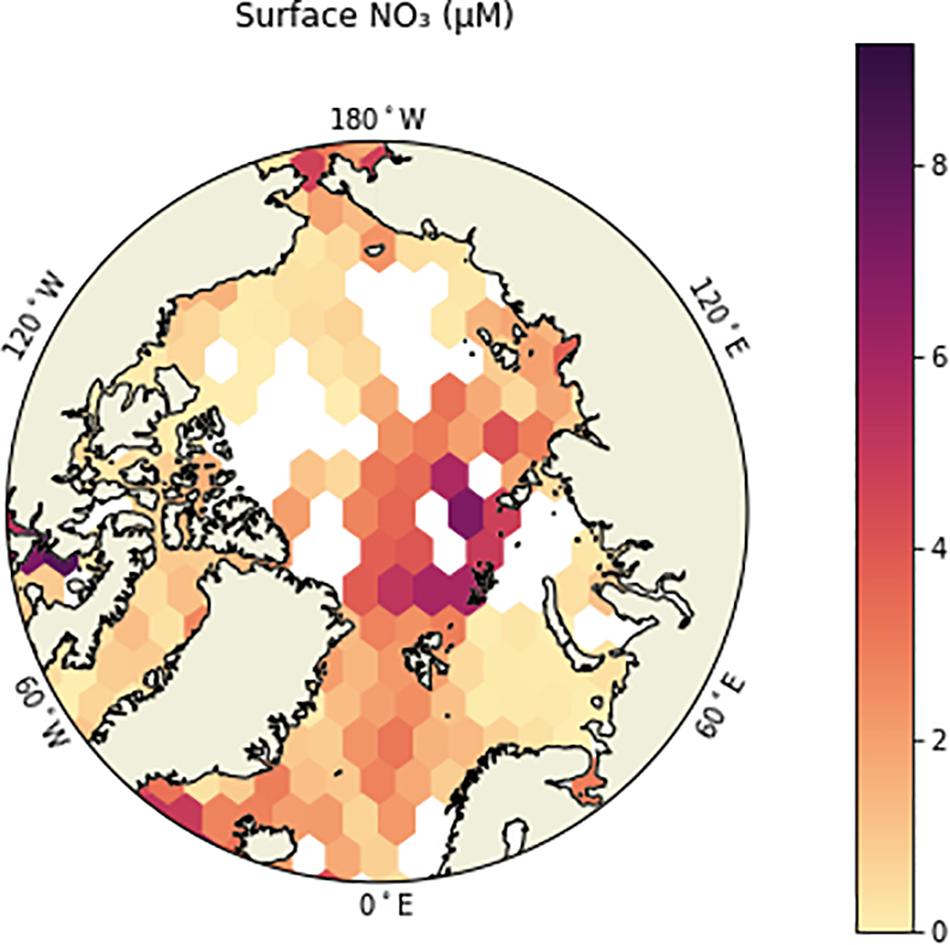
Figure 7. Summer surface nitrate concentration.
A cautionary remark is in order regarding nitrate concentrations as indicators of potential growth. Since the nitrate supply, like phytoplankton growth, is a rate and not a stock, its present-day inventory alone does not yield sufficient information to infer possible limitations in future scenarios. Therefore the summer surplus nitrate observed in the central AO may only be available transiently while the ice cover shrinks, but not in a steady-state situation without summer sea ice.
In other words: If fall blooms are due to upward mixing of new nitrate, they increase new production in the short term. Whether such increases are long-term or if they instead serve to deepen the nitracline depends on the vertical mixing in winter. Similarly, a lengthening ice-free season or a more transparent ice cover lead to a deeper euphotic zone and could enhance growth in subsurface waters, richer in nutrients, but the resupply rate of nitrogen ultimately decides about potential lasting increases in new production.
Future Scenarios
Randelhoff and Guthrie (2016) provided estimates of end-of-century new production, given presently observed turbulence and potential future increases in the freshwater inventory observed in a numerical circulation model (Nummelin et al., 2015). They concluded that a potential increase in new production in the Amundsen Basin (if the system were to turn to nitrate limitation) may fall victim to future increases in vertical stability. Little is known about the future of seasonal and especially summertime stratification in the surface layer (Randelhoff et al., 2017).
Contrarily, Polyakov et al. (2017) posited that an ongoing Atlantification will lead to deeper winter convection in the Eurasian Basin. As Atlantic Water is also the principal source of heat in the Arctic Ocean, it has been implicated in recent sea ice loss (Ivanov et al., 2016; Polyakov et al., 2017), and hence could regionally relieve nutrient and light limitation at the same time (Randelhoff et al., 2018). The recent decreases of sea ice extent in Northern Fram Strait and north of Svalbard (Onarheim et al., 2018) indicate that such a process is already well underway. The analog may be happening in the Chukchi sea, where the Alaskan Coastal Current brings in both large amounts of heat (Woodgate et al., 2012) and nutrients (Torres-Valdés et al., 2013), but the published literature is less clear on the presence and effects of such a tentative advective borealization of the Chukchi sea.
Ice Cover and Wind-Driven Turbulence
The published literature is also equivocal on whether or not the decreasing ice cover will enhance turbulent mixing in the upper ocean. While less sea ice may enhance the input of wind energy into the ocean (Rainville and Woodgate, 2009; Dosser and Rainville, 2016), this energy may be dissipated at shallow depths due to the strong stratification (Lincoln et al., 2016). Reanalysis of conductivity-temperature depth and acoustic Doppler current profiler finestructure data has not shown trends in turbulent mixing in recent decades either (Guthrie et al., 2013; Chanona et al., 2018).
Broken-up, free-drifting sea ice in summer may enhance wind energy input into the upper ocean compared to ice-covered areas by enhancing surface roughness (Martin et al., 2016) but also decrease vertical turbulent mixing in the surface layer through the associated layer of meltwater (Randelhoff et al., 2016, 2017). Larger freezing rates, caused by increasing proportions of first-year ice, may increase upward mixing, but the potential effects on entrainment of nitrate into the surface layer has to our knowledge not been systematically studied. A major uncertainty in any future prognoses is the scarcity of large-scale surveys of the ice-ocean boundary layer.
Arctic Nitrate Fluxes in a Global Context
Based on a literature review (Table 2), Arctic vertical nitrate fluxes tend to be approximately one order of magnitude lower than in the rest of the world ocean (Figure 8). Even though study sites in the global ocean may be biased by measurements seeking to explain high biological productivity (most often as the result of strong mixing and upwelling), there is a considerable difference between new production in the Arctic Ocean and the world’s most productive areas.
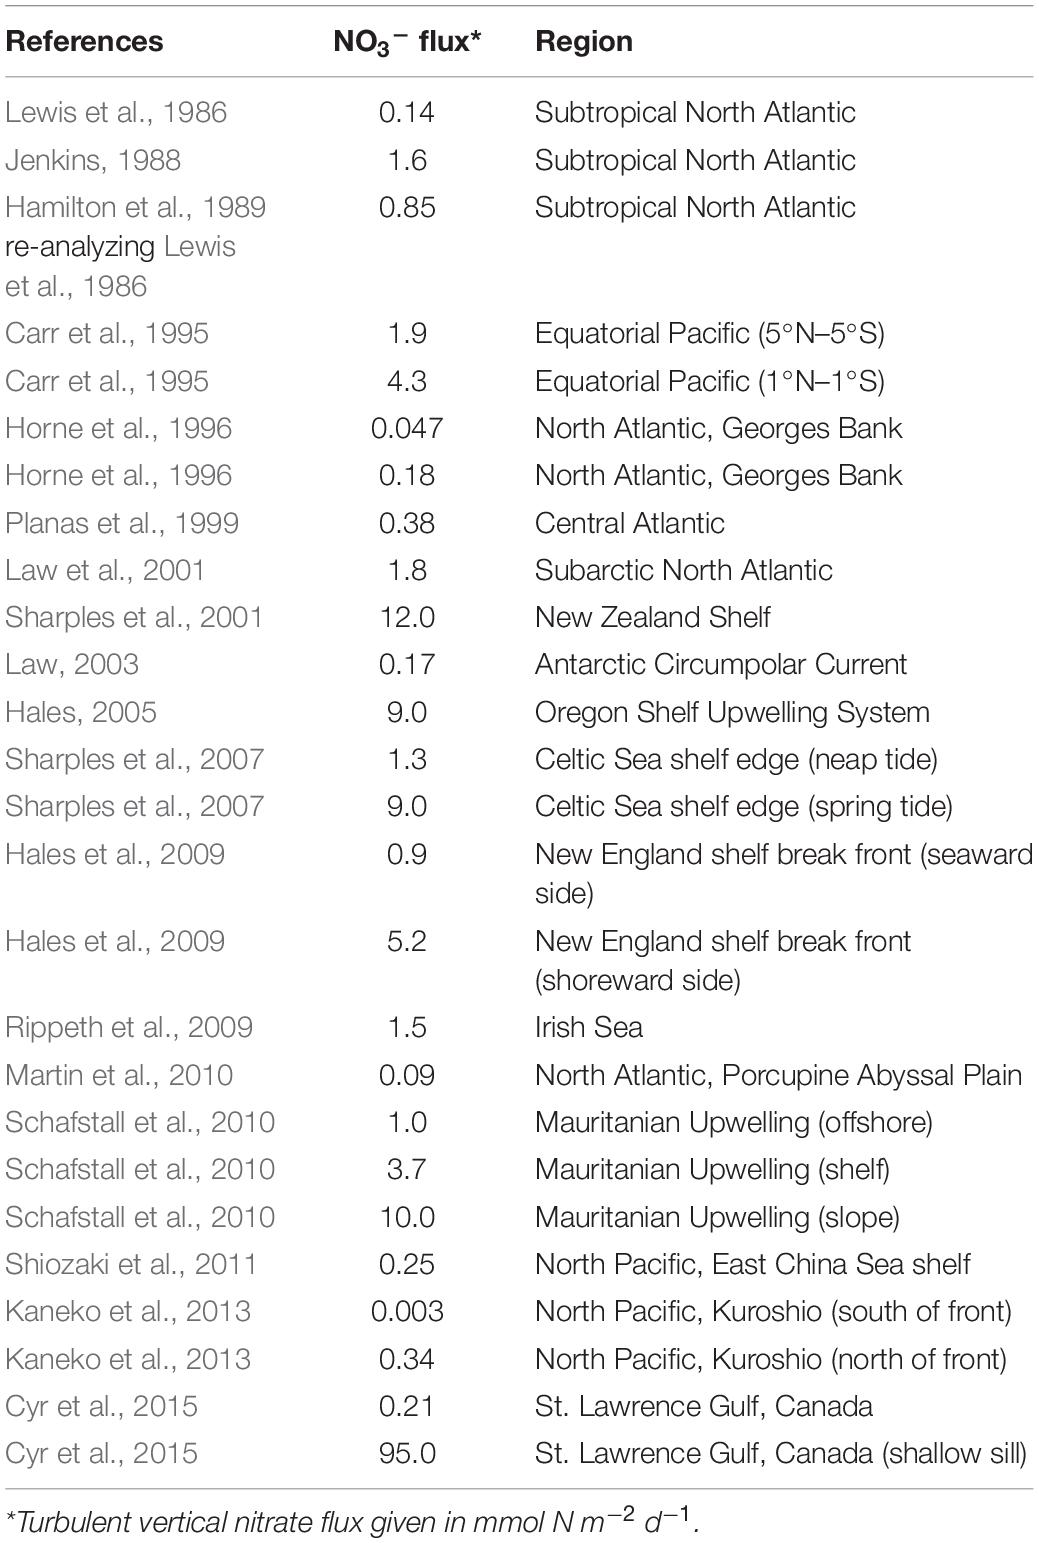
Table 2. Nitrate fluxes in the global ocean, excluding the Arctic.
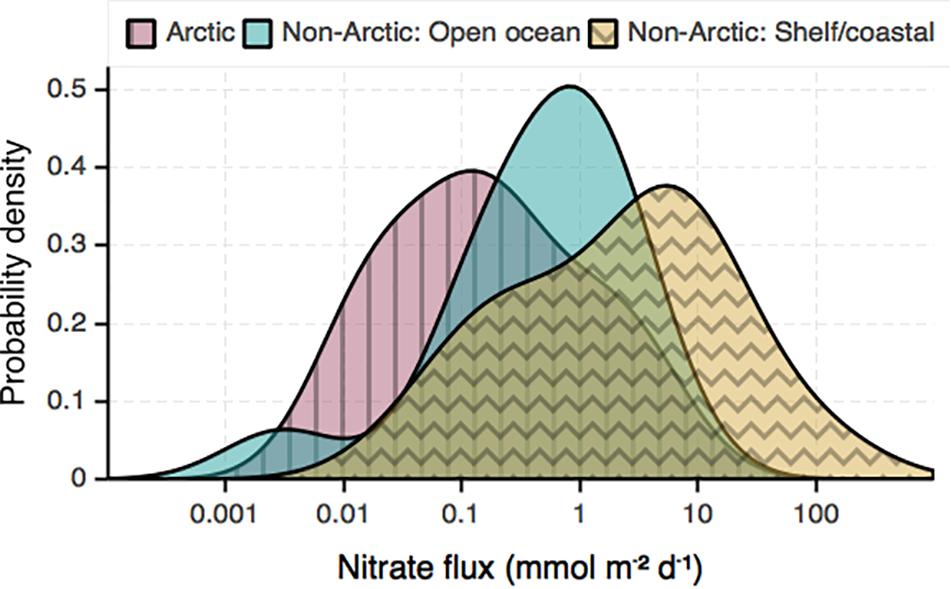
Figure 8. Distributions (kernel density estimates) of observed nitrate fluxes based on Tables 1, 2. Note that these curves give each observation the same weight, regardless of areal or temporal scope.
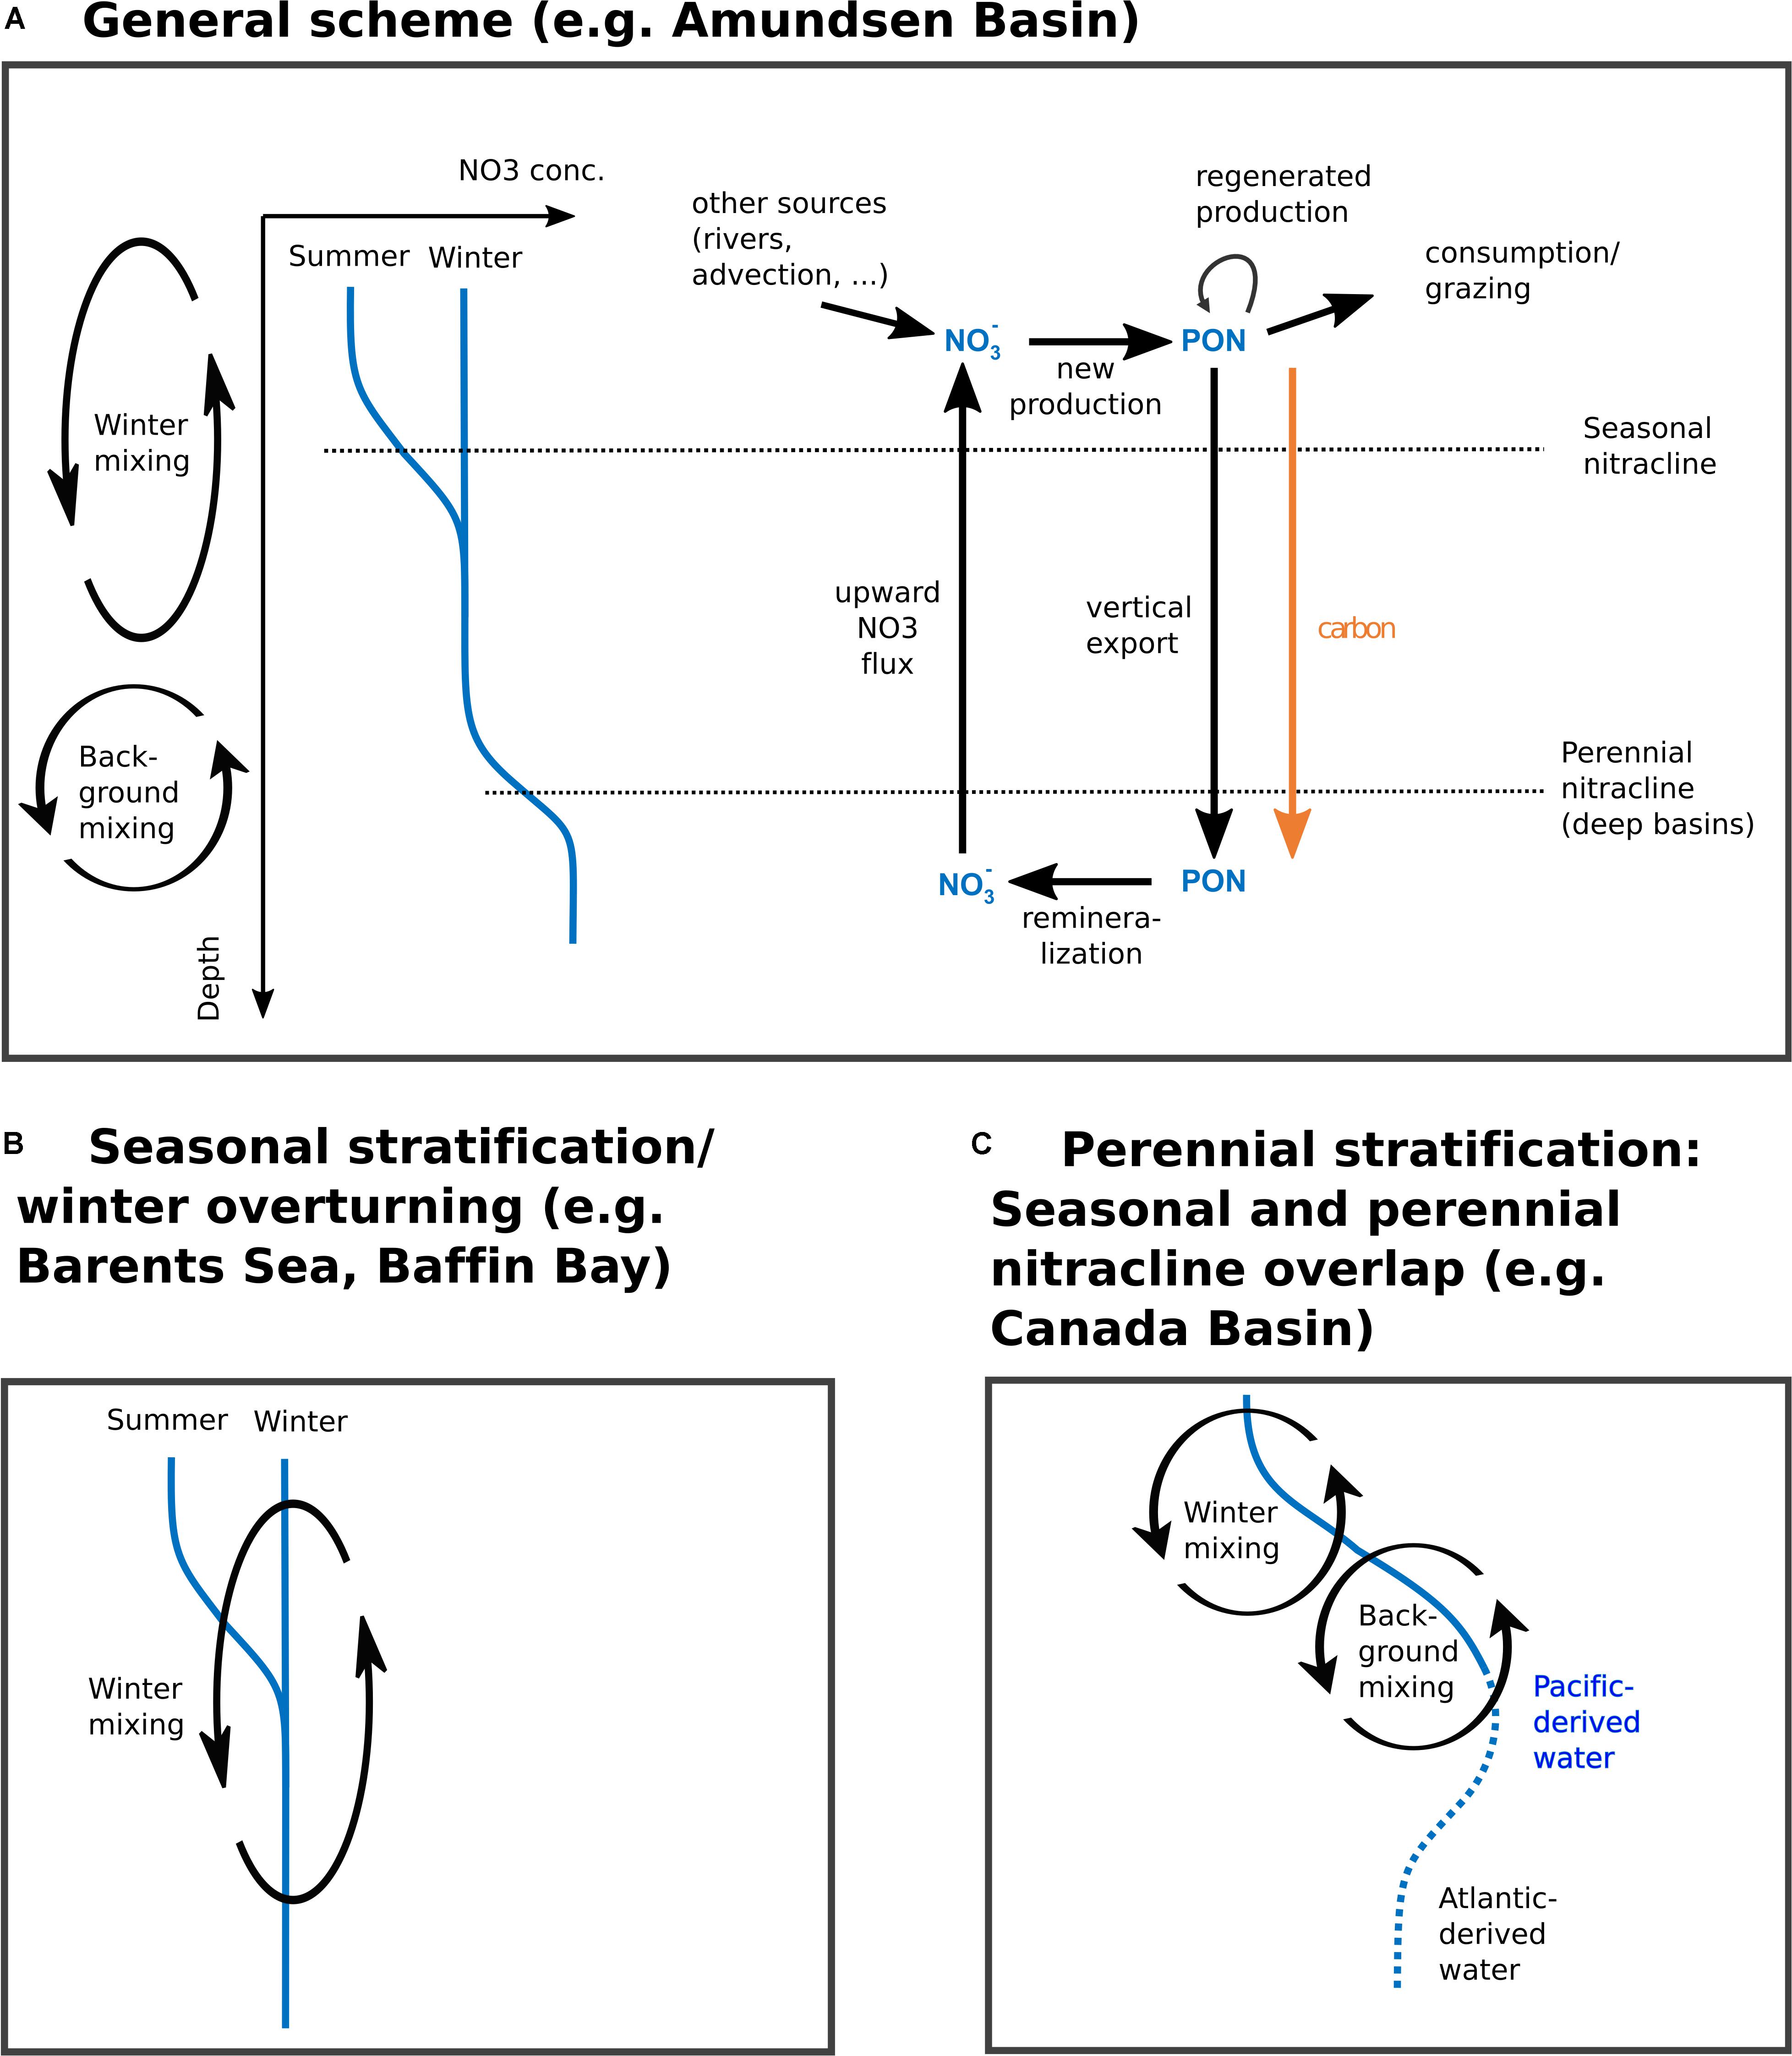
Figure 9. A simplified marine nitrogen cycle and idealized Arctic hydrography. (A) General schematic of a vertical profile of nitrate concentration, along with the respective portion of the nitrogen cycle that takes place in each layer. In this idealized case, there is a clear separation between the seasonal variations in nitrate concentrations in the surface layer which give rise to the seasonal nitracline, and the underlying perennial nitracline. (B) In areas with deep overturning into the waters of maximum nitrate concentration, the deep nitracline ceases to be meaningful. Instead, nitrate fluxes tap into high-nutrient water every winter. (C) Highly stratified areas do not see large seasonal excursions in surface layer nitrate concentrations or mixing depths.
Conclusion
Summary
(1) Determining nitrate fluxes is a laborious task. With measurements accumulating through the last 10 years, we are now approaching a Pan-Arctic baseline. In individual regions however, seasonal coverage remains patchy.
(2) Arctic nitrate fluxes are, on average, one to two orders of magnitude smaller than those observed elsewhere in the world ocean.
(3) The spatial patterns of the upper ocean nitrate inventory in the Arctic are well explained by vertical nitrate fluxes.
(4) On annual timescales, nitrate fluxes are a powerful tool to constrain export fluxes and new production, both of which are hard to measure autonomously.
(5) On weekly or shorter timescales, the relation between nitrate supply and new production is unclear, mostly due to lack of appropriate time series data. A certain asynchronicity between the different nitrogen pools may confound budget calculations.
Avenues for Further Research
Besides further aggregate scale (seasonal or basin-scale) measurements of the turbulent vertical nitrate flux, two avenues emerge from our conclusions.
(1) Advances in turbulence-ecosystem coupling will require dedicated or autonomous sampling and time series. Purely physics-oriented turbulence sampling often does not sufficiently resolve the biologically relevant surface layer.
(2) Prediction of upper ocean mixing and ice-ocean interaction depends on sea ice melt and freeze rates, expressed as buoyancy fluxes or in units of meters of freshwater equivalent per unit area. Yet, to our knowledge, this quantity is not routinely investigated as output of coupled ice-ocean circulation models and so no such data product exists that could aid in the extrapolation of Pan-Arctic patterns of the seasonal vertical nitrate flux.
Upscaling Primary Production Measurements
While currently publicly available datasets may be more comprehensive for new and export production than for nitrate fluxes, they possess some drawbacks concerning evaluating large-scale patterns. As incubations to determine new production are usually point measurements, averaging them is not trivial. Sediment traps, while measuring export fluxes at a single location, integrate the time dimension, and so are more representative, but also require a large logistic effort. Chemical tracer approaches (e.g., Moran et al., 2003) make the data acquisition phase easier, but still require water samples and are hence not easily amenable to autonomous exploration. In sum, current Arctic Ocean exploration does not scale well. Nitrate fluxes, on the other hand, can be estimated purely based on physical sensor data and hence with larger scope both in time and space.
Such turbulence measurements do not necessarily have to be conducted using microstructure profilers – mixing can also be estimated from current shear or density strain fine-structure with more standard instruments, which may work especially well in discerning relative magnitudes but can also be calibrated using regional microstructure estimates (Gargett and Garner, 2008; Guthrie et al., 2013; Polzin et al., 2014; Chanona et al., 2018). Parameterizations of this kind, relying on models of internal wave breaking, are most useful away from boundaries, in scenarios of perennial stratification where year-round background fluxes dominate (Randelhoff and Guthrie, 2016), and less so to characterize near-surface mixing. Other promising avenues are approaches based on turbulence structure functions (Wiles et al., 2006), high-frequency Acoustic Doppler Current Profiler measurements, or microstructure sensors deployed on moorings and gliders (Scheifele et al., 2018).
Turbulence also obeys tight physical constraints imposed by wind, tidal and other energy available for mixing, and by the freshwater (density) fluxes that cause background stratification. Nitrate fluxes may therefore be more easily constrained than plankton photophysiology that is notoriously variable across species and environmental conditions (e.g., Bouman et al., 2018).
Perspectives
This study has focused on vertical diffusive transport, largely ignoring other transport modes. Upwelling (Carmack and Chapman, 2003; Kämpf and Chapman, 2016), horizontal advection (Torres-Valdés et al., 2013), mesoscale eddy shedding (Watanabe et al., 2014), benthic processes (Renaud et al., 2015), and river biogeochemistry (Frey and McClelland, 2009) all likely affect Arctic Ocean primary production at least regionally. The fact that Pan-Arctic patterns of primary production can seemingly be explained without the need to invoke any of these mechanisms also showcases the stark contrasts between the different Arctic regimes that likely shadow intra-regional nuances.
Mesoscale turbulence can contribute to cross-shelf transport and nutrient supply in the Chukchi sea (Watanabe et al., 2014). Some studies suggest that eddies may also contribute to cross-shelf transport along the West Spitsbergen Current (Hattermann et al., 2016). Crews et al. (2018) found eddies may contribute to ventilation of halocline waters in the European Arctic, meaning they would be apparent in the upward vertical fluxes measured out of the halocline waters instead of contributing directly to mixed-layer nitrate pools. Johnson et al. (2010), working in the Subtropical North Pacific, stressed the importance of event-driven upward nitrate transport not easily captured by vertical diffusivities, and even the possibility of immediate utilization of nitrate in an otherwise diabatic isopycnal excursion, for example associated with a passing eddy. Attention is required summing these contributions, however, as there is a certain danger of double counting nitrate fluxes in eddies (Martin and Richards, 2001; Martin and Pondaven, 2003).
Advection with ocean currents manifests itself largely as transport with the Pacific and Atlantic currents that, e.g., Torres-Valdés et al. (2013) have discussed. For the most part, these currents are subducted under local (Arctic) water masses and can hence be accounted for as part of the vertical fluxes downstream. Randelhoff et al. (2016) have argued that as these currents come from further south where primary production starts earlier and terminates later, the surface waters they carry are as nutrient-depleted as the Arctic surface waters. This argument has, however, never been tested quantitatively. Similarly, upwelling along coasts, shelf breaks, in eddies, and at marine-terminating glaciers may contribute regionally to ocean productivity (Carmack and Chapman, 2003; Kämpf and Chapman, 2016; Meire et al., 2017). Arguments as to how exactly upwelling is caused and how it impacts nutrient fluxes have largely remained qualitative (Randelhoff and Sundfjord, 2018; but see Spall et al., 2014 for a careful modeling exercise).
Lastly, turbulent mixing is much more than only the vertical nitrate flux. It affects predator-prey interactions (Kiørboe, 2008), nutrient uptake rates at the cell level (Karp-Boss et al., 1996), light exposure of individual cells (Sverdrup, 1953), etc. In fact, mixing and variability is a resource in itself that can be exploited by different plankton life strategies (Margalef, 1978). These concepts may turn out to be important in particular when interpreting regional specifics such as biological hotspots. As methods advance and measurements accumulate, we expect that more efforts can be dedicated to studying regional phenomena in a Pan-Arctic unified manner.
Data Availability Statement
All data that were published for the first time in this study are included with Randelhoff (2020). The rest are included to the extent possible.
Author Contributions
AR designed the study, made all visualizations, and wrote the first draft of the manuscript. AR, JH, and MS conducted field sampling and data analysis of the Young Sound data. MA and MJ sampled and analyzed the Laptev Sea data. MB lead the acquisition of the Baffin Bay data. J-ÉT contributed Canadian Archipelago nutrient data. All authors commented on the manuscript.
Funding
Data acquisition of BGC-Argo Floats in Baffin Bay was funded through the NAOS project. Work in Young Sound was supported by the DANCEA project “De-icing Arctic coasts” and the Greenland Ecosystem Monitoring Programme. AR was supported by the Sentinel North program of Université Laval, partly funded by the Canada First Research Excellence Fund, and Carbon Bridge, a Polar Programme (project 226415) funded by the Norwegian Research Council. JH was supported by the European Commission H2020 programme under the Marie Skłodowska-Curie Actions (GrIS-Melt: Grant No. 752325). MA was supported by the National Science Foundation (PLR-1203146 AM003) and the National Oceanic and Atmospheric Administration (NA15OAR4310156). MJ was supported by the German Ministry of Science and Education (BMBF) under grants 03G0833, 03F0776, and 03F0804A.
Conflict of Interest
The authors declare that the research was conducted in the absence of any commercial or financial relationships that could be construed as a potential conflict of interest.
Acknowledgments
The present article started taking shape around the 4th “Symposium on Pan-Arctic Integration,” held in Motovun, Croatia, 2017, and we thank all participants for inspiring discussions. We thank Andrey Novikhin (AARI) for preparing the nutrient measurements from the Laptev Sea shelf, Xiaogang Xing for quality-controlling and calibrating the Baffin Bay BGC Argo data, and Jørgen Bendtsen and Torben Vang for providing Young Sound bathymetry data. We are further grateful to Shigeto Nishino for clarifying discussions about his work in the Chukchi Sea. Data exploration and visualization relied heavily on the Holoviews library (Stevens et al., 2015). Pierre Coupel compiled the nitrate concentration database for the Canadian Arctic.
Supplementary Material
The Supplementary Material for this article can be found online at: https://www.frontiersin.org/articles/10.3389/fmars.2020.00150/full#supplementary-material
The Supplementary Material, accessible at https://github.com/poplarShift/arctic-nitrate-fluxes, contains:
• The python code necessary to reproduce all analyses and figures, licensed under GNU GPL3.
• The data, as plotted in all figures, in machine readable formats.
• An interactive version of this article where figures can be zoomed, panned, and selectively highlighted (as appropriate) leveraging the Bokeh library (Bokeh Development Team, 2018).
References
Aagaard, K., and Carmack, E. C. (1989). The role of sea ice and other fresh water in the Arctic circulation. J. Geophys. Res. Oceans 94, 14485–14498. doi: 10.1029/JC094iC10p14485
Agawin, N. S. R., Duarte, C. M., and Agustí, S. (2000). Nutrient and temperature control of the contribution of picoplankton to phytoplankton biomass and production. Limnol. Oceanogr. 45, 591–600. doi: 10.4319/lo.2000.45.3.0591
Alkire, M. (2019). Ocean Conductivity, Temperature, Density (CTD), Oxygen, and Nitrate Profiles, Eurasian and Makarov Basins, Arctic Ocean, 2013–2018. Arctic Data Center. Available online at: https://arcticdata.io/catalog/view/doi:10.18739/A24X54G9W
Alkire, M. B., Falkner, K. K., Morison, J., Collier, R. W., Guay, C. K., Desiderio, R. A., et al. (2010). Sensor-based profiles of the NO parameter in the central Arctic and southern Canada Basin New insights regarding the cold halocline. Deep-Sea Res. Part I-Oceanogr. Res. Pap. 57, 1432–1443. doi: 10.1016/j.dsr.2010.07.011
Allen, T. F. H., and Hoekstra, T. W. (2015). Toward a Unified Ecology, 2nd Edn. New York, NY: Columbia University Press.
Ambühl, H. (1959). Die Bedeutung der Strömung als ökologischer Faktor. Schweiz. Z. Hydrol. 21:133. doi: 10.1007/BF02505455
Ardyna, M., Babin, M., Gosselin, M., Devred, E., Rainville, L., and Tremblay, J. É (2014). Recent Arctic Ocean sea ice loss triggers novel fall phytoplankton blooms. Geophys. Res. Lett. 41, 6207–6212. doi: 10.1002/2014gl061047
Arrigo, K. R., Mills, M. M., Dijken, G. L., van, Lowry, K. E., Pickart, R. S., et al. (2017). Late spring nitrate distributions beneath the ice-covered northeastern chukchi shelf. J. Geophys. Res. Biogeosci. 122, 2409–2417. doi: 10.1002/2017JG003881
Bauch, D., Cherniavskaia, E., Novikhin, A., and Kassens, H. (2018). Physical oceanography, nutrients, and δ18O measured on water bottle samples in the Laptev Sea. PANGAEA doi: 10.1594/PANGAEA.885448
Biogeochemical-Argo Planning Group (2016). The Scientific Rationale, Design and Implementation Plan for a Biogeochemical-Argo Float Array. Issy-les-Moulineaux: Ifremer, doi: 10.13155/46601
Bluhm, B. A., Kosobokova, K. N., and Carmack, E. C. (2015). A tale of two basins: an integrated physical and biological perspective of the deep Arctic Ocean. Prog. Oceanogr. 139, 89–121. doi: 10.1016/j.pocean.2015.07.011
Bokeh Development Team (2018). Bokeh: Python Library for Interactive Visualization. Wichita, KS: Bokeh Development Team.
Bouffard, D., and Boegman, L. (2013). A diapycnal diffusivity model for stratified environmental flows. Dynam. Atmos. Oceans 6, 14–34. doi: 10.1016/j.dynatmoce.2013.02.002
Bouman, H. A., Platt, T., Doblin, M., Figueiras, F. G., Gudmundsson, K., Gudfinnsson, H. G., et al. (2018). Photosynthesis-irradiance parameters of marine phytoplankton: synthesis of a global data set. Earth Syst. Sci. Data 10, 251–266. doi: 10.5194/essd-10-251-2018
Bourgault, D., Hamel, C., Cyr, F., Tremblay, J. -É, Galbraith, P. S., Dumont, D., et al. (2011). Turbulent nitrate fluxes in the Amundsen Gulf during ice-covered conditions. Geophys. Res. Lett. 38:L15602. doi: 10.1029/2011GL047936
Brzezinski, M. A. (1985). The Si:C:N ratio of marine diatoms: interspecific variability and the effect of some environmental variables. J. Phycol. 21, 347–357. doi: 10.1111/j.0022-3646.1985.00347.x
Cai, P., Rutgers van der Loeff, M., Stimac, I., Nöthig, E.-M., Lepore, K., and Moran, S. B. (2010). Low export flux of particulate organic carbon in the central Arctic Ocean as revealed by 234Th:238U disequilibrium. J. Geophys. Res. Oceans 115:C10037. doi: 10.1029/2009JC005595
Carmack, E., Barber, D., Christensen, J., Macdonald, R., Rudels, B., and Sakshaug, E. (2006). Climate variability and physical forcing of the food webs and the carbon budget on panarctic shelves. Prog. Oceanogr. 71, 145–181. doi: 10.1016/j.pocean.2006.10.005
Carmack, E., and Chapman, D. C. (2003). Wind-driven shelf/basin exchange on an Arctic shelf: The joint roles of ice cover extent and shelf-break bathymetry. Geophys. Res. Lett. 30:1778. doi: 10.1029/2003gl017526
Carmack, E., and Wassmann, P. (2006). Food webs and physical – Biological coupling on pan-Arctic shelves: unifying concepts and comprehensive perspectives. Prog. Oceanogr. 71, 446–477. doi: 10.1016/j.pocean.2006.10.004
Carmack, E. C. (2007). The alpha/beta ocean distinction: a perspective on freshwater fluxes, convection, nutrients and productivity in high-latitude seas. Deep Sea Res. Part II: Top. Stud. Oceanogr. 54, 2578–2598. doi: 10.1016/j.dsr2.2007.08.018
Carr, M.-E., Lewis, M. R., Kelley, D., and Jones, B. (1995). A physical estimate of new production in the equatorial Pacific along 150W. Limnol. Oceanogr. 40, 138–147. doi: 10.4319/lo.1995.40.1.0138
Chanona, M., Waterman, S., and Gratton, Y. (2018). Variability of internal wave-driven mixing and stratification in canadian arctic shelf and shelf-slope waters. J. Geophys. Res. Oceans 123, 9178–9195. doi: 10.1029/2018JC014342
Chisholm, S. W. (1992). “Phytoplankton Size,” in Primary Productivity and Biogeochemical Cycles in the Sea Environmental Science Research, eds P. G. Falkowski, A. D. Woodhead, and K. Vivirito, (Boston, MA: Springer), 213–237. doi: 10.1007/978-1-4899-0762-2_12
Cochlan, W. P., and Harrison, P. J. (1991). Kinetics of nitrogen (nitrate, ammonium and urea) uptake by the picoflagellate Micromonas pusilla (Prasinophyceae). J. Exp. Mar. Biol. Ecol. 153, 129–141. doi: 10.1016/0022-0981(91)90220-Q
Codispoti, L. A., Kelly, V., Thessen, A., Matrai, P., Suttles, S., Hill, V., et al. (2013). Synthesis of primary production in the Arctic Ocean: III. Nitrate and phosphate based estimates of net community production. Prog. Oceanogr. 110, 126–150. doi: 10.1016/j.pocean.2012.11.006
Cole, S. T., Toole, J. M., Rainville, L., and Lee, C. M. (2018). Internal waves in the Arctic: influence of ice concentration, ice roughness, and surface layer stratification. J. Geophys. Res. Oceans 123, 5571–5586. doi: 10.1029/2018JC014096
Comiso, J. C. (2012). Large decadal decline of the Arctic multiyear ice cover. J. Clim. 25, 1176–1193. doi: 10.1175/JCLI-D-11-00113.1
Crews, L., Sundfjord, A., Albretsen, J., and Hattermann, T. (2018). Mesoscale eddy activity and transport in the atlantic water inflow region north of svalbard. J. Geophys. Res. Oceans 123, 201–215. doi: 10.1002/2017JC013198
Cyr, F., Bourgault, D., Galbraith, P. S., and Gosselin, M. (2015). Turbulent nitrate fluxes in the Lower St. Lawrence Estuary (Canada). J. Geophys. Res. Oceans 120, 2308–2329. doi: 10.1002/2014jc010272
Dosser, H. V., and Rainville, L. (2016). Dynamics of the changing near-inertial internal wave field in the arctic ocean. J. Phys. Oceanogr. 46, 395–415. doi: 10.1175/jpo-d-15-0056.1
Dugdale, R. C., and Goering, J. J. (1967). Uptake of new and regenerated forms of nitrogen in primary productivity. Limnol. Oceanogr. 12, 196–206. doi: 10.4319/lo.1967.12.2.0196
Eppley, R. W., Rogers, J. N., and McCarthy, J. J. (1969). Half-saturation constants for uptake of nitrate and ammonium by marine phytoplankton1. Limnol. Oceanogr. 14, 912–920. doi: 10.4319/lo.1969.14.6.0912
Fer, I., and Drinkwater, K. (2014). Mixing in the barents sea polar front near hopen in spring. J. Mar. Syst. 130, 206–218. doi: 10.1016/j.jmarsys.2012.01.005
Frey, K. E., and McClelland, J. W. (2009). Impacts of permafrost degradation on arctic river biogeochemistry. Hydrol. Process. 23, 169–182. doi: 10.1002/hyp.7196
Frigstad, H., Andersen, T., Bellerby, R. G. J., Silyakova, A., and Hessen, D. O. (2014). Variation in the seston C:N ratio of the arctic ocean and pan-arctic shelves. J. Mar. Syst. 129, 214–223. doi: 10.1016/j.jmarsys.2013.06.004
Gargett, A., and Garner, T. (2008). Determining thorpe scales from ship-lowered CTD density profiles. J. Atmos. Oceanic Technol. 25, 1657–1670. doi: 10.1175/2008jtecho541.1
Garrett, C., and Munk, W. (1975). Space-time scales of internal waves: a progress report. J. Geophys. Res. 80, 291–297. doi: 10.1029/JC080i003p00291
Gregg, M. C., D’Asaro, E. A., Riley, J. J., and Kunze, E. (2018). Mixing efficiency in the ocean. Annu. Rev. Mar. Sci. 10, 443–473. doi: 10.1146/annurev-marine-121916-063643
Guthrie, J. D., Morison, J. H., and Fer, I. (2013). Revisiting internal waves and mixing in the Arctic Ocean. J. Geophys. Res. Oceans 118, 3966–3977. doi: 10.1002/jgrc.20294
Hales, B. (2005). Irreversible nitrate fluxes due to turbulent mixing in a coastal upwelling system. J. Geophys. Res. 110:C10S11. doi: 10.1029/2004JC002685
Hales, B., Hebert, D., and Marra, J. (2009). Turbulent supply of nutrients to phytoplankton at the New England shelf break front. J. Geophys. Res. 114:C05010. doi: 10.1029/2008JC005011
Hamilton, J. M., Lewis, M. R., and Ruddick, B. R. (1989). Vertical fluxes of nitrate associated with salt fingers in the world’s oceans. J. Geophys. Res. Oceans 94, 2137–2145. doi: 10.1029/JC094iC02p02137
Hattermann, T., Isachsen, P. E., von Appen, W.-J., Albretsen, J., and Sundfjord, A. (2016). Eddy-driven recirculation of atlantic water in fram strait. Geophys. Res. Lett. 43, 3406–3414. doi: 10.1002/2016gl068323
Holding, J. M., Markager, S., Juul-Pedersen, T., Paulsen, M. L., Møller, E. F., Meire, L., et al. (2019). Seasonal and spatial patterns of primary production in a high-latitude fjord affected by greenland ice sheet run-off. Biogeosciences 16, 3777–3792. doi: 10.5194/bg-16-3777-2019
Honjo, S., Krishfield, R. A., Eglinton, T. I., Manganini, S. J., Kemp, J. N., Doherty, K., et al. (2010). Biological pump processes in the cryopelagic and hemipelagic Arctic Ocean: Canada Basin and Chukchi Rise. Prog. Oceanogr. 85, 137–170. doi: 10.1016/j.pocean.2010.02.009
Hopwood, M. J., Carroll, D., Browning, T., Meire, L., Mortensen, J., Krisch, S., et al. (2018). Non-linear response of summertime marine productivity to increased meltwater discharge around Greenland. Nat. Commun. 9:3256. doi: 10.1038/s41467-018-05488-8
Hopwood, M. J., Carroll, D., Dunse, T., Hodson, A., Holding, J. M., Iriarte, J. L., et al. (2019). How does glacier discharge affect marine biogeochemistry and primary production in the Arctic? Cryosphere Discuss. 1–51.
Horne, E. P. W., Loder, J. W., Naime, C. E., and Oakey, N. S. (1996). Turbulence dissipation rates and nitrate supply in the upper water column on Georges Bank. Deep Sea Res. Part II: Top. Stud. Oceanogr. 43, 1683–1712. doi: 10.1016/S0967-0645(96)00037-9
Ivanov, V., Alexeev, V., Koldunov, N. V., Repina, I., Sandø, A. B., Smedsrud, L. H., et al. (2016). Arctic ocean heat impact on regional ice decay – A suggested positive feedback. J. Phys. Oceanogr. 46, 1437–1456. doi: 10.1175/jpo-d-15-0144.1
Jenkins, W. J. (1988). Nitrate flux into the euphotic zone near Bermuda. Nature 331, 521–523. doi: 10.1038/331521a0
Johnson, K. S., Riser, S. C., and Karl, D. M. (2010). Nitrate supply from deep to near-surface waters of the North Pacific subtropical gyre. Nature 465, 1062–1065. doi: 10.1038/nature09170
Kalvelage, T., Jensen, M. M., Contreras, S., Revsbech, N. P., Lam, P., Günter, M., et al. (2011). Oxygen sensitivity of anammox and coupled N-cycle processes in oxygen minimum zones. PLoS ONE 6:e29299. doi: 10.1371/journal.pone.0029299
Kaneko, H., Yasuda, I., Komatsu, K., and Itoh, S. (2013). Observations of vertical turbulent nitrate flux across the Kuroshio. Geophys. Res. Lett. 40, 3123–3127. doi: 10.1002/grl.50613
Karp-Boss, L., Boss, E. S., and Jumars, P. A. (1996). Nutrient fluxes to planktonic osmotrophs in the presence of fluid motion. Oceanogr. Mar. Biol. Annu. Rev. 34, 71–107.
Kiørboe, T. (2008). A Mechanistic Approach to Plankton Ecology. Princeton: Princeton University Press.
Kowalik, Z., and Proshutinsky, A. Y. (2013). “The arctic ocean tides,” in The Polar Oceans and Their Role in Shaping the Global Environment, eds O. M. Johannessen, R. D. Muench, and J. E. Overland, (Washington, D.C.: American Geophysical Union (AGU)), 137–158. doi: 10.1029/GM085p0137
Law, C. S. (2003). Vertical eddy diffusion and nutrient supply to the surface mixed layer of the Antarctic Circumpolar Current. J. Geophys. Res. 108:3272. doi: 10.1029/2002JC001604
Law, C. S., Martin, A. P., Liddicoat, M. I., Watson, A. J., Richards, K. J., and Woodward, E. M. S. (2001). A Lagrangian SF6 tracer study of an anticyclonic eddy in the North Atlantic: patch evolution, vertical mixing and nutrient supply to the mixed layer. Deep Sea Res. Part II Top. Stud. Oceanogr. 48, 705–724. doi: 10.1016/S0967-0645(00)00112-0
Lewis, M. R., Hebert, D., Harrison, W. G., Platt, T., and Oakey, N. S. (1986). Vertical nitrate fluxes in the oligotrophic ocean. Science 234, 870–873. doi: 10.1126/science.234.4778.870
Lincoln, B. J., Rippeth, T. P., Lenn, Y.-D., Timmermans, M. L., Williams, W. J., and Bacon, S. (2016). Wind-driven mixing at intermediate depths in an ice-free Arctic Ocean. Geophys. Res. Lett. 43, 9749–9756. doi: 10.1002/2016GL070454
Loeng, H. (1991). Features of the physical oceanographic conditions of the Barents Sea. Polar Res. 10, 5–18. doi: 10.1111/j.1751-8369.1991.tb00630.x
Lueck, R. G., Wolk, F., and Yamazaki, H. (2002). Oceanic velocity microstructure measurements in the 20th Century. J. Oceanogr. 58, 153–174. doi: 10.1023/A:1015837020019
Margalef, R. (1978). Life-forms of phytoplankton as survival alternatives in an unstable environment. Oceanol. Acta 1, 493–509.
Martin, A. P., Lucas, M. I., Painter, S. C., Pidcock, R., Prandke, H., Prandke, H., et al. (2010). The supply of nutrients due to vertical turbulent mixing: a study at the Porcupine Abyssal Plain study site in the northeast Atlantic. Deep Sea Res. Part II: Top. Stud. Oceanogr. 57, 1293–1302. doi: 10.1016/j.dsr2.2010.01.006
Martin, A. P., and Pondaven, P. (2003). On estimates for the vertical nitrate flux due to eddy pumping. J. Geophys. Res. Oceans 108:3359. doi: 10.1029/2003JC001841
Martin, A. P., and Richards, K. J. (2001). Mechanisms for vertical nutrient transport within a North Atlantic mesoscale eddy. Deep Sea Res. Part II: Top. Stud. Oceanogr. 48, 757–773. doi: 10.1016/S0967-0645(00)00096-5
Martin, T., Tsamados, M., Schroeder, D., and Feltham, D. L. (2016). The impact of variable sea ice roughness on changes in Arctic Ocean surface stress: a model study. J. Geophys. Res. Oceans 121, 1931–1952. doi: 10.1002/2015JC011186
McPhee, M. G., and Kantha, L. H. (1989). Generation of internal waves by sea ice. J. Geophys. Res. Oceans 94, 3287–3302. doi: 10.1029/JC094iC03p03287
McPhee, M. G., and Stanton, T. P. (1996). Turbulence in the statically unstable oceanic boundary layer under Arctic leads. J. Geophys. Res. Oceans 101, 6409–6428. doi: 10.1029/95JC03842
Meier, W. N., Hovelsrud, G. K., van Oort, B. E. H., Key, J. R., Kovacs, K. M., Michel, C., et al. (2014). Arctic sea ice in transformation: a review of recent observed changes and impacts on biology and human activity: arctic sea ice: review of recent changes. Rev. Geophys. 52, 185–217. doi: 10.1002/2013RG000431
Meire, L., Meire, P., Struyf, E., Krawczyk, D. W., Arendt, K. E., Yde, J. C., et al. (2016). High export of dissolved silica from the Greenland Ice Sheet: silica export the ice sheet. Geophys. Res. Lett. 43, 9173–9182. doi: 10.1002/2016GL070191
Meire, L., Mortensen, J., Meire, P., Juul-Pedersen, T., Sejr, M. K., Rysgaard, S., et al. (2017). Marine-terminating glaciers sustain high productivity in Greenland fjords. Glob. Change Biol. 23, 5344–5357. doi: 10.1111/gcb.13801
Moore, C. M., Mills, M. M., Arrigo, K. R., Berman-Frank, I., Bopp, L., Boyd, P. W., et al. (2013). Processes and patterns of oceanic nutrient limitation. Nat. Geosci. 6, 701–710. doi: 10.1038/ngeo1765
Moran, S. B., Weinstein, S. E., Edmonds, H. N., Smith, J. N., Kelly, R. P., Pilson, M. E. Q., et al. (2003). Does 234Th/238U disequilibrium provide an accurate record of the export flux of particulate organic carbon from the upper ocean? Limnol. Oceanogr. 48, 1018–1029. doi: 10.4319/lo.2003.48.3.1018
Moum, J. N., Gregg, M. C., Lien, R. C., and Carr, M. E. (1995). Comparison of turbulence kinetic energy dissipation rate estimates from two ocean microstructure profilers. J. Atmos. Oceanic Technol. 12, 346–366. doi: 10.1175/1520-0426(1995)012<0346:cotked>2.0.co;2
Nishino, S., Kawaguchi, Y., Fujiwara, A., Shiozaki, T., Aoyama, M., Harada, N., et al. (2018). Biogeochemical anatomy of a cyclonic warm-core eddy in the arctic ocean. Geophys. Res. Lett. 45, 11284–11292. doi: 10.1029/2018GL079659
Nishino, S., Kawaguchi, Y., Inoue, J., Hirawake, T., Fujiwara, A., Futsuki, R., et al. (2015). Nutrient supply and biological response to wind-induced mixing, inertial motion, internal waves, and currents in the northern Chukchi Sea. J. Geophys. Res. Oceans 120, 1975–1992. doi: 10.1002/2014jc010407
Nummelin, A., Ilicak, M., Li, C., and Smedsrud, L. H. (2015). Consequences of future increased Arctic runoff on Arctic Ocean stratification, circulation, and sea ice cover. J. Geophys. Res. Oceans 121, 617–637. doi: 10.1002/2015jc011156
Omand, M. M., Feddersen, F., Guza, R. T., and Franks, P. J. S. (2012). Episodic vertical nutrient fluxes and nearshore phytoplankton blooms in Southern California. Limnol. Oceanogr. 57, 1673–1688. doi: 10.4319/lo.2012.57.6.1673
Onarheim, I. H., Eldevik, T., Smedsrud, L. H., and Stroeve, J. C. (2018). Seasonal and regional manifestation of arctic sea ice loss. J. Clim. 31, 4917–4932. doi: 10.1175/JCLI-D-17-0427.1
Osborn, T. R. (1980). Estimates of the local rate of vertical diffusion from dissipation measurements. J. Phys. Oceanogr. 10, 83–89.
Padman, L. (1995). “Small-scale physical processes in the Arctic Ocean,” in Coastal and Estuarine Studies, eds W. O. Smith and J. M. Grebmeier, (Washington, D. C.: American Geophysical Union), 97–129. doi: 10.1029/CE049p0097
Paulsen, M. L., Nielsen, S. E. B., Müller, O., Møller, E. F., Stedmon, C. A., Juul-Pedersen, T., et al. (2017). Carbon Bioavailability in a High Arctic Fjord Influenced by Glacial Meltwater, NE Greenland. Front. Mar. Sci. 4:176. doi: 10.3389/fmars.2017.00176
Paulsen, M. L., Seuthe, L., Reigstad, M., Larsen, A., Cape, M. R., and Vernet, M. (2018). Asynchronous accumulation of organic carbon and nitrogen in the atlantic gateway to the arctic ocean. Front. Mar. Sci. 5:416. doi: 10.3389/fmars.2018.00416
Peralta-Ferriz, C., and Woodgate, R. A. (2015). Seasonal and interannual variability of pan-Arctic surface mixed layer properties from 1979 to 2012 from hydrographic data, and the dominance of stratification for multiyear mixed layer depth shoaling. Prog. Oceanogr. 134, 19–53. doi: 10.1016/j.pocean.2014.12.005
Planas, D., Agustí, S., Duarte, C. M., Granata, T. C., and Merino, M. (1999). Nitrate uptake and diffusive nitrate supply in the Central Atlantic. Limnol. Oceanogr. 44, 116–126. doi: 10.4319/lo.1999.44.1.0116
Polyakov, I. V., Pnyushkov, A. V., Alkire, M. B., Ashik, I. M., Baumann, T. M., Carmack, E. C., et al. (2017). Greater role for Atlantic inflows on sea-ice loss in the Eurasian Basin of the Arctic Ocean. Science 356, 285–291. doi: 10.1126/science.aai8204
Polzin, K. L., Naveira Garabato, A. C., Huussen, T. N., Sloyan, B. M., and Waterman, S. (2014). Finescale parameterizations of turbulent dissipation. J. Geophys. Res. Oceans 119, 1383–1419. doi: 10.1002/2013jc008979
Rainville, L., and Woodgate, R. A. (2009). Observations of internal wave generation in the seasonally ice-free Arctic. Geophys. Res. Lett. 36:L23604. doi: 10.1029/2009GL041291
Randelhoff, A. (2020). Software, data, and supplementary material for: pan-arctic ocean primary production constrained by turbulent nitrate fluxes. doi: 10.5281/zenodo.3712287
Randelhoff, A., Fer, I., and Sundfjord, A. (2017). Turbulent upper-ocean mixing affected by meltwater layers during arctic summer. J. Phys. Oceanogr. 47, 835–853. doi: 10.1175/JPO-D-16-0200.1
Randelhoff, A., Fer, I., Sundfjord, A., Tremblay, J.-E., and Reigstad, M. (2016). Vertical fluxes of nitrate in the seasonal nitracline of the Atlantic sector of the Arctic Ocean. J. Geophys. Res. Oceans 121, 5282–5295. doi: 10.1002/2016JC011779
Randelhoff, A., and Guthrie, J. D. (2016). Regional patterns in current and future export production in the central arctic ocean quantified from nitrate fluxes. Geophys. Res. Lett. 43, 8600–8608. doi: 10.1002/2016gl070252
Randelhoff, A., Reigstad, M., Chierici, M., Sundfjord, A., Ivanov, V., Cape, M., et al. (2018). Seasonality of the physical and biogeochemical hydrography in the inflow to the arctic ocean through fram strait. Front. Mar. Sci. 5:224. doi: 10.3389/fmars.2018.00224
Randelhoff, A., and Sundfjord, A. (2018). Short commentary on marine productivity at Arctic shelf breaks: Upwelling, advection and vertical mixing. Ocean Sci. 14, 293–300. doi: 10.5194/os-14-293-2018
Randelhoff, A., Sundfjord, A., and Reigstad, M. (2015). Seasonal variability and fluxes of nitrate in the surface waters over the Arctic shelf slope. Geophys. Res. Lett. 42, 3442–3449. doi: 10.1002/2015gl063655
Redfield, A. C., Ketchum, B. H., and Richards, F. A. (1963). “The influence of organisms on the composition of sea-water,” in The Sea, ed. M. N. Hill, (Cambridge, MA: Academic Press), 26–77.
Rees, A. P., Joint, I., Woodward, E. M. S., and Donald, K. M. (2001). Carbon, nitrogen and phosphorus budgets within a mesoscale eddy: comparison of mass balance with in vitro determinations. Deep Sea Res. Part II Top. Stud. Oceanogr. 48, 859–872. doi: 10.1016/S0967-0645(00)00101-6
Renaud, P. E., Sejr, M. K., Bluhm, B. A., Sirenko, B., and Ellingsen, I. H. (2015). The future of Arctic benthos: expansion, invasion, and biodiversity. Prog. Oceanogr. 139, 244–257. doi: 10.1016/j.pocean.2015.07.007
Rippeth, T. P., Lincoln, B. J., Lenn, Y.-D., Green, J. A. M., Sundfjord, A., and Bacon, S. (2015). Tide-mediated warming of Arctic halocline by Atlantic heat fluxes over rough topography. Nat. Geosci. 8, 191–194. doi: 10.1038/ngeo2350
Rippeth, T. P., Wiles, P., Palmer, M. R., Sharples, J., and Tweddle, J. (2009). The diapcynal nutrient flux and shear-induced diapcynal mixing in the seasonally stratified western Irish Sea. Cont. Shelf Res. 29, 1580–1587. doi: 10.1016/j.csr.2009.04.009
Risgaard-Petersen, N., Revsbech, N. P., and Rysgaard, S. (1995). Combined microdiffusion-hypobromite oxidation method for determining nitrogen-15 isotope in ammonium. Soil Sci. Soc. Am. J. 59, 1077–1080. doi: 10.2136/sssaj1995.03615995005900040018x
Rysgaard, S., Vang, T., Stjernholm, M., Rasmussen, B., Windelin, A., and Kiilsholm, S. (2003). Physical conditions, carbon transport, and climate change impacts in a northeast greenland fjord. Arctic Antarctic Alpine Res. 35, 301–312.
Sakshaug, E. (2004). “Primary and secondary production in the arctic seas,” in The Organic Carbon Cycle in the Arctic Ocean, eds R. Stein and R. W. Macdonald, (Berlin: Springer), 57–81. doi: 10.1007/978-3-642-18912-8_3
Schafstall, J., Dengler, M., Brandt, P., and Bange, H. (2010). Tidal-induced mixing and diapycnal nutrient fluxes in the Mauritanian upwelling region. J. Geophys. Res. 115:C10014. doi: 10.1029/2009JC005940
Scheifele, B., Waterman, S., Merckelbach, L., and Carpenter, J. R. (2018). Measuring the dissipation rate of turbulent kinetic energy in strongly stratified, low-energy environments: a case study from the arctic ocean. J. Geophys. Res. Oceans 123, 5459–5480. doi: 10.1029/2017JC013731
Sharples, J., Moore, C. M., and Abraham, E. R. (2001). Internal tide dissipation, mixing, and vertical nitrate flux at the shelf edge of NE New Zealand. J. Geophys. Res. Oceans 106, 14069–14081. doi: 10.1029/2000JC000604
Sharples, J., Tweddle, J. F., Green, J. A. M., Palmer, M. R., Kim, Y.-N., Hickman, A. E., et al. (2007). Spring-neap modulation of internal tide mixing and vertical nitrate fluxes at a shelf edge in summer. Limnol. Oceanogr. 52, 1735–1747. doi: 10.4319/lo.2007.52.5.1735
Shih, L. H., Koseff, J. R., Ivey, G. N., and Ferziger, J. H. (2005). Parameterization of turbulent fluxes and scales using homogeneous sheared stably stratified turbulence simulations. J. Fluid Mech. 525, 193–214. doi: 10.1017/S0022112004002587
Shiozaki, T., Furuya, K., Kodama, T., and Takeda, S. (2009). Contribution of N2 fixation to new production in the western North Pacific Ocean along 155E. Mar. Ecol. Prog. Ser. 377, 19–32. doi: 10.3354/meps07837
Shiozaki, T., Furuya, K., Kurotori, H., Kodama, T., Takeda, S., Endoh, T., et al. (2011). Imbalance between vertical nitrate flux and nitrate assimilation on a continental shelf: Implications of nitrification. J. Geophys. Res. Oceans 116:C10031. doi: 10.1029/2010JC006934
Spall, M. A., Pickart, R. S., Brugler, E. T., Moore, G. W. K., Thomas, L., and Arrigo, K. R. (2014). Role of shelfbreak upwelling in the formation of a massive under-ice bloom in the Chukchi Sea. Deep Sea Res. Part II: Top. Stud. Oceanogr. 105, 17–29. doi: 10.1016/j.dsr2.2014.03.017
Stevens, J.-L. R., Rudiger, P., and Bednar, J. A. (2015). “HoloViews: building complex visualizations easily for reproducible science,” in Proceedings of the 14th Python in Science Conference, Austin, TX.
Stroeve, J. C., Serreze, M. C., Holland, M. M., Kay, J. E., Malanik, J., and Barrett, A. P. (2012). The Arctic’s rapidly shrinking sea ice cover: a research synthesis. Clim. Change 110, 1005–1027. doi: 10.1007/s10584-011-0101-1
Sundfjord, A., Fer, I., Kasajima, Y., and Svendsen, H. (2007). Observations of turbulent mixing and hydrography in the marginal ice zone of the Barents Sea. J. Geophys. Res. Oceans 112:C05008. doi: 10.1029/2006JC003524
Sverdrup, H. (1953). On conditions for the vernal blooming of phytoplankton. ICES J. Mar. Sci. 18, 287–295. doi: 10.1093/icesjms/18.3.287
Tamelander, T., Reigstad, M., Olli, K., Slagstad, D., and Wassmann, P. (2013). New production regulates export stoichiometry in the ocean. PLoS ONE 8:e54027. doi: 10.1371/journal.pone.0054027
Tank, S. E., Manizza, M., Holmes, R. M., McClelland, J. W., and Peterson, B. J. (2012). The processing and impact of dissolved riverine nitrogen in the arctic ocean. Estuar. Coasts 35, 401–415. doi: 10.1007/s12237-011-9417-3
Torres-Valdés, S., Tsubouchi, T., Bacon, S., Naveira-Garabato, A. C., Sanders, R., McLaughlin, F. A., et al. (2013). Export of nutrients from the Arctic Ocean. J. Geophys. Res. Oceans 118, 1625–1644. doi: 10.1002/jgrc.20063
Tremblay, J.-E., Anderson, L. G., Matrai, P., Coupel, P., Belanger, S., Michel, C., et al. (2015). Global and regional drivers of nutrient supply, primary production and CO2 drawdown in the changing Arctic Ocean. Prog. Oceanogr. 139, 171–196. doi: 10.1016/j.pocean.2015.08.009
Tremblay, J.-E., Simpson, K. G., Martin, J., Miller, L., Gratton, Y., Barber, D., et al. (2008). Vertical stability and the annual dynamics of nutrients and chlorophyll fluorescence in the coastal, southeast Beaufort Sea. J. Geophys. Res. Oceans 113:C07S90. doi: 10.1029/2007JC004547
Vancoppenolle, M., Bopp, L., Madec, G., Dunne, J., Ilyina, T., Halloran, P. R., et al. (2013). Future arctic ocean primary productivity from CMIP5 simulations: uncertain outcome, but consistent mechanisms. Global Biogeochem. Cycles 27, 605–619. doi: 10.1002/gbc.20055
Watanabe, E., Onodera, J., Harada, N., Honda, M. C., Kimoto, K., Kikuchi, T., et al. (2014). Enhanced role of eddies in the Arctic marine biological pump. Nat. Commun. 5:3950. doi: 10.1038/ncomms4950
Wiedmann, I. (2015). Potential Drivers of the Downward Carbon and Particle Flux in Arctic Marine Ecosystems Under Contrasting Hydrographical and Ecological Situations. Available online at: https://hdl.handle.net/10037/8293 (accessed August 19, 2019).
Wiedmann, I., Tremblay, J. -É, Sundfjord, A., and Reigstad, M. (2017). Upward nitrate flux and downward particulate organic carbon flux under contrasting situations of stratification and turbulent mixing in an Arctic shelf sea. Elem. Sci. Anth. 5:43. doi: 10.1525/elementa.235
Wiles, P. J., Rippeth, T. P., Simpson, J. H., and Hendricks, P. J. (2006). A novel technique for measuring the rate of turbulent dissipation in the marine environment. Geophys. Res. Lett. 33:L21608. doi: 10.1029/2006GL027050
Keywords: Arctic, turbulence, nitrate, flux, primary production, climate change, sea ice
Citation: Randelhoff A, Holding J, Janout M, Sejr MK, Babin M, Tremblay J-É and Alkire MB (2020) Pan-Arctic Ocean Primary Production Constrained by Turbulent Nitrate Fluxes. Front. Mar. Sci. 7:150. doi: 10.3389/fmars.2020.00150
Received: 02 December 2019; Accepted: 26 February 2020;
Published: 31 March 2020.
Edited by:
Peng Jin, Guangzhou University, ChinaReviewed by:
Laura Castro De La Guardia, University of Manitoba, CanadaHilde Oliver, Woods Hole Oceanographic Institution, United States
Copyright © 2020 Randelhoff, Holding, Janout, Sejr, Babin, Tremblay and Alkire. This is an open-access article distributed under the terms of the Creative Commons Attribution License (CC BY). The use, distribution or reproduction in other forums is permitted, provided the original author(s) and the copyright owner(s) are credited and that the original publication in this journal is cited, in accordance with accepted academic practice. No use, distribution or reproduction is permitted which does not comply with these terms.
*Correspondence: Achim Randelhoff, YWNoaW0ucmFuZGVsaG9mZkB0YWt1dmlrLnVsYXZhbC5jYQ==
†Present address: Matthew B. Alkire, School of Oceanography, University of Washington, Seattle, WA, United States