 Krista D. Sherman1,2,3,4*
 Josephine R. Paris1
 Robert Andrew King1
 Karen A. Moore1Craig P. Dahlgren3,4Lindy C. Knowles3
 Kristine Stump2,5Charles R. Tyler1
 Jamie R. Stevens1
- 1Biosciences, University of Exeter, Exeter, United Kingdom
- 2Daniel P. Haerther Center for Conservation and Research, John G. Shedd Aquarium, Chicago, IL, United States
- 3Science and Policy, Bahamas National Trust, Nassau, Bahamas
- 4Perry Institute for Marine Science, Waitsfield, VT, United States
- 5Field Lab Consulting, LLC, Palmetto, FL, United States
Nassau grouper (Epinephelus striatus, Bloch 1792) are globally critically endangered and an important fishery species in The Commonwealth of The Bahamas (hereafter The Bahamas) and parts of the Caribbean, with an urgent need for better management and conservation. Here, we adopted a combined approach, integrating restriction-site-associated DNA sequencing (RAD-seq) and acoustic telemetry to establish country-wide demographic structure, diversity and connectivity, and the origins of Nassau grouper using an active fish spawning aggregation (FSA) in the central Bahamas. RAD-seq analysis of 94 Nassau grouper sampled from nine locations in The Bahamas generated a working dataset of 13,241 single nucleotide polymorphisms (SNPs). Similar levels of genetic diversity were found among sampled locations. Evidence of population sub-structuring across The Bahamas was demonstrated and supported by discriminate analysis of principal components (DAPCs) along with analyses of molecular variance (AMOVAs). Associated acoustic telemetry data indicated Nassau grouper tagged at an active FSA in the central Bahamas during the 2016–2017 spawning season migrated to the Exumas at the conclusion of the spawning period. Telemetry data suggest the likely origins of five individuals, which traveled one-way distances of up to 176 km from the FSA in the central Bahamas to two sites within a no-take marine protected area (MPA). Analyses of high-resolution SNP markers (including candidate loci under selection) illustrated patterns of spatial structure and genetic connectivity not reflected by telemetry data alone. Nassau grouper from Exuma and Long Island appear to have genetic signatures that differ from other islands and from the Hail Mary FSA. Collectively, these findings provide novel information on the intraspecific population dynamics of Nassau grouper within The Bahamian archipelago and within an active FSA.
Introduction
Approximately 25,000 of the species assessed worldwide have been classified as threatened and are at risk of extinction (IUCN, 2017), including 12% of grouper (Epinephelidae) species (Sadovy de Mitcheson et al., 2013). Changing this trajectory will require coordinated research and management approaches to develop a more robust understanding of population demographics and ecology at both small and large spatial scales. Current approaches to assess and manage fish species include analyses of fisheries dependent and independent data for stock assessments (Thurstan et al., 2015; Egerton et al., 2017; Pauly and Zeller, 2017), examination of habitat use and migratory behavior (Austin, 2007; Pittman et al., 2014; Aswani et al., 2015), and modeling predicted responses to climate change (Cheung et al., 2012; Crozier and Hutchings, 2014; Sunday et al., 2014). Designating and monitoring marine protected areas (MPAs) or reserves (Hughes et al., 2007; Mumby and Harborne, 2010; White, 2015), establishing stock enhancement programmes (Griffiths et al., 2011; Lorenzen et al., 2013; Abelson et al., 2016), recommending sustainable harvest regulations (Dann et al., 2013; Bozec et al., 2016; Hazen et al., 2016), and evaluating and incorporating the role of adaptation in survival and reproductive fitness (Eizaguirre and Baltazar-Soares, 2014; Delmore et al., 2015; Calosi et al., 2016) are other examples of valuable approaches for species management.
Nassau grouper (Epinephelus striatus, Bloch, 1792), exemplify a species requiring immediate management due to their IUCN critically endangered status, and economic, cultural, and ecological significance (Sadovy de Mitcheson and Colin, 2012; Carpenter et al., 2015; Sherman et al., 2016, 2018a). Nassau grouper are inherently vulnerable to population declines because of their reproductive and life history traits (Coleman et al., 2000; Dahlgren and Eggelston, 2001; Domeier, 2012). More specifically, the predictable occurrence of lunar-associated migrations to known fish spawning aggregations (FSAs) for annual reproduction with conspecifics increases their susceptibility to overexploitation (Domeier, 2012; Sadovy de Mitcheson and Erisman, 2012; Cheung et al., 2013). As a result, many historic Nassau grouper FSAs have disappeared and others have declined by orders of magnitude in the last few decades (Olsen and LaPlace, 1979; Sadovy de Mitcheson et al., 2013).
Investigations of Nassau grouper FSAs have described the dynamic nature of these migrations – particularly, intraspecific differences in the timing of migrations (in relation to the winter solstice) and distances traveled to and from FSAs (Smith, 1972; Colin, 1992; Bolden, 2000; Starr et al., 2007; Dahlgren C. P. et al., 2016). Additionally, acoustic telemetry studies suggest that adults exhibit site fidelity to specific FSAs (Heppell et al., 2009; Kadison et al., 2010; Dahlgren C. P. et al., 2016) and tend to home to their respective reefs (Bolden, 2000; Dahlgren C. P. et al., 2016). However, FSAs are comprised of hundreds to thousands of individuals that migrate from multiple locations (Domeier, 2012), and larvae are dispersed with ocean currents, which can facilitate genetic mixing of different stocks during the spawning season (Colin, 1992, 2012; Molloy et al., 2012). Indeed, previous research has demonstrated how variability in migratory behavior can influence genetic connectivity (Dann et al., 2013; Delmore et al., 2015; Moore et al., 2017). The Bahamian archipelago represents an important area for Nassau grouper (Dahlgren C. et al., 2016; Sherman et al., 2016), yet data on the current status of Nassau grouper, its spawning stocks, patterns of gene flow, population structure and the origins of migrating adults within the country are limited (Dahlgren C. P. et al., 2016; Sherman et al., 2016, 2017; Stump et al., 2017). Such information is critical in order to effectively manage this critically endangered species.
In recent decades, conservation biology has increasingly incorporated genetic tools to assist with fisheries management (Reiss et al., 2009; Flanagan et al., 2017; Paris et al., 2018). Several reviews have highlighted the advantages and limitations of molecular approaches for both marine and freshwater species (e.g., Selkoe et al., 2016; Bernatchez et al., 2017; Lowe et al., 2017). In particular, highly connected marine species, characterized by weak genetic subdivision and large effective population sizes (Ne), pose difficulties for population assignment and ascribing management units (MUs) (Allendorf et al., 2010), in comparison to freshwater species (e.g., Vidal and García-Marín, 2011; Whiteley et al., 2011). For Nassau grouper, most assessments of genetic differentiation have been based on relatively small numbers of nuclear markers, i.e., mtDNA or microsatellites (Jackson et al., 2014; Bernard et al., 2016; Sherman et al., 2017), which may provide insufficient resolution to delineate fine-scale population structure.
Restriction-site-associated DNA sequencing (RAD-seq) can be used to identify and genotype large numbers of single nucleotide polymorphisms (SNPs). Increased coverage throughout the genome using thousands of SNP markers have substantially improved the capacity to unravel genetic diversity and divergence in species with both strong (Perrier et al., 2013) and weak (Larson et al., 2014; Benestan et al., 2015) population structure. While SNPs have been identified and utilized in Caribbean-wide assessments of genetic subdivision for Nassau grouper (Jackson et al., 2014), such an approach has not been used to explore fine-scale patterns of genetic variation in The Bahamas. Recent research based on microsatellite data showed no geographic population structure, suggesting that contemporary genetic connectivity may be higher than previously thought (Sherman et al., 2017). Better characterization of the spatiotemporal population dynamics of Nassau grouper through genome-wide assessments of genetic diversity and in situ investigations of FSAs and spawning migration patterns are critical to develop effective conservation management strategies (e.g., optimizing MPA networks). Emerging research has begun to integrate genetics and telemetry data, providing complimentary approaches to understand migration, spawning behavior and to elucidate patterns of connectivity for aquatic species [e.g., Arctic ringed seals (Pusa hispida, Schreber, 1775) (Martinez-Bakker et al., 2013); lake sturgeon (Acipenser fulvescens) Rafinesque, 1817 (Donofrio et al., 2018); Arctic char (Salvelinus alpinus) Linnaeus, 1758 (Moore et al., 2017)].
In this study, we used both RAD-seq and acoustic telemetry data to provide a more detailed insight into the spatial population dynamics and intraspecific genetic population structure of Nassau grouper in The Bahamas. The specific objectives were to (1) use SNPs to investigate fine-scale genetic variation throughout The Bahamas, (2) combine population genomics and acoustic telemetry to determine the origins of Nassau grouper migrating to Hail Mary, an active FSA in the central Bahamas and (3) investigate the role of selection on the genetic population structure of Nassau grouper across The Bahamas. These data are required to assess spatial and temporal changes in the health of Nassau grouper, inform national fisheries management strategies and direct future research and monitoring (Sherman et al., 2018a).
Materials and Methods
Sampling, DNA Extraction, and Quantification for RAD-Seq
Nassau grouper fin clips (n = 96) were collected according to methods described by Sherman et al. (2017). Samples originated from eight islands (Abaco, Andros, Eleuthera, Exuma, Great Inagua, Long Island, New Providence, and Ragged Island) and the Hail Mary FSA in The Bahamas (Figure 1). Fin clips were preserved in 95–100% ethanol prior to genomic DNA extraction. Genomic DNA was isolated using the Qiagen DNeasy Blood and Tissue Kit® according to the manufacturer’s instructions. DNA was quality assessed via agarose gel electrophoresis and quantified using the dsDNA BR Qubit Quant-iT assay (Invitrogen).
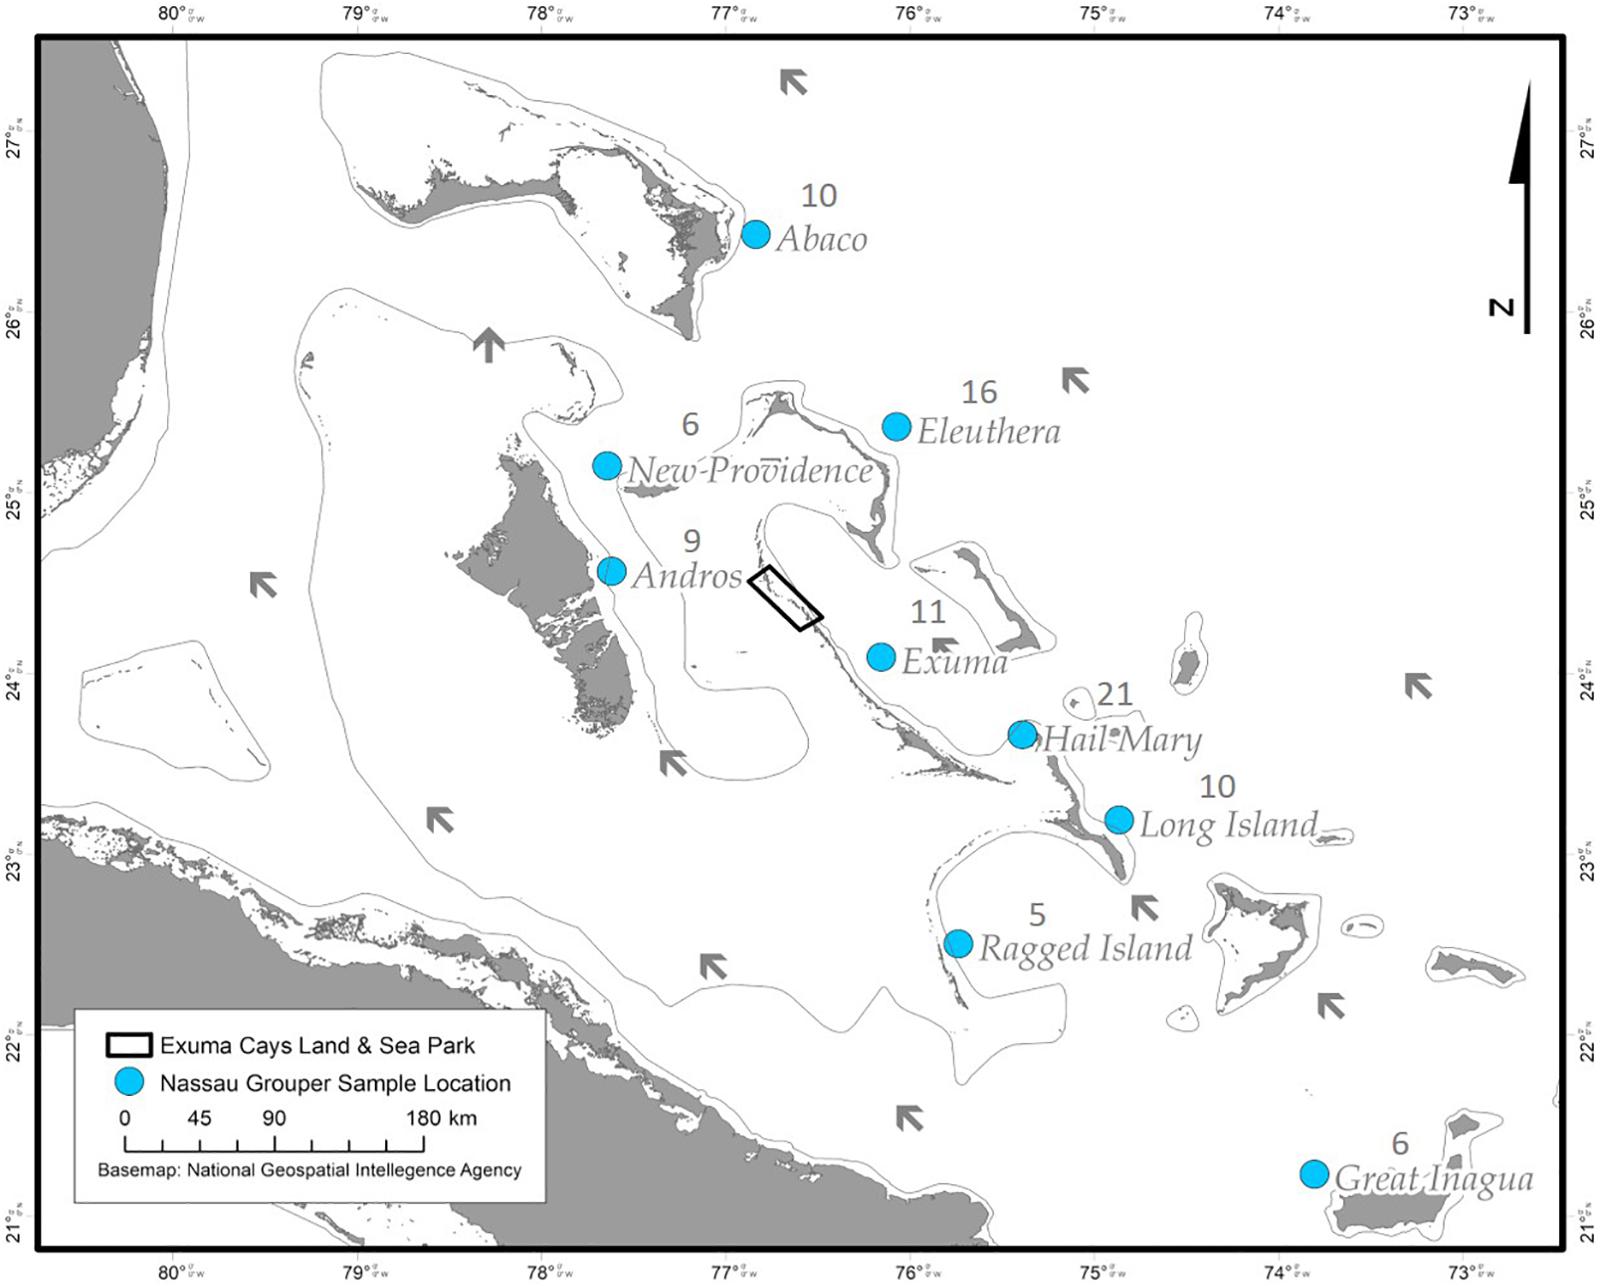
Figure 1. Sampling locations of Nassau grouper (blue circles) and prevailing currents (black arrows) showing the extent of the Exuma Cays Land and Sea Park (rectangle).
RAD Library Development and Sequencing
Libraries were prepared using a modification of the original single-digest RAD protocol (Baird et al., 2008). RAD-seq libraries were prepared by the Exeter Sequencing Service (University of Exeter, United Kingdom) using the SbfI (New England Biolabs) enzyme. Libraries were sequenced on two lanes (48 individuals per lane) of Illumina HiSeq 2500 using single-end sequencing. Additional details on library preparation and sequencing methodology can be found in Supplementary Material 1.
SNP Discovery and Genotyping
FastQC was used to inspect the quality of raw sequence reads (Andrews, 2010). Stacks v. 1.42 (Catchen et al., 2011, 2013) was used for RAD-seq data processing, SNP discovery and standard population genetic statistics. Raw sequence data were de-multiplexed and cleaned (e.g., quality ≤ 10) and truncated to 96 bp using process_radtags. Following recommendations by Paris et al. (2017), de novo assembly parameters were optimized (m: 3–7, M: 1–7, and n: 2–4; see Supplementary Figure 1).
The denovo_map pipeline was run using optimal parameters of m5, M3, and n3. Two samples – one from Andros (AN026) and one from Hail Mary (LI239) – were removed from subsequent analyses due to low coverage (Supplementary Tables 1, 2). The program, cstacks was used to rebuild a catalog of loci using individuals with coverage depths of ≥ 15x (n = 59) to reduce the likelihood of genotyping recurrent sequencing error. Loci from all individuals were then matched back to this catalog using sstacks to generate genotypes for each individual. populations was used to filter loci (p = 5, r = 0.8, min-maf = 0.1, max_obs_het = 0.7), resulting in a final dataset consisting of 10,031 polymorphic loci (and ∼13 k SNPs), which was exported as GENEPOP (Raymond and Rousset, 1995) and vcf (Danecek et al., 2011) file formats. Further data conversion was implemented using PGD Spider v. 2.0.1.0 (Liscjher and Excoffier, 2012).
Loci were assessed for conformity to Hardy-Weinberg equilibrium (HWE) using GENEPOP v.4.2 (Rousset, 2008), and multiple sample testing was corrected using the false discovery rate (FDR) (Storey and Tibshirani, 2003). To address linkage disequilibrium (LD) between SNPs and to account for potential ascertainment bias only a single random SNP was selected from each RAD-tag (–write_single_snp in populations).
Population Diversity, Differentiation, and Structure
Standard diversity measures, including allele frequencies, expected and observed heterozygosity (HE and HO), the inbreeding F-statistic (FIS), numbers of polymorphic loci, and global and pairwise values of FST (Weir and Cockerham, 1984) were computed in GenoDive v. 2.0b27 (Meirmans and Van Tienderen, 2004).
For analyses sensitive to outlier loci, a neutral dataset containing one random SNP from each locus was used (10,031 loci; see section Results). Assessments of genetic population structure were performed with a discriminate analysis of principal components (DAPCs) using the adegenet package in R v. 1.0.143 (Jombart, 2008; Jombart et al., 2010). The number of principal components employed to create each DAPC was based on inspections of the optimal α-score and cross-validation outputs (Jombart et al., 2010). To avoid over-fitting the data, the number of principal components retained for analysis was based on the lower of the two outputs. DAPCs were constructed using the optimal α-score value (40 PCs) and three discriminant functions.
Results of the sub-structure suggested by DAPC analysis was used to develop and test hypotheses for analyses of molecular variance (AMOVAs). The infinite alleles model (IAM) in GenoDive was selected to perform three AMOVAs based on 10,000 iterations of the neutral SNP dataset to test whether genetic variation was greater between (1) The Bahamas and Exuma, (2) The Bahamas and Long Island, or (3) The Bahamas versus Exuma and Long Island.
Identifying Loci Under Selection
Because FST values were low and non-significant (see section Results), two environmental association tests: latent factor mixed models (LFMMs, Frichot and François, 2015) and redundancy analysis (RDA, Forester et al., 2018) were employed to screen for potentially adaptive loci. We obtained environmental data for eight sample sites (excluding the Hail Mary spawning aggregation) from the Bio-ORACLE database (Tyberghein et al., 2012). Data for each site [salinity (SAL), minimum and maximum sea surface temperature (SSTmin and SSTmax), current (CURRmin and CURRmax) and primary productivity (PPmin and PPmax)] were extracted using the R package sdmpredictors (Bosch et al., 2018). Environmental variables were selected based on their significance to the timing of spawning migrations, spawning, larval distribution and survival for this species (Colin, 1992, 2012; Eggleston, 1995). Pearson’s r correlations were used to check for relationships between the measured environmental variables.
LFMM v 1.5 was used to detect correlations between genotypes and environmental variables (Frichot et al., 2013). LFMM analysis was run for 10,000 iterations and a burn-in of 5,000 reps, as suggested by Frichot et al. (2013). The number of latent factors was set at K = 3, as suggested by estimating the minimal cross-entropy criterion of the snmf function (iterating through K1 to K20) in the LEA package in R, and also based on the results of the DAPC analysis (see section Results). Prior to analyses, missing data were imputed using K = 3 based on 10 repetitions of the dataset. The Gibbs sampler was run five independent times on the dataset to estimate the appropriate average LFMM parameters (z-score values). p-values were adjusted using an estimation of the genomic inflation factor (λ) and a FDR of 0.05 to test for significance.
RDA, conditioned on site latitude, was performed using vegan (Oksanen et al., 2019) to identify candidate SNP loci associated with environmental variables. Significance of the full model and of each constrained axis was tested using an analysis of variance (ANOVA) and a marginal ANOVA, respectively with 999 permutations of the data. We used a ± 3 standard deviation cut-off from the mean SNP loading for each axis, as suggested by Forester et al. (2018) to optimize the number of correct positive detections while reducing false positives and identify SNPs significantly associated with environmental variables.
Finally, in order to investigate the functional attributes of identified outlier loci from LFMM and RDA, homology to the genome of the red spotted grouper (Epinephelus akaara, Temminck and Schlegel, 1842) (Ge et al., 2019) was assessed. RAD tags were aligned to the genome using minimap2 (Li, 2018), first directly to the gene.cds.fasta for direct hits to coding sequence (CDS). Remaining RAD tags were aligned to the genome.fasta and the annotation gff was used to guide hits to the nearest CDS. Resultant alignments for LFMM and RDA hits can be found in Supplementary Tables 4, 5.
Tagging and Telemetry of Nassau Grouper
During December 2014 – December 2016, Nassau grouper collected around the Exumas, Long Island and the Hail Mary FSA, were externally tagged (n = 103) using color-coded FloyTM tags and fish of an appropriate size, i.e., ≥ 54 cm total length, TL (n = 45) were also surgically implanted with VemcoTM V13 or V13P (13 mm × 36 mm, 6.5 g in water; Vemco, Ltd., Nova Scotia, Canada) acoustic transmitters and released as per procedures outlined by Stump et al. (2017). Specifically, 43 fish were acoustically tagged at the Hail Mary FSA, one fish was tagged in the Exuma Cays Land and Sea Park (ECLSP) and one individual in Long Island (Table 4 and Supplementary Table 6). Genetic analysis was also performed on a subset of acoustically tagged Nassau grouper (Tables 1, 4 and Supplementary Table 6). Eleven acoustic receivers (VR2Ws) stationed in the Exumas (n = 3), Long Island (n = 3), and at the Hail Mary FSA (n = 5) were used to record data on Nassau grouper migrations to and from the Hail Mary FSA over consecutive spawning seasons between December 2014 and January 2017 (Figures 1, 2).
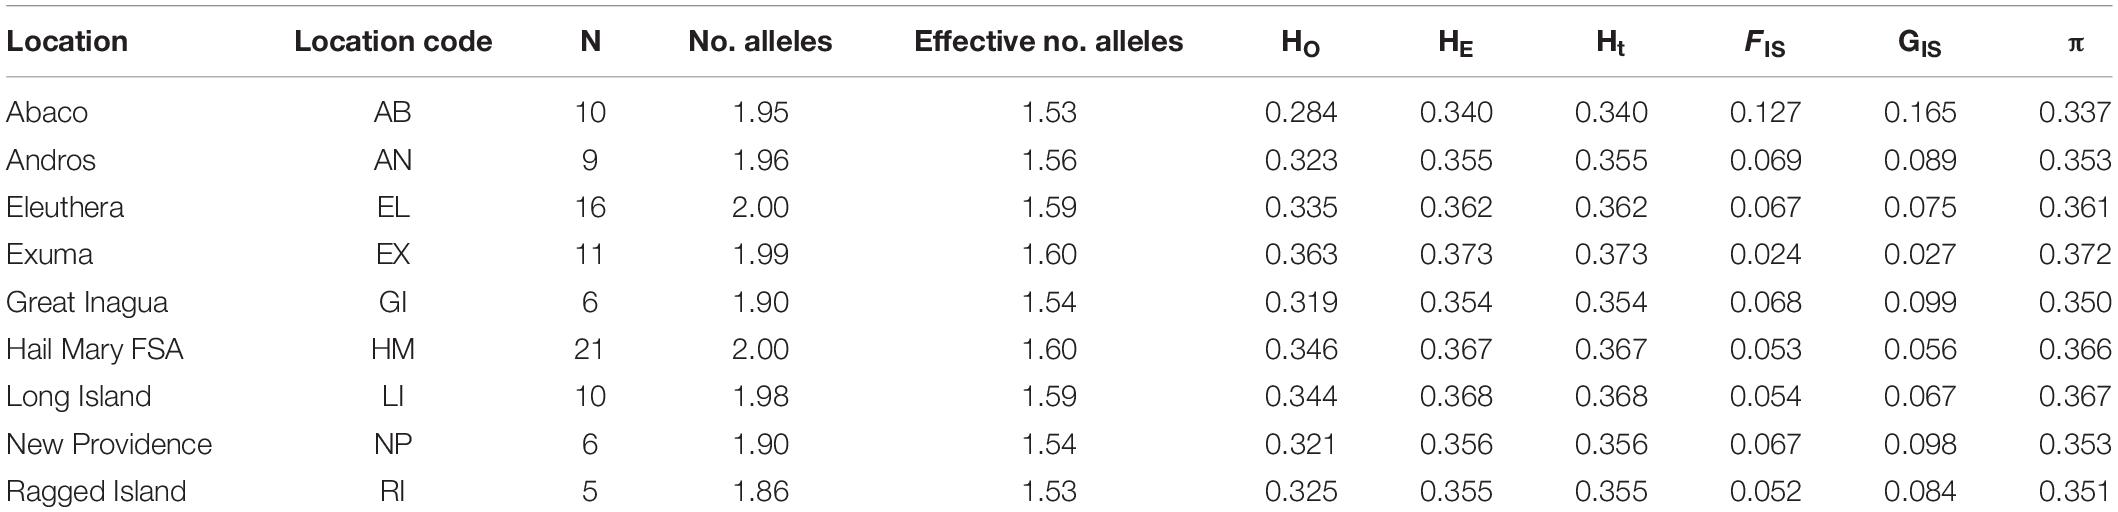
Table 1. Summary indices of genetic diversity per location based on 10,031 loci.
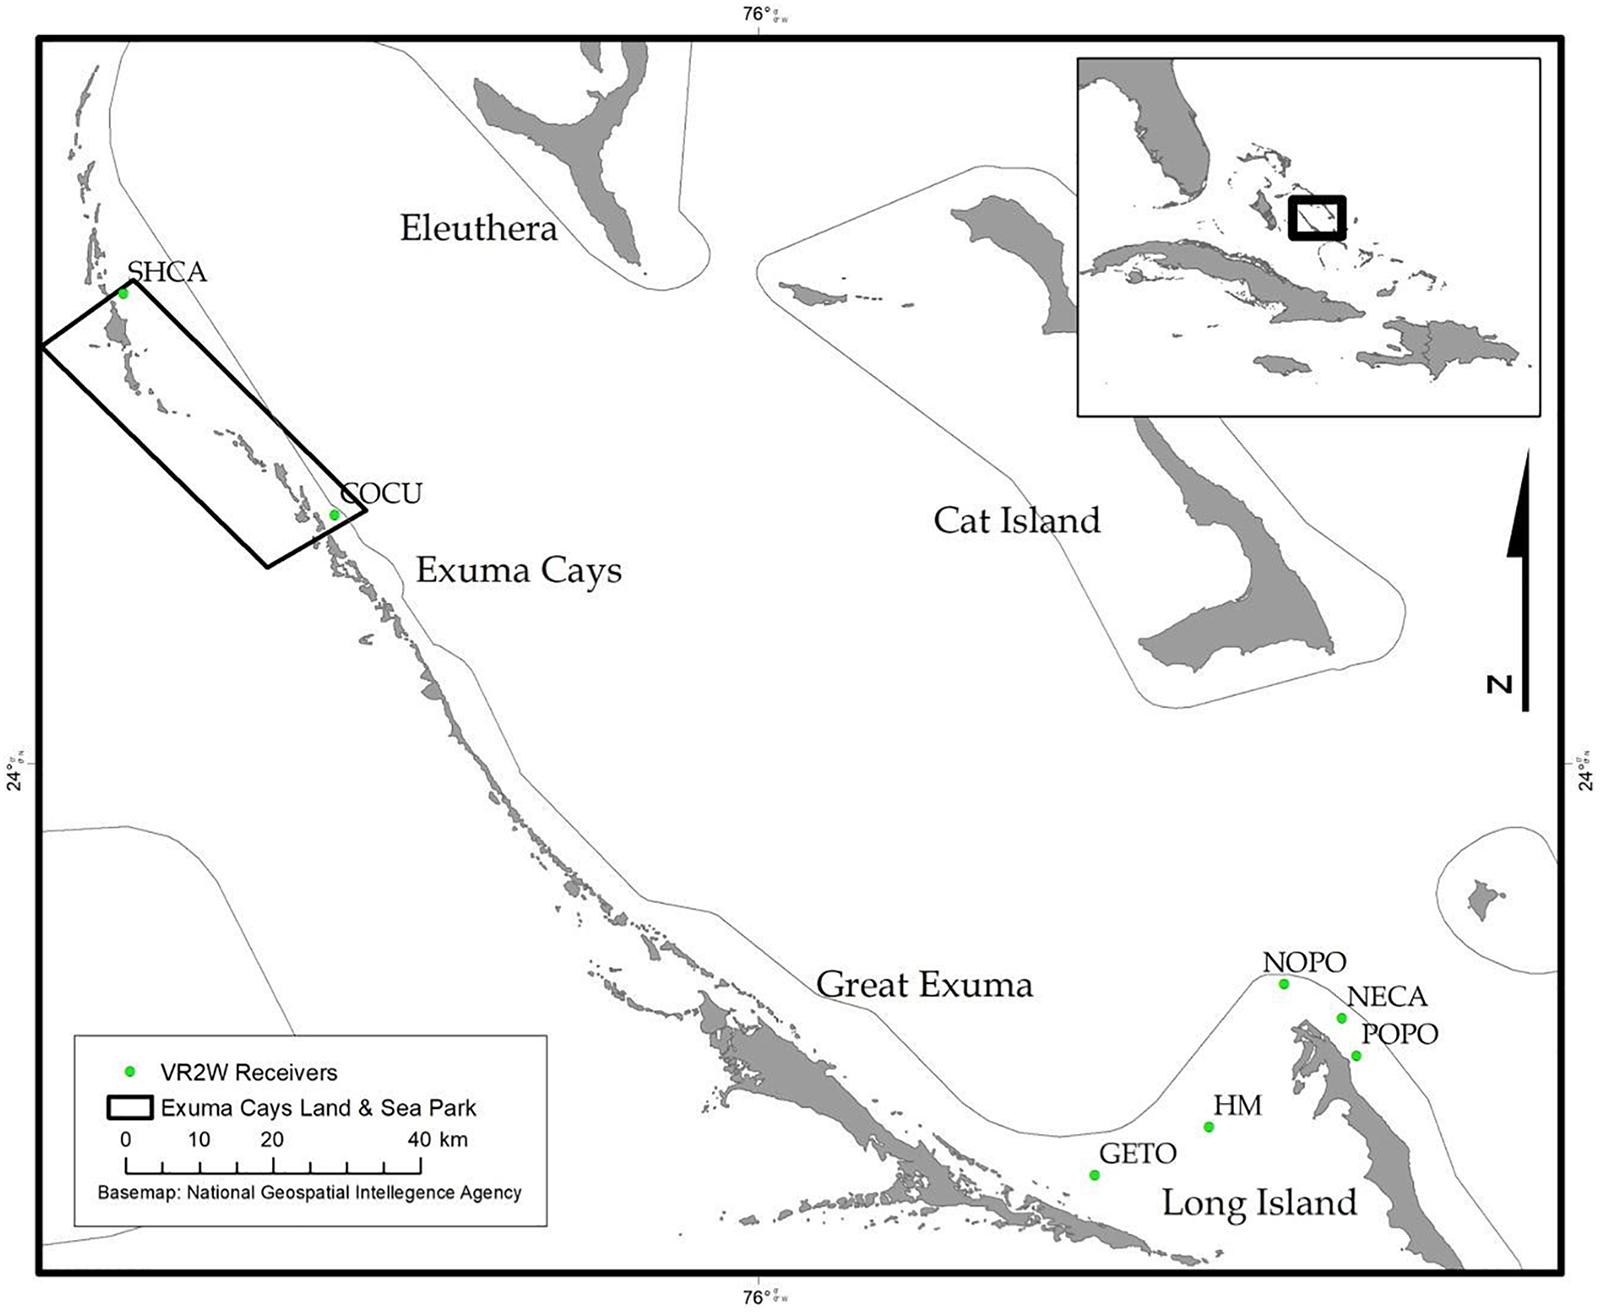
Figure 2. Map of acoustic receivers (VR2Ws) [denoted by green circles] deployed around the Exumas and Long Island, Bahamas. Receiver codes correspond to: SCHA, Shroud Cay; COCU, Conch Cut; GETO, Georgetown; HM, Hail Mary; NOPO, North Point; NECA, Newton’s Cay; POPO, Poseidon’s Point. SHCA and COCU are located within the boundaries no-take Exuma Cays Land and Sea Park (rectangular shape outlined in black). The inset map shows the Exuma Sound study area (black box) in relation to the rest of The Bahamas, Florida and the Caribbean.
Results
SNP Discovery and Genotyping
Sequencing of 96 Nassau grouper samples produced a total of 159,195,960 raw RAD-tags with an average of 1,658,291 (± 671,515 SD) RAD-tags across all samples (Supplementary Table 1). The number of RAD-tags generated for individual Nassau grouper ranged from 272,483 (LI239) to 3,653,394 (LI227). Following filtering and quality control, 114,174,309 RAD-tags (∼72%) were retained, with a mean of 1,189,316 (± 478,376 SD) RAD-tags across samples (Supplementary Table 1). After parameter optimization, a total of 5,139,297 assembled loci (min = 20,298; max = 63,594), 610,951 polymorphic loci (min = 1,382; max = 8,687), 869,675 polymorphic SNPs (min = 2,489; max = 12,139), and 78,615 fixed SNPs (min = 19; max = 8,216) were obtained (Supplementary Table 2). Average numbers of assembled loci, polymorphic loci, SNPs and fixed SNPs were 54,673 (± 8,317 SD), 6,499 (± 1,695 SD), 9,252 (± 2,173 SD), and 836 (± 1,253 SD) respectively (Supplementary Table 2). Approximately 35% of loci were polymorphic and contained an average of 1.3 SNPs per locus. After filtering in populations, the final dataset contained 28,636 assembled loci, of which 10,031 were polymorphic, containing a total of 13,241 SNPs.
Genetic Diversity, Differentiation, and Structure
A total of 262 loci deviated from HWE after FDR correction (p < 0.05). Measures of genetic diversity and allele polymorphism were generally consistent across sample locations (Table 1). Mean genome-wide diversity across all locations was HE = 0.3627 (range 0.340–0.373; Table 1) and HO = 0.332. HO was lowest in Abaco (0.284) and highest in Exuma (0.363; Table 1). Inbreeding coefficients were highest in Abaco (FIS = 0.127, GIS = 0.165) and lowest in Exuma (FIS = 0.024, GIS 0.027; Table 1).
Global FST was low and non-significant (Global FST = 0.0003; p = 0.325). Genetic differentiation based on pairwise FST values ranged from -0.003 to 0.003 and was greatest between Exuma and Great Inagua (0.003), and Hail Mary and Ragged Island (0.003). Pairwise FST values were significant (p < 0.05) between only three population pairs (Supplementary Table 3).
DAPC analysis revealed three genetic clusters of Bahamian Nassau grouper (Figure 3). The analysis separated fish from Long Island and Exuma from the other locations (Figure 3). Based on the AMOVA results, most genetic variability (∼97%) occurs within individuals (Table 2). However, of the three AMOVA models, the third model, which separated Exuma and Long Island versus the rest of The Bahamas, explained most of the genetic variance (p = 0.055), compared with the other two models comparing the rest of The Bahamas and Exuma (p = 0.111) or the rest of The Bahamas and Long Island (p = 0.334; Table 2).
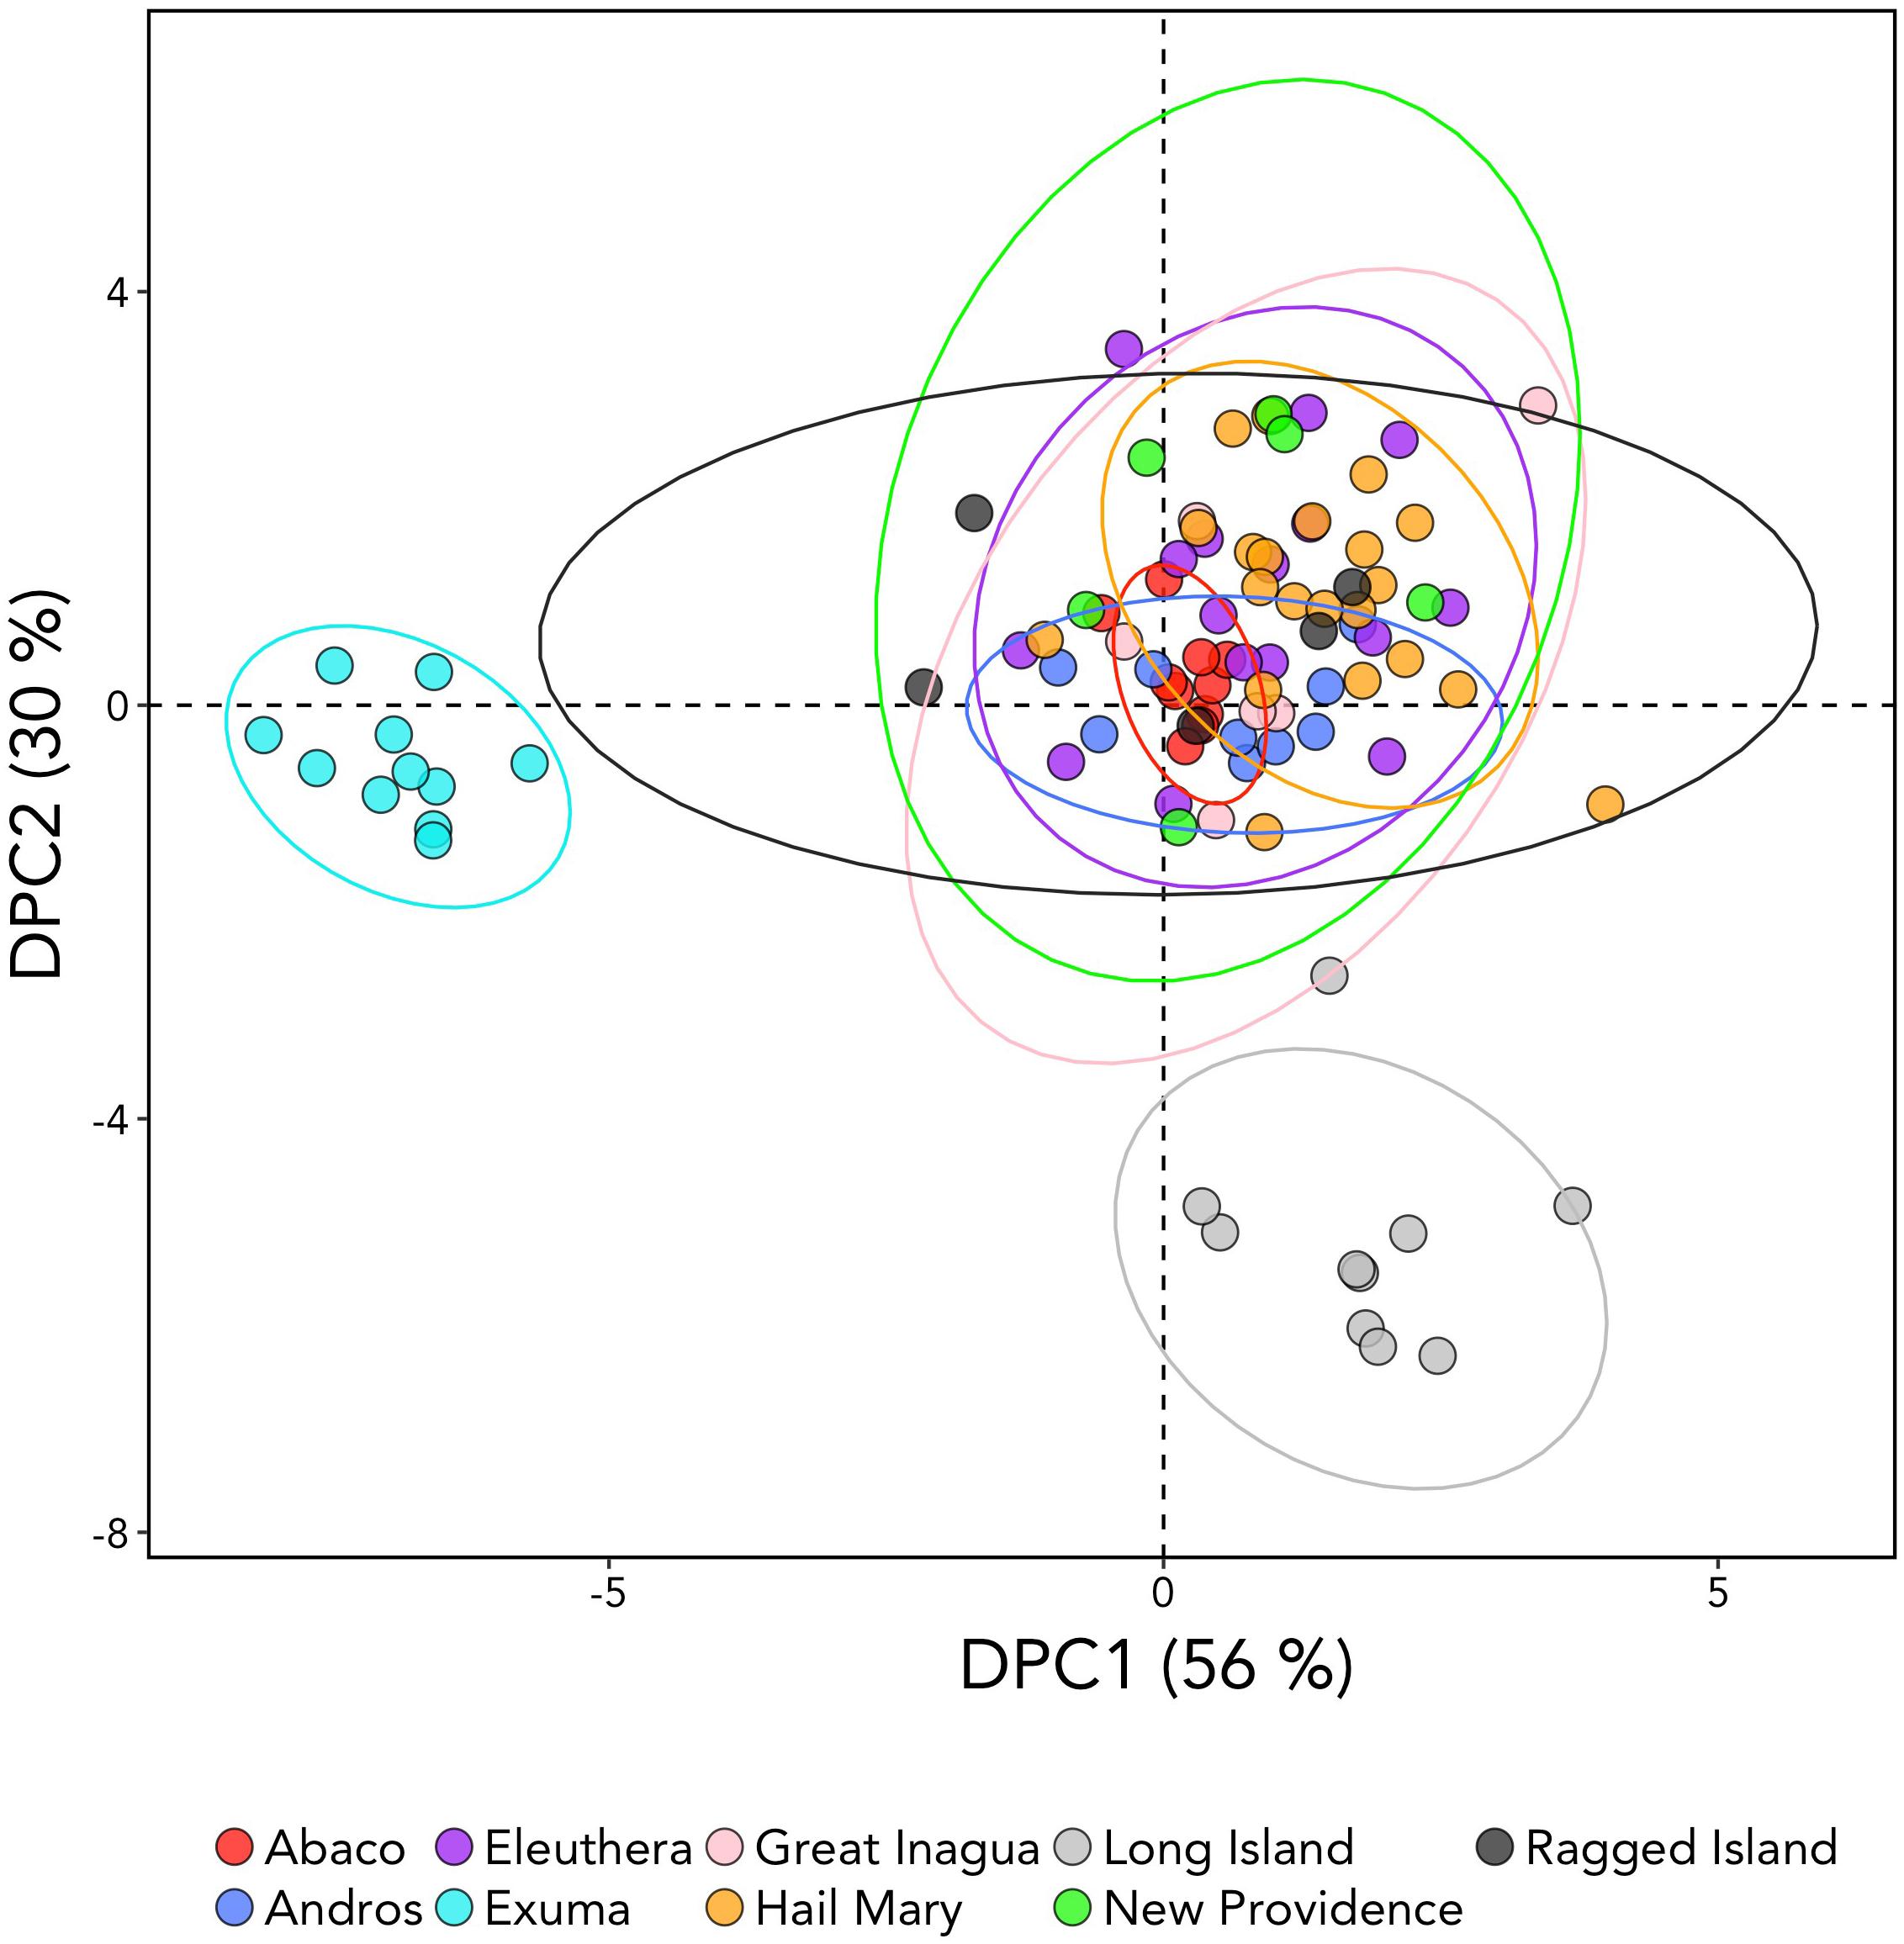
Figure 3. Discriminate analysis of principal components (DAPC) analysis of Nassau grouper based on 10,031 SNP loci illustrating separations of Exuma and Long Island from other sampled locations within The Bahamas. The DAPC was constructed using 40 principal components (PCs) and 3 discriminate functions. The percent variation explained by each axis appears in brackets.
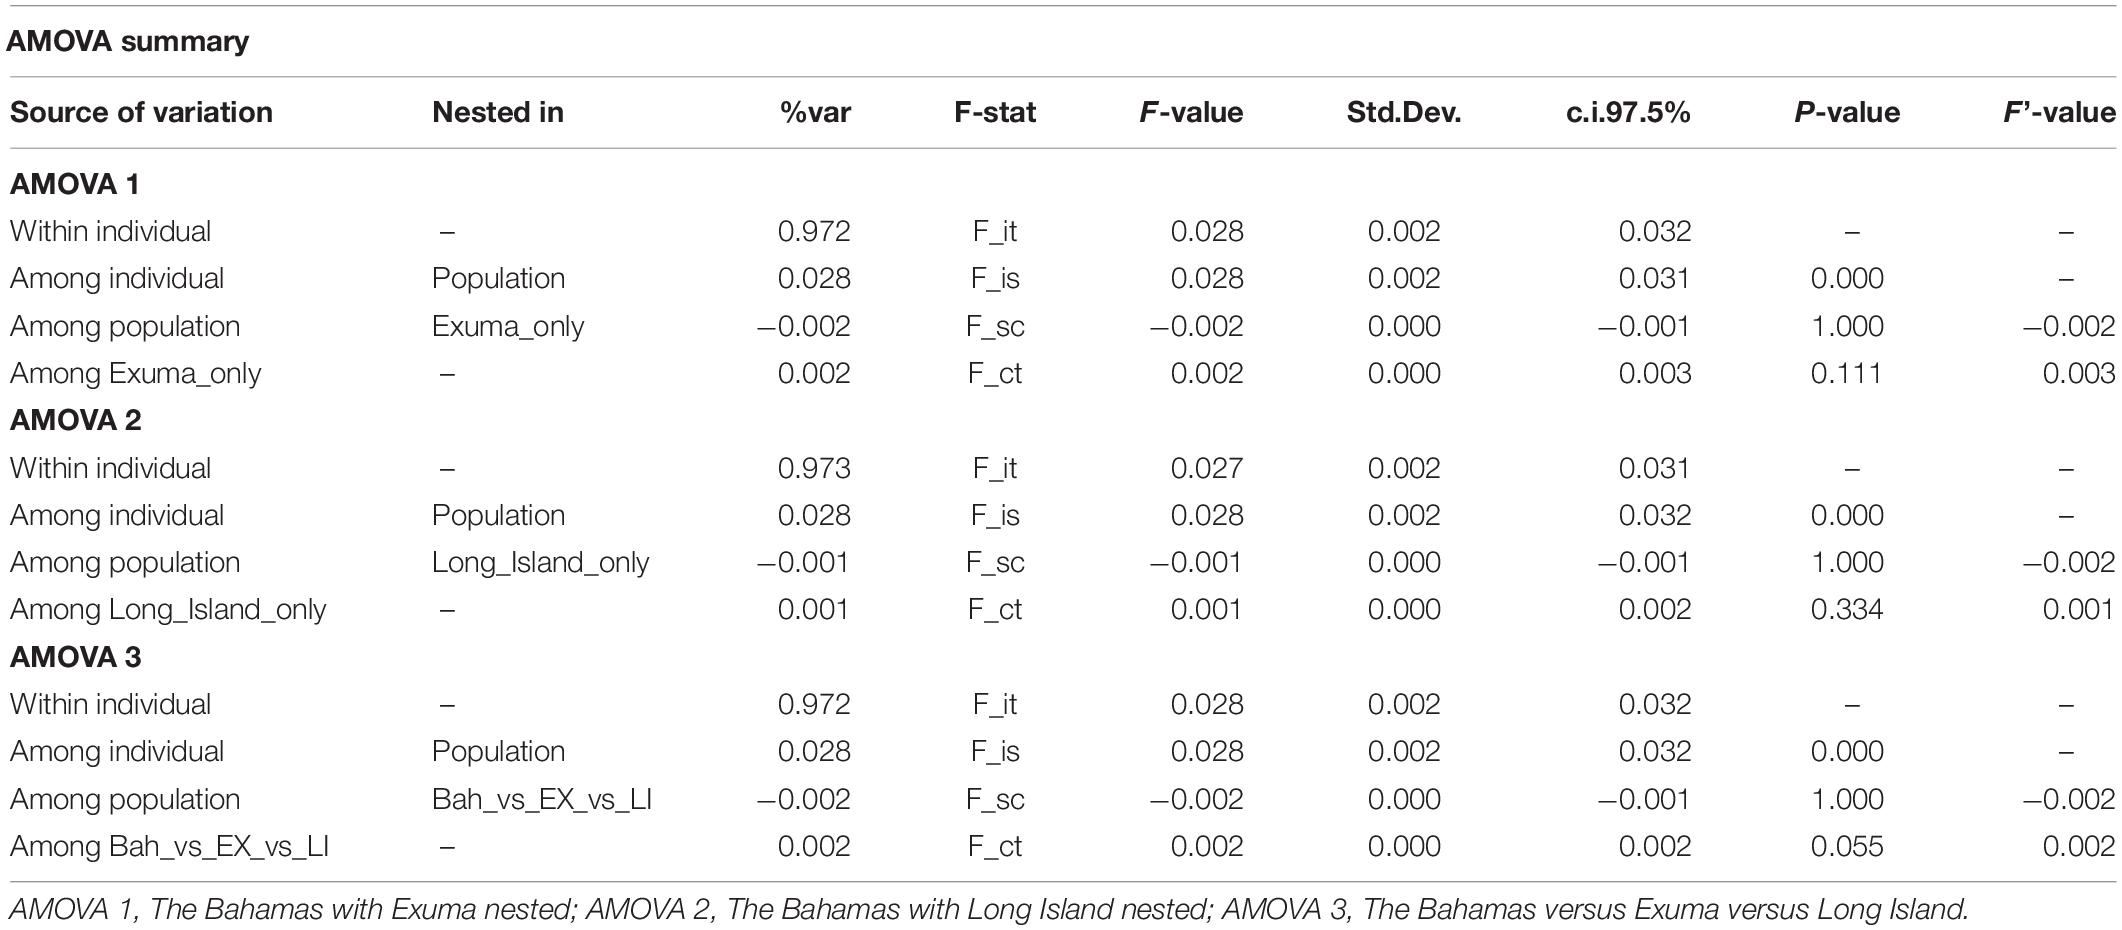
Table 2. Analysis of Molecular Variance (AMOVA) for the three models tested to examine genetic variation in 94 Nassau grouper sampled from eight islands and one spawning site in The Bahamas.
Identifying Loci Under Selection
Preliminary analysis showed that some of the environmental variables were highly correlated (Supplementary Figure 2). We therefore performed an initial RDA only on five environmental variables – maximum sea surface temperature, minimum sea surface temperature, minimum primary productivity, maximum current and salinity (SSTmax, SSTmin, PPmin, CURRmax and SAL). The resultant variance inflation factors (VIF) suggested collinearity between SSTmin and other variables. We therefore removed this variable and performed the final RDA on four variables (SSTmax, PPmin, CURRmax, and SAL). The first two axes explained 32 and 27.53% of the variation, respectively with a total of 16 SNPs associated with environmental variables – four with CURRmax, four with salinity, six with PPmin and two with SSTmax (Table 3 and Figure 4). However, results of this analysis should be treated with caution as ANOVAs showed both the full model and each axis to be non-significant.
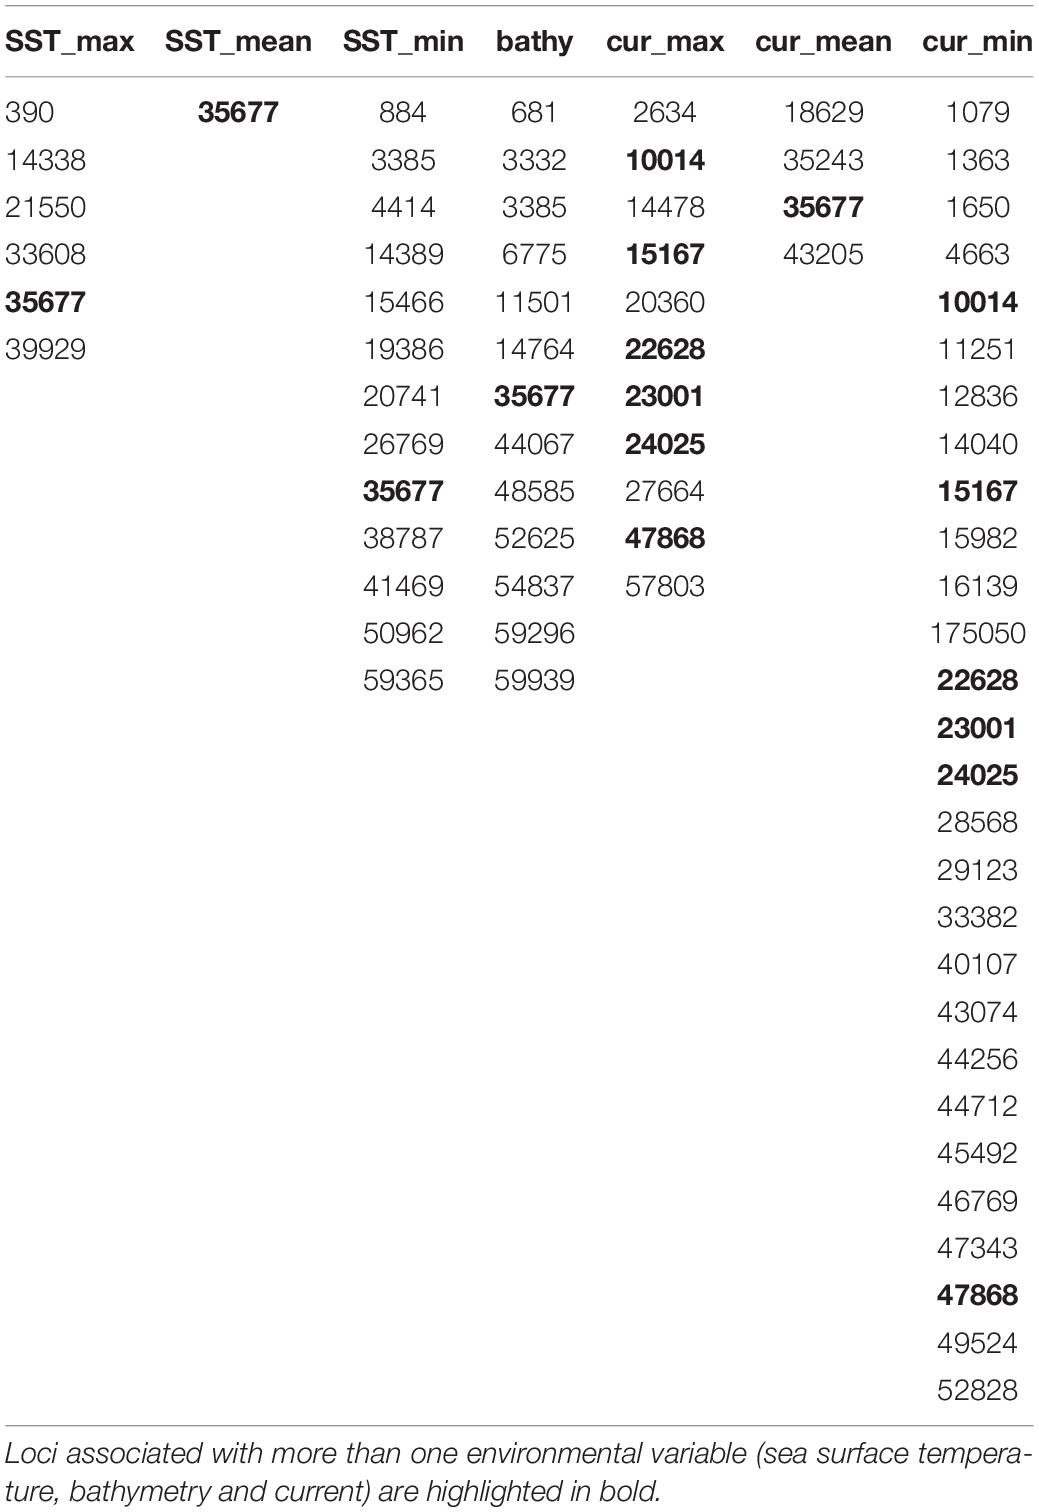
Table 3. Environmentally linked loci under putative selection based on latent factor mixed model (LFMM) and redundancy (RDA) analysis.
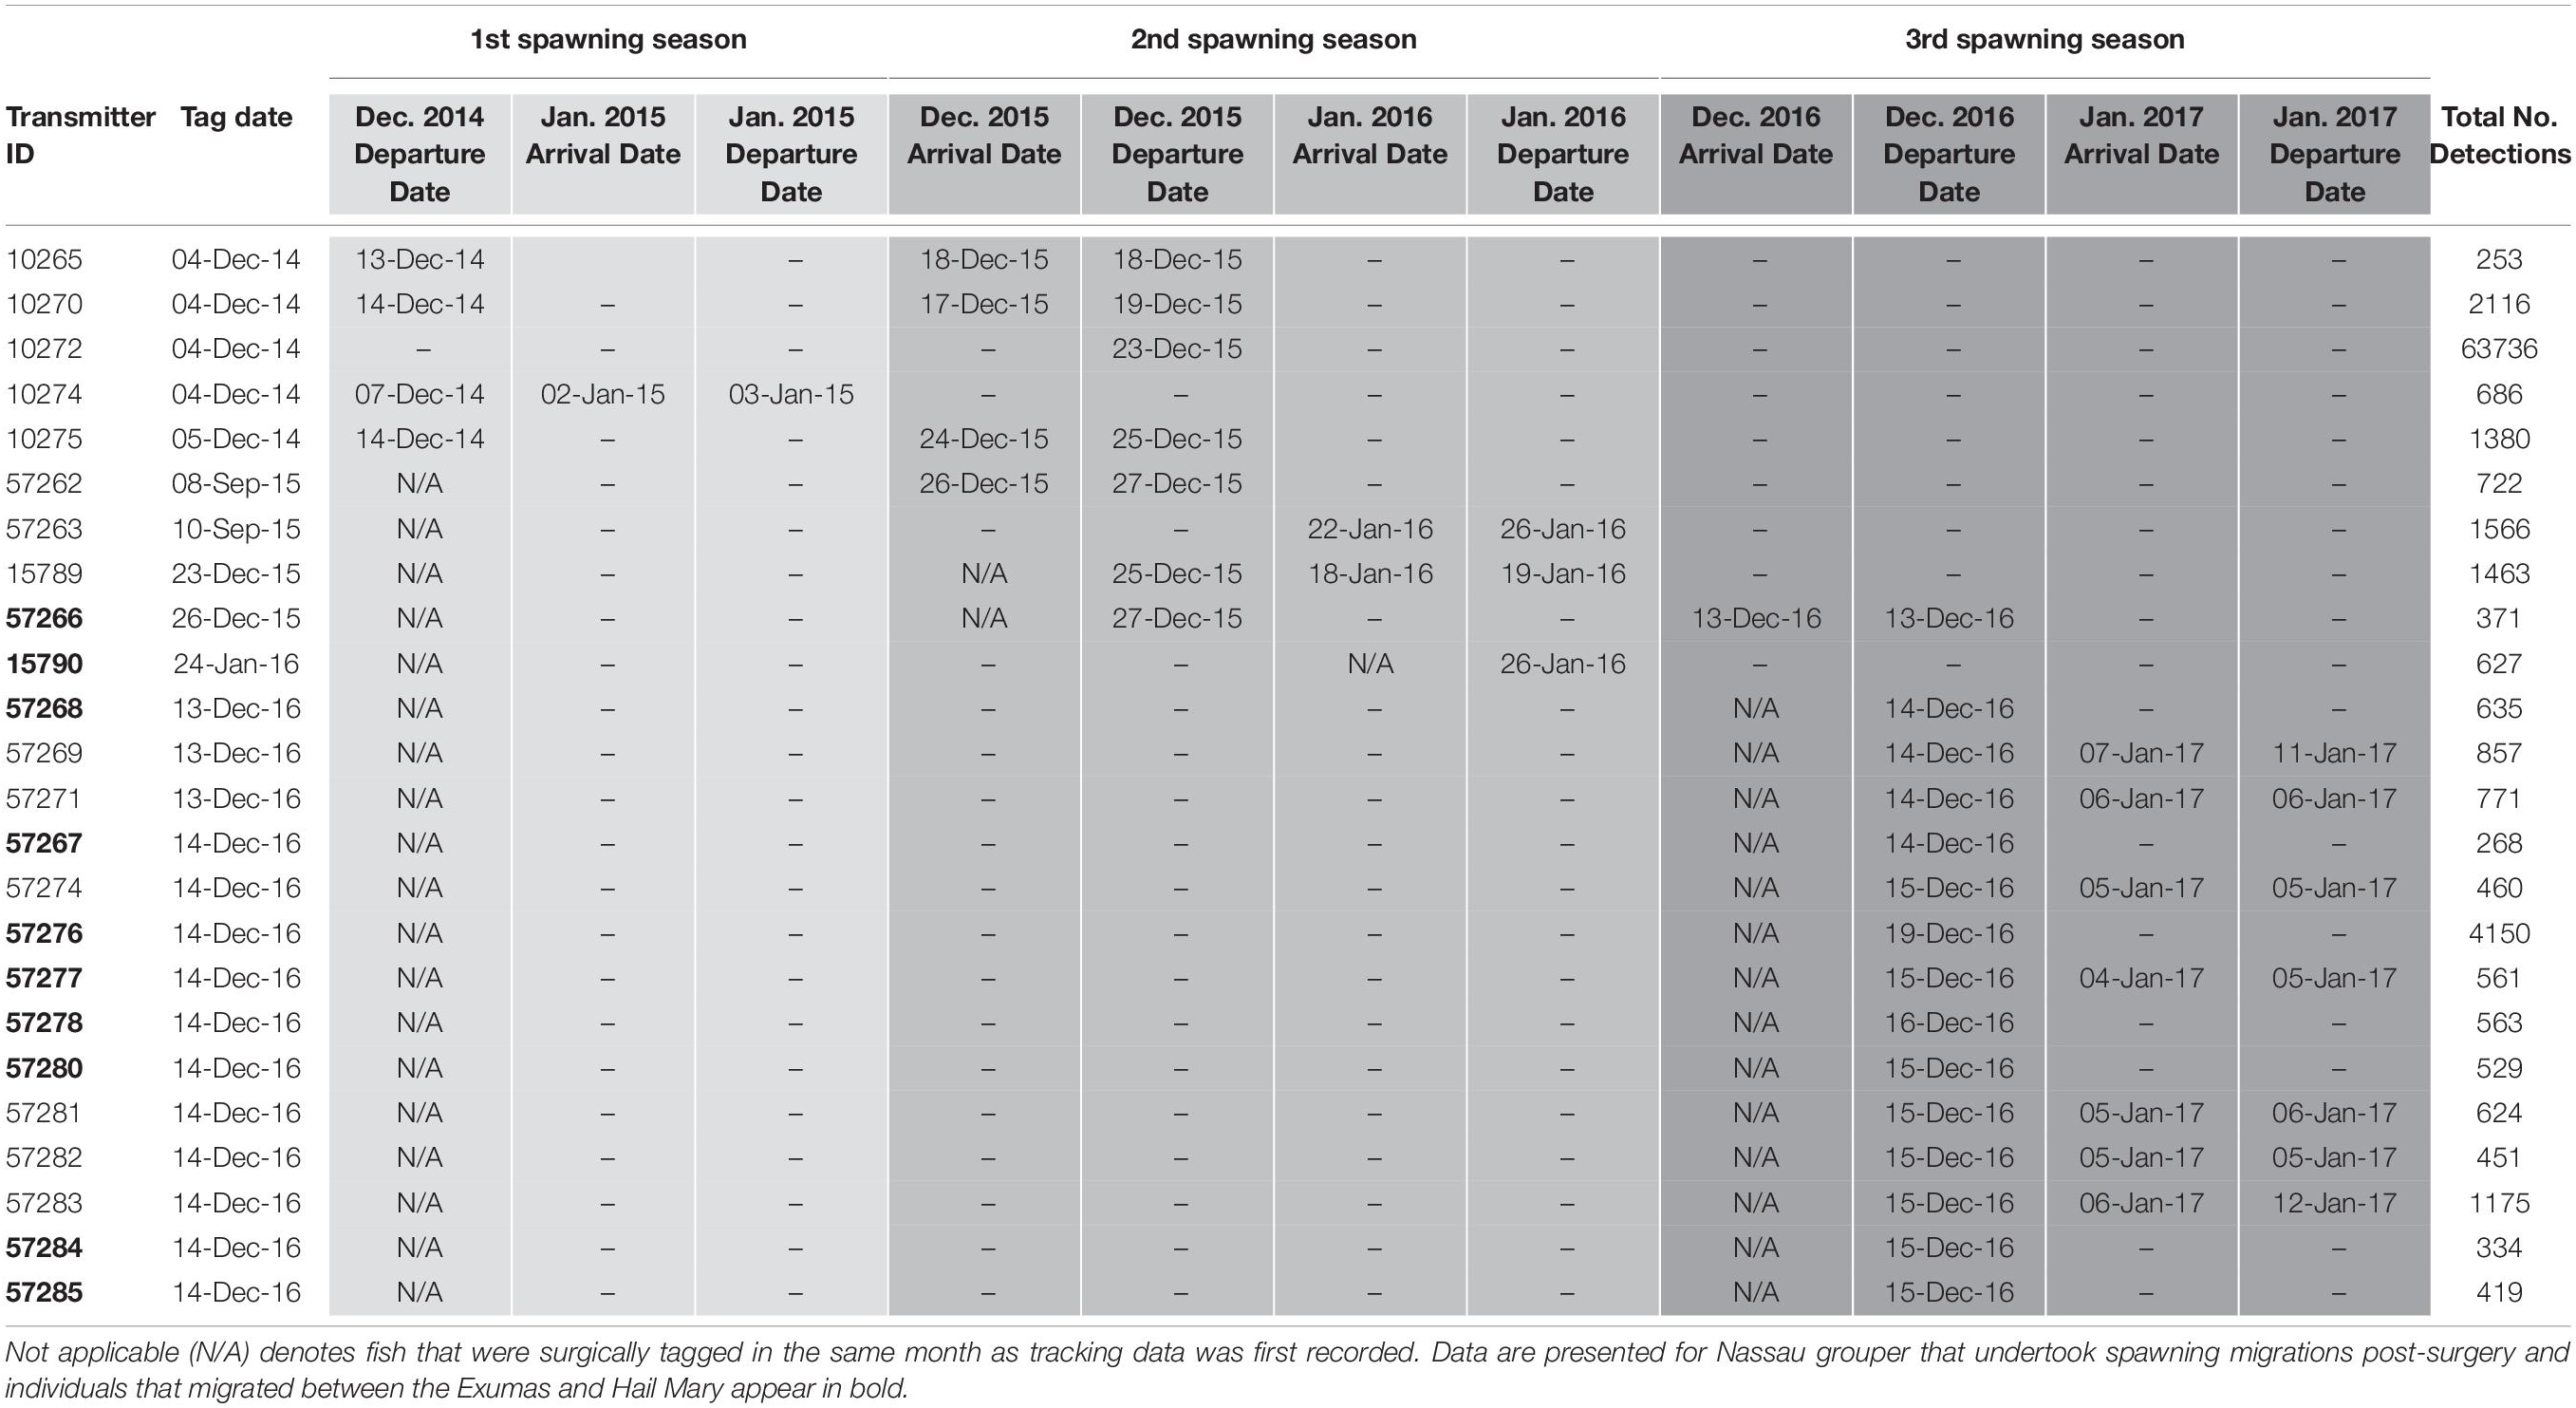
Table 4. Details of acoustic telemetry data including transmitter identification (ID), tag date, detection information [i.e., dates, times, total number of detections across spawning seasons (shaded in progressively darker gray colors)] for Nassau grouper recorded on receivers in the Exuma Sound.
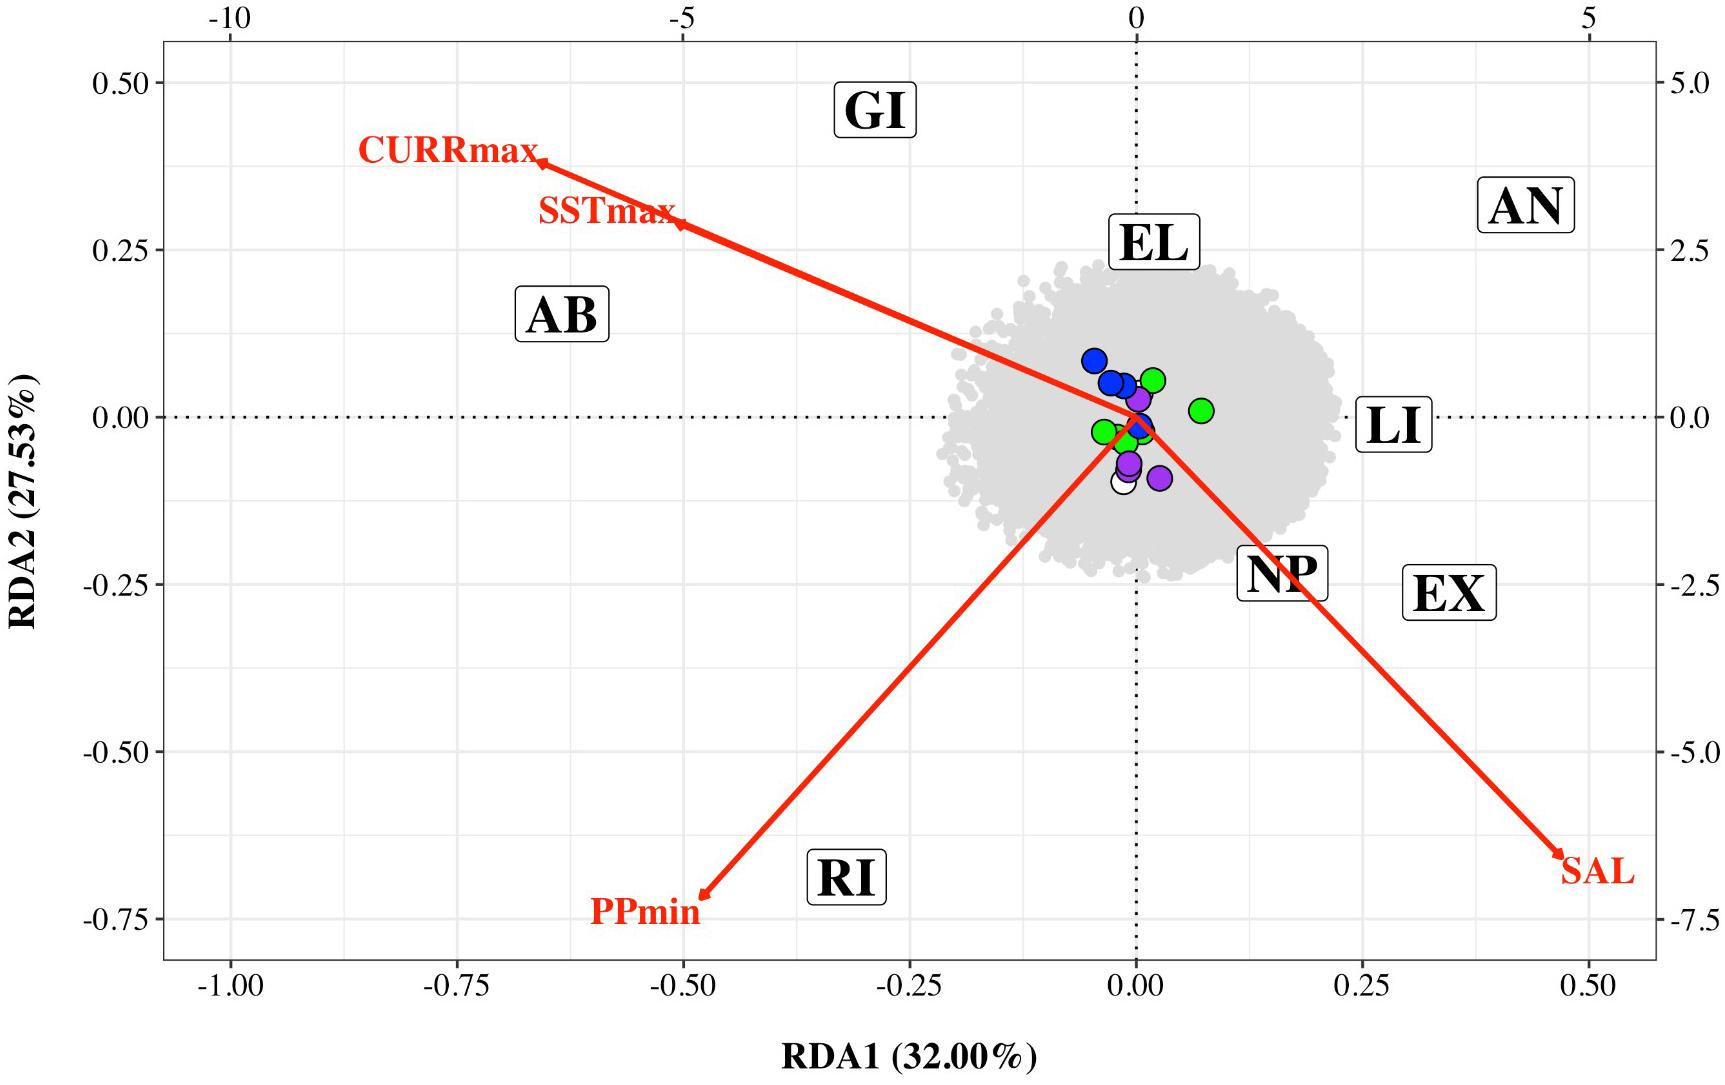
Figure 4. Redundancy analysis triplot of association between Nassau grouper single nucleotide polymorphism (SNP) frequency and four environmental variables: maximum current velocity (CURRmax), minimum primary productivity (PPmin), maximum sea surface temperature (SSTmax) and salinity (SAL) for eight sampling locations (AB, Abaco; AN, Andros; EL, Eleuthera; EX, Exuma; GI, Great Inagua; LI, Long Island; NP, New Providence; RI, Ragged Island). SNPs associated with each environmental variable are color coded (CURRmax – purple, PPmin – green, SSTmax – white and SAL – blue). The bottom and left axes relate to site and environmental variable scores while the top and right axes relate to SNPs scores.
LFMM analysis showed that seven loci were associated with two or more environmental variables (Table 3). A total of 67 (non-overlapping) hits associated with 58 genes was returned when the dataset was aligned with available red spotted grouper sequences for outlier SNP loci detected from LFMM analysis (51 loci) and RDA (16 loci) (Ge et al., 2019; Supplementary Tables 4, 5).
Tagging and Telemetry
Externally tagged Nassau grouper ranged in size from 21.2 to 73.0 cm TL, with an average of 51.97 (± 14.0 SD) cm TL (Supplementary Table 6). Local fishers reported only five tag returns from Nassau grouper. Acoustically tagged fish ranged in size from 53.1 to 73.0 cm TL, averaging 63.84 (± 4.2 cm TL) and 4.5 (± 1.1 SD) kg in weight (Supplementary Table 6). Hail Mary VR2Ws recorded detections from 43 Nassau grouper, 18 of which returned to the site during subsequent spawning seasons (Table 4). Of the 16 Nassau grouper tagged at Hail Mary in December 2014, one was detected between September and December 2015, two were detected 3 days after the November 25th, 2015 full moon, three were detected within a week around the December 25th, 2015 full moon, and one was detected 2 days before the January 4th, 2015 full moon (Table 4).
For Nassau grouper tagged in 2015, one individual that was tagged and released at Parrotfish Reef, ECLSP migrated to the Hail Mary FSA during the December 2015 spawning season, and another fish returned to the FSA for the week of the January 23rd, 2016 full moon (Table 4). One Nassau grouper, also tagged in December 2015, arrived at Hail Mary on the day of the full moon (December 13th, 2016) and remained within detection range at the FSA for approximately 4 h prior to its departure. Additionally, seven fish tagged in December 2016 were detected during the week of the January 12th, 2017 full moon (Table 4).
Five Nassau grouper that were acoustically tagged at the Hail Mary FSA in December 2016 were detected on two VR2Ws in the ECLSP a few days after the December 2016 full moon. One individual remained within detection range of Hail Mary VR2Ws for 5 days prior to departing for the ECLSP. Migrating Nassau grouper covered one-way distances of ∼137 km from Hail Mary to Conch Cut (COCU) in the south and ∼176 km to Shroud Cay (SHCA) in the north of the ECLSP during the 2016–2017 spawning season (Table 4). Three Nassau grouper that were tagged in December 2016 at Hail Mary were detected on the Georgetown (GETO) receiver in Exuma during the 2016–2017 spawning season (Table 4). Two of these fish were detected within 1–2 days after the December 13th, 2016 full moon and the other fish was detected on January 4th, 2017 (Table 4). Migrating Nassau grouper traveled ∼15.7 km (9.8 mi) from Hail Mary to GETO.
Nassau grouper were not detected on the Poseidon Point (POPO) receiver on the eastern side of Long Island. However, one individual was detected on the Newton Cay (NECA) VR2W for 27 consecutive days beginning on November 28th, 2015 and then again for another 4 days around the time of the January 2016 full moon (Table 4). Additionally, tag return information from fishers suggests that one Nassau grouper migrated from Hail Mary to Clarence Town, located in the southeastern end of Long Island.
Discussion
RAD-seq was used to discover and genotype SNPs for Nassau grouper, enabling assessments of genomic diversity and population divergence within The Bahamas. We also sought, for the first time, to investigate the role of selection on genetic population structure of Nassau grouper. Analyses of high-resolution SNP markers (including candidate loci under selection) coupled with acoustic telemetry revealed intraspecific population structure of Bahamian Nassau grouper, enabled us to determine the origins of individuals migrating to the Hail Mary FSA, and suggest that multiple processes influence the spatial dynamics of this species.
Genetic Diversity, Differentiation, and Structure
Global estimates of genetic differentiation (Global FST = 0.0003; p = 0.325) were lower than that reported by Jackson et al. (2014) using SNPs (FST = 0.002; p = 0.014) and microsatellite markers (FST = 0.002; p = 0.004), respectively. This, however, is not surprising given that Nassau grouper in the Jackson et al. (2014) study were sampled over an extensive geographical area, encompassing The Bahamas and parts of the Caribbean. Genome-wide assessments of diversity and differentiation with large numbers of SNPs have been shown to yield more accurate estimations of patterns of genetic variation (Helyar et al., 2011; Fischer et al., 2017; Hodel et al., 2017). Differences have been reported in gene diversity values between two studies for Nassau grouper using microsatellites and SNP markers (Jackson et al., 2014; Bernard et al., 2016). In the present study, however, findings from RAD-seq data concur with microsatellite data reported by Sherman et al. (2017), with both techniques demonstrating similar levels of genetic diversity in Bahamian Nassau grouper.
DAPC analysis is multivariate approach that attempts to simultaneously maximize variability between populations, while minimizing variation within populations. As a result, DAPC analysis has become an increasingly used method for revealing fine-scale patterns of population structure, especially when population differentiation estimates are low (Jombart et al., 2010; Kalinowski, 2010). Multivariate DAPC analysis enabled detection of three distinct genetic clusters (Figure 3), offering an apparently finer level of the resolution than that obtained by microsatellite analysis, which showed no structure (Sherman et al., 2017). The observed genomic divergences of Exuma and Long Island from the rest of The Bahamas (despite exhibiting similar levels of heterozygosity) suggest subtle differences in gene flow may be occurring among Nassau grouper from these islands.
In the absence of overt physical barriers to gene flow, probable explanations for the observed patterns of genetic connectivity include, (1) varied migration patterns and adult dispersal capabilities (Bolden, 2000; Dahlgren C. P. et al., 2016); (2) intraspecific differences in larval survivorship, dispersal, and recruitment (Eggleston, 1995; Kough and Paris, 2015); (3) low densities of Nassau grouper (0.13-0.25 fish/100 m2) outside the ECLSP (Dahlgren C. et al., 2016; Sherman et al., 2018b); and (4) divergent selective pressures between islands (e.g., Delmore et al., 2015; Moore et al., 2017).
As a transient spawner (Domeier, 2012), most of the reproductive effort for Nassau grouper is limited to a relatively narrow temporal window, which is further influenced by environmental and oceanographic processes (e.g., water temperature, currents, and the lunar cycle) (Colin, 1992, 2012). Through biophysical modeling, Kough and Paris (2015) demonstrated that infrequent spawners often exhibit reduced larval connectivity networks. Therefore, heavy exploitation of Nassau grouper outside the MPA coupled with reduced larval connectivity networks may potentially limit the relative contribution of gene flow throughout parts of The Bahamas. While residents of the ECLSP experience negligible fishing pressure compared to the rest of The Bahamas (Dahlgren C. et al., 2016), telemetry data in the present study, as well as previous research (Bolden, 2000; Dahlgren C. P. et al., 2016), support connectivity through adult migrations for spawning, which are variable in space and time.
Genetic connectivity in marine species is often complicated by geographical separation, migration, larval dispersal, life history characteristics (e.g., age at maturity, ontogeny, reproductive strategies), and oceanographic conditions (Rivera et al., 2011; Hemmer-Hansen et al., 2014; Selkoe et al., 2016). Future research is required to clarify patterns of gene flow and provide additional insights into the mechanisms influencing source-sink dynamics for Nassau grouper throughout The Bahamas. Such data will have important implications for maintaining genetic connectivity within Bahamian MPA networks, including the protection of specific FSAs, and in recommending fishery quotas. However, in the interim, stronger enforcement of national fisheries regulations particularly around the Exumas and Long Island are warranted to protect both genetic stocks.
Identifying Loci Under Selection
Examination of loci under selection has been employed to explain genetic population structuring in marine species (Overgaard Therkildsen et al., 2013; Benestan et al., 2015; Forester et al., 2018), which in turn is fundamental for understanding potential adaptive responses and associated relationships between genetic diversity. These data are therefore useful from both evolutionary and conservation management perspectives, providing the associated functions are known (Funk et al., 2012). To this end, we performed RDA of outlier SNPs to visualize weather patterns of genetic structure could be attributed to loci under selective processes (Figure 4 and Table 3). Additionally, LFMM analysis was used to detect correlations between SNPs and the environmental variables considered in the study (Supplementary Figure 2 and Table 3).
In the present study, pairwise FST with neutral loci showed no significant FST values (Supplementary Table 3), and there were no clear geographic patterns related to gene diversity for outlier loci linked to environmental variables (Figure 4). RDA results showed correlations between outlier SNPs and maximum sea surface temperature, maximum current, minimum primary productivity, and salinity, with maximum sea surface temperature and maximum current influencing the northern and southern extremes of The Bahamas (i.e., Abaco and Great Inagua, Figure 4). RDA and LFMM outlier SNPs possibly under selection were connected to a spectrum of important biological and molecular functions (Supplementary Tables 4, 5). Gene ontology indicates that loci of interest were related to chaperone and developmental proteins, oxidative stress, osmoregulation, metabolic processes, muscle differentiation, and function (Smithers et al., 2000; Chaube et al., 2017; Dardenne et al., 2017). Indeed, several of these gene families and transporter proteins (e.g., slc, ATPase, cpne, ptpn) have been shown to be connected to osmoregulatory and physiological processes in fish (DeFaveri et al., 2011; Tine, 2017).
In other research (e.g., Hess et al., 2013; DeFaveri and Merilä, 2014; Xu et al., 2017), loci under potential divergent selection were used to explain observed spatial patterns. For example, using SNP data obtained from RAD-seq, Hess et al. (2013) were able to link adaptive loci with environmental conditions that helped to explain demographic population structure in Pacific lamprey (Entosphenus tridentatus, Richardson, 1836). By examining patterns of gene flow, dispersal and putative loci under adaptive selection, Moore et al. (2017) found that Arctic char (S. alpinus) altered their migratory patterns to reduce exposure to unfavorable environmental conditions outside of the reproductive season.
Mean monthly water temperatures in The Bahamas range from 24°C in the winter to 29°C in the summer, but rarely drop below 26°C in the southern Bahamas during winter months1. However, elevated water temperatures in nursery habitats (exposed to tidal fluctuations) and on the Bahama Banks are common during summer months, where maximum temperatures can exceed 40°C (Murchie et al., 2011; Shultz et al., 2014). Nassau grouper migrate during winter months, when water temperatures are cooler (Colin, 1992). Any extremes in water temperature are likely to be experienced by juvenile and sub-adult fish transitioning from nursery habitats to reefs (Eggleston et al., 1998). However, long distance migrations are likely to be more energetically costly, and thus may explain the presence of outlier loci associated with osmoregulation, metabolic processes and muscle function, which were also linked to environmental variables (Table 3 and Supplementary Tables 4, 5). There are, however, limitations with the different methods used for detecting loci under selection and even moderate gene flow may mask signals of divergence (Davey et al., 2011; Narum and Hess, 2011). Development and annotation of a genome for Nassau grouper would allow for rigorous exploration of genes associated with reproduction, physiology and other important biological functions, as well as correlations between fitness traits and adaptive variation.
Tagging and Telemetry
Round-trip migration distances covered by Nassau grouper in The Bahamas can exceed 300 km (Dahlgren C. P. et al., 2016), thus surpassing distances reported for fish in the Cayman Islands and Belize (e.g., Whaylen et al., 2004; Semmens et al., 2007; Starr et al., 2007). The migratory patterns displayed by Nassau grouper in this study are congruent with previous research in The Bahamas in terms of routes and distances (∼15.7–176 km) traveled (Bolden, 2000; Dahlgren C. P. et al., 2016; Stump et al., 2017). Adult Nassau grouper migrate along the shelf edge in groups to and from FSAs within 1–2 weeks of the full moon (Dahlgren C. P. et al., 2016; Stump et al., 2017). Moreover, Dahlgren C. P. et al. (2016) demonstrated that some fish from the ECLSP utilize FSAs around Long Island and highlighted temporal differences in migratory patterns, which coincided with the timing of the full moon. In the present study, of 45 acoustically tagged fish, 22% were detected by receivers traveling between Hail Mary and the Exumas (Figures 1, 2 and Table 4), and 14% entered or exited the ECLSP, a no-take marine protected area (MPA). Approximately 37% of Nassau grouper from the Exuma Cays were sampled within the ECLSP (Supplementary Table 5). Acoustic telemetry revealed this MPA as the likely origin of five Nassau grouper, representing 5 of 19 individuals (26%) tagged at the Hail Mary FSA in December 2016 (Supplementary Table 5). These results not only corroborate patterns of long-distance adult dispersal during the winter spawning season (Dahlgren C. P. et al., 2016), but also highlight the relative contribution of the ECLSP to the Hail Mary FSA.
However, the discrepancy between genetic and telemetry data suggest that fish may use other FSAs around Long Island or originate from other islands. Genetic data may not reflect this pattern due to low sample sizes (i.e., < 20) for several islands and limited spatial coverage across certain islands (e.g., Abaco, Grand Bahama, and Long Island). Future Nassau grouper sampling should aim to increase both geographic coverage and sample sizes. More detailed tagging data via satellite tagging or a more extensive network of acoustic receivers placed around migration routes, in tandem with additional genetic analysis of other potential reef sites of origin, may be necessary to fully understand spawning migration patterns around this part of The Bahamas. Identifying where all active FSAs are, the exact locations Nassau grouper migrate from to participate in annual spawning events, and patterns of larval dispersal and recruitment will be essential to the long-term protection and sustainable exploitation of this species.
Conclusion
Here, we aimed to determine whether a genomic approach, in conjunction with acoustic telemetry, could resolve intraspecific population structure and provide additional insight into the demographics of Nassau grouper in The Bahamas. RAD-seq analysis using more than 13,000 SNPs yielded new genomic data for the species. Key findings from this research show that genomic patterns of diversity in Nassau grouper exhibit a high degree of uniformity throughout The Bahamas. DAPC analyses revealed fine-scale genetic clustering – separating Exuma and Long Island from the rest of The Bahamas.
Patterns of cryptic divergence were further supported by AMOVAs, showing differences in the relative contribution of putative loci under selection in parts of The Bahamas. Acoustic telemetry data were used to confirm migratory corridors and track northwest movements of Nassau grouper from an active FSA into the Exumas and into the ECLSP. Long-distance movement patterns displayed by acoustically tagged fish provide additional evidence for a mechanism of genetic exchange, which is likely to be ubiquitous throughout The Bahamas. However, genomic analysis of Nassau grouper sampled at Hail Mary, did not reflect genetic signatures of fish from Exuma and Long Island, highlighting discrepancies between the genetic and telemetry data. Despite evidence of some tagged Nassau grouper moving to and from ECLSP and Hail Mary, genetic data suggest Hail Mary fish may also originate from other islands. MPAs like ECLSP that do not account for genetic connectivity and/or have not been explicitly designed to address fisheries management objectives are also unlikely to be completely effective conservation management tools. Collectively, these results demonstrate the critical importance of understanding the reproductive output of active FSAs and connectivity for well-designed MPAs and MPA networks, as they can be valuable tools for species conservation.
Using RAD-seq, new information on putative loci associated with divergent selection in Nassau grouper has been derived. It appears that selection may also be an important driver in shaping the contemporary genetic population structure of the species and these data certainly warrant further exploration to identify potential processes influencing selection. These findings may have implications for long-term survival in light of future anthropogenic disturbances (e.g., forecasted increases to water temperatures, which may impact the timing, and energetic costs of spawning migrations). Moreover, the use of SNP data will facilitate regional comparisons of genetic diversity, differentiation and structure once such data become available from other countries where Nassau grouper populations still exist. In the future, Nassau grouper SNP data may have applications beyond demographic inferences, such as examining the extent of illegal unreported and unregulated (IUU) fishing for fisheries management (e.g., Martinsohn and Ogden, 2009) and population assignment (e.g., Larson et al., 2014).
Overall, data from this study build upon previous Nassau grouper research in The Bahamas. It demonstrates the power of RAD-seq to reveal complex spatial patterns and provide novel insight into population dynamics of a critically endangered marine species. Furthermore, the application of both in situ methodologies (i.e., acoustic telemetry) and molecular research highlight the benefits and importance of integrative approaches for advancing understanding the dynamics of aggregating species.
Data Availability Statement
RAD-seq data are available in the European Nucleotide Archive (ENA) via study accession number PRJEB36904. Sample accession numbers as ERX3958594–ERX3958689.
Ethics Statement
Established ethical procedures were reviewed by Shedd Aquarium’s Internal and External Research Committee and were adhered to during animal handling.
Author Contributions
KDS conducted fieldwork, performed genomic DNA extractions and quality testing, prepared samples for RAD-tag library development, analyzed the data, and wrote the manuscript. JP assisted with bioinformatics and contributed to the manuscript. RK provided laboratory support, performed RDA analysis, and contributed to the manuscript. KM developed RAD-tag libraries and completed sequencing. CD, LK, and KS were involved with fieldwork and commented on the manuscript. LK also produced Figures 1–2. JS and CT helped in project design and contributed to improving the manuscript. The final version was approved by all authors.
Funding
RAD-sequencing was funded by the Save Our Seas Foundation (small Grant No. 365) and Lyford Cay Foundation via the Shirley Oakes Butler Charitable Trust scholarship to KDS. Fieldwork was funded by Shedd Aquarium. Open access publication fees were covered by the University of Exeter.
Conflict of Interest
KS was employed by company Field Lab Consulting, LLC.
The remaining authors declare that the research was conducted in the absence of any commercial or financial relationships that could be construed as a potential conflict of interest.
Acknowledgments
We would like to thank the Exeter Sequencing Service and Computational core facilities team at the University of Exeter. Fin clips were obtained with permission from The Bahamas Department of Marine Resources under scientific research permit (MAMR/FIS/17 – Sherman) to KDS and follow UK Home Office guidelines. Fieldwork and telemetry research were completed under permits issued to KDS (MAMR/FIS/17 – Sherman) and KS (MAMR/FIS/17 – Stump). Finally, we are grateful to research volunteers from the Shedd Aquarium, Bahamas National Trust, Atlantis, Cape Eleuthera Institute, Bahamas Reef Environment Educational Foundation, The Nature Conservancy, University of Miami, T. Kamerman, S. Buhler-Hensel, D. Rottman, D. Delaney, N. Truelove, B. Crown, and R. Fluck who assisted with fieldwork between December 2014–May 2017 and to Keith Pamper and the crew of the R/V Coral Reef II for logistical field support.
Supplementary Material
The Supplementary Material for this article can be found online at: https://www.frontiersin.org/articles/10.3389/fmars.2020.00157/full#supplementary-material
Footnotes
References
Abelson, A., Obolski, U., Regoniel, P., and Hadany, L. (2016). Restocking herbivorous fish populations as a social-ecological restoration tool in coral reefs. Front. Mar. Sci. 3:138. doi: 10.3389/fmars.2016.00138
Allendorf, F. W., Hohenlohe, P. A., and Luikart, G. (2010). Genomics and the future of conservation genetics. Nat. Rev. Genet. 11, 697–709. doi: 10.1038/nrg2844
Andrews, S. (2010). FastQC: A Quality Control Tool for High Throughput Sequence Data. Available online at: http://www.bioinformatics.babraham.ac.uk/projects/fastqc/ (accessed April 4, 2017).
Aswani, S., Mumby, P. J., Baker, A. C., Christie, P., McCook, L. J., Steneck, R. S., et al. (2015). Scientific frontiers in the management of coral reefs. Front. Mar. Sci. 2:50. doi: 10.3389/fmars.2015.00050
Austin, M. (2007). Species distribution models and ecological theory: a critical assessment and some possible new approaches. Ecol. Model. 200, 1–19. doi: 10.1016/j.ecolmodel.2006.07.005
Baird, N. A., Etter, P. D., Atwood, T. S., Currey, M. C., Shiver, A. L., Lewis, Z. A., et al. (2008). Rapid SNP discovery and genetic mapping using sequenced RAD markers. PLoS One 3:e3376. doi: 10.1371/journal.pone.0003376
Benestan, L., Gosselin, T., Perrier, C., Sainte-Marie, B., Rochette, R., and Bernatchez, L. (2015). RAD genotyping reveals fine-scale genetic structuring and provides powerful population assignment in a widely distributed marine species, the American lobster (Homarus americanus). Mol. Ecol. 24, 3299–3315. doi: 10.1111/mec.13245
Bernard, A. M., Feldheim, K. A., Nemeth, R., Kadison, E., Blondeau, J., Semmens, B. X., et al. (2016). The ups and downs of coral reef fishes: the genetic characteristics of a formerly severely overfished but currently recovering Nassau grouper fish spawning aggregation. Coral Reefs 35, 273–284. doi: 10.1007/s00338-015-1370-3
Bernatchez, L., Wellenreuther, M., Araneda, C., Ashton, D. T., Barth, J. M. I., Beacham, T. D., et al. (2017). Harnessing the power of genomics to secure the future of seafood. Trends Ecol. Evol. 32, 665–680. doi: 10.1016/j.tree.2017.06.010
Bolden, S. K. (2000). Long-distance movement of a Nassau grouper (Epinephelus striatus) to a spawning aggregation in the central Bahamas. Fish. Bull. 98, 642–645.
Bosch, S., Tyberghein, L., and De Clerck, O. (2018). Sdmpredictors: Species Distribution Modelling Predictor Datasets. R Package Version 0.2.8. Available online at: https://cran.r-project.org/web/packages/sdmpredictors/index.html. (accessed July 19, 2018).
Bozec, Y. M., O’Farell, S., Bruggemann, J. H., Luckurst, B. E., and Mumby, P. J. (2016). Tradeoffs between fisheries harvest and the resilience of coral reefs. Proc. Natl. Acad. Sci. U.S.A. 113, 4536–4541. doi: 10.1073/pnas.1601529113
Calosi, P., De Wit, P., Thor, P., and Dupont, S. (2016). Will life find a way? Evolution of marine species under global change. Evol. Appl. 9, 1035–1042. doi: 10.1111/eva.12418
Carpenter, K. E., Claro, R., Cowan, J., Sedberry, G., and Zapp-Sluis, M. (2015). Epinephelus Striatus. The IUCN Red List of Threatened Species 2015: e.T7862A70324790. Available online at: https://dx.doi.org/10.2305/IUCN.UK.2018-2.RLTS.T7862A46909843.en (accessed April 11, 2018).
Catchen, J., Hohenlohe, P. A., Bassham, S., and Amores, A. (2013). Stacks: an analysis tool set for population genomics. Mol. Ecol. 22, 3124–3140. doi: 10.1111/mec.12354
Catchen, J. M., Amores, A., Hohenlohe, P., Cresko, W., and Postlewait, J. H. (2011). Stacks: building and genotyping loci de novo from short-read sequences. G3: Genes Genomes Genet. 1, 171–182. doi: 10.1534/g3.111.000240
Chaube, R., Rawat, A., Inbaraj, R. M., Bobe, J., Guiguen, Y., Fostier, A., et al. (2017). Identification and characterization of a catechol-o-methyltransferase cDNA in the catfish Heteropneustes fossilis: tissue, sex and seasonal variations, and effects of gonadotropin and 2-hydroxyestradiol-17β on mRNA expression. Gen. Comp. Endocrinol. 246, 129–141. doi: 10.1016/j.ygcen.2016.12.001
Cheung, W. W. L., Sadovy, Y., Braynen, M. T., and Gittens, L. G. (2013). Are the last remaining Nassau grouper Epinephelus striatus fisheries sustainable? Status quo in the Bahamas. Endang. Species Res. 20, 27–39. doi: 10.3354/esr00472
Cheung, W. W. L., Sarmiento, J. L., Dunne, J., Frölicher, T. L., Lam, V. W. L., and Deng, et al. (2012). Shrinking of fishes exacerbates impacts of global ocean changes on marine ecosystems. Nat. Clim. Change 3, 254–258. doi: 10.1038/nclimate1691
Coleman, F. C., Koenig, C. C., Huntsman, G. R., Musick, J. A., Eklund, A. M., McGovern, J. C., et al. (2000). Long-lived reef fishes: the grouper-snapper complex. Fisheries 25, 14–21. doi: 10.1577/1548-8446(2000)025<0014:lrf>2.0.co;2
Colin, P. L. (1992). Reproduction of the Nassau grouper, Epinephelus striatus, (Pisces: Serranidae) and its relationship to environmental conditions. Environ. Biol. Fish. 34, 357–377. doi: 10.1007/bf00004740
Colin, P. L. (2012). “Aggregation spawning: biological aspects of the early life history,” in Reef Fish Spawning Aggregations: Biology, Research and Management, eds Y. Sadovy de Mitcheson, and P. L. Colin, (New York, NY: Springer), 191–224. doi: 10.1007/978-94-007-1980-4_7
Crozier, L. G., and Hutchings, J. A. (2014). Plastic and evolutionary responses to climate change in fish. Evol. Appl. 7, 68–87. doi: 10.1111/eva.12135
Dahlgren, C., Sherman, K., Lang, J., Kramer, P. R., and Marks, K. (2016). Bahamas Coral Reef Report Card, Vol. 1: 2011-2013. Nassau. Available online at:http://www.agrra.org/wp-content/uploads/2016/05/Bahamas-2016-Coral-Reef-Report-Card.pdf (accessed September 5, 2017).
Dahlgren, C. P., and Eggelston, D. B. (2001). Spatio-temporal variability in abundance, size and microhabitat associations of early juvenile Nassau grouper Epinephelus striatus in an off-reef nursery system. Mar. Ecol. Prog. Ser. 217, 145–156. doi: 10.3354/meps217145
Dahlgren, C. P., Buch, K., Rechisky, E., and Hixon, M. A. (2016). Multiyear tracking of Nassau grouper spawning migrations. Mar. Coast. Fish. 8, 522–535. doi: 10.1080/19425120.2016.1223233
Danecek, P., Auton, A., Abecasis, G., Albers, C. A., Banks, E., DePristo, M. A., et al. (2011). The variant call format and VCFtools. Bioinformatics 27, 2156–2158. doi: 10.1093/bioinformatics/btr330
Dann, T. H., Habicht, C., Baker, T. T., Seeb, J. E., and Fraser, D. (2013). Exploiting genetic diversity to balance conservation and harvest of migratory salmon. Can. J. Fish. Aquat. Sci. 70, 785–793. doi: 10.1139/cjfas-2012-0449
Dardenne, E., Pierredon, S., Driouch, K., Gratadou, L., Lacroix-Triki, M., Polay Espinoza, M., et al. (2017). Splicing switch of an epigenetic regulator by RNA helicases promotes tumor-cell invasiveness. Nat. Struct. Mol. Biol. 19, 1139–1146. doi: 10.1038/nsmb.2390
Davey, J. W., Hohenlohe, P. A., Etter, P. D., Boone, J. Q., Catchen, J. M., and Blaxter, M. L. (2011). Genome-wide genetic marker discovery and genotyping using next-generation sequencing. Nat. Rev. Genet. 12, 499–510. doi: 10.1038/nrg3012
DeFaveri, J., and Merilä, J. (2014). Local adaptation to salinity in the three-spine stickleback? J. Evol. Biol. 27, 290–302. doi: 10.1111/jeb.12289
DeFaveri, J., Shikano, T., Shimada, Y., Goto, A., and Merilä, J. (2011). Global analysis of genes involved in freshwater adaptation in threespine sticklebacks (Gasterosteus aculeatus). Evolution 65, 1800–1807. doi: 10.1111/j.1558-5646.2011.01247.x
Delmore, K. E., Hübner, S., Kane, N. C., Schuster, R., Andrew, R. L., Câmara, F., et al. (2015). Genomic analysis of a migratory divide reveals candidate genes for migration and implicates selective sweeps in generating islands of differentiation. Mol. Ecol. 8, 1873–1888. doi: 10.1111/mec.13150
Domeier, M. L. (2012). “Revisiting spawning aggregations: definitions and challenges,” in Reef Fish Spawning Aggregations: Biology, Research and Management, Vol. 35, eds Y. Sadovy de Mitcheson, and P. L. Colin, (Berlin: Springer), 1–20. doi: 10.1007/978-94-007-1980-4_1
Donofrio, M. C., Scribner, K. T., Baker, E. A., Kanefsky, J., Tsehaye, I., and Elliott, R. F. (2018). Telemetry and genetic data characterize lake sturgeon (Acipenser fulvescens Rafinesque, 1817) breeding ecology and spawning site fidelity in Green Bay Rivers of Lake Michigan. J. Appl. Ichthyol. 34, 302–313. doi: 10.1111/jai.13561
Egerton, J. P., Johnson, A. F., Le Vay, L., McCoy, C. M., Semmens, B. X., Heppell, S. A., et al. (2017). Hydroacoustics for the discovery and quantification of Nassau grouper (Epinephelus striatus) spawning aggregations. Coral Reefs 36, 589–600. doi: 10.1007/s00338-017-1542-4
Eggleston, D. B. (1995). Recruitment in Nassau grouper Epinephelus striatus: post-settlement abundance, microhabitat features, and ontogenetic habitat shifts. Mar. Ecol. Prog. Ser. 124, 9–22. doi: 10.3354/meps124009
Eggleston, D. B., Grover, J. J., and Lipcius, R. N. (1998). Ontogenetic diet shifts in Nassau grouper: trophic linkages and predatory impact. Bull. Mar. Sci. 63, 111–126.
Eizaguirre, C., and Baltazar-Soares, M. (2014). Evolutionary conservation—evaluating the adaptive potential of species. Evol. Appl. 7, 963–967. doi: 10.1111/eva.12227
Fischer, M. C., Rellstab, C., Leuzinger, M., Roumet, M., Gugerli, F., Shimizu, K. K., et al. (2017). Estimating genomic diversity and population differentiation – an empirical comparison of microsatellite and SNP variation in Arabidopsis halleri. BMC Genomics 18:69. doi: 10.1186/s12864-016-3459-7
Flanagan, S. P., Forester, B. R., Latch, E. K., Aitken, S. N., and Hoban, S. (2017). Guidelines for planning genomic assessment and monitoring of locally adaptive variation to inform species conservation. Evol. Appl. 11, 1035–1052. doi: 10.1111/eva.12569
Forester, B. R., Lasky, J. R., Wagner, H. H., and Urban, D. L. (2018). Comparing methods for detecting multilocus adaptation with multivariate genotype-environment associations. Mol. Ecol. 27, 2215–2233. doi: 10.1111/mec.14584
Frichot, E., and François, O. (2015). LEA: an R package for landscape and ecological association studies. Methods Ecol. Evol. 6, 925–929. doi: 10.1111/2041-210x.12382
Frichot, E., Schoville, S. D., Bouchard, G., and François, O. (2013). Testing for associations between loci and environmental gradients using latent factor mixed models. Mol. Biol. Evol. 30, 1687–1699. doi: 10.1093/molbev/mst063
Funk, W. C., McKay, J. K., Hohenlohe, P. A., and Allendorf, F. W. (2012). Harnessing genomics for delineating conservation units. Trends Ecol. Evol. 27, 489–496. doi: 10.1016/j.tree.2012.05.012
Ge, H., Kebing, L., Shen, M., Wu, S., Wang, Y., Zhang, Z., et al. (2019). De novo assembly of a chromosome-level reference genome of red-spotted grouper (Epinephelus akaara) using nanopore sequencing and Hi-C. Mol. Ecol. Resour. 2019, 1–9. doi: 10.1111/1755-0998.13064
Griffiths, A. M., Ellis, J. S., Clifton-Dey, D., Machado-Schiaffino, G., Bright, D., Garcia-Vazquez, E., et al. (2011). Restoration versus recolonisation: The origin of Atlantic salmon (Salmo salar L.) currently in the River Thames. Biol. Conserv. 144, 2733–2738. doi: 10.1016/j.biocon.2011.07.017
Hazen, L., Le Cornu, E., Zerbe, A., Martone, R., Erickson, A. L., and Crowder, L. B. (2016). Translating sustainable seafood frameworks to assess the implementation of ecosystem-based fisheries management. Fish. Res. 182, 149–157. doi: 10.1016/j.fishres.2015.11.019
Helyar, S. J., Hemmer-Hansen, J., Bekkevold, D., Taylor, M. I., Ogden, R., Limborg, M. T., et al. (2011). Application of SNPs for population genetics of nonmodel organisms: new opportunities and challenges. Mol. Ecol. Resour. 11, 123–136. doi: 10.1111/j.1755-0998.2010.02943.x
Hemmer-Hansen, J., Overgaard Therkildsen, N., and Pujolar, J. M. (2014). Population genomics of marine fishes: next-generation prospects and challenges. Biol. Bull. 227, 117–132. doi: 10.1086/bblv227n2p117
Heppell, S. A., Semmens, B. X., Pattengill-Semmens, C. V., Bush, P. G., Johnson, B. C., McCoy, C. M., et al. (2009). Tracking potential larval dispersal patterns from Nassau grouper aggregation sites: evidence for local retention and the ‘importance of place’. Proc. Gulf Caribb. Fish. Inst. 61, 325–327.
Hess, J. E., Campbell, N. R., Close, D. A., Docker, M. F., and Narum, S. R. (2013). Population genomics of Pacific lamprey: adaptive variation in a highly dispersive species. Mol. Ecol. 22, 2898–2916. doi: 10.1111/mec.12150
Hodel, R. G. J., Chen, S., Payton, A. C., McDaniel, S. F., Soltis, P., and Soltis, D. E. (2017). Adding loci improves phylogeographic resolution in red mangroves despite increased missing data: comparing microsatellites and RAD-Seq and investigating loci filtering. Sci. Rep. 7:17598. doi: 10.1038/s41598-017-16810-7
Hughes, T. P., Bellwood, D. R., Folke, C. S., McCook, L. J., and Pandolfi, J. M. (2007). No-take areas, herbivory and coral reef resilience. Tends. Ecol. Evol. 22, 1–3. doi: 10.1016/j.tree.2006.10.009
IUCN, (2017). The IUCN Red List of Threatened Species, Version 2017-1. Available online at: http://www.iucnredlist.org (September 5, 2017).
Jackson, A. M., Semmens, B. X., Sadovy, de Mitcheson, Y., Nemeth, R. S., Heppellm, S. A., et al. (2014). Population structure and phylogeography in Nassau grouper (Epinephelus striatus), a mass-aggregating marine fish. PLoS One 9:e97508. doi: 10.1371/journal.pone.0097508
Jombart, T. (2008). adegenet: a R package for the multivariate analysis of genetic markers. Bioinformatics 24, 1403–1405. doi: 10.1093/bioinformatics/btn129
Jombart, T., Devillard, S., and Balloux, F. (2010). Discriminant analysis of principal components: a new method for the analysis of genetically structured populations. BMC Genet 11:94. doi: 10.1186/1471-2156-11-94
Kadison, E., Nemeth, R. S., Blondeau, J., Smith, T., and Calnan, J. (2010). Nassau Grouper (Epinephelus striatus) in St. Thomas, US Virgin Islands, with evidence for a spawning aggregation site recovery. Proc. Gulf. Caribb. Fish. Inst. 62, 273–279.
Kalinowski, S. T. (2010). The computer program STRUCTURE does not reliably identify the main genetic clusters within species: simulations and implications for human population structure. Heredity 106, 625–632. doi: 10.1038/hdy.2010.95
Kough, A. S., and Paris, C. B. (2015). The influence of spawning periodicity on population connectivity. Coral Reefs 34, 753–757. doi: 10.1371/journal.pone.0095050
Larson, W. A., Seeb, L. W., Everett, M. V., Waples, R. K., Templin, W. D., and Seeb, J. E. (2014). Genotyping by sequencing resolved shallow population structure to inform conservation of Chinook salmon (Oncorhynchus tshawytscha). Evol. Appl. 7, 355–369. doi: 10.1111/eva.12128
Li, H. (2018). Minimap2: pairwise alignment for nucleotide sequences. Bioninformatics 34, 3094–3100. doi: 10.1093/bioinformatics/bty191
Liscjher, H. E. L., and Excoffier, L. (2012). PGDSpider: an automated data conversion tool for connecting population genetics and genomics programs. Bioinformatics 28, 298–299. doi: 10.1093/bioinformatics/btr642
Lorenzen, K., Agnalt, A.-L., Blankenship, H. L., Hines, A. H., Leber, K. M., Loneragan, N. R., et al. (2013). Evolving context and maturing science: aquaculture-based enhancement and restoration enter the marine fisheries management toolbox. Rev. Fish. Sci. 21, 213–221. doi: 10.1080/10641262.2013.837358
Lowe, W. H., Kovach, R. P., and Allendorf, F. W. (2017). Population genetics and demography unite ecology and evolution. Trends Ecol. Evol. 32, 141–152. doi: 10.1016/j.tree.2016.12.002
Martinez-Bakker, M. E., Sell, S. K., Swanson, B. J., Kelly, B. P., and Tallmon, D. A. (2013). Combined genetic and telemetry data reveal high rates of gene flow, migration, and long-distance dispersal potential in Arctic ringed seals (Pusa hispida). PLoS One 8:e77125. doi: 10.1371/journal.pone.0077125
Martinsohn, J. T., and Ogden, R. (2009). FishPopTrace—Developing SNP-based population genetic assignment methods to investigate illegal fishing. Foren. Sci. Int. Genet. Suppl. Ser. 2, 294–296. doi: 10.1016/j.fsigss.2009.08.108
Meirmans, P. G., and Van Tienderen, P. H. (2004). GENOTYPE and GENODIVE: two programs for the analysis of genetic diversity of asexual organisms. Mol. Ecol. Notes 4, 792–794. doi: 10.1111/j.1471-8286.2004.00770.x
Molloy, P. P., Côté, I. M., and Reynolds, J. D. (2012). “Why spawn in aggregations?,” in Reef Fish Spawning Aggregations: Biology, Research and Management, eds Y. Sadovy de Mitcheson, and P. L. Colin, (New York, NY,: Springer), 57–84.
Moore, J.-S., Harris, L. N., Le Luyer, J., Sutherland, B. J. G., Rougemont, Q., Tallman, R. F., et al. (2017). Migration harshness drives habitat choice and local adaptation in anadromous Arctic char: evidence from integrating population genomics and acoustic telemetry. Mol. Ecol. 26, 6784–6800. doi: 10.1111/mec.14393
Mumby, P. J., and Harborne, A. R. (2010). Marine reserves enhance the recovery of corals on caribbean reefs. PLoS One 5:e8657. doi: 10.1371/journal.pone.0008657
Murchie, K. J., Cooke, S. J., Danylchuk, A. J., Danylchuk, S. E., Goldberg, T. L., Suski, C. D., et al. (2011). Thermal biology of bonefish (Albula vulpes) in Bahamian coastal waters and tidal creeks: an integrated laboratory and field study. J. Therm. Biol. 36, 38–48. doi: 10.1016/j.jtherbio.2010.10.005
Narum, S. R., and Hess, J. E. (2011). Comparison of FST outlier tests for SNP loci under selection. Mol. Ecol. Res. 11, 184–194. doi: 10.1111/j.1755-0998.2011.02987.x
Oksanen, J., Blanchet, F. G., Friendly, M., Kindt, R., Legendre, P., McGlinn, D., et al. (2019). vegan: Community Ecology Package. R Package Version 2.5-6. Available online at: https://cran.r-project.org/web/packages/vegan/index.html. (accessed September 1, 2019).
Olsen, D. A., and LaPlace, J. A. (1979). A study of a Virgin Islands grouper fishery based on a breeding aggregation. Proc. Gulf Caribb. Fish. Inst. 31, 130–144.
Overgaard Therkildsen, N., Hemmer-Hansen, J., Berg Hedeholm, R., Wisz, M. S., Pampoulie, C., Meldrup, D., et al. (2013). Spatiotemporal SNP analysis reveals pronounced biocomplexity at the northern range margin of Atlantic cod Gadus morhua. Evol. Appl. 6, 690–705. doi: 10.1111/eva.12055
Paris, J. R., Sherman, K. D., Bell, E., Boulenger, C., Delord, C., El-Mahdi, M. B. M., et al. (2018). Understanding and managing fish populations: keeping the toolbox fit for purpose. J. Fish Biol. 92, 727–751. doi: 10.1111/jfb.13549
Paris, J. R., Stevens, J. R., and Catchen, J. M. (2017). Lost in parameter space: a road map for STACKS. Methods Ecol. Evol. 8, 1360–1373. doi: 10.1111/2041-210X.12775
Pauly, D., and Zeller, D. (2017). Comments on FAOs State of World Fisheries and Aquaculture (SOFIA 2016). Mar. Policy 77, 176–181. doi: 10.1016/j.marpol.2017.01.006
Perrier, C., Guyomard, R., Bagliniere, J.-L., Nikolic, N., and Evanno, G. (2013). Changes in the genetic structure of Atlantic salmon populations over four decades reveal substantial impacts of stocking and potential resiliency. Ecol. Evol. 3, 2334–2349. doi: 10.1002/ece3.629
Pittman, S. J., Moaco, M. E., Friedlander, A. M., Legare, B., Nemeth, R. S., Kendall, M. S., et al. (2014). Fish with chips: tracking reef fish movements to evaluate size and connectivity of Caribbean marine protected areas. PLoS One 9:e96028. doi: 10.1371/journal.pone.0096028
Raymond, M., and Rousset, F. (1995). GENEPOP (Version 1.2): population genetics software for exact tests and ecumenicisim. J. Hered. 86, 248–249. doi: 10.1093/oxfordjournals.jhered.a111573
Reiss, H., Hoarau, G., Dickey-Collas, M., and Wolff, W. J. (2009). Genetic population structure of marine fish: mismatch between biological and fisheries management units. Fish 10, 361–395. doi: 10.1111/j.1467-2979.2008.00324.x
Rivera, M. A. J., Andrews, K. R., Kobayashi, D. R., Wren, J. L. K., Kelley, C., Roderick, G. K., et al. (2011). Genetic analyses and simulations of larval dispersal reveal distinct populations and directional connectivity across the range of the Hawaiian grouper (Epinephelus quernus). J. Mar. Biol. 2011, 1–11. doi: 10.1155/2011/765353
Rousset, F. (2008). GENEPOP’007: a complete re-implementation of the GENEPOP software for Windows and Linux. Mol. Ecol. Resour. 8, 103–106. doi: 10.1111/j.1471-8286.2007.01931.x
Sadovy de Mitcheson, Y., Craig, M. T., Bertoncini, A. A., Carpenter, K. E., Cheung, W. L. L., et al. (2013). Fishing groupers towards extinction: a global assessment of threats and extinction risks in a billion dollar fishery. Fish 14, 119–136. doi: 10.1111/j.1467-2979.2011.00455.x
Sadovy, de Mitcheson, Y. S., and Erisman, B. (2012). “Fishery and biological implications of fishing spawning aggregations, and the social and economic importance of aggregating fishes,” in Reef Fish Spawning Aggregations: Biology, Research and Management, eds Y. Sadovy de Mitcheson, and P. L. Colin, (New York, NY: Springer), 225–284. doi: 10.1007/978-94-007-1980-4_8
Sadovy de Mitcheson, Y., and Colin, P.L. (eds). (2012). Reef Fish Spawning Aggregations: Biology, Research and Management. Fish and Fisheries, Vol. 35. New York, NY: Springer.
Selkoe, K. A., D’Aloia, C. C., Crandall, E. D., Iacchei, M., Liggins, L., Puritz, J. B., et al. (2016). A decade of seascape genetics: contributions to basic and applied marine connectivity. Mar. Ecol. Prog. Ser. 554, 1–19. doi: 10.3354/meps11792
Semmens, B. X., Luke, K. E., Bush, P. G., Pattengill-Semmens, C., Johnson, B., McCoy, C., et al. (2007). Investigating the reproductive migration and spatial ecology of Nassau grouper (Epinephelus striatus) on Little Cayman Island using acoustic tags — an overview. Proc. Gulf Caribb. Fish. Inst. 58, 199–206.
Sherman, K. D., Dahlgren, C. P., and Knowles, L. C. (2018a). Nassau Grouper (Epinephelus striatus) Conservation Management Plan for The Commonwealth of The Bahamas. Nassau: Prepared for the Department of Marine Resources.
Sherman, K. D., Dahlgren, C. P., Stevens, J. R., and Tyler, C. R. (2016). Integrating population biology into conservation management for endangered Nassau grouper Epinephelus striatus. Mar. Ecol. Prog. Ser. 554, 263–280. doi: 10.3354/meps11771
Sherman, K. D., King, R. A., Dahlgren, C. P., Simpson, S. D., Stevens, J. R., and Tyler, C. R. (2017). Historic and contemporary anthropogenic activities influence genetic population dynamics of Nassau grouper (Epinephelus striatus) within The Bahamas. Front. Mar. Sci. 4:393. doi: 10.3389/fmars.2017.00393
Sherman, K. D., Shultz, A. D., Dahlgren, C. P., Thomas, C., Brooks, E., Brooks, A., et al. (2018b). Contemporary and emerging fisheries in The Bahamas – conservation and management challenges, achievements and future directions. Fish. Manag. Ecol. 25, 319–331. doi: 10.1111/fme.12299
Shultz, A. D., Zuckerman, Z. C., Stewart, H. A., and Suski, C. D. (2014). Seasonal blood chemistry response of sub-tropical nearshore fishes to climate change. Conserv. Physiol. 2, 1–12. doi: 10.1093/conphys/cou028
Smith, C. L. (1972). A spawning aggregation of Nassau grouper, Epinephelus striatus (Bloch). Trans. Am. Fish. Soc. 101, 257–261. doi: 10.1577/1548-8659(1972)101<257:asaong>2.0.co;2
Smithers, L., Haddon, C., Jiang, Y.-J., and Lewis, J. (2000). Sequence and embryonic expression of deltaC in the zebrafish. Mech. Dev. 90, 119–123. doi: 10.1016/s0925-4773(99)00231-2
Starr, R. M., Sala, E., Ballesteros, E., and Zabala, M. (2007). Spatial dynamics of the Nassau grouper Epinephelus striatus in a Caribbean atoll. Mar. Ecol. Prog. Ser. 343, 239–249. doi: 10.3354/meps06897
Storey, J. D., and Tibshirani, R. (2003). Statistical significance for genome-wide studies. Proc. Natl. Acad. Sci. U.S.A. 100, 9440–9445.
Stump, K., Dahlgren, C. P., Sherman, K. D., and Knapp, C. R. (2017). Nassau grouper migrations during full moon suggest collapsed historic fish spawning aggregation and evidence of undocumented aggregation. Bull. Mar. Sci. 93, 375–389. doi: 10.5343/bms.2016.1042
Sunday, J. M., Calosi, P., Dupont, S., Munday, P. L., Stillman, J. H., and Reusch, T. B. H. (2014). Evolution in an acidifying ocean. Trends Ecol. Evol. 29, 117–125. doi: 10.1016/j.tree.2013.11.001
Thurstan, R. H., McClenachan, L., Crowder, L. B., Drew, J. A., Kittinger, J. N., Levin, P. S., et al. (2015). Filling historical data gaps to foster solutions in marine conservation. Ocean Coast. Manag. 115, 31–40. doi: 10.1016/j.ocecoaman.2015.04.019
Tine, M. (2017). Evidence of the complexity of gene expression analysis in fish wild populations. Int. J. Genomics 2017:1258396. doi: 10.1155/2017/1258396
Tyberghein, L., Verbruggan, H., Pauly, K., Troupin, C., Mineur, F., and De Clerck, O. (2012). Bio-ORACLE: a global environmental dataset for marine species distribution modelling. Glob. Ecol. Biogeogr. 21, 272–281. doi: 10.1111/j.1466-8238.2011.00656.x
Vidal, O., and García-Marín, J. L. (2011). Ecological genetics of freshwater fish: a short review of the genotype–phenotype connection. Anim. Biodivers. Conserv. 34:2, 309–317.
Weir, B. S., and Cockerham, C. C. (1984). Estimating F-statistics for the analysis of population structure. Evolution 38, 1358–1370. doi: 10.1111/j.1558-5646.1984.tb05657.x
Whaylen, L., Pattengill-Semmens, C. V., Semmens, B. X., Bush, P. G., and Boardmand, M. R. (2004). Observations of a Nassau grouper, Epinephelus striatus, spawning aggregation site in Little Cayman, Cayman Islands, including multispecies spawning information. Environ. Biol. Fish. 70, 305–313. doi: 10.1073/pnas.1917132117
White, J. W. (2015). Marine reserve design theory for species with ontogenetic migration. Biol. Lett. 11:20140511. doi: 10.1098/rsbl.2014.0511
Whiteley, A. R., Bhat, A., Martins, E. P., Mayden, R. L., Arunachalam, M., Uusi-HeikkilÄ, S., et al. (2011). Population genomics of wild and laboratory zebrafish (Danio rerio). Mol. Ecol. 20, 4259–4276. doi: 10.1111/j.1365-294x.2011.05272.x
Keywords: environmental association tests, fish spawning aggregation, groupers, migration, population genomics, selection, single nucleotide polymorphisms, telemetry
Citation: Sherman KD, Paris JR, King RA, Moore KA, Dahlgren CP, Knowles LC, Stump K, Tyler CR and Stevens JR (2020) RAD-Seq Analysis and in situ Monitoring of Nassau Grouper Reveal Fine-Scale Population Structure and Origins of Aggregating Fish. Front. Mar. Sci. 7:157. doi: 10.3389/fmars.2020.00157
Received: 06 October 2019; Accepted: 28 February 2020;
Published: 19 March 2020.
Edited by:
Romuald Lipcius, College of William & Mary, United StatesReviewed by:
Kathleen Sullivan Sealey, University of Miami, United StatesScott Heppell, Oregon State University, United States
Copyright © 2020 Sherman, Paris, King, Moore, Dahlgren, Knowles, Stump, Tyler and Stevens. This is an open-access article distributed under the terms of the Creative Commons Attribution License (CC BY). The use, distribution or reproduction in other forums is permitted, provided the original author(s) and the copyright owner(s) are credited and that the original publication in this journal is cited, in accordance with accepted academic practice. No use, distribution or reproduction is permitted which does not comply with these terms.
*Correspondence: Krista D. Sherman, a3Jpc3RhLnNoZXJtYW5AcGVycnlpbnN0aXR1dGUub3Jn