 Craig R. McClain
 Thomas J. Webb
 Clifton C. Nunnally
 S. River Dixon
 Seth Finnegan4
 James A. Nelson
- 1Louisiana Universities Marine Consortium (LUMCON), Chauvin, LA, United States
- 2Department of Animal and Plant Sciences, University of Sheffield, Sheffield, United Kingdom
- 3Department of Biology, University of Louisiana- Lafayette, Lafayette, LA, United States
- 4Department of Integrative Biology, University of California, Berkeley, Berkeley, CA, United States
The great anthropogenic alterations occurring to carbon availability in the oceans necessitate an understanding of the energy requirements of species and how changes in energy availability may impact biodiversity. The deep-sea floor is characterized naturally by extremely low availability of chemical energy and is particularly vulnerable to changes in carbon flux from surface waters. Because the energetic requirements of organisms impact nearly every aspect of their ecology and evolution, we hypothesize that species are adapted to specific levels of carbon availability and occupy a particular metabolic niche. We test this hypothesis in deep-sea, benthic invertebrates specifically examining how energetic demand, axes of the metabolic niche, and geographic range size vary over gradients of chemical energy availability. We find that benthic invertebrates with higher energetic expenditures, and ecologies associated with high energy demand, are located in areas with higher chemical energy availability. In addition, we find that range size and location of deep-sea, benthic species is determined by geographic patterns in chemical energy availability. Our findings indicate that species may be adapted to specific energy regimes, and the metabolic niche can potentially link scales from individuals to ecosystems as well as adaptation to patterns in biogeography and biodiversity.
Introduction
As demonstrated by several environmental indicators anthropogenic impacts on the environment continue to exhibit a long-term, post-industrial rise (Steffen et al., 2015). This human induced environmental degradation has led to significant declines in global biodiversity including increasing numbers of endangered species and decreasing abundances of key taxa (Lotze et al., 2006; Butchart et al., 2010). Alarmingly, this decline of species diversity in response to climate change is a factor of four greater in marine systems as compared to terrestrial systems (Blowes et al., 2018). Much research has been dedicated to alterations of the marine environment as a function of several key parameters – including temperature, acidification, oxygen, and pollution – and how these have and will impact marine communities (Kennish, 1997; Harley et al., 2006; Vaquer-Sunyer and Duarte, 2008; Kordas et al., 2011; Doney et al., 2012). Much less research exists in characterizing how marine ecosystems will respond to the immense anthropogenic alterations to carbon cycling and availability, especially in the deep oceans, the largest habitat on Earth and the key in long-term sequestration of carbon.
We propose an eco-evolutionary adaptive theory of the metabolic niche (Wilson et al., 2011) where species are adapted to specific energy regimes which scale with biodiversity patterns. We hypothesize that the species observed in a locality are dependent on the energy content of that habitat. Here, we develop this hypothesis through a series of 10 linked propositions, from first principles of metabolic ecology through to biogeographic patterns in metabolic adaptation. For each of these propositions, we review current support and theory from a general eco-evolutionary viewpoint and specifically with a deep-sea perspective. The deep-sea benthos provides an ideal test system for metabolic hypotheses because the system is productivity limited, experiences little temperature variation, and has documented clines over productivity gradients (Gage and Tyler, 1991; Tittensor et al., 2011; McClain et al., 2012a; McClain and Barry, 2014; Woolley et al., 2016). The deep seafloor, which encompasses depths below 200 m, covers most of Earth and is an especially energy-deprived system (Gage and Tyler, 1991). Primary production is virtually absent in these dark depths. The carbon that sustains most deep-sea seafloor life is sequestered from sinking particulate organic carbon (POC) derived from primary production in the euphotic zone (Gage and Tyler, 1991). However, temperature is relatively constant over the deep seafloor varying between -1 and 4°C (Gage and Tyler, 1991), allowing us to examine the role of productivity largely independent of the role of temperature. Previous studies have also demonstrated that biodiversity patterns in the deep ocean are controlled primarily by productivity with a weaker or non-existent effect of temperature (Tittensor et al., 2011; McClain et al., 2012a; McClain and Barry, 2014; Woolley et al., 2016). For many of the propositions, we bring new data from deep-sea, benthic invertebrates to bear to quantify and specifically test the hypotheses.
Proposition 1: Life Requires Energy
Premise
Energy is the currency of life, intrinsically linked to ecological (Brown et al., 2004) and evolutionary (Van Valen, 1976; Bambach, 1993) processes and driving fitness through growth, maintenance, and reproduction (Van Valen, 1976). Four basic forms of energy affect biological systems – photosynthetically active radiation; thermal kinetic energy as indexed by temperature; mechanical energy in the form of movement of air, water, and earth; and chemical potential energy stored in reduced carbon compounds (Denny, 1999; Clarke and Gaston, 2006) – encompassing the fundamental axes which together form an organism’s energetic niche.
Metabolic rate is the rate of chemical energy uptake, transformation, and allocation (Brown et al., 2004). In heterotrophs, this energy is obtained by oxidizing carbon compounds; the respiration rate of chemical energy is the metabolic rate (Brown et al., 2004). Thus, the energetic needs of an organism are its total organic carbon demand. We define carbon availability as the amount of organic carbon available for an organism to consume and in part can be viewed analogous to the more general term of food.
Here, we restrict our use of the term energy to chemical potential energy, or organic carbon, following the conventions of species-energy theory (Wright, 1983; Wright et al., 1993; Hurlbert, 2004, 2006). For terrestrial and shallow-water systems, productivity, e.g., net primary production, is often used as a metric for chemical energy. For the deep-sea benthos, organic carbon availability is often quantified as either POC flux or organic carbon in the sediment. Note that organic carbon may also arrive to the seafloor through large food parcels such as whale carcasses, macroalgae, jellyfish, and wood. However, these larger food falls are isolated and scarce both in time and space, due to the immense scale of ocean basins, so while they are locally important at certain times, background levels of organic carbon availability are more general drivers of deep-sea diversity. Promisingly, previous studies have demonstrated that macroecological patterns in the deep-sea benthos are highly correlated with POC flux (Tittensor et al., 2011; McClain et al., 2012a; McClain and Barry, 2014; Woolley et al., 2016). This suggests that POC represents a reasonable metric for understanding the chemical energy available to deep-sea benthic organisms.
Consequence
This basic requirement of energy can be quantified for each organism and potentially inform about biological patterns from the individual up to the ecosystem.
Proposition 2: Against a Backdrop of Global Change in Organic Carbon Availability, Understanding the Energetic Needs of Organisms is Vital
Premise
In the oceans, the combination of global phytoplankton production declines over century to decadal timescales (Behrenfeld et al., 2006; Boyce et al., 2010), with more varied responses at regional and local scales (Harding and Perry, 1997; Boyce et al., 2010; McQuatters-Gollop et al., 2011; Rousseaux and Gregg, 2015), indicates significant heterogeneity of anthropogenic impacts and a major reworking of carbon cycling. This alteration of organic carbon availability is predicted to increase with continued anthropogenic disturbance (Chust et al., 2014; Bryndum-Buchholz et al., 2019) potentially leading to 15–30% decreases in biomass in some ocean basins and 20–80% increases in others (Bryndum-Buchholz et al., 2019).
Consequence
The metabolic niche and its relationship to biodiversity is important because of these immense anthropogenic alterations to carbon cycling and availability. Against this backdrop of global change in organic carbon availability, understanding how organisms respond to a changing energetic environment is critical. Changing organic carbon availability can affect aggregate properties of ecological communities such as the number of individuals and species (Wright, 1983; Wright et al., 1993; Brown et al., 2004), but the extent to which species with different carbon requirements and adaptations will vary in their responses to a novel energetic environment is not well known. This has consequences for how we expect ecological communities to be structured, and for predicting winners and losers as we progress into the Anthropocene.
Proposition 3: the Deep-Sea Benthos Is Particularly Vulnerable to Alterations in Organic Carbon Availability
Premise
As previously stated, below 200 m the oceans are chemical energy-deprived systems (Gage and Tyler, 1991; McClain et al., 2012a), with deep-sea floor communities reliant on primary production occurring in surface waters sinking in the form of POC (Gage and Tyler, 1991). This supply of chemical energy to the benthos varies as a function of depth because of remineralization and surface primary production, also often decreasing with distance from productive coastal regions (Gage and Tyler, 1991). On the abyssal plains, one of the largest habitats on Earth, with an average depth of 4.4 km, the downward flux of POC represents less than 1% of surface production (Lampitt and Anita, 1997) resulting in an extremely food-limited environment, albeit one with considerable energetic patchiness at a range of spatial scales. The decrease in environmental energy availability is mirrored by substantial decreases in biomass and abundance with depth (often used as a proxy for total energy availability) in benthic faunal groups ranging from bacteria to large mobile fish and invertebrates (Rex et al., 2006; Wei et al., 2010b; McClain et al., 2012a).
Consequence
Nearly every aspect of deep-sea benthic ecology and evolution is driven by this flux of carbon from the sea surface (Smith et al., 2008), and “[t]he presence and persistence of life itself on the ocean-floor can be viewed as a response to organic inputs” (Gooday, 2002). In contrast to shallower ecosystems (Tittensor et al., 2010), deep-sea diversity is primarily driven by patterns of chemical energy and not by other forms of energy such as thermal energy, indexed by temperature (Woolley et al., 2016). As noted by Smith et al. (2008) “Many aspects of ecosystem structure and function in the abyss are strongly modulated by the rate and nature of food flux to the seafloor. Climate change and human activities will alter patterns of sinking food flux to the deep ocean, substantially impacting the structure, function and biodiversity of abyssal ecosystems.”
Proposition 4: Substantial Variation Exists in Metabolic Need, I.E., Energetic Needs, Across Taxa Even After Accounting for Temperature and Body Size
Premise
Under the Metabolic Theory of Ecology (MTE) (Brown et al., 2004), energy is an allocated resource translated into work and mass and further allocated into the fitness-enhancing processes of survival, growth, and reproduction. The energy demand, i.e., the metabolic niche, of an organism in the MTE is largely set by first principles governing the distribution of materials and temperature-related kinetics as indexed by temperature and body size (Gillooly et al., 2001). Metabolic rate can be described by the power-law relationship between organismal size, temperature, and metabolic rate:
where B is the metabolic rate, β0 is a normalizing constant, M is mass, b is the scaling coefficient, T is temperature, E the activation energy of the respiratory complex, and k is Boltzmann’s constant (Gillooly et al., 2001). Substantial variation–at least 1–2 orders of magnitude–exists in metabolic rates even when standardized for organismal mass and temperature (Glazier, 2005) even among deep-sea organisms (McClain et al., 2012a).
Data and Analysis
We analyze the global dataset of Brey et al. (2010) on relationships between mass, elemental composition and energy content for marine invertebrates to quantify the relationship between mass and respiration rate. We limited the dataset to include only benthic, marine, adult measurements. This includes data for 13,478 individuals from 444 species, 336 genera, 46 orders, 29 classes, and 14 phyla ranging in depths from 1 to 4,420 meters. Complete details on the construction of the database can be found in Brey et al. (2010). Original respiration and mass data from the literature included a wide array of measurement units. All of these were converted into respiration into the energy unit of Joules per day and all masses were converted from dry, ash free dry, wet, or carbon content into Joules. From the database, we analyze log10 of respiration rate (J) as a function of log10 of mass (J) and the inverse of temperature (°K) using a linear model in R Package (R Development Core Team, 2019). The general relationship was visualized utilizing ggplot (Wickham, 2009). Residuals from the linear model were further analyzed with ANOVA to test for significant differences in the residuals among taxa. Residuals were visualized with ggridges (Wilke, 2018). We then test whether different phyla vary in their typical departure from this relationship by testing for significant differences in the residuals between phyla using ANOVA.
Consequence
Respiration rate is strongly and positively related to mass (Figure 1, p < 0.0001) across the 13,478 marine invertebrate individuals in our dataset. Even after correcting for mass and temperature, metabolic rate residuals exhibit considerable variation (Figures 1, 2). Moreover, this variation is in part related to ecological and evolutionary differences in higher level taxa (Figure 2, ANOVA: p < 0.0001, R2 = 0.24). This implies that the energetic need of organisms is set by factors beyond the first principles of distribution of materials and temperature-related kinetics (Gillooly et al., 2001). We thus propose an adaptive model of the metabolic niche where species are adapted to specific energy regimes to explain this residual variation.
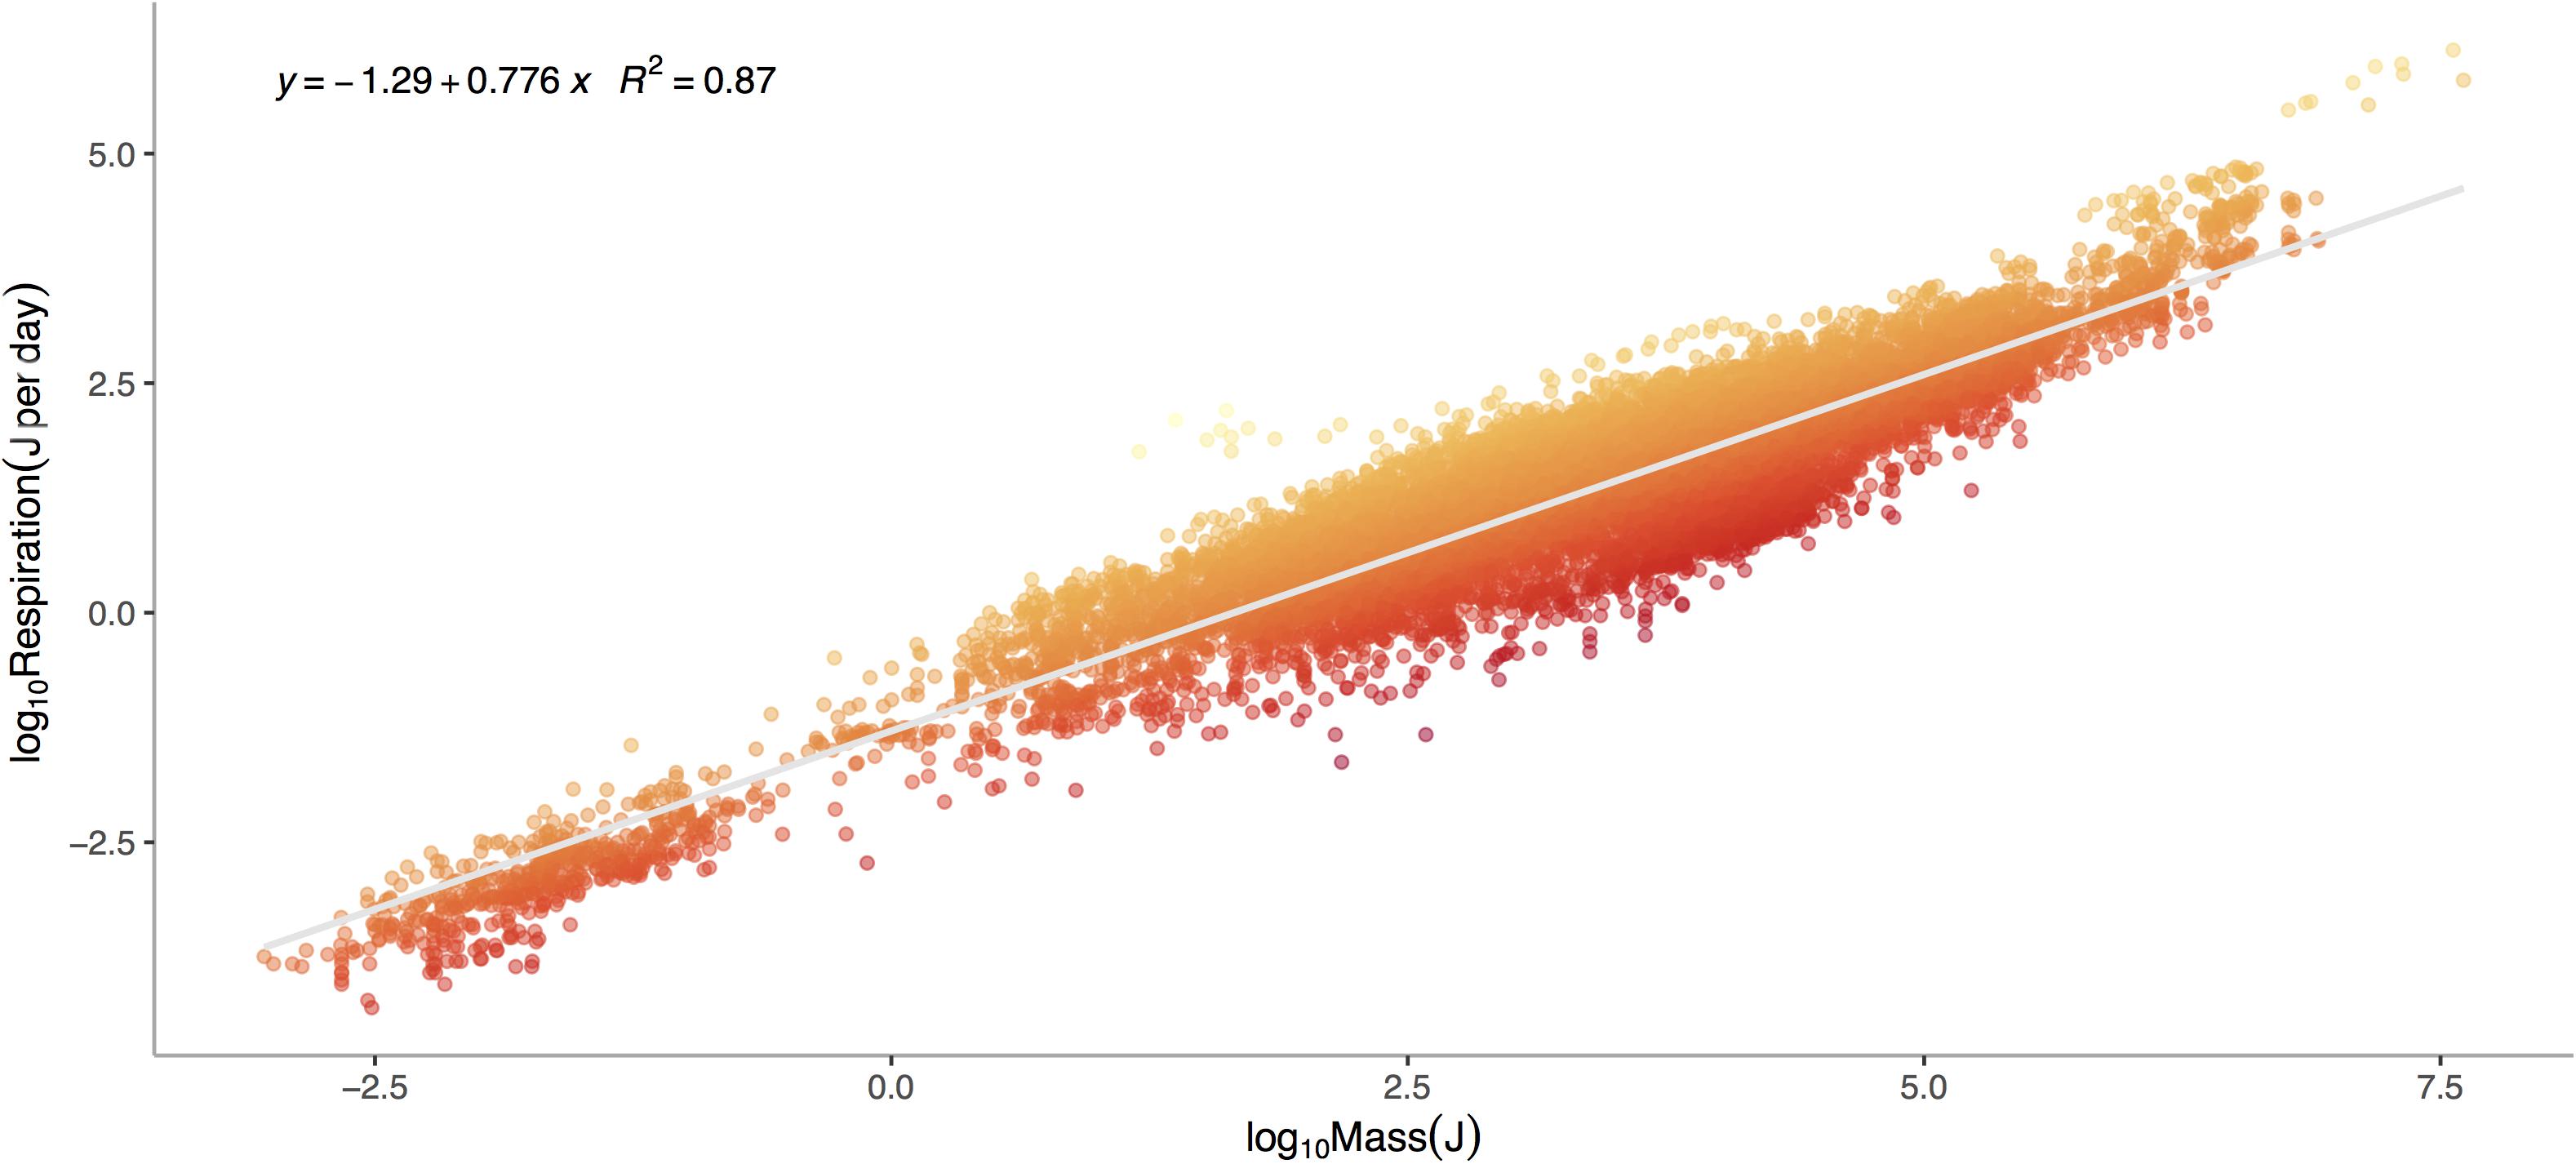
Figure 1. Log10 Metabolic Rate (Joules per Day) verses Log10 Mass (Joules) for marine invertebrates. Data represent a global database from Brey et al. (2010) on relationships between mass, elemental composition and energy content for marine invertebrates. This includes data for 13,478 individuals from 444 species, 336 genera, 46 orders, 29 classes, and 14 phyla ranging in depths from 1 to 4,420 meters. Colors denote large negative (red) to large positive (orange) residuals of the relationship between respiration and mass.
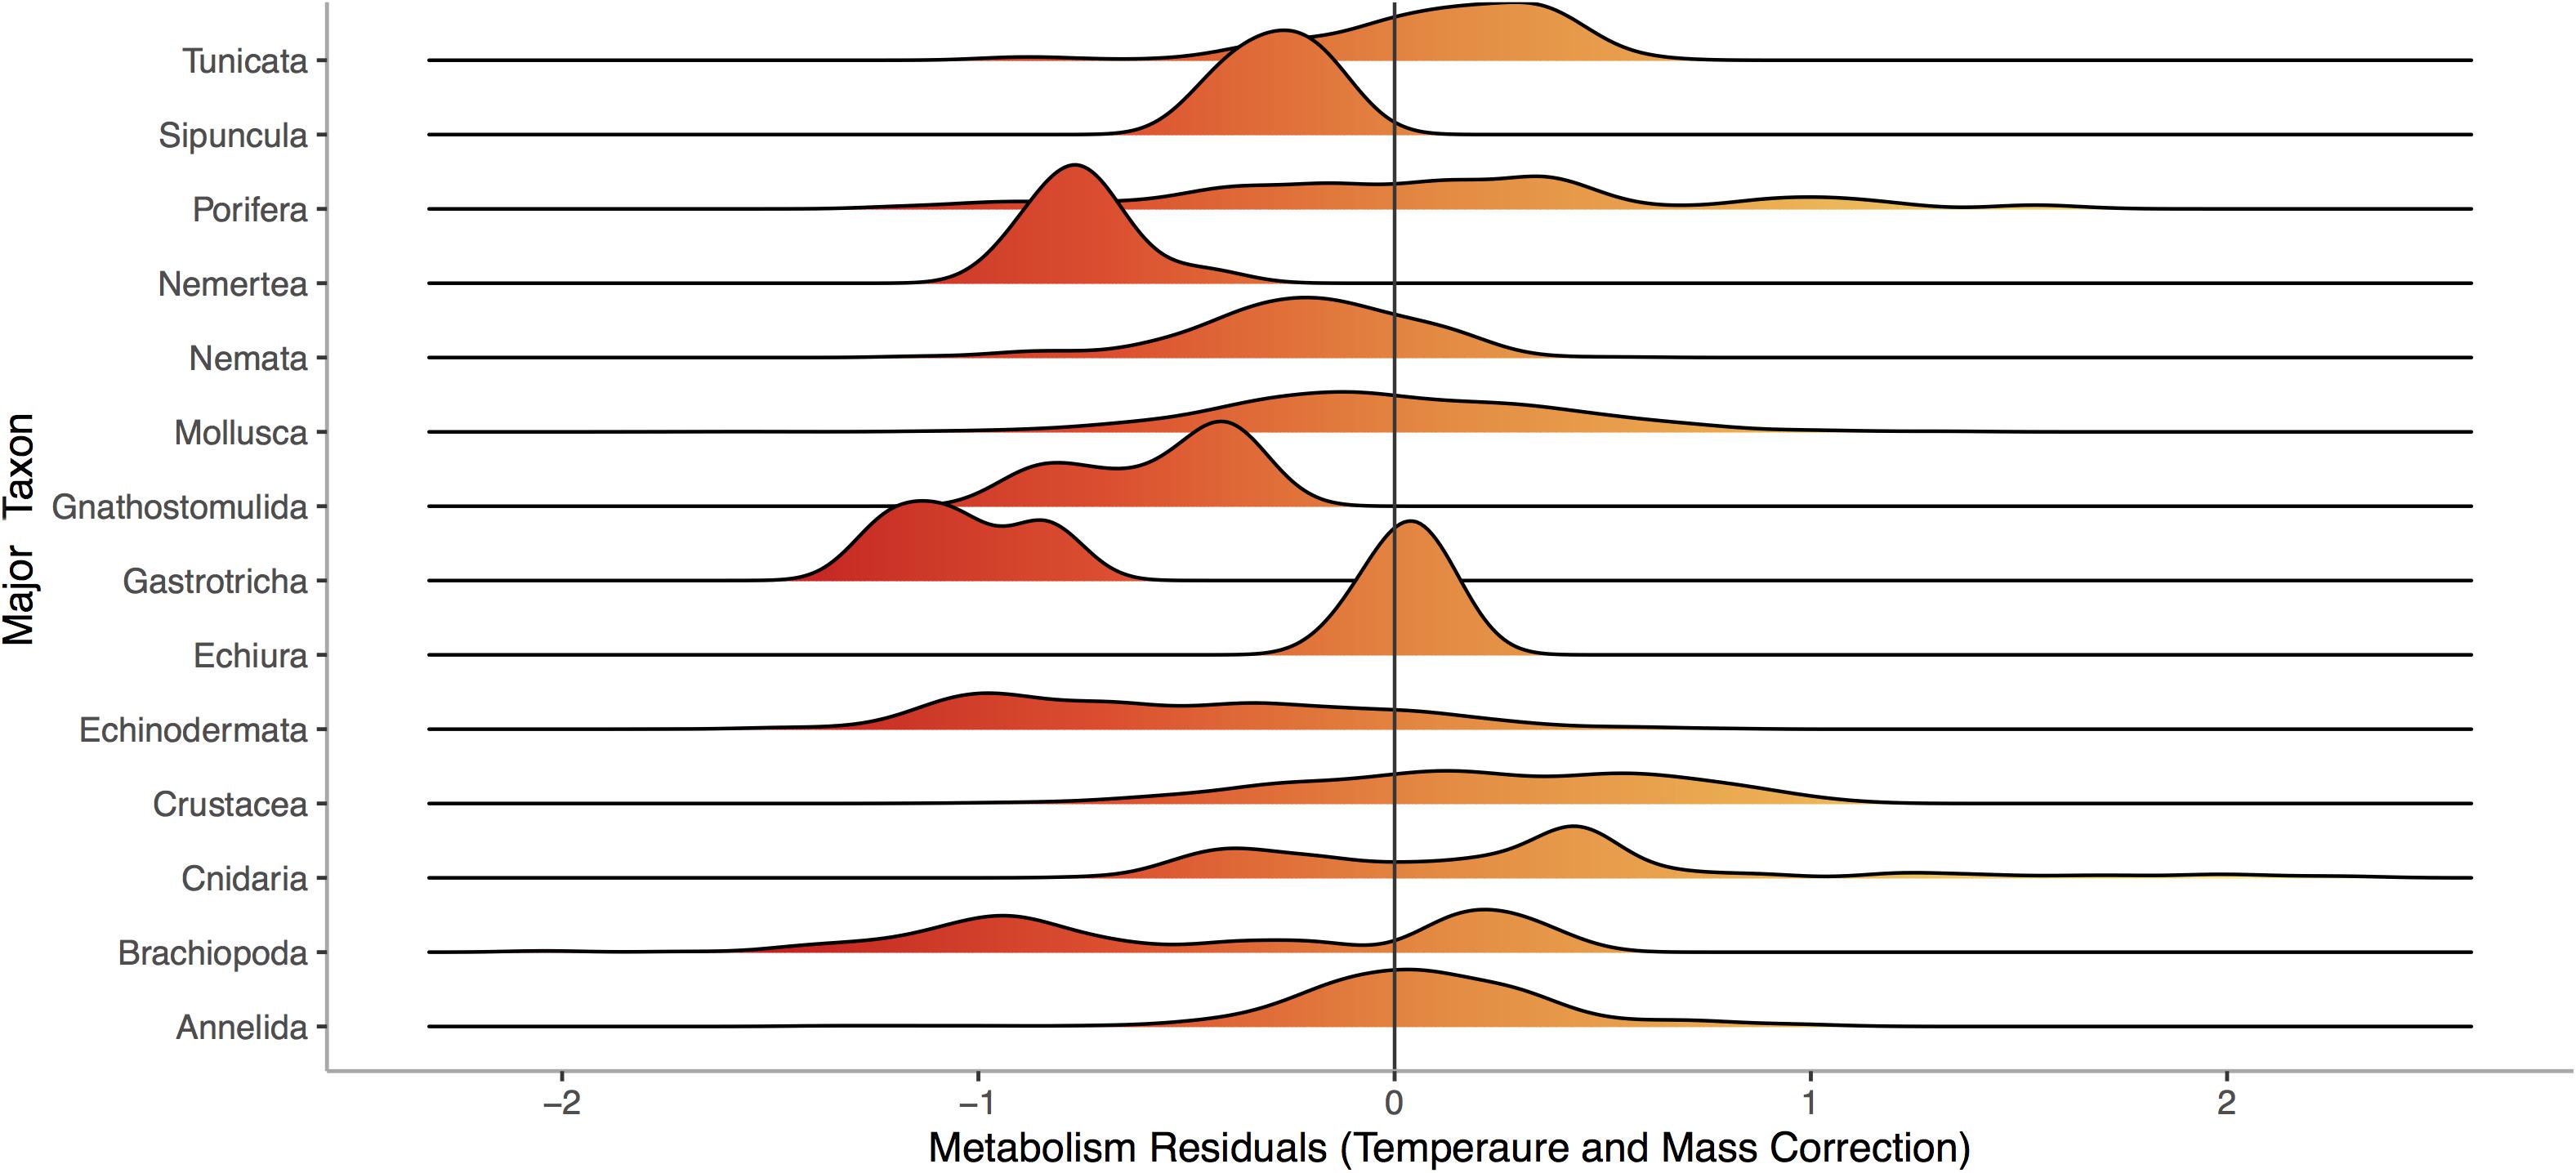
Figure 2. Distribution of residuals for each of 14 phyla from a model fitting Log10 Metabolic Rate (Joules per Day) as a function of Log10 Mass (Joules) and 1/Temperature (°K), using data from the same 13,478 individuals from 444 species shown in Figure 1. Colors denote large negative (red) to large positive (orange) residuals of the relationship between respiration and mass.
Proposition 5: This Variation in Metabolic Need Is Adaptive, I.E., Species Have a Metabolic Niche
Premise
The metabolic niche represents a series of energetic tradeoffs within an organism that sets overall metabolic need, and is comprised of axes that govern the anatomy, physiology, and behaviors of an organism that increase or decrease these energetic costs. Under this model, we propose that species occur on a continuum of energetic need, from “high-energy taxa” (HET) to “low-energy taxa” (LET), and are thus adapted specifically for temporally and spatially varying levels of carbon availability.
Consequence
This variation in energetic need spans evolution across the tree of life (Uyeda et al., 2017). Major clades of vertebrates exhibit significant differences in scaling, suggesting fundamental evolutionary shifts in the adaptation of metabolic need (Uyeda et al., 2017), and comparative studies have revealed other generalities too, e.g., between endotherms and ectotherms (Nagy, 1987), trophic levels (Carbone et al., 2007), passerines and non-passerines (McNab, 2016), foraging (Childress, 1995), locomotory (Voight and Speakman, 2007; Shen et al., 2010) and predator avoidance strategies (McNab, 1986). Overall, this variation suggests that metabolic rates, while in part controlled by first-order principles, vary considerably within and across clades (Makarieva et al., 2008), and that this reflects trade-offs in energetic demand. Importantly, the links between metabolic rates and well-studied ecological traits or other well-understood mechanisms could be generalized to set up testable predictions in other groups and environmental settings.
Proposition 6: a Relationship Exists Between Environmental Availability of Carbon and Metabolic Niche
Premise
Given this variation in energy needs across the tree of life, we might also expect to observe a relationship between the environmental availability of carbon and the metabolic niche. However, previous research indicates that temperature- and mass-corrected basal metabolic rates do not appear to vary over carbon gradients (Childress, 1995). One possibility to reconcile our theory with this finding would be if basal metabolic rates themselves, as the lowest basic need of organism, were governed by fundamental first principles (Brown et al., 2004) and evolutionarily conserved. In this scenario, field metabolic rates or active metabolic rates indicating work and fitness beyond maintenance may more strongly map onto environmental availability of carbon.
Alternatively, total metabolic demand, accounting for differences in organismal mass, may vary with carbon availability, even if per unit mass metabolic rates do not. To restate, the primary ecological and evolutionary energetic response of species to changes in carbon availability is alterations in body size. Indeed, reductions in body size, and thus total metabolic demand, with declining POC are well documented in the deep sea (Thiel, 1975, 1979; Rex et al., 2006; Wei et al., 2010a; McClain et al., 2012b).
Data and Analysis
Allen (2008) compiled and taxonomically standardized bivalve data from samples collected with an epibenthic sledge during research cruises from 1962 to 1979. The dataset includes 204,068 individuals representing 527 bivalve species from 11 basins and 255 sites ranging in depth from 68 to 5875 m (McClain et al., 2012c). Species-level maximum body size (biovolume) was collected from the literature and biovolume was calculated as length∗width2 (details can be found in McClain et al., 2012b). Intraspecific variation in biovolume is much less than interspecific variation and the choice of using median or maximum body size in mollusks is unlikely to mask ecological patterns (McClain, 2004). Biovolume was converted to wet weight utilizing the conversions in Powell and Stanton (1985). Utilizing published scaling equations for bivalve families and orders (Vladimirova et al., 2003), we calculated metabolic rate (mW). Body size data was not available for all species, reducing the final analyzed dataset down to 475 bivalve species. We estimated POC flux (gC/m2/yr) from Lutz et al. (2007) for each site. For each species, we calculated the mean POC across all station occurrences for that species. The Lutz et al. (2007) study uses empirically derived sediment trap POC flux estimates compared to remotely sensed estimates of net primary production and sea surface temperature. These data were used to develop an algorithm with coefficients predicting annual POC flux at a given depth from remotely sensed data. We analyzed the log10 of respiration rate (mW) as a function of log10 of POC flux and using a linear model in R Development Core Team (2019). The general relationship was visualized utilizing ggplot (Wickham, 2009).
Consequence
POC is a significant predictor of total bivalve metabolism (p < 0.0001) among 475 deep-sea bivalve species across the Atlantic Ocean (Figure 3). The intercepts (p < 0.0001) but not the slopes (p = 0.0627) of this relationship vary among bivalve orders. These results suggest that a species’ total energetic demand, as set by body size, is concordant with energy available in the environment. Additional evolutionary history and ecology associated with higher taxonomic levels also sets additional energetic needs. Thus while body size is a major axis of the metabolic niche, different intrinsic factors of taxa define the other axes.
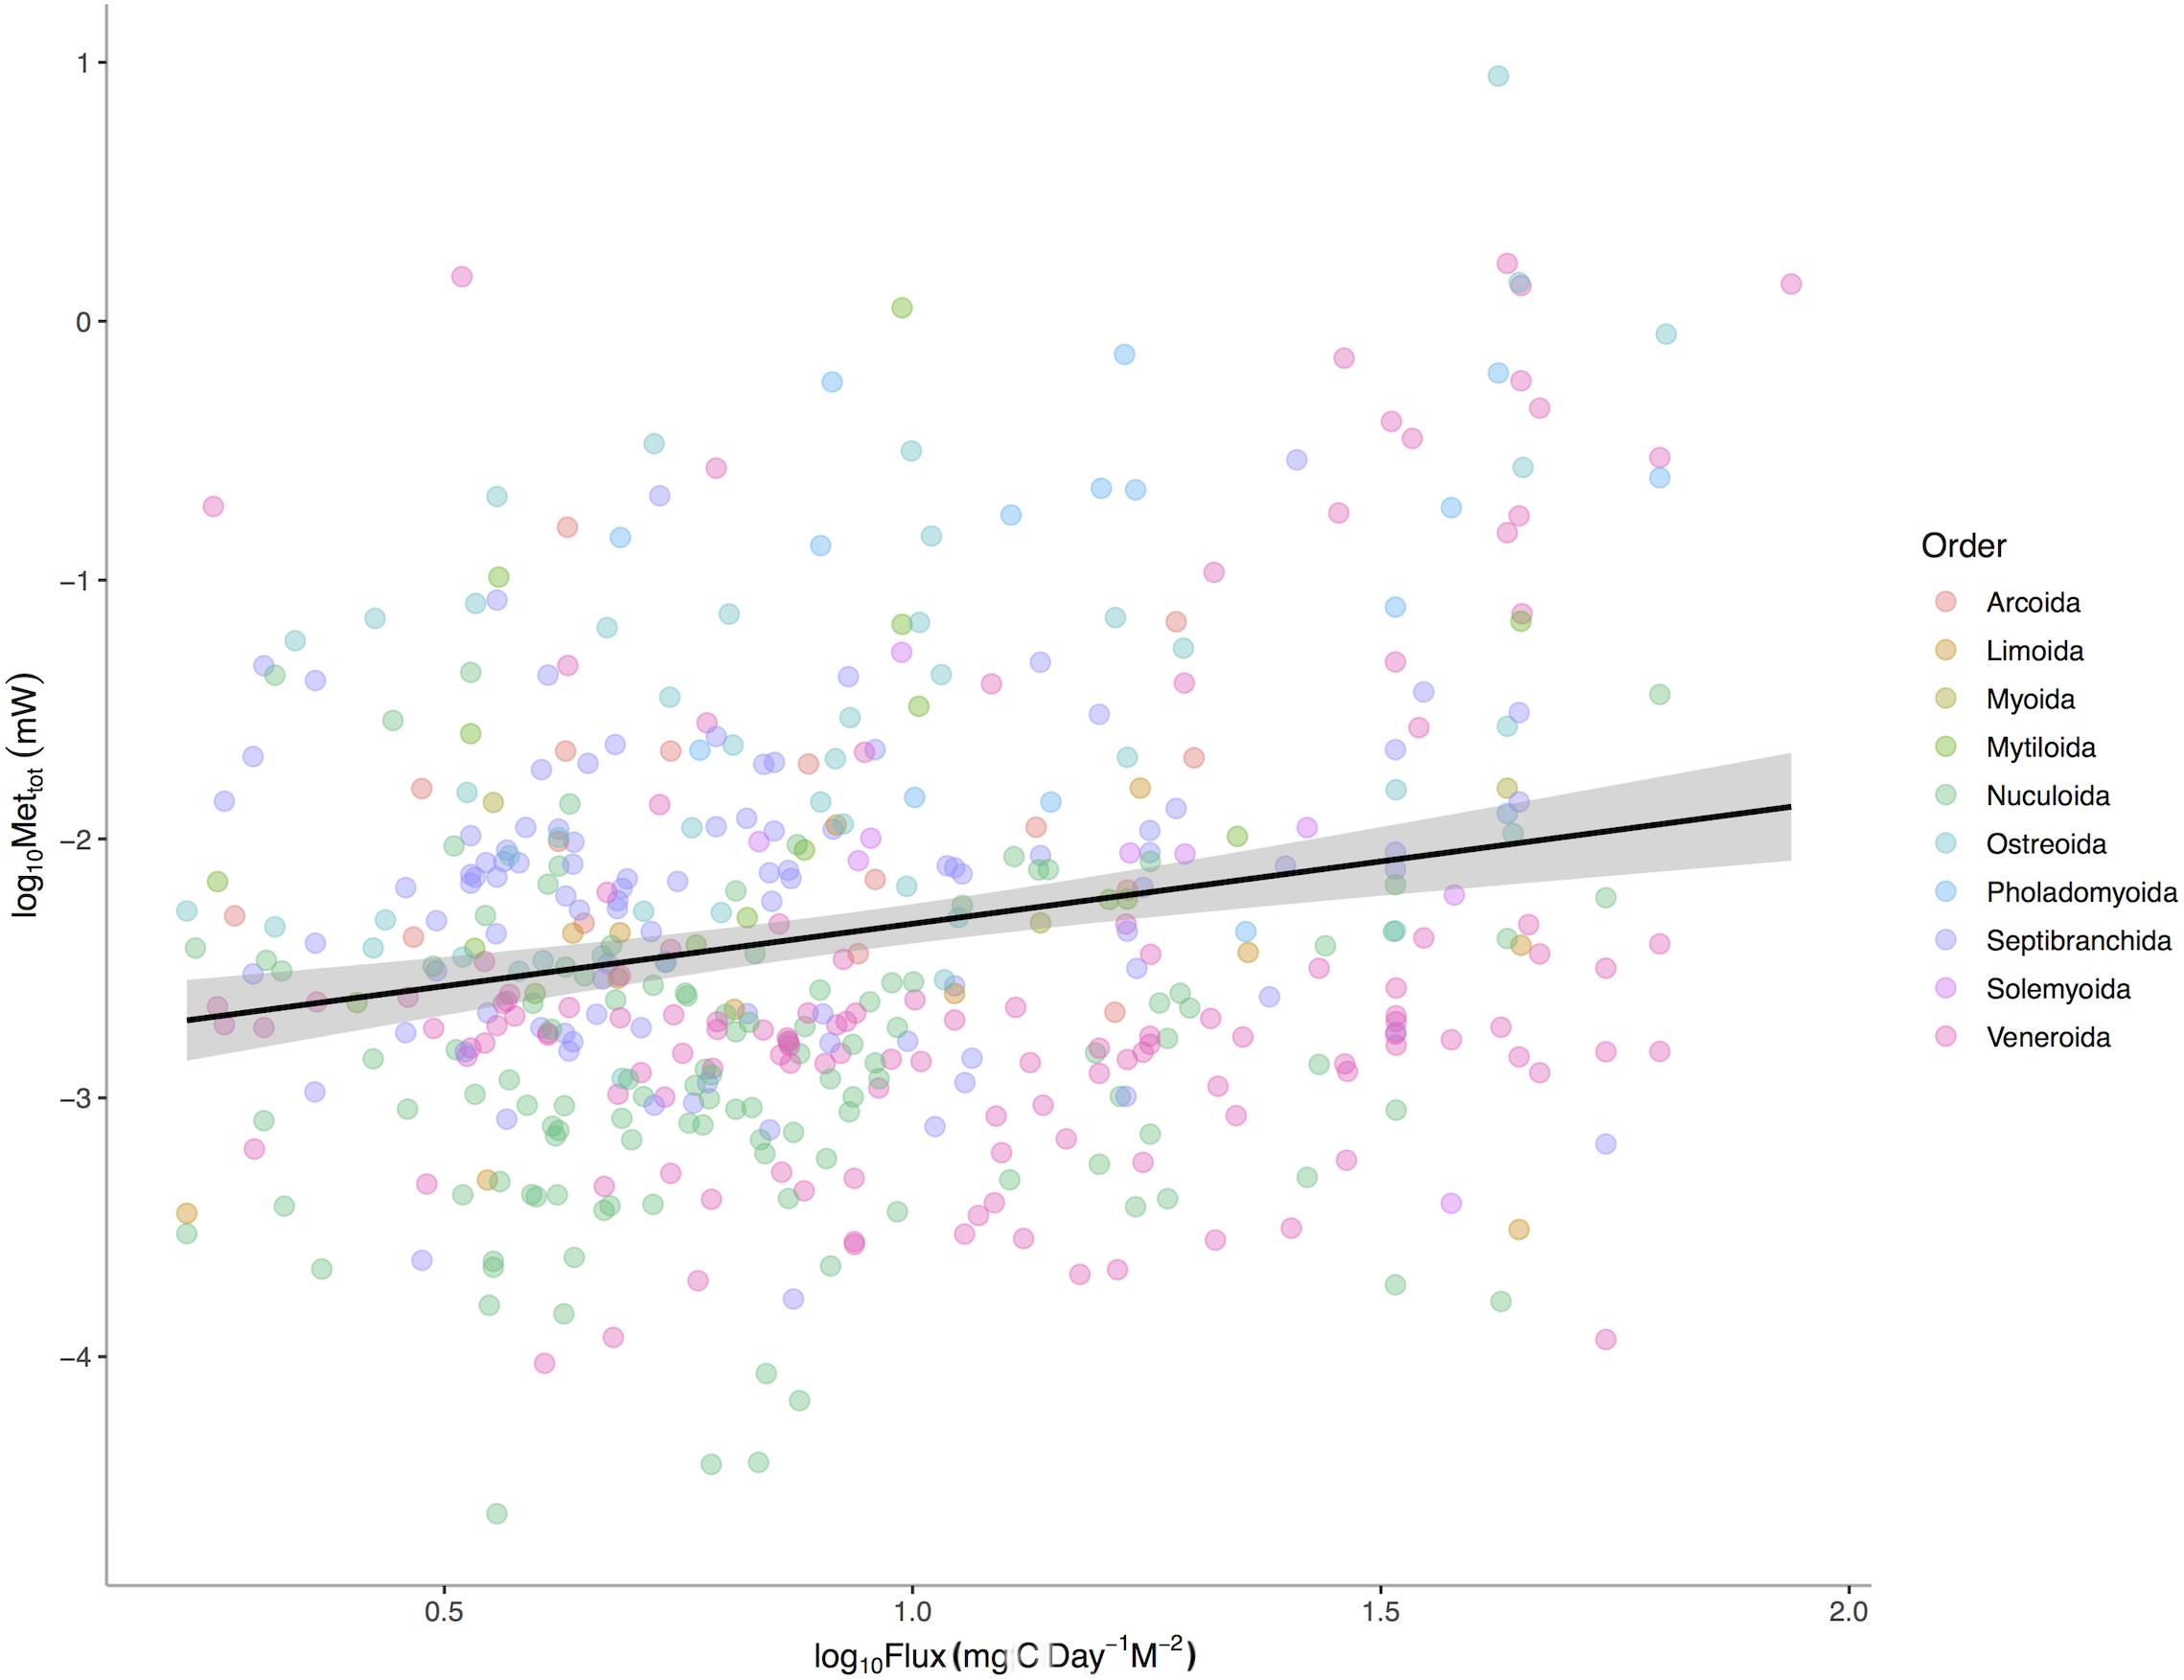
Figure 3. Log10 Maximum Metabolic Rate (mW) verses Log10 Mean Standardized Carbon Flux (gC m– 2 d– 1) for 475 species of deep-sea bivalves across the Atlantic Ocean. Black line represents linear regression for all species and gray area represents the 95% confidence interval around the linear fit.
Proposition 7: the Metabolic Niche Is the Sum of a Series of Energetic Tradeoffs, Thus the Representation of Ecological Traits, as Set by Their Metabolic Requirements, Should Vary With Environmental Availability of Carbon
Premise
Energetic niche axes can be defined as specific functional traits that dictate overall energetic demand. Thus, quantifying the underlying functional traits and tradeoffs that impact the balance between metabolic intake and demand can be used to define the energetic niche. We can quantify these functional trait tradeoffs and begin to identify the traits of HET and LET, by either exploring how they impact metabolic demand or exploring how functional traits vary over a carbon energy gradient.
We know that energy demand is impacted by the functional traits of the organisms. For example, metabolic rates are higher in endotherms due to the increased costs of maintaining homeostasis (Nagy, 1987). Metabolic rates increase with increasing trophic level (McNab, 1986; Nagy, 1987) in vertebrates (Carbone et al., 2007) and invertebrates (Vladimirova, 2001; Vladimirova et al., 2003) alike, potentially reflecting the increased need for locomotor capacity and range to capture and search for resources at lower densities for carnivores versus herbivores (Tamburello et al., 2015). In the deep sea, temperature- and mass-corrected metabolic rates among species decline with depth in pelagic fish and crustaceans because the attenuation of light leads to a switch from visual-base foraging and a subsequent decline in need for locomotor capacity (Childress, 1995). Prior research indicates that at broad levels, physiological and trophic adaptations lead to a LET to HET spectrum.
A number of traits are known to co-vary with spatial clines in carbon availability. Metabolically expensive morphological characteristics, such as the production and maintenance of complex shells (McClain et al., 2004; McClain, 2005), may be precluded in low energy environments. The environmental energy availability is also reflected in the trophic niches with, for example, suspension feeders and specialist carnivores declining in importance with decreasing carbon availability (Sokolova, 1960; Gage and Tyler, 1991). In some circumstances, lower carbon availability and resource competition may drive species to exploit and specialize on new carbon resources (Sanders, 1977), as observed in deep-sea polychetes (Jumars et al., 1990) and, anecdotally, in the occurrence of wood- and bone-eating deep-sea specialists (Turner, 1973; Rouse et al., 2004; Johnson et al., 2010). In general, as carbon availability increases, so too does the prevalence of direct development, while the prevalence of planktonic larval stages decreases (McClain et al., 2014). These findings suggest that some reproductive strategies are too energetically expensive at low carbon availabilities, or arise only when energy is available, and thus may be restricted to HET.
Data and Analysis
Methods and data are from McClain et al. (2018). Data, including carbon flux, were originally taken from McClain et al. (2012b). In brief, data on the taxonomy, maximum and minimum water depth in meters, maximum and minimum longitude, and maximum and minimum latitude were compiled for bivalves in the Northeast Pacific and Northwest Atlantic through an extensive search of the primary literature and online databases. The final dataset includes complete information for 1578 species from 75 families.
Over each species’ biogeographic range, we estimated POC flux (gC/m2/yr) from Lutz et al. (2007) model (equal-area grid of 9 km resolution) as described above. These values were previously determined as part of another study (McClain et al., 2012b). For each species, McClain et al. (2012b) quantified the mean, median, and standard deviation of carbon flux over their known latitudinal and depth ranges. For the analyses here, we used mean carbon flux only as mean and median fluxes are highly correlated (Spearman’s rho = 0.94, p < 0.0001). We created a range map for each species based on its latitudinal range. This range map was then overlain onto a bathymetry layer (GEBCO 08, 30 arc-second grid, September 2010 release)1 and cropped to regions between the minimum and maximum reported depth. We assumed a species’ range represents an elongated band with North/South limits set by maximum and minimum reported latitude. East/West limits were set by depth, instead of longitude, because North American coasts run approximately south to north with species occurring in depth bands along the continental margins. POC flux values were pulled for each cell within a species’ biogeographic range as defined minimum and maximum latitude and depth.
We classified species according to a framework for ecological modes that is based on the first principles of functional morphology and developed by Bambach et al. (2007) and Bush et al. (2007). The ecological mode of a species is defined by three axes: tiering, motility, and feeding. Each axis consists of six categorical states. The tiering axis consists of pelagic, erect, surficial, semi-infaunal, shallow infaunal, and deep infaunal. The motility axis consists of freely motile/fast; freely motile/slow; facultatively motile/unattached; facultatively motile/attached; non-motile/unattached; and non-motile/attached. The feeding axis consists of suspension feeding, surficial deposit feeding, mining, grazing, predatory, and other (for feeding strategies that do not fit into the previous five feeding modes). Bush et al. (2007) provide a full description of this ecospace model. Ecological mode assignments were made at the genus level. Huber (2010) describes the life habits of individual bivalve families, and in the cases where genera within families are known to differ from one another, notes which genera differ and how they differ from other genera in the family. All ecological assignments were based on the life habits of the adult form. In the exceedingly rare cases where a genus occupied more than one ecological category for a given axis as an adult, the single ecological category that describes the majority of species in the genus was chosen. For the modern bivalve range dataset, we were able to assign ecological modes to 1,477 of 1,578 species by matching species to genera.
We conducted a correlation analysis of mean POC fluxes among ecological modes, to elucidate which modes were associated with HET and LET, comparing the mean POC values determined with the Atlantic data to those determined with the Pacific data using Spearman’s rho statistic to estimate a rank-based measure of association. This allowed us to examine whether high-energy or low-energy ecological modes were consistently found in high- or low-energy settings using independent lists of species and independent ocean basins. We also tested whether the representation of ecological modes differs between the overall higher productivity Pacific Ocean and lower productivity Atlantic Ocean. For the Atlantic and Pacific oceans separately, we calculated the proportion of each species within each ecological mode. We then calculated the difference in the proportion of species within each ecological mode between the Atlantic and Pacific oceans and compare that to the mean carbon flux of the ecological mode. We predict that ecological modes more strongly tied to higher POC fluxes will occur at higher proportions in the Pacific compared to the Atlantic Ocean due to the overall higher productivity in the Pacific. We tested this relationship using a general linear regression model with mean POC flux of the ecological mode as the independent and the Atlantic/Pacific ratio of the proportion of species as the dependent variable. Linear models were performed in R Development Core Team (2019). The general relationship was visualized utilizing ggplot (Wickham, 2009).
Consequence
Ecological niche axes in modern bivalves over oceanic scales are correlated with the available environmental energy (McClain et al., 2018; Figures 4, 5). More specifically, the basic functional traits of feeding mode, tiering level, and motility level are associated with their relative prevalence in low- or high-energy settings (McClain et al., 2018). The strong consistency between the rank orders of ecological modes based on carbon flux between the Atlantic and Pacific Oceans, observed across independent lists of endemic species, implies that the association between ecological mode and carbon flux is also not an artifact of indirect connections but, rather, a fundamental aspect of these ecological modes (Figure 4). Ecological differences among ocean basins, correlated with differences in POC, provide evidence that overall food availability at broad scales can shape the ecology of the regional to global biota (Figure 5). The differences in total carbon flux between the Atlantic and Pacific Ocean determine the relative proportion of specific bivalve ecologies (Figure 5). In the more productive Pacific, HET ecologies are numerically dominant, and conversely, in the less productive Atlantic, LET ecologies are numerically dominant (Figure 5).
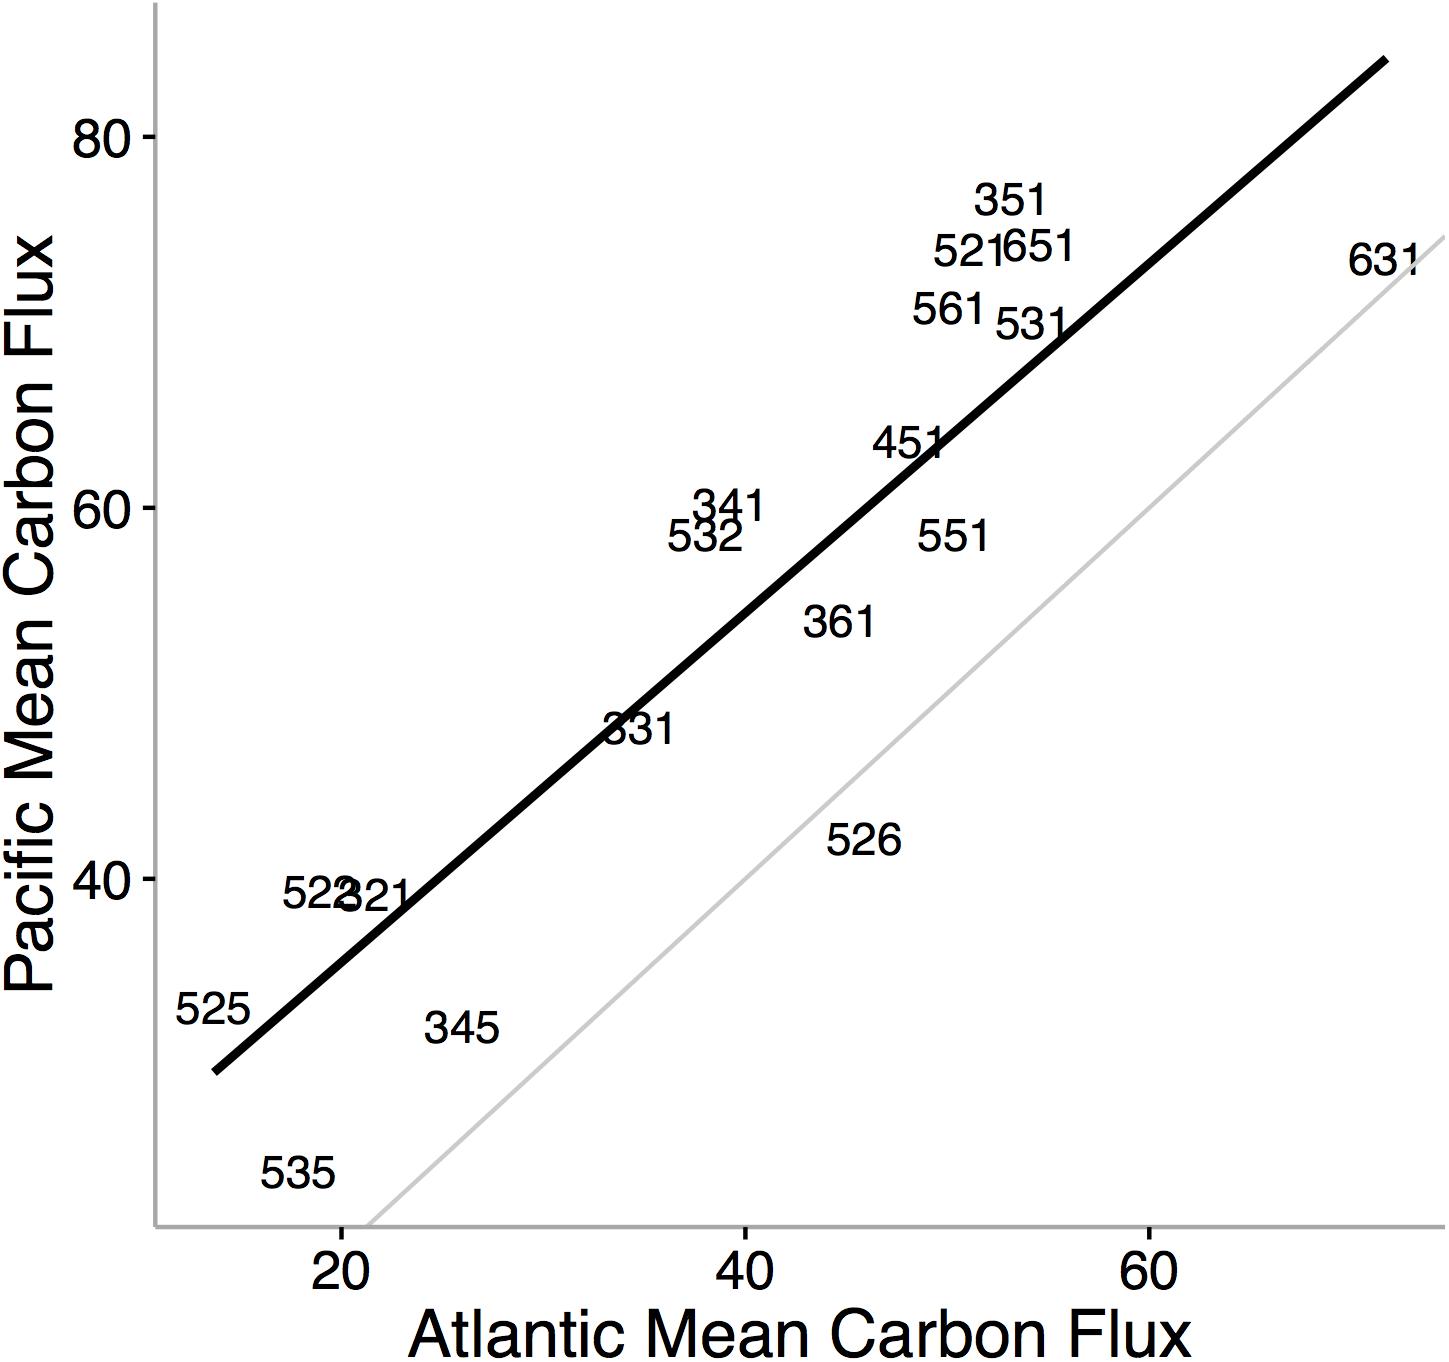
Figure 4. Mean carbon flux of bivalve ecological modes in the Pacific Ocean versus the mean carbon flux of ecological modes in the Atlantic Ocean. Black line denotes the rank order correlation and the gray line represents the one-to-one value line. Numbers refer to unique functional combinations on three ecological mode axes: tiering, motility, and feeding. Each axis consists of six categorical states. The tiering axis consists of 1 pelagic, 2 erect, 3 surficial, 4 semi-infaunal, 5 shallow infaunal, and 6 deep infaunal. The motility axis consists of 1 freely motile/fast; 2 freely motile/slow; 3 facultatively motile/unattached; 4 facultatively motile/attached; 5 non-motile/unattached; and6 non-motile/attached. The feeding axis consists of 1 suspension feeding, 2 surficial deposit feeding, 3 mining, 4 grazing, 5 predatory, and 6 other (for feeding strategies that do not fit into the previous five feeding modes). Using independent values of mean carbon flux for ecological modes by restricting the analysis to species endemic to either the Atlantic or the Pacific, we find striking consistency in the ranking of carbon flux requirements in bivalve ecological modes. The finding that most ecological modes are typically associated with higher flux values in the Pacific Ocean is not surprising; the Pacific is on average more productive than the Atlantic (Marra et al., 1987; Lutz et al., 2007). From McClain et al. (2018).
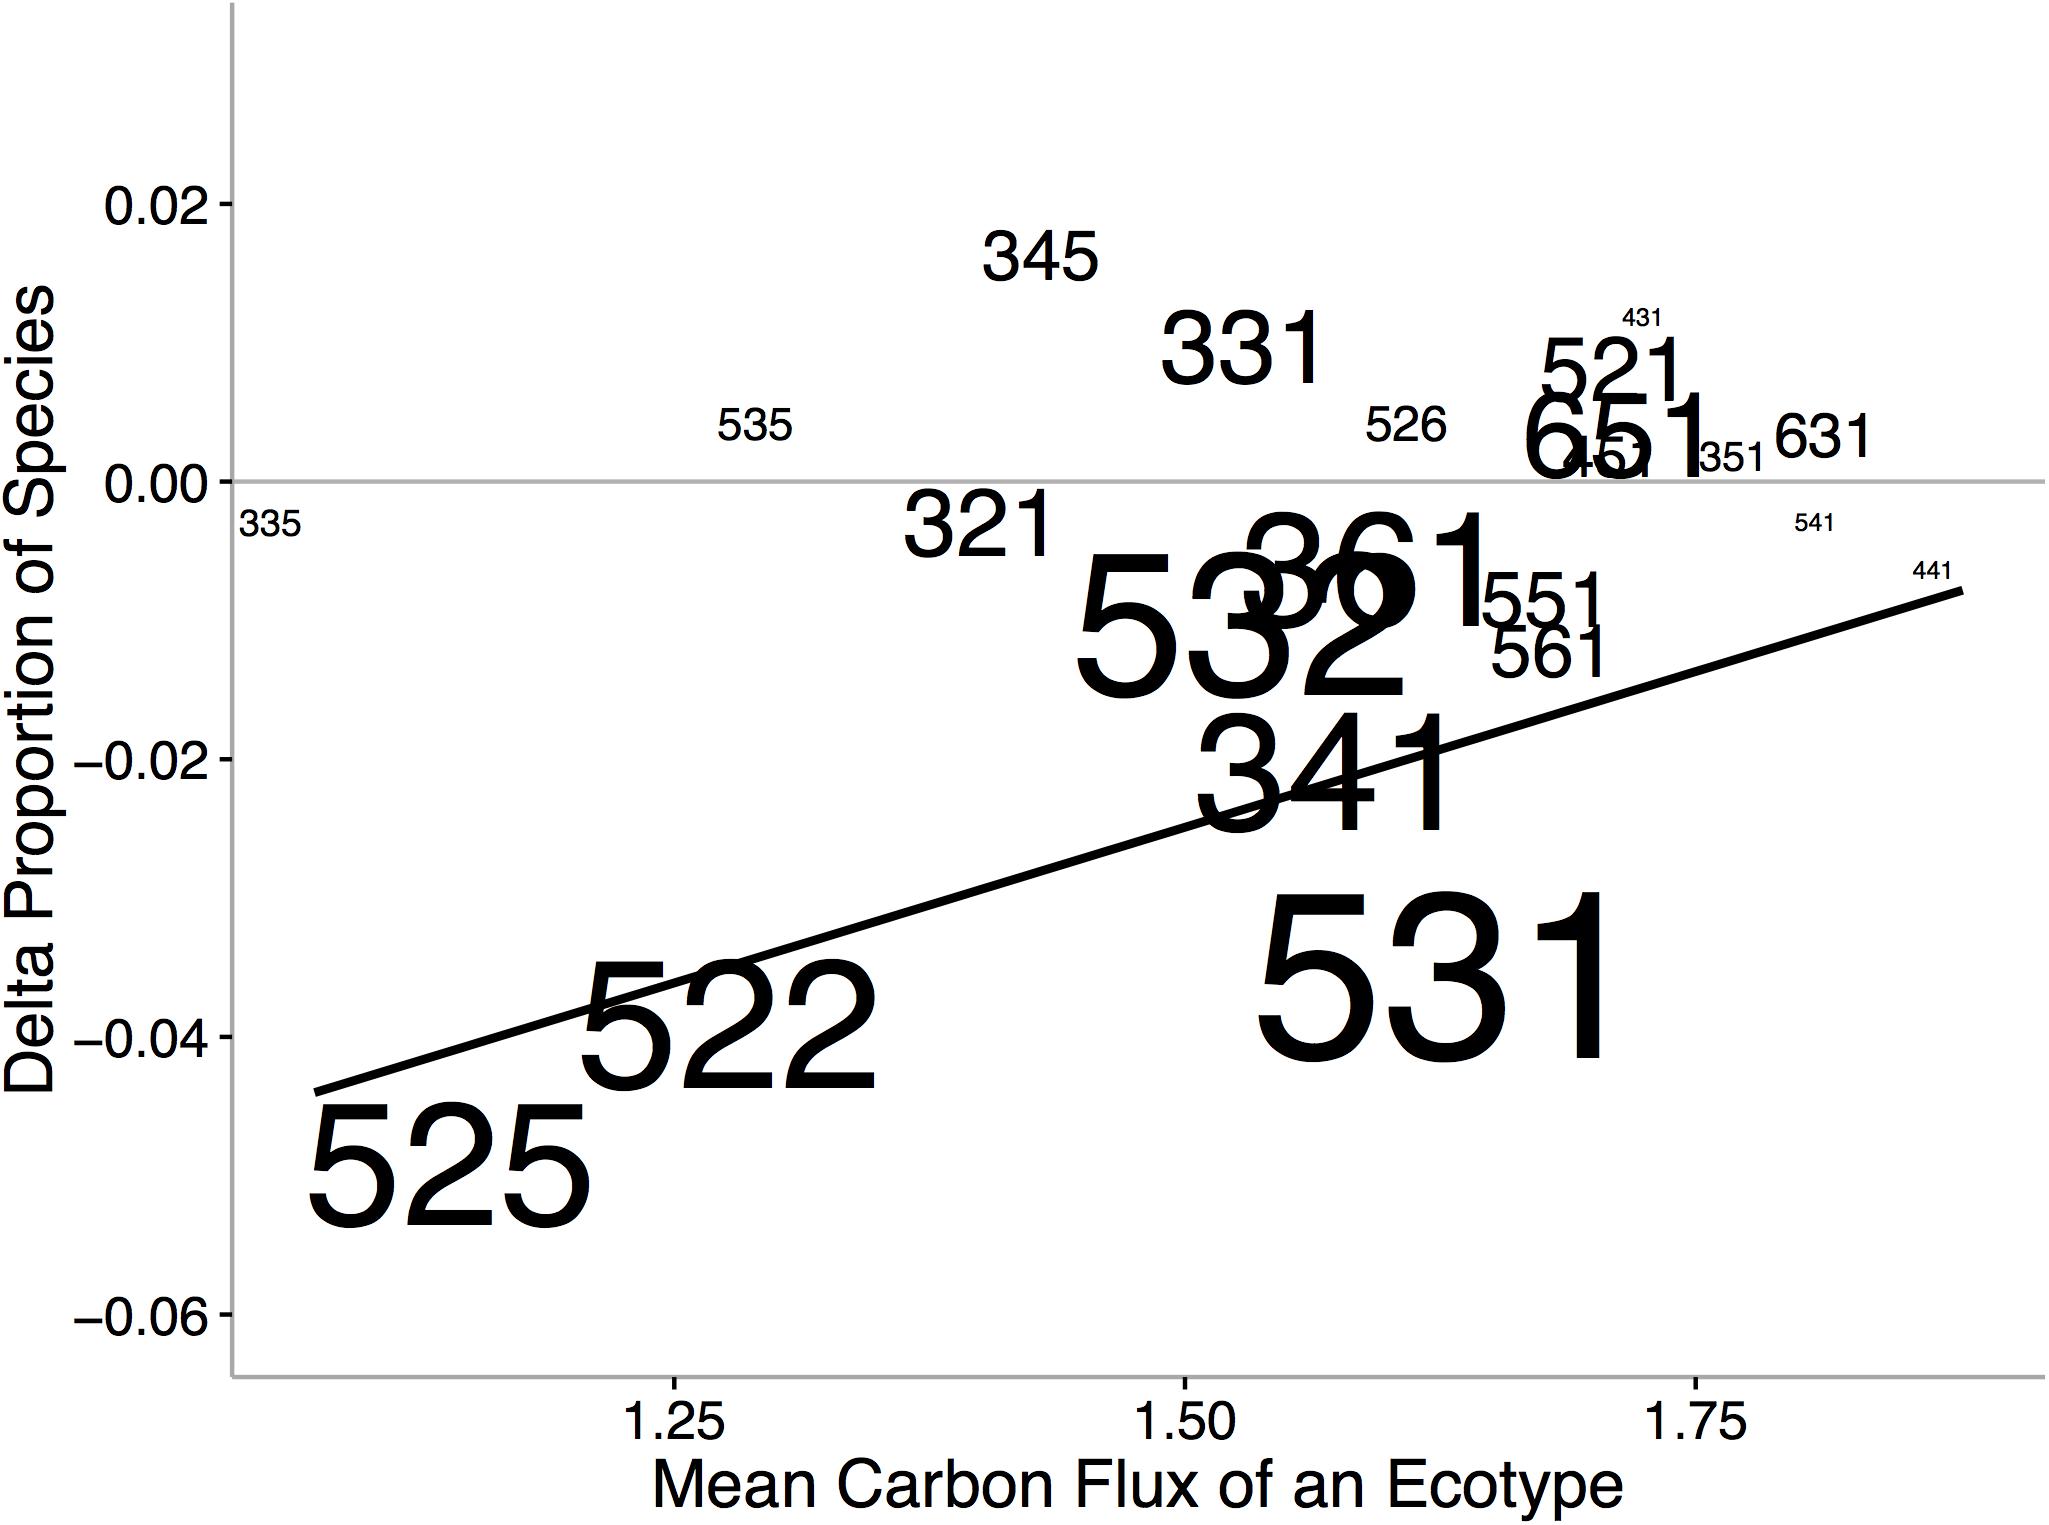
Figure 5. Changes in the proportion of ecological modes between the Atlantic and Pacific Oceans verses the mean carbon flux of the ecological mode. Increases in values indicate increased representation in the Pacific and decreased representation in the Atlantic. Size of text indicates ecological-mode proportion in the data set. Numbers refer to unique functional combinations on three ecological mode axes, tiering, motility, and feeding (see Figure 4 caption for details of numbers). We find that HET associated with higher POC fluxes occur in greater proportion in the Pacific Ocean and, conversely, LET occur in greater proportion in the Atlantic. From McClain et al. (2018). Dashed line represents in proportions in the Atlantic and Pacific Oceans. Solid line indicates significant regression line.
In many cases, empirical results are surprising and contrary to theoretical predictions. Simultaneous hermaphroditism, predicted to increase with decreasing environmental carbon availability as low populations sizes would decrease the chance of finding a mate, actually show the opposite pattern in deep-sea mollusks (McClain et al., 2014). These kinds of counter-theory findings suggest that much work is required in order to elucidate patterns of functional tradeoffs and adaptation over energetic gradients. Emerging research does support the presence of certain metabolically expensive traits that can be tied to low-energy and high-energy taxa (LET vs. HET) such that their relative representations vary over energetic gradients. We analyzed the Atlantic deep-sea bivalve database with a general additive model (GAM) to examine how two common traits, suspension and deposit feeding, vary with POC flux. We find (Figure 6) that the proportion of species of suspension feeding increases (p < 0.0001, R2 = 0.19) and deposit feeding decreases (p = 0.0030, R2 = 0.11) with increasing POC flux. Suspension feeders require a continuous supply of suspended particulate matter at a density high enough to offset the energetic costs of filter feeding; thus, the link to regional carbon fluxes is predictable (McClain and Lundsten, 2015).
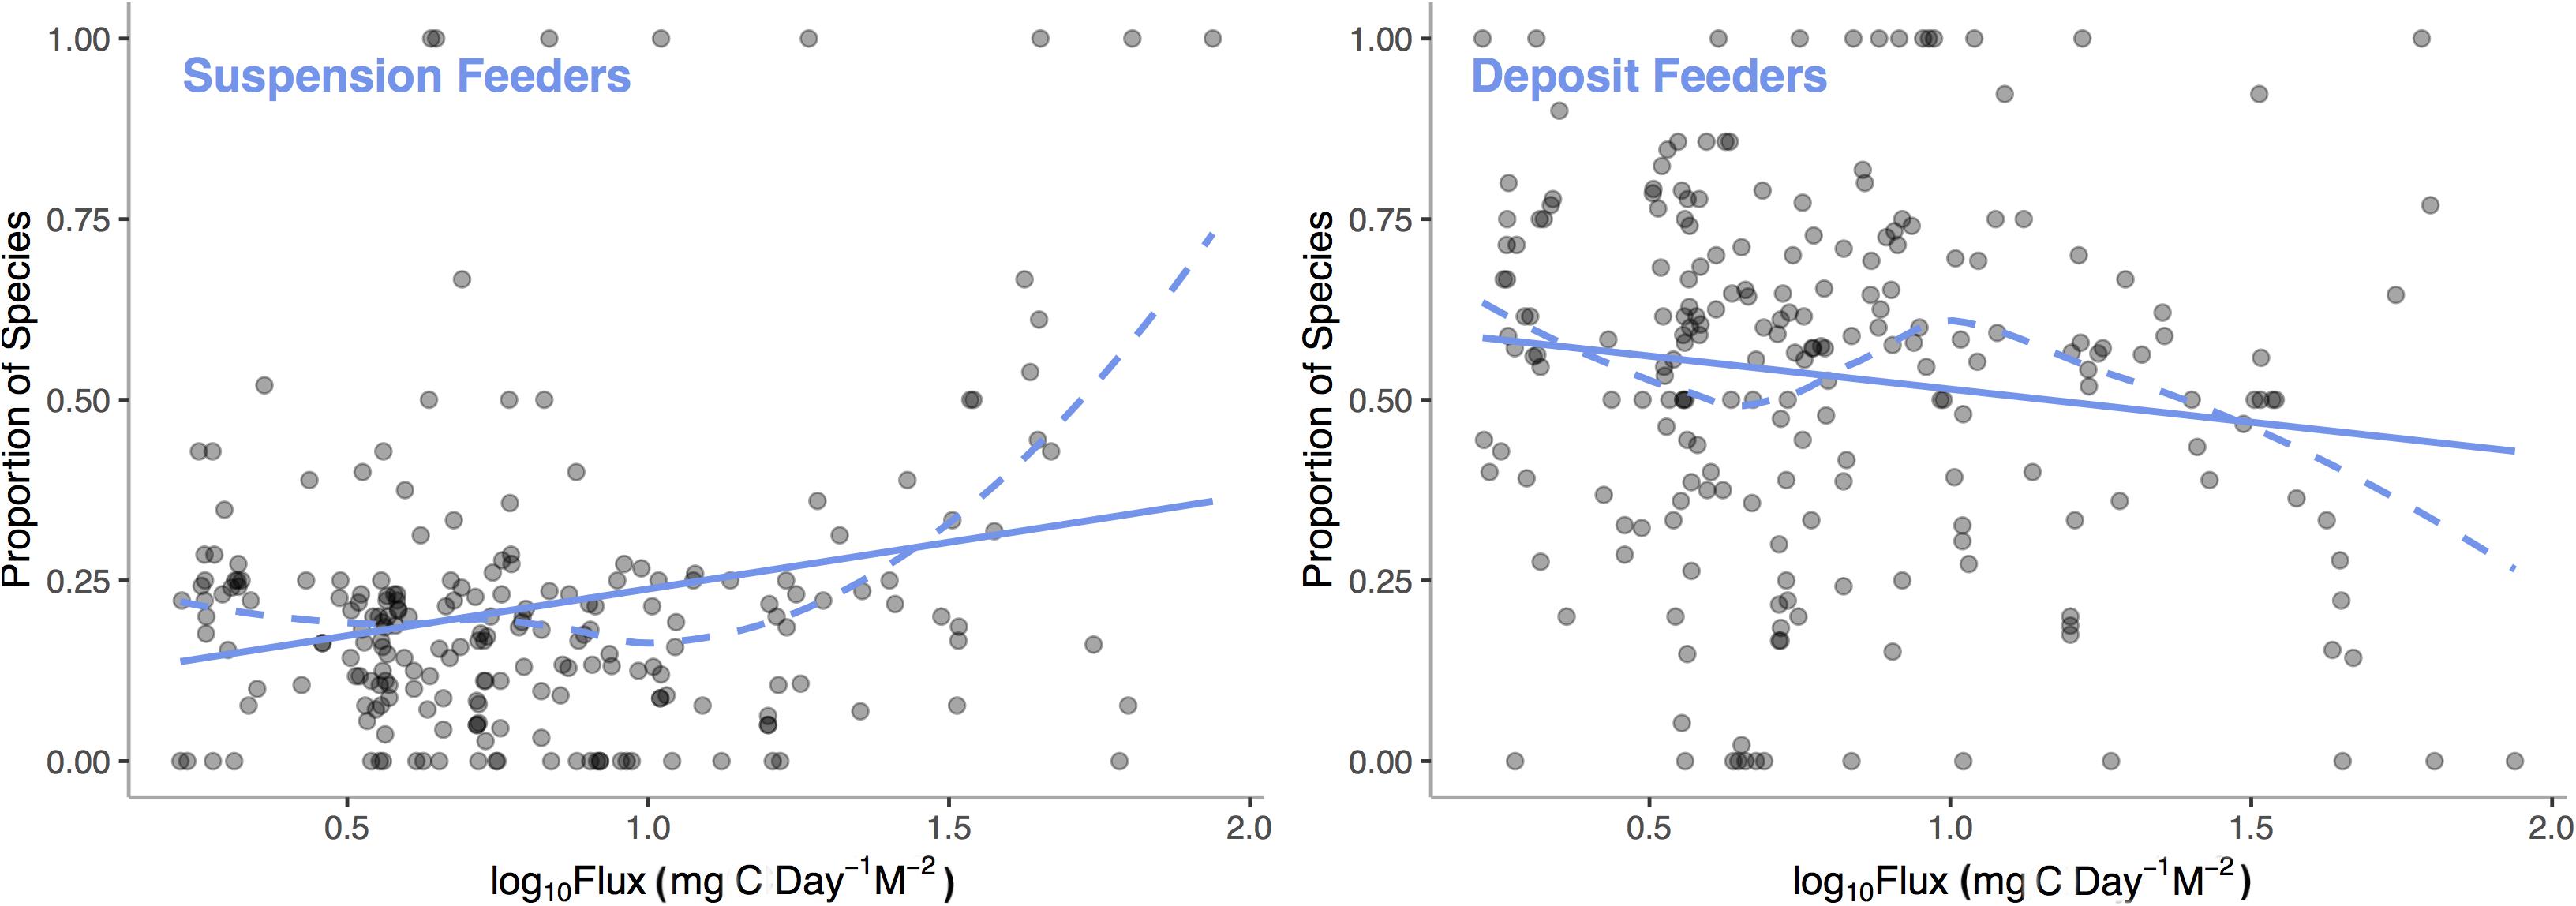
Figure 6. Proportion of deep-sea, bivalve species that are suspension feeders and deposit feeders among sampling stations across the Atlantic Ocean verses Log10 Standardized Carbon Flux (gC m– 2 d– 1) for the sampling station. Dashed line represent LOESS smooths and the solid lines represent general additive model fits.
Proposition 8: Metabolic Niche Width Increases With Increasing Environmental Availability of Carbon
Premise
To the extent that biogeographic range is the realization of a species’ niche (Slayter et al., 2013), processes controlling the metabolic niche should impact the size and placement of species distributions. For example, energetically expensive traits such as large body sizes may be confined to high energy regions (Fernández and Vrba, 2005; McClain et al., 2012b). In addition, within a given environmental setting HET are predicted to possess larger biogeographic ranges as home range sizes increase to incorporate the increased food resources required (McNab, 1963; Brown and Maurer, 1987). Energetics may also impact biogeographic range size because of the connections with niche breadth (Slatyer et al., 2013): higher energy availability can lead to smaller ranges because species become resource specialists (Sircom and Walde, 2010; Whitton et al., 2012). Range size is also impacted by the degree of environmental variability in both time and space. For instance, marine bivalves achieve broad geographic ranges across broad, contiguous isotherms (Jablonski et al., 2013; Tomasovych et al., 2015); widespread biogeographic ranges could also be constructed through large and homogenous chemical energetic landscapes. Environmental variables associated with habitat productivity, especially temperature and precipitation, are typically important predictors of species occurrence across taxonomic groups (Bradie and Leung, 2017), supporting the contention that the biogeographic ranges of many species are set, at least in part, by chemical energy availability.
Two different hypotheses relate niche width more generally to carbon availability: (1) Increased carbon availability increases the amount of a preferred resource allowing species to decrease their consumption of less optimal resources, i.e., specialization (Evans et al., 1999). Lower food availability may favor generalists, e.g., scavengers, so that any carbon resources can be utilized, expanding the niche. These hypotheses predict that niche width, or generalism, exhibits a negative relationship with carbon availability. (2) Alternatively, low carbon availability could favor specialization on previously underutilized carbon sources as energy sources become limited, leading to narrow niche widths (Sanders, 1977).
Measuring niche breadth directly is difficult. However, we can use geographic range as proxy, allowing us to test hypotheses. Geographic range is known to reflect niche width such that specialization is associated with smaller geographic ranges (Slayter et al., 2013).
Data and Analyses
We examine this relationship between geographic range size, as a proxy for niche width, and mean POC across the geographic range for gastropod species across the Atlantic Ocean. Data were compiled by McClain et al. (2018) in an extensive search of the primary literature and online databases resulting in complete information a 3,162 species from 100 families. Data include taxonomic information from subclass to species, synonymies, maximum and minimum water depth in meters, maximum and minimum longitude, and maximum and minimum latitude. Biogeographic range and POC were quantified for each gastropod species by the methods described in the Proposition 6 for bivalves. Total range size was calculated as the number of 1° by 1° cells assuming that a species occurs at all sites across its latitudinal and depth range. For the range size verses mean carbon flux, we utilized a GAM to account for potential non-linear effects. The full model also includes other known variants of range size including temperature, mean latitude, mean depth, and species biovolume. The GAM was implemented using the mgcv package in R (Wood, 2011).
Consequence
After accounting for temperature, body size, latitude and depth, we find a significant and positive relationship between geographic range size of Atlantic gastropods and mean POC (p < 0.0001, Figure 7). Increasing temperature, body size, depth, and latitude also correlated with increases in range size (p < 0.0001 for all independent factors) with the overall model accounting for 41.9% of the variation.
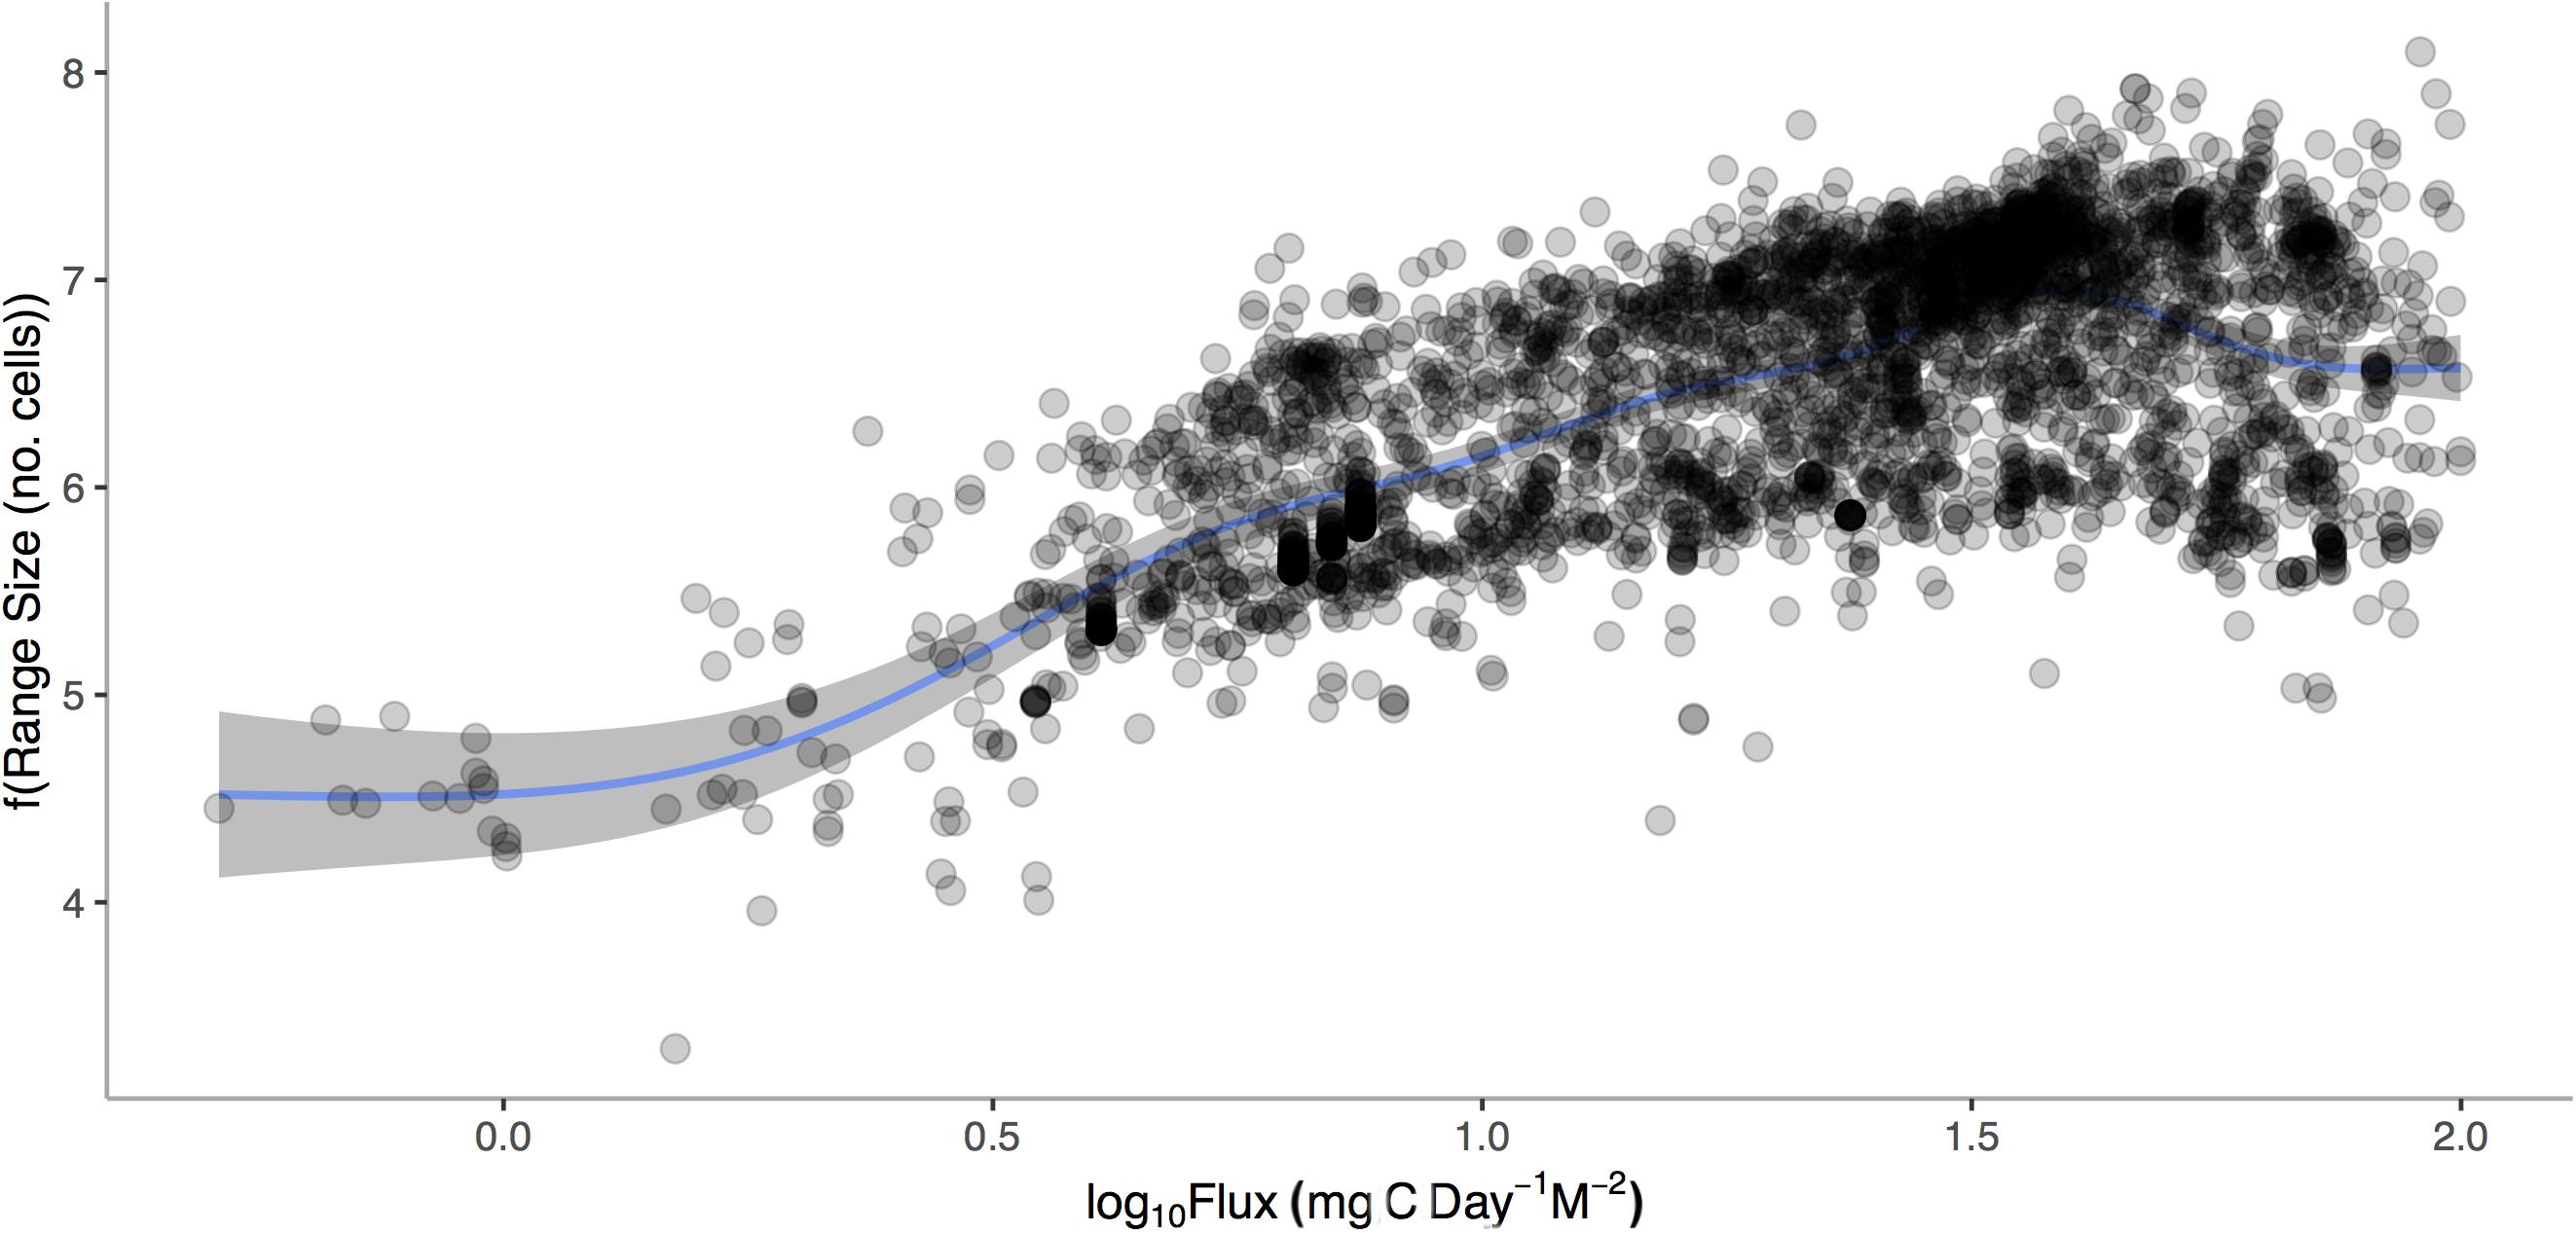
Figure 7. Geographic range size (1°cells) of marine gastropods from the Atlantic Ocean verses Log10 Mean Carbon Flux (gC m– 2 d– 1). General additive model relationship is shown for the conditional relationship once body size, mean depth, mean latitude, and temperature are accounted for.
Lower carbon availabilities produce smaller geographic range sizes and potentially narrow niche widths. Increases in food availability correlate with larger ranges. This positive correlation is in contrast to most theories suggesting that higher carbon availability should lead to smaller ranges (Evans et al., 1999; Bonn et al., 2004; Sircom and Walde, 2010; Whitton et al., 2012). One possible reason for this result is that the analyses here control for a variety of other geographic, environmental, and biological factors correlated with body size. Thus, the negative pattern between productivity and range size may reflect other factors correlated with productivity. For example, body size increases with increasing productivity (McClain et al., 2012b). Sanders (1977) originally proposed that low productivity would favor specialization to consume previously underutilized carbon sources. Indeed, the low productivity encountered in the deep sea appears to select for specialization on exotic carbon sources (Van Dover, 2000; Braby et al., 2007; Bienhold et al., 2013).
Proposition 9: If Metabolic Niches, and Energetic Requirements, Vary Among Species Then Compositional Changes Are Expected Over Spatial or Temporal Gradients of Energy
Premise
Beta diversity (β-diversity) is “the extent of change in community composition, or degree of community differentiation, in relation to a complex-gradient of environment, or a pattern of environments” (Whittaker, 1960, p. 320). β-diversity patterns therefore emerge from the interaction between the environment and the varying metabolic niche requirements (indexed by biogeographic range and patchiness of occupancy within that range) of all species in an assemblage. If metabolic niches, and energetic requirements, do indeed vary among species then compositional changes are expected over spatial or temporal gradients of energy.
Consequence
In support of this, clines of β-diversity over energy gradients have been documented among bacteria (Zinger et al., 2011), invertebrates (McClain and Barry, 2010, 2014; McClain et al., 2011, 2012c, 2016; Andrew et al., 2012), and vertebrates (He and Zhang, 2009; Melo et al., 2009; Qian and Xiao, 2012), on land (He and Zhang, 2009; Melo et al., 2009; Andrew et al., 2012; Qian and Xiao, 2012) and in the ocean (McClain and Barry, 2010, 2014; McClain et al., 2011, 2012c, 2016; Zinger et al., 2011), with the rate of this turnover set by both niche width and the intensity of the environmental gradient in energy availability. At a taxonomic level, species or clades with comparatively higher metabolic demands should exhibit higher rates of turnover (Soininen et al., 2007a, b), because HET will be more sensitive to changes in environmental energy. Any reduction in energy should push HET increasingly near to their energetic minimum requirements. β-diversity does vary greatly among taxa with different body masses, trophic levels, and thermoregulation as predicted from energetic theory based on how these factors control metabolic demand (Soininen et al., 2007a, b).
Despite the overall paucity of energy, the deep seafloor supports high alpha diversity, which may be comparable to much more productive ecosystems such as coral reefs or tropical rainforests. This paradox of seemingly high diversity in a low-energy system is well treated in the deep-sea literature (McClain and Schlacher, 2015) but the most influential idea is the patch-mosaic hypothesis (Grassle and Sanders, 1973). Grassle posited that interactions between the spatially heterogeneous fall of POC and microscale topography such as burrows and mounds, or feeding trails of large mobile deposit feeders, create a mosaic of centimeter scale patches of high and low energy availability (Grassle, 1989) which – unlike in shallow water where patches are homogenized quickly (days to weeks) due to frequent bioturbation and currents – can persist for years (Etter and Mullineaux, 2001). Species are highly specialized in microhabitat preference which leads to an overall diverse mosaic of assemblages, each with a unique set of species. To restate, species have a metabolic niche that contributes to high small-scale beta diversity increasing local alpha-diversity.
This patchiness is reflected in high species turnover at small scales (Etter and Mullineaux, 2001; Snelgrove and Smith, 2002), and experimental work enriching nutrients in deep-sea colonization trays has underlined the key role that energy plays, with species that are rare or absent in the background environment reaching high abundances in enriched patches (Levin and Smith, 1984; Snelgrove et al., 1992, 1994, 1996; Bernardino et al., 2010; McClain et al., 2011).
Proposition 10: Metabolic Niches, and Energetic Requirements, Can Be Used to Make Specific Predictions of Biodiversity Patterns Over Spatial or Temporal Gradients of Energy
Premise
Increases in available carbon frequently translate into increases in species richness or alpha-diversity (Rosenzweig and Abramsky, 1993; Waide et al., 1999; Clarke and Gaston, 2006; Cusens et al., 2012), either linearly or as a unimodal relationship with richness peaking at intermediate levels of energy. Although a variety of mechanisms exist to explain the relationship between species richness and energy (Rosenzweig and Abramsky, 1993), here we explore only how understanding species metabolic niches may inform about diversity gradients. We envision two different scenarios for patterns of β- and a-diversity over gradients in energy availability in the context of the metabolic niche (Figure 8). These differ in whether β-diversity occurs because of the replacement of some species with others (species turnover) or because species loss leads to smaller communities forming ordered subsets of larger communities (nestedness) (Baselga, 2010, 2012). It is worth noting, across energy gradients there is evidence of both nestedness (Baselga et al., 2012; Brault et al., 2013; McClain et al., 2016; Stuart et al., 2016) and turnover (Andrew et al., 2012; Brault et al., 2013; Wagstaff et al., 2014). These two scenarios lead to different predictions of alpha-diversity over a productivity gradient as well.
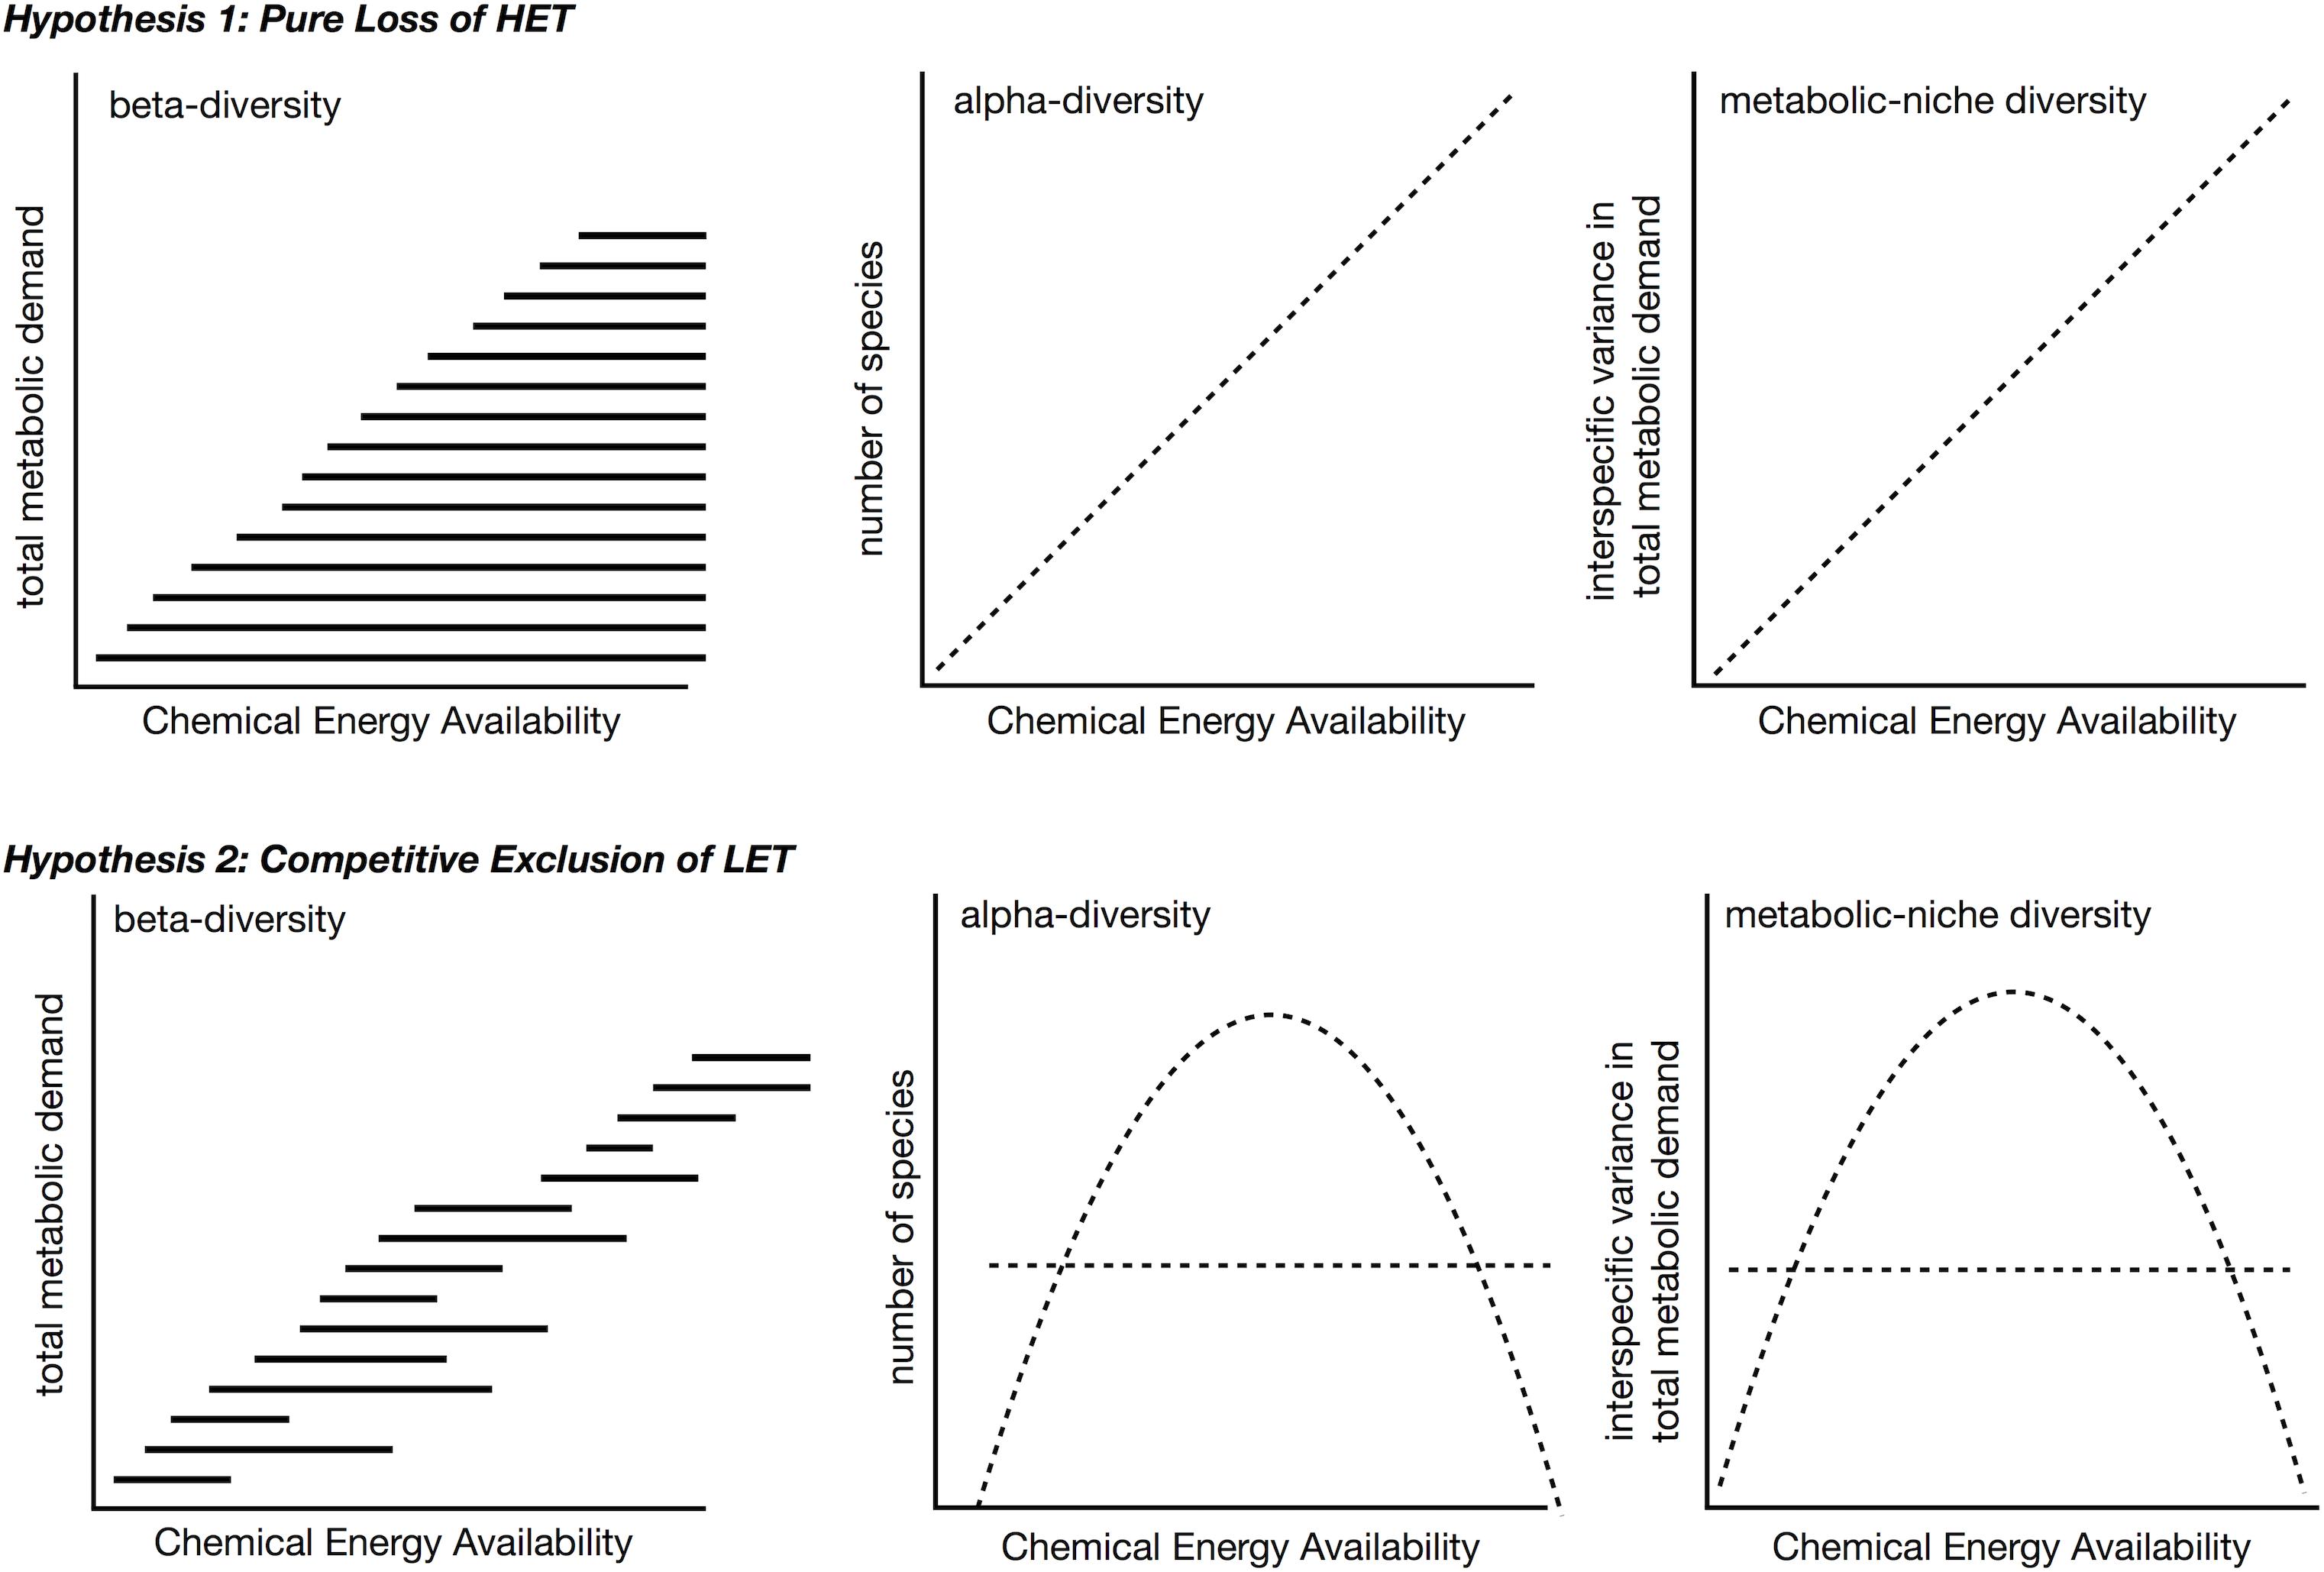
Figure 8. Two hypotheses for beta- and alpha-diversity patterns in the context of metabolic niches. In both scenarios, high energy taxa (HET) are lost from communities as chemical energy availability decreases across a gradient. In the second hypothesis, high chemical energy availability LET are additionally outcompeted, e.g., due to slower populations rates, and are lost from these communities. The competitive exclusion in LET in second hypothesis leads to a unimodal species-energy relationship as opposed to a linear pattern. In both hypotheses, metabolic niche diversity, e.g., interspecific variation in metabolic rate, should mirror the species richness pattern.
Proposition 10A: High Metabolic Demand Taxa Are Lost From Communities When Environmental Energy Drops Below Their Metabolic Need
The first scenario predicts nestedness will occur as energy availability falls below the minimum metabolic requirement of certain taxa (Figure 8, top). At ecological scales, high-energy habitats offer more niches because more species can meet their minimum energetic requirements, and both LET and HET can persist. LET may survive on patches of low quality, quantity, or density of resources that are not monopolized by HET within these high-energy habitats, i.e., no competitive exclusion occurs. In low-energy habitats, HET are lost because minimum energetic requirements cannot be met. While empirical tests for this idea are lacking, the test is relatively straightforward – the diversity of interspecific metabolic rates should increase with greater energy availability.
If high-energy habitats support more energetic niches, species richness may increase at higher energy availability because species are able to specialize on preferred resources, e.g., a predator consuming a single prey species or a herbivore consuming a single plant, reducing competitive interactions and allowing for greater species coexistence (Evans et al., 2005). Again, empirical tests of this hypothesis are rare but easily conducted: the trophic niche, measured for instance as the variance in δ13C (a measure of the variability in consumed carbon sources), and the variance in δ15N (a measure of trophic specialization), should both decrease with increasing energy availability.
Proposition 10B: Low Metabolic Demand Taxa Are Lost From Communities From Competitive Exclusion When Environmental Energy Is High
In the second scenario, over a decreasing gradient of carbon availability, the expectation is for LET to replace HET, i.e., turnover (Figure 8, bottom). As before, the minimum metabolic demands of HET cannot be met when environmental energy declines, but this scenario additionally assumes that LET do not exist in higher energy availability habitats, because they are competitively excluded by HET that can monopolize resources. To restate, HETs with faster growth rates, population growth rates, increased mobility, and larger sizes may prove to be superior competitors to LETs in high energy environments. This is essentially the second half of the dynamic equilibrium model (Huston, 1979) and is in some aspects very similar to the resource ratio hypothesis in that it invokes competition under high energy availability (Tilman, 1982). The competitive exclusion of LET in high energy habitats predicts a unimodal relationship between α-diversity and energy availability, similar to the interaction competition hypothesis (Rosenzweig and Abramsky, 1993), where all increases in energy go to a competing taxon.
Data and Analyses
We analyze the Allen (2008) bivalve data as described in Proposition 6. We decomposed β-diversity over the POC gradient into two distinct components: species turnover and species loss leading to nestedness using the betapart package (Baselga et al., 2013) in R to decompose Sørensen’s dissimilarity index βSØR into dissimilarity due to turnover measured as Simpson’s index βSIM and a new index of dissimilarity due to species loss leading to nestedness βNES. We computed dissimilarity between pairs of sites against the difference in depth for each pair (Baselga, 2010). We used a Mantel test with 1,000 replicates (Pearson correlation) to assess whether the components of β-diversity changed among sites along the gradient of POC flux.
Consequence
In our analysis of bivalves from the deep-sea of the Atlantic Ocean, we find that turnover (Mantel Test: r = 0.1141, p < 0.0001) rather than nestedness (Mantel Test: r = -0.258, p = 0.904) is prevalent (Figure 9) implying that both metabolic competition and limits are important in shaping compositional changes.
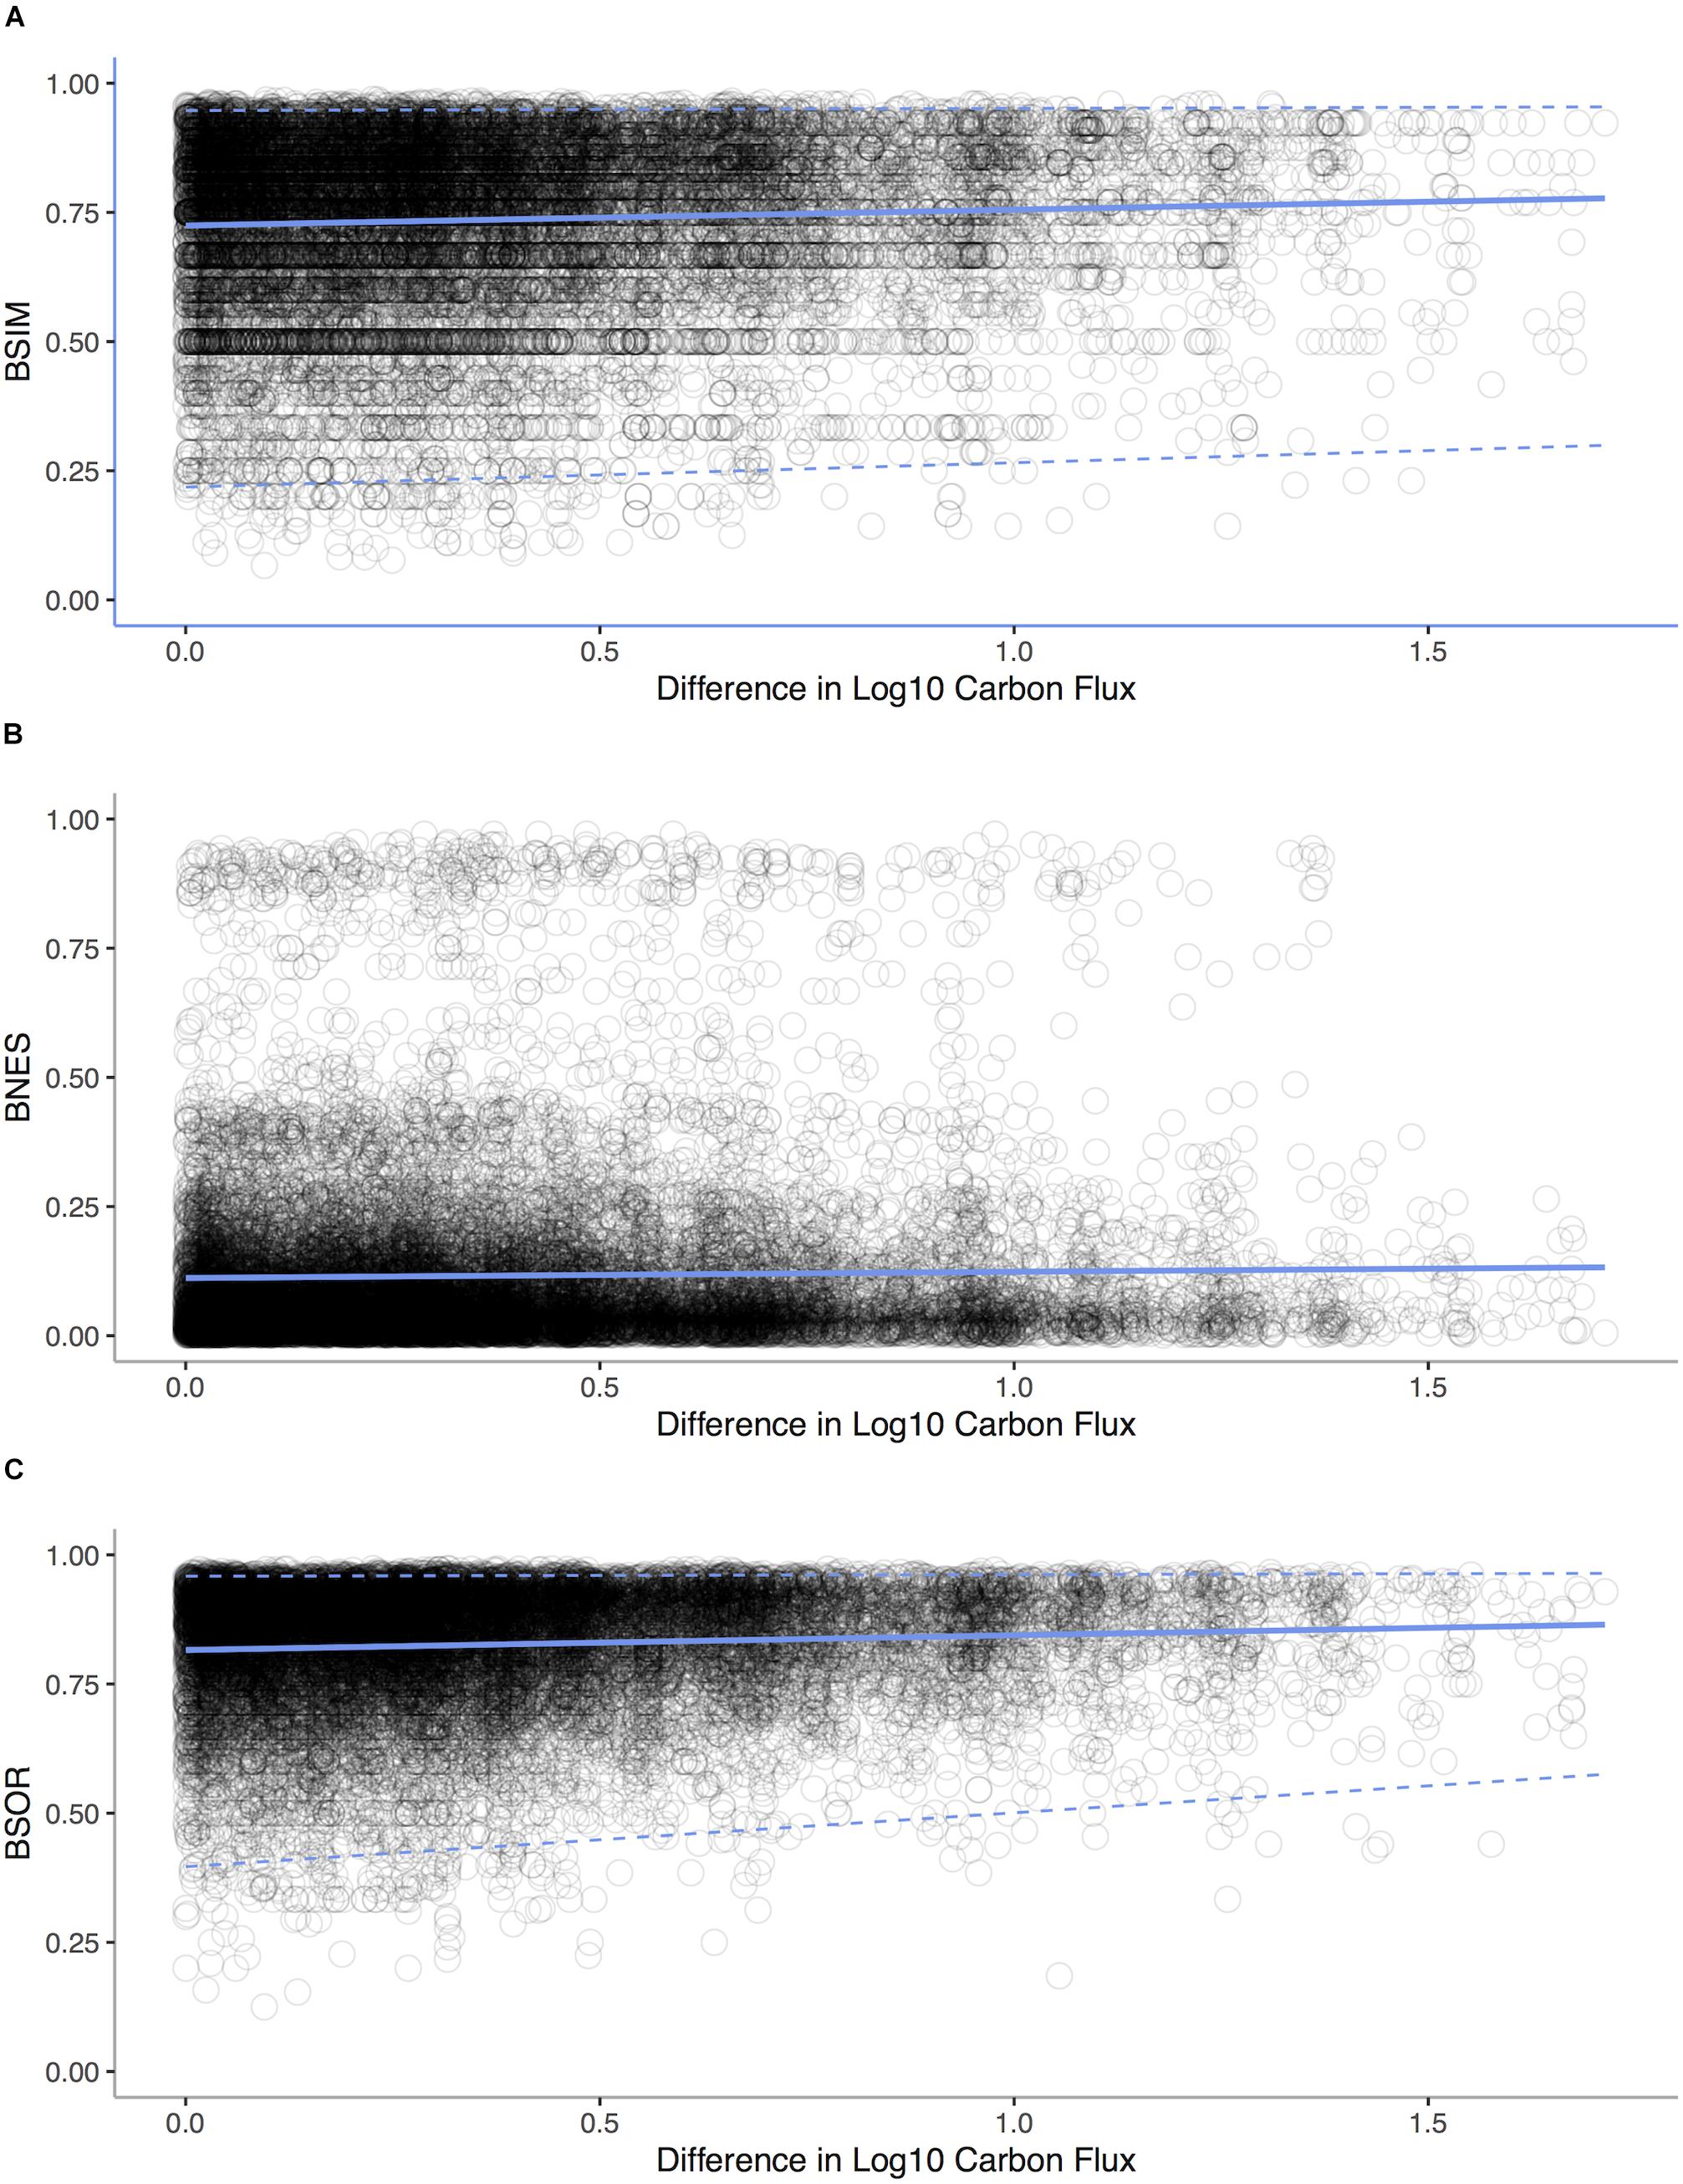
Figure 9. Standard environmental distance-decay plots representing pairwise comparisons of bivalve community similarity verses differences in POC flux for each sampling station in the Atlantic Ocean. (A) Simpson’s index βSIM of dissimilarity due to turnover vs. difference in Log10 Carbon Flux (gC m– 2 d– 1, Mantel statistic r: 0.08, p < 0.0001). (B) Dissimilarity due to species loss leading to nestedness βNES verses Log10 Carbon Flux (Mantel statistic r: -0.03, p = 0.904). (C) Sørensen’s dissimilarity index βSØR verses differences Log10 Carbon Flux (Mantel statistic r: 0.11, p < 0.0001). Regression lines (solid lines) and quantile regressions lines (1 and 99%, dashed lines) are shown.
In the context of the two scenarios illustrated in Figure 8, turnover appears to be prevalent in deep-sea invertebrates over a depth gradient, implying LET are replacing HET and that LET are outcompeted at higher energy availabilities (Brault et al., 2013). Equally, in deep-sea canyons areas with increased POC support only a small subset of species, with the loss coming from competitive exclusion (McClain and Barry, 2010). At larger scales, patterns of taxonomic, functional, and phylogenetic beta-diversity are tied to POC (McClain et al., 2012c), implying that the changes in beta-diversity have an adaptive origin tied to species traits. From local to oceanic spatial scales, a pattern is emerging that the metabolic niche of deep-sea species and its relations to energy availability sets beta-diversity.
However at very low energy values, like those occurring on the abyssal plains, nestedness occurs, reflecting the loss of even LET when energy availability falls below minimum metabolic needs (Rex et al., 2005). Low-energy communities on deep-sea wood falls are also nested taxonomic subsets of high-energy communities (McClain et al., 2016). This switch from turnover to nestedness implies that at extreme energy limitation, evolutionary novelty and adaptation may not be possible; rather, a source-sink system emerges in which populations from higher energy availability regions of the deep sea sustain through emigration populations of abyssal low-energy sites mitigating Allee effects (Rex et al., 2005). This combination of nestedness and turnover is reflected in a general unimodal pattern of alpha-diversity which typically peaks at intermediate depths and levels of POC (Rex and Etter, 2010): in low-energy habitats, HET are lost because minimum energetic requirements cannot be met (Rex et al., 2005), whereas LETs may not be able to survive at the highest energy availabilities because they are outcompeted by HETs that can monopolize resources, as observed in deep-sea canyons (McClain and Barry, 2010).
Conclusion
Van Valen (1976) stated that “Potential energy in the form of reduced carbon is the fuel of the fire of life. All other resources, even when regulatory, can be considered surrogates, when they are competed for.” This perhaps represents an extreme view, but every aspect of an animal’s existence requires carbon. We propose from this simple concept that understanding and quantifying the metabolic niche can potentially link scales from individuals to ecosystems and link adaptation to patterns in biogeography and biodiversity. Energy and the metabolic niche also allow for explicit links between ecological and evolutionary theory. Future avenues of research include addressing the following questions:
(1) Do intraspecific metabolic rates vary over energy gradients?
(2) What is the diversity of and energetic adaptations among organisms and how do these vary over energy gradients? Is a greater diversity of metabolic niches and adaptations afforded at greater energy availability?
(3) Do generalists or specialists prevail at high and low energy habitats?
(4) To what extent are range limits and biogeographic patterns set by the metabolic niche?
(5) Do patterns of α- and β-diversity differ among high and low energy taxa?
(6) Are low energy taxa competitively excluded at high energy availability?
We have outlined how the unique features of deep-sea benthos that make them an ideal testbed for many of these questions, but linking data on the occurrences and biological traits of species with their energetic environmental settings in a range of extreme systems, including deep-sea pelagic systems, will help to generalize the metabolic niche concept.
Data Availability Statement
The datasets generated for this study are available on request to the corresponding author.
Author Contributions
CM led writing, theory development, and analyses. SD, TW, and SF contributed to the analyses. All authors contributed to theory development, writing, and editing.
Funding
CM and CN were supported by NSF/OCE 1634586.
Conflict of Interest
The authors declare that the research was conducted in the absence of any commercial or financial relationships that could be construed as a potential conflict of interest.
Acknowledgments
This work and theory developed out of numerous conversations over the years with J. Payne, J. Nekola, J. Brown, A. Hulbert, M. Ernest, J. Barry, M. Rex, and countless others. We are indebted to them. D. McGlinn and M. Pennell, and their respective lab groups, provided friendly reviews and invaluable feedback.
Footnotes
References
Allen, J. A. (2008). Bivalvia of the deep Atlantic. Malacologia 50, 57–173. doi: 10.4002/0076-2997-50.1.57
Andrew, M. E., Wulder, M. A., Coops, N. C., and Baillargeon, G. (2012). Beta-diversity gradients of butterflies along productivity axes. Glob. Ecol. Biogeogr. 21, 352–364. doi: 10.1111/j.1466-8238.2011.00676.x
Bambach, R. K. (1993). Seafood through time: changes in biomass, energetics, and productivity in the marine ecosystem. Paleobiology 19, 372–397. doi: 10.1017/s0094837300000336
Bambach, R. K., Bush, A. M., and Erwin, D. H. (2007). Autecology and the filling of ecospace: key metazoan radiations. Paleontology 50, 1–22. doi: 10.1111/j.1475-4983.2006.00611.x
Baselga, A. (2010). Partitioning the turnover and nestedness components of beta diversity. Glob. Ecol. Biogeogr. 19, 134–143. doi: 10.1111/j.1466-8238.2009.00490.x
Baselga, A. (2012). The relationship between species replacement, dissimilarity derived from nestedness, and nestedness. Glob. Ecol. Biogeogr. 21, 1223–1232. doi: 10.1111/j.1466-8238.2011.00756.x
Baselga, A., Gómez-Rodríguez, C., and Lobo, J. M. (2012). Historical legacies in world amphibian diversity revealed by the turnover and nestedness components of beta diversity. PLoS One 7:e32341. doi: 10.1371/journal.pone.0032341
Baselga, A., Orme, D., Villeger, S., Bortoli, J. D., and Leprieur, F. (2013). Betapart: Partitioning Beta Diversity Into Turnover and Nestedness Components, Version R Package Version 1.3.
Behrenfeld, M. J., O’malley, R. T., Siegel, D. A., Mcclain, C. R., Sarmiento, J. L., Feldman, G. C., et al. (2006). Climate-driven trends in contemporary ocean productivity. Nature 444, 752–755. doi: 10.1038/nature05317
Bernardino, A. F., Smith, C. R., Baco, A. R., Altamira, I., and Sumida, P. Y. G. (2010). Macrofaunal succession in sediments around kelp and woodfalls in the deep NE Pacific and community overlap with other reducing habitats. Deep Sea Res. I 57, 708–723. doi: 10.1016/j.dsr.2010.03.004
Bienhold, C., Risotva, P. P., Wenzhofer, F., Dittmar, T., and Boetius, A. (2013). How deep-sea wood falls sustain chemosynthetic life. PLoS One 8:e53590. doi: 10.1371/journal.pone.0053590
Blowes, S., Supp, S., Antao, L., Bates, A., Bruelheide, H., Chase, J., et al. (2018). Biodiversity trends are stronger in marine than terrestrial assemblages. bioRxiv [Preprint]. doi: 10.1101/457424
Bonn, A., Storch, D., and Gaston, K. J. (2004). Structure of the species–energy relationship. Proc. R. Soc. B Biol. Sci. 271, 1685–1691. doi: 10.1098/rspb.2004.2745
Boyce, D. G., Lewis, M. R., and Worm, B. (2010). Global phytoplankton decline over the past century. Nature 466, 591–596. doi: 10.1038/nature09268
Braby, C. E., Rouse, G. W., Johnson, S. B., Jones, W. J., and Vrijenhoek, R. C. (2007). Bathymetric and temporal variation among Osedax boneworms and associated megafauna on whale-falls in Monterey Bay, California. Deep Sea Res. I 54, 1773–1791. doi: 10.1016/j.dsr.2007.05.014
Bradie, J., and Leung, B. (2017). A quantitative synthesis of the importance of variables used in MaxEnt species distribution models. J. Biogeogr. 44, 1344–1361. doi: 10.1111/jbi.12894
Brault, S., Stuart, C., Wagstaff, M., Mcclain, C. R., Allen, J. A., and Rex, M. A. (2013). Contrasting patterns of α- and β-diversity in deep-sea bivalves of the eastern and western North Atlantic. Deep Sea Res. II 92, 157–164. doi: 10.1016/j.dsr2.2013.01.018
Brey, T., Müller-Wiegmann, C., Zittier, Z. M., and Hagen, W. (2010). Body composition in aquatic organisms—a global data bank of relationships between mass, elemental composition and energy content. J. Sea Res. 64, 334–340. doi: 10.1016/j.seares.2010.05.002
Brown, J. H., Gillooly, J. F., Allen, A. P., Savage, V. M., and West, G. B. (2004). Toward a metabolic theory of ecology. Ecology 85, 1771–1789. doi: 10.1890/03-9000
Brown, J. H., and Maurer, B. A. (1987). Evolution of species assemblages : effects of energetic constraints and species dynamics on the diversification of the North-American Avifauna. Am. Nat. 130, 1–17. doi: 10.1086/284694
Bryndum-Buchholz, A., Tittensor, D. P., Blanchard, J. L., Cheung, W. W., Coll, M., Galbraith, E. D., et al. (2019). Twenty-first-century climate change impacts on marine animal biomass and ecosystem structure across ocean basins. Glob. Chang. Biol. 25, 459–472. doi: 10.1111/gcb.14512
Bush, A. M., Bambach, R. K., and Daley, G. M. (2007). Changes in theoretical ecospace utilization in marine fossil assemblages between the mid-Paleozoic and late Cenozoic. Paleobiology 33, 76–97. doi: 10.1666/06013.1
Butchart, S. H., Walpole, M., Collen, B., Van Strien, A., Scharlemann, J. P., Almond, R. E., et al. (2010). Global biodiversity: indicators of recent declines. Science 328, 1164–1168. doi: 10.1126/science.1187512
Carbone, C., Teacher, A., and Rowcliff, J. M. (2007). The cost of carnivory. PLoS Biol. 5:e22. doi: 10.1371/journal.pbio.0050022
Childress, J. J. (1995). Are there physiological and biochemical adaptations of metabolism in deep-sea animals? Trends Ecol. Evol. 10, 30–36. doi: 10.1016/s0169-5347(00)88957-0
Chust, G., Allen, J. I., Bopp, L., Schrum, C., Holt, J., Tsiaras, K., et al. (2014). Biomass changes and trophic amplification of plankton in a warmer ocean. Glob. Chang. Biol. 20, 2124–2139. doi: 10.1111/gcb.12562
Clarke, A., and Gaston, K. J. (2006). Climate, energy and diversity. Proc. R. Soc. B Biol. Sci. 273, 2257–2266.
Cusens, J., Wright, S. D., Mcbride, P. D., and Gillman, L. N. (2012). What is the form of the productivity–animal-species-richness relationship? A critical review and meta-analysis. Ecology 2012, 2241–2252. doi: 10.1890/11-1861.1
Denny, M. W. (1999). Are there mechanical limits to size in wave-swept organisms? J. Exp. Biol. 202, 3463–3467.
Doney, S. C., Ruckelshaus, M., Emmett Duffy, J., Barry, J. P., Chan, F., English, C. A., et al. (2012). Climate change impacts on marine ecosystems. Annu. Rev. Mar. Sci. 4, 11–37.
Etter, R. J., and Mullineaux, L. S. (2001). “Deep-sea communities,” in Marine Community Ecology, eds M. D. Bertness, S. D. Gaines and M. E. Hay (Sunderland, MA: Sinauer Associates, Inc), 367–394.
Evans, K. L., Greenwood, J. J. D., and Gaston, K. J. (2005). Dissecting the species-energy relationship. Proc. Biol. Sci. 272, 2155–2163. doi: 10.1098/rspb.2005.3209
Evans, K. L., Warren, P. H., and Gaston, K. J. (1999). Species–energy relationships at the macroecological scale: a review of the mechanisms. Biol. Rev. 80, 1–25. doi: 10.1017/s1464793104006517
Fernández, M. H., and Vrba, E. S. (2005). Body size, biomic specialization and range size of African large mammals. J. Biogeogr. 32, 1243–1256. doi: 10.1111/j.1365-2699.2005.01270.x
Gage, J. D., and Tyler, P. A. (1991). Deep-Sea Biology: A Natural History of Organisms at the Deep-Sea Floor. Cambridge: Cambridge University Press.
Gillooly, J. F., Brown, J. H., West, G. B., Savage, V. M., and Charnov, E. L. (2001). Effects of size and temperature on metabolic rate. Science 293, 2248–2251. doi: 10.1126/science.1061967
Glazier, D. S. (2005). Beyond the ’3/4-power’ law: variation in the intra- and interspecific scaling of metabolic rate in animals. Biol. Rev. 80, 611–662.
Gooday, A. J. (2002). Biological responses to seasonally varying fluxes of organic matter to the ocean floor: a review. J. Oceanogr. 58, 305–332.
Grassle, J. F. (1989). Species diversity in deep-sea communities. Trends Ecol. Evol. 4, 12–15. doi: 10.1016/0169-5347(89)90007-4
Grassle, J. F., and Sanders, H. L. (1973). Life histories and the role of disturbance. Deep Sea Res. 34, 313–341.
Harding, L. W. Jr., and Perry, E. S. (1997). Long-term increase of phytoplankton biomass in Chesapeake Bay, 1950-1994. Mar. Ecol. Prog. Ser. 157, 39–52. doi: 10.3354/meps157039
Harley, C. D., Randall Hughes, A., Hultgren, K. M., Miner, B. G., Sorte, C. J., Thornber, C. S., et al. (2006). The impacts of climate change in coastal marine systems. Ecol. Lett. 9, 228–241. doi: 10.1111/j.1461-0248.2005.00871.x
He, K., and Zhang, J. (2009). Testing the correlation between beta diversity and differences in productivity among global ecoregions, biomes, and biogeographical realms. Ecol. Inform. 4, 93–98. doi: 10.1016/j.ecoinf.2009.01.003
Huber, M. (2010). Compendium of Bivalves. A Full-Color Guide to 3,300 of the World’s Marine Bivalves. A Status on Bivalvia after 250 Years of Research. Hackenheim: ConchBooks.
Hurlbert, A. H. (2004). Species-energy relationships and habitat complexity in bird communities. Ecol. Lett. 7, 714–720. doi: 10.1111/j.1461-0248.2004.00630.x
Hurlbert, A. H. (2006). Linking species–area and species–energy relationships in Drosophila microcosms. Ecol. Lett. 9, 287–294. doi: 10.1111/j.1461-0248.2005.00870.x
Huston, M. (1979). A general hypothesis of species diversity. Am. Nat. 113, 81–101. doi: 10.1086/283366
Jablonski, D., Belanger, C. L., Berke, S. K., Huang, S., Krug, A. Z., Roy, K., et al. (2013). Out of the tropics, but how? Fossils, bridge species, and thermal ranges in the dynamics of the marine latitudinal diversity gradient. Proc. Natl. Acad. Sci. U.S.A. 110, 10487–10494. doi: 10.1073/pnas.1308997110
Johnson, S. B., Waren, A., Lee, R. W., Kanyo, Y., Kaime, A., Davis, A., et al. (2010). Rubyspira, new genus and two new species of bone-eating deep-sea snails with ancient habits. Biol. Bull. 219, 166–177. doi: 10.1086/bblv219n2p166
Jumars, P. A., Mayer, L. M., Deming, J. W., Baross, J. A., and Wheatcroft, R. A. (1990). Deep-sea deposit-feeding strategies suggested by environmental and feeding constraints. Philos. Trans. R. Soc. Lond. A 331, 85–101. doi: 10.1098/rsta.1990.0058
Kordas, R. L., Harley, C. D., and O’Connor, M. I. (2011). Community ecology in a warming world: the influence of temperature on interspecific interactions in marine systems. J. Exp. Mar. Biol. Ecol. 400, 218–226. doi: 10.1016/j.jembe.2011.02.029
Lampitt, R. S., and Anita, A. N. (1997). Particle flux in the deep seas: regional characteristics and temporal variability. Deep Sea Res. I 44, 1377–1403. doi: 10.1016/s0967-0637(97)00020-4
Levin, L. A., and Smith, C. R. (1984). Response of background fauana to disturbance and enrichment in the deep sea: a sediment tray experiment. Deep Sea Res. 31, 1277–1285. doi: 10.1016/0198-0149(84)90001-3
Lotze, H. K., Lenihan, H. S., Bourque, B. J., Bradbury, R. H., Cooke, R. G., Kay, M. C., et al. (2006). Depletion, degradation, and recovery potential of estuaries and coastal seas. Science 312, 1806–1809. doi: 10.1126/science.1128035
Lutz, M. J., Caldiera, K., Dunbar, R. B., and Behrenfeld, M. J. (2007). Seasonal rhythms of net primary production and particulate organic carbon flux describes biological pump efficiency in the global ocean. J. Geophys. Res. 112:C10011.
Makarieva, A. M., Gorshkov, V. G., Li, B.-L., Chown, S. L., Reich, P. B., and Gavrilov, V. M. (2008). Mean mass-specific metabolic rates are strikingly similar across life’s major domains: evidence for life’s metabolic optimum. Proc. Natl. Acad. Sci. U.S.A. 105, 16995–16999. doi: 10.1073/pnas.0802148105
Marra, J., Weibe, P. H., Bishop, J. B., and Stepien, J. C. (1987). Primary production and grazing in the plankton of the Panama Bight. Bull. Mar. Sci. 40, 255–270.
McClain, C. R. (2004). Connecting species richness, abundance, and body size in deep-sea gastropods. Glob. Ecol. Biogeogr. 13, 327–334. doi: 10.1111/j.1466-822x.2004.00106.x
McClain, C. R. (2005). Bathymetric patterns of morphological disparity in deep-sea gastropods from the western North Atlantic Basin. Evolution 59, 1492–1499. doi: 10.1111/j.0014-3820.2005.tb01798.x
McClain, C. R., Allen, A. P., Tittensor, D. P., and Rex, M. A. (2012a). The energetics of life on the deep seafloor. Proc. Natl. Acad. Sci. U.S.A. 109, 5366–15371.
McClain, C. R., and Barry, J. P. (2010). Habitat heterogeneity, biogenic disturbance, and resource availability work in concert to regualte biodiversity in deep submarine canyons. Ecology 91, 964–976. doi: 10.1890/09-0087.1
McClain, C. R., and Barry, J. P. (2014). Beta-diversity on deep-sea wood falls reflects gradients in energy availability. Biol. Lett. 10:20140129. doi: 10.1098/rsbl.2014.0129
McClain, C. R., Barry, J. P., Eernisse, D., Horton, T., Judge, J., Kakui, K., et al. (2016). Multiple processes generate productivity-diversity relationships in experimental wood-fall communities. Ecology 97, 885–98.
McClain, C. R., Filler, R., and Auld, J. R. (2014). Does energy availaiblity predict gastropod reproductive strategies? Proc. R. Soc. B Biol. Sci. 281, 20140400. doi: 10.1098/rspb.2014.0400
McClain, C. R., Gullet, T., Jackson-Ricketts, J., and Unmack, P. J. (2012b). Increased energy promotes size-based niche availability in marine mollusks. Evolution 66, 2204–2215. doi: 10.1111/j.1558-5646.2012.01580.x
McClain, C. R., Heim, N. A., Knope, M. L., and Payne, J. L. (2018). Is biodiversity energy-limited or unbounded? A test in fossil and modern bivalves. Paleobiology 44, 385–401. doi: 10.1017/pab.2018.4
McClain, C. R., Johnson, N. A., and Rex, M. A. (2004). Morphological disparity as a biodiversity metric in lower bathyal and abyssal gastropod assemblages. Evolution 58, 338–348. doi: 10.1111/j.0014-3820.2004.tb01649.x
McClain, C. R., and Lundsten, L. (2015). Assemblage structure is related to slope and depth on a deep offshore Pacific seamount chain. Mar. Ecol. 36, 210–220. doi: 10.1111/maec.12136
McClain, C. R., Nekola, J. C., Kuhnz, L., and Barry, J. P. (2011). Local-scale turnover on the deep Pacific floor. Mar. Ecol. Prog. Ser. 442, 193–200. doi: 10.3354/meps08924
McClain, C. R., and Schlacher, T. (2015). On some hypotheses of diversity of animal life at great depths on the seafloor. Mar. Ecol. [Epub ahead of print].
McClain, C. R., Stegen, J. C., and Hurlbert, A. H. (2012c). Dispersal, niche dynamics, and oceanic patterns in beta-diversity in deep-sea bivalves. Proc. R. Soc. B Biol. Sci. 279, 1933–2002. doi: 10.1098/rspb.2011.2166
McNab, B. K. (1963). Bioenergetics and the derteminations of home range size. Am. Nat. 97, 133–140. doi: 10.1086/282264
McNab, B. K. (1986). The influence of food habits on the energetics of eutherian mammals. Ecol. Monogr. 56, 1–19. doi: 10.2307/2937268
McNab, B. K. (2016). Avian energetics: the passerine/non-passerine dichotomy. Comp. Biochem. Physiol. Part A Mol. Integr. Physiol. 191, 152–155. doi: 10.1016/j.cbpa.2015.10.005
McQuatters-Gollop, A., Reid, P. C., Edwards, M., Burkill, P. H., Castellani, C., Batten, S., et al. (2011). Is there a decline in marine phytoplankton? Nature 472, E6–E7.
Melo, A. S., Rangel, T. F. L. V. B., and Diniz-Filho, J. A. F. (2009). Environmental drivers of beta-diversity patterns in New-World birds and mammals. Ecography 32, 226–236. doi: 10.1111/j.1600-0587.2008.05502.x
Nagy, K. A. (1987). Field metabolic rate and food requirement scaling in mammals and birds. Ecol. Monogr. 57, 111–128. doi: 10.2307/1942620
Powell, E. N., and Stanton, R. J. (1985). Estimating biomass and energy-flow of mollusks in paleo-communities. Paleontology 28, 1–34.
Qian, H., and Xiao, M. (2012). Global patterns of the beta diversity–energy relationship in terrestrial vertebrates. Acta Oecol. 39, 67–71. doi: 10.1016/j.actao.2011.12.003
R Development Core Team (ed.) (2019). R: A Language and Environment for Statistical Computing. Vienna, Austria: R Foundation for Statistical Computing.
Rex, M. A., and Etter, R. J. (2010). Deep-Sea Biodiversity: Pattern and Scale. Cambridge: Harvard University Press.
Rex, M. A., Etter, R. J., Morris, J. S., Crouse, J., Mcclain, C. R., Johnson, N. A., et al. (2006). Global bathymetric patterns of standing stock and body size in the deep-sea benthos. Mar. Ecol. Prog. Ser. 317, 1–8. doi: 10.3354/meps317001
Rex, M. A., Mcclain, C. R., Johnson, N. A., Etter, R. J., Allen, J. A., Bouchet, P., et al. (2005). A source-sink hypothesis for abyssal biodiversity. Am. Nat. 165, 163–178. doi: 10.1086/427226
Rosenzweig, M. L., and Abramsky, Z. (1993). “How are diversity and productivity related?” in Species Diversity in Ecological Communities: Historical and Geographical Perspectives, eds R. E. Ricklefs and D. Schluter (Chicago, IL: University of Chicago Press), 52–65.
Rouse, G. W., Goffredi, S. K., and Vrijenhoek, R. (2004). Osedax: bone-eating marine worms with dwarf males. Science 305, 668–671. doi: 10.1126/science.1098650
Rousseaux, C. S., and Gregg, W. W. (2015). Recent decadal trends in global phytoplankton composition. Glob. Biogeochem. Cycles 29, 1674–1688. doi: 10.1080/2150704X.2017.1354263
Sanders, H. L. (1977). “Evolutionary ecology of the deep-sea benthos,” in The Changing Scenes in Natural Sciences: 1776-1976, Special Publication, ed. C. E. Goulden (Philadelphia, PA: Academy of Natural Sciences).
Shen, Y.-Y., Liang, L., Zhu, Z.-H., Zhou, W.-P., Irwin, D., and Zhange, Y.-P. (2010). Adaptive evolution of energy metabolism genes and the origin of flight in bats. Proc. Natl. Acad. Sci. U.S.A. 107, 8666–8671. doi: 10.1073/pnas.0912613107
Sircom, J., and Walde, S. J. (2010). Niches and neutral processes contribute to the resource– diversity relationships of stream detritivores. Freshw. Biol. 2011, 877–888. doi: 10.1111/j.1365-2427.2010.02533.x
Slatyer, R. A., Hirst, M., and Sexton, J. P. (2013). Niche breadth predicts geographical range size: a general ecological pattern. Ecol. Lett. 16, 1104–1114. doi: 10.1111/ele.12140
Slayter, R. A., Hirst, M., and Sexton, J. P. (2013). Niche breadth predicts geographical range size: a general ecological pattern. Ecol. Lett. 16, 1104–1114. doi: 10.1111/ele.12140
Smith, C. R., De Leo, F. C., Bernardino, A. F., Sweetman, A. K., and Arbizu, P. M. (2008). Abyssal food limitation, ecosystem structure and climate change. Trends Ecol. Evol. 23, 518–528. doi: 10.1016/j.tree.2008.05.002
Snelgrove, P. V., and Smith, C. R. (2002). A riot of species in an environmental calm: the paradox of the species-rich deep-sea floor. Oceanogr. Mar. Biol. Annu. Rev. 40, 311–342. doi: 10.1201/9780203180594.ch6
Snelgrove, P. V. R., Grassle, J. F., and Petrecca, R. F. (1992). The role of food patches in maitaining high deep-sea diversity: field experiments with hydrodynamically unbiased colonization trays. Limnol. Oceanogr. 37, 1543–1550. doi: 10.4319/lo.1992.37.7.1543
Snelgrove, P. V. R., Grassle, J. F., and Petrecca, R. F. (1994). Macrofaunal response to artificial enrichments and depressions in a deep-sea habitat. J. Mar. Sci. 52, 345–369. doi: 10.1357/0022240943077082
Snelgrove, P. V. R., Grassle, J. F., and Petrecca, R. F. (1996). Experimental evidence for aging food patches as a factor contributing to high deep-sea macrofaunal diversity. Limnol. Oceanogr. 41, 605–614. doi: 10.4319/lo.1996.41.4.0605
Soininen, J., Lennon, J. J., and Hillebrand, H. (2007a). A multivariate analysis of beta diversity across organisms and environments. Ecology 88, 2830–2838. doi: 10.1890/06-1730.1
Soininen, J., Mcdonald, R., and Hillebrand, H. (2007b). The distance decay of similarity in ecological communties. Ecography 30, 3–12. doi: 10.1111/j.0906-7590.2007.04817.x
Sokolova, M. N. (1960). On the distribution of deep-water bottom animals in relation to their feeding habits and the character of sedimentation. Deep Sea Res. 6, 1–4. doi: 10.1016/0146-6313(59)90052-8
Steffen, W., Broadgate, W., Deutsch, L., Gaffney, O., and Ludwidg, C. (2015). The trajectory of the Anthropocene: the great acceleration. Anthropocene Rev. 2, 1–18. doi: 10.1038/s41586-018-0005-6
Stuart, C. T., Brault, S., Rowe, G. T., Wei, C.-L., Wagstaff, M., Mcclain, C. R., et al. (2016). Nestedness and species replacement along bathymetric gradients in the deep sea reflect productivity: a test with polychaete assemblages in the oligotrophic north-west Gulf of Mexico. J. Biogeogr. 44, 548–555. doi: 10.1111/jbi.12810
Tamburello, N., Cote, I. M., and Dulvy, N. K. (2015). Energy and the scaling of animal space use. Am. Nat. 186, 196–211. doi: 10.1086/682070
Thiel, H. (1975). The size structure of the deep-sea benthos. Int. Rev. Gesamten Hyrdobiol. 60, 575–606. doi: 10.1111/gcb.12480
Tilman, D. (1982). Resource Competition and Community Structure. Princeton, NJ: Princeton University Press.
Tittensor, D. P., Mora, C., Jetz, W., Lotze, H. K., Berghe, E. V., and Worm, B. (2010). Global patterns and predictors of marine biodiveristy across taxa. Nature 466, 1098–1101. doi: 10.1038/nature09329
Tittensor, D. P., Rex, M. A., Stuart, C. T., Mcclain, C. R., and Smith, C. R. (2011). Species-energy relationships in deep-sea mollusks. Biol. Lett. 7, 718–722. doi: 10.1098/rsbl.2010.1174
Tomasovych, A., Jablonski, D., Berke, S. K., Krug, A. Z., and Valentine, J. W. (2015). Nonlinear thermal gradients shape broad-scale patterns in geographic range size and can reverse Rapoport’s rule. Glob. Ecol. Biogeogr. 24, 157–167. doi: 10.1111/geb.12242
Turner, R. D. (1973). Wood-boring bivalves, opportunistic species in the deep sea. Science 180, 1377–1379. doi: 10.1126/science.180.4093.1377
Uyeda, J. C., Pennell, M. W., Miller, E. T., Maia, R., and Mcclain, C. R. (2017). The evolution of energetic scaling across the vertebrate tree of life. Am. Nat. 190, 185–199. doi: 10.1086/692326
Van Dover, C. L. (2000). The Ecology of Deep-Sea Hydrothermal Vents. Princeton, NJ: Princeton University Press.
Vaquer-Sunyer, R., and Duarte, C. M. (2008). Thresholds of hypoxia for marine biodiversity. Proc. Natl. Acad. Sci. U.S.A. 105, 15452–15457. doi: 10.1073/pnas.0803833105
Vladimirova, I. G., Kleimenov, S. Y., and Radzinskaya, L. I. (2003). The relation of energy metabolism and body weight in bivalves (Mollusca: Bivalvia). Biol. Bull. 30, 392–399.
Voight, C. C., and Speakman, J. R. (2007). Nectar-feeding bats fuel their high metabolism directly with exogenous carbohydrates. Funct. Ecol. 21, 913–921. doi: 10.1242/jeb.043505
Wagstaff, M. C., Howell, K. L., Bett, B. J., Billet, D. S. M., Brault, S., Stuart, C. T., et al. (2014). β-diversity of deep-sea holothurians and asteroids along a bathymetric gradient (NE Atlantic). Mar. Ecol. Prog. Ser. 508, 177–185. doi: 10.3354/meps10877
Waide, R. B., Willig, M. R., Steiner, C. F., Mittelbach, G. C., Gough, L., Dodson, S. I., et al. (1999). The relationship between productivity and species richness. Annu. Rev. Ecol. Syst. 30, 257–300.
Wei, C.-L., Rowe, G. T., Escobar-Briones, E., Boetius, A., Soltwedel, T., Caley, M. J., et al. (2010a). Global patterns and predictions of seafloor biomass using random forests. PLoS One 5:e15323. doi: 10.1371/journal.pone.0015323
Wei, C.-L., Rowe, G. T., Hubbard, G. F., Sheltema, A. H., Wilson, G. D. F., Petrescu, I., et al. (2010b). Bathymetric zonation of deep-sea macrofauna in relation to export of surface phytoplankton production. Mar. Ecol. Prog. Ser. 399, 1–14. doi: 10.3354/meps08388
Whittaker, R. H. (1960). Vegetation of the Siskiyou mountains, Oregan and California. Ecol. Monogr. 30, 279–338. doi: 10.2307/1943563
Whitton, F. S., Purvis, A., Orme, C. D. L., and Olalla-TaìRraga, M. A. (2012). Understanding global patterns in amphibian geographic range size: does Rapoport rule? Glob. Ecol. Biogeogr. 21, 179–190. doi: 10.1111/j.1466-8238.2011.00660.x
Wilke, C. O. (2018). ggridges: Ridgeline Plots in ’ggplot2. Available at: https://CRAN.R-project.org/package=ggridges
Wilson, R. P., Mcmahon, C. R., Quintana, F., Frere, E., Scolaro, A., Hays, G. C., et al. (2011). N-dimensional animal energetic niches clarify behavioural options in a variable marine environment. J. Exp. Biol. 214, 646–656. doi: 10.1242/jeb.044859
Wood, S. N. (2011). Fast stable restricted maximum likelihood and marginal likelihood estimation of semiparametric generalized linear models. J. R. Stat. Soc. 73, 3–36. doi: 10.1111/j.1467-9868.2010.00749.x
Woolley, S. N. C., Titternsor, D. P., Dusntan, P. K., Guillera-Arroita, G., Lahoz-Monfrort, J. J., Wintle, B. A., et al. (2016). Deep-sea diversity patterns are shsaped by energy availability. Nature 533, 393–396. doi: 10.1038/nature17937
Wright, D. H. (1983). Species-energy theory: An extension of species-area theory. Oikos 41, 496–506.
Wright, D. H., Currie, D. J., and Maurer, B. A. (1993). “Energy supply and patterns of species richness on local and regional scales,” in Species Diversity in Ecological Communities: Historical and Geographical Perspectives, eds R. E. Ricklefs and D. Schluter (Chicago, IL: University of Chicago Press), 66–74.
Keywords: energetic, metabolism, adaptation, diversity, niche
Citation: McClain CR, Webb TJ, Nunnally CC, Dixon SR, Finnegan S and Nelson JA (2020) Metabolic Niches and Biodiversity: A Test Case in the Deep Sea Benthos. Front. Mar. Sci. 7:216. doi: 10.3389/fmars.2020.00216
Received: 01 November 2019; Accepted: 19 March 2020;
Published: 15 April 2020.
Edited by:
Jeroen Ingels, Florida State University, United StatesReviewed by:
Michael Vecchione, National Oceanic and Atmospheric Administration (NOAA), United StatesAnn Vanreusel, Ghent University, Belgium
Copyright © 2020 McClain, Webb, Nunnally, Dixon, Finnegan and Nelson. This is an open-access article distributed under the terms of the Creative Commons Attribution License (CC BY). The use, distribution or reproduction in other forums is permitted, provided the original author(s) and the copyright owner(s) are credited and that the original publication in this journal is cited, in accordance with accepted academic practice. No use, distribution or reproduction is permitted which does not comply with these terms.
*Correspondence: Craig R. McClain, Y21jY2xhaW5AbHVtY29uLmVkdQ==