 Guisheng Song
 Liang Zhao3
 Fangfang Liu
 Huixiang Xie
- 1School of Marine Science and Technology, Tianjin University, Tianjin, China
- 2State Key Laboratory of Satellite Ocean Environment Dynamics, Second Institute of Oceanography, Ministry of Natural Resources, Hangzhou, China
- 3College of Marine and Environmental Sciences, Tianjin University of Science and Technology, Tianjin, China
- 4Institut des Sciences de la mer de Rimouski, Université du Québec à Rimouski, Rimouski, QC, Canada
Increasing attention has recently been drawn to oxygen depletion and ocean acidification in coastal seas and their impacts on the marine ecosystem. Intensive organic matter degradation combined with weak water exchange is considered to be mainly responsible for bottom water oxygen depletion and acidification. Hypoxia and acidification in the bottom water of Bohai Sea have been frequently observed in summer seasons over the past decade. In this study, monthly surveys were conducted along an inshore-offshore transect in the north Bohai Sea from May to August in 2017 and 2018. The physical structure of the water column in the study area was characterized by a well-mixed surface layer and an essentially homogeneous deep layer that were separated by a strong pycnocline over the period from mid-Jun to late August in both years. Dissolved oxygen (DO), pH, and dissolved inorganic carbon (DIC) in the water column were also split into two layers by the pycnocline and varied little in each layer. No significant interannual variations were observed for the temporal progressions of DO, pH and DIC in the bottom water. Average DO concentration and pH in the bottom water linearly decreased with time from May to August while DIC presented an opposite trend. DO became increasingly unsaturated from mid-June to late August when DO decreased to 96 μmol L–1 and pH to 7.74. The molar ratio of net oxygen consumption to DIC production was 1.42, similar to the Redfield ratio (1.30). Pelagic respiration (>60%) linked to degradation of fresh organic matter prevailed over sediment respiration (<40%) in contributing to the oxygen depletion and acidification observed in this shallow water body. The duration and intensity of oxygen depletion and acidification in the study area were strongly affected by stormy weather events such as typhoons.
Introduction
Water masses undergoing oxygen depletion and acidification are expanding globally in both open oceans and coastal seas (Matear and Hirst, 2003; Carstensen et al., 2014). Oxygen depletion and ocean acidification can reduce the ocean’s biodiversity (Rabalais et al., 2002; Fabricius et al., 2011) and influence the abundance and activity of bacteria (Galán et al., 2009; Galgani et al., 2014). Prolonged exposure to low oxygen conditions may change the population and community structure of zooplankton (Keister et al., 2000) and benthic organisms (Vaquer-Sunyer and Duarte, 2008). Ocean acidification can also inhibit the activity of calcifying organisms (Orr et al., 2005; Hoegh-Guldberg et al., 2007) and hence decrease the downward flux of CaCO3 to the deep ocean (Feng et al., 2008). Consequently, oxygen depletion and ocean acidification have potentially important impacts on the structure and function of the marine ecosystem (Diaz and Rosenberg, 2008), the ocean’s fisheries industry (Rabalais et al., 2002; Rheuban et al., 2018), and the dynamics of organic and inorganic matter (Galgani et al., 2014).
Oxygen depletion and concomitant acidification in the bottom water of coastal seas stem from a combination of strengthened bacterial respiration and restricted water exchange (Diaz, 2001; Wallace et al., 2014). The increase in bacterial respiration is often linked to eutrophication which enhances primary production (Smodlaka, 1986) and therefore downward particulate organic matter transport to the bottom water and sediments. The relative contributions of pelagic and sedimentary respiration of organic matter to the water column oxygen consumption vary substantially among different hypoxic waters, depending to a large extent on the depth of the water column and the topography of the seabed (Hetland and DiMarco, 2008; Murrell and Lehrter, 2011; Bourgault et al., 2012). Similarly, the relative contributions of fresh, autochthonous organic matter and old, allochthonous organic matter to the water column oxygen consumption differ considerably as well from one hypoxic system to another, depending in part on the quantity and lability of the allochthonous organic matter (Rabalais et al., 2002; Wang et al., 2017; Su et al., 2017, 2020). In addition to organic matter input, stormy weather conditions, such as typhoons and hurricanes, can also strongly impact the duration and intensity of oxygen depletion and acidification in coastal bottom waters, given that these events can dramatically alter the physical stability of the water column and redistribute nutrients therein (McCarthy et al., 2013; Ni et al., 2016; Su et al., 2017).
Located in the northeast China, the Bohai Sea is a semi-closed coastal sea that is connected to the Yellow Sea to the east via the Bohai Channel (Figure 1). Eutrophication in the Bohai Sea has been deteriorating in the past 30 years due to industrialization and urbanization along its coast (Zhang et al., 2012; Yu et al., 2013) combined with its limited water exchange with the outside. Increasing eutrophication and strong water column stratification in summer have led to decreasing summertime dissolved oxygen (DO) concentration in the bottom water of the Bohai Sea in the past decades (Zu et al., 2005; Ning et al., 2010). Zhai et al. (2012) first reported the occurrence of significant oxygen depletion and acidification in the nearshore bottom water of the northeastern and northern Bohai Sea, with pH and DO decreasing by 0.29 and 170 μmol kg–1, respectively, from June to August. Later studies demonstrated that summertime oxygen depletion in the Bohai Sea shows a two-core feature corresponding to the two cold cores located in the bottom water of the western and northern Bohai Sea (Zhao et al., 2017; Wei et al., 2019). Currently, little is known about the duration, intensity, and interannual variability of the summertime oxygen depletion and acidification in the Bohai Sea. Moreover, the source (pelagic vs. sedimentary) and nature (fresh vs. old) of the organic matter dominating oxygen consumption in the bottom water of the Bohai Sea remain unclear, though organic matter degradation has been considered to be responsible for the observed oxygen depletion and acidification there (Zhai et al., 2012; Zhao et al., 2017; Wei et al., 2019). In this study, we investigated the temporal evolution of DO, pH, and dissolved inorganic carbon (DIC) in the bottom water on the west coast of the Bohai Sea over two summer seasons to assess the rates of oxygen consumption and acidification and the pelagic vs. sedimentary contribution to the observed oxygen depletion and acidification. We also assessed the impact of Typhoon Rumbia, which passed over the Bohai Sea during late summer of 2018, on bottom water oxygen depletion and acidification in the study area.
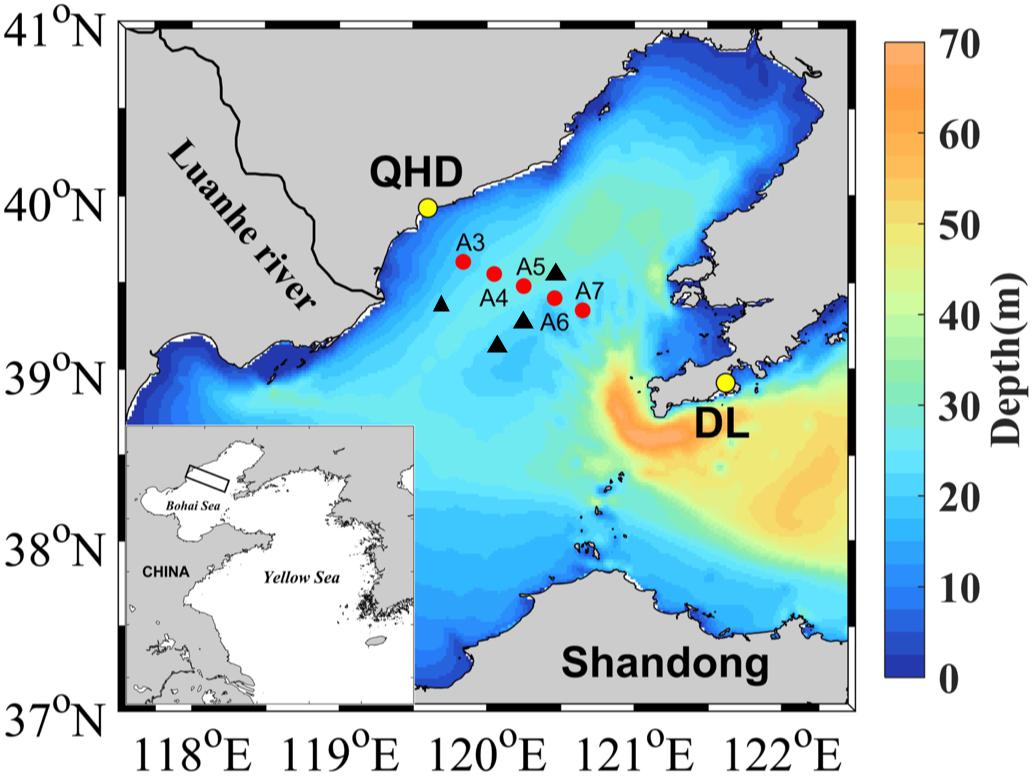
Figure 1. Map of sampling stations. See Table 1 for the coordinates of the sampling stations and other sampling information. Red points denote stations sampled in 2017 and 2018 and the black triangles represent stations visited in June and August 2011 by Zhai et al. (2012) (see section Oxygen Depletion and Acidification in the Bottom Layer). QHD and DL denote Qinhuangdao City and Dalian City, respectively.
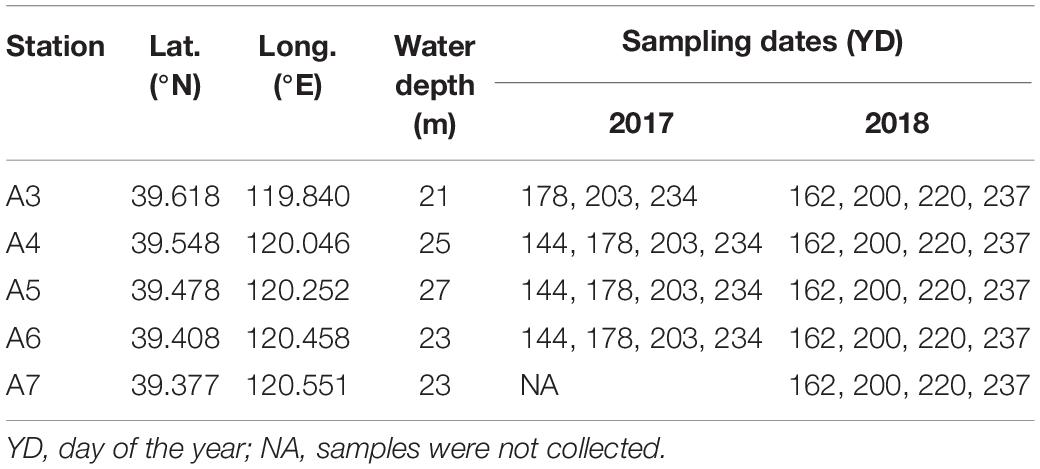
Table 1. Coordinates, water depth, and sampling dates.
Sample Collection and Analysis
DO, pH, and DIC were investigated during the summers of 2017 and 2018 along an inshore-offshore transect across the known oxygen depletion area with four cruises being conducted each year (Figure 1 and Table 1). The transect, located off Qinhuangdao City, crossed the southwest of the bowl-shaped depression extending from northeast to southwest (Figure 1; Zhou et al., 2017). In summer, cyclonic circulation is dominant in this area, and horizontal transport in bottom water is weak, with the current velocity <30 cm s–1 (Zhou et al., 2017). Water samples were collected from 4 to 6 depths using a 5 L Niskin bottle and vertical profiles of temperature and salinity were simultaneously acquired using a RBR maestro multi-parameter. Upon on the deck, water in the Niskin bottle was immediately transferred into 100-mL brown glass bottles, 60-mL transparent glass bottles, and 250-mL polypropylene bottles for DO, DIC, and pH measurements, respectively. Sample transfer, storage, and analysis for DO followed the Winkler method (Grasshoff et al., 1999). An auto-titrator (Brand: Mettler Toledo, model: G10S) was used for DO analysis, and the relative standard deviation for all triplicate samples was <2%. pH and DIC samples were also transferred without air contamination by sufficient overflowing. pH samples were stored in the dark at room temperature (∼22°C) and DIC in dark at 4°C. Saturated HgCl2 solution (250 μL) was added into the DIC samples to prevent biological activities during storage. pH was measured on board right after the sample was warmed to lab temperature (22 ± 0.5°C), using a bench pH meter (Brand: Mettler Toledo; Model: S210) equipped with an Inlab® Expert Pro pH probe. Before use, the pH meter was calibrated with three NIST (NBS) buffers at pH 4.00, 7.01, and 9.24 (22°C) purchased from Mettler Toledo. The pH values of the buffers at 22°C were linearly interpolated from their corresponding certified pH values at 20 and 25°C. Then a Tris buffer, provided by A. G. Dickson’s lab at Scripps Institution of Oceanography, was used to convert the NBS scale (pHNBS) to the total hydrogen ion concentration scale (i.e., pHT). The measured pHNBS of the Tris buffer was 0.12 ± 0.01 (n = 24) higher than its pHT value at 22°C which was converted from the certified pHT value at 25°C using the excel conversion file provided by A. G. Dickson’s lab. The difference between pHNBS and pHT obtained here was comparable with those reported previously (Zhai et al., 2012; Cai et al., 2017). For each sample, at least three pHNBS values, along with temperature, were recorded. If the differences among the three values were less than 0.01, their average was taken as the measured pHNBS of this sample. The pHT values of the samples at the measured temperatures were retrieved by subtracting 0.12 from the pHNBS values and then corrected to the in situ temperatures and pressures using the CO2Sys software (Pierrot et al., 2006). The uncertainty of pH measurement was estimated to be 0.005 ± 0.008 pH units based on 360 sets of triplicate measurements. DIC concentrations for all duplicate subsamples were measured in triplicate injections using a Shimadzu TOC-Lcph analyzer in a land-based lab, with the coefficient of variation <2%. The analyzer was daily calibrated with a certified DIC reference standard (batch# 174, provided by A. G. Dickson’s lab) with a mean concentration of 2050.84 ± 0.66 μmol kg–1 or 2099.14 ± 0.68 μmol L–1 at the temperature of calibration and sample analysis (20°C). The relative standard deviation was 0.75% based on five triplicate analyses of the DIC reference standard. The unit of DIC concentrations were expressed in μmol L–1.
After the collection of the water samples, current velocity at station A5 was continuously recorded for 47 h with a Nortek Acoustic Doppler Velocimetry (ADV) from 22:00 of day of year 220 (YD 220) in 2018. The downward-looking ADV sampling volume was set up at ∼0.3 m above the bottom, with a sampling rate of 32 Hz. Continuous temperature, salinity and DO concentration in this layer were determined by the RBR maestro multi-parameter. The mean downward oxygen flux through the bottom boundary layer (i.e., oxygen consumption by sedimentary organic matter, FBBL) at the interval of 0.5 h was calculated using Equation (1) (Wang et al., 2016):
where D is the oxygen diffusion coefficient (m2 s–1), CBBL is the DO concentration in the bottom boundary layer (μmol L–1), T denotes the temperature in the bottom boundary layer and Tm the mean temperature of the dataset during the continuous measurement. could be calculated based on the measured current velocity according to Wang et al. (2013). The oxygen diffusion coefficient (D) was obtained based on the bottom water temperature and salinity (Ramsing and Gundersen, 1994). Both CBBL and T were measured by the RBR maestro multi-parameter (see above).
Meanwhile, the turbulent kinetic energy (TKE) dissipation rate (ε) was hourly scanned using a vertical microstructure profiler (VMP-200) manufactured by Rockland Scientific International (RSI). The VMP was equipped with two high-frequency shear probes with a sampling frequency of 512 Hz. The TKE dissipation rate ε was estimated by fitting the empirical Nasmyth spectrum to the measured shear spectra with the calculation methods have been clearly depicted before (Gregg, 1999; Wolk et al., 2002; Xu et al., 2020). Hourly DO vertical profiles at this station were synchronously determined by another RBR maestro multi-parameter. The oxygen sensors used above were corrected with the corresponding titrated DO concentrations during sampling on YD 220(2018). The eddy diffusivity Kρ (m2 s–1) was estimated using the formula (Osborn, 1980):
where Γ (unitless) is the mixing efficiency and is assigned to be a constant of 0.2 (Osborn, 1980), ε the TKE dissipation rate (W kg–1), and N2 the squared buoyancy frequency (s–2). N2 was calculated based on the density profile according to Jackett and McDougall (1995). Then the vertical turbulent oxygen diffusion flux through the pycnocline (Fp, mmol m–2 s–1) was estimated using Equation (3) (Rippeth et al., 2009):
where Δz stands for the thickness of the pycnocline and ΔDO for the difference in DO concentration between the upper and lower boundary of the pycnocline. ΔDO/Δz thus denotes the vertical gradient of DO across the pycnocline.
Results and Discussion
Physical and Biological Settings
The water depth along the transect ranged from 21 to 27 m, with the maximum occurring at station A5 (Table 1). The depth ranges of the pycnoclines, where N2 exceeded 0.001 s–2, at the sampling stations are shown in Table 2. Note that the pycnocline was undetectable, per the criterium of N2 >0.001 s–2, across the entire transect on YD 144 (24 May) in 2017 and at station A3 on YD 237 (25 August) in 2018, though weak stratification was visually noticeable on both occasions based on the vertical profiles of water temperature, salinity, and density (Figure 2). The absence of a fully developed pycnocline on YD 144(2017) was due to the relatively low surface water temperature (14.5–16.2°C) preventing the formation of a strong stratification. The passage of Typhoon Rumbia over the Bohai Sea on YD 231-232(2018), which created intensive turbulence, was mainly responsible for the weak stratification on YD 237(2018). Owning to the abrupt heavy wind just within 15 h before sampling on YD 203(2017), the depths of the pycnocline were much deeper than that during other cruises (Figure 2 and Table 2). During the other cruises, the water column was separated into a well-mixed surface layer (“surface layer” hereafter) and a nearly homogenous deep layer (“bottom layer” hereafter) by a strong thermocline or pycnocline (Figure 2 and Supplementary Figures S1, S2). In each layer, the water temperature and salinity (and thus density) varied little. Despite the lack of a quantifiable pycnocline, a bottom layer with depth > 16 m was assigned to YD 144(2017) based on the visually observable decrease in temperature and increase in density at the middle of the water column (14–16 m) (Figure 2). The vertical profile of temperature almost mirrored that of density, indicating that temperature was the dominant factor controlling the distribution of density. In contrast, the halocline was much weaker and the bottom-surface difference in salinity was mostly <0.87 across the entire transect. The lower-than-expected surface salinity on YD 200(2018) was due to the heavy precipitation in July. Water temperature generally increased with time in the whole water column. Yet surface water temperature along the entire transect on YD 237(2018) was 1.60 ± 0.94°C lower than that on YD 220(2018) due to the strong water column mixing by Typhoon Rumbia. Salinity slightly decreased from May to August in both years but the decrease was larger in 2018 because of a relatively heavier precipitation in 2018. As expected from the temporal trends of temperature and salinity, density gradually decreased from May to August in both years.
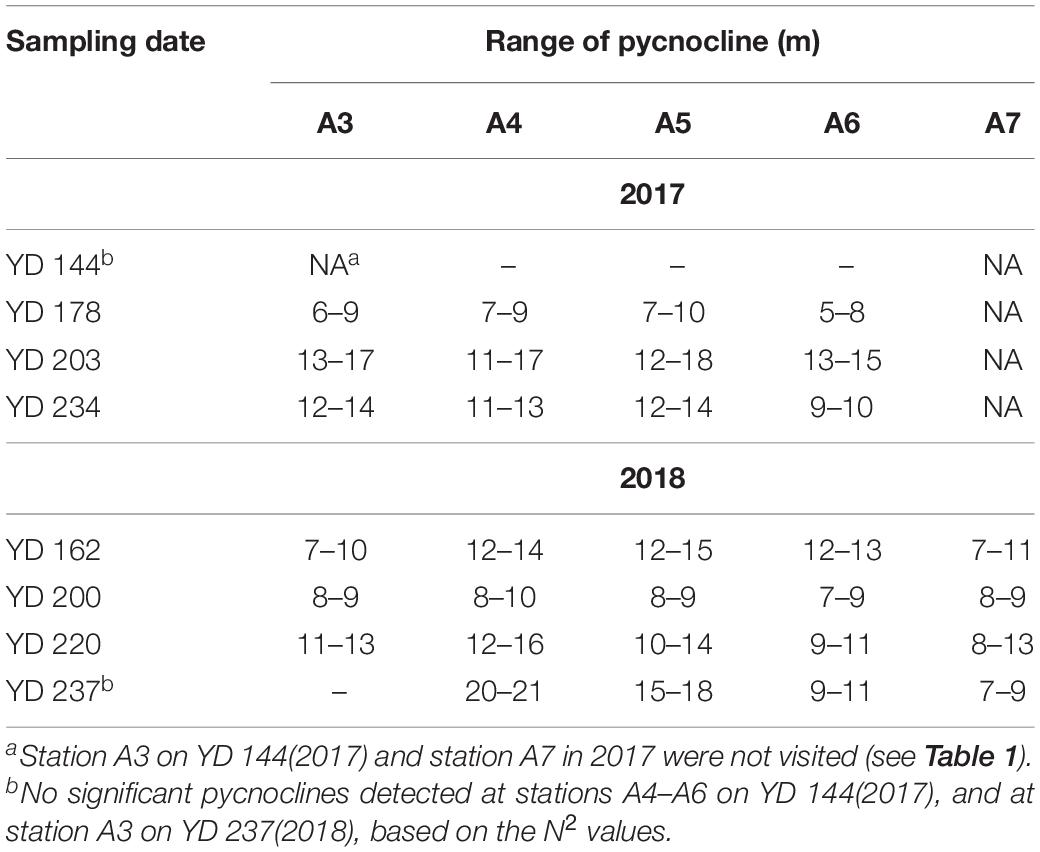
Table 2. Depth range of the pycnocline based on the buoyance frequency (N2).
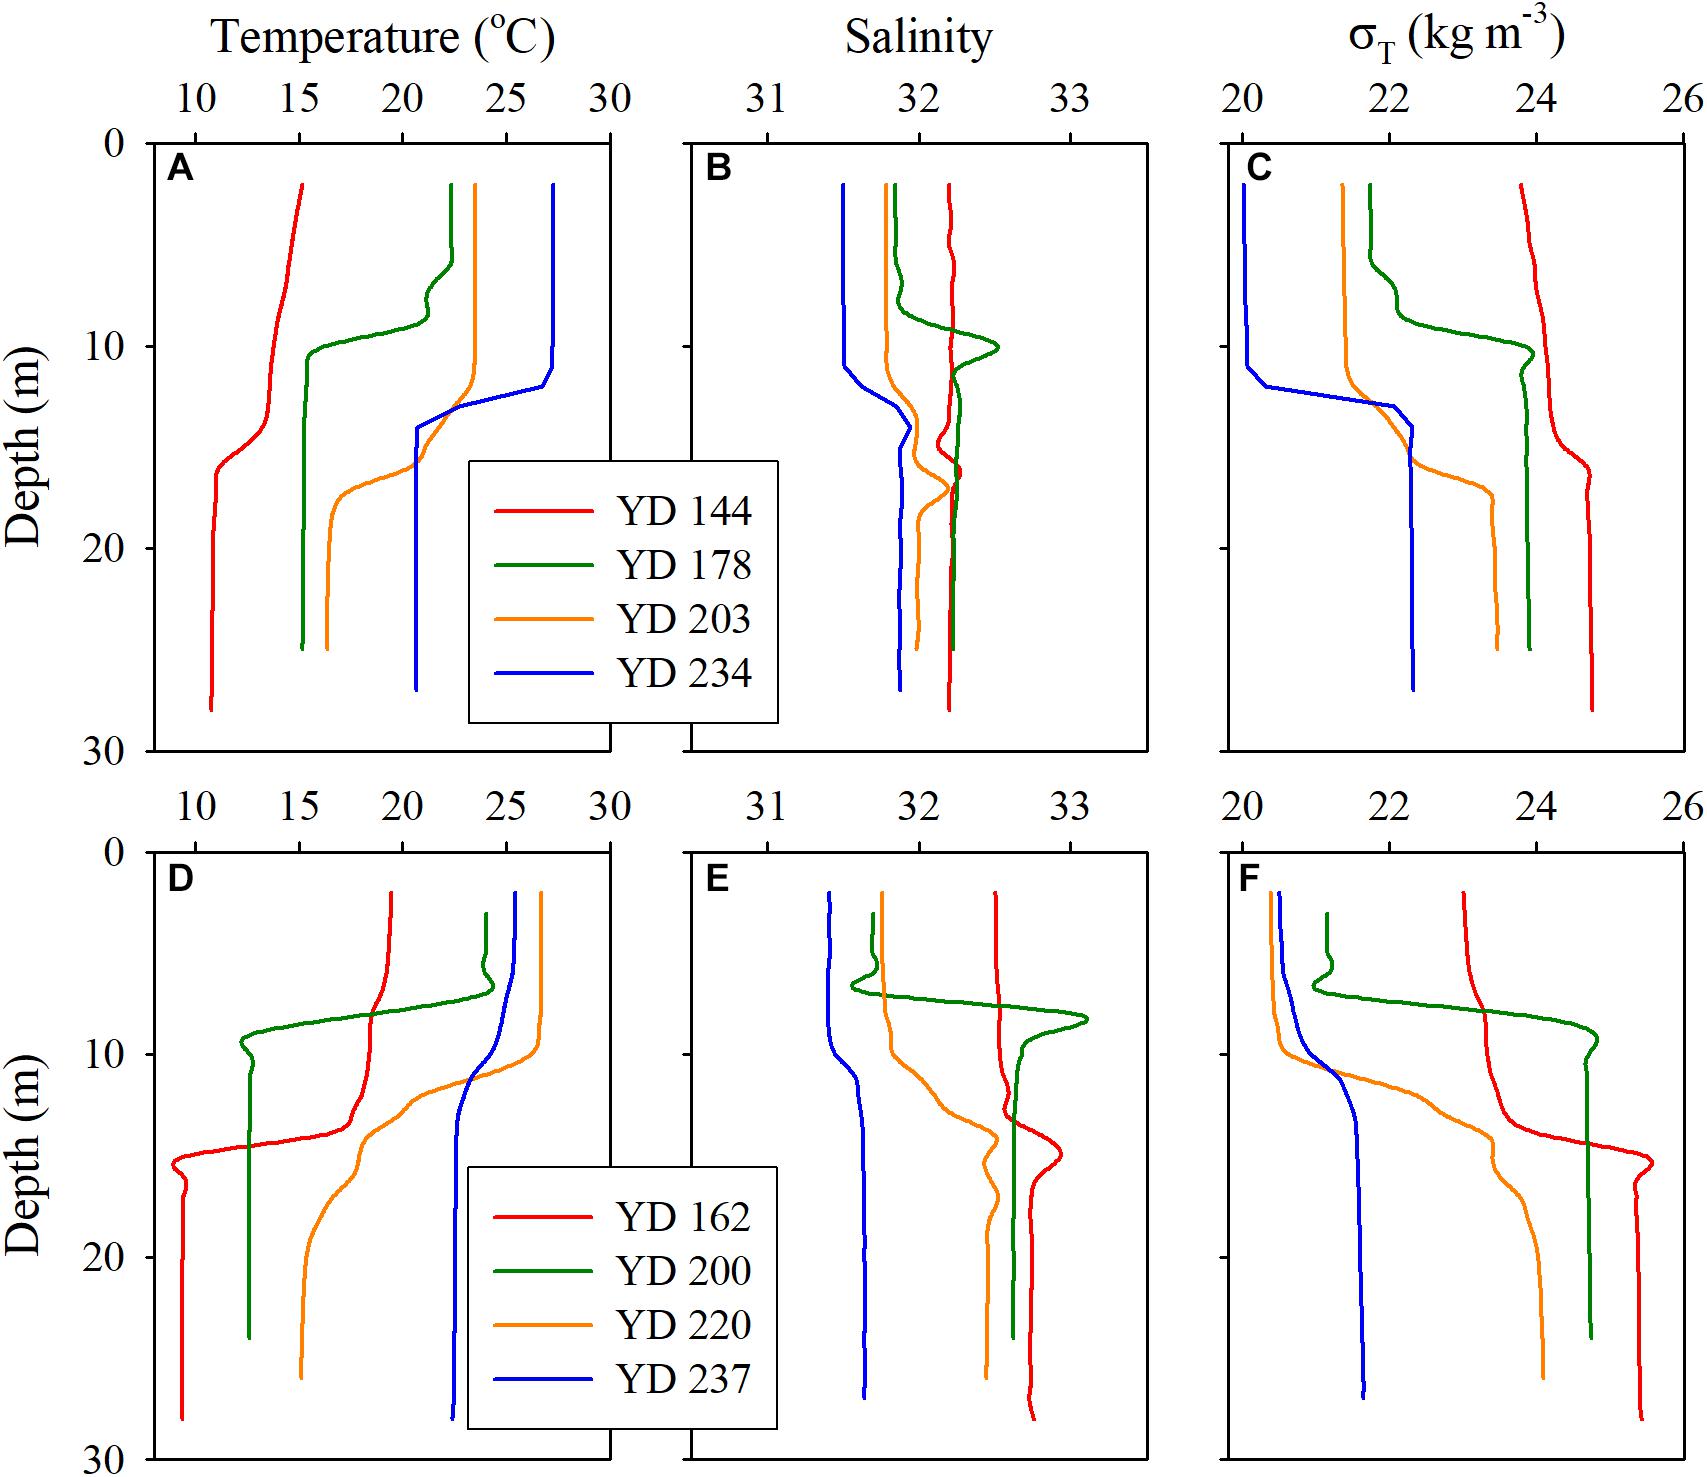
Figure 2. Vertical profiles of temperature (A,D), salinity (B,E), and density (C,F) for each cruise at station A5 in 2017 (upper panels) and 2018 (lower panels).
Vertical Profiles of DO, pHT, and DIC
The vertical profiles of DO, pHT, and DIC displayed a double-layer feature similar to that of density, i.e., homogeneous or weak gradients in the surface and bottom layers and rapid changes within the pycnoclines (Figures 3). DO and pHT in the surface layer were higher than in the bottom layer while DIC exhibited an inverse pattern. The temporal variations in pHT, DO, and DIC in the surface layer were generally less regular and smaller than those in the bottom layer. These phenomena can be attributed to more complex processes in controlling the dynamics of pHT, DO, and DIC in the surface layer (e.g., air-sea exchange, photosynthesis, respiration) than those in the bottom layer (mainly respiration only). In 2017, pHT and DO decreased while DIC increased progressively in the bottom layer from late May (YD 144) to late August (YD 234) (Figures 3A–C). In 2018, a similar temporal trend was seen in the bottom layer from mid-June (YD 162) to early August (YD 220) but this trend was sharply reversed in late August (YD 237) (Figures 3D–F) as a result of the disruption of the stable vertical structure of the water column by Typhoon Rumbia (Figure 2F).
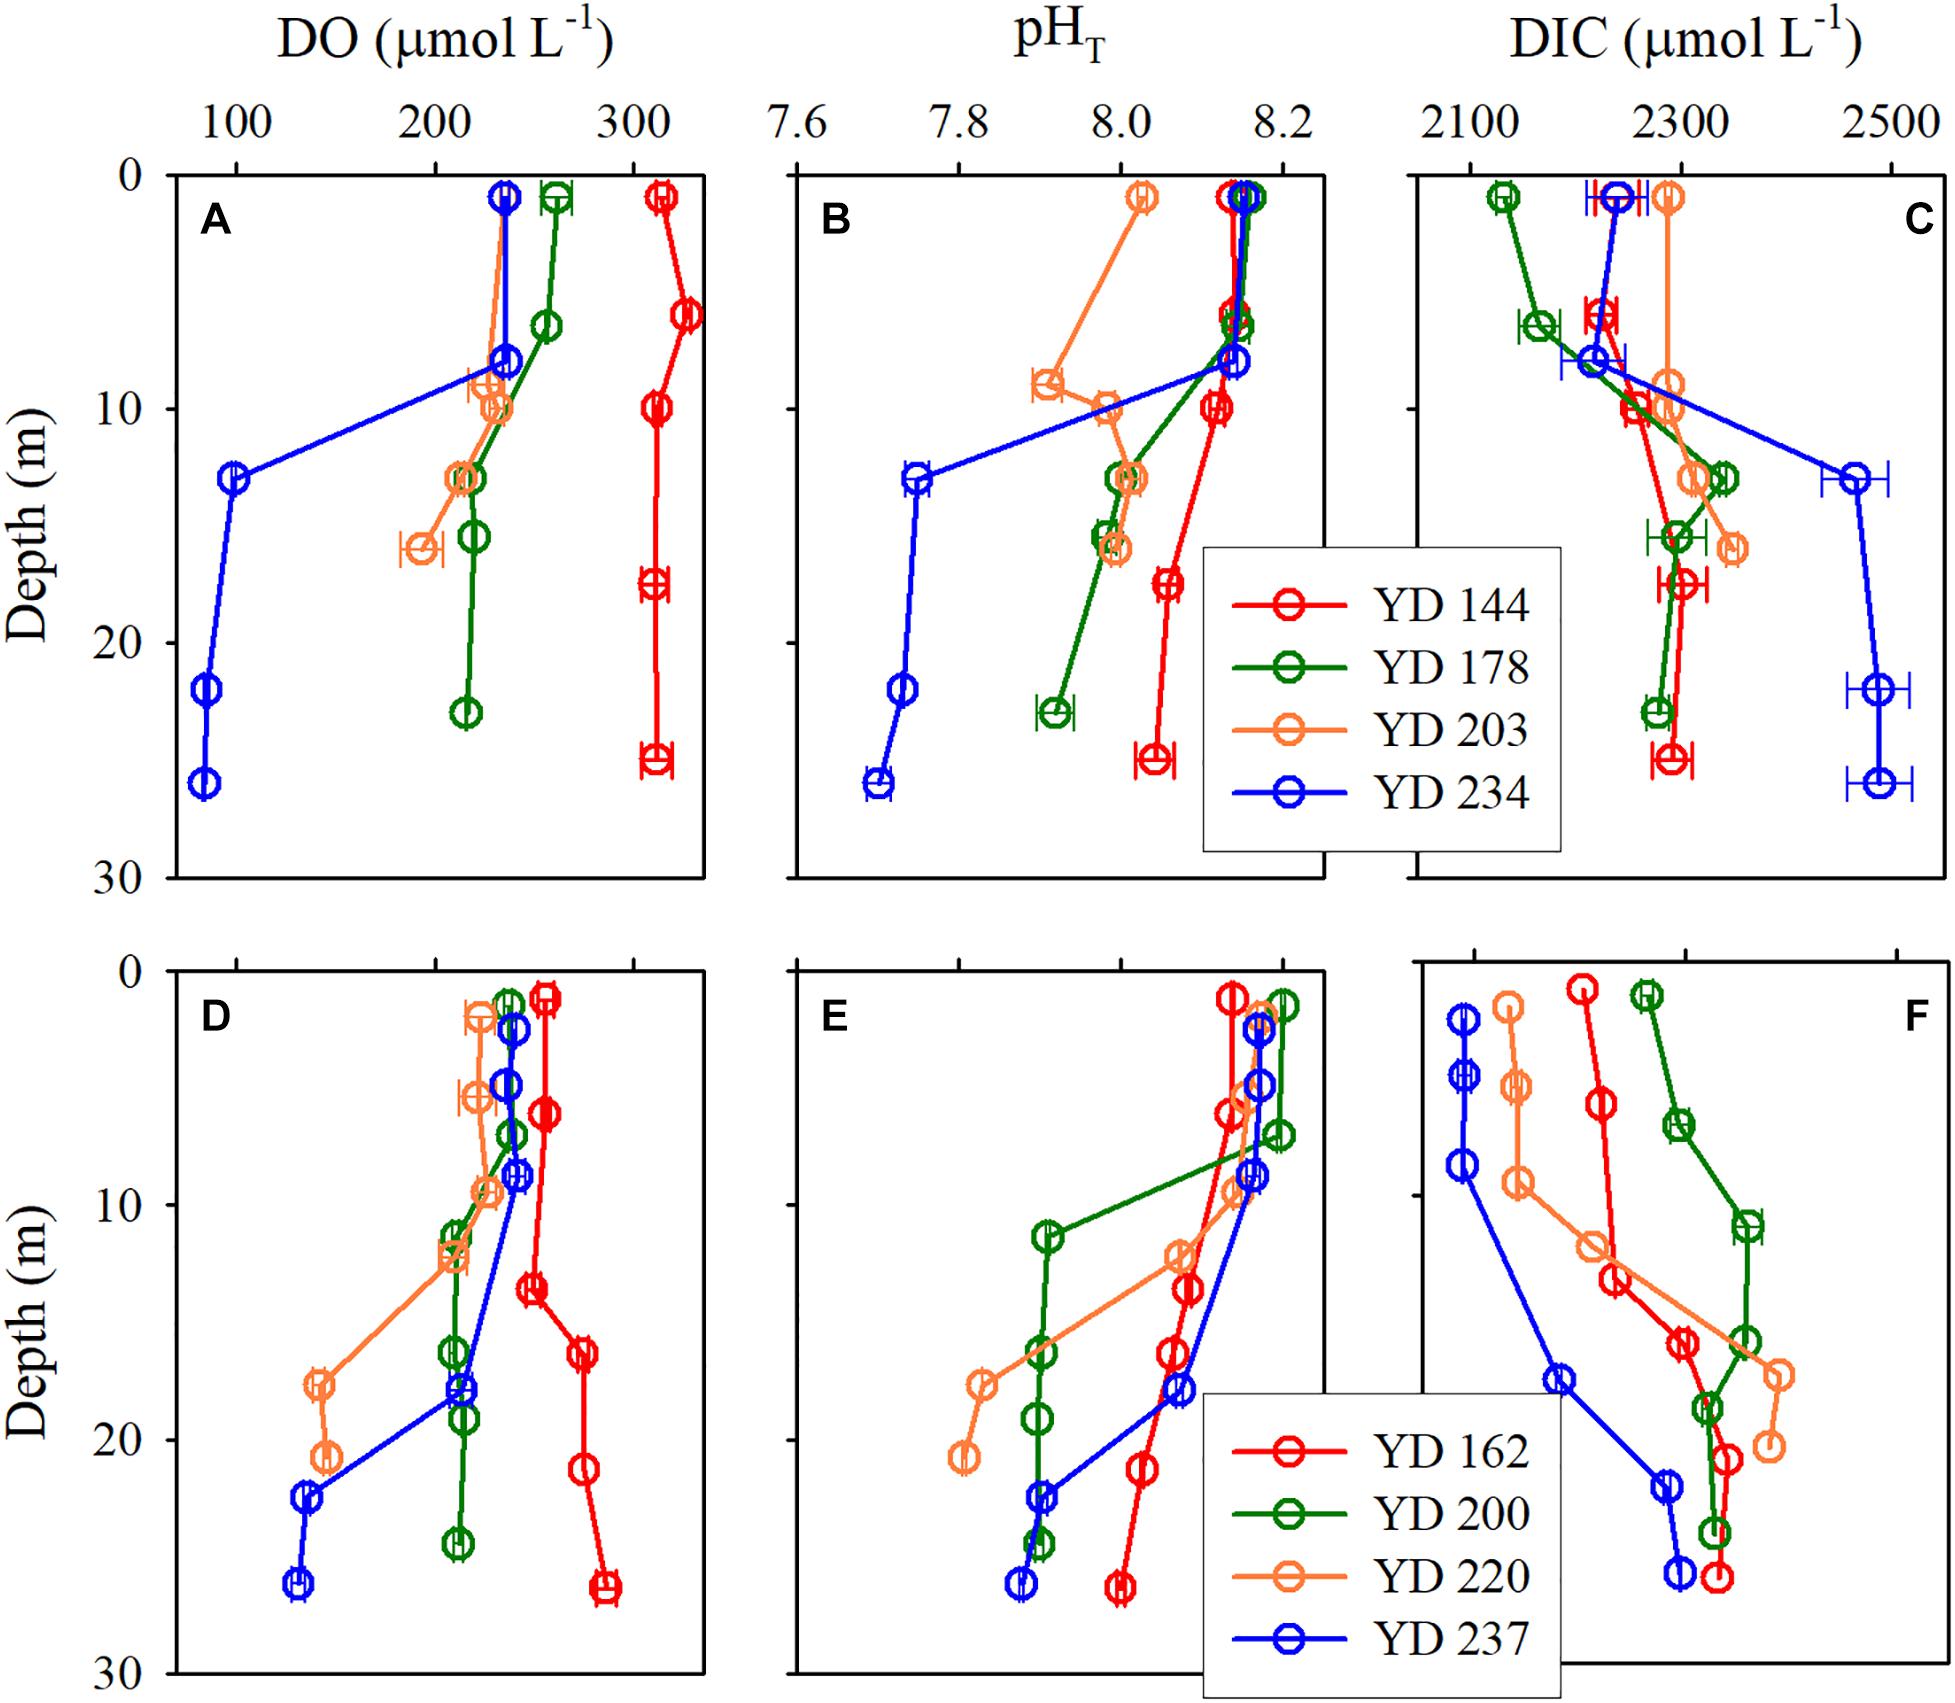
Figure 3. Vertical profiles of DO (A,D), pHT (B,E), and DIC (C,F) for each cruise at station A5 in 2017 (upper panels) and 2018 (lower panels).
Oxygen Depletion and Acidification in the Bottom Layer
Since the water mass was essentially homogenous beneath the pycnocline (Supplementary Figures S1, S2), the average values of DO, pHT, and DIC in bottom water (see section Physical and Biological Settings) along the entire transect were calculated for discussion. For each sampling year, DO, pHT, and DIC changed linearly with YD (Table 3). Student’s t-test did not show significant interannual variations for the progressions of DO, pHT and DIC over the sampling periods (p > 0.45). The daily decreasing rates of DO and pHT obtained from the present study, i.e., the regressed slopes in Table 3, were also comparable with those in summer 2011 (DO: 2.13 ± 0.14 μmol L–1 d–1; pHT: 0.0038 ± 0.0006 d–1) observed near our sampling transect (Zhai et al., 2012; Figure 1). These results demonstrate little interannual variations in the rates of oxygen consumption and the associated acidification in the bottom water of the study area from 2011 to 2018. For the above comparison, the pHT at 25°C (pH25) reported by Zhai et al. (2012) was converted to in situ temperature pHT using the method presented in section Sample Collection and Analysis. In addition, DO concentration was also converted from the units of μmol kg–1 to μmol L–1 using the samples’ potential densities. Owing to lack of interannual variability, we combined our 2-year data to simplify discussion. The composite data lead to a net oxygen consumption rate of 2.18 μmol L–1 d–1, a net DIC production rate of 1.54 μmol L–1 d–1, and an acidification rate of 0.0037 pH d–1 (Figure 4 and Table 4). The oxygen consumption rate was similar to that in the North Sea–Baltic Sea transition zone (0.28–2.8 μmol L–1 d–1) (Hansen and Bendtsen, 2014), but lower than that in the northern Gulf of Mexico (3.8–106 μmol L–1 d–1) (Murrell and Lehrter, 2011; McCarthy et al., 2013). The ratio of the oxygen depletion rate to the acidification rate is 589 μmol L–1 pH–1, comparable to the modeled ratio (588 μmol kg–1 pH–1) for the northern Gulf of Mexico and the East China Sea with present atmospheric CO2 level (Cai et al., 2011).
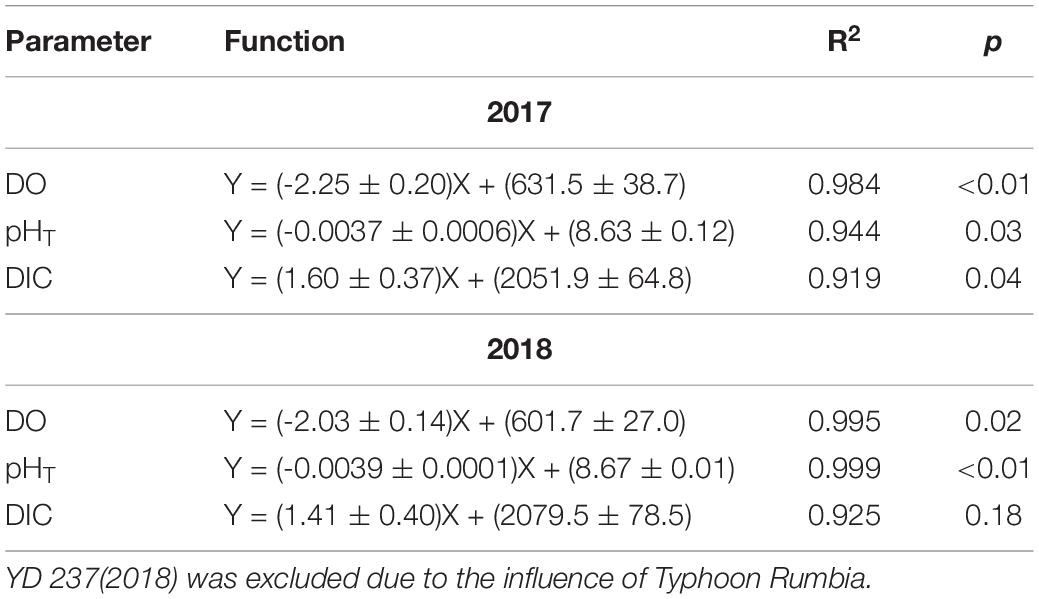
Table 3. Results of linear regression of the mean DO, pHT, and DIC in bottom water against day of the year (YD) performed separately for 2017 and 2018.
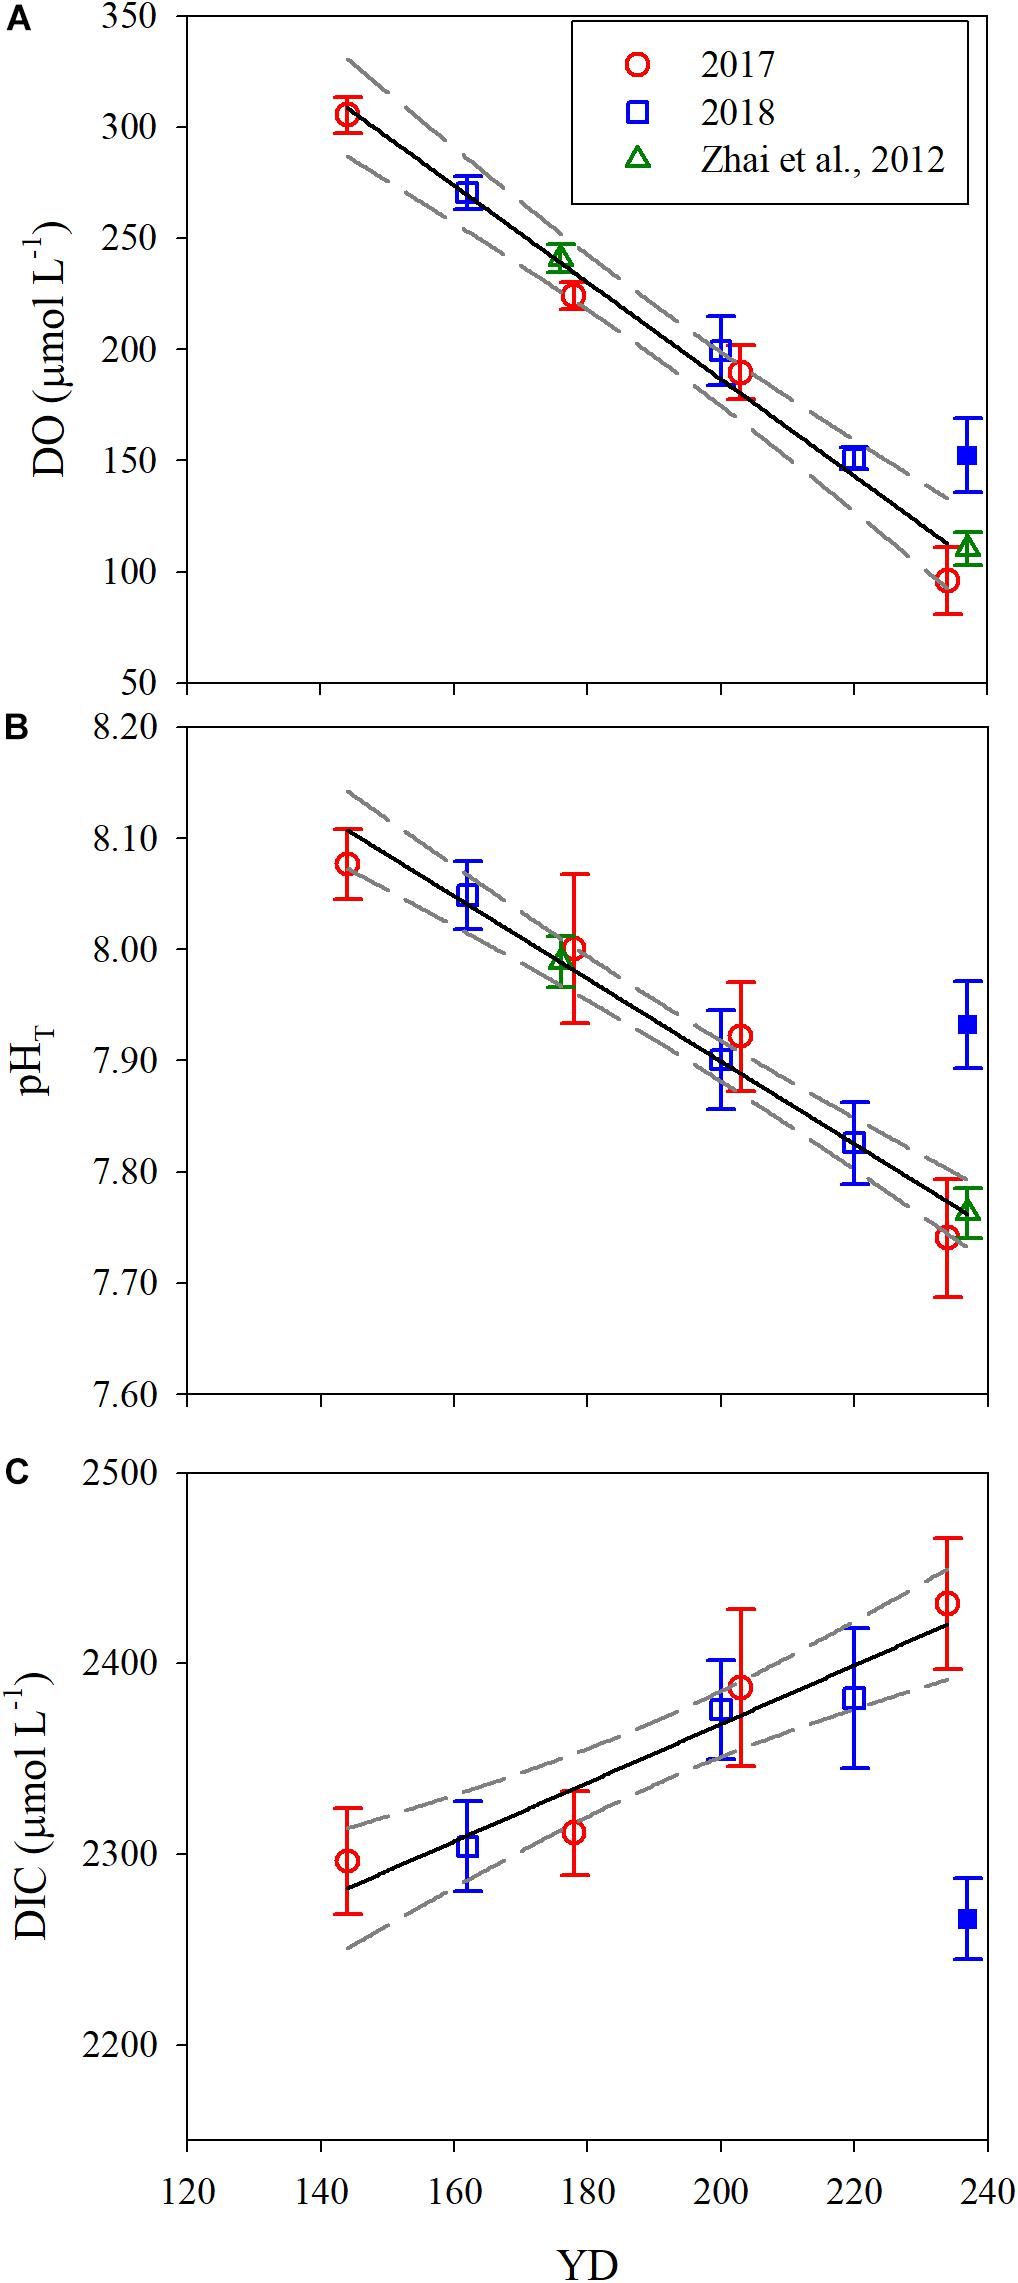
Figure 4. Temporal evolution of the mean DO (A), pHT (B), and DIC (C) in bottom water along the sampling transect. YD stands for day of the year. Error bars are 1 standard deviation. The solid and dashed lines are the linear fit to the data and 95% confidence interval, respectively. The solid blue points on YD 237 were excluded for data fitting.
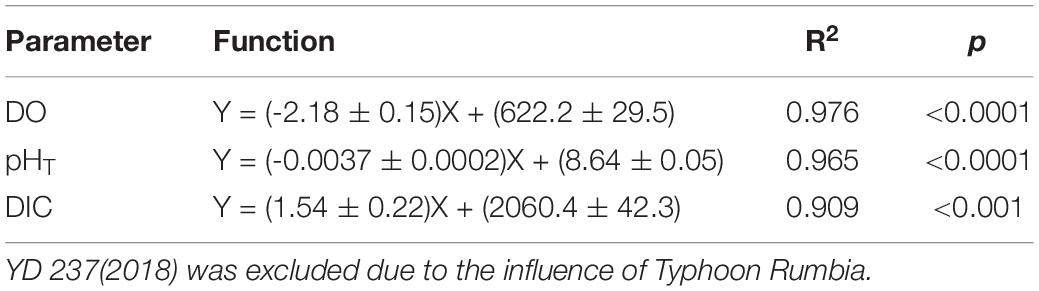
Table 4. Results of linear regression of the mean values of DO, pHT, and DIC in bottom water against day of the year (YD) based on the composite data of 2017 and 2018.
Based on the regression of DO saturation degree against YD (Figure 5 and Table 4), DO in the bottom water switched from oversaturation to undersaturation on YD 164 (June 13), decreasing gradually from 264.7 ± 38.4 μmol L–1 to 90.3 ± 8.1 μmol L–1, or by 66% ± 17% over a period of ∼80 days from YD 164. Simultaneously, pHT progressively decreased from 8.03 ± 0.06 to 7.74 ± 0.07, or by 0.29 ± 0.09. The extent of oxygen depletion in our study area is comparable to those in the Gulf of St. Lawrence (Bourgault et al., 2012) and the Pearl River estuary (Qian et al., 2018) but substantially lower than those in the Chesapeake Bay (Cai et al., 2017), the northern Gulf of Mexico (Cai et al., 2011), and the Yangtze River estuary (Ni et al., 2016; Wang et al., 2017) which all experience severe summertime hypoxia (DO < 32 μmol L–1). The pH in bottom water in the Bohai Sea in August is lower than that in the bottom water of the neighboring north Yellow Sea (7.88 ± 0.06) (Zhai et al., 2014), but higher than those in the northern Gulf of Mexico and the Chesapeake Bay, where pH in bottom water is <7.6 (Cai et al., 2011, 2017). Furthermore, the acidification degree (i.e., ΔpH) in the bottom water of the Bohai Sea is moderate relative to those in the north Yellow Sea (0.14 ± 0.07) (Zhai et al., 2014), the northern Gulf of Mexico (0.3–0.4) (Cai et al., 2011), and the Chesapeake Bay (∼0.4) (Cai et al., 2017).
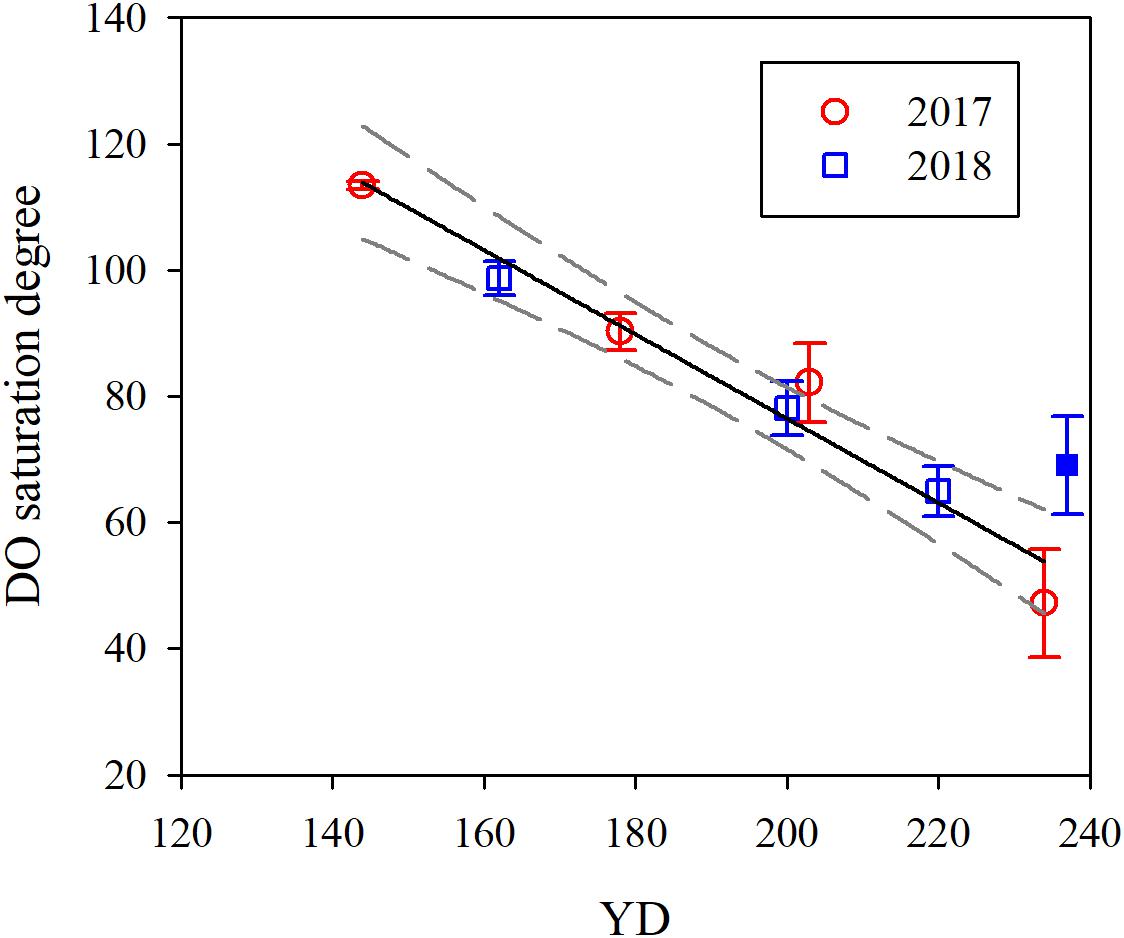
Figure 5. Temporal evolution of the mean DO saturation degree in bottom water. YD stands for day of the year. Error bars are 1 standard deviation. The solid and dashed lines are the linear fit to the data and 95% confidence interval, respectively. The solid blue point was excluded for data fitting. The regressed equation is: Y = (-0.67 ± 0.06) X + (210.0 ± 12.0), R2 = 0.96, p = 0.001.
Note that the data for YD 237(2018) was not included for the regression analysis shown in Figure 4 and Table 4 due to the influence of Typhoon Rumbia. The passage of the typhoon over the sampling area on YD 231-232(2018) greatly weakened the pycnocline, leading to enhanced vertical mixing of DO and DIC. Horizontal exchange with adjacent waters richer in DO but poorer in DIC might also be increased due to the elevated turbulence. Consequently, DO and pHT in bottom water on YD 237(2018) were 46.7 μmol L–1 and 0.17 higher and DIC was 159.5 μmol L–1 lower than expected from the fit to the data excluding YD 237(2018) (Figure 4 and Table 4). This result also indicates that the typhoon effect persisted at least to the end of our sampling campaign, ∼5 days after the typhoon event. Previous studies have demonstrated that typhoons could terminate bottom water oxygen depletion in the estuaries of the Yangtze River and Pearl River (Ni et al., 2016; Su et al., 2017). However, phytoplankton blooms often ensue following stormy weather events due to large supplies of nutrients to surface water via enhanced vertical mixing and freshwater discharge, leading to a renewed and even exacerbated bottom water oxygen depletion and acidification (McCarthy et al., 2013; Su et al., 2017; Wang et al., 2017). In the Bohai Sea, bottom water oxygen depletion and acidification could disappear in early- or mid-September due to weakened water column stratification by stronger wind mixing (Huang et al., 1999; Xu et al., 2020). Hence, stormy weather events in late summer are not expected to allow the water column to fully re-establish stratification before seasonal surface water cooling sets in, thereby reducing both the intensity and duration of the bottom water oxygen depletion and acidification.
Pelagic vs. Sediment Oxygen Consumption
The oxygen diffusion flux through the pycnocline (i.e., the diapycnal diffusion flux) derived from Equation (3) for station A5 on YD 220–222(2018) ranged from 0 to 0.93 mmol m–2 d–1 and averaged 0.19 ± 0.21 mmol m–2 d–1 (Figure 6A). The concurrently determined oxygen flux at the water-sediment boundary layer, i.e., the sediment oxygen consumption rate, ranged from 0.27 to 10.26 mmol m–2 d–1 and averaged 6.32 ± 2.44 mmol m–2 d–1 (Figure 6B), which is comparable to that in the Oregen continental shelf (3.2–9.8 mmol m–2 d–1) (Reimers et al., 2012), and lower than those in the northern Gulf of Mexico (1.3–26.0 mmol m–2 d–1) (Murrell and Lehrter, 2011; McCarthy et al., 2013) and the Yangtze River estuary (9.1–62.5 mmol m–2 d–1) (Zhang et al., 2017). At station A5, the net oxygen consumption rate in the bottom layer derived from regressing DO against time was 2.34 ± 0.34 μmol L–1 d–1, translating into a depth-integrated net oxygen consumption rate of 30.42 ± 4.42 mmol m–2 d–1 on YD 220(2018) when the bottom layer was 13 m thick (Tables 1, 2). The diapycnal diffusion flux was thus negligible (<1%) compared to the net oxygen consumption rate in the bottom layer and can be ignored for the discussion below. The sediment oxygen consumption contributed 21% to the net oxygen consumption in the overlying bottom water. If assuming negligible monthly variations in the current velocity in the bottom water, the sediment oxygen consumption rate at station A5 during each cruise was estimated using the bottom-most DO concentration, temperature and salinity (Table 5). The results suggest the sediment oxygen consumption rate generally decreases with time, with its contribution to the net oxygen consumption in bottom water ranged from 13.4 to 42.1%. Before sampling, very heavy wind occurred over night on YD 202-203(2017), which induced the pycnocline deeper (Figure 2 and Table 2). So the depth-integrated net oxygen consumption rate on YD 203(2017) was much smaller, and consequently the sedimentary contribution was highest. The sedimentary contribution on YD 237(2018) was about three times of that on YD 234(2017), due to the influence of Typhoon Rumbia. The results demonstrated the dominant role of pelagic respiration in generating the observed oxygen depletion in the bottom layer. This argument is also supported by most DO vertical profiles showing little change in DO concentration toward the seafloor (Figure 3).
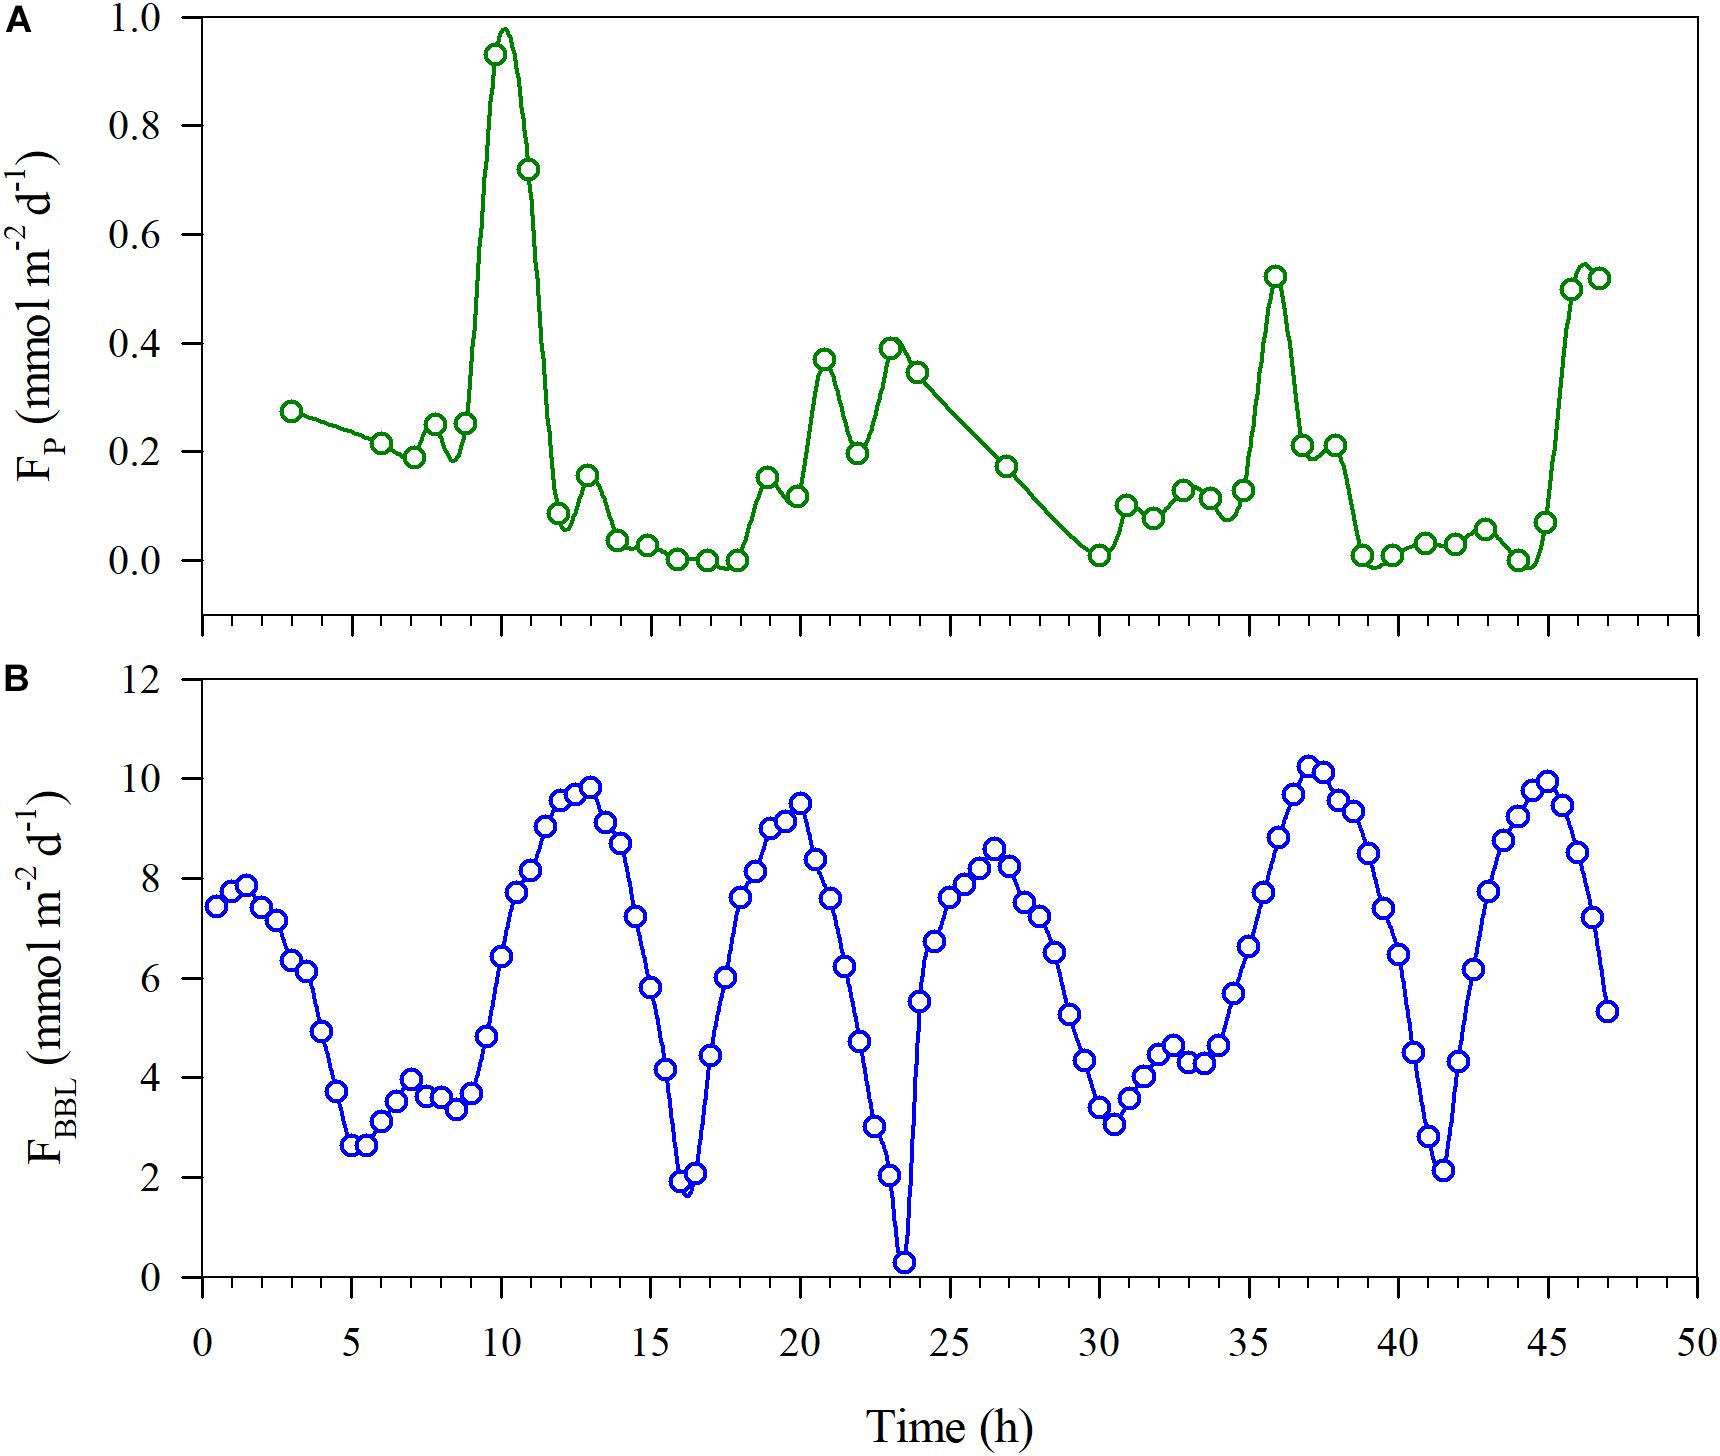
Figure 6. Estimated DO fluxes at station A5 through the pycnocline (Fp) (A) and through the bottom boundary layer (FBBL) (B) as a function of time.
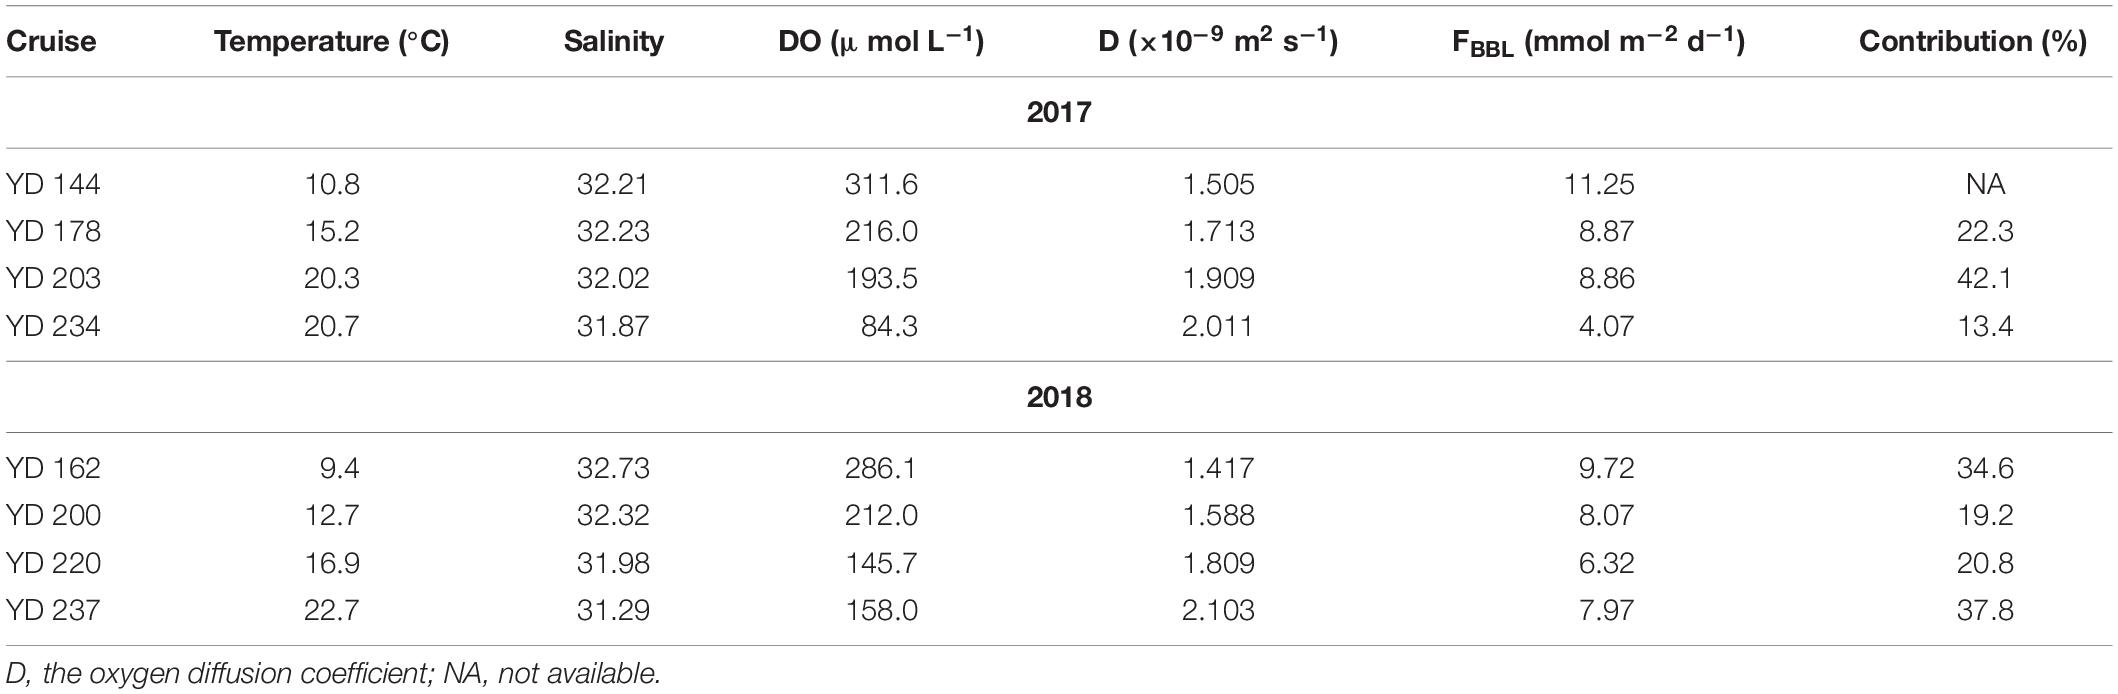
Table 5. Estimated DO fluxes through the bottom boundary layer (FBBL) and their contributions to the net oxygen consumption rate in bottom water at station A5, along with other parameters in the bottom water.
The molar ratio of oxygen consumption to DIC production in the bottom water (O2/DIC hereafter) was calculated to be 1.42 ± 0.22 based on the slopes of the fitted DO vs. YD and DIC vs. YD equations (Table 4). This ratio is statistically indifferent from the Redfield ratio (1.30), suggesting that microbial oxidation of particulate organic matter freshly produced by marine plankton (e.g., phytodetritus) dominated oxygen consumption, as has been observed in the Gulf of Mexico (Rabalais et al., 2002; Green et al., 2006), the Yangtze River estuary (Wang et al., 2017), the Pearl River estuary (Qian et al., 2018), and the Chesapeake Bay (Su et al., 2020). Since pelagic respiration was the main contributor (>60%) to the oxygen depletion (see above), the oxidation of fresh, autochthonous particulate organic matter should have primarily transpired in the water column rather than in the sediment, even though the water column was very shallow (<30 m). This result was consistent with that in the shallow (<30 m) hypoxic zone in the Chesapeake Bay where the pelagic respiration contributes ∼70% to the bottom oxygen depletion (Li et al., 2015). However, in shallow waters, sediment oxygen consumption often plays a dominant role, e.g., in the western side of the Gulf of Mexico near the Atchafalaya River plume (<30 m) (Hetland and DiMarco, 2008) and the Yangtze River estuary (30–50 m) (Zhang et al., 2017). Pelagic-dominated oxygen consumption occurs in relatively deeper water bodies, such as the lower St. Lawrence estuary (>300 m deep) (Bourgault et al., 2012) where the residence time of particulate organic matter in the water column is relatively long. Pelagic-dominated oxygen consumption can also take place in shallow waters with limited sediment deposition, such as in the Louisiana Bight near the Mississippi River plume where suspended particles in the river plume can barely reach the seafloor before entering the deeper (>40 m) shelf water (Corbett et al., 2006; Green et al., 2006; Hetland and DiMarco, 2008). The factors leading to the pelagic-dominated oxygen consumption in the shallow water off Qinhuangdao, Bohai Sea, is unclear but could be linked to abundant loads of slow-sinking, fine organic particles in the water column that originated from phytoplankton blooms.
Summary and Conclusion
Oxygen depletion of ∼90 μmol L–1 and acidification of ∼0.3 pH unit occurred in the bottom water of the Bohai Sea off Qinhuangdao City during the summers of 2017 and 2018. Combined with literature data, no significant interannual variations were observed in the rates of oxygen depletion and acidification from 2011 to 2018. The bottom water had therefore remained in a stable condition in terms of net community respiration over that period. The ratio of oxygen consumption to DIC production in the bottom water (1.42 ± 0.22) was close to the Redfield ratio (1.30), demonstrating that degradation of freshly produced organic matter dominated oxygen consumption. Sedimentary organic matter degradation contributed <40% of the oxygen depletion and acidification in the overlying bottom water. The passage of Typhoon Rumbia over the Bohai Sea in the late summer of 2018 strongly weakened the bottom water oxygen depletion and acidification. This study demonstrates that pelagic respiration can thus prevail over sediment respiration in generating oxygen depletion and acidification in shallow coastal systems and stormy weather events can substantially alter the duration and intensity of oxygen depletion and acidification in coastal areas.
Data Availability StateMent
The raw data supporting the conclusions of this article will be made available by the authors, without undue reservation, to any qualified researcher.
Author Contributions
GS, LZ, FC, and HX designed the project. GS, LZ, and FL collected and analyzed the water samples. GS, LZ, and ML processed the data. GS and HX prepared the manuscript with input from all other authors.
Funding
This study was financially supported by the Natural Key Research and Development Program of China (2016YFC1401602), National Natural Science Foundation of China (41606098, 41876018, and 41806018), and Tianjin Natural Science Foundation (19JCZDJC40600 and 16JCQNJC08000). GS held a visiting scholarship (QNHX1811) at Second Institute of Oceanography, Ministry of Natural Resources during this study.
Conflict of Interest
The authors declare that the research was conducted in the absence of any commercial or financial relationships that could be construed as a potential conflict of interest.
Acknowledgments
We thank W. Zhai for providing the 2011 DO and pH data, our colleagues for their help with the sample collection, and the crews for their cooperation during the cruises.
Supplementary Material
The Supplementary Material for this article can be found online at: https://www.frontiersin.org/articles/10.3389/fmars.2020.00252/full#supplementary-material
References
Bourgault, D., Cyr, F., Galbraith, P. S., and Pelletier, E. (2012). Relative importance of pelagic and sediment respiration in causing hypoxia in a deep estuary. J. Geophys. Res. 117:C08033. doi: 10.1029/2012JC007902
Cai, W.-J., Hu, X., Huang, W., Murrell, M. C., Lehrter, J. C., Lohrenz, S. E., et al. (2011). Acidification of subsurface coastal waters enhanced by eutrophication. Nat. Geosci. 4, 766–770. doi: 10.1038/ngeo1297
Cai, W.-J., Huang, W., Luther, G. W.III, Pierrot, D., Li, M., Testa, J., et al. (2017). Redox reactions and weak buffering capacity lead to acidification in the Chesapeake Bay. Nat. Commun. 8:369. doi: 10.1038/s41467-017-00417-7
Carstensen, J., Andersen, J. H., Gustafsson, B. G., and Conley, D. J. (2014). Deoxygenation of the Baltic Sea during the last century. Proc. Natl. Acad. Sci. U.S.A. 111, 5628–5633. doi: 10.1073/pnas.1323156111
Corbett, D. R., McKee, B. A., and Duncan, D. (2006). An evaluation of mobile mud dynamics in the Mississippi River deltaic region. Cont. Shelf Res. 26, 2125–2140.
Diaz, R. J. (2001). Overview of hypoxia around the world. J. Environ. Quality 30, 275–281. doi: 10.2134/jeq2001.302275x
Diaz, R. J., and Rosenberg, R. (2008). Spreading dead zones and consequences for marine ecosystems. Science 321, 926–929. doi: 10.1126/science.1156401
Fabricius, K. E., Langdon, C., Uthicke, S., Humphrey, C., Noonan, S., De’ath, G., et al. (2011). Losers and winners in coral reefs acclimatized to elevated carbon dioxide concentrations. Nat. Climat. Change 1, 165–169. doi: 10.1038/nclimate1122
Feng, Y., Warner, M. E., Zhang, Y., Sun, J., Fu, F.-X., Feng, Y., et al. (2008). Interactive effects of increased pCO2, temperature and irradiance on the marine coccolithophore Emiliania huxleyi (Pyrmnesiophyceae). Eur. J. Phycol. 43, 87–98. doi: 10.1080/09670260701664674
Galán, A., Molina, V., Thamdrup, B., Woebken, D., Lavik, G., Kuypers, M. M. M., et al. (2009). Anammox bacteria and the anaerobic oxidation of ammonium in the oxygen minimum zone off northern Chile. Deep Sea Res. II 56, 1021–1031. doi: 10.1016/j.dsr2.2008.09.016
Galgani, L., Stolle, C., Endres, S., Schulz, K. G., and Engel, A. (2014). Effects of ocean acidification on the biogenic composition of the sea-surface microlayer: results from a mesocosm study. J. Gepphys. Res. Oceans 119, 7911–7924. doi: 10.1002/2014jc010188
Grasshoff, K., Kremling, K., and Ehrhardt, M. (1999). Methods of Seawater Analysis. Third, Completely Revised and Extended Edition. Weinheim: Wiley-VCH Verlag GmbH.
Green, R. E., Bianchi, T. S., Dagg, M. J., Walker, N. D., and Breed, G. A. (2006). An organic carbon budget for the Mississippi River turbidity plume and plume contributions to air-sea CO2 fluxes and bottom water hypoxia. Estuar. Coast. 29, 579–597. doi: 10.1007/bf02784284
Gregg, M. C. (1999). Uncertainties and limitations in Measuring varepsilon and χW. J. Atmos. Oceanic Technol. 16, 1483–1490.
Hansen, J. L. S., and Bendtsen, J. (2014). Seasonal bottom water respiration in the North Sea-Baltic Sea transition zone: rate, temperature sensitivity and sources of organic material. Mar. Ecol. Prog. Ser. 499, 19–34. doi: 10.3354/meps10633
Hetland, R. D., and DiMarco, S. F. (2008). How does the character of oxygen demand control the structure of hypoxia on the Texas-Louisiana continental shelf? J. Mar. Syst. 70, 49–62. doi: 10.1016/j.jmarsys.2007.03.002
Hoegh-Guldberg, O., Mumby, P. J., Hooten, A. J., Steneck, R. S., Greenfield, P., Gomez, E., et al. (2007). Coral reefs under rapid climate change and ocean acidification. Science 318, 1737–1742.
Huang, D., Su, J., and Backhaus, J. O. (1999). Modelling the seasonal thermal stratification and baroclinic circulation in the Bohai Sea. Cont. Shelf Res. 19, 1485–1505. doi: 10.1016/s0278-4343(99)00026-6
Jackett, D. R., and McDougall, T. J. (1995). Minimal adjustment of hydrographic profiles to achieve static stability. J. Atmos. Ocean. Technol. 12, 381–389. doi: 10.1175/1520-0426(1995)012<0381:maohpt>2.0.co;2
Keister, J. E., Houde, E. D., and Breitburg, D. L. (2000). Effects of bottom-layer hypoxia on abundances and depth distributions of organisms in Patuxent River. Chesapeake Bay. Mar. Ecol. Prog. Ser. 205, 43–59. doi: 10.3354/meps205043
Li, Y., Li, M., and Kemp, W. M. (2015). A budget analysis of bottom-water dissolved oxygen in Chesapeake Bay. Estuar. Coast. 38, 2132–2148. doi: 10.1007/s12237-014-9928-9
Matear, R. J., and Hirst, A. C. (2003). Long-term changes in dissolved oxygen concentrations in the ocean caused by protracted global warming. Global Biogeochem. Cycles 17:1125. doi: 10.1029/2002GB001997
McCarthy, M. J., Carine, S. A., Liu, Z., Ostrom, N., and Gardner, W. S. (2013). Oxygen consumption in the water column and sediments of the northern Gulf of Mexico hypoxic zone. Estuar. Coast. Shelf Sci. 123, 46–53. doi: 10.1016/j.ecss.2013.02.019
Murrell, M. C., and Lehrter, J. C. (2011). Sediment and lower water column oxygen consumption in the seasonally hypoxic region of the Louisiana Continental Shelf. Estuar. Coast. 34, 912–924. doi: 10.1007/s12237-010-9351-9
Ni, X., Huang, D., Zeng, D., Zhang, T., Li, H., and Chen, J. (2016). The impact of wind mixing on the variation of bottom dissolved oxygen off the Changjiang Estuary during summer. J. Mar. Syst. 154, 122–130. doi: 10.1016/j.jmarsys.2014.11.010
Ning, X., Lin, C., Su, J., Liu, C., Hao, Q., Le, F., et al. (2010). Long-term environmental changes and the responses of the ecosystems in the Bohai Sea during 1960-1996. Deep Sea Res. II 57, 1079–1091. doi: 10.1016/j.dsr2.2010.02.010
Orr, J. C., Fabry, V. J., Aumont, O., Bopp, L., Doney, S. C., Feely, R. A., et al. (2005). Anthropogenic ocean acidification over the twenty-first century and its impact on calcifying organisms. Nature 437, 681–686. doi: 10.1038/nature04095
Osborn, T. R. (1980). Estimates of the local rate of diffusion from dissipation measurements. J. Phys. Oceanogr. 10, 83–89. doi: 10.1175/1520-0485(1980)010<0083:eotlro>2.0.co;2
Pierrot, D., Lewis, E., and Wallace, D. W. R. (2006). MS Excel Program Developed for CO2 System Calculations. Oak Ridge, TN: U.S. Department of energy, doi: 10.3334/CDIAC/otg.CO2SYS_XLS_CDIAC105a
Qian, W., Gan, J., Liu, J., He, B. Y., Lu, Z., Guo, X., et al. (2018). Current status of emerging hypoxia in a eutrophic estuary: the lower reach of the Pearl River estuary, China. Estuar. Coast. Shelf Sci. 205, 58–67. doi: 10.1016/j.ecss.2018.03.004
Rabalais, N. N., Turner, R. E., and Wiseman, W. J. Jr. (2002). Gulf of Mexico hypoxia, A. K. A. “the dead zone”. Annu. Rev. Ecol. Syst. 33, 235–263. doi: 10.1146/annurev.ecolsys.33.010802.150513
Ramsing, N., and Gundersen, J. (1994). Seawater and Gases-Tabulated Physical Parameters of Interest to People Working with Microsensors in Marine Systems, Version 2.0, Unisense Internal Report. doi: 10.1146/annurev.ecolsys.33.010802.150513
Reimers, C. E., Özkan-Haller, H. T., Berg, P., Devol, A., McCann-Grosvenor, K., and Sanders, R. D. (2012). Benthic oxygen consumption rates during hypoxic conditions on the Oregon continental shelf: evaluation of the eddy correlation method. J. Geophys. Res. 117:C020021. doi: 10.1029/2011JC007564
Rheuban, J. E., Doney, S. C., Cooley, S. R., and Hart, D. R. (2018). Projected impacts of future climate change, ocean acidification, and management on the US Atlantic sea scallop (Placopecten magellanicus) fishery. PLoS One 13:E0203536. doi: 10.1371/journal.pone.0203536
Rippeth, T. P., Wiles, P., Palmer, M. R., Sharples, J., and Tweddle, J. (2009). The diapycnal nutrient flux and shear-induced diapycnal mixing in the seasonally stratified western Irish Sea. Cont. Shelf Res. 29, 1580–1587. doi: 10.1016/j.csr.2009.04.009
Smodlaka, N. (1986). Primary production of the organic matter as an indicator of the eutrophication in the northern Adriatic sea. Sci. Total Environ. 56, 211–220. doi: 10.1016/0048-9697(86)90325-6
Su, J., Cai, W.-J., Brodeur, J., Hussain, N., Chen, B., Testa, J. M., et al. (2020). Source partitioning of oxygen-consuming organic matter in the hypoxic zone of the Chesapeake Bay. Limnol. Oceanogr. 9999, 1–17. doi: 10.1002/lno.11419
Su, J., Dai, M., He, B., Wang, L., Gan, J., Guo, X., et al. (2017). Tracing the origin of the oxygen-consuming organic matter in the hypoxic zone in a large eutrophic estuary: the lower reach of the Pearl River estuary. Chin. Biogeosci. 14, 4085–4099. doi: 10.5194/bg-14-4085-2017
Vaquer-Sunyer, R., and Duarte, C. M. (2008). Thresholds of hypoxia for marine biodiversity. Proc. Natl. Acad. Sci. U.S.A. 105, 15452–15457. doi: 10.1073/pnas.0803833105
Wallace, R. B., Baumann, H., Grear, J. S., Aller, R. C., and Gobler, C. J. (2014). Coastal ocean acidification: the other eutrophication problem. Estuar. Coast. Shelf Sci. 148, 1–13. doi: 10.1016/j.ecss.2014.05.027
Wang, B., Chen, J., Jin, H., Li, H., Huang, D., and Cai, W.-J. (2017). Diatom bloom-derived bottom water hypoxia off the Changjiang estuary, with and without typhoon influence. Limnol. Oceanogr. 62, 1552–1560.
Wang, J., Wei, H., Lu, Y., and Zhao, L. (2013). Diffusive boundary layer influence by bottom boundary hydrodynamics in tidal flows. J. Geophys. Res. Oceans 118, 5994–6005. doi: 10.1002/2013jc008900
Wang, J., Zhao, L., Fan, R., and Wei, H. (2016). Scaling relationships for diffusive boundary layer thickness and diffusive flux based on in situ measurements in coastal seas. Prog. Oceanogr. 144, 1–14. doi: 10.1016/j.pocean.2016.03.001
Wei, Q., Wang, B., Yao, Q., Xue, L., Sun, J., Xin, M., et al. (2019). Spatiotemporal variations in the summer hypoxia in the Bohai Sea (China) and controlling mechanisms. Mar. Pollut. Bull. 138, 125–134. doi: 10.1016/j.marpolbul.2018.11.041
Wolk, F., Yamazaki, H., Seuront, L., and Lueck, R. G. (2002). A 431 new free-fall profiler for measuring biophysical microstructure. J. Atmos. Oceanic Technol. 19, 780–793. doi: 10.1175/1520-0426(2002)019<0780:anffpf>2.0.co;2
Xu, P., Yang, W., Zhao, L., Wei, H., and Nie, H. (2020). Observations of turbulent mixing in the Bohai Sea during weakly stratified period. Acta Oceanol. Sin. 42, 1–9. doi: 10.3969/j.issn.0253-4193.2020.03.001
Yu, C., Liang, B., Bao, C., Li, M., Hu, Y., Lan, D., et al. (2013). Study on eutrophication status and trend in Bohai Sea. Mar. Environ. Sci. 32, 175–177.
Zhai, W.-D., Zhao, H., Zheng, N., and Xu, L. (2012). Coastal acidification in summer bottom oxygen-depleted waters in northwestern-northern Bohai Sea from June to August in 2011. Chin. Sci. Bull. 57, 1062–1068. doi: 10.1007/s11434-011-4949-2
Zhai, W.-D., Zheng, N., Huo, C., Xu, Y., Zhao, H., Li, Y., et al. (2014). Subsurface pH and carbonate saturation state of aragonite on the Chinese side of the North Yellwo Sea: seasonal variations and controls. Biogeosciences 11, 1103–1123. doi: 10.5194/bg-11-1103-2014
Zhang, H., Zhao, L., Sun, Y., Wang, J., and Wei, H. (2017). Contribution of sediment oxygen demand to hypoxia development off the Changjiang Estuary. Estuar. Coast. Shelf Sci. 192, 149–157. doi: 10.1016/j.ecss.2017.05.006
Zhang, Z., He, X., Zhang, Z., Han, G., Wang, Y., and Wang, L. (2012). Eutrophication status, mechanism and its coupling effect with algae blooming in Bohai. Mar. Environ. Sci. 31, 465–483.
Zhao, H.-D., Kao, S.-J., Zhai, W.-D., Zang, K., Zheng, N., Xu, X., et al. (2017). Effects of stratification organic matter remineralization and bathymetry on summertime oxygen distribution in the Bohai Sea. China. Cont. Shelf Res. 134, 15–25. doi: 10.1016/j.csr.2016.12.004
Zhou, F., Huang, D., Xue, H., Xuan, J., Yan, T., Ni, X., et al. (2017). Circulations associated with cold pools in the Bohai Sea on the Chinese continental shelf. Cont. Shelf Res. 137, 25–38. doi: 10.1016/j.csr.2017.02.005
Keywords: oxygen depletion, acidification, dissolved inorganic carbon, organic matter degradation, typhoon, Bohai Sea
Citation: Song G, Zhao L, Chai F, Liu F, Li M and Xie H (2020) Summertime Oxygen Depletion and Acidification in Bohai Sea, China. Front. Mar. Sci. 7:252. doi: 10.3389/fmars.2020.00252
Received: 26 February 2020; Accepted: 30 March 2020;
Published: 24 April 2020.
Edited by:
Xianghui Guo, Xiamen University, ChinaReviewed by:
Yuanyuan Xu, University of Miami, United StatesGuoxiang Wu, Ocean University of China, China
Copyright © 2020 Song, Zhao, Chai, Liu, Li and Xie. This is an open-access article distributed under the terms of the Creative Commons Attribution License (CC BY). The use, distribution or reproduction in other forums is permitted, provided the original author(s) and the copyright owner(s) are credited and that the original publication in this journal is cited, in accordance with accepted academic practice. No use, distribution or reproduction is permitted which does not comply with these terms.
*Correspondence: Guisheng Song, Z3Vpc2hlbmcuc29uZ0B0anUuZWR1LmNu; Huixiang Xie, aHVpeGlhbmdfeGllQHVxYXIuY2E=