 Tisja D. Daggers
 Peter M. J. Herman2,3
 Daphne van der Wal
- 1NIOZ Royal Netherlands Institute for Sea Research, Department of Estuarine and Delta Systems, Utrecht University, Yerseke, Netherlands
- 2Department of Marine and Coastal Systems, Deltares, Delft, Netherlands
- 3Department of Coastal Engineering, Delft University of Technology, Delft, Netherlands
- 4Faculty of Geo-Information Science and Earth Observation (ITC), University of Twente, Enschede, Netherlands
Understanding the spatial structure of microphytobenthos (MPB) on intertidal flats is necessary to gain insight in the benthic community structure and ecosystem processes. The increasing availability of high resolution satellite sensors provides the opportunity to better understand spatial patterns of MPB on various (meter to km) scales. We tested how MPB patch size (indicated by the range derived from a semi-variogram) and degree of patchiness (indicated by the sill) vary as function of seasons, salinity, tidal flat type (muddy fringing versus sandy mid-channel tidal flats) or ecotopes (defined by hydrodynamics, silt content and elevation), in the Westerschelde estuary, the Netherlands. We used Sentinel-2 imagery (2016–2019) with 10 m spatial resolution to derive (omnidirectional) semi-variogram parameters from the NDVI (used as indicator for MPB biomass) and evaluated (seasonality in) patchiness of MPB in the different categories. We demonstrated that MPB patch size (the range) remains constant from winter to summer, while the sill increased from winter to summer. The location of patches on tidal flats was variable throughout the year and shows a remarkable similarity with seasonality in the spatial heterogeneity of the silt content on tidal flats. The patch size and degree of patchiness is higher on relatively sandy mid-channel tidal flats than on relatively silt rich fringing tidal flats. This implies that spatial patterning of MPB biomass on the meso-scale is likely closely linked to abiotic conditions and that spreading processes or grazing activity play a minor role. We observed visually that some areas with a relatively high MPB biomass (‘patches’) remain visible throughout the year, while other patches were only present during a particular season.
Introduction
Microphytobenthos (MPB) living on intertidal flats in estuaries, consisting of cyanobacteria and unicellular eukaryotic algae, can form a considerable part of the total primary production in estuaries (Underwood and Kromkamp, 1999). MPB on intertidal flats mainly consist of benthic diatoms (Meleder et al., 2007). Several studies have emphasized the key role of MPB in sustaining intertidal food webs (Herman et al., 2000; Thrush et al., 2012; Christianen et al., 2017) and stabilizing the sediment (Orvain et al., 2004; Ubertini et al., 2015). Strong environmental gradients are present in estuarine ecosystems associated with distance to the mouth (salinity, temperature, and tidal amplitude) and elevation (current velocity and sediment composition) (Moreira et al., 1993). These environmental gradients, in turn, structure the spatial variability of biota, including the macrobenthic community and MPB.
Intertidal areas that are relatively homogeneous in terms of the environmental factors can be classified into ecotopes (Bouma et al., 2006; Baptist et al., 2019), and these may also structure the biota.
Meso-scale (i.e., meters to kilometers) and macro-scale (kilometers up to scale of an entire estuary) spatial variability in MPB biomass on intertidal sediments has often been associated with sediment characteristics, bathymetry and wave action (bottom–up control) (Guarini et al., 1998; Van der Wal et al., 2010b; Orvain et al., 2012; Brito et al., 2013; Benyoucef et al., 2014), while micro scale (up to ca 1 m) spatial variability has been associated with grazing by benthic fauna (top–down control) (Weerman et al., 2011). Orvain et al. (2012) identified median grain size of the sediment as the most important parameter explaining spatial variability of MPB, using a macro-scale in situ sampling campaign. Van der Wal et al. (2010b) identified positive correlations between MPB biomass and emersion duration, mud content and their interaction, using MODIS satellite imagery of various temperate tidal basins and estuaries. The species composition of benthic diatoms has been associated with sediment characteristics, with epipsammic (sand-fixed) species, mainly occurring in relatively sandy sediments and epipelic (migrating) species, dominating relatively silty sediments (Paterson et al., 1998). Seasonal variability in MPB biomass has been associated with abiotic factors such as irradiance, temperature, nutrient concentrations and wind velocity (Van der Wal et al., 2010b; Ubertini et al., 2012 and references therein).
The macrofaunal community is known to vary as function of current velocity, sediment composition and salinity (Van der Wal et al., 2008; Cozzoli et al., 2013). Macrobenthos may promote or inhibit MPB abundance through various mechanisms, including grazing and physical disturbances (bioturbation) (Solan et al., 2003). Bioturbation from motile infauna (e.g., bivalves, crustaceans, gastropods, and polychaetes) may contribute to the decline of MPB biomass through resuspension and burial below the photic zone (de Deckere et al., 2001; Andersen et al., 2002; Orvain et al., 2004). Small scale effects of macrofaunal grazing on spatial patterns of MPB have been observed, whereby fauna lowered MPB biomass and patchiness (Weerman et al., 2011). However, few studies have focused on meso-scale effects of macrofauna on spatial patterns of MPB biomass. In the Westerschelde, The Netherlands, species richness, biomass and abundance of macrofauna decreases with increasing grain size of the sediment, likely due to increasing hydrodynamic stress in sandy habitats (Cozzoli et al., 2013). The total biomass and number of species of macrofauna in the intertidal areas of the Westerschelde has been demonstrated to strongly decrease with decreasing salinity (Ysebaert et al., 2003). In the polyhaline zone, suspension feeders dominate in terms of biomass and decrease with decreasing salinity. Likewise, surface deposit feeders and sub-surface deposit feeders have a higher biomass in the polyhaline zone than in the mesohaline zone (Ysebaert et al., 2003).
Understanding of the spatial structure of microphytobenthos (MPB) on intertidal flats is necessary to understand community structure and ecosystem functioning (Murphy et al., 2008; Brito et al., 2013). The increasing availability of high resolution satellite sensors provides the opportunity to better understand spatial patterns of MPB on the scale at which ecosystem functioning can be analyzed (meso- and macro-scale). Furthermore, the increasing temporal resolution of satellite imagery may add to insight in changes in spatial patterns of MPB over time. As MPB usually forms small patches at a scale smaller than the resolution of most available satellite sensors, unmanned aerial vehicles (UAVs) may provide detailed information on spatial patterns of MPB on finer spatial scales (<1 m) (Ryu et al., 2014).
Few studies have addressed specific sizes of MPB patches on the meso- or macro-scale. Guarini et al. (1998) performed a geostatistical semi-variogram analysis on MPB biomass data collected in winter and summer (1 km grid resolution). The analysis revealed that patches of high MPB biomass were located at the same spots in summer and winter. A decrease in patch size was observed from summer to winter indicated by the semi-variogram range, which decreased from 6 to 2 km. The process leading to the observed pattern could not be identified. Morris (2005) performed in situ sampling campaigns on several tidal flats located in multiple estuaries and emphasized that, because of the dependency of chl-a distributions on topography and sediment properties, spatial patterns of chl-a can have a highly site specific nature.
In the Westerschelde, fringing tidal flats generally have a relatively high silt content, low hydrodynamic energy and high macrofaunal biomass compared to the relatively sandy tidal flats located in the mid-channel. We hypothesize that the degree of patchiness (represented by the sill of a semi-variogram) is lower and the patch size (represented by the range of a semi-variogram) of MPB is higher on mid-channel tidal flats than on fringing tidal flats. We expect that the higher hydrodynamic activity on mid-channel tidal flats compared to fringing tidal flats homogenizes spatial variation in MPB biomass, due to the high resuspension rates of MPB associated with higher current velocities (Lucas et al., 2000). The degree of patchiness is expected to decrease with decreasing salinity due to lower grazing and bioturbation by macrofauna, while the patch size (range) may increase with decreasing salinity.
We hypothesize that patch size and degree of patchiness of MPB increases during the expected spring bloom (early spring) and decreases again in summer and winter. Hereby, it is assumed that MPB biomass follows a constant-density model (Guarini et al., 1998), whereby an increase in MPB biomass expands the patch sizes when an ‘optimum’ MPB biomass at the center of the patch is reached. We expect that in spring, patch size and degree of patchiness are mainly coupled to abiotic factors, while in summer macrofauna may influence these parameters by increased grazing activity and bioturbation.
We analyze the seasonality in spatial patterns in MPB along a longitudinal gradient in the Westerschelde estuary, Netherlands, using semi-variograms. Spatial patterns of MPB are studied on the meso-scale at study sites located in varying abiotic and biotic environments along the estuarine gradient. Differences in MPB patch sizes (range of the semi-variogram), degree of patchiness (sill of the semi-variogram), micro-scale variability (nugget of the semi-variogram) and total MPB biomass are compared among seasons, salinity, tidal flat type (fringing, relatively silty or mid-channel, relatively sandy) and ecotopes whereby available Sentinel-2 imagery (10 m resolution) from 2016 to 2019 is used.
Materials and Methods
Study Sites
The study is performed in the Westerschelde, The Netherlands. The salinity decreases in upstream direction and varies from polyhaline to α-mesohaline. The selected study sites are located in a strongly polyhaline region (29.23 ± 1.36), weakly polyhaline region (23.96 ± 1.52) and α-mesohaline region (16.52 ± 2.04), respectively (Figure 1; Ysebaert et al., 2003). In each salinity zone, a tidal flat located in the mid-channel and a fringing tidal flat was selected. The sediment composition in the intertidal is similar along the estuarine gradient (Cozzoli et al., 2013).
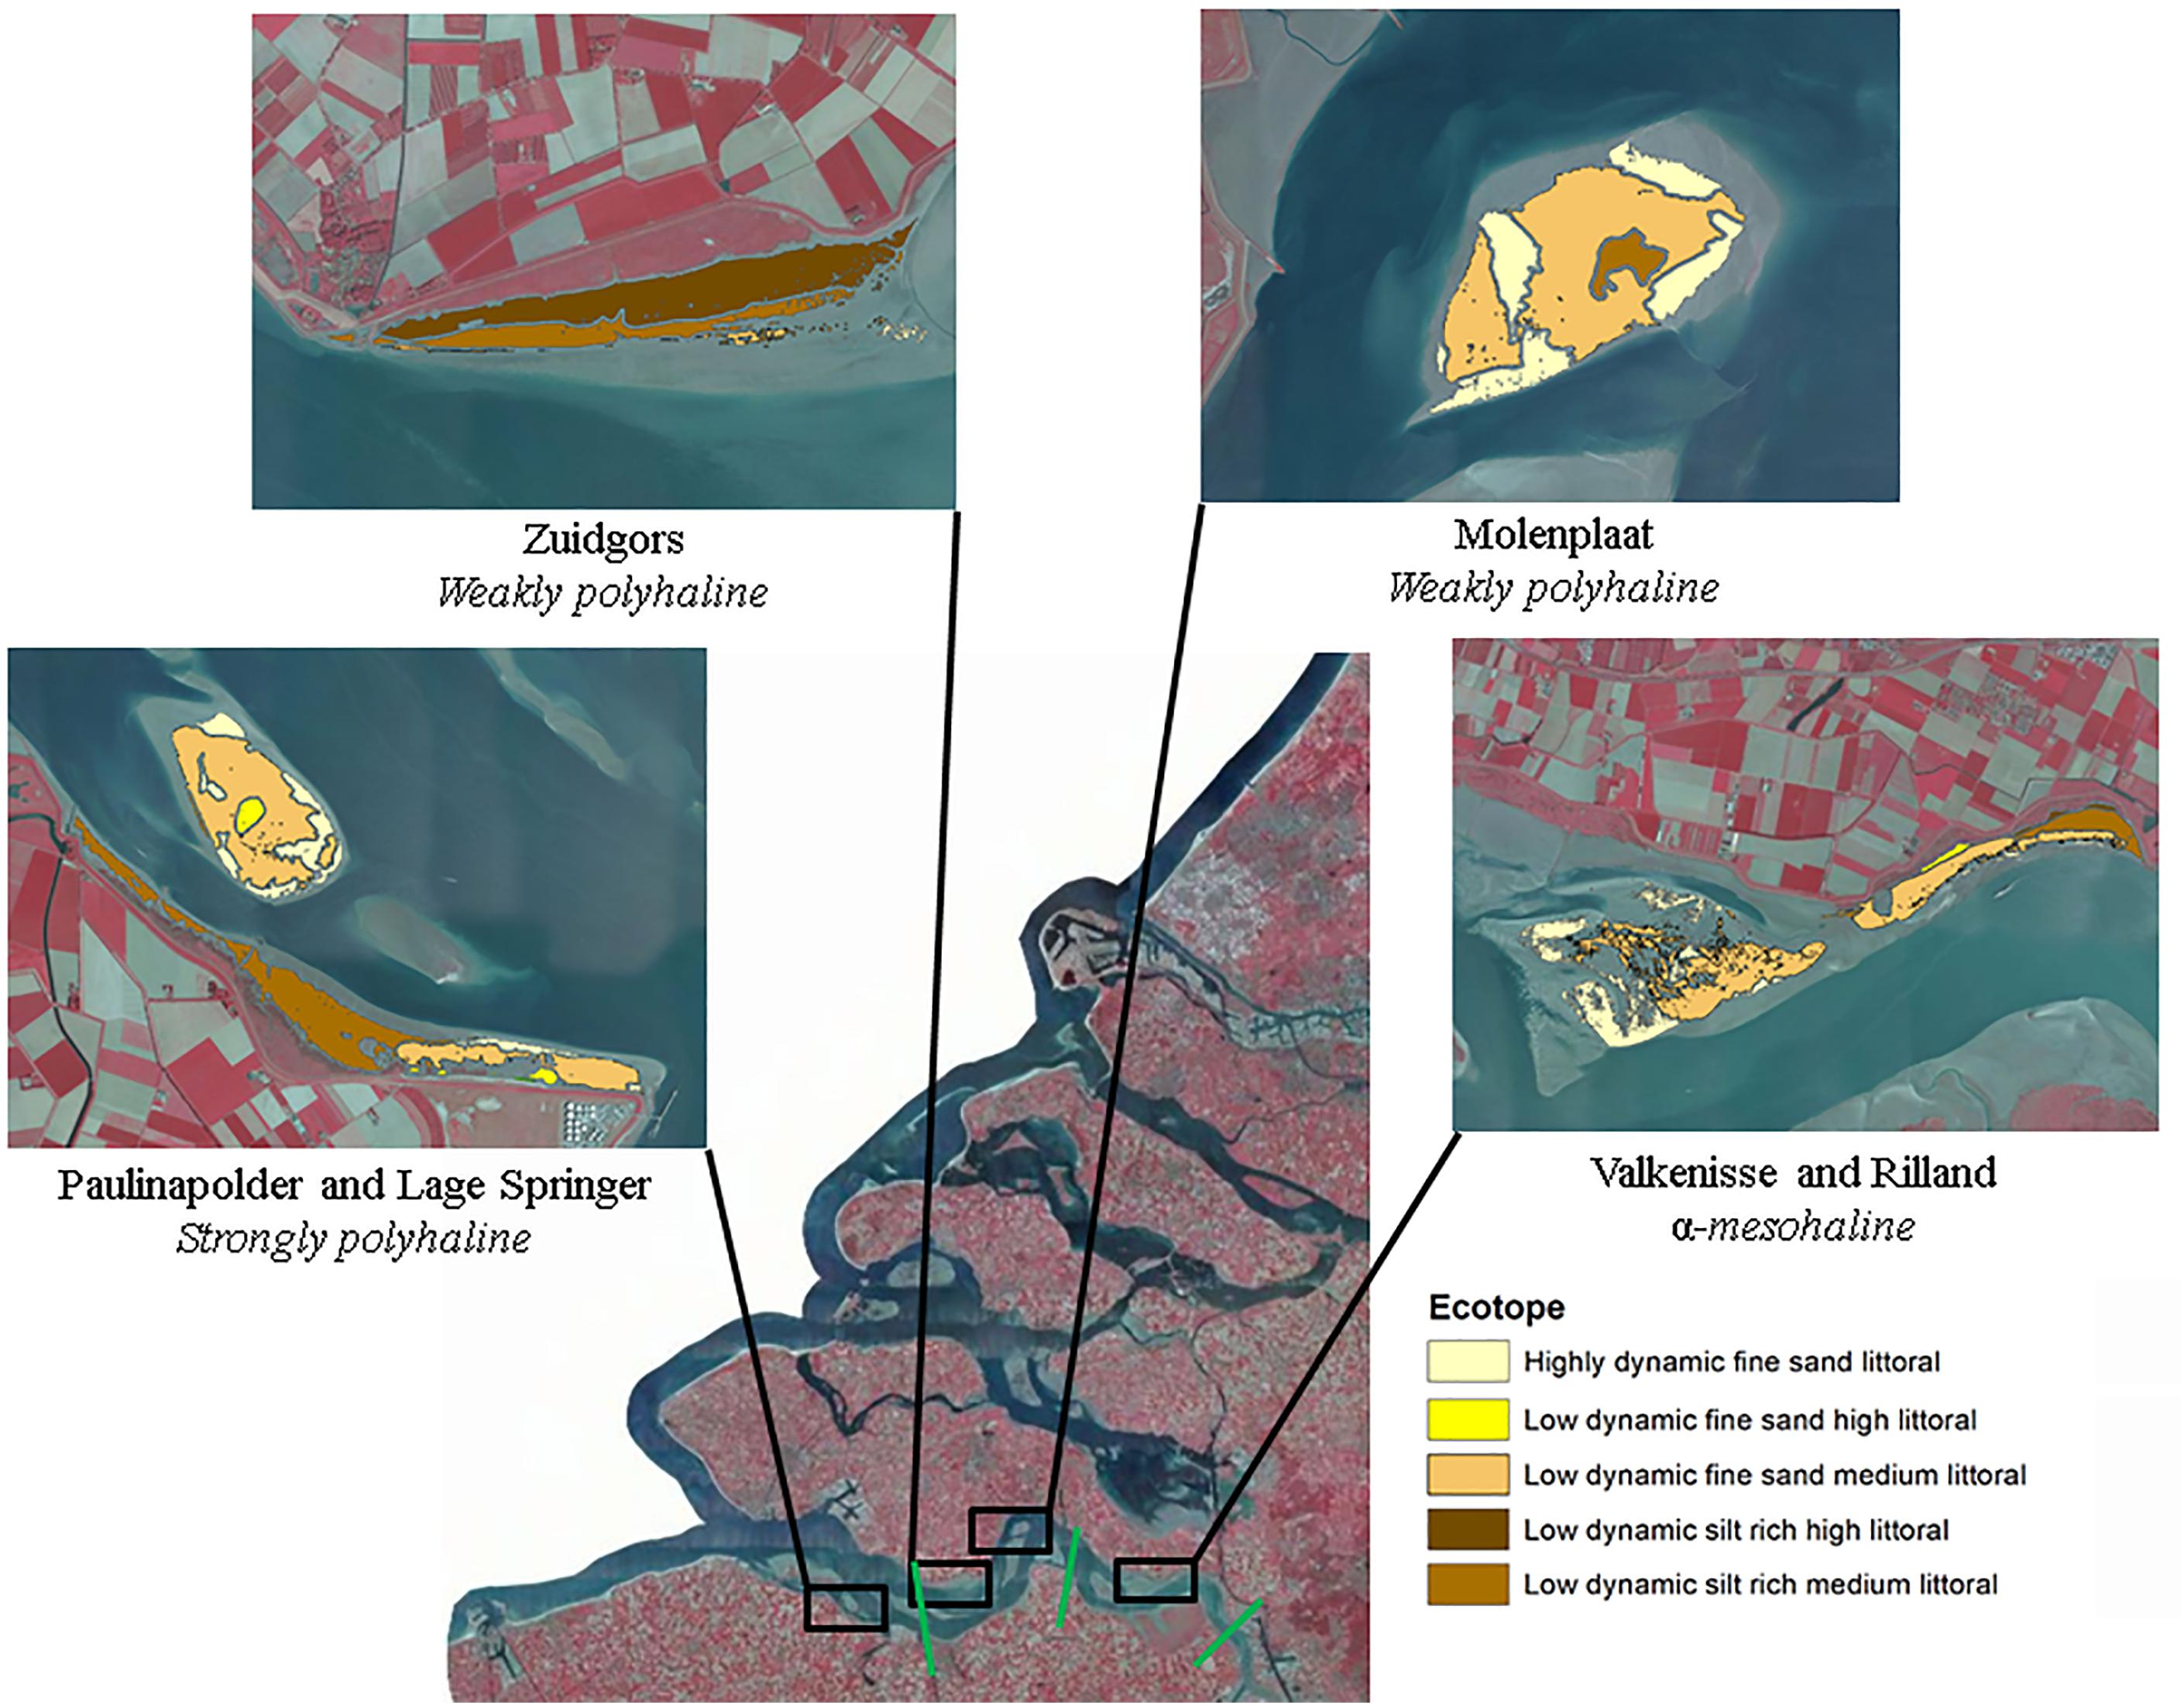
Figure 1. Study sites. The boundaries between different salinity zones (strongly polyhaline, weakly polyhaline, and α-mesohaline) are indicated in green. The boundaries of the study areas are the outer boundaries of the displayed ecotopes and contain the part of the tidal flat that was emersed at all images (see ‘Data analyses’ for a detailed description of the followed procedure). Ecotope information was obtained from Rijkswaterstaat (2017). Source image: Esri, Aerial photograph of the Netherlands CIR - 25 cm resolution, 2017.
MPB is the main benthic primary producer in the Westerschelde (Daggers et al., 2019). MPB biomass in the surface layer of intertidal sediments of the Westerschelde (i.e., the upper 2 mm) varies from approximately 5 to 300 mg chl a m–2 (Sahan et al., 2007; Daggers et al., 2019). In a study on the Molenplaat in the Westerschelde, MPB assemblages were dominated by benthic diatoms in spring and autumn, while in summer cyanobacteria and euglenoids became more abundant (Barranguet et al., 1997). In another study performed at the Molenplaat, benthic diatoms were found to be dominant in June (Kromkamp et al., 2006). Benthic diatoms consist of epipelic and epipsammic species. In a study on a brackish site in the Westerschelde, the epipsammic fraction was most abundant and dominated by Achnantes delicatula, Opephora cf. perminuta, and Catenula adhaerens (Sabbe, 1993), but many other (episammic) species can be found in the Westerschelde, such as Rhaphoneis amphiceros and R. munitissima (Sabbe and Vyverman, 1991). The epipelic diatom community composition is related locally to the tidal regime and sediment composition (Sabbe and Vyverman, 1991) and on the estuary scale to the salinity gradient, whereby brackish sites, e.g., contain Navicula flanatica, N. gregaria, N. phyllepta, Gyrosigma sp., Stauphora salina and Tryblionella hungarica and marine sites, e.g., contain the salt tolerant Amphora spp., N. arenaria var. rostellata, N. microdsigitoradiata, N. cf. mollis and N. perminuta (Sahan et al., 2007). The community composition of epipelic diatoms varies seasonally, notably at marine sites, containing a higher diversity and larger sized diatoms in late spring and summer than in early spring (Sahan et al., 2007).
Macroalgae densities are generally low and macroalgae are mainly located at the base of the dikes (Lucas and Holligan, 1999; Riera et al., 2000). Nevertheless, field surveys have revealed some patches with macroalgae (Ulva sp., Vaucheria sp.) in summer, particularly Ulva sp. at the southeastern side of the Molenplaat, and at the edge of a chenier on the southern side of Lage Springer.
The most common macrofauna species in the Westerschelde (observed in number of samples) are the capitellid worm Heteromastus filiformis, the saltwater clam Macoma balthica, the polychete worm Pygospio elegans, the sand digger shrimp Bathyporeia spp., the ragworm Hediste diversicolor and the mudsnail Peringia ulvae (Ysebaert et al., 2003).
Sentinel-2 Satellite Data and Pre-processing
Sentinel-2 MSI data for the tiles 31UES and 31UET from April 2016 to July 2019 were downloaded as level 1C data (before 2018) or level 2A (from 1 April 2017) from the Scientific hub at https://scihub.copernicus.eu. The level 1C data were atmospherically corrected using Sen2Cor v2.2; for level 2A the correction was already applied. For the atmospheric correction of the level 1C images, we assumed an aerosol type “maritime,” and used the default cirrus correction. Further default settings ensured that the temperature profile and ozone content were determined from the metadata of the image with a LUT to determine the best fit for the measured ozone concentration, and visibility was automatically calculated and averaged from the scene using a dark pixel approach (all images had a visibility of >20 km, clear sky). The season was also taken from the image metadata. On all images, an empirical line calibration was applied to band 4 (surface reflectance in the red) and 8 (surface reflectance in the near-infrared) of each image, using a set of reference points with semi-invariant surfaces (e.g., roofs, deep clear water) and regressed to surface reflectances in band 4 and 8 of an atmospherically corrected image with clear sky (March 12th 2016). This normalization was applied to best compare the images in time. In all cases, regressions had fits of R2 > 0.74 and in most cases R2 ≥ 0.90. The equations for both bands in each image are provided in Supplementary Table S1.
A Normalized Differential Vegetation Index (NDVI) was based on the resulting surface reflectance in band 4 (10 m resolution reflectance in the red RR) and band 8 (10 m resolution reflectance in the near-infrared RNIR), following (RNIR-RR)/(RR + RNIR) (Kromkamp et al., 2006; Van der Wal et al., 2010b; Daggers et al., 2018). Satellite images acquired during clear sky and low tide conditions were selected, considering groups of 3 images per season (Table 1). Pixels with clouds and cloud shadows were masked using manually defined polygons based on visual inspection of the image; such masks were applied for small areas in the sites of Rilland and Valkenisse on the image of July 5th 2019. The NDVI is used as proxy for MPB biomass on the emerged tidal flats, as elaborated below in section “Data analyses.” This proxy is widely used (e.g., Kromkamp et al., 2006; Van der Wal et al., 2010b; Kazemipour et al., 2012) and validated for this purpose with chlorophyll-a data collected at several sites along the estuarine gradient in the Dutch part of the Westerschelde (Daggers et al., 2018, 2019).
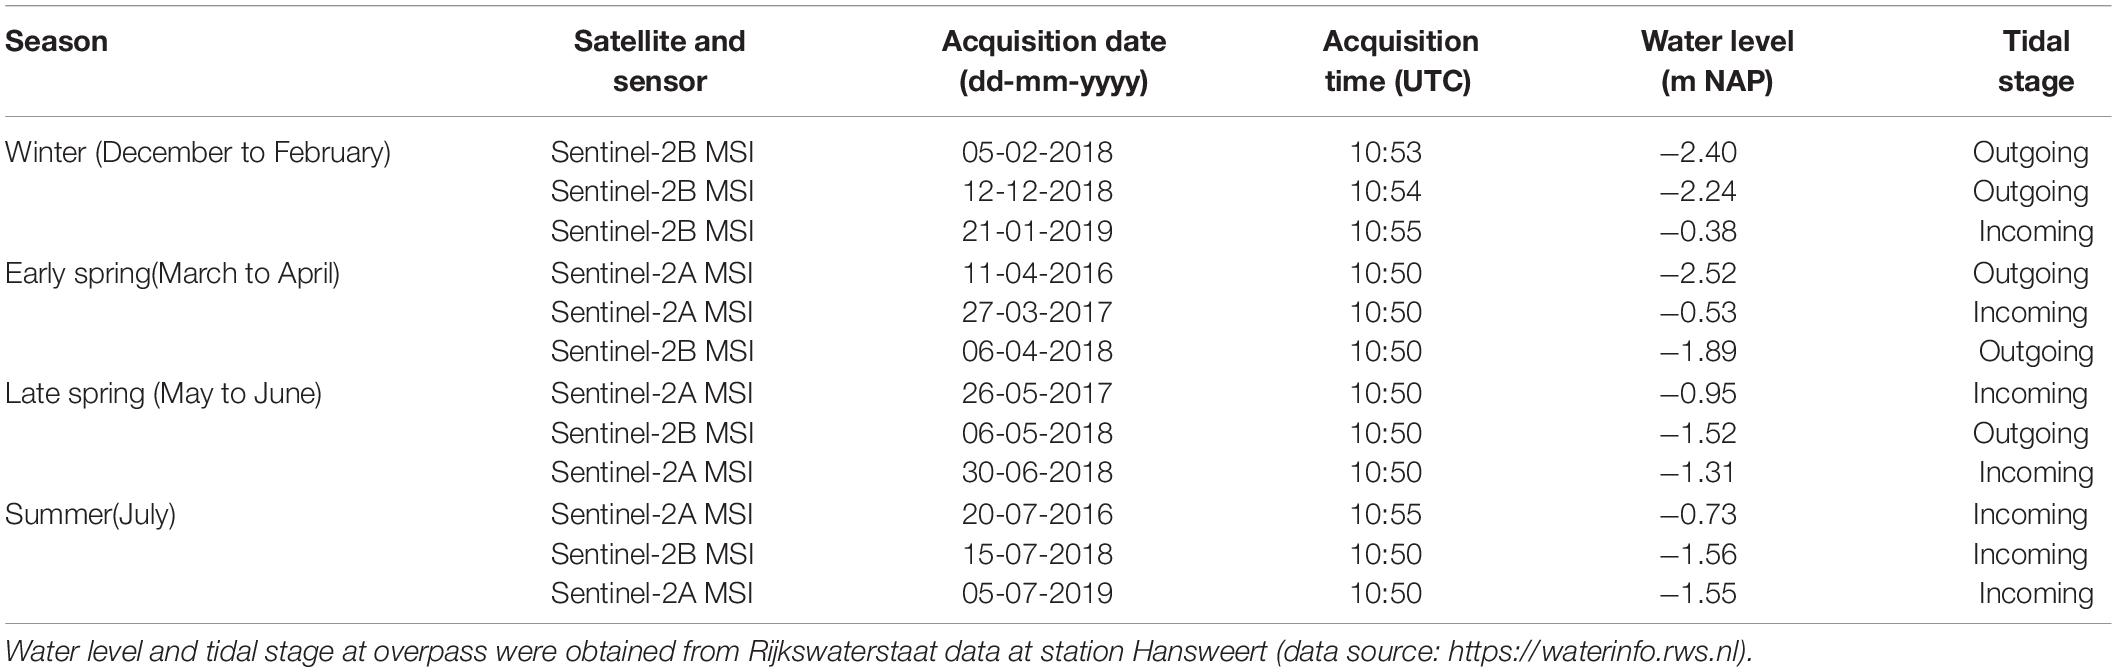
Table 1. Overview of Copernicus Sentinel-2 MSI imagery used for data analyses.
Ecotope and Bathymetry Maps
An ecotope map of the Westerschelde was obtained from Rijkswaterstaat (2017), and used to identify intertidal areas that are ecologically distinct (Bouma et al., 2006). The ecotope map of the Westerschelde considers the following abiotic factors for the ecotope classification of intertidal areas: hydrodynamics (high energy: maximum linear current velocity > 0.8 m/s, low energy: maximum linear current velocity < 0.8 m/s), depth (low littoral: 75% flood duration, medium high littoral: 75–25%, 25%) and sediment composition (silt rich: ≥25% silt, <63 μm; fine sand: >25% silt and median < 250 μm).
Airborne LiDAR data of the intertidal areas of the Westerschelde (2014–2018) were also obtained from Rijkswaterstaat (cm spatial resolution); these data were used to characterize the tidal flats of interest in terms of their mean elevation and standard deviation.
Data Analyses
The pixels used for the semi-variogram analysis were selected using a mask. Pixels with NDVI < −0.05 were considered to be water, and were removed. The boundary NDVI value of −0.05 was determined empirically, as areas with NDVI values > −0.05 were visibly emersed. Pixels with an NDVI < 0 may contain some standing water. Pixels with NDVI > 0.3 were excluded to exclude areas containing macroalgae. A buffer of 10m along saltmarshes was applied, to exclude pioneer vegetation. Only pixels that were emersed and did not contain macroalgae or saltmarsh vegetation at all available imagery were used for further analyses, i.e., the same mask was applied to all images. Using the ecotope map, saltmarshes present at low to high densities, peat and hard substratum were excluded from the study area. A buffer of 20 m was applied between ecotopes, to prevent edge effects in the semi-variogram analyses per ecotope. Semi-variograms of NDVI (as a proxy for microphytobenthos biomass MPB on emerged sediments), were used to quantify the degree (sill) and scale (range) of MPB patchiness (Rossi et al., 1992; Legendre and Legendre, 2012) for each tidal flat per image using the gstat package version 2.0-2 (Pebesma, 2004) in R version 3.6.0. Variograms were fit using the following default initial parameters: the maximum lag was taken as one third of the maximum sample variogram distance, the nugget parameter was taken as the mean of the first three sample variogram values and the partial sill was given the mean of the last five sample variogram values. To obtain the lag interval, the maximum lag was divided into 15 equal lags. A fit was considered as ‘converged’ when the change in the weighted sum of squares of differences between the semi-variogrm model and sample variogram became less than 106 times the last value of this sum of squares. The nugget represents random variation on the sub-pixel scale (<10 m). Omnidirectional semi-variograms were calculated for each tidal flat separately at each date (Table 1), where a tidal flat is defined as a consecutive intertidal area with a minimum width of 100 m. Furthermore, semi-variograms were calculated per ecotope on each tidal flat (see Figure 1 for an overview of ecotopes present). A spherical model gave the best semi-variogram fit (smallest sum of squared errors of the fitted model) at the majority of datasets as opposed to a Matern or exponential model and was therefore applied to all data. NDVI data per ecotope for which a semi-variogram could not be fitted, as autocorrelation was present in the entire study area, was excluded from further analyses (15% of ecotope data). The NDVI values were normally distributed (Shapiro–Wilk, p > 0.05). The NDVI data was (1) detrended using a 1st degree polynomial function to achieve stationary conditions, and (2) normalized by dividing by the standard deviation per tidal flat or ecotope.
Three images per season from winter to summer were considered (Table 1), whereby a distinction was made between early and late spring. The effect of season, salinity and tidal flat type (fringing or mid-channel) on MPB biomass, patch size (range), degree of patchiness (sill) and micro-scale variability (nugget) per tidal flat was quantified using an ANOVA test and HSD Tukey post hoc test. The residuals did not meet the normality assumption (Shapiro–Wilk, p < 0.01) and showed a somewhat right-tailed distribution as commonly observed in biological datasets. Variation in semi-variogram parameters calculated per ecotope per site was tested using an ANOVA and HSD Tukey post hoc test for the factors season, salinity and ecotope. We tested whether a linear correlation was present between the MPB biomass and sill using the Pearson product-moment correlation coefficient.
The locations on the tidal flats of interest where the NDVI was high or low, respectively, in particular seasons was similar over the years (2016–2019, inspected visually) and the NDVI was therefore averaged per season to produce maps with mean (non de-trended, non-normalized) NDVI per season. In addition, maps of the coefficient of variation in NDVI (calculated as σ/μ per pixel for the study period 2016-2019) were produced for each of the tidal flats and analyzed visually.
Results
Site Characteristics
The selected tidal flats, i.e., the surface area selected for semi-variogram analysis (−0.05 < NDVI < 0.30), had a similar surface area with the exception of Valkenisse (± a factor 2 larger) and similar average MPB biomass, i.e., NDVI (Table 2). The percentage of area covered with silt rich sediment derived from the ecotope map was profoundly larger on fringing tidal flats than on mid-channel tidal flats. The average elevation of the sites was similar, although Zuidgors was located somewhat higher in the intertidal (1.45 m NAP).
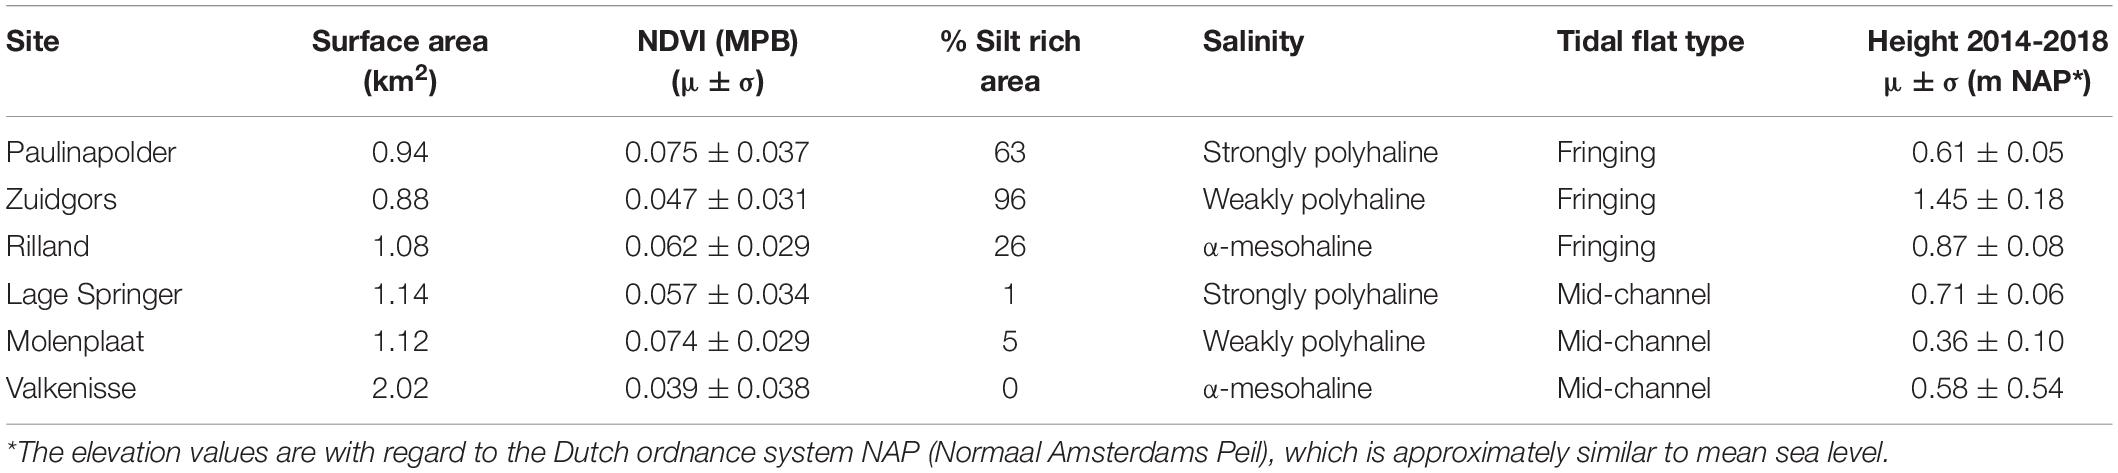
Table 2. General characteristics of the areas of interest of the selected tidal flats, i.e., −0.05 < NDVI < 0.3.
Seasonality in MPB Biomass
The MPB biomass was higher in summer than in early spring (Table 3; ANOVA, P = 0.004, F3,55 = 4.80, n = 72; HSD Tukey, p < 0.05). The MPB biomass did not differ significantly between fringing and mid-channel tidal flats (ANOVA, P = 0.9, F1,65 = 0.02, n = 72) or among salinity zones (ANOVA, P = 0.45, F2,65 = 0.81, n = 72). Particularly at Zuidgors, Molenplaat and Valkenisse an increasing trend in MPB biomass was observed from early spring to summer, while a large amount of variation in the biomass was present in winter among the years 2016–2019 at most sites (Figure 2).

Table 3. Statistics of MPB biomass and semi-variogram parameters calculated per site.
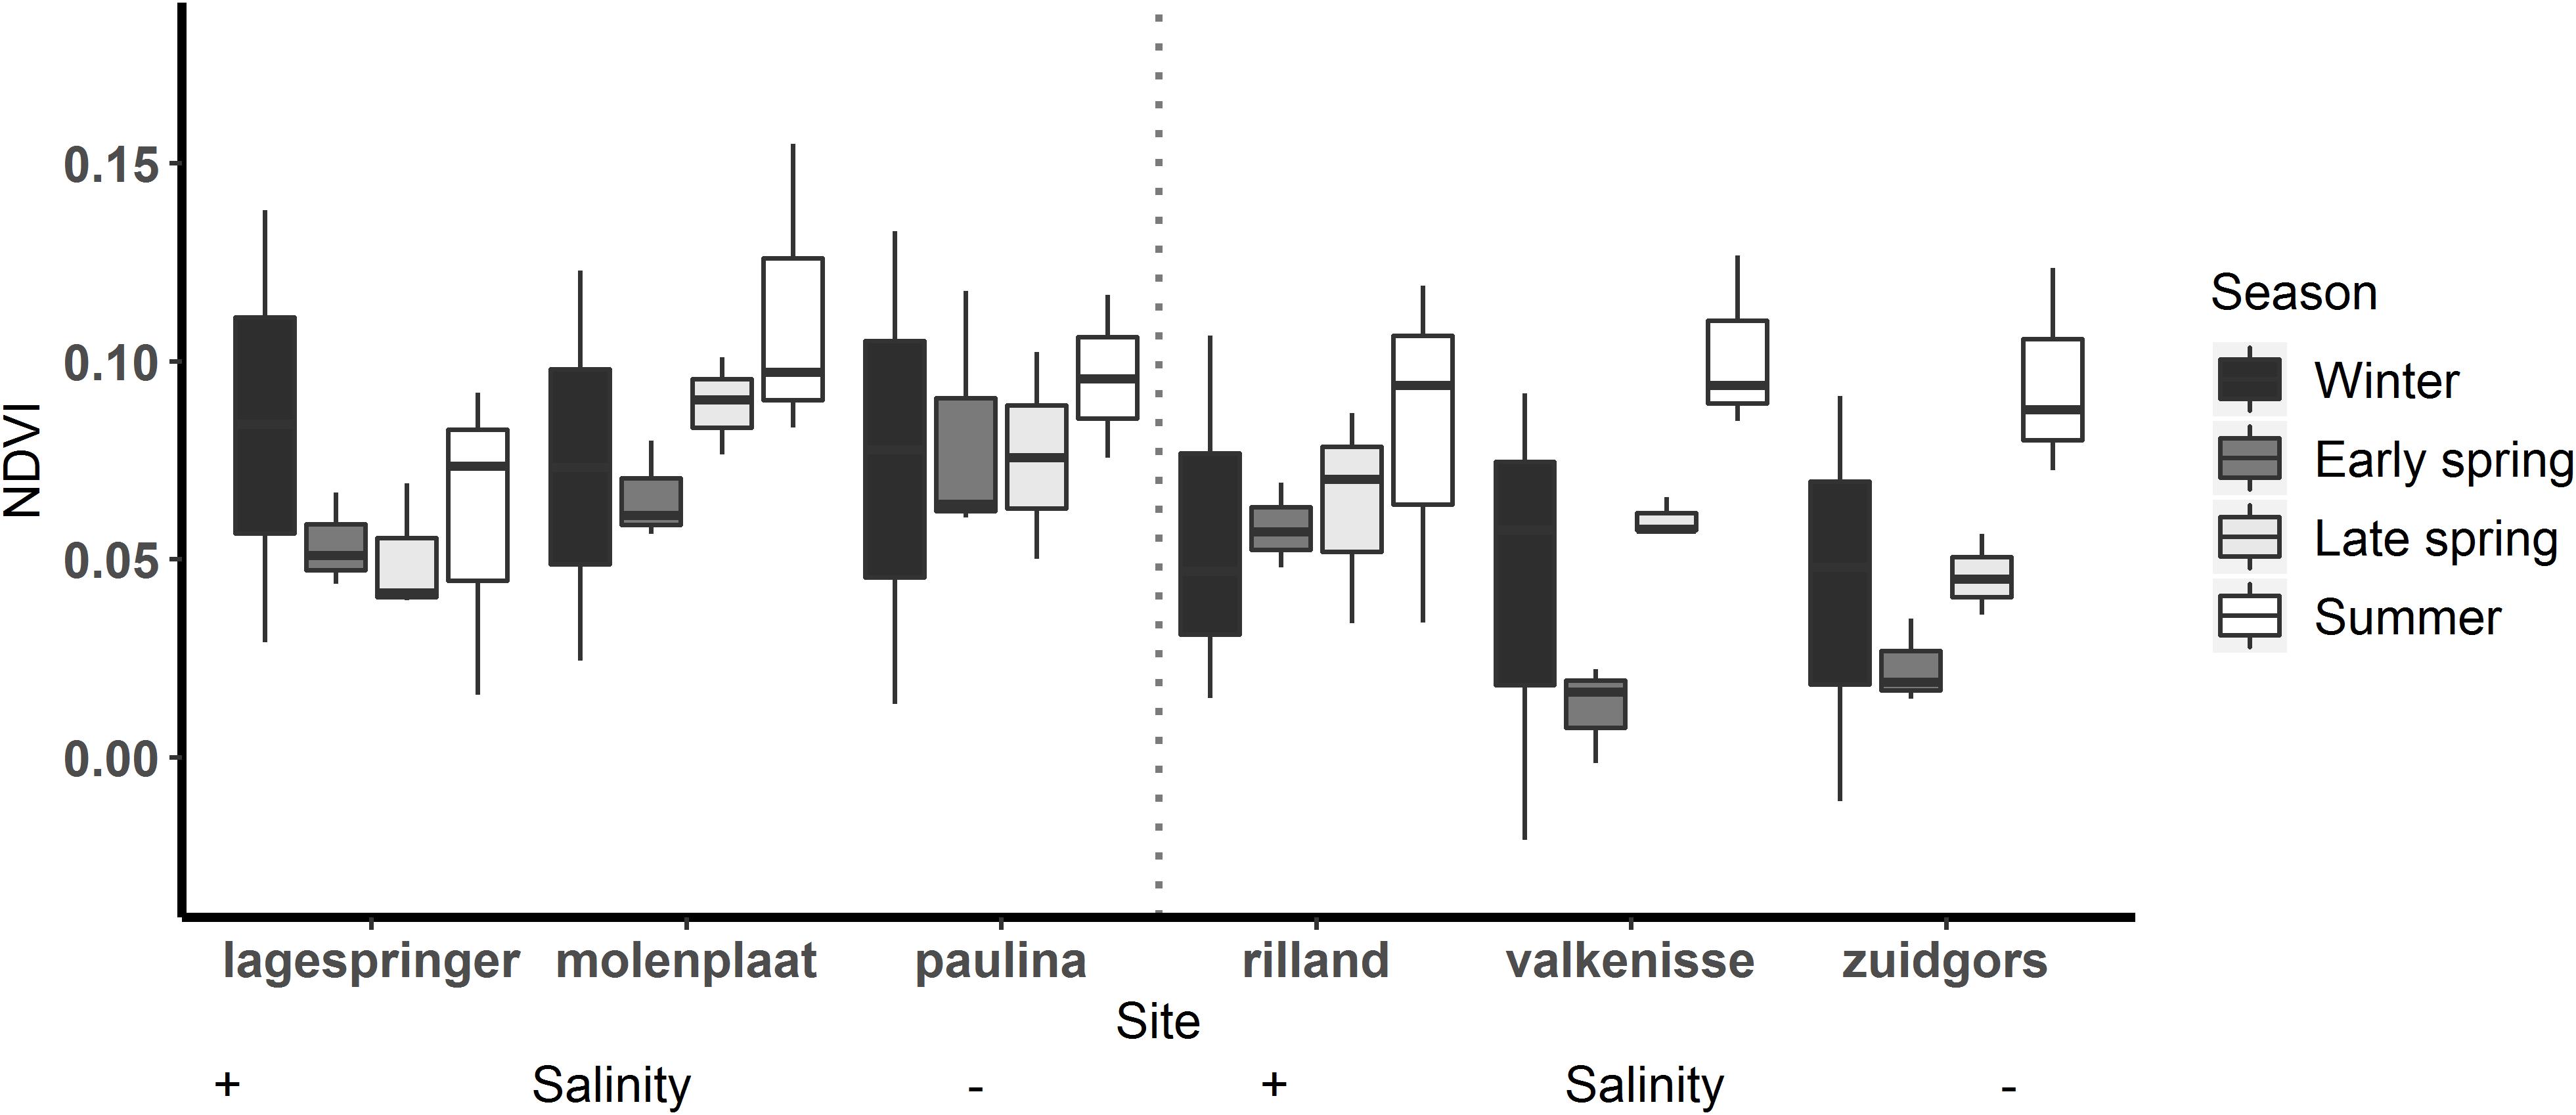
Figure 2. MPB biomass, expressed as the NDVI, on each tidal flat per season. Winter: December to February, early spring: March to April, late spring: May to June, summer: July.
Semi-Variogram Parameters per Site
The range derived from the semi-variograms of the normalized NDVI showed a high degree of similarity among different dates at each site (Figure 3 and Supplementary Table S2). The range of the semi-variogram (patch size) did not vary among seasons (ANOVA, P = 0.17, F3,65 = 1.72, n = 72) and appeared relatively constant throughout the year (Figure 4). Although the location of patches was in many cases constant throughout the year, the location of the patches may change over time (Figure 6 and Supplementary Figure S1). The range was higher in the mesohaline zone (603 m) than in the weakly polyhaline (338 m) and strongly polyhaline zone (366 m) (ANOVA, P = 2.77∗10–6, F2,65 = 15.68, n = 72; HSD Tukey, p < 0.0001). Furthermore, the range was higher at tidal flats located in the mid-channel (510 m) than at fringing tidal flats (362 m) (ANOVA, P < 0.001, F1,65 = 12.28, n = 72; HSD Tukey, p < 0.001). The angle of the major range was estimated visually from anisotropy maps and was highly consistent throughout the year (Lage springer: ±135, Molenplaat: ±60, Paulinapolder: ±115, Rilland: ±70, Valkenisse: ±100, Zuidgors: ±80).
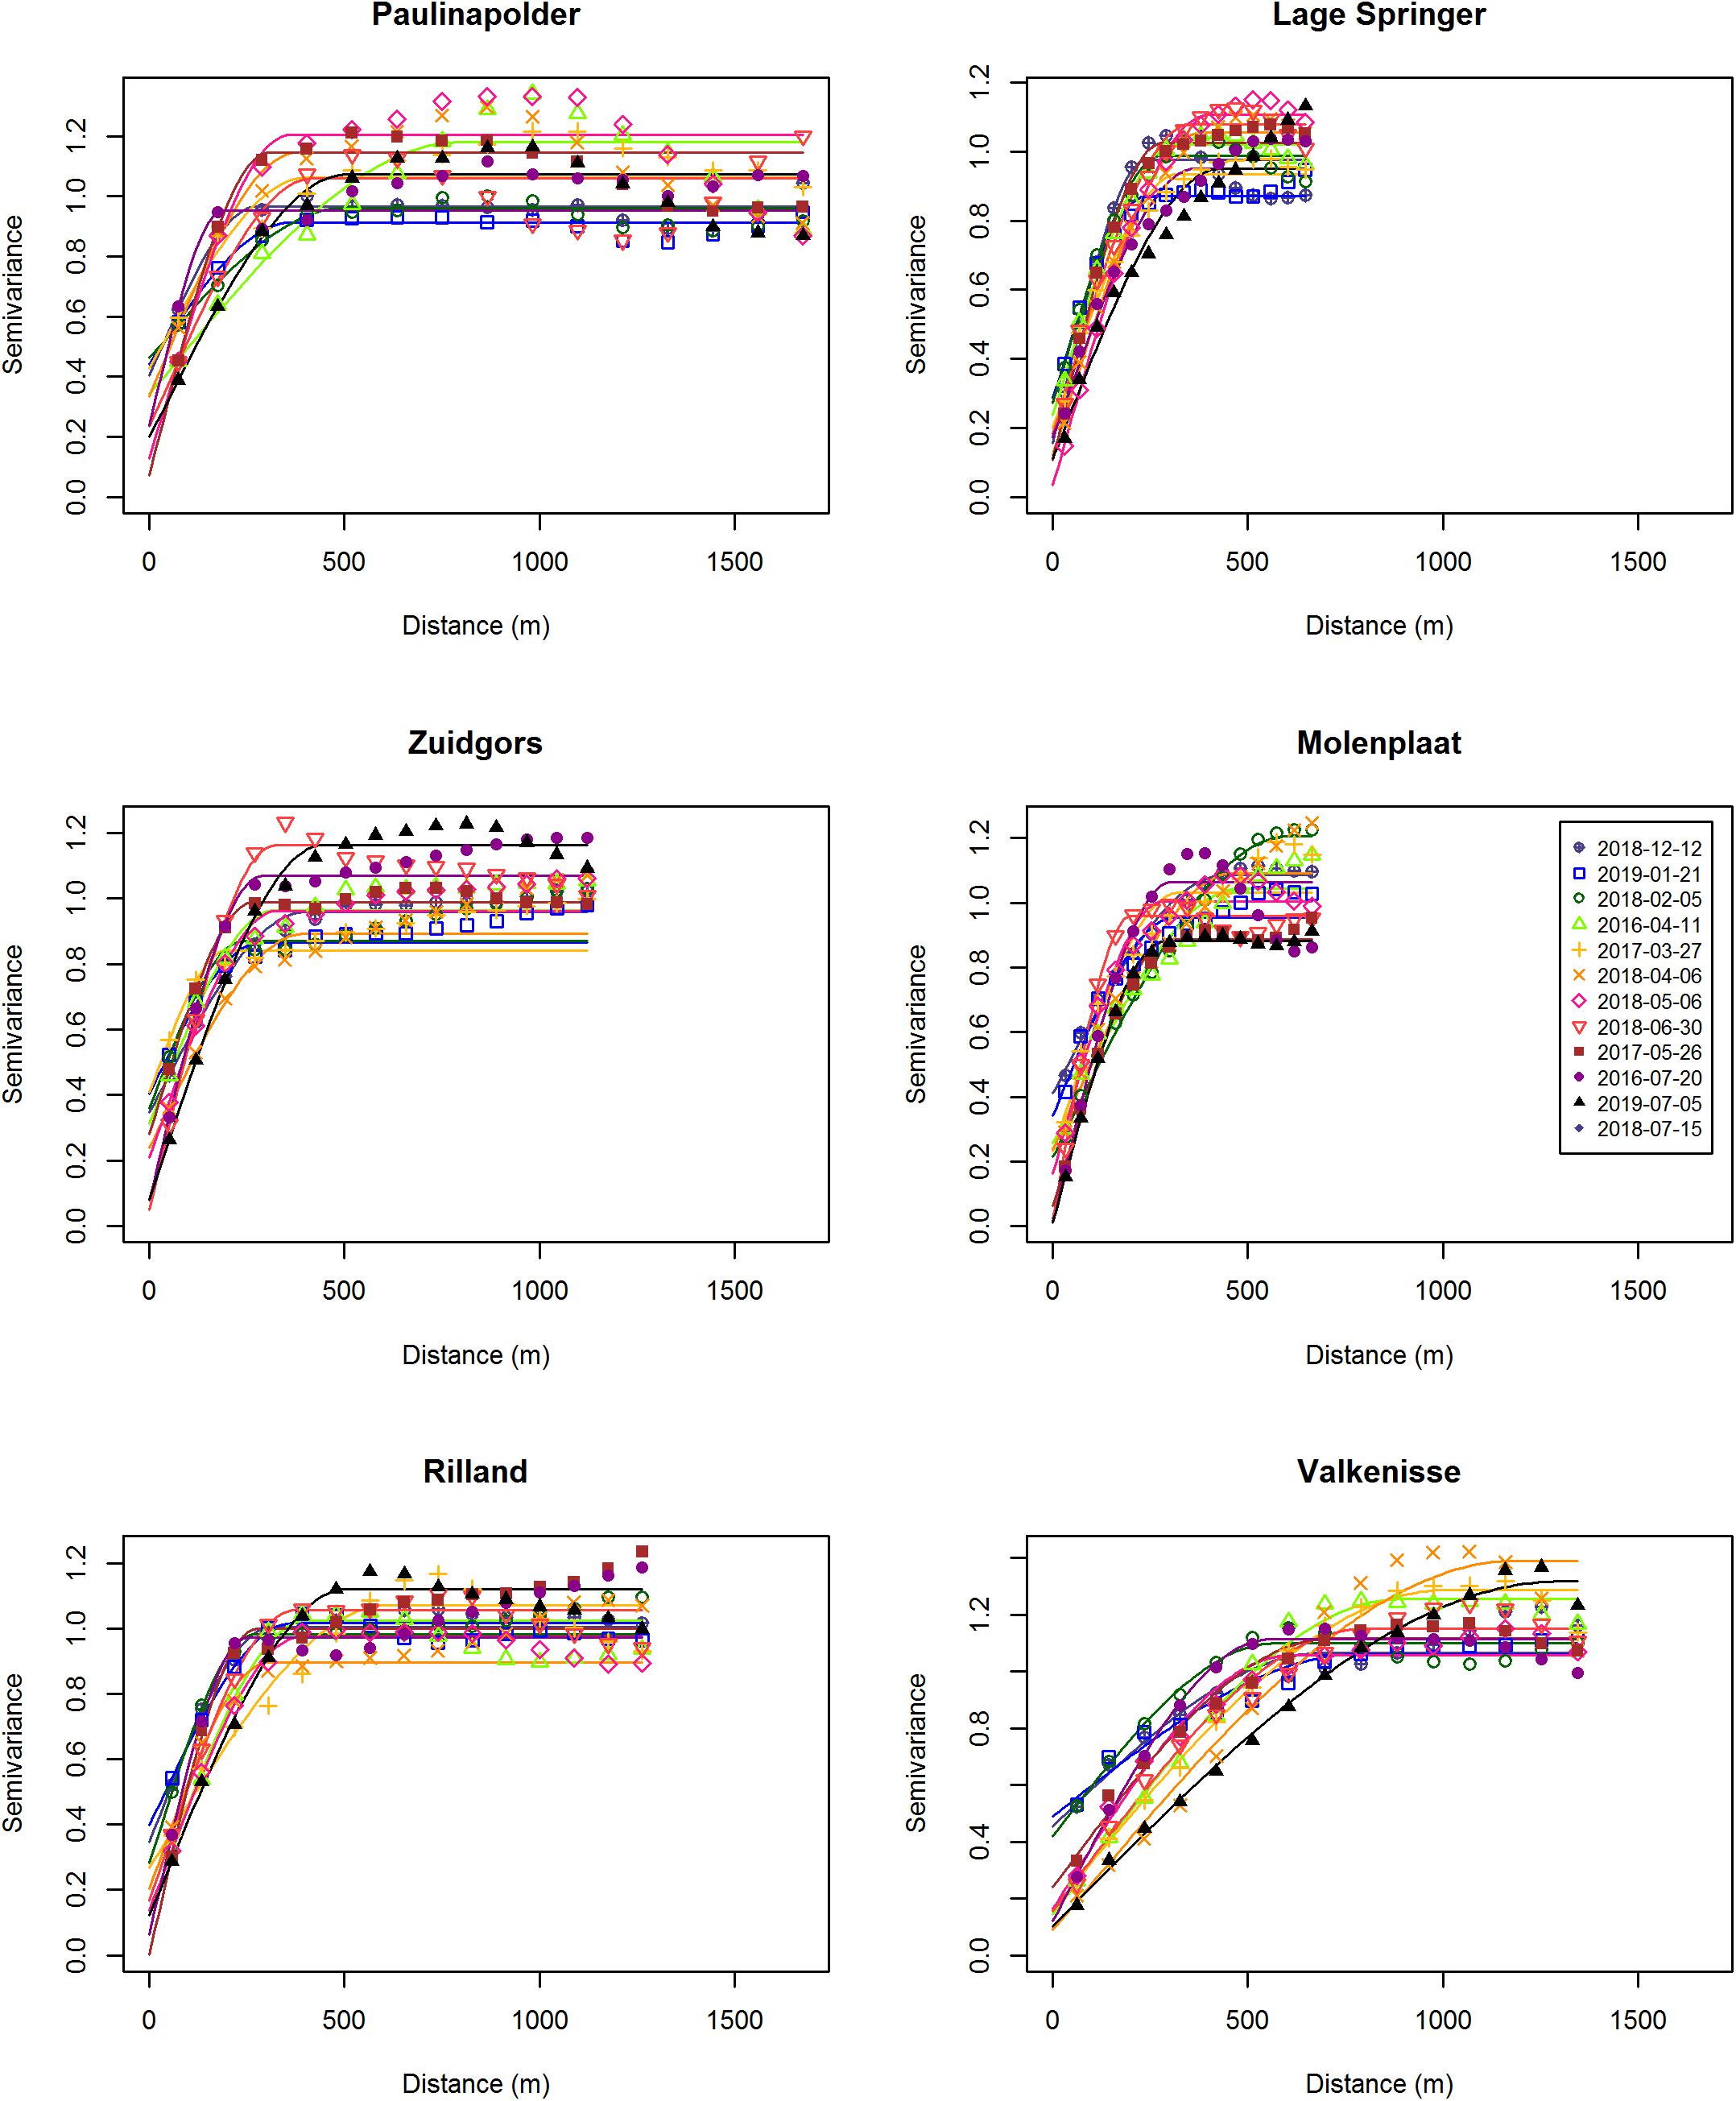
Figure 3. Semi-variograms per site.
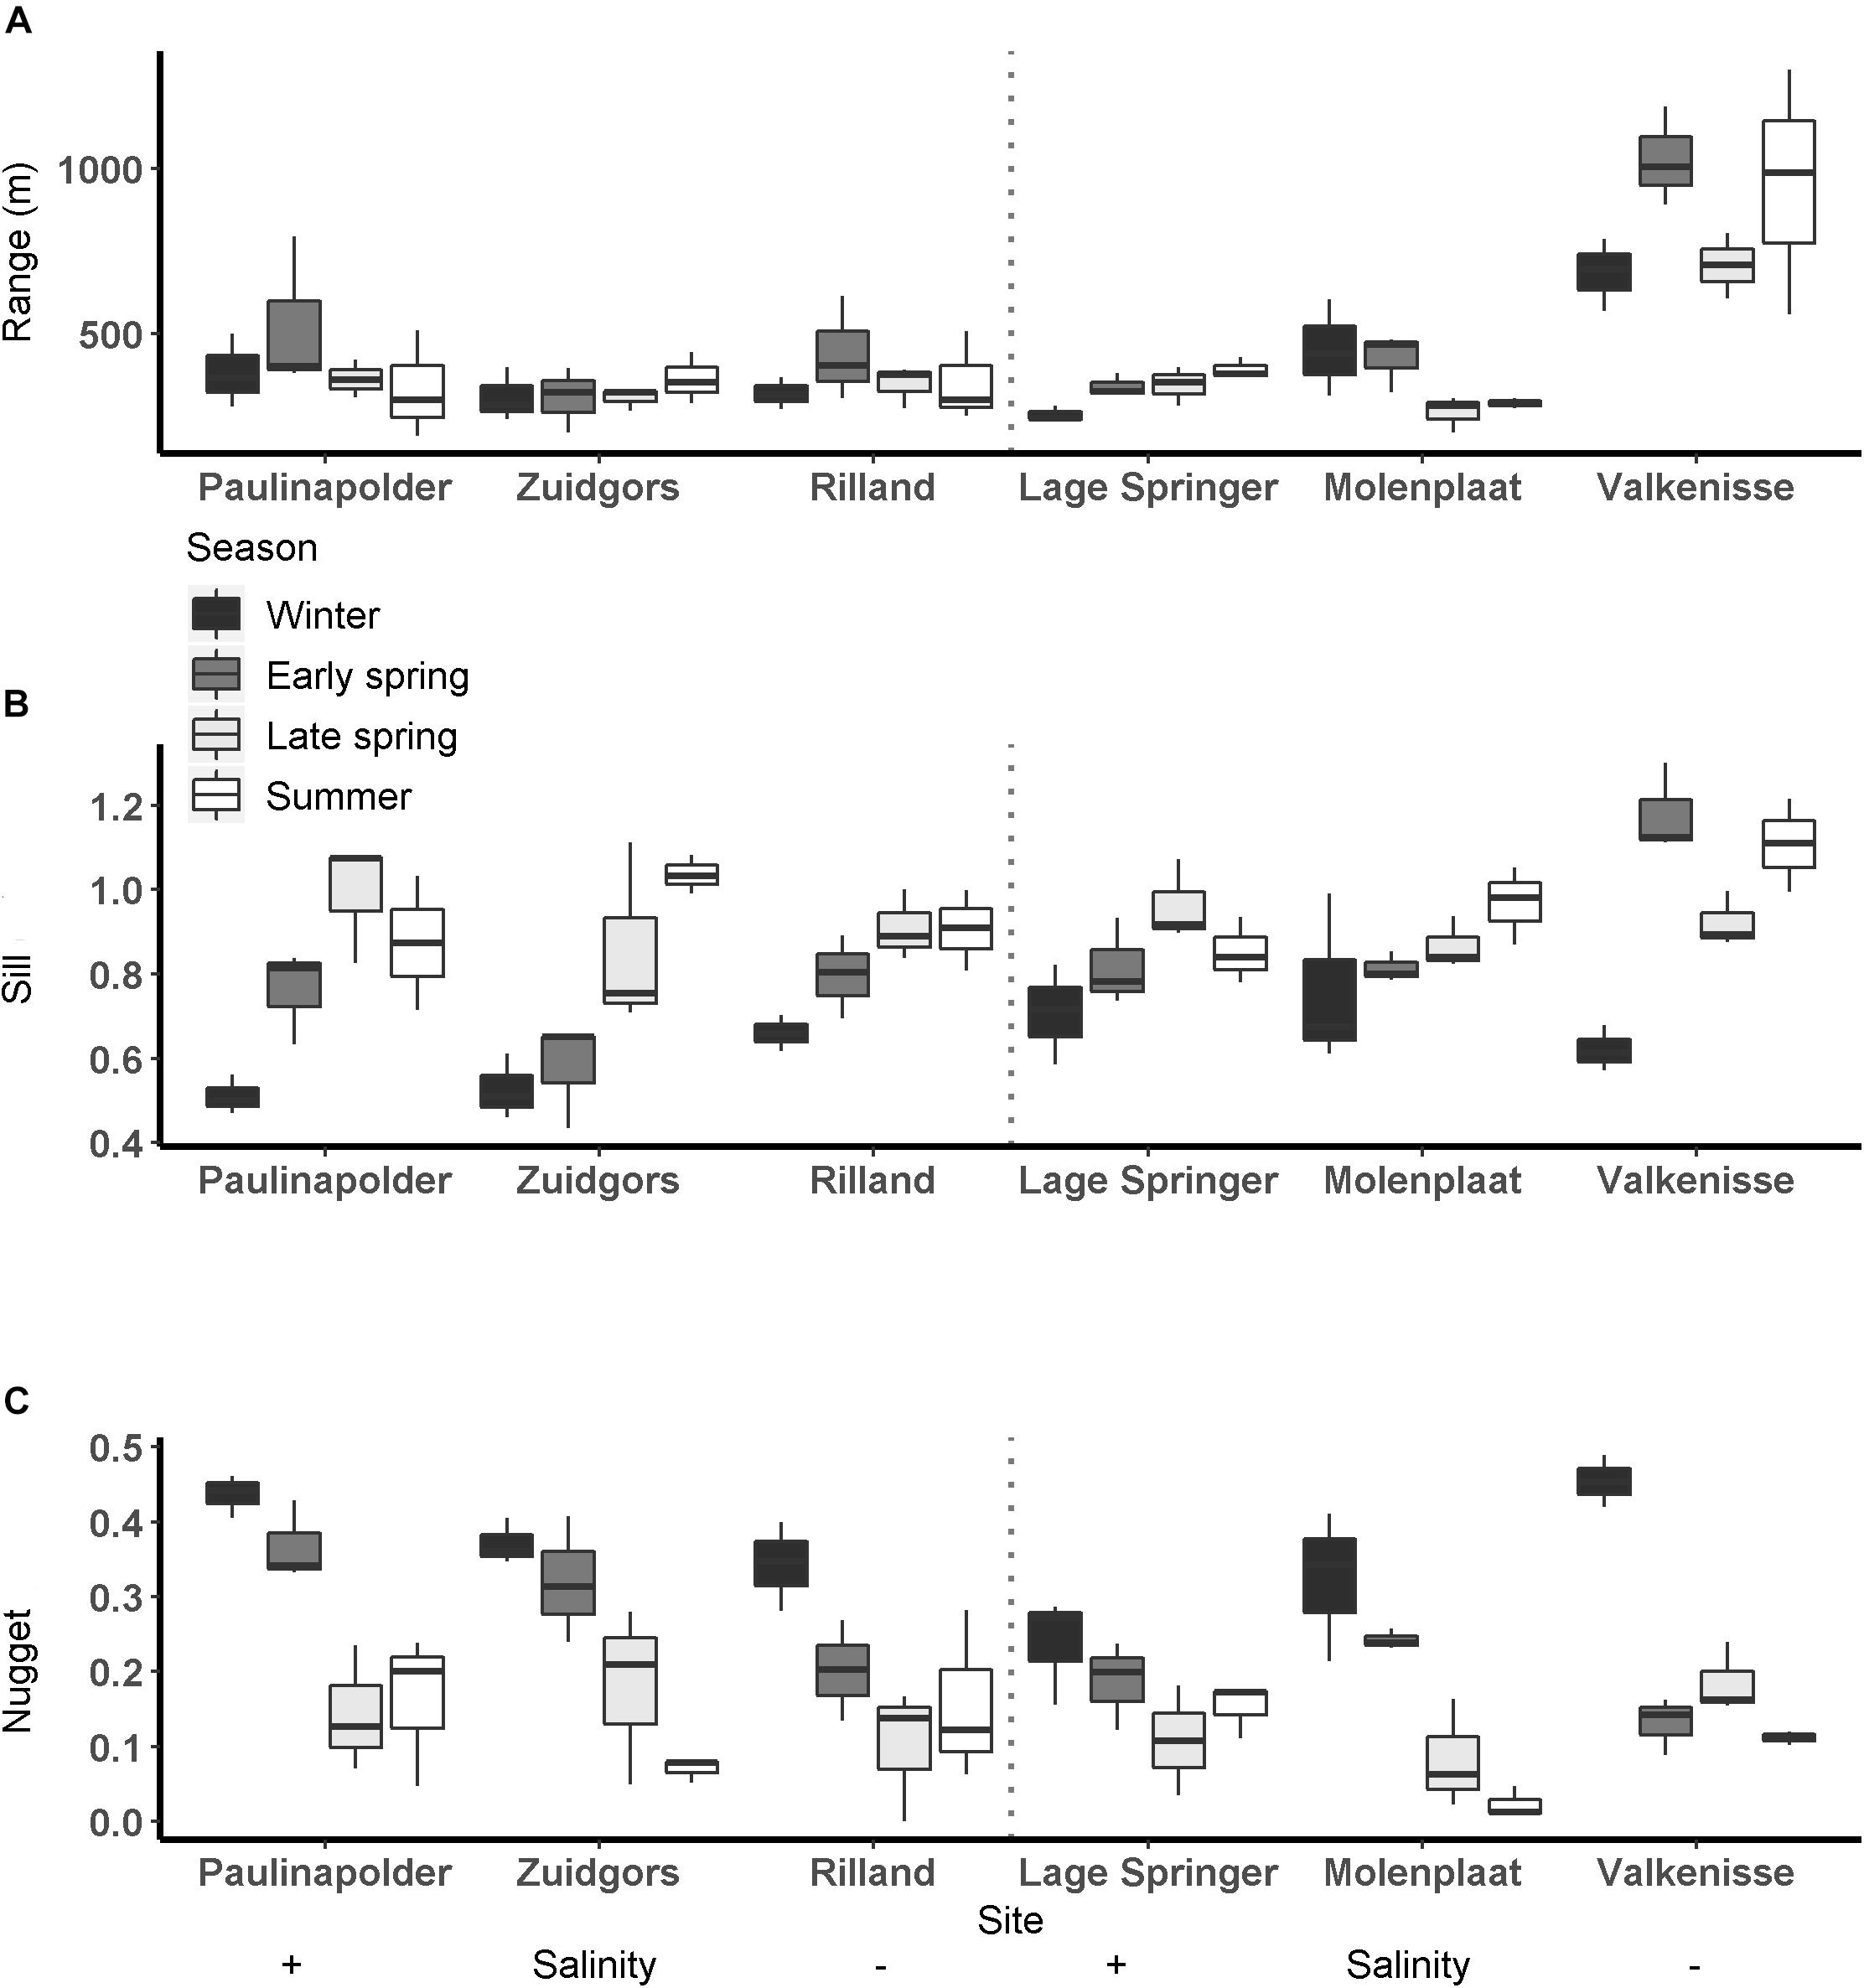
Figure 4. Semi-variogram parameters per season per site at fringing (left) and mid-channel (right) tidal flats (A: range (m), B: sill, C: nugget).
The sill showed an increasing trend throughout the year (Figure 4). The sill was higher in early spring, late spring, and summer than in winter and the sill was higher in summer than in early spring (ANOVA, P = 1.7∗10–9, F3,65 = 20.6, n = 72; HSD Tukey, p < 0.05). The sill was higher on mid-channel tidal flats than on fringing tidal flats (ANOVA, P = 0.004, F3,65 = 9.18, n = 72; HSD Tukey, p < 0.01). The sill was not significantly correlated with MPB biomass (Pearson’s r = 0.17, p = 0.16).
The nugget showed a decreasing trend throughout the year (Figure 4). The nugget did not vary significantly as function of salinity, but was lower in early spring, late spring and summer than in winter. Furthermore, the nugget was lower in late spring and summer than in early spring (ANOVA, P = 2.54∗10–13, F3,65 = 33.95, n = 72; HSD Tukey, p < 0.05). The nugget was higher on fringing tidal flats than on mid-channel tidal flats (ANOVA, P = 0.01, F3,65 = 6.85, n = 72; HSD Tukey, p < 0.05).
Semi-Variogram Parameters per Ecotope
The range calculated per ecotope did not differ significantly among seasons or salinity zones (Figure 5 and Table 4). The range was higher in the ‘low dynamic silt rich medium high littoral’ ecotope than the ‘low dynamic fine sand high littoral’ ecotope (ANOVA, P = 0.002, F3,111 = 4.02, n = 120; HSD Tukey, p = 0.02). Furthermore, the range was lower in the ‘low dynamic fine sand high littoral’ ecotope than in the ‘highly dynamic fine sand littoral’ ecotope (HSD Tukey, p = 0.001). Lastly, the range was higher in the ‘low dynamic fine sand medium high littoral’ ecotope than in the ‘low dynamic fine sand high littoral’ ecotope (HSD Tukey, p = 0.01).
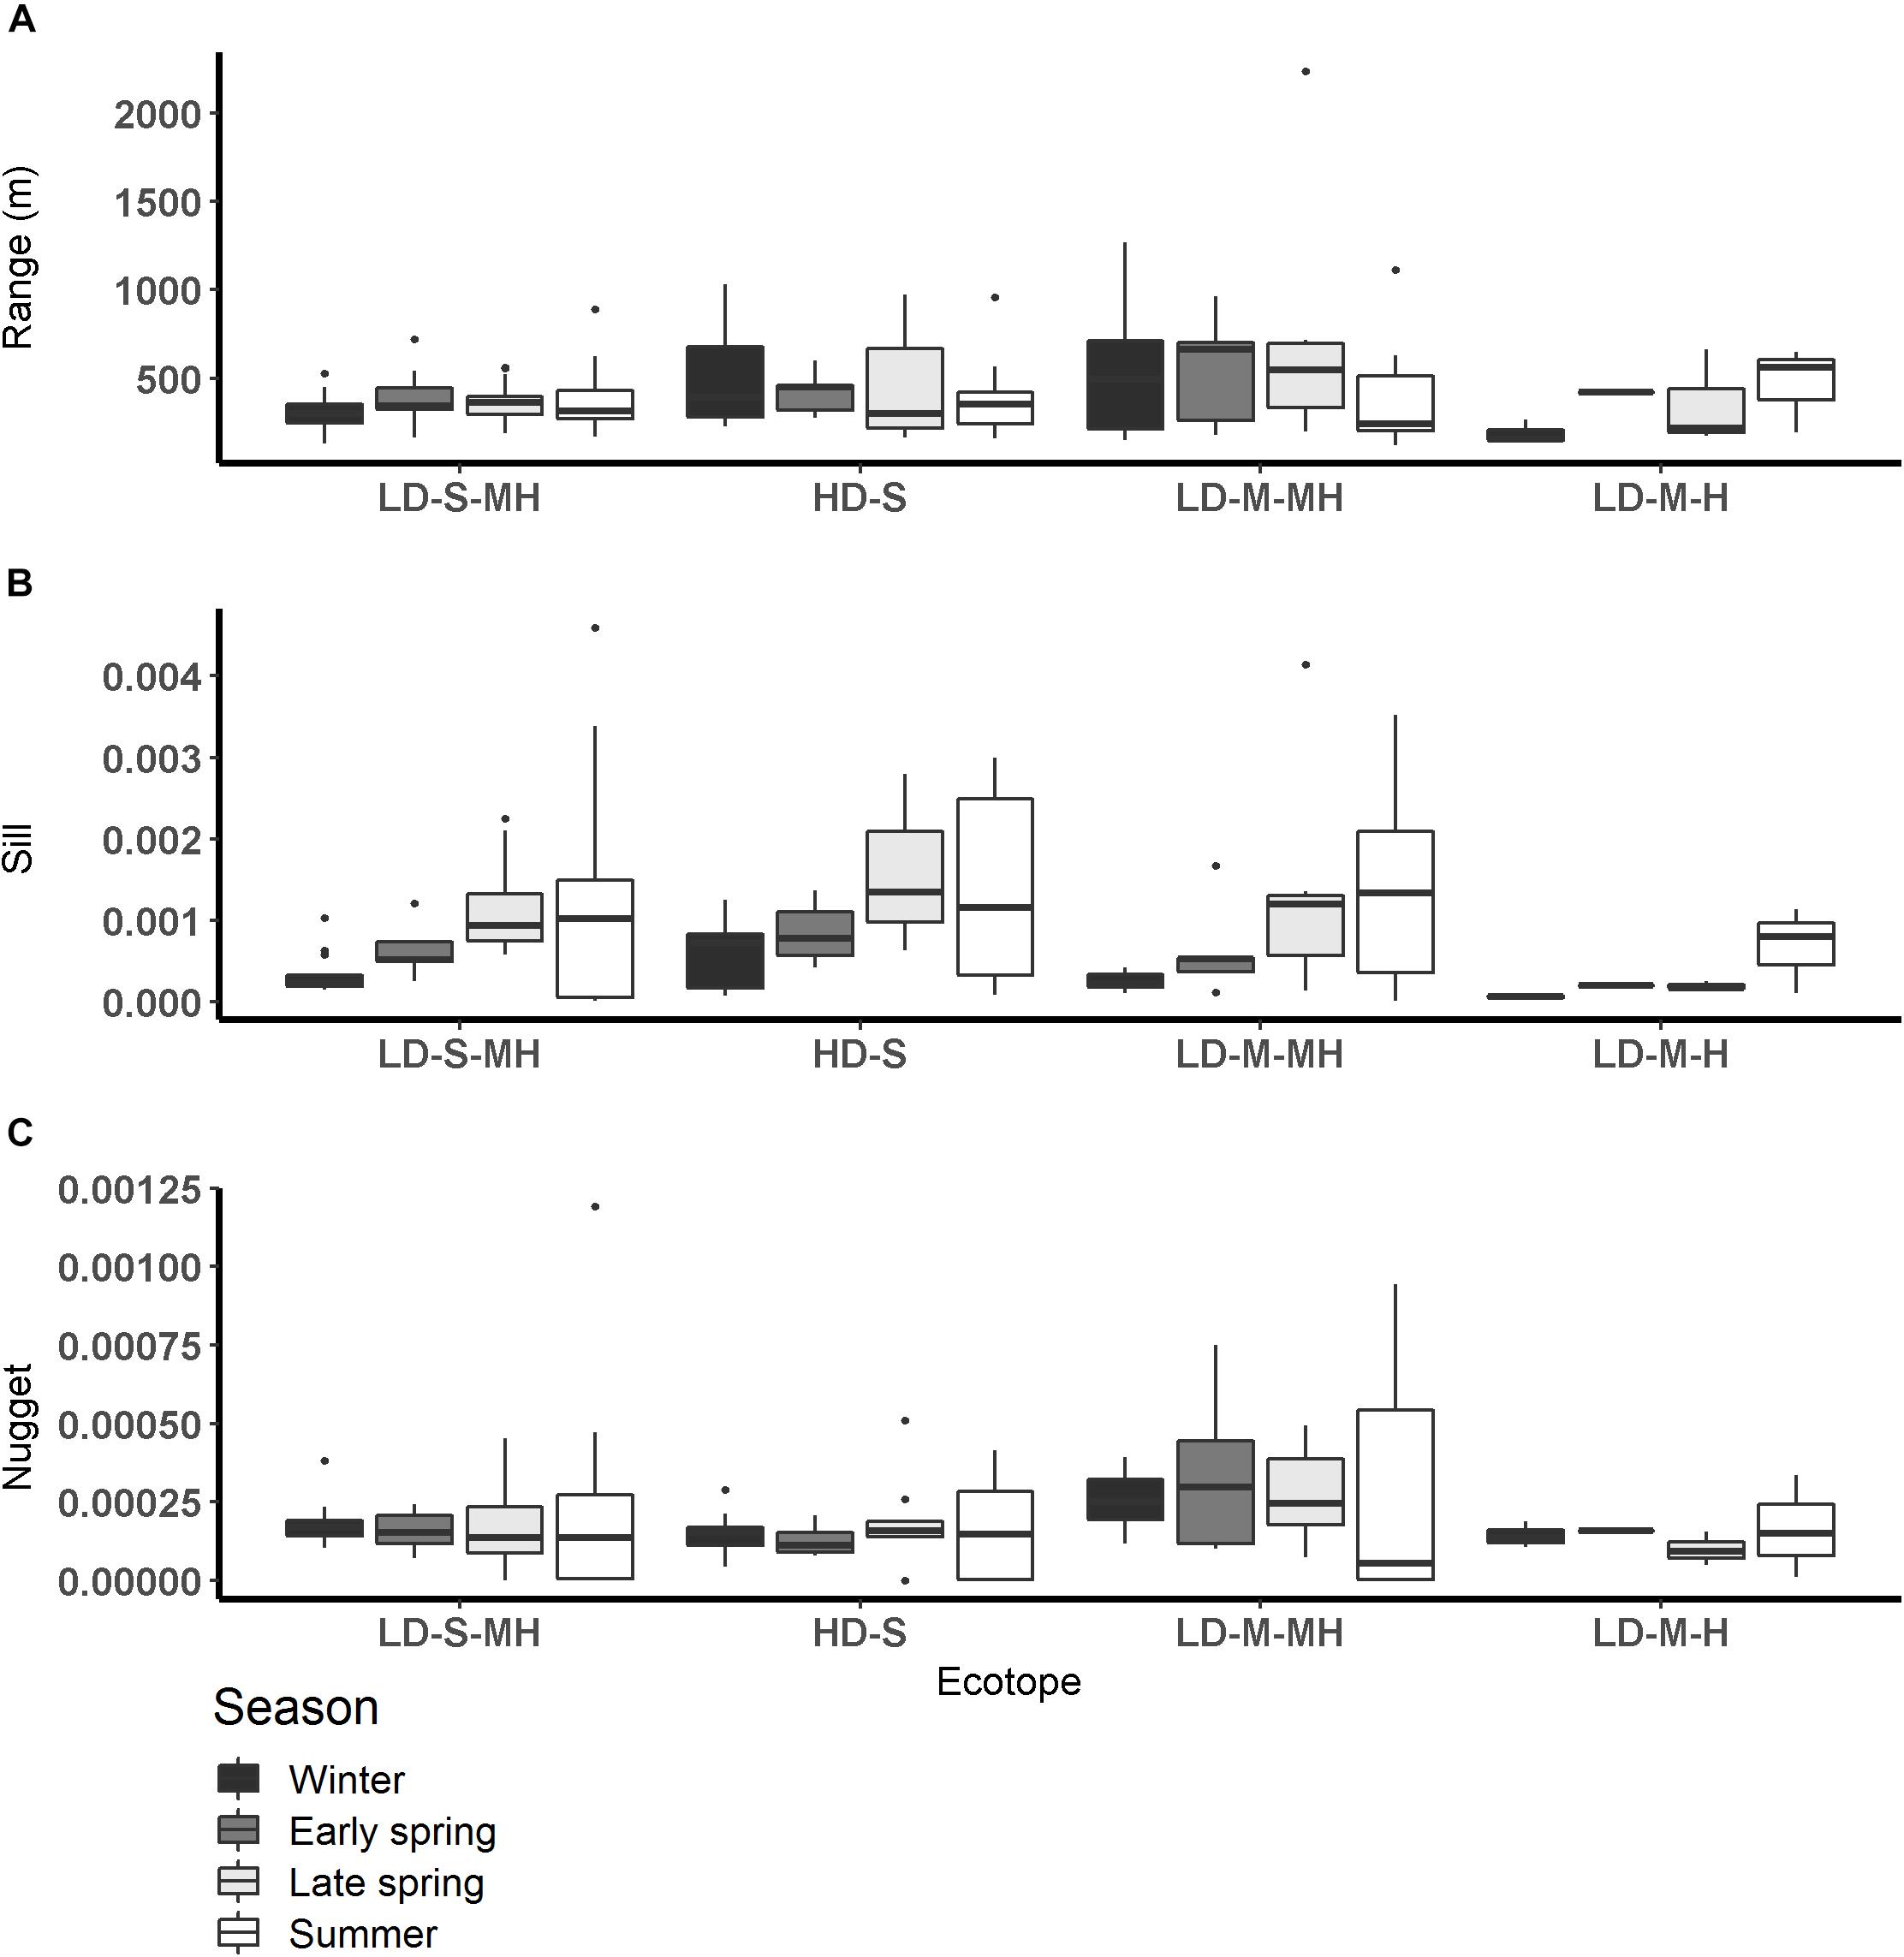
Figure 5. Semi-variogram parameters per season per ecotope (A: range (m), B: sill, C: nugget). HD-S, Highly dynamic fine sand littoral; LD-S-MH, low dynamic fine sand medium high littoral; LD-M-H, low dynamic silt rich high littoral, and LD-M-MH, low dynamic silt rich medium high littoral.

Table 4. Statistics of MPB biomass and semi-variogram parameters calculated per ecotope.
The sill calculated per ecotope was higher in late spring and summer than in winter (ANOVA, P = 1.6∗10–5, F3,111 = 8.83, n = 120; HSD Tukey, p < 0.001). The sill did not differ significantly among ecotopes. The sill was higher in the weakly polyhaline zone than in the strongly polyhaline zone (ANOVA, P = 0.02, F3,111 = 3.81, n = 120; HSD Tukey, p < 0.05). The ANOVA test revealed significant differences in the variance between ecotopes (ANOVA, P = 0.01, F3,111 = 3.01, n = 120). However, an HSD Tukey test revealed no significant differences between individual ecotopes.
The nugget was higher in early spring, late spring and summer than in winter and higher in early spring than in summer (ANOVA, P < 2∗10–16, F3,111 = 32.84, n = 120; HSD Tukey, p < 0.05). The nugget did not differ significantly among salinity zones. The nugget was higher in the ‘low dynamic fine sand high littoral’ ecotope than in the ‘highly dynamic fine sand littoral’ ecotope (ANOVA, P < 0.002, F3,111 = 3.93, n = 120; HSD Tukey, p = 0.01). The nugget was higher in the ‘highly dynamic fine sand high littoral’ ecotope than in the ‘low dynamic fine sand medium high littoral’ ecotope (HSD Tukey, p = 0.02).
Seasonality in the Location of Patches
Regular observation of the sites showed that that some areas with a relatively high MPB biomass (‘patches’) remain visible throughout the year, while other patches were only present during a particular season. For example, the patch located on the southeast side of the mid-channel tidal flat Lage Springer (Figure 6, a) can be clearly distinguished during all studied seasons. However, the patch located on the north side of Lage Springer was clearly visible in winter, but could hardly be detected in other seasons (Figure 6, b). At the fringing tidal flat Paulinapolder, an area of high MPB biomass was observed at the center of the tidal flat, which could not be distinguished clearly in winter or spring (Figure 6, c). At the mid-channel tidal flat Valkenisse, the MPB biomass was consistently higher on the southeast side of the tidal flat throughout the year and the region with a relatively high biomass appeared to increase in surface area from spring to summer (Supplementary Figure S1, a and Figure 2). The coefficient of variation confirmed that changes in MPB biomass were relatively low in this area (Figure 7, a). At the mid-channel tidal flat Molenplaat, the seasonal average of the MPB biomass was relatively high on the east side throughout the year (Supplementary Figure S1, b). The MPB biomass was most variable over time on the west side (Figure 7, b), where a patch appeared in late spring (Supplementary Figure S1, c). At the fringing tidal flats Zuidgors and Rilland, a cross-shore gradient from high to low in MPB biomass was present during all seasons. The MPB biomass was most variable throughout the year at low elevation at Zuidgors, Rilland and Valkenisse (Figure 7). In late spring, a band of high MPB biomass appeared at low elevation at Zuidgors (Supplementary Figure S1, d).
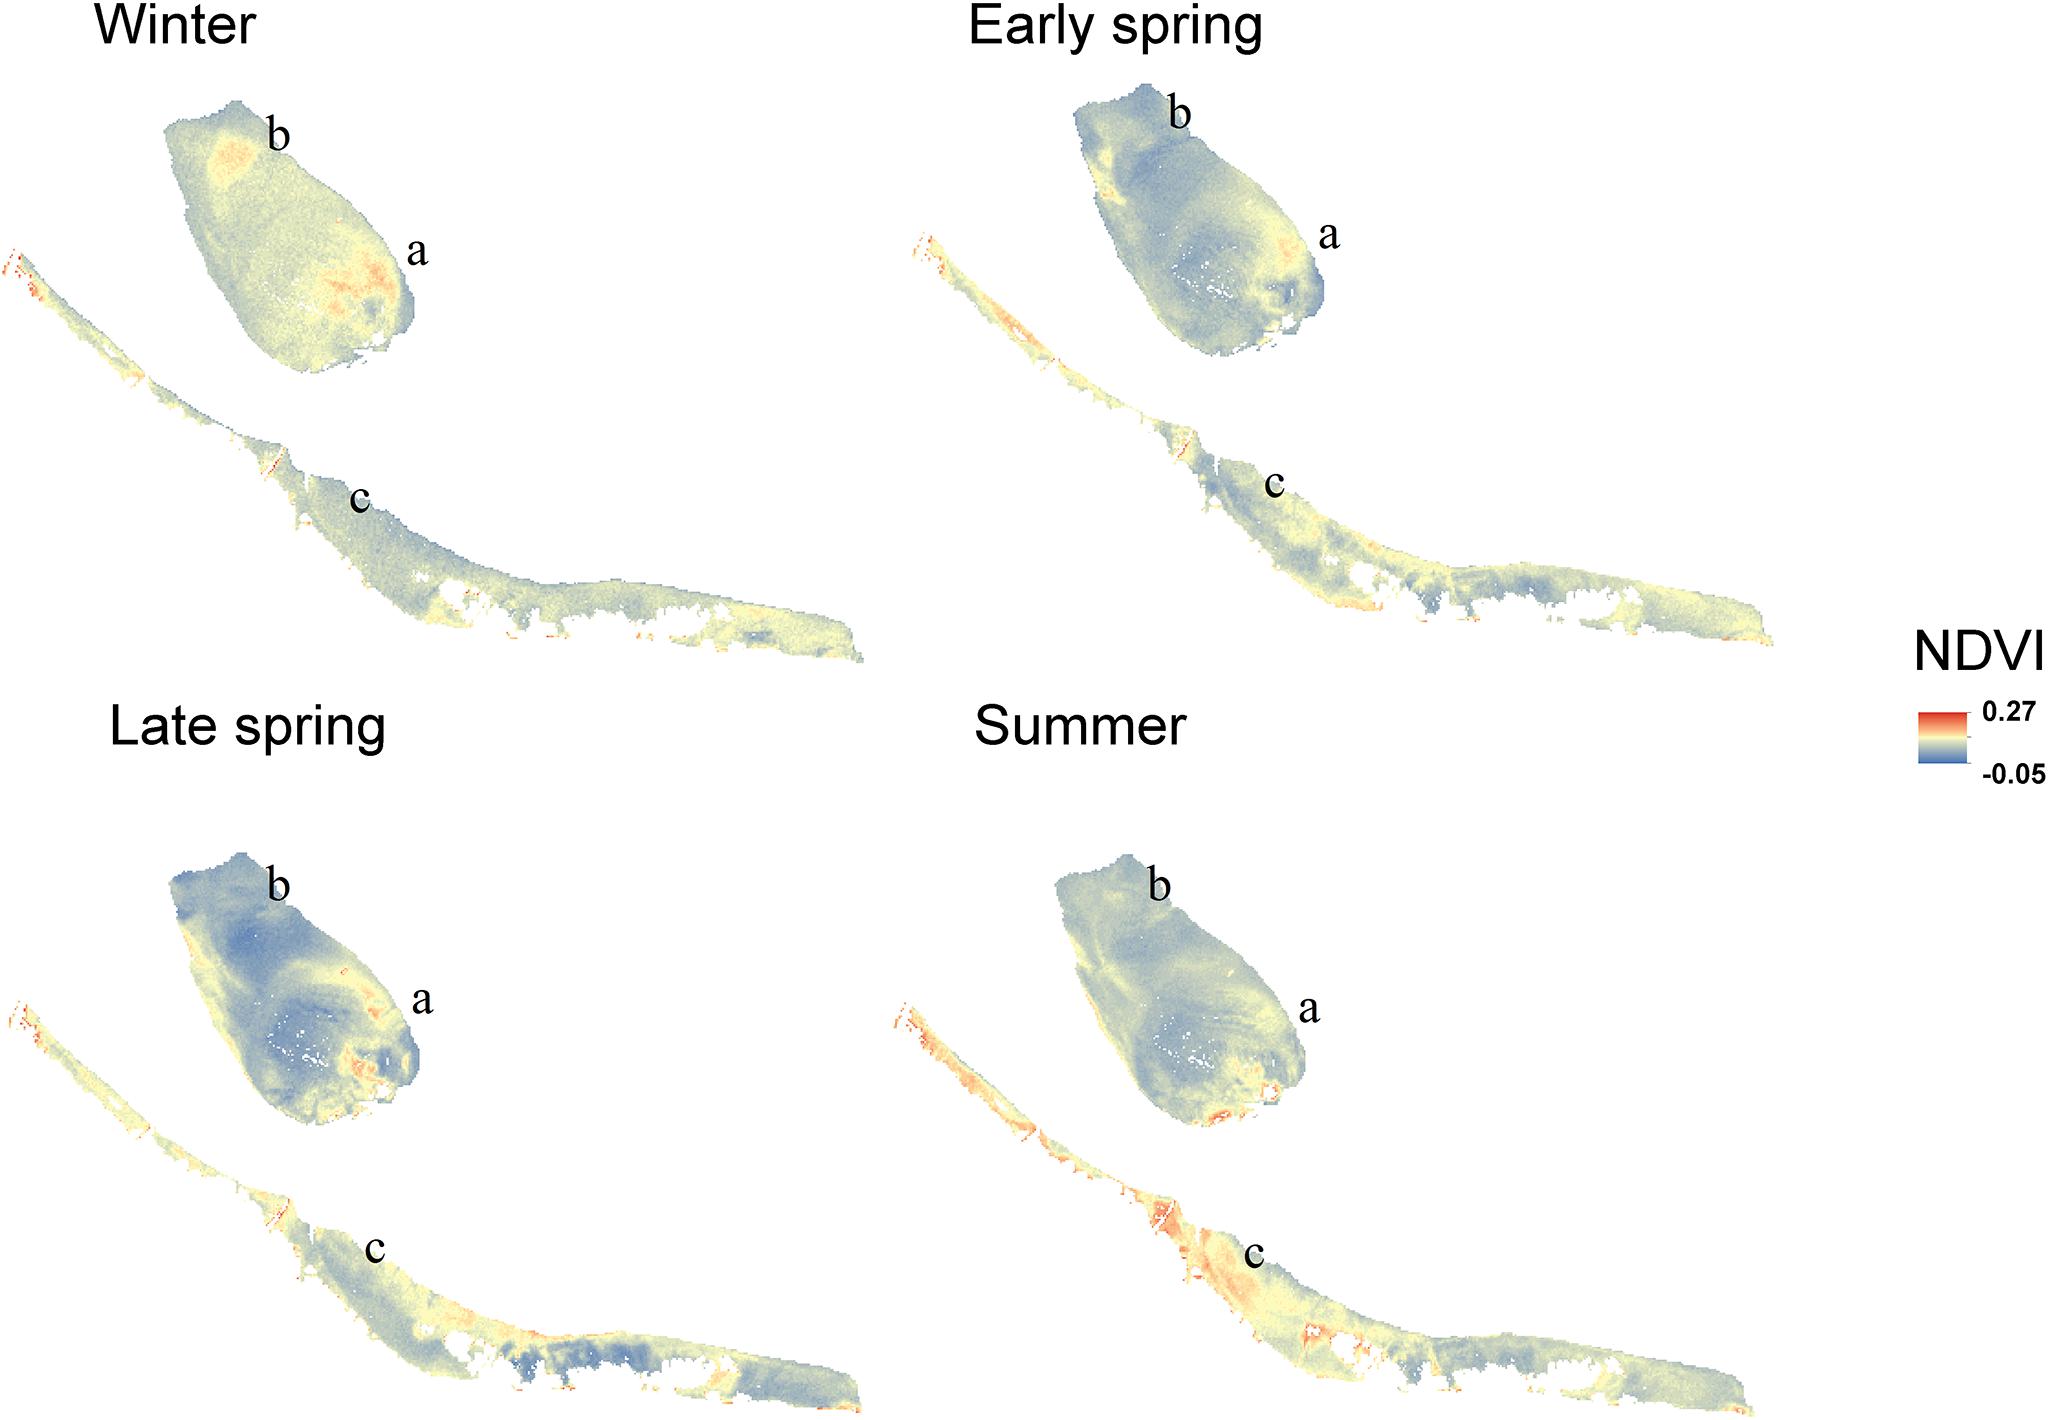
Figure 6. NDVI maps averaged per season for ‘Lage Springer’ (mid-channel tidal flat) and ‘Paulinapolder’ (fringing tidal flat).
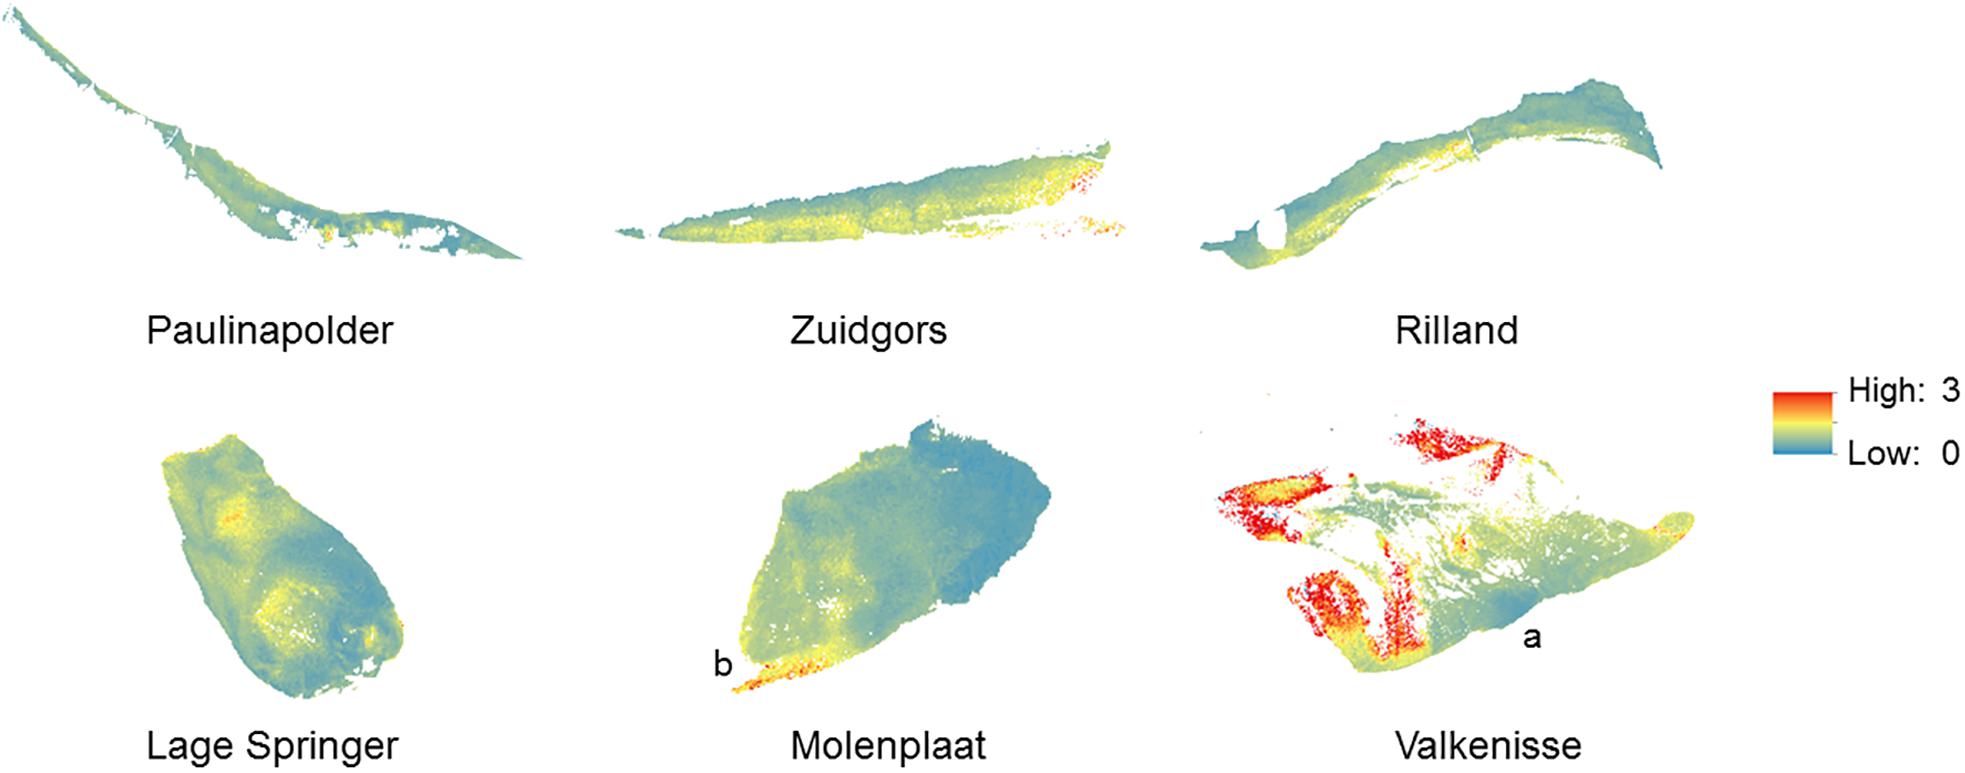
Figure 7. Coefficient of variation of the NDVI (2016–2019). The coefficient of variation ranged from –5176 to 13565.
Discussion
Spatial structure is a crucial component of ecological communities. Our results demonstrate that MPB show a remarkable seasonality in the degree of patchiness (sill) which increases from winter to summer, while the patch size (range) remains relatively constant. The location of the patches may change over time, which suggests that in these cases the increase in degree of patchiness is not associated with a general increase in MPB biomass but with locally changing abiotic conditions or grazing activity. Furthermore, the patch size and degree of patchiness is higher on relatively sandy mid-channel tidal flats than on relatively silt rich fringing tidal flats. This suggests that sediment composition plays an important role in pattern formation of MPB, as found in earlier studies (Morris, 2005; Meleder et al., 2007).
Seasonal Dynamics of MPB Biomass and Patterning
Our results demonstrate that the MPB biomass averaged per tidal flat increased from early spring to summer, while in winter MPB biomass was highly variable among the years 2016–2019. We did not observe a clear spring bloom. Following a constant-density model, as hypothesized, the patch size (range) would be expected to increase from early spring to summer accordingly. However, the range of MPB did not change significantly over time and visual observation showed that the location of areas with a relatively high MPB biomass changed throughout the seasons (Supplementary Figure S1). It should be noted that no boundary value for the NDVI was used to distinguish between ‘MPB patches’ versus ‘bare sediment’ in the current study. Variation in MPB biomass on tidal flats are gradual and the range derived from the semi-variogram quantifies the size of areas with a similar MPB biomass (referred to as ‘patch’). A power law analysis using a definition of patches with a fixed NDVI threshold may provide further insight in changes in the number and size of patches throughout seasons (Weerman et al., 2012). Visual observation showed that, at most sites, areas with a relatively low MPB biomass increased in biomass from early spring to summer, while the biomass was highly variable in winter in 2016–2019. In some areas, MPB biomass remained low throughout the seasons (Figure 8). Furthermore, it was visually observed that the number of areas with a relatively high MPB biomass increases from early spring to summer. At a few tidal flats, the spatial configuration of patches remained relatively constant from winter to summer (Valkenisse, Molenplaat, and Rilland; Supplementary Figure S1). Visual observation showed that at Valkenisse and the eastern side of Molenplaat, areas with a relatively high MPB biomass expand over time (Figure 8). Valkenisse and Rilland are located in the mesohaline zone, where macrofaunal biomass is relatively low (Ysebaert et al., 2003) and, therefore, a minor influence of grazing activity or bioturbation on spatial patterns of MPB is expected. The consistent patch size throughout the year is not in line with the finding of Guarini et al. (1998), who studied spatial variability on a larger scale (1 km grid resolution) and found an increase in patch size from winter to summer along with an increasing MPB biomass. However, we did visually observe this phenomenon at Valkenisse and Molenplaat, where MPB biomass increased from early spring to summer and patches appeared to spread over the tidal flat (Supplementary Figure S1). This suggests that, depending on local environmental conditions, pattern formation may indeed follow a constant-density model.
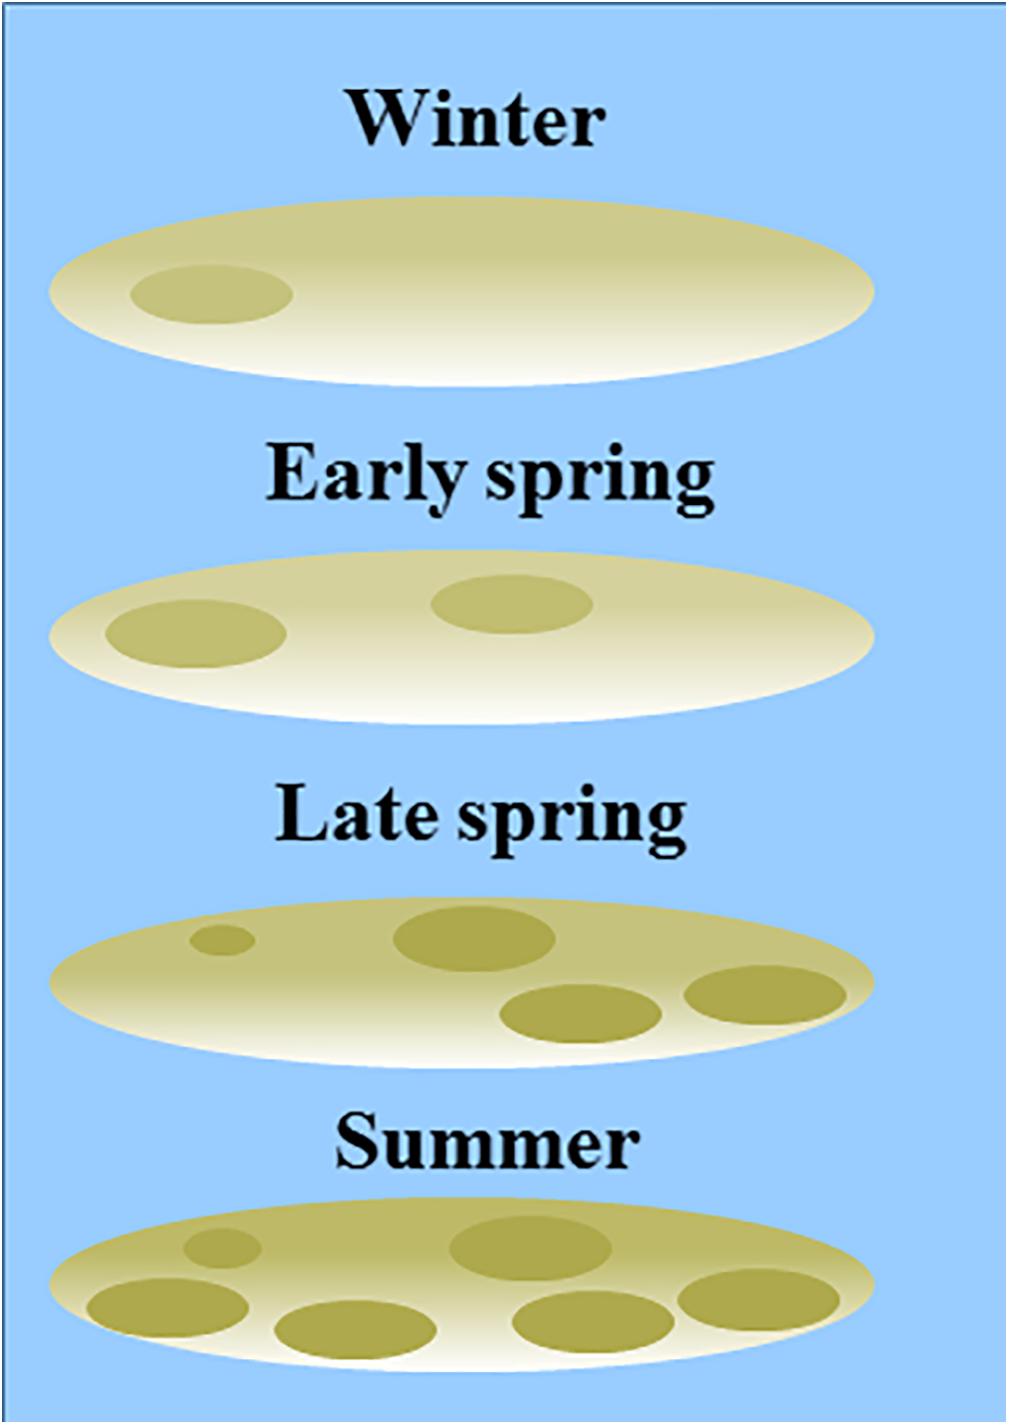
Figure 8. Conceptual model of seasonality in patch size (based on the range derived from a semi-variogram) and degree of patchiness (sill derived from a semi-variogram) in MPB biomass, complemented by visual observations of the sites. No boundary values for areas of ‘MPB patches’ versus ‘bare sediment’ were used in the current study.
The sill was significantly higher in late spring and summer than in winter at mid-channel and fringing tidal flats. This is in line with our hypothesis and may be associated with increased grazing activity and bioturbation by macrofauna or with changed abiotic conditions. The higher sill in late spring and summer than in winter was observed in all ecotopes (‘low dynamic fine sand medium high littoral,’ ‘low dynamic silt rich medium high littoral,’ and ‘highly dynamic fine sand littoral’) except the ecotope ‘low dynamic silt rich high littoral.’ This ecotope was only present at Zuidgors, where the MPB biomass visually appeared relatively homogeneous in winter, early spring and late spring. In summer, a patch emerged on the east side of the tidal flat (Supplementary Figure S1).
Spatial Patterning on Fringing Versus Mid-Channel Tidal Flats
As hypothesized, the patch size (range) was higher on mid-channel tidal flats than on fringing tidal flats. This suggests that the relatively high hydrodynamic activity on mid-channel tidal flats as opposed to fringing tidal flats homogenizes spatial variability in MPB biomass, possibly due to high resuspension rates associated with higher current velocities (Lucas et al., 2000). However, the observed difference was mainly due to the range being approximately a factor two higher at the site Valkenisse than all other study sites. Likewise, the range was significantly higher in the mesohaline zone than in the strongly and weakly polyhaline zone, mainly due to the range being higher at Valkenisse than at all other sites. At Valkenisse, there appears to be one prevalent patch on the southeastern side of the tidal flat which is present throughout the year. In summer, more heterogeneity in MPB biomass appears within the patch which may be associated with increased grazing activity by macrofauna or changed abiotic conditions. The higher range at this site compared to other tidal flats is expected to be associated with the higher hydrodynamic activity and lower macrofaunal biomass at this location compared to other sites, as this site is located in the α-mesohaline zone and is characterized by mega-ripples (cf. Van der Wal et al., 2017). However, the larger surface area of Valkenisse may also play a role (Table 2), as no correction for the size of the study areas was applied in the semi-variogram analysis. Expansion of the current study to other estuaries and coastal embayments may increase insight on the possible effect of tidal flat size on the range of MPB patches.
The sill was higher on mid-channel tidal flats than on fringing tidal flats. This is not in line with our hypothesis, which stated that higher hydrodynamic energy and low macrofaunal biomass on mid-channel tidal flats is expected to homogenize MPB biomass. Instead, based on our findings, we suggest that the presence of an embankment at the top of the shore reduces the directionality in which heterogeneity in MPB biomass may emerge. At the fringing tidal flats, MPB patches mostly appeared in bands orientated alongshore (Supplementary Figure S1), as was observed by Guarini et al. (1998), while at mid-channel tidal flats patches have an omnidirectional character.
Structuring Processes
The proposition by Guarini et al. (1998) that seasonal dynamics of MPB biomass follow a constant density model is not supported by the current study, as the patch size remained constant throughout the year, but instead suggest a proportional-density model. Hereby, no relationship exists between the biomass of MPB and the occupied area, which is illustrated by the increase in MPB biomass over time while the patch size remained constant. From an ecological perspective, this implies that spatial patterning of MPB biomass is not governed by spreading processes.
Spatial variability of MPB biomass is caused by both physical and biological structuring processes. Morris (2005) found that the most important scales of variability in MPB biomass were around 200–300 m, ≤100 m and ≤2.5 m and that mean grain size and sediment sorting explain about 27% of the spatial variability in chl-a concentrations. A positive feedback exists between net silt accumulation and diatom growth, likely due to relatively high concentrations of nutrients in silt rich sediment compared to sandy sediments. Furthermore, diatoms secrete extracellular polymeric substances which lead to increased sediment cohesion, reducing the erodibility of sediment (Van De Koppel et al., 2001). This results in generally higher concentrations of MPB in silt rich sediment than in sandy sediments (Van der Wal et al., 2010b). The silt content of intertidal sediments in the Westerschelde retrieved from surface roughness estimates from ERS-2 SAR revealed changes in spatial heterogeneity in the silt content throughout the year (Van der Wal et al., 2010a). The seasonality in the spatial heterogeneity of the silt content observed in 2006 shows remarkable similarities with the seasonality in the spatial heterogeneity of MPB biomass surveyed in the current study. For example, the emerging MPB patch on the west side of the Molenplaat in late spring and summer (Supplementary Figure S1) coincides with a strong increase in silt content in summer (Van der Wal et al., 2010a). Furthermore, the high concentration of MPB biomass on the southeast side of Valkenisse corresponds with a high silt content at this location, which increases in surface area in summer like the surface area of MPB increases at this site. This provides a strong indication that seasonality in spatial patterns of MPB and silt content are linked on the meso-scale and that, on the meso-scale, grazing activity likely plays a minor role.
Spatial Patterning in Ecotopes
The patch size (range) was higher in the ‘low dynamic silt rich medium high littoral’ ecotope than the ‘low dynamic fine sand high littoral,’ confirming our previous conclusion that sediment composition is likely closely linked to pattern formation of MPB. In addition, the range was significantly higher in the ‘low dynamic fine sand medium high littoral’ ecotope than in the ‘low dynamic fine sand high littoral’ ecotope. Therefore, the factor ‘elevation’ is additionally expected to influence the patch size, which may be associated with the presence of a gradient in hydrodynamic conditions or grazing activity. However, the relatively small surface area of the latter ecotope in the Westerschelde is likely to influence the observed difference in the range here.
Future Requirements and Perspectives
Regular in situ monitoring campaigns of MPB in intertidal areas are rare and provide limited information on ecosystem dynamics on the meso-scale. The use of satellite remote sensing seems a promising method to monitor spatial patterning of MPB at this scale. We demonstrated that Sentinel-2 MSI imagery provides a useful information source for mapping and analyses of spatial heterogeneity and seasonality in MPB biomass. Our results demonstrate that the location of MPB patches and, therefore, available food for higher trophic levels (including benthic macrofauna) varies from winter to summer. This information can be accounted for in spatially explicit food web models or sediment transport modeling.
The proposed method could be used in tidal systems worldwide to investigate to what extent patch characteristics and their seasonal dynamics vary among systems. This may provide further insight into the contribution of e.g., climate, tidal regime and the specific morphology of tidal flats to seasonal dynamics of patch characteristics. Several studies where MPB biomass was quantified using the NDVI were performed in benthic diatom dominated estuaries (e.g., Kromkamp et al., 2006; Benyoucef et al., 2014; Daggers et al., 2018). However, further research is needed on possible effects of the microphytobenthic community composition (e.g., benthic diatoms versus euglenoids) on the relationship between the NDVI and MPB biomass. The relationship between the NDVI and MPB biomass should be calibrated for each site, as the relationship may vary per site and season.
Conclusion
Overall, we provided evidence that the degree of patchiness (sill derived from a semi-variogram) of MPB on the meso-scale varies from winter to spring, while the patch size (range derived from a semi-variogram) remains constant. The degree of patchiness and the patch size was higher on relatively sandy mid-channel tidal flats than on relatively silt rich fringing tidal flats. The location of patches may remain constant or vary throughout the year. The observed seasonality in MPB patchiness on the meso-scale appears to be closely linked to changes in the silt content.
Data Availability Statement
The datasets generated for this study are available on request to the corresponding author.
Author Contributions
DW and TD designed the study. TD compiled the data, performed the analysis, and wrote the manuscript. PH and DW contributed to the study design, analyses, interpretation of the data, and editing of the manuscript.
Funding
This research was supported by the “User Support Program Space Research” of the Netherlands Organization for Scientific Research (NWO grant no. ALW-GO 13/14 to DW).
Conflict of Interest
The authors declare that the research was conducted in the absence of any commercial or financial relationships that could be construed as a potential conflict of interest.
Acknowledgments
We gratefully acknowledge Annette Wielemaker for her assistance in data collection, pre-processing of the imagery, and valuable discussions on the used methodology.
Supplementary Material
The Supplementary Material for this article can be found online at: https://www.frontiersin.org/articles/10.3389/fmars.2020.00392/full#supplementary-material
References
Andersen, T. J., Jensen, K. T., Lund-Hansen, L., Mouritsen, K. N., and Pejrup, M. (2002). Enhanced erodibility of fine-grained marine sediments by Hydrobia ulvae. J. Sea Res. 48, 51–58.
Baptist, M. J., Van der Wal, J. T., Folmer, E. O., Grawe, U., and Elschot, K. (2019). An ecotope map of the trilateral Wadden Sea. J. Sea Res. 152:101761. doi: 10.1016/j.seares.2019.05.003
Barranguet, C., Herman, P. M. J., and Sinke, J. J. (1997). Microphytobenthos biomass and community composition studied by pigment biomarkers: importance and fate in the carbon cycle of a tidal flat. J. Sea Res. 38, 59–70.
Benyoucef, I., Blandin, E., Lerouxel, A., Jesus, B., Rosa, P., Meleder, V., et al. (2014). Microphytobenthos interannual variations in a north-European estuary (Loire estuary, France) detected by visible-infrared multispectral remote sensing. Estuar. Coast. Shelf Sci. 136, 43–52. doi: 10.1016/j.ecss.2013.11.007
Bouma, H., de Jong, D. J., Twisk, F., and Wolfstein, K. (2006). A Dutch Ecotope System for Coastal Waters (ZES.1). To Map The Potential Occurrence Of Ecological Communities In Dutch Coastal And Transitional Waters. Middelburg: Rijkswaterstaat.
Brito, A. C., Benyoucef, I., Jesus, B., Brotas, V., Gernez, P., Mendes, C. R., et al. (2013). Seasonality of microphytobenthos revealed by remote-sensing in a South European estuary. Cont. Shelf Res. 66, 83–91. doi: 10.1016/j.csr.2013.07.004
Christianen, M. J. A., Middelburg, J. J., Holthuijsen, S. J., Jouta, J., Compton, T. J., van der Heide, T., et al. (2017). Benthic primary producers are key to sustain the Wadden Sea food web: stable carbon isotope analysis at landscape scale. Ecology 98, 1498–1512. doi: 10.1002/ecy.1837
Cozzoli, F., Bouma, T. J., Ysebaert, T., and Herman, P. M. J. (2013). Application of non-linear quantile regression to macrozoobenthic species distribution modelling: comparing two contrasting basins. Mar. Ecol. Prog. Ser. 475, 119–133. doi: 10.3354/Meps10112
Daggers, T. D., Kromkamp, J. C., Herman, P. M. J., and Van der Wal, D. (2018). A model to assess microphytobenthic primary production in tidal systems using satellite remote sensing. Remote Sens. Environ. 211, 129–145. doi: 10.1016/j.rse.2018.03.037
Daggers, T. D., Kromkamp, J. C., Herman, P. M. J., and Van der Wal, D. (2019). Corrigendum to “A model to assess microphytobenthic primary production in tidal systems using satellite remote sensing”. Remote Sens. Environ. 211, 129–145.
de Deckere, E. M. G. T., Tolhurst, T. J., and de Brouwer, J. F. C. (2001). Destabilization of cohesive intertidal sediments by infauna. Estuar. Coast. Shelf Sci. 53, 665–669. doi: 10.1006/ecss.2001.0811
Guarini, J. M., Blanchard, G. F., Bacher, C., Gros, P., Riera, P., Richard, P., et al. (1998). Dynamics of spatial patterns of microphytobenthic biomass: inferences from a geostatistical analysis of two comprehensive surveys in Marennes-Oleron bay (France). Mar. Ecol. Prog. Ser. 166, 131–141.
Herman, P. M. J., Middelburg, J. J., Widdows, J., Lucas, C. H., and Heip, C. H. R. (2000). Stable isotopes as trophic tracers: combining field sampling and manipulative labelling of food resources for macrobenthos. Mar. Ecol. Prog. Ser. 204, 79–92. doi: 10.3354/Meps204079
Kazemipour, F., Launeau, P., and Meleder, V. (2012). Microphytobenthos biomass mapping using the optical model of diatom biofilms: application to hyperspectral images of Bourgneuf Bay. Remote Sens. Environ. 127, 1–13. doi: 10.1016/j.rse.2012.08.016
Kromkamp, J. C., Morris, E. P., Forster, R. M., Honeywill, C., Hagerthey, S., and Paterson, D. M. (2006). Relationship of intertidal surface sediment chlorophyll concentration to hyperspectral reflectance and chlorophyll fluorescence. Estuar. Coasts 29, 183–196. doi: 10.1007/Bf02781988
Legendre, P., and Legendre, L. (2012). “Spatial analysis,” in Numerical Ecology, (Oxford: Elsevier), 785–858.
Lucas, C. H., and Holligan, P. M. (1999). Nature and ecological implications of algal pigment diversity on the molenplaat tidal flat (Westerschelde estuary, SW Netherlands). Mar. Ecol. Prog. Ser. 180, 51–64.
Lucas, C. H., Widdows, J., Brinsley, M. D., Salkeld, P. N., and Herman, P. M. J. (2000). Benthic-pelagic exchange of microalgae at a tidal flat. 1. Pigment analysis. Mar. Ecol. Prog. Ser. 196, 59–73.
Meleder, V., Rince, Y., Barille, L., Gaudin, P., and Rosa, P. (2007). Spatiotemporal changes in microphytobenthos assemblages in a macrotidal flat (Bourgneuf bay, France). J. Phycol. 43, 1177–1190. doi: 10.1111/j.1529-8817.2007.00423.x
Moreira, M. H., Queiroga, H., Machado, M. M., and Cunha, M. R. (1993). Environmental gradients in a southern Europe estuarine system: Ria de Aveiro, Portugal. Implications for soft bottom macrofauna colonization. Neth. J. Aquat. Ecol. 27, 465–482.
Morris, E. P. (2005). Quantifying Primary Production Of Microphytobenthos: Application Of Optical Methods. Ph. D thesis, University of Groningen, Groningen.
Murphy, R. J., Tolhurst, T. J., Chapman, M. G., and Underwood, A. J. (2008). Spatial variation of chlorophyll on estuarine mudflats determined by field-based remote sensing. Mar. Ecol. Prog. Ser. 365, 45–55. doi: 10.3354/Meps07456
Orvain, F., Lefebvre, S., Montepini, J., Sebire, M., Gangnery, A., and Sylvand, B. (2012). Spatial and temporal interaction between sediment and microphytobenthos in a temperate estuarine macro-intertidal bay. Mar. Ecol. Prog. Ser. 458, 53–68.
Orvain, F., Sauriau, P. G., Sygut, A., Joassard, L., and Le Hir, P. (2004). Interacting effects of Hydrobia ulvae bioturbation and microphytobenthos on the erodibility of mudflat sediments. Mar. Ecol. Prog. Ser. 278, 205–223. doi: 10.3354/Meps278205
Paterson, D. M., Wiltshire, K. H., Miles, A., Blackburn, J., Davidson, I., Yates, M. G., et al. (1998). Microbiological mediation of spectral reflectance from intertidal cohesive sediments. Limnol. Oceanogr. 43, 1207–1221.
Pebesma, E. J. (2004). Multivariable geostatistics in S: the gstat package. Comput. Geosci. 30, 683–691.
Riera, P., Stal, L. J., and Nieuwenhuize, J. (2000). Heavy delta N-15 in intertidal benthic algae and invertebrates in the Scheldt Estuary (The Netherlands): effect of river nitrogen inputs. Estuar. Coast. Shelf Sci. 51, 365–372. doi: 10.1006/ecss.2000.0684
Rijkswaterstaat (2017). Toelichting op de zoute ecotopenkaart Westerschelde 2016: biologische monitoring zoute rijkswateren. Delft: Rijkswaterstaat - Centrale Informatievoorziening.
Rossi, R. E., Mulla, D. J., Journel, A. G., and Franz, E. H. (1992). Geostatistical tools for modeling and interpreting ecological spatial dependence. Ecol. Monogr. 62, 277–314. doi: 10.2307/2937096
Ryu, J. H., Choi, J. K., and Lee, Y. K. (2014). Potential of remote sensing in management of tidal flats: a case study of thematic mapping in the Korean tidal flats. Ocean Coast. Manag. 102, 458–470. doi: 10.1016/j.ocecoaman.2014.03.003
Sabbe, K. (1993). Short-term fluctuations in benthic diatom numbers on an intertidal sandflat in the Westerschelde estuary (Zeeland, The Netherlands). Hydrobiologia 26, 275–284.
Sabbe, K., and Vyverman, W. (1991). Distribution of benthic diatom assemblages in the Westerschelde (Zeeland, The Netherlands). Belg. Journ. Bot. 124, 91–101.
Sahan, E., Sabbe, K., Creach, V., Hernandez-Raquet, G., Vyverman, W., Stal, L. J., et al. (2007). Community structure and seasonal dynamics of diatom biofilms and associated grazers in intertidal mudflats. Aquat. Microb. Ecol. 47, 253–266.
Solan, M., Germano, J. D., Rhoads, D. C., Smith, C., Michaud, E., Parry, D., et al. (2003). Towards a greater understanding of pattern, scale and process in marine benthic systems: a picture is worth a thousand worms. J. Exp. Mar. Biol. Ecol. 285, 313–338.
Thrush, S. F., Hewitt, J. E., and Lohrer, A. M. (2012). Interaction networks in coastal soft-sediments highlight the potential for change in ecological resilience. Ecol Appl 22, 1213–1223. doi: 10.1890/11-1403.1
Ubertini, M., Lefebvre, S., Gangnery, A., Grangere, K., Le Gendre, R., and Orvain, F. (2012). Spatial variability of benthic-pelagic coupling in an estuary ecosystem: consequences for microphytobenthos resuspension phenomenon. PLoS One 7:e44155. doi: 10.1371/journal.pone.0044155
Ubertini, M., Lefebvre, S., Rakotomalala, C., and Orvain, F. (2015). Impact of sediment grain-size and biofilm age on epipelic microphytobenthos resuspension. J. Exp. Mar. Biol. Ecol. 467, 52–64.
Underwood, G. J. C., and Kromkamp, J. (1999). Primary production by phytoplankton and microphytobenthos in estuaries. Adv. Ecol. Res. 29, 93–153. doi: 10.1016/j.scitotenv.2017.12.184
Van De Koppel, J., Herman, P. M. J., Thoolen, P., and Heip, C. H. R. (2001). Do alternate stable states occur in natural ecosystems? Evidence from a tidal flat. Ecology 82, 3449–3461.
Van der Wal, D., Herman, P. M. J., Forster, R. M., Ysebaert, T., Rossi, F., Knaeps, E., et al. (2008). Distribution and dynamics of intertidal macrobenthos predicted from remote sensing: response to microphytobenthos and environment. Mar. Ecol. Prog. Ser. 367, 57–72. doi: 10.3354/Meps07535
Van der Wal, D., van Kessel, T., Eleveld, M. A., and Vanlede, J. (2010a). Spatial heterogeneity in estuarine mud dynamics. Ocean Dyn. 60, 519–533. doi: 10.1007/s10236-010-0271-9
Van der Wal, D., Wielemaker-van den Dool, A., and Herman, P. M. J. (2010b). Spatial synchrony in intertidal benthic algal biomass in temperate coastal and estuarine ecosystems. Ecosystems 13, 338–351. doi: 10.1007/s10021-010-9322-9329
Van der Wal, D., Ysebaert, T., and Herman, P. M. J. (2017). Response of intertidal benthic macrofauna to migrating megaripples and hydrodynamics. Mar. Ecol. Prog. Ser. 585, 17–30. doi: 10.3354/meps12374
Weerman, E. J., Herman, P. M. J., and Van de Koppel, J. (2011). Top-down control inhibits spatial self-organization of a patterned landscape. Ecology 92, 487–495. doi: 10.1890/10-0270.1
Weerman, E. J., Van Belzen, J., Rietkerk, M., Temmerman, S., Kéfi, S., Herman, P. M. J., et al. (2012). Changes in diatom patch-size distribution and degradation in a spatially self-organized intertidal mudflat ecosystem. Ecology 93, 608–618. doi: 10.1890/11-0625.1
Keywords: microphytobenthos, patchiness, intertidal flats, silt, remote sensing
Citation: Daggers TD, Herman PMJ and van der Wal D (2020) Seasonal and Spatial Variability in Patchiness of Microphytobenthos on Intertidal Flats From Sentinel-2 Satellite Imagery. Front. Mar. Sci. 7:392. doi: 10.3389/fmars.2020.00392
Received: 30 November 2019; Accepted: 07 May 2020;
Published: 03 June 2020.
Edited by:
Vona Meleder, Université de Nantes, FranceReviewed by:
Rodney Forster, University of Hull, United KingdomJan Marcin Weslawski, Institute of Oceanology (PAN), Poland
Copyright © 2020 Daggers, Herman and van der Wal. This is an open-access article distributed under the terms of the Creative Commons Attribution License (CC BY). The use, distribution or reproduction in other forums is permitted, provided the original author(s) and the copyright owner(s) are credited and that the original publication in this journal is cited, in accordance with accepted academic practice. No use, distribution or reproduction is permitted which does not comply with these terms.
*Correspondence: Daphne van der Wal, ZGFwaG5lLnZhbi5kZXIud2FsQG5pb3oubmw=