 M. Cristina Mangano1*
 Nova Mieszkowska2,3
 Brian Helmuth4
 Tiago Domingos5Tania Sousa5Giuseppe Baiamonte6Giuseppe Bazan7
 Angela Cuttitta8
 Fabio Fiorentino9
 Antonio Giacoletti10Magnus Johnson11
 Giuseppe D. Lucido10Marco Marcelli12,13
 Riccardo Martellucci12,14Simone Mirto8
 Bernardo Patti8
 Fabio Pranovi15
 Gray A. Williams16
 Gianluca Sarà10
- 1Stazione Zoologica Anton Dohrn, Dipartimento di Ecologia Marina Integrata (EMI), Palermo, Italy
- 2The Marine Biological Association of the UK, Plymouth, United Kingdom
- 3School of Environmental Sciences, University of Liverpool, Liverpool, United Kingdom
- 4Marine Science Center, Northeastern University, Nahant, MA, United States
- 5MARETEC – Marine Environment and Technology Centre, Instituto Superior Técnico (IST), University of Lisbon, Lisbon, Portugal
- 6Dipartimento di Scienze e Tecnologie, Università degli Studi del Sannio, Benevento, Italy
- 7Dipartimento di Scienze e Tecnologie Biologiche Chimiche e Farmaceutiche (STEBICEF), Università degli Studi di Palermo, Palermo, Italy
- 8Istituto per lo Studio degli Impatti Antropici e Sostenibilità in Ambiente Marino (IAS) Consiglio Nazionale delle Ricerche (CNR), Torretta Granitola, Italy
- 9Istituto per le Risorse Biologiche e per le Biotechnologie Marine (IRBIM) Consiglio Nazionale delle Ricerche (CNR), Mazara del Vallo, Italy
- 10Dipartimento di Scienze della Terra e del Mare (DiSTeM), Università degli Studi di Palermo, Palermo, Italy
- 11School of Environmental Sciences, University of Hull, Hull, United Kingdom
- 12Laboratory of Experimental Oceanology and Marine Ecology, DEB, Tuscia University, Molo Vespucci snc Porto di Civitavecchia, Civitavecchia, Italy
- 13Centro Euro-Mediterraneo sui Cambiamenti CLimatici (CMCC), Via Augusto Imperatore, Lecce, Italy
- 14National Institute of Oceanography and Applied Geophysics (OGS), Borgo Grotta Gigante, Italy
- 15Department of Environmental Sciences, Informatics and Statistics, University Ca’ Foscari, Venice, Italy
- 16The Swire Institute of Marine Science and School of Biological Sciences, The University of Hong Kong, Pok Fu Lam, Hong Kong
Realistic predictions of climate change effects on natural resources are central to adaptation policies that try to reduce these impacts. However, most current forecasting approaches do not incorporate species-specific, process-based biological information, which limits their ability to inform actionable strategies. Mechanistic approaches, incorporating quantitative information on functional traits, can potentially predict species- and population-specific responses that result from the cumulative impacts of small-scale processes acting at the organismal level, and can be used to infer population-level dynamics and inform natural resources management. Here we present a proof-of-concept study using the European anchovy as a model species that shows how a trait-based, mechanistic species distribution model can be used to explore the vulnerability of marine species to environmental changes, producing quantitative outputs useful for informing fisheries management. We crossed scenarios of temperature and food to generate quantitative maps of selected mechanistic model outcomes (e.g., Maximum Length and Total Reproductive Output). These results highlight changing patterns of source and sink spawning areas as well as the incidence of reproductive failure. This study demonstrates that model predictions based on functional traits can reduce the degree of uncertainty when forecasting future trends of fish stocks. However, to be effective they must be based on high spatial- and temporal resolution environmental data. Such a sensitive and spatially explicit predictive approach may be used to inform more effective adaptive management strategies of resources in novel climatic conditions.
Introduction
Understanding and forecasting how ongoing climate change will likely alter the structure and functioning of ecosystems is one of the central challenges facing marine environmental managers (van de Pol et al., 2017). This task is especially challenging due to the high levels of spatial and temporal heterogeneity in climate- and non-climate-related drivers (Lohrer et al., 2015), the interaction of multiple stressors on organisms and ecosystems (Crain et al., 2008) and high variability in the vulnerability of different species to environmental change (Gunderson et al., 2016).
Specifically, whilst climate change is a global phenomenon, species respond physiologically and behaviorally to local environmental conditions (Helmuth et al., 2014; Bates et al., 2018). Scaling up responses to forecast future responses of ecosystems and their component species requires an understanding of how key drivers will individually and collectively affect ecosystem composition, structure, and function at local scales; however, large gaps still exist in our basic knowledge of most marine species (Fulton, 2011; Pecl et al., 2014, 2017). Tools are needed that, whilst being informed by knowledge of current distribution patterns, can also account for organisms’ vulnerability to a broader range of conditions than those currently or previously observed (Solow, 2017). To improve projections of the future status of individual species and ecosystems, and to effectively support the development of more sustainable policies that minimize expected impacts and maximize potential opportunities, as in the case of fisheries management, novel combinations of modeling and field and laboratory experimentation are recommended to prevent mismatch between physical drivers and ecological processes (Bates et al., 2018; Korell et al., 2019). An integrated approach that incorporates biological realism is necessary to produce reliable forecasts at spatiotemporal scales relevant to organisms and populations (Burrows et al., 2011; Helmuth et al., 2014; Pacifici et al., 2015; van de Pol et al., 2017; Queirós et al., 2018).
The adoption of a risk-based approach and of process-based (hereafter mechanistic) models has been recently suggested to improve such predictions (Pecl et al., 2014; Pacifici et al., 2015; Fordham et al., 2017). By using functional trait-based mechanistic bioenergetics (sensu Sousa et al., 2008, 2010; Kooijman, 2010; Sarà et al., 2013a, 2018) derived from experimental data, mechanistic models are able to incorporate the effects of environmental drivers at levels that exceed the range of values currently operating in nature (Teal et al., 2018). The spatially and temporally explicit quantitative predictions generated by these models are species-specific and based on life-history traits such as body size and fecundity (Pecquerie et al., 2009; Kearney et al., 2010; Pethybridge et al., 2013). Model outcomes such as these are critical to parameterize population-based models and are required if they are used to inform appropriate, proactive mitigation and adaptation strategies at scales relevant to spatial management and national and regional policy decision-making (van de Pol et al., 2017; Sarà et al., 2018; Mangano et al., 2019). To date, however, relatively few examples exist of the application of such approaches over large geographic scales (Montalto et al., 2016) and they are seldom applied to commercially important species (Sarà et al., 2018; Mangano et al., 2019).
One of the most critical stumbling blocks when designing effective marine resources management strategies and plans are trade-offs among different priorities, for example among fisheries or between fisheries and other management objectives, such as conservation. This can be exemplified by the case study of the European anchovy (Engraulis encrasicolus). Management objectives, and the relative efficacy of different approaches, may consider not only the stock availability for fisheries (i.e., the economic role), but also the biomass available to sustain natural predators and species persistence through time (i.e., the ecological role). Clearly there is an important contribution offered by mechanistic approaches to increase predictive capability with respect to where and when fish stocks will become more vulnerable to collapse, serving as a sensitive, geographically explicit, early warning system (Sarà et al., 2018; Teal et al., 2018; Mangano et al., 2019). For policy-makers it would be exceptionally difficult, if not impossible, to accurately generate climate-proof economies, dependent upon exploitable marine resources, without accounting for changes in the environment in which a stock/natural population occurs. Notably, these cannot be based on global trends such as increases in global temperature and even regional models may be insufficient unless they capture the coincidence of multiple drivers interacting on local scales (e.g., Kroeker et al., 2016). Often these drivers are manifest as mosaics rather than as geographic gradients (e.g., Helmuth et al., 2006), making the application of spatially explicit models increasingly important.
Here, through this proof-of-concept modeling exercise, we explore a mechanistic physiological approach, based on DEB theory (Kooijman, 2010), with a focus on application to marine natural resource (specifically fisheries) management, to quantify the effects of future environmental change on the potential distribution and vulnerability of an European anchovy population. By translating environmental change into biological effects at a fine spatial scale, we compared the current status of this population in a core area of its Mediterranean distributional range (i.e., the Strait of Sicily, Southern Mediterranean Sea, a recognized hotspot for this species; Basilone et al., 2006) with its future responses to predicted temperature increases. A sensitivity analysis to simulate both temperature increase and trophic condition scenarios (food availability, i.e., oligo- and eutrophic conditions) allowed us to explore the robustness of the models’ outputs (Pecquerie et al., 2009; Payne et al., 2015; Kleisner et al., 2017; Sarà et al., 2018). Engraulis encrasicolus has been selected as a model species because three out of eight stocks in the Mediterranean Sea are “currently lying outside safe biological boundaries” (Vasilakopoulos et al., 2014). Management efforts for European anchovy stocks based on long-term monitoring coupled with environmental indices and simulation have proven unsuccessful (Borja et al., 1998; Allain et al., 2001; Uriarte et al., 2002; De Oliveira et al., 2005). Management approaches of this species have mainly consisted of technical measures such as: the establishment of minimum conservation reference size, catch regulation, limitation of fishing areas, closed seasons and mandated changes in gear size. The harvest control rule drives the ICES advice on setting the Total Allowable Catch (TAC quota; e.g., Subarea 8, Bay of Biscay; Ruiz et al., 2017).
We developed scenario-specific quantitative maps to show the different simulation outcomes, which allowed: (1) the identification of current source and sink areas and the detection of future temporal and spatial shifts and (2) the predictions of size-structure shifts and reproductive failure in response to climate change. By providing critical insights into the effects of environmental change on this key species, independent of fishing pressure, our results may be used to inform and integrate novel policy targets for climate-resilience and to help inform and develop adaptive management strategies that enable a more sustainable exploitation of marine resources (Goh, 2012; Queirós et al., 2018). Importantly, because of a lack of high spatial and temporal-resolution predictions of weather for this region, our approach uses a sensitivity analysis based on realistic representative environmental conditions. The main goal is to provide a framework that can be used for other species and to serve as a case study for how high-resolution model predictions can be used to produce biologically realistic forecasts, when informed by environmental data and models at appropriate spatial and temporal scales. For example, managers could use retrospective environmental data from previous years combined with near-term forecasts to estimate short- and medium-range population vulnerability (Mills et al., 2013).
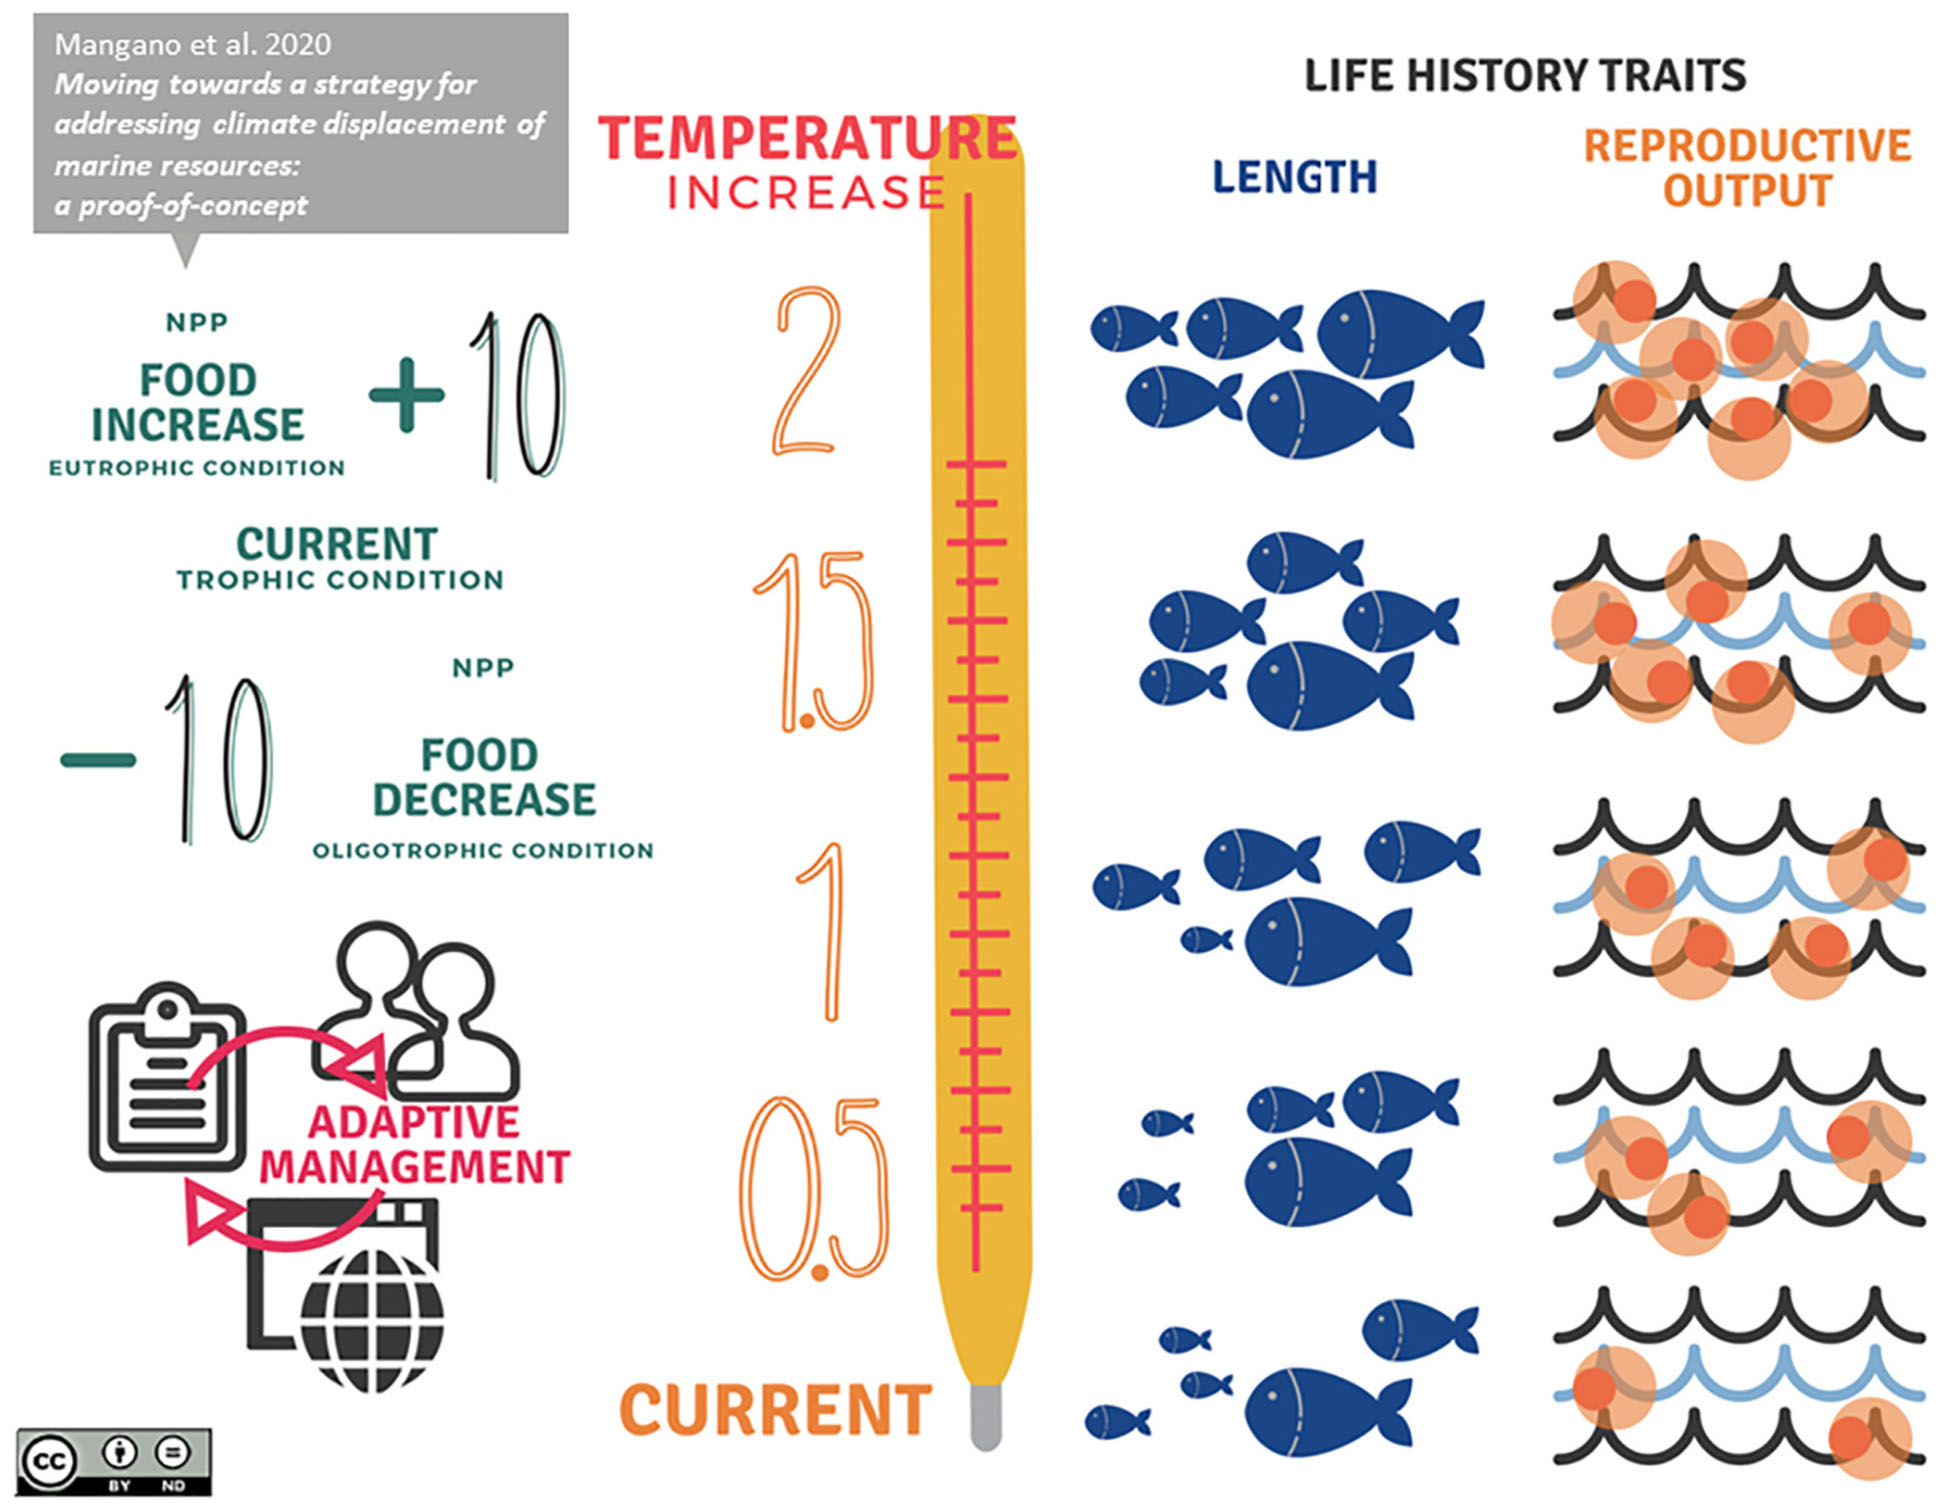
GRAPHICAL ABSTRACT. Climate-informed management at sea.
Materials and Methods
The Dynamic Energy Budget (DEB) Model
DEB theory (Kooijman, 2010) provides a conceptual and quantitative framework to model metabolism at the whole organism level encompassing all life-stages. The standard DEB model (Kooijman, 2010; Sousa et al., 2010; Kearney et al., 2015) describes the rate at which an organism assimilates and utilizes energy for maintenance, growth and reproduction as a function of parameters that characterize the species’ physiology and its response to environmental forcing variables (e.g., food availability and temperature) taking into account metabolic trade-offs. The model has three state variables: reserves (E), structure (V), and maturity (EH) tracking the development of an individual (see Supplementary Material S1 and Supplementary Table S1). The dynamics of these variables are determined by six energy flows formulated in units of J d–1: assimilation flow (p.A), mobilization flow (p.C), somatic maintenance flow (p.S), maturity maintenance flow (p.J), growth flow (p.G), maturation/reproduction flow (p.R) (see Supplementary Material S1 and Supplementary Figure S1). The model states that energy is assimilated (p.A), from food and transferred into reserve (E). According to the κ-rule a fixed energy fraction (κ) is allocated to growth and somatic maintenance, while the remaining fraction (1-κ) is allocated to maturity maintenance plus maturation or reproduction. Changes in environmental conditions (temperature, food availability, etc.) thus can be translated into effects on growth and reproduction.
In contrast to net-production models (e.g., scope for growth), which assume assimilated energy is partitioned between maintenance and both growth and reproduction, DEB theory assumes assimilated energy is first stored as reserves, and is then distributed among physiological processes (Filgueira et al., 2011). This storage effect permits the exploration of time history effects, specifically those related to energetic status (feeding history) and vulnerability to factors such as temperature (Kearney et al., 2010) but in order to do so DEB models require high temporal resolution (daily or better) environmental data (Kearney et al., 2012). DEB represents a reliable and powerful tool to mechanistically describe the whole life cycle of an organism and to make predictions of life-history traits (Pecquerie et al., 2009; Kearney et al., 2010; Nisbet et al., 2012; Pethybridge et al., 2013). DEB theory therefore allows, through the explicit modeling of energy and mass fluxes through organisms, the derivation of individual performance in terms of the most important life-history traits of a species such as maximum length, Lmax, and Total Reproductive Output, TRO (Pecquerie et al., 2009; Kearney et al., 2010; Sarà et al., 2011, 2013a,b, 2014, 2018; Nisbet et al., 2012; Pethybridge et al., 2013; Mangano et al., 2019). DEB also allows an understanding of the interacting time histories of exposures to environmental conditions. Thus, for example, increasing temperature can (up to a point) increase metabolic rates (Sinclair et al., 2016). These in turn can lead to faster rates of maturity (higher TRO values) and growth (higher Lmax values), but only in the presence of sufficient food. In contrast, increased metabolic demand in the absence of food can lead to rapid declines in growth (lower Lmax values).
Aside from the basic assumptions of the standard DEB model (i.e., one reserve and one structure compartment, isomorphic growth; Kearney et al., 2010) some other supplementary assumptions are needed to account for the specificity of this model. Although the von Bertalanffy growth equation, based on physiological assumptions, is the most commonly used descriptor of indeterminate growth (Charnov, 1993), it has been often stated that this equation does not describe larval fish growth unless the animal is: (i) an isomorph, (ii) living in constant environmental conditions, (iii) with constant surface-area specific searching capabilities for food (Kooijman, 2010). Here we assume that the growth of a larvae departs from isomorphic growth and starts to grow exponentially with age (V1-morphic) until it reaches puberty. Pethybridge et al. (2013) found that anchovy larvae have a different (more cylindrical) shape than juveniles and adults, and so estimated the respective shape coefficients as a function of life history stage. In order to simulate exponential growth and to avoid the effects of abrupt shape changes between life-stages we followed Pethybridge’s et al. (2013) approach, allowing the shape coefficient to linearly change with size from day – 0 (δlarva) until puberty, using the equation:
After puberty, the adult shape (δadult) was applied.
In our proof-of-concept, we present maps of multiple DEB outputs, but here focus only on maximum length (Lmax, cm) and Total Reproductive Output (TRO, the total number of eggs per life span) among all the modeled life-history traits (mapped outcomes of “time to catch size,” “eggs,” and “reproductive events” are reported in Supplementary Material S1, Supplementary Figures S4–S6 and Supplementary Table S4). Lmax and TRO were selected because they represent crucial parameters for size-based management and conservation measures. For example, minimum size limits can be designed to allow individuals to reproduce at least once, maximum allowable catch size can ensure survival of large individuals with disproportionate reproductive outputs, and temporal or spatial closures (e.g., spawning areas, spatial allocation, rotating closure areas, and seasonal-area closures, Stram and Evans, 2009) can be designated based on high reproductive output. Knowledge of organismal body temperature (assumed to be similar to Sea Surface Temperature, SST) and environmental food densities are a prerequisite, together with the Engraulis encrasicolus species-specific DEB parameters (see Supplementary Material S1 and Supplementary Table S2), to run the DEB model (Figure 1).
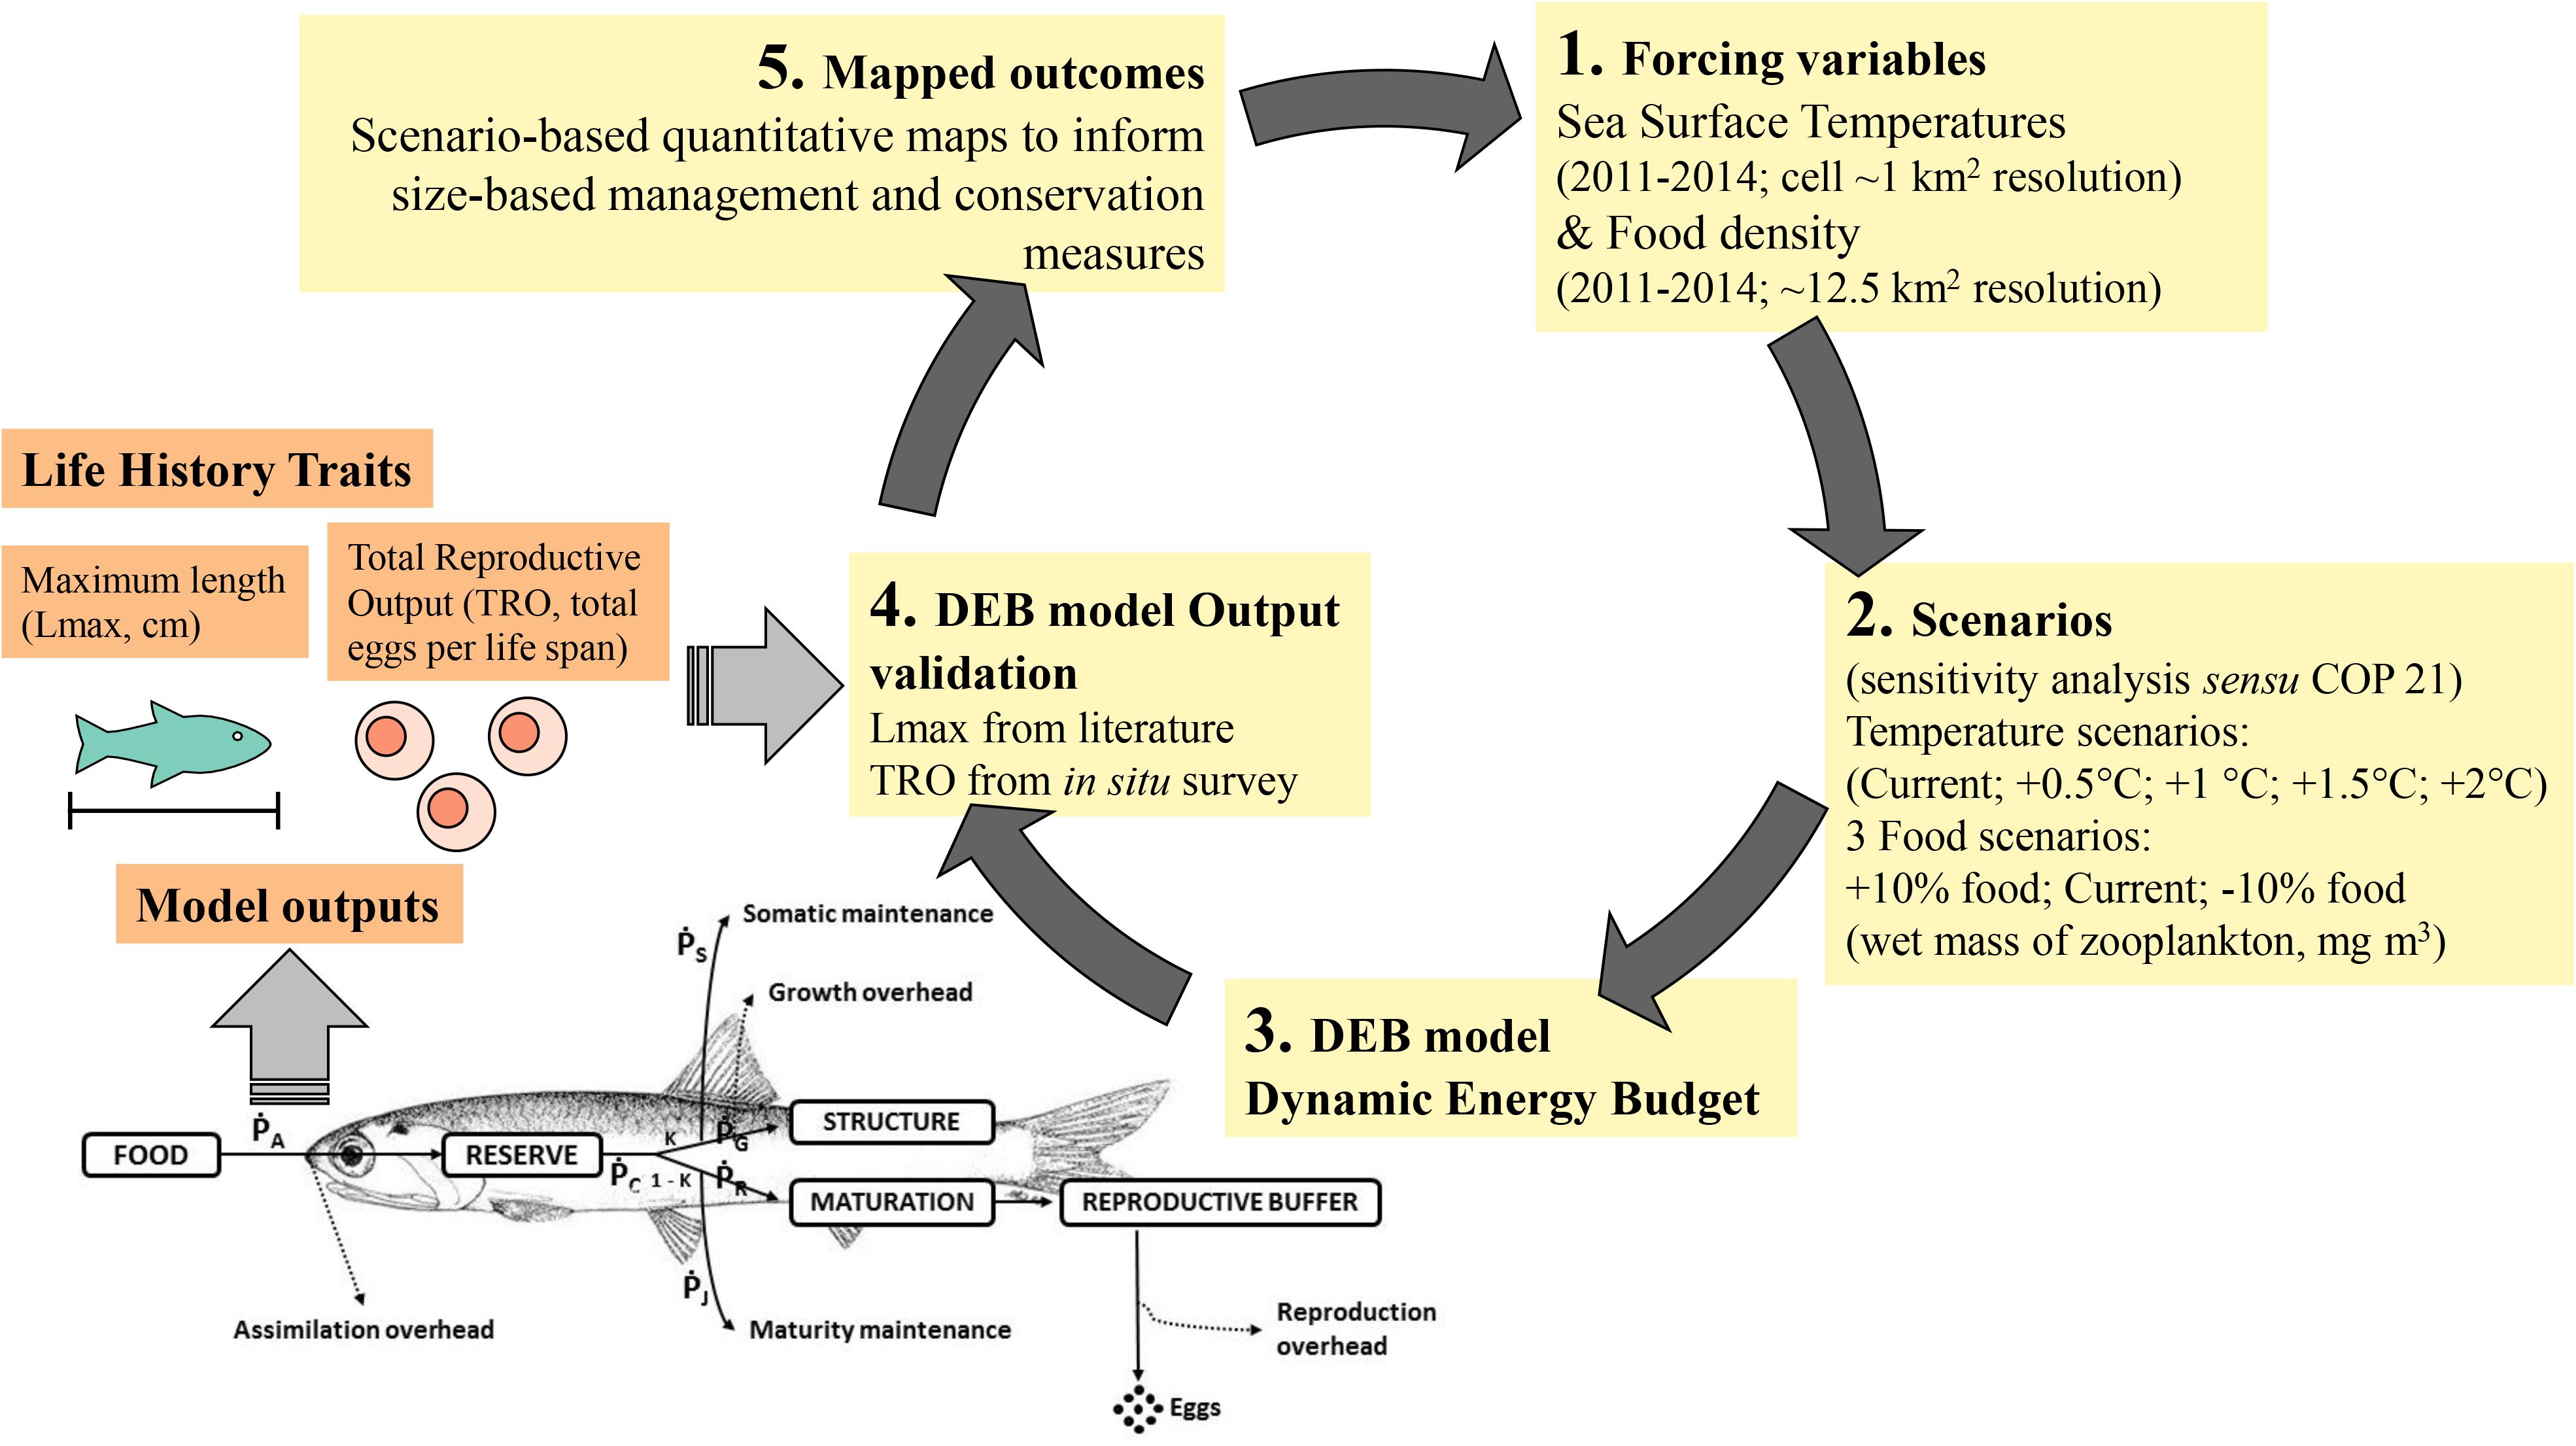
Figure 1. Rationale of the proof-of-concept.
Forcing Variables: Temperature
Due to the short life span of the anchovy (∼4 years), we extracted daily Sea Surface Temperatures (SST; 1 km resolution) from JPL MUR MEaSUREs Project SST data JPL MUR MEaSUREs Project, 20101 over a time range of 4 years (2011–2014) for each cell (see Supplementary Material S1 and Supplementary Figure S2). To simulate increases in temperature similar in magnitude to those forecasted by COP 21 (sensu COP 21 Paris Climate Conference Agreement; Hulme, 2016), we performed a sensitivity analysis by running DEB models, cell by cell, and by increasing current temperatures from 0.5 to 2.0°C (0.5°C step) obtaining four increasing temperature DEB scenarios (current + 0.5°C, + 1.0°C, + 1.5°C, + 2.0°C). All simulations were run on an hourly basis following the approach of Sarà et al. (2018) and Mangano et al. (2019) (Figure 1).
Forcing Variables: Food Density
Food availability is an important forcing variable of the model and is expressed as density (wet mass mg m–3), which for anchovy primarily comprise zooplankton (Tudela and Palomera, 1997 and references therein). Locally collected data for zooplankton were spatially and temporally fragmented due to sampling effort. Due to this gap in the actual food availability for anchovies throughout the study area (Torri et al., 2018), we obtained a spatially continuous dataset on the distribution of food throughout the study area by following the approach proposed by Strömberg et al. (2009) and applied by Mangano et al. (2019). This approach involves transforming weekly Net Primary Productivity (NPP) into wet mass of zooplankton (mg m–3) using the conversion coefficient provided by the ICES Committee on Terms and Equivalents (Cushing et al., 1958) starting from NPP values of carbon per unit volume expressed as grams of carbon/m3/day. The NPP dataset was obtained from Oregon State University (2017), and values were extracted for each cell (0.11°× 0.11° [∼12.5 km2]) over a time span of 4 years (2011–2014) to reflect the short life span of the anchovy (see Supplementary Material S1 and Supplementary Figure S3). To simulate future trophic changes, we carried out a sensitivity analysis by adding or subtracting (cell by cell) a fixed amount of 10% generating three future scenarios: oligotrophic (current NPP – 10%), eutrophic (current + 10%), and no-change (current NPP) (Figure 1).
Model Outcomes Validation
The DEB Lmax simulation was validated by extracting data from a literature search using a complex search string combining prominent or substantial key-words {[(“Engraulis encrasicolus” OR “European anchovy”) AND (“Total length” OR “Maximum length” OR “length” OR “size class” OR “length-weight” OR “age” OR “life stage”) AND “Mediterranean sea”]}. The search string was entered into the two most extensive scientific databases as: ISI Web of Sciences and Scopus. A manual search was also performed on the bibliographies of relevant review articles to identify any additional references. The “all years” timespan was selected during the search. Searches were confined to English language; only titles, abstracts and keywords were searched. Data were extracted from Basilone et al. (2004, 2006) and fitted on an observed vs. predicted model regression (Figure 2, upper panel) allowing a validation for Lmax values off the Southern Sicilian coasts. DEB TRO simulation outputs were validated using in situ data collected during ad hoc oceanographic surveys (the “Bansic” cruise performed off the Southern Sicilian coast). Anchovy eggs data used to validate the model were collected during five summer surveys on board the R/V “Urania” for each year over the period 2006–2010, in approximate correspondence with the peak of reproductive period for anchovy in the study area (Tsikliras et al., 2010). The systematic sampling was constituted by a regular grid of stations (1/10° × 1/10° along the continental shelf and 1/5° × 1/5° further offshore). Plankton sampling was conducted day-night independently by using oblique tows with a Bongo 40 net (two mouths of 40 cm inlet diameter, 200 μm mesh). The plankton oblique tows were carried out from within 5 m of the bottom to the surface in “shallow” stations (bottom depth < 100 m), or from 100 m depth to the surface in deeper stations, wherever possible, with a constant speed of 2 knots. In each mouth, calibrated flow-meters were mounted in order to calculate the volume of filtered water (m3). Samples were preserved using a borax-buffered solution of 4% formaldehyde and seawater. In order to identify eggs of European anchovy, all samples were observed under a microscope once in the laboratory and fish eggs were sorted from the rest of the plankton and identified according to Whitehead (1985). The number of eggs, collected at each station, was normalized as:
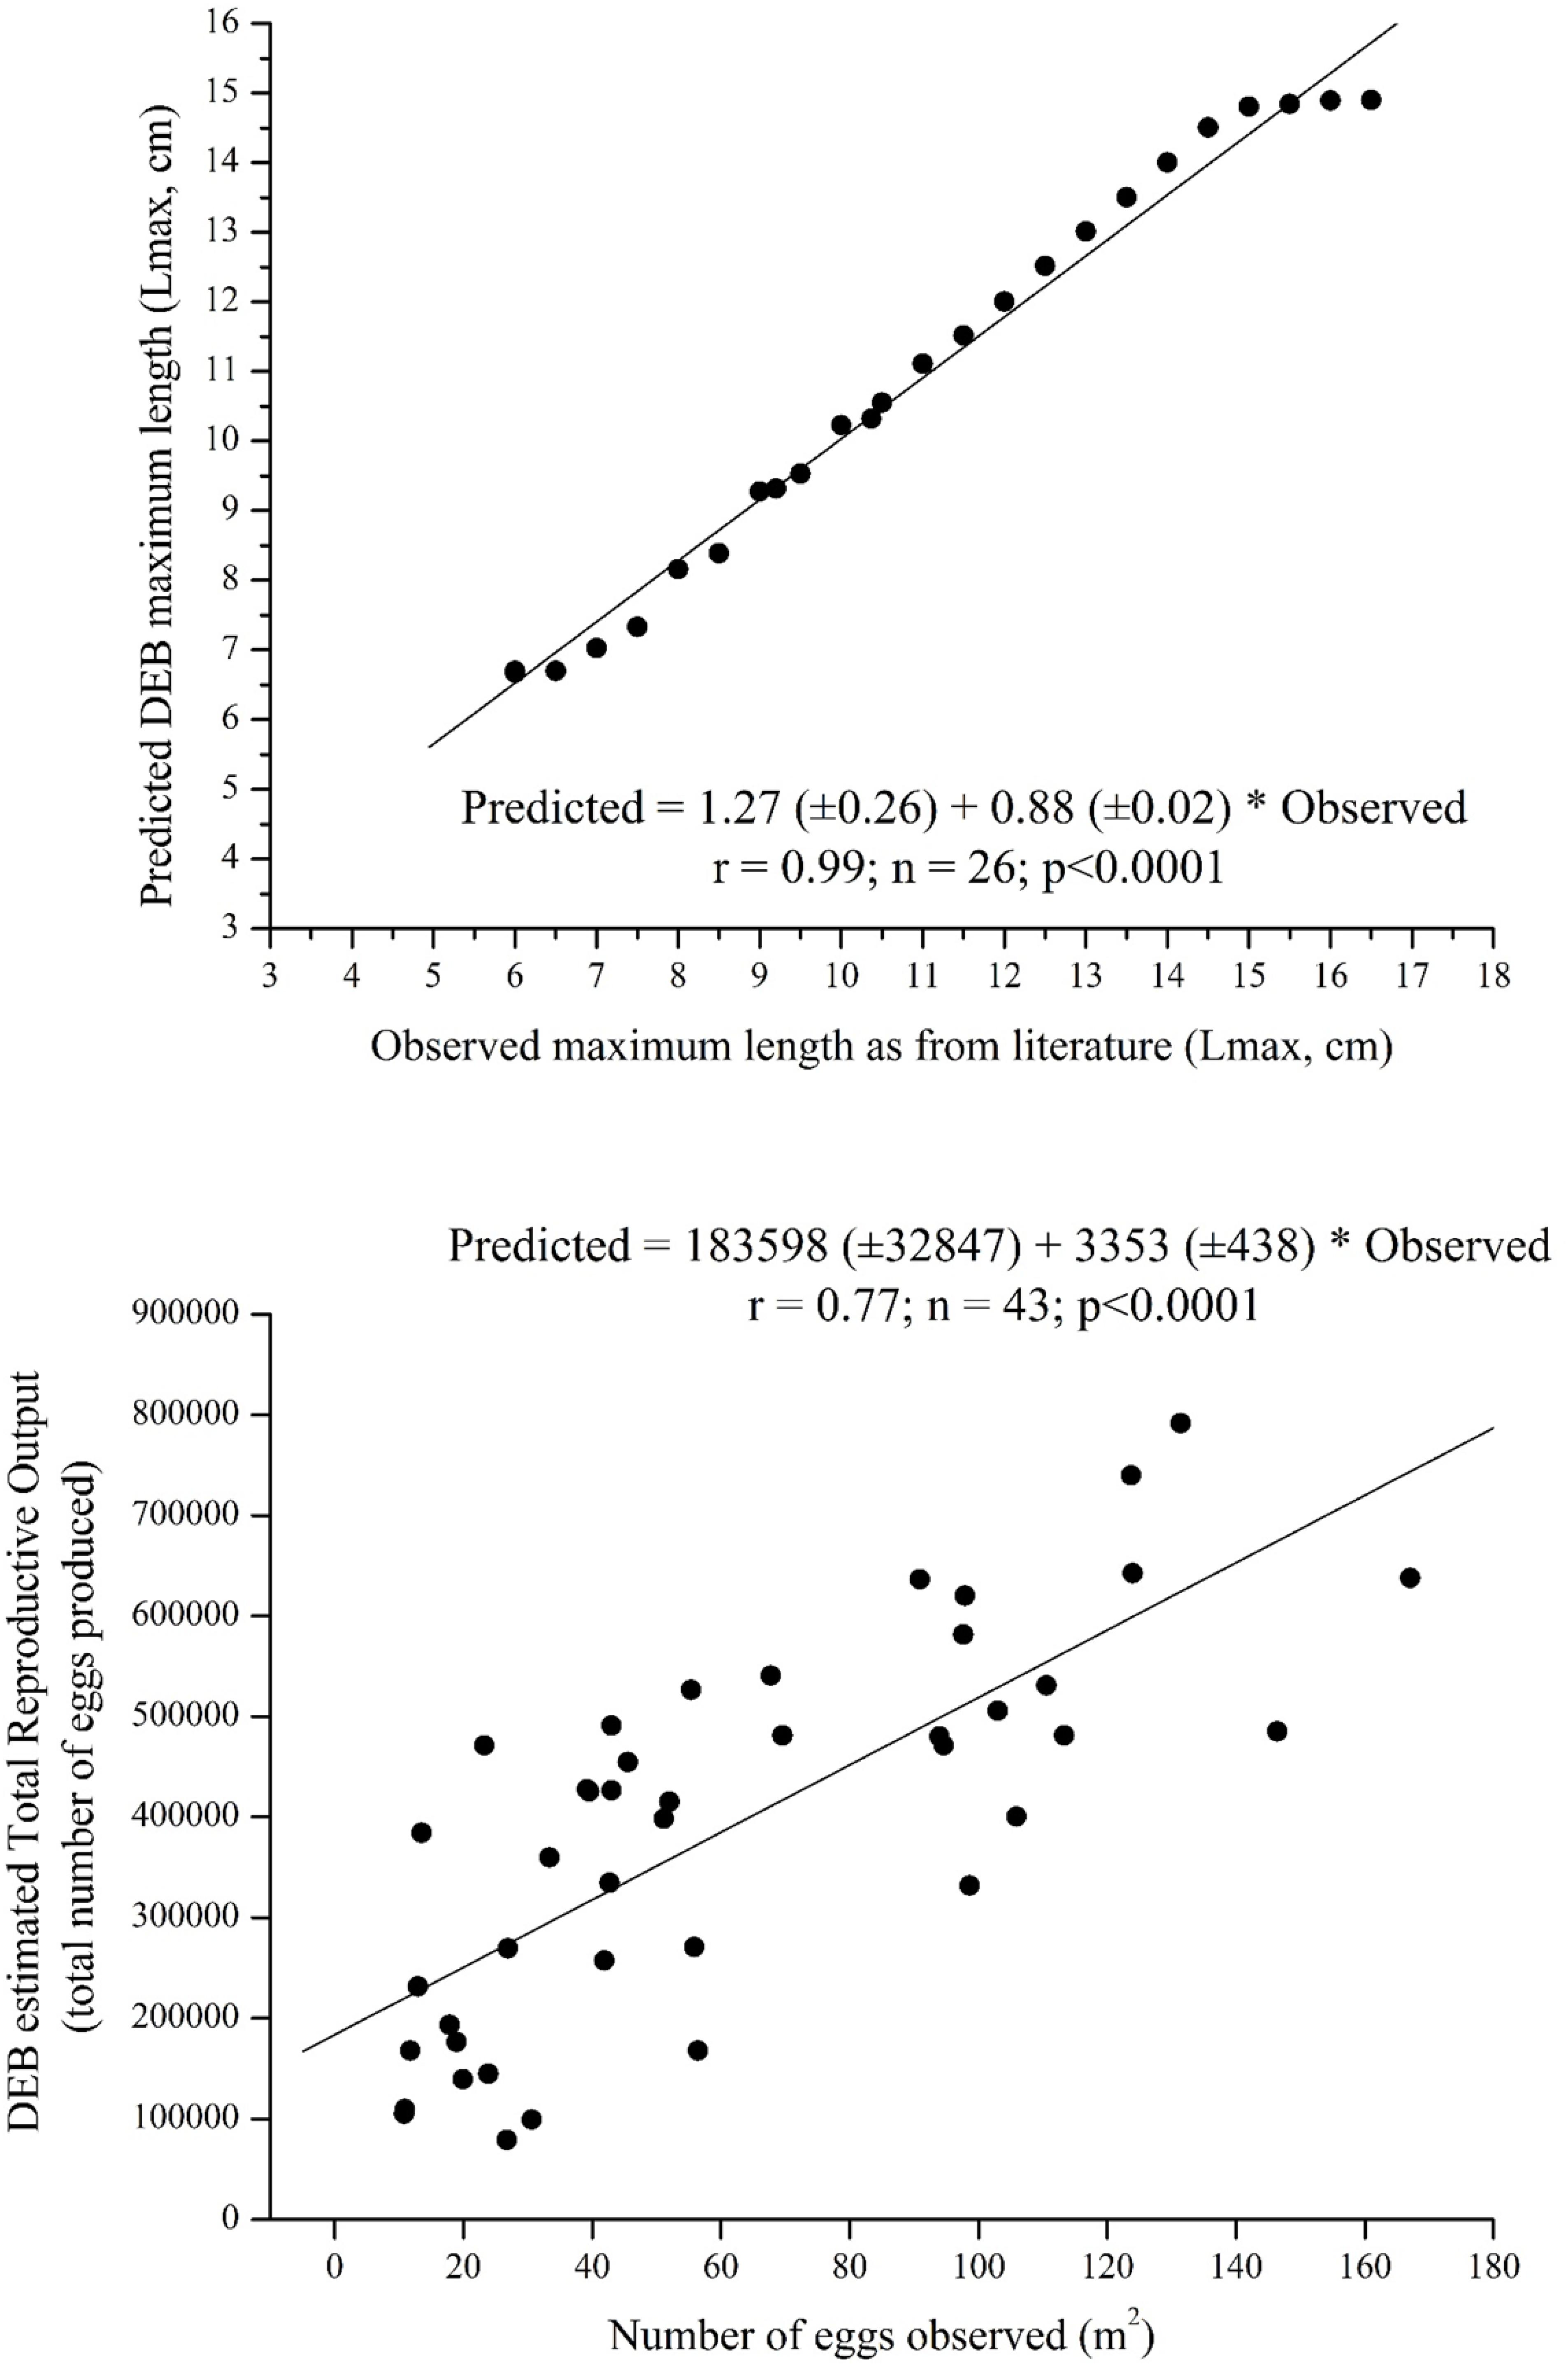
Figure 2. Model validation. Regression lines between observed and predicted data, equation and significant values are reported. Upper panel, Lmax outputs simulations validated by using data extracted from literature (Basilone et al., 2004, 2006). Lower panel, TRO outputs simulations validated by using data collected in situ (ad hoc oceanographic surveys conducted in the framework of various national projects – RITMARE project, FAO MedSudMed GCP/RER/010/ITA – as well as in the framework of more regional projects funded by Ministero dell’Innovazione, Ministero Ambiente, Regione Sicilia; as from Patti et al., 2018).
where Yi is the number of anchovy eggs under one m2 of sea surface at station i, xi is the number of eggs taken at station i, vi is the volume of water filtered in m3 and di is the maximum depth (in meters) reached by the net. A total of 379 stations from 5 years of surveying were included in the observed vs. predicted model regression (Figure 2 lower panel). Both model output (Lmax and TRO) predictions were tested against observations at specific times and places (ad hoc DEB models have been run for those same places based on environmental conditions) (Figure 1).
Model Outcomes Mapping
We performed simulations to investigate potential variations in the maximum length and fecundity of Engraulis encrasicolus under different temperature and food availability scenarios. Model outputs are expressed in terms of maximum length (Lmax, cm) and Total Reproductive Output (TRO, the total number of eggs per life span) and presented through climate-informed scenario-based quantitative maps (Figures 3, 4); minimum, maximum, mean, and median values for each scenario are reported in Supplementary Table S3. The results for each temperature and food scenario are mapped and reported for both Lmax and TRO (Figures 5, 6; minimum, maximum, mean, and median values for each scenario are reported in Supplementary Table S5). All spatial analyses were performed using GIS procedures and tools, specifically ESRI ArcGIS 10.5 (and Spatial Analyst extension) and R software (R Core Team, 2019), using the ggplot2 package (Wickham, 2016). Our simulations were restricted to the continental shelf on the basis of depth (from 0 to 200 m below sea level) identified through bathymetric data obtained from EMODnet Bathymetry Consortium (2016). A vector polygon grid feature class of 346 square cells (having a size of 0.11°× 0.11° [∼12.5 km2]) covering the study area was used.
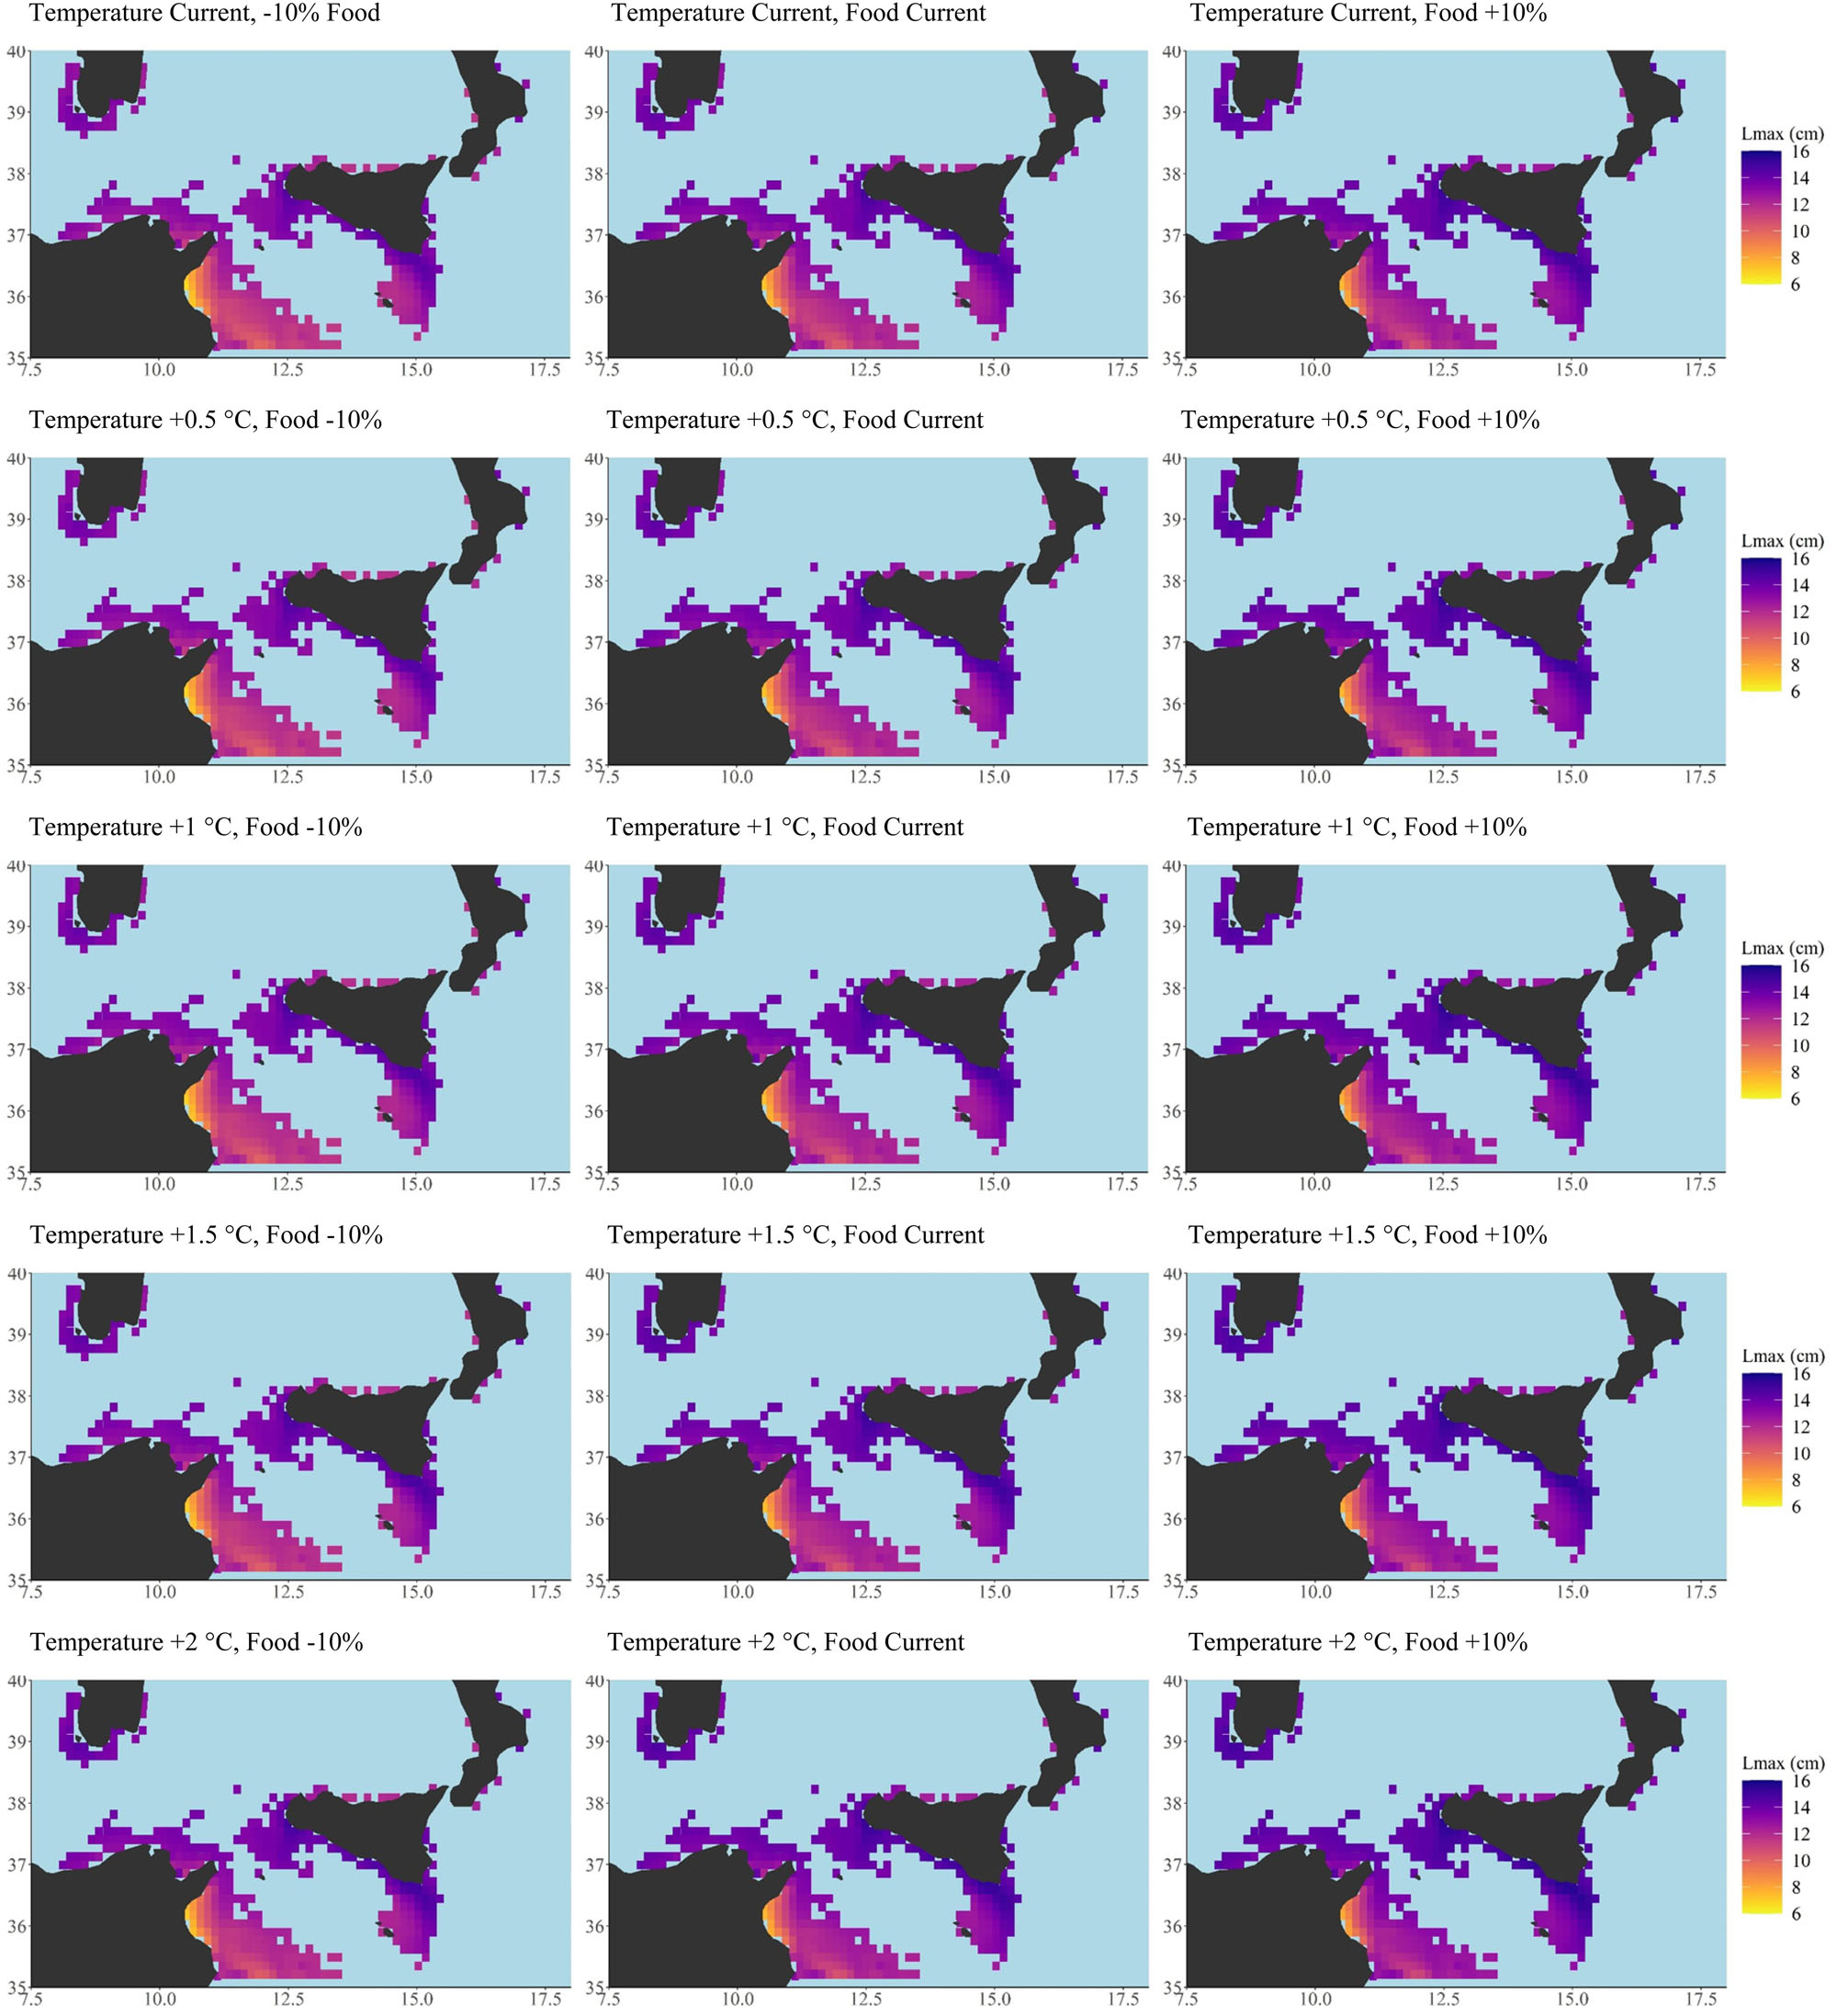
Figure 3. Scenario-based quantitative maps of Maximum length (Lmax, cm) described by a continuous scale ranging (from 0 to 16) under current conditions of both temperature and food (central panel) and under four increasing temperature scenarios (+0.5; +1.0; +1.5; +2.0°C from top line to bottom line, central) coupled with decreasing (oligotrophic, -10% net primary production, left side) and increasing trophic conditions (eutrophic +10% net primary production, right side). Minimum, maximum, mean and median values for each scenario have been also reported as well as the global G statistic values at Supplementary Table S3. Total number of cells = 346, cell resolution of 12.5 × 12.5 km2. Maps were created using R software (ggplot2 package).
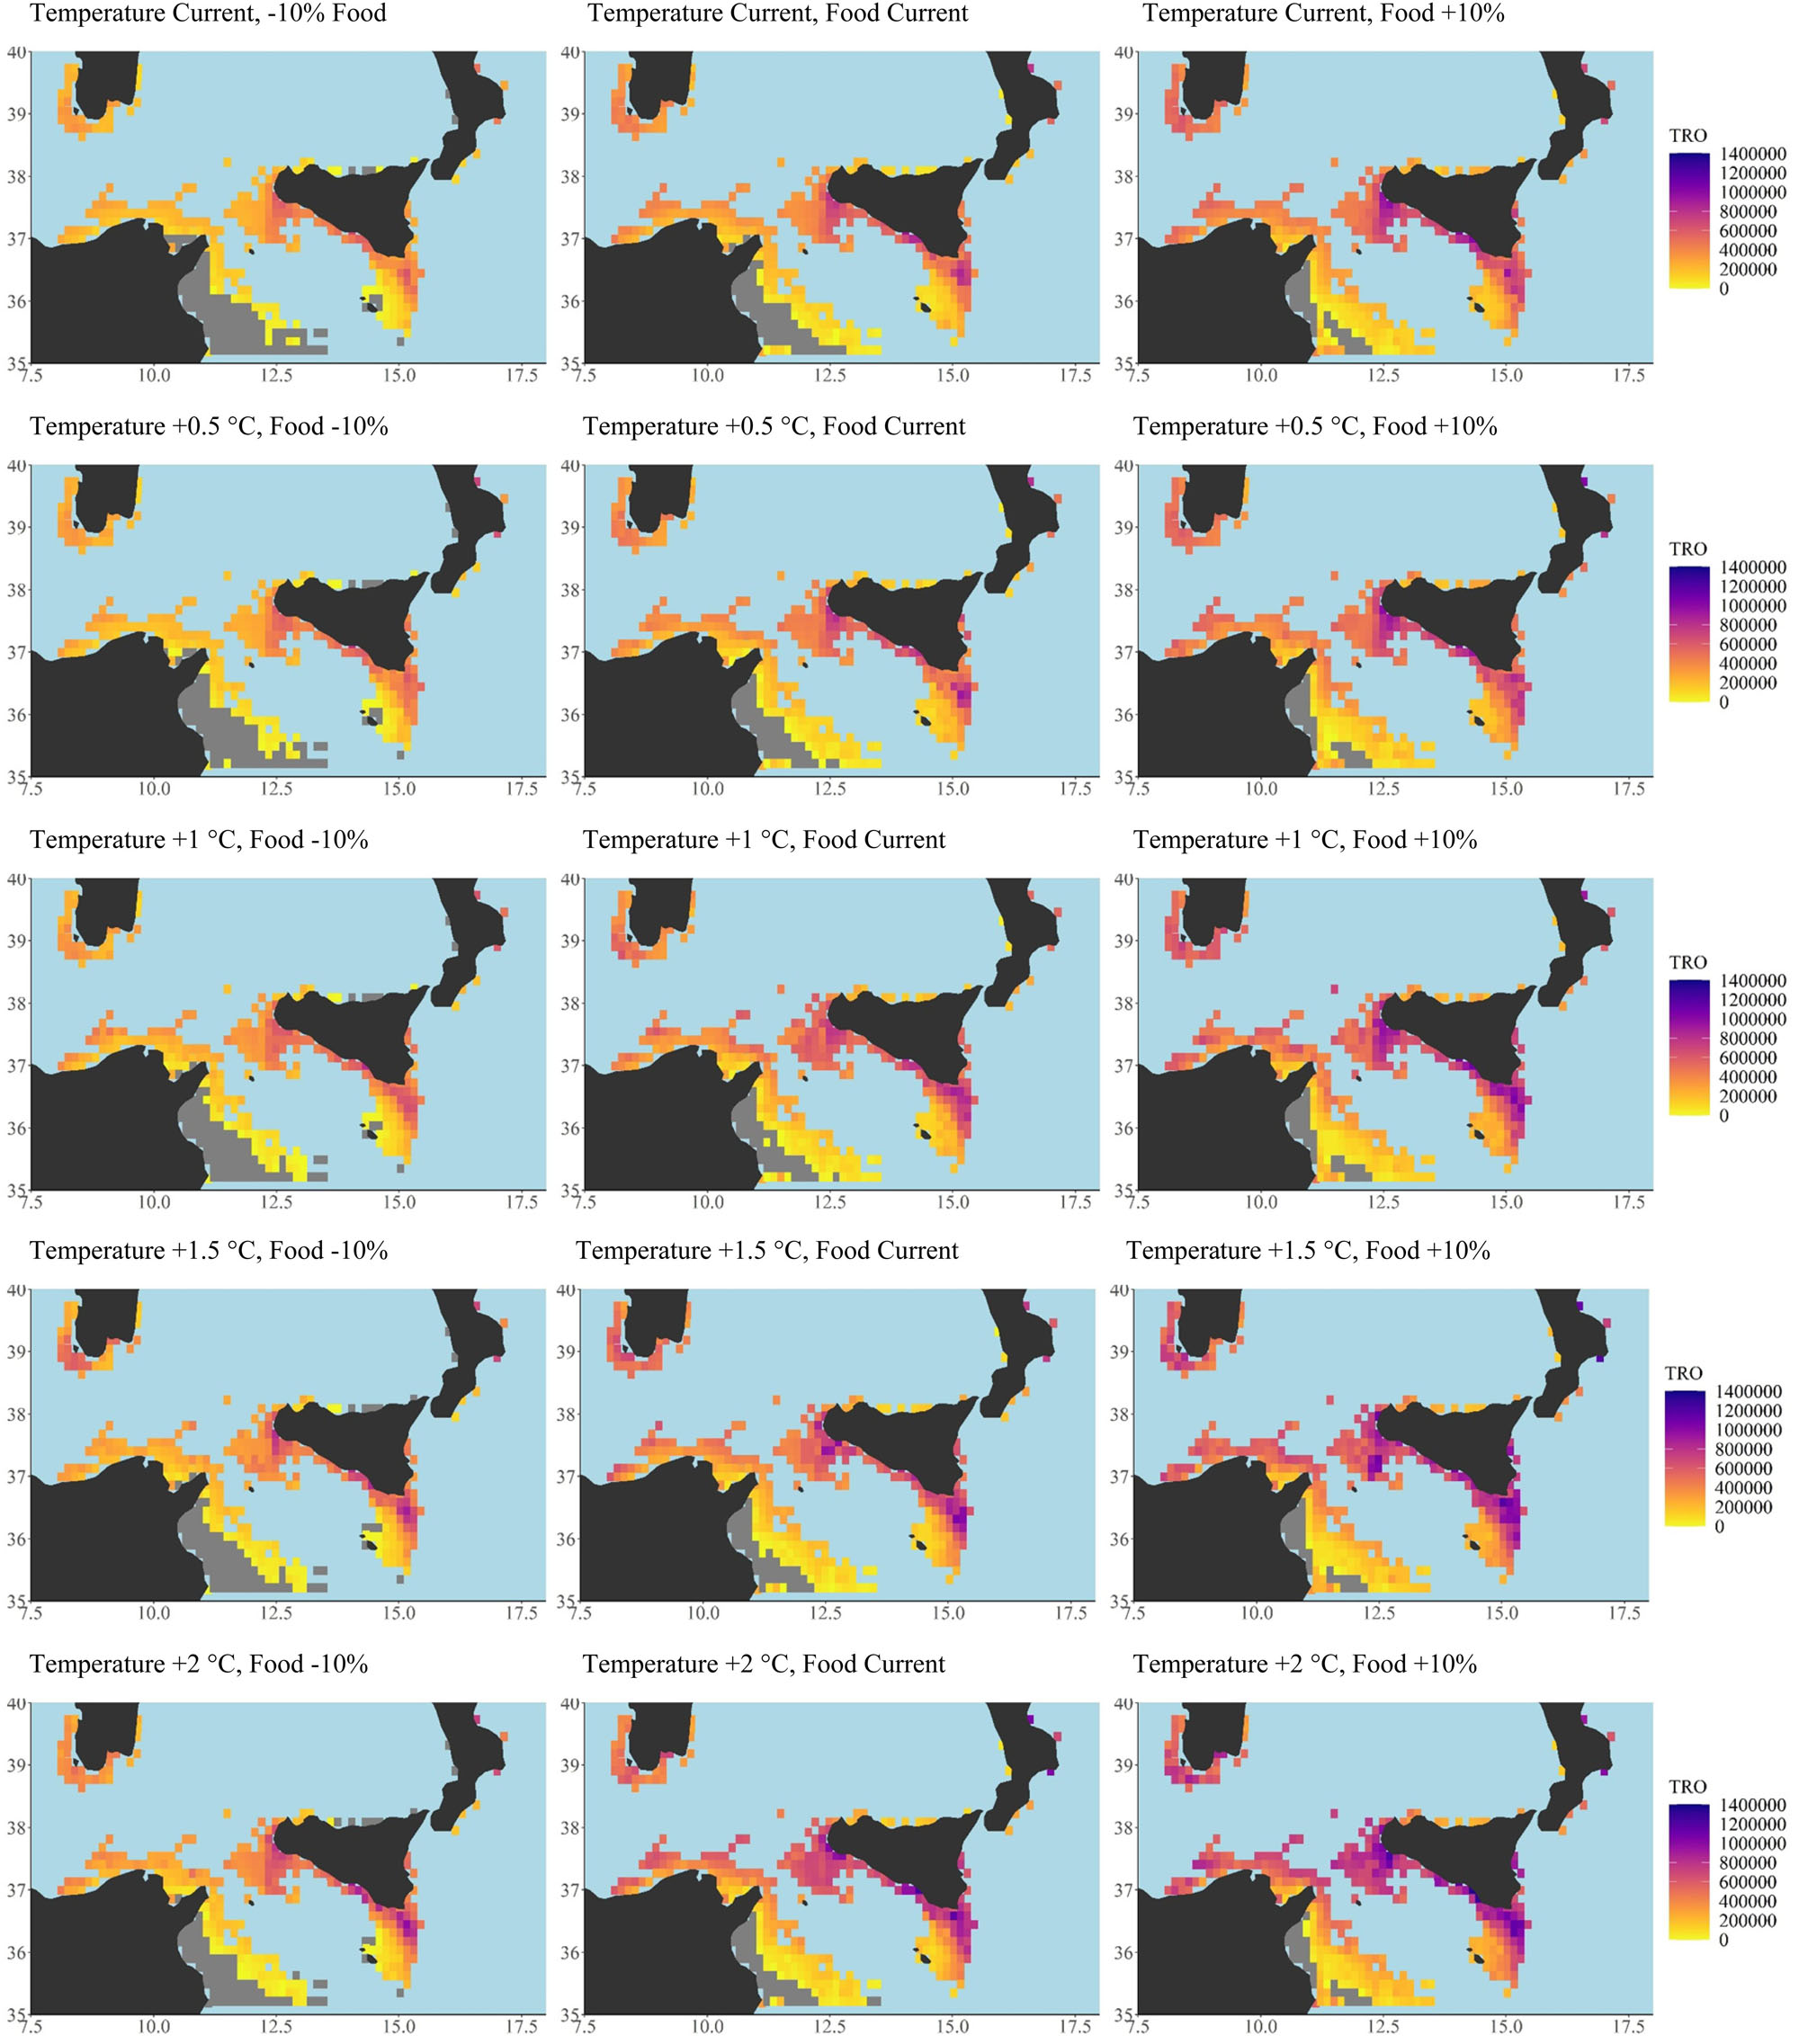
Figure 4. Scenario-based quantitative maps of Total Reproductive Output (TRO, n. eggs/n. of reproductive events) described by a continuous scale ranging (from 0 to 1,400,000) under current conditions of both temperature and food (central panel) and under four increasing temperature scenarios (+0.5; +1.0; +1.5; +2.0°C from top line to bottom line, central) coupled with decreasing (oligotrophic, -10% net primary production, left side) and increasing trophic conditions (eutrophic +10% net primary production, right side). Minimum, maximum, mean and median values for each scenario have been also reported as well as the global G statistic values at Supplementary Table S3. Total number of cells = 346, cell resolution of 12.5 × 12.5 km2. Maps were created using R software (ggplot2 package).
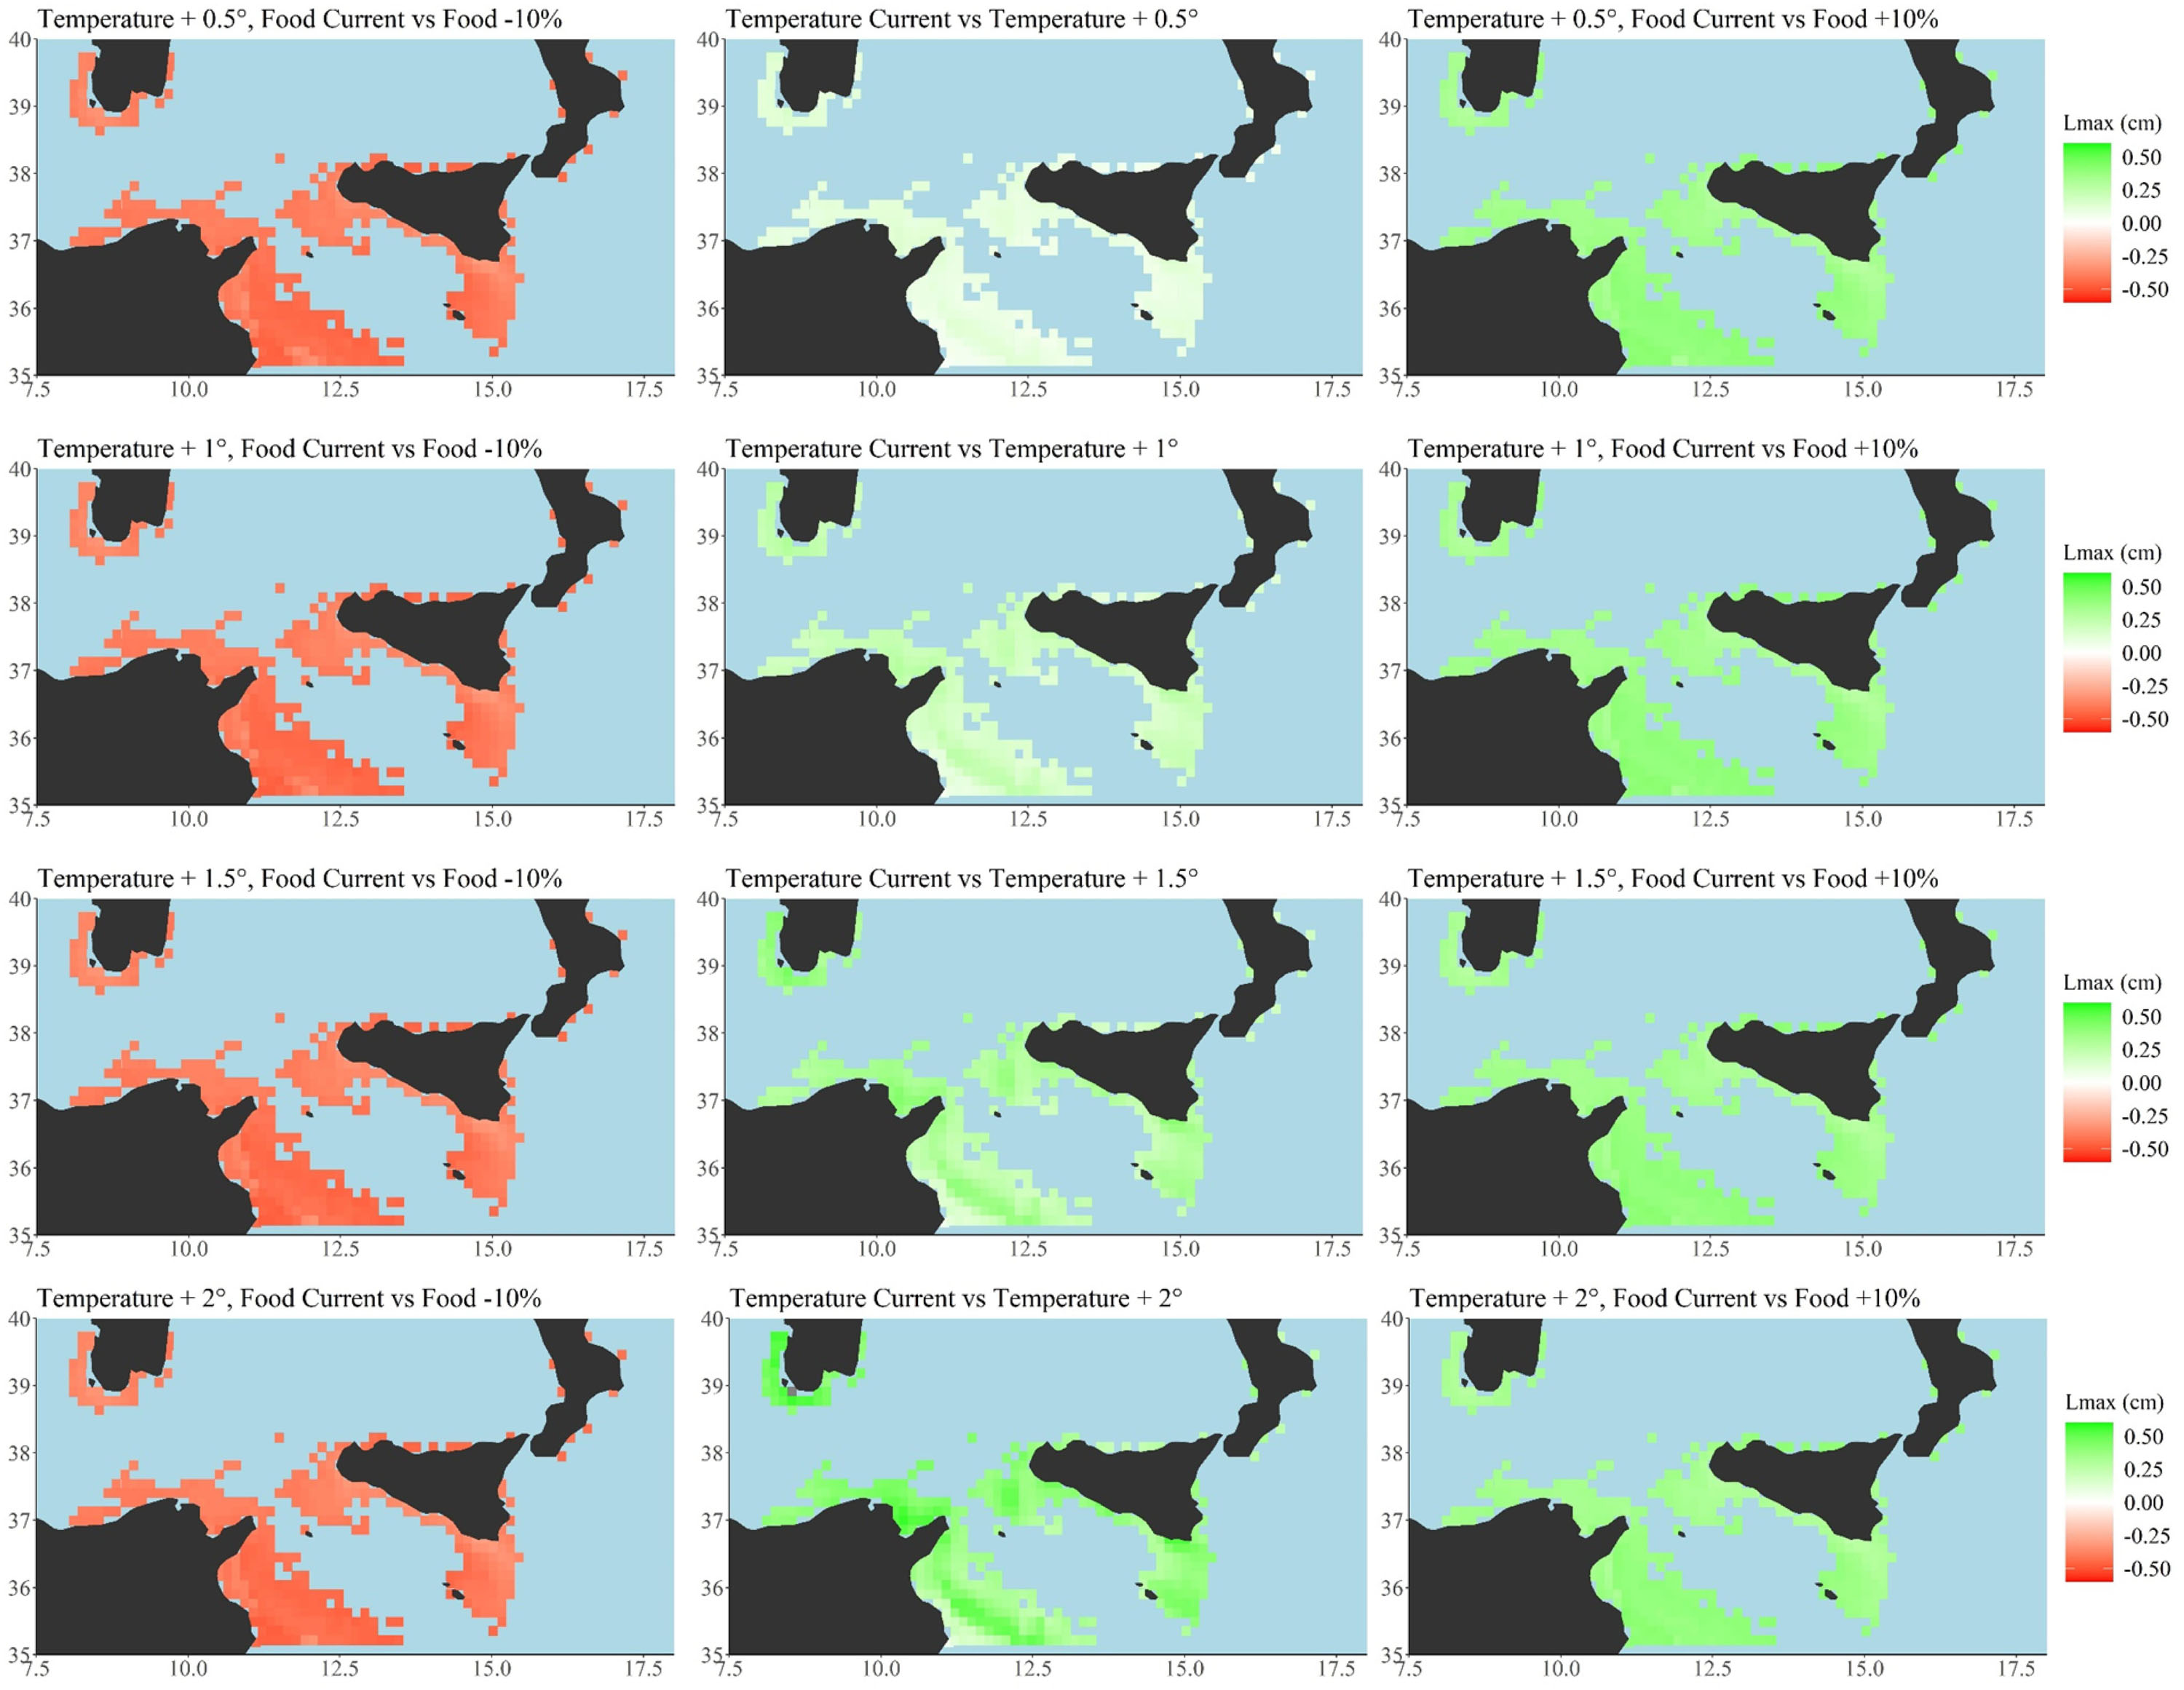
Figure 5. Scenario-based quantitative maps showing differences between Maximum length (Lmax, cm) described by a continuous scale (from -0.48 to 0.46), respectively, across the examined temperature scenarios (central panel, current temperature vs. all the four temperature increasing scenarios of +0.5°C increase up to +2°C). Differences between current primary production food condition and oligotrophic, −10%, food condition per each temperature scenarios (+0.5; +1.0; +1.5; +2.0°C, left side). Differences between current primary production food condition and eutrophic, +10%, food condition per each temperature scenarios (right side). Minimum, maximum, mean and median values for each scenario have been also reported as well as the global G statistic values at Supplementary Table S5. Total number of cells = 346, cell resolution of 12.5 × 12.5 km2. Maps were created using R software (ggplot2 package).
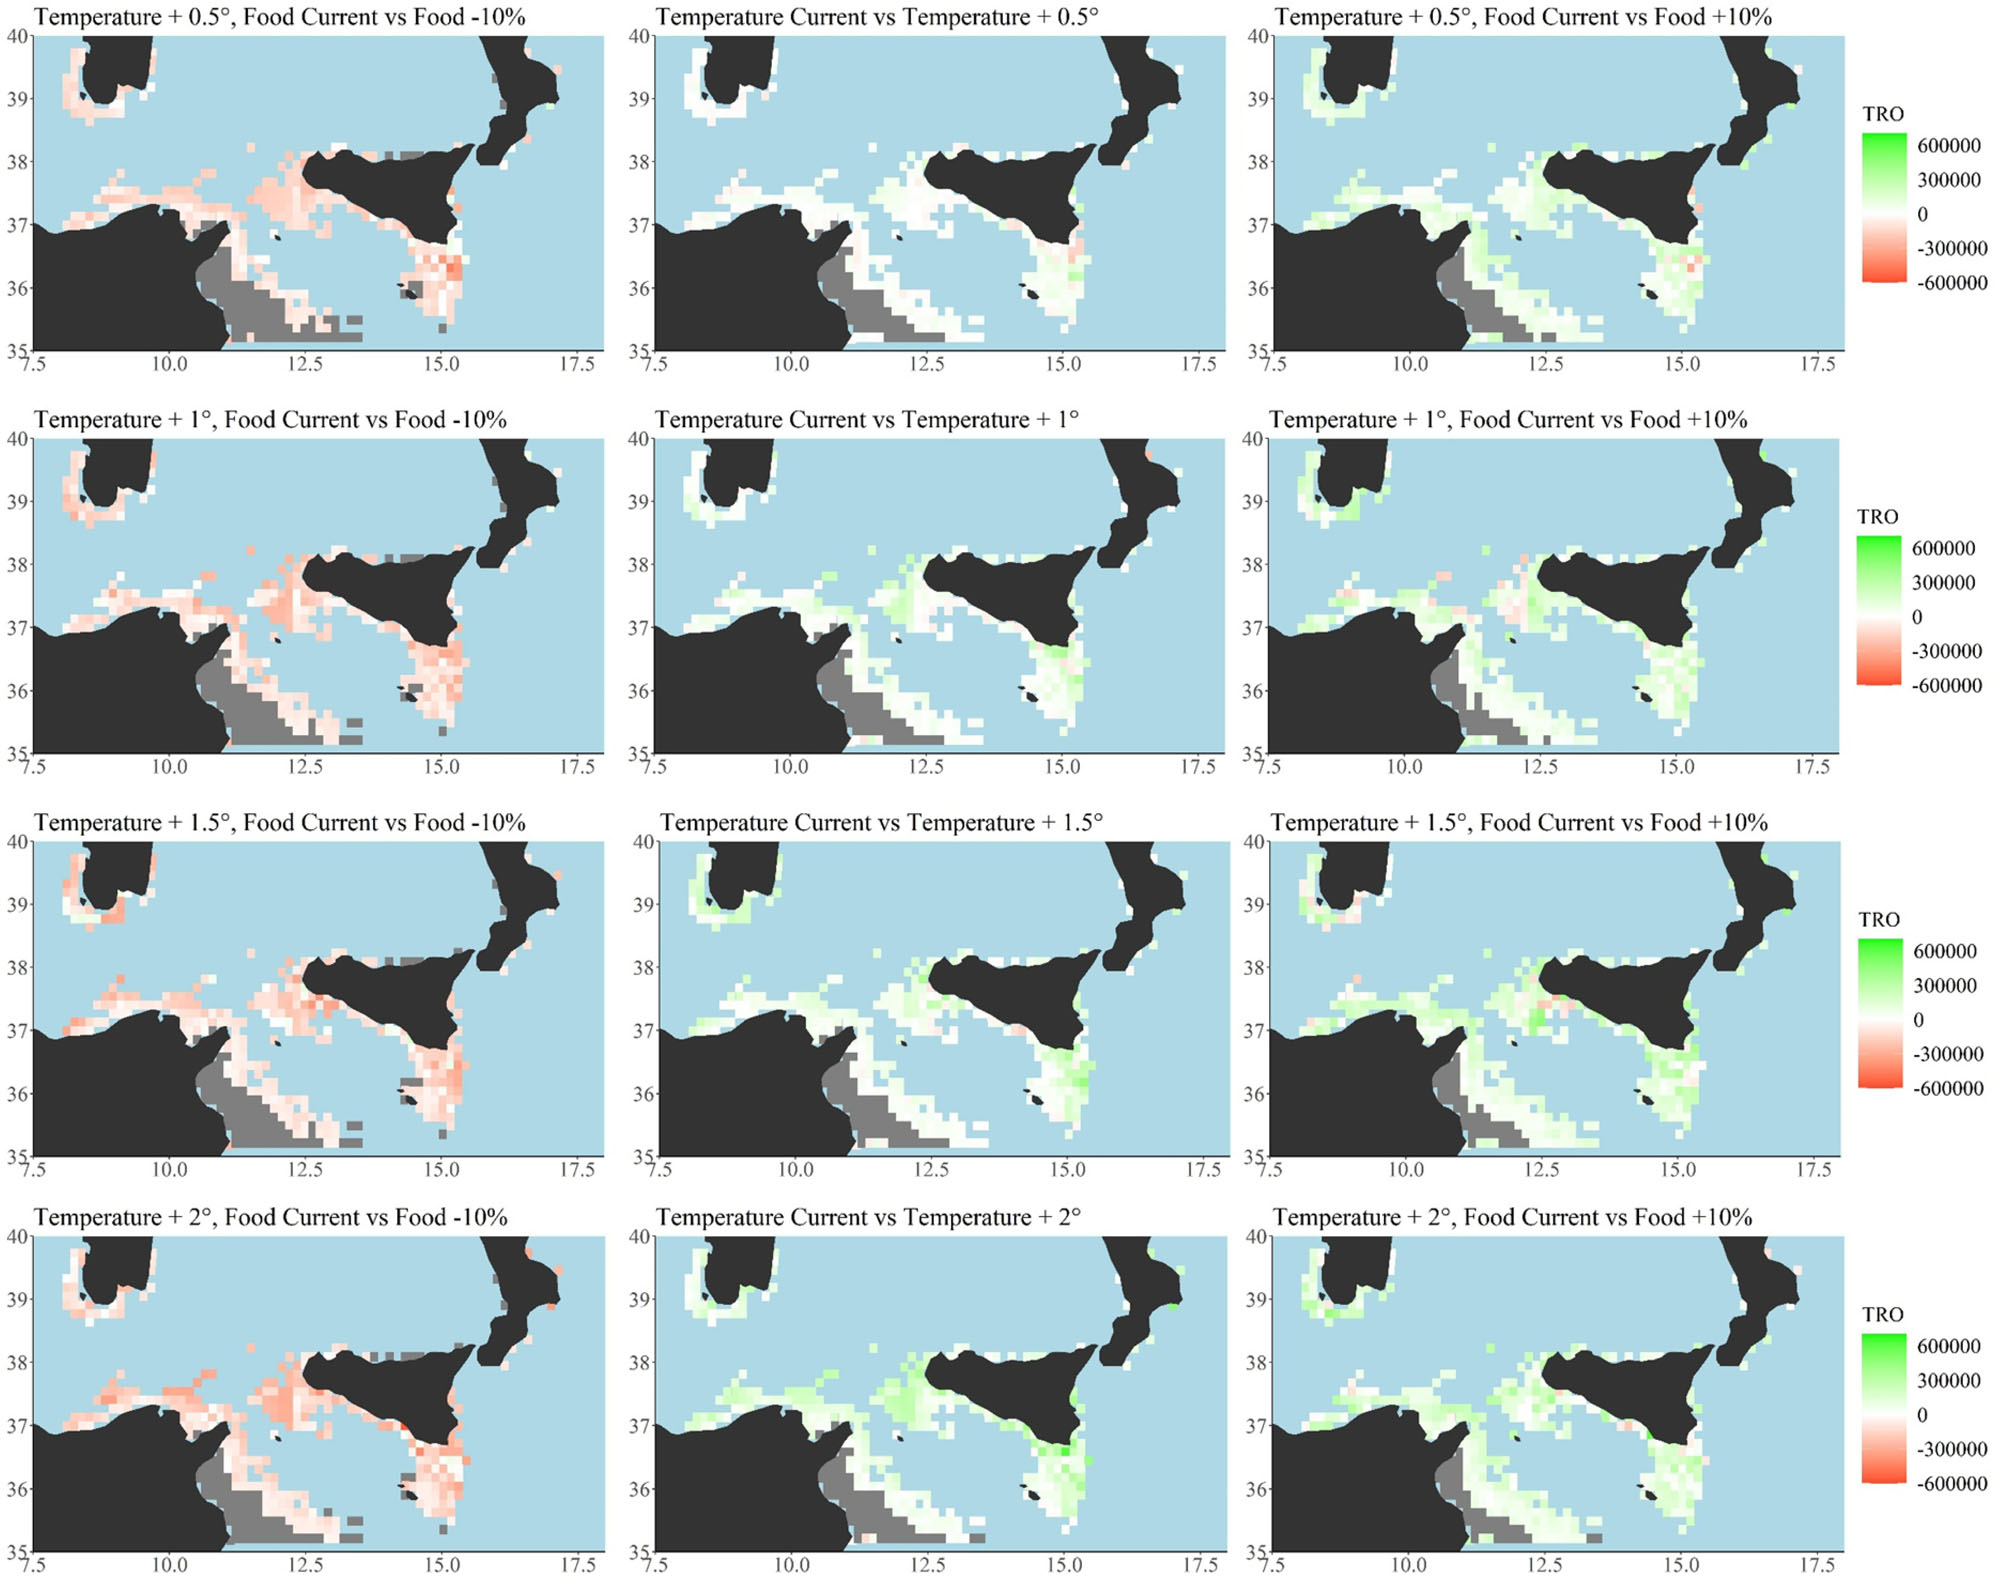
Figure 6. Scenario-based quantitative maps showing differences between Total Reproductive Output (TRO, n. eggs/n. of reproductive events) described by a continuous scale (from -562,550 to 577,740) respectively across the examined temperature scenarios (central panel, current temperature vs. all the four temperature increasing scenarios of +0.5°C increase up to +2°C). Differences between current primary production food condition and oligotrophic, −10%, food condition per each temperature scenarios (+0.5; +1.0; +1.5; +2.0°C, left side). Differences between current primary production food condition and eutrophic, +10%, food condition per each temperature scenarios (right side). Minimum, maximum, mean and median values for each scenario have been also reported as well as the global G statistic values at Supplementary Table S5. Total number of cells = 346, cell resolution of 12.5 × 12.5 km2. Maps were created using R software (ggplot2 package).
To analyze the spatial distributions and trends of both Lmax and TRO patches, under the selected scenarios, z-score values and strength of clustering (positive = high clustering; zero no apparent clustering; negative = low clustering) were estimated through the Spatial Analyst tool of ArcGIS (Getis and Ord, 1992, 1993) and reported for each scenario and life-history trait respectively (only significant, p < 0.05, values are reported, see Supplementary Tables S3–S5). G statistics allow evaluation of the spatial association of a variable within a specified distance of a single point. Here, we used a global G statistic G(d), which measures overall concentration or lack of concentration of all pairs of (xi, xj) such that i and j are within d (a given distance) of each other, giving us information about high or low, positive or negative, spatial clustering of variables. The distance d in km was set at 25 km, corresponding to twice the minimum distance between two cells given the resolution of the map, in order to consider for each cell the two neighboring cells in each direction. G(d) was chosen as it applies on a non-regular grid (as in this case). Relating to quantiles of standard normal distribution, high negative or positive values of the G statistic mean that there is a clustering tendency of, respectively, low and high values of the variable. Values of G(d) near to zero indicate a non-significant clustering tendency, generally visualized as a flat spatial pattern.
Results
DEB model outputs based on observed environmental conditions provided good predictions of the two selected life-history traits in European anchovy, giving a high level of confidence in the generated forecasts (Figure 2, model validation). Validated DEB model outcomes of both the proxy of population size-structure (Lmax) and of population fecundity (TRO) across the study area were positively affected by increased temperatures (see scenario-based quantitative map, Figures 3, 4 central panel, resulting outputs from current temperature to +2°C scenario with +0.5 increment intermediate scenarios) coupled with increases in food availability (see scenario-based quantitative maps; Figures 3, 4 right panel, eutrophic condition + 10% of net primary production). An increase in food availability had a greater effect on both life-history traits, with the highest mean values being predicted under the higher food (eutrophic) scenario (i.e., 10% above current levels of nutrients). Scenario-based quantitative maps of life-history traits represent the geographically explicit forecasts across the study area (model predictions in each cell; Figures 3, 4). The size structure (Figures 3, 5) and the fecundity (Figures 4, 6) of the anchovy are predicted to shift under future conditions with scenario specific response patterns.
Growth Patterns (Lmax)
Generally, increasing temperatures promoted the spatial extension of the highest Lmax values (Figure 3 and Supplementary Table S3). Temperature increases under oligotrophic conditions led to a decrease in the spatial extent of the largest anchovies, whereas eutrophic conditions facilitated an increase (Figure 3 and Supplementary Table S3). Anchovies were predicted to never achieve the maximum size under temperature increase scenarios coupled with oligotrophic conditions. Under the highest temperature scenario, +2°C, coupled with oligotrophic conditions, the anchovies were forecast to reach the lower value of Lmax (maximum size 13.62 cm, minimum size 11.81 cm; Figure 5 and Supplementary Table S5). Under eutrophic conditions the species were predicted to achieve the higher value of Lmax recorded by the model (15.56 cm) at the highest temperature increase (+ 2°C; Figure 5 and Supplementary Table S5).
Fecundity Patterns (TRO)
A similar spatial heterogeneity characterized the TRO simulated responses. The model identified areas predicted to be more productive (Figure 3, highest values, darker colors; Supplementary Table S3) as well as area where a loss of productivity was forecast (Figure 4, gray color; Supplementary Table S3). The highest percentage of loss was under oligotrophic food conditions (-10% NPP), ranging from a loss of 33% under current temperature conditions to a 24% loss under the maximum temperature scenario, +2°C. The lowest percentages of reproductive failure were recorded under the eutrophic food condition (+10% NPP) ranging from a maximum loss of 11% under current temperatures to a minimum of 8% under the maximum temperature scenario, +2°C (Figure 4, gray color; Supplementary Table S3). Differences among crossed scenarios showed increases of TRO under conditions of increased temperature and food (Figure 6, green color, left panel; Supplementary Table S3).
According to G statistics and their respective p-values reported in Supplementary Materials (Supplementary Tables S3, S4), the spatial analysis of patchiness among all life-history traits of the European anchovy exhibited a significant tendency to cluster higher values of TRO and a non-significant tendency to cluster values of TL, in all trophic and temperature scenarios.
Discussion
Our mechanistic, proof-of-concept approach, using DEB theory, allowed for a comparison of current baseline conditions of European anchovy life-history traits distribution against those that might be expected under future climate scenarios. The present model provides highly reliable, quantitative, spatially explicit predictions of how changes in climate-related environmental conditions can potentially affect life-history traits of organisms such as growth (Lmax) and reproduction (TRO). These traits were selected as they drive population dynamics (Bohner and Diez, 2019) and represent essential information for managing commercially important species both currently and in the future (Queirós et al., 2018). Our approach generates spatial forecast data with a previously unachievable fine-scale (∼12.5 km) resolution, allowing the identification of threats and opportunities for the long-term sustainability of the commercially important anchovy, with implications for the European anchovy fisheries sector. The presented approach, when combined with high spatial- and temporal-resolution temperature and food data, has a potential wide range of applications to fisheries stocks globally, assisting in the implementation of existing management evaluation strategies and helping to develop more climate-resilient, trans-boundary resource management planning options.
Fecundity as an Early Warning Proxy of Species Vulnerability: A Baseline Tool to Formulate Control Measures
As the first input-driver of a species’ population dynamics, the fecundity output from the model can be coupled with Lagrangian physical-biological models to predict species local persistence over time, source areas, dispersal over time, and sink areas, all at fine spatial resolution (Falcini et al., 2015; Politikos et al., 2015). Persistence is an essential component of predictive forecasts of future status of commercial stocks and one of the most important population traits for the efficient creation of spatially explicit, climate-driven adaptive management plans (Munroe et al., 2012; Holsman et al., 2019). In this context the scenario-based forecasts of size and productivity shifts for target species, such as the European anchovy, can be used to address the development of seasonal (or even higher such as monthly), adaptive Total Allowable Catch (TAC), proportional to life-history traits. Using this model’s TRO outcomes may help improve the degree of model accuracy when evaluating strategies and the robustness of management options. Interestingly, our approach, although applied in a limited geographic region, demonstrates new capabilities for predicting areas of future species’ vulnerability in terms of changes in spatial connectivity (patchiness) and increase/decrease of reproductive failure (Montalto et al., 2016). Quantitative information on fragmentation of spawning areas, i.e., more productive patches, recognized as Essential Fish Habitat (EFH, sensu Benaka, 1999), fills a critical knowledge gap regarding the capacity to implement spatially explicit management strategies. It also facilitates the design of tailored temporal and/or spatial mitigation measures of fisheries pressures, i.e., control provision measures such as special rules concerning fishing permits in specific areas allowing to plan the fishing fleet capacity over long temporal scale, the design of protection areas within or between reproductive patches of higher productivity that represent source populations for the neighboring areas (e.g., spawning), which can be used to increase stock resilience. As a proxy for recruitment variability, predicted fecundity can represent an effective metric for defining sustainable exploitation strategies (Shelton et al., 2014; Kell et al., 2015).
Spatial Explicit Identification of Source Areas: A Baseline Tool to Address Protection and Adaptation Measures
The need to increase knowledge of population shifts of this species is also crucial because anchovy is the most common forage fish eaten by large predators in the Mediterranean Sea, including Atlantic Bluefin tuna and European hake (Olson et al., 2016). Detecting shifts in the anchovy population can provide a means of foreseeing and disentangling interconnected responses within the multiple hierarchical levels of the food web that this species sustains. The scenario-based quantitative maps resulting from our proof-of-concept clearly identified source areas (Lewin, 1989) where anchovy might still be capable of reproducing under even a 2°C increase in surface temperature, and therefore serve as “rescue sites” (Assis et al., 2017). The number, distribution and extent of source areas could provide the most reliable baseline information for identifying and prioritizing effective areas for protection (e.g., no-take areas, Marine Protected Areas; Lehuta et al., 2010; Giannoulaki et al., 2013). Other sites may in contrast serve as sinks where fish are able to rapidly grow but may fail to reproduce. The localization of areas of highest productivity coupled with other factors, including local and regional oceanography (Falcini et al., 2015; Politikos et al., 2015), can allow identification of sink areas forecast under future climatic scenarios and can be useful to redirect research and management strategies. This knowledge is essential for an effective and successful adaptive management of exploitation by fishing activities and for the maintenance and enhancement of climate-resilience in the context of marine resources management (Pikitch et al., 2004; Lawler et al., 2010; Berkes, 2012; Noble et al., 2014; Pinsky and Mantua, 2014; Busch et al., 2016; Costello et al., 2016).
The scenario-based quantitative maps produced in this study are expected to improve our ability to cope with expected changes in fishery practices at sea (e.g., fleet behavior shifts) and to better manage the relocation of human activities (e.g., fish farms, wind farms) and the enactment of efficient maritime spatial planning (Domínguez-Tejo et al., 2016). Fishery-dependent communities along cross-border coastal areas could be offered the opportunity to maximize their adaptive capacity and minimize their socio-economic vulnerability (i.e., climate-proofing for development) with a general improvement of social-ecological system resilience to environmental changes (Folke, 2006; Liu et al., 2007; Charles, 2012; Lubchenco et al., 2016; Holsman et al., 2019). Instead of long-term and fixed solutions, more flexible, tailored and adaptive tools and strategies would facilitate the implementation of fisheries management plans that incorporate the recovery of populations overfished or threatened by stressors with both local (e.g., pollution) and global origins (Folke, 2006; Halpern et al., 2008; King et al., 2015; Queirós et al., 2018). Mechanistically based forecasts can help to promote more flexible management plans based on a system of year-by-year assessment of marine resources (i.e., based on seasonal assessments and revision of benchmarks and protection, adaptation, mitigation management options) and facilitate more appropriate and specifically tailored monitoring plans.
Key Model Assumptions
DEB modeling can provide useful information that can inform spatial management of resources, however, while the high levels of spatial specificity required by the DEB can provide insights that cannot be gleaned from coarser approaches, it also has some drawbacks and limitations. This approach assumes stationarity in biological parameters (i.e., DEB parameter values estimated for populations in one location/time are valid for populations elsewhere; Monaco et al., 2019). Although this assumption is common to virtually all modeling approaches in use today, it should be acknowledged that model outcomes can be affected by the choice of DEB parameters. Here, we adopted the DEB parameters designed for the Mediterranean anchovy by Pethybridge et al. (2013), but we are aware that phenotypic plasticity and/or local adaptation have the potential to increase the degree of uncertainty of modeling outcomes. These two factors are crucial, and can lead to a modulation of responses under different environmental conditions (Monaco et al., 2019). As a main consequence, when the aim is to design management measures at local scales under environmental changes such as those shown here, we suggest the use of DEB parameters values that, to the extent possible, realistically match those of local populations rather than global (species-specific) parameters. The degree of uncertainty of our simulations was low (model validation Figure 2), which was sufficiently robust to allow reliable predictions of anchovy life-history traits under climate change.
The DEB approach also requires a large computational effort and the application of environmental data at very high resolutions, sometimes at scales which remote sensing cannot provide. The high resolution data necessary as inputs to spatially explicit DEB models require large computational efforts when the aim is to design resource management measures at local levels. These two aspects have interlinked implications for DEB modeling feasibility when running DEB models at regional spatial scales. For example, in the Mediterranean Basin global climate models are considered insufficient to represent the complexity of the geomorphology of the region (Gualdi et al., 2013). Feasibility must likewise be considered where regional, high spatial resolution models, forced by high resolution atmospheric fields, are required to properly reproduce variability (Calafat et al., 2012) or at larger scales (oceanic, continental or global). Here we used a sensitivity analysis to simulate the COP21 predicted changes rather than feeding DEB models with data from IPCC scenarios. We are aware this approach was not able to consider inter-annual spatial variability. Such a choice was driven largely by trade-offs in high spatial and temporal resolution data from IPCC for the study region. For example, in order to gain high temporal resolution (daily) data (WordClime) spatial resolution was insufficient (every pixel was about 1°, i.e., 111 × 111 km). In contrast, with high spatial resolution data (∼44 km pixels for the Mediterranean Basin) temporal resolution was very poor (monthly). We therefore chose an approach using a sensitivity analysis bounded by realistic parameter values (informed by COP21) which allowed us to generate a series of “what if” scenarios based on recent historical data and projections for the next years. We argue that, ultimately, this type of approach may be more useful for some forms of adaptive management than if we had used predictions of the future where temporal variability is only accurate when looking at much longer (climatic) time scales. While projections at this coarse scales which use climatic data with statistically realistic variation are certainly informative of overall trends in response to climate, they may be less reliable as a management tool for enacting shorter-term strategies, for example in advance of projected anomalously warm seasons (e.g., Mills et al., 2017). Such process-based approaches can potentially serve as a new approach in “data dense” situations. However, when such approaches can and should be applied vs. when longer-term forecasts that rely on e.g., IPCC scenarios, remains an open question and deserves further studies designed for this explicit question (e.g., Montalto et al., 2016).
Conclusion
The approach proposed by this proof-of-concept case study represents a tool to enhance ecological resilience under climate change supporting more adaptive fisheries management. The scenario projections were confirmed as a powerful approach to scope biological responses. Our model represents a robust tool (as tested against a wide range of climate scenarios), that is flexible, integrative and responsive to feedback and learning (more external drivers may be integrated) and efficient (output implementation into an adaptive management may increase management benefits and reduced costs; sensu Noble et al., 2014). It can thus be used to build a climate-resilient, adaptive, management strategy (sensu Holsman et al., 2019) that is designed to support the long-term sustainability of fishery resources. The future coupling with other analytical tools (e.g., physical and topographic barriers; Bacha et al., 2014; or food web models) could provide a promising approach toward the implementation of Ecosystem Based Management within the context of global change.
Waiting for the next “policy window” (sensu Rose et al., 2017, technically a window of opportunity for policy change requiring uptake of knowledge, even when it has been previously ignored) the outcomes from our proof-of-concept reinforces the growing chorus of scientific literature and scientists calling for a more “ecologically sound” reframing of management areas established based on political and statistical considerations by the Scientific Advisory Committee of the GFCM (General Fisheries Commission for the Mediterranean [GFCM], 2012), which otherwise risk being invalidated, threatening the effectiveness of the enormous efforts which now proliferate in current management policies.
Data Availability Statement
The raw data supporting the conclusions of this article will be made available by the authors, without undue reservation, to any qualified researcher on reasonable request.
Author Contributions
MCM and GS conceived the idea and developed the modeling design. MCM performed the systematic review to set-up the modeling exercise and lead the writing. FF, AC, and BP provided anchovy data for model validation and some feedback in data interpretation. AG, GL, and GS performed the DEB modeling analyses. TD and TS the fine tuning of DEB writing. MM, RM, GBai, and GBaz provided environmental data (SST and NPP), GIS data analysis and mapping. MCM, NM, FP, MJ, GW, BH, and GS wrote the manuscript. GW, BH, SM, and GS provided research funds and facilities. All authors reviewed and commented on the final manuscript.
Funding
HARMONY Project, INTERREG Italy-Malta 2016 Grant (C1-3.1-31) funded by the Sicilian Region and Maltese Government (to GS) has supported this research together with Fondo Personale FOE N. 418 at Stazione Zoologica Anton Dohrn that supported MCM and Hong Kong Government RGC GRF Grant 780913 (to GW). Several projects have supported data collection at sea for validation: “RITMARE project” La Ricerca ITaliana per il MARE funded by MIUR, Ministero dell’Innovazione, Ministero Ambiente, Regione Sicilia; FAO “MedSudMed Project” Assessment and Monitoring of the Fishery Resources and the Ecosystems in the Strait of Sicily, GCP/RER/010/ITA; Sistema di supporto alle decisioni per la gestione sostenibile della pesca nelle regioni del Mezzogiorno d’Italia (SSD PESCA), Dipartimento Terra e Ambiente (Art. 44, 191 23/12/2009 MIUR MISE); ICT per l’Eccellenza dei Territori – Intervento “Piano ICT per l’eccellenza nella Sicilia occidentale del settore innovazione imprenditoriale a partire dalla ricerca marina” – ICT-E3.
Conflict of Interest
The authors declare that the research was conducted in the absence of any commercial or financial relationships that could be construed as a potential conflict of interest.
Supplementary Material
The Supplementary Material for this article can be found online at: https://www.frontiersin.org/articles/10.3389/fmars.2020.00408/full#supplementary-material
Footnotes
References
Allain, G., Petitgas, P., and Lazure, P. (2001). The influence of mesoscale ocean processes on anchovy (Engraulis encrasicolus) recruitment in the Bay of Biscay estimated with a three-dimensional hydrodynamic mode. Fish. Oceanogr. 10, 151–163. doi: 10.1046/j.1365-2419.2001.00164.x
Assis, J., Berecibar, E., Claro, B., Alberto, F., Reed, D., Raimondi, P., et al. (2017). Major shifts at the range edge of marine forests: the combined effects of climate changes and limited dispersal. Sci. Rep. 7:44348. doi: 10.1038/srep44348
Bacha, M., Jemaa, S., Hamitouche, A., Rabhi, K., and Amara, R. (2014). Population structure of the European anchovy, Engraulis encrasicolus, in the SW Mediterranean Sea, and the Atlantic Ocean: evidence from otolith shape analysis. ICES J. Mar. Sci. 71, 2429–2435. doi: 10.1093/icesjms/fsu097
Basilone, G., Guisande, C., Patti, B., Mazzola, S., Cuttitta, A., Bonanno, A., et al. (2004). Linking habitat conditions and growth in the European anchovy (Engraulis encrasicolus). Fish. Res. 68, 9–19. doi: 10.1016/j.fishres.2004.02.012
Basilone, G., Guisande, C., Patti, B., Mazzola, S., Cuttitta, A., Bonanno, A., et al. (2006). Effect of habitat conditions on reproduction of the European anchovy (Engraulis encrasicolus) in the Strait of Sicily. Fish. Oceanogr. 15, 271–280. doi: 10.1111/j.1365-2419.2005.00391.x
Bates, A. E., Helmuth, B., Burrows, M. T., Duncan, M. I., Garrabou, J., Guy-Haim, T., et al. (2018). Biologists ignore ocean weather at their peril. Nature 560, 299–301. doi: 10.1038/d41586-018-05869-5
Benaka, L. R. (1999). Fish Habitat: Essential Fish Habitat and Rehabilitation. Bethesda MA: American Fisheries Society.
Berkes, F. (2012). Implementing ecosystem-based management: evolution or revolution? Fish Fish. 13, 465–476. doi: 10.1111/j.1467-2979.2011.00452.x
Bohner, T., and Diez, J. (2019). Extensive mismatches between species distributions and performance and their relationship to functional traits. Ecol. Lett. 23, 33–44. doi: 10.1111/ele.13396
Borja, A., Uriarte, A. S., Egaña, J., Motos, L., and Valencia, V. (1998). Relationships between anchovy (Engraulis encrasicolus) recruitment and environment in the Bay of Biscay (1967–1996). Fish. Oceanogr. 7, 375–380. doi: 10.1046/j.1365-2419.1998.00064.x
Burrows, M. T., Schoeman, D. S., Buckley, L. B., Moore, P., Poloczanska, E. S., Brander, K. M., et al. (2011). The pace of shifting climate in marine and terrestrial ecosystems. Science 334, 652–655. doi: 10.1126/science.1210288
Busch, D. S., Griffis, R., Link, J., Abrams, K., Baker, J., Brainard, R. E., et al. (2016). Climate science strategy of the US National Marine Fisheries Service. Mar. Policy 74, 58–67. doi: 10.1016/j.marpol.2016.09.001
Calafat, F. M., Jordá, G., Marcos, M., and Gomis, D. (2012). Comparison of Mediterranean sea level variability as given by three baroclinic models. J. Geophys. Res. Oceans 117:C02009.
Charles, A. (2012). People, oceans and scale: governance, livelihoods and climate change adaptation in marine social–ecological systems. Curr. Opin. Environ. Sustain. 4, 351–357. doi: 10.1016/j.cosust.2012.05.011
Charnov, E. L. (1993). Life History Invariants: Some Explorations of Symmetry in Evolutionary Ecology, Vol. 6. Oxford: Oxford University Press.
Costello, C., Ovando, D., Clavelle, T., Strauss, C. K., Hilborn, R., Melnychuk, M. C., et al. (2016). Global fishery prospects under contrasting management regimes. Proc. Natl. Acad. Sci. U.S.A. 113, 5125–5129. doi: 10.1073/pnas.1520420113
Crain, C. M., Kroeker, K., and Halpern, B. S. (2008). Interactive and cumulative effects of multiple human stressors in marine systems. Ecol. Lett. 11, 1304–1315. doi: 10.1111/j.1461-0248.2008.01253.x
Cushing, D. H., Humprey, G. H., Banse, K., and Laevastui, T. (1958). Report of the committee on terms and equivalents. Rapports et procès verbaux des réunions - Conseil international pour l’exploration de la mer 144, 15–16.
De Oliveira, J. A., Uriarte, A., and Roel, B. A. (2005). Potential improvements in the management of Bay of Biscay anchovy by incorporating environmental indices as recruitment predictors. Fish. Res. 75, 2–14. doi: 10.1016/j.fishres.2005.05.005
Domínguez-Tejo, E., Metternicht, G., Johnston, E., and Hedge, L. (2016). Marine spatial planning advancing the ecosystem-based approach to coastal zone management: a review. Mar. Policy 72, 115–130. doi: 10.1016/j.marpol.2016.06.023
EMODnet Bathymetry Consortium (2016). EMODnet Digital Bathymetry (DTM 2016). Avaliable at: doi: 10.12770/c7b53704-999d-4721-b1a3-04ec60c87238 (accessed February 08, 2017).
Falcini, F., Palatella, L., Cuttitta, A., Nardelli, B. B., Lacorata, G., Lanotte, A. S., et al. (2015). The role of hydrodynamic processes on anchovy eggs and larvae distribution in the sicily channel (Mediterranean Sea): a case study for the 2004 data set. PLoS One 10:e0123213. doi: 10.1371/journal.pone.0123213
Filgueira, R., Rosland, R., and Grant, J. (2011). A comparison of scope for growth (SFG) and dynamic energy budget (DEB) models applied to the blue mussel (Mytilus edulis). J. Sea Res. 66, 403–410. doi: 10.1016/j.seares.2011.04.006
Folke, C. (2006). Resilience: the emergence of a perspective for social–ecological systems analyses. Global Environ. Change 16, 253–267. doi: 10.1016/j.gloenvcha.2006.04.002
Fordham, D. A., Bertelsmeier, C., Brook, B. W., Early, R., Neto, D., Brown, S. C., et al. (2017). How complex should models be? Comparing correlative and mechanistic range dynamics models. Global Change Biol. 24, 1357–1370. doi: 10.1111/gcb.13935
Fulton, E. A. (2011). Interesting times: winners, losers, and system shifts under climate change around Australia. ICES J. Mar. Sci. 68, 1329–1342. doi: 10.1093/icesjms/fsr032
General Fisheries Commission for the Mediterranean [GFCM] (2012). FAO Fisheries and Aquaculture. GFCM Report, 35. Rome: FAO, 164.
Getis, A., and Ord, J. K. (1992). The analysis of spatial association by use of distance statistics. Geogr. Anal. 24, 189–206. doi: 10.1111/j.1538-4632.1992.tb00261.x
Getis, A., and Ord, J. K. (1993). Erratum: the analysis of spatial association by the use of distance statistics Geogr. Anal. 25:276.
Giannoulaki, M., Iglesias, M., Tugores, M. P., Bonanno, A., Patti, B., De Felice, A., et al. (2013). Characterizing the potential habitat of European anchovy Engraulis encrasicolus in the Mediterranean Sea, at different life stages. Fish. Oceanogr. 22, 69–89. doi: 10.1111/fog.12005
Gualdi, S., Somot, S., Li, L., Artale, V., Adani, M., Bellucci, A., et al. (2013). The CIRCE simulations: regional climate change projections with realistic representation of the Mediterranean Sea. Bull. Am. Meteorol. Soc. 94, 65–81. doi: 10.1175/bams-d-11-00136.1
Gunderson, A. R., Armstrong, E. J., and Stillman, J. H. (2016). Multiple stressors in a changing world: the need for an improved perspective on physiological responses to the dynamic marine environment. Ann. Rev. Mar. Sci. 8, 357–378. doi: 10.1146/annurev-marine-122414-033953
Halpern, B. S., Walbridge, S., Selkoe, K. A., Kappel, C. V., Micheli, F., D’agrosa, C., et al. (2008). A global map of human impact on marine ecosystems. Science 319, 948–952.
Helmuth, B., Broitman, B. R., Blanchette, C. A., Gilman, S., Halpin, P., and Harley, C. D. G. (2006). Mosaic patterns of thermal stress in the rocky intertidal zone: implications for climate change. Ecol. Monogr. 76, 461–479. doi: 10.1890/0012-9615(2006)076[0461:mpotsi]2.0.co;2
Helmuth, B., Russell, B. D., Connell, S. D., Dong, Y., Harley, C. D. G., Lima, F. P., et al. (2014). Beyond long-term averages: Making biological sense of a rapidly changing world. Clim. Change Responses 1, 10–20.
Holsman, K. K., Hazen, E. L., Haynie, A., Gourguet, S., Hollowed, A., Bograd, S. J., et al. (2019). Towards climate resiliency in fisheries management. ICES J. Mar. Sci. 76, 1368–1378. doi: 10.1093/icesjms/fsz031
Hulme, M. (2016). 1.5°C and climate research after the Paris agreement. Nat. Clim. Change 6, 222–224. doi: 10.1038/nclimate2939
JPL MUR MEaSUREs Project (2010). GHRSST Level 4 MUR North America Regional Foundation Sea Surface Temperature Analysis. Ver. 1. PO.DAAC, CA, USA. Available online at: https://doi.org/10.5067/GHNMR-4FJ01 (accessed May 25, 2020).
Kearney, M., Simpson, S. J., Raubenheimer, D., and Helmuth, B. (2010). Modelling the ecological niche from functional traits. Philos. Trans.R. Soc. B 365, 3469–3483. doi: 10.1098/rstb.2010.0034
Kearney, M. R., Domingos, T., and Nisbet, R. (2015). Dynamic energy budget theory: an efficient and general theory for ecology. BioScience 65, 341–341. doi: 10.1093/biosci/biv013
Kearney, M. R., Matzelle, A., and Helmuth, B. (2012). Biomechanics meets the ecological niche: the importance of temporal data resolution. J. Exp. Biol. 215, 922–933. doi: 10.1242/jeb.059634
Kell, L. T., Nash, R. D., Dickey-Collas, M., Mosqueira, I., and Szuwalski, C. (2015). Is spawning stock biomass a robust proxy for reproductive potential? Fish Fish. 17, 596–616. doi: 10.1111/faf.12131
King, J. R., McFarlane, G. A., and Punt, A. E. (2015). Shifts in fisheries management: adapting to regime shifts. Philos. Trans. R. Soc. Lond. B Biol. Sci. 370, 20130277. doi: 10.1098/rstb.2013.0277
Kleisner, K. M., Fogarty, M. J., McGee, S., Hare, J. A., Moret, S., Peretti, C. T., et al. (2017). Marine species distribution shifts on the U.S. north east continental shelf under continued ocean warming. Prog. Oceanogr. 153, 24–36. doi: 10.1016/j.pocean.2017.04.001
Kooijman, S. A. L. M. (2010). Dynamic Energy Budget Theory for Metabolic Organisation, 3rd Edn. Cambridge: Cambridge University Press.
Korell, L., Auge, H., Jonathan, M. C., Harpole, W. S., and Knight, T. M. (2019). We need more realistic climate change experiments for understanding ecosystems of the future. Global Change Biol. 26, 352–327.
Kroeker, K. J., Sanford, E., Rose, J. M., Blanchette, C. A., Chan, F., Chavez, F. P., et al. (2016). Interacting environmental mosaics drive geographic variation in mussel performance and species interactions. Ecol. Lett. 19, 771–779. doi: 10.1111/ele.12613
Lawler, J. J., Tear, T. H., Pyke, C., Shaw, M. R., Gonzalez, P., Kareiva, P., et al. (2010). Resource management in a changing and uncertain climate. Front. Ecol. Environ. 8:35–43. doi: 10.1890/070146
Lehuta, S., Mahévas, S., Petitgas, P., and Pelletier, D. (2010). Combining sensitivity and uncertainty analysis to evaluate the impact of management measures with ISIS–Fish: marine protected areas for the Bay of Biscay anchovy (Engraulis encrasicolus) fishery. ICES J. Mar. Sci. 67, 1063–1075. doi: 10.1093/icesjms/fsq002
Lewin, R. (1989). Sources and sinks complicate ecology. Science 243, 477–478. doi: 10.1126/science.243.4890.477
Liu, J., Dietz, T., Carpenter, S. R., Alberti, M., Folke, C., Moran, E., et al. (2007). Complexity of coupled human and natural systems. Science 317, 1513–1516.
Lohrer, A. M., Thrush, S. F., Hewitt, J. E., and Kraan, C. (2015). The up-scaling of ecosystem functions in a heterogeneous world. Sci. Rep. 5:10349.
Lubchenco, J., Cerny-Chipman, E. B., Reimer, J. N., and Levin, S. A. (2016). The right incentives enable ocean sustainability successes and provide hope for the future. Proc. Natl. Acad. Sci. U.S.A. 113, 14507–14514. doi: 10.1073/pnas.1604982113
Mangano, M. C., Giacoletti, A., and Sarà, G. (2019). Dynamic energy budget provides mechanistic derived quantities to implement the ecosystem based management approach. J. Sea Res. 143, 272–279. doi: 10.1016/j.seares.2018.05.009
Mills, K. E., Pershing, A. J., Brown, C. J., Chen, Y., Chiang, F.-S., Holland, D. S., et al. (2013). Fisheries management in a changing climate: lessons from the 2012 ocean heat wave in the Northwest Atlantic. Oceanography 26, 191–195.
Mills, M. J., Richter, J. H., Tilmes, S., Kravitz, B., MacMartin, D. G., Glanville, A. A., et al. (2017). Radiative and chemical response to interactive stratospheric sulfate aerosols in fully coupled CESM1 (WACCM). J. Geophys. Res. Atmos. 122, 13–061.
Monaco, C. J., Porporato, E. M., Lathlean, J. A., Tagliarolo, M., Sarà, G., and McQuaid, C. D. (2019). Predicting the performance of cosmopolitan species: dynamic energy budget model skill drops across large spatial scales. Mar. Biol. 166:14.
Montalto, V., Helmuth, B., Ruti, P. M., Dell’Aquila, A., Rinaldi, A., and Sarà, G. (2016). A mechanistic approach reveals non linear effects of climate warming on mussels throughout the Mediterranean sea. Clim. Change 139, 293–306. doi: 10.1007/s10584-016-1780-4
Munroe, D. M., Klinck, J. M., Hofmann, E. E., and Powell, E. N. (2012). The role of larval dispersal in meta population gene flow: local population dynamics matter. J. Mar. Res. 70, 441–467. doi: 10.1357/002224012802851869
Nisbet, R. M., Jusup, M., Klanjscek, T., and Pecquerie, L. (2012). Integrating dynamic energy budget (DEB) theory with traditional bioenergetic models. J. Exp. Biol. 215, 892–902. doi: 10.1242/jeb.059675
Noble, I. R., Hu, S., Anokhin, Y. A., Carmin, J., Goudou, D., Lansigan, F. P. P., et al. (2014). “Adaptation needs and options. In climate change 2014: impacts, adaptation, and vulnerability. part a: global and sectoral aspects,” in Proceeding of the Contribution of Working Group II to the Fifth Assessment Report of the Intergovernmental Panel on Climate Change, eds C. B. Field, V. R. Barros, D. J. Dokken, K. J. Mach, M. D. Mastrandrea, T. E. Bilir, et al. (Cambridge: Cambridge University Press), 833–868. doi: 10.1017/cbo9781107415379.019
Olson, R. J., Young, J. W., Ménard, F., Potier, M., Allain, V., Goñi, N., et al. (2016). Bioenergetics, trophic ecology, and niche separation of tunas. Adv. Mar. Biol. 74, 199–344. doi: 10.1016/bs.amb.2016.06.002
Pacifici, M., Foden, W. B., Visconti, P., Watson, J. E., Butchart, S. H., Kovacs, K. M., et al. (2015). Assessing species vulnerability to climate change. Nat. Clim. Change 5, 215.
Patti, B., Zarrad, R., Jarboui, O., Cuttitta, A., Basilone, G., Aronica, S., et al. (2018). Anchovy (Engraulis encrasicolus) early life stages in the Central Mediterranean Sea: connectivity issues emerging among adjacent sub-areas across the Strait of Sicily. Hydrobiologia 821, 25–40. doi: 10.1007/s10750-017-3253-9
Payne, M. R., Barange, M., Cheung, W. W., MacKenzie, B. R., Batchelder, H. P., Cormon, X., et al. (2015). Uncertainties in projecting climate-change impacts in marine ecosystems. ICES J. Mar. Sci. 73, 1272–1282.
Pecl, G. T., Araújo, M. B., Bell, J. D., Blanchard, J., Bonebrake, T. C., Chen, I. C., et al. (2017). Biodiversity redistribution under climate change: Impacts on ecosystems and human well-being. Science 355:eaai9214. doi: 10.1126/science.aai9214
Pecl, G. T., Ward, T. M., Doubleday, Z. A., Clarke, S., Day, J., Dixon, C., et al. (2014). Rapid assessment of fisheries species sensitivity to climate change. Clim. Change 127, 505–520. doi: 10.1007/s10584-014-1284-z
Pecquerie, L., Petitgas, P., and Kooijman, S. A. (2009). Modeling fish growth and reproduction in the context of the dynamic energy budget theory to predict environmental impact on anchovy spawning duration. J. Sea Res. 62, 93–105. doi: 10.1016/j.seares.2009.06.002
Pethybridge, H., Roos, D., Loizeau, V., Pecquerie, L., and Bacher, C. (2013). Responses of European anchovy vital rates and population growth to environmental fluctuations: an individual-based modelling approach. Ecol. Model. 250, 370–383. doi: 10.1016/j.ecolmodel.2012.11.017
Pikitch, E. K., Santora, C., Babcock, E. A., Bakun, A., Bonfil, R., Conover, D. O., et al. (2004). Ecosystem-based fishery management. Science 305, 346–347. doi: 10.1126/science.1098222
Pinsky, M. L., and Mantua, N. (2014). Emerging adaptation approaches for climate-ready fisheries management. Oceanography 27, 146–159. doi: 10.5670/oceanog.2014.93
Politikos, D. V., Huret, M., and Petitgas, P. (2015). A coupled movement and bioenergetics model to explore the spawning migration of anchovy in the Bay of Biscay. Ecol. Model. 313, 212–222. doi: 10.1016/j.ecolmodel.2015.06.036
Queirós, A. M., Fernandes, J., Genevier, L., and Lynam, C. P. (2018). Climate change alters fish community size-structure, requiring adaptive policy targets. Fish Fish. 19, 613–621. doi: 10.1111/faf.12278
R Core Team (2019). R: A Language and Environment for Statistical Computing. Vienna, Austria: R Foundation for Statistical Computing. Available online at: http://www.R-project.org/
Rose, D. C., Mukherjee, N., Simmons, B. I., Tew, E. R., Robertson, R. J., Vadrot, A. B., et al. (2017). Policy windows for the environment: tips for improving the uptake of scientific knowledge. Environ. Sci. Policy. doi: 10.1016/j.envsci.2017.07.013
Ruiz, J., Rincón, M. M., Castilla, D., Ramos, F., and del Hoyo, J. J. G. (2017). Biological and economic vulnerabilities of fixed TACs in small pelagics: an analysis of the European anchovy (Engraulis encrasicolus) in the Gulf of Cádiz. Mar. Policy 78, 171–180. doi: 10.1016/j.marpol.2017.01.022
Sarà, G., Gouhier, T. C., Brigolin, D., Porporato, E. M. D., Mangano, M. C., Mirto, S., et al. (2018). Predicting shifting sustainability trade-offs in marine finfish aquaculture under climate change. Global Change Biol. 24, 3654–3665. doi: 10.1111/gcb.14296
Sarà, G., Kearney, M., and Helmuth, B. (2011). Combining heat-transfer and energy budget models to predict local and geographic patterns of mortality in Mediterranean intertidal mussels. Chem. Ecol. 27, 135–145. doi: 10.1080/02757540.2011.552227
Sarà, G., Palmeri, V., Montalto, V., Rinaldi, A., and Widdows, J. (2013a). The parameterisation of bivalve functional traits in a context of mechanistic eco-physiological dynamic energy budget model. Mar. Ecol. Prog. Ser. 480, 99–117. doi: 10.3354/meps10195
Sarà, G., Palmeri, V., Rinaldi, A., Montalto, V., and Helmuth, B. (2013b). Predicting biological invasions in marine habitats through eco-physiological mechanistic models: a study case with the bivalve Brachidontes pharaonis. Divers. Distrib. 19, 1235–1247. doi: 10.1111/ddi.12074
Sarà, G., Rinaldi, A., and Montalto, V. (2014). Thinking beyond organism energy use: a trait-based bioenergetic mechanistic approach for predictions of life history traits in marine organisms. Mar. Ecol. 35, 506–515. doi: 10.1111/maec.12106
Shelton, A. O., Samhouri, J. F., Stier, A. C., and Levin, P. S. (2014). Assessing trade-offs to inform ecosystem-based fisheries management of forage fish. Sci. Rep. 4:7110. doi: 10.1038/srep07110
Sinclair, B. J., Marshall, K. E., Sewell, M. A., Levesque, D. L., Willett, C. S., Slotsbo, S., et al. (2016). Can we predict ectotherm responses to climate change using thermal performance curves and body temperatures? Ecol. Lett. 19, 1372–1385. doi: 10.1111/ele.12686
Solow, A. R. (2017). On detecting ecological impacts of extreme climate events and why it matters. Philos. Trans. R. Soc. Lond. B Biol. Sci 372:20160136. doi: 10.1098/rstb.2016.0136
Sousa, T., Domingos, T., and Kooijman, S. A. L. M. (2008). From empirical patterns to theory: a formal metabolic theory of life. Philos. Trans. R. Soc. Lond. B Biol. Sci. 363, 2453–2464. doi: 10.1098/rstb.2007.2230
Sousa, T., Domingos, T., Poggiale, J. C., and Kooijman, S. A. L. M. (2010). Dynamic energy budget theory restores coherence in biology. Philos. Trans. R. Soc. Lond. B Biol. Sci. 365, 3413–3428. doi: 10.1098/rstb.2010.0166
Stram, D. L., and Evans, D. C. (2009). Fishery management responses to climate change in the North Pacific. ICES J. Mar. Sci. 66, 1633–1639. doi: 10.1093/icesjms/fsp138
Strömberg, K. H. P., Smyth, T. J., Allen, J. I., Pitois, S., and O’Brien, T. D. (2009). Estimation of global zooplankton biomass from satellite ocean colour. J. Mar. Syst. 78, 18–27. doi: 10.1016/j.jmarsys.2009.02.004
Teal, L. R., Marras, S., Peck, M. A., and Domenici, P. (2018). Physiology-based modelling approaches to characterize fish habitat suitability: their usefulness and limitations. Estuar. Coast. Shelf Sci. 201, 56–63. doi: 10.1016/j.ecss.2015.11.014
Torri, M., Corrado, R., Falcini, F., Cuttitta, A., Palatella, L., Lacorata, G., et al. (2018). Planktonic stages of small pelagic fishes (Sardinella aurita and Engraulis encrasicolus) in the central Mediterranean Sea: the key role of physical forcings and implications for fisheries management. Prog. Oceanogr. 162, 25–39. doi: 10.1016/j.pocean.2018.02.009
Tsikliras, A. C., Antonopoulou, E., and Stergiou, K. I. (2010). Spawning period of Mediterranean marine fishes. Rev. Fish Biol. Fish. 20, 499–538. doi: 10.1007/s11160-010-9158-6
Tudela, S., and Palomera, I. (1997). Trophic ecology of the European anchovy Engraulis encrasicolus in the Catalan Sea (northwest Mediterranean). Mar. Ecol. Prog. Ser. 160, 121–134. doi: 10.3354/meps160121
Uriarte, A., Roel, B. A., Borja, A., Allain, G., and O’Brien, C. M. (2002). Role of environmental indices in determining the recruitment of the Bay of Biscay anchovy. ICES Pelagic Fish Responses to Climate Variability - Consequences for Fisheries and Ecosystem Advice CM 2002/O:25.
van de Pol, M., Jenouvrier, S., Cornelissen, J. H. C., and Visser, M. E. (2017). Behavioural, ecological and evolutionary responses to extreme climatic events: challenges and directions. Philos. Trans. R. Soc. Lond. B Biol. Sci. 372:20160134. doi: 10.1098/rstb.2016.0134
Vasilakopoulos, P., Maravelias, C. D., and Tserpes, G. (2014). The alarming decline of Mediterranean fish stocks. Curr. Biol. 24, 1643–1648. doi: 10.1016/j.cub.2014.05.070
Whitehead, J. P. (1985). “Clupeoid fishes of the world (suborder clupeoidei),” in An Annotated and Illustrated Catalogue of the Herrings, Sardines, Pilchards, Sprats, Shads, Anchovies, and Wolfherrings, (Rome: Food & Agriculture Organisation).
Keywords: climate-informed management, Dynamic Energy Budget model, Engraulis encrasicolus, life-history traits, scenarios, temperature increase
Citation: Mangano MC, Mieszkowska N, Helmuth B, Domingos T, Sousa T, Baiamonte G, Bazan G, Cuttitta A, Fiorentino F, Giacoletti A, Johnson M, Lucido GD, Marcelli M, Martellucci R, Mirto S, Patti B, Pranovi F, Williams GA and Sarà G (2020) Moving Toward a Strategy for Addressing Climate Displacement of Marine Resources: A Proof-of-Concept. Front. Mar. Sci. 7:408. doi: 10.3389/fmars.2020.00408
Received: 01 March 2020; Accepted: 12 May 2020;
Published: 02 July 2020.
Edited by:
Rachel Gjelsvik Tiller, SINTEF, NorwayReviewed by:
Tommaso Russo, University of Rome Tor Vergata, ItalyGeorge Triantafyllou, Hellenic Centre for Marine Research (HCMR), Greece
Copyright © 2020 Mangano, Mieszkowska, Helmuth, Domingos, Sousa, Baiamonte, Bazan, Cuttitta, Fiorentino, Giacoletti, Johnson, Lucido, Marcelli, Martellucci, Mirto, Patti, Pranovi, Williams and Sarà. This is an open-access article distributed under the terms of the Creative Commons Attribution License (CC BY). The use, distribution or reproduction in other forums is permitted, provided the original author(s) and the copyright owner(s) are credited and that the original publication in this journal is cited, in accordance with accepted academic practice. No use, distribution or reproduction is permitted which does not comply with these terms.
*Correspondence: M. Cristina Mangano, bWFyaWFjcmlzdGluYS5tYW5nYW5vQGdtYWlsLmNvbQ==; bWFyaWFjcmlzdGluYS5tYW5nYW5vQHN6bi5pdA==