 Joshua Kiesel
 Christina Bienhold
 Frank Wenzhöfer
 Heike Link
- 1Department of Geography, Kiel University, Kiel, Germany
- 2HGF-MPG Group for Deep Sea Ecology and Technology, Alfred Wegener Institute Helmholtz Centre for Polar and Marine Research, Bremerhaven, Germany
- 3HGF-MPG Group for Deep Sea Ecology and Technology, Max Planck Institute for Marine Microbiology, Bremen, Germany
- 4Department Maritime Systems, Faculty of Interdisciplinary Research, University of Rostock, Rostock, Germany
Remineralization of organic matter at the seafloor is an important ecosystem function, as it drives carbon and nutrient cycling, supplying nutrients for photosynthetic production, but also controls carbon burial within the sediment. In the Arctic Ocean, changes in primary production due to rapid sea-ice decline and thinning affect the export of organic matter to the seafloor and thus, benthic ecosystem functioning. Due to the remoteness and difficult accessibility of the Arctic Ocean, we still lack baseline knowledge about patterns of benthic remineralization rates and their drivers in both shelf and deep-sea sediments. Particularly comparative studies across regions are scarce. Here, we address this knowledge gap by contrasting benthic diffusive and total oxygen uptake rates (DOU and TOU), both established proxies of the benthic remineralization function, between shelf and deep-sea habitats of the Barents Sea and the central Arctic Ocean, sampled during a RV Polarstern expedition in 2015. DOU and TOU were measured using ex situ porewater oxygen microprofiles and sediment core incubations, respectively. In addition, contextual parameters including organic matter availability and microbial cell numbers were determined as environmental predictors. Pan-Arctic regional comparisons were obtained by extending our analyses to previously published data from the Laptev and Beaufort Seas. Our results show that (1) benthic oxygen uptake rates and most environmental predictors varied significantly between shelf and deep-sea habitats; (2) the availability of detrital organic matter is the main driver for patterns in total as well as diffusive respiration, while bacterial abundances were highly variable and only a weak predictor of differences in TOU and DOU; (3) regional differences in oxygen uptake across shelf and deep-sea sediments were mainly related to organic matter availability and may reflect varying primary production regimes and distances to the nearest shelf. Our findings suggest that the expected decline in sea-ice cover and the subsequent increase in export of organic matter to the seafloor may particularly enhance remineralization in the deep seas of the Arctic Ocean, altering benthic ecosystem functioning in future climate scenarios.
Introduction
A major function of benthic ecosystems is the turnover of organic matter, mainly driven by microorganisms (Glud et al., 1998), which we refer to as the “benthic remineralization” function (Link et al., 2013b). This remineralization is crucial for the replenishment of nutrients to the water column (Canfield, 1993) and determines the amount of buried carbon in the seafloor (Archer and Maier-Reimer, 1994). It is dependent on exported organic matter from the upper water column to the seafloor, which constitutes a crucial food source for benthic communities. This is especially valid for 95% of the seabed (67% of the Earth’s surface), where the absence of light impedes primary production (Jørgensen and Boetius, 2007). It is therefore not surprising that benthic remineralization rates are dependent on water depth (Wenzhöfer and Glud, 2002). On a global scale, 15–50% (Glud, 2008) of the pelagic primary production finally reach the seafloor on the shelf, while the deep sea only receives about 1 – 5% of the exported organic matter (Klages et al., 2004; Smith et al., 2008). From these 1 – 5%, only 1 – 2% are remineralized within a few days, while the remaining proportion is turned over very slowly and gets finally buried in the seabed (Turley and Lochte, 1990; Jørgensen and Boetius, 2007).
Shelf seas in the Arctic Ocean are generally known to have higher turnover rates than deeper areas of the central Arctic (Clough et al., 2005; Grebmeier et al., 2006; Link et al., 2013b). In the latter, the perennial sea-ice cover further hampers primary production and thus, the export of organic matter to the seafloor (Bleil and Thiede, 1990; Grebmeier, 2012; Fernández-Méndez et al., 2015). Sea-ice cover in September is currently estimated to decline by 43 to 94% by 2100 (IPCC, 2013) and production regimes are predicted to change with sea-ice decline (Arrigo et al., 2008). This will ultimately affect benthic ecosystem functioning, as the quantity and quality of organic matter exported to the seafloor changes, enhancing benthic remineralization and carbon burial (Arrigo et al., 2008; Bauerfeind et al., 2009; Lalande et al., 2014; Sørensen et al., 2015; Hoffmann et al., 2017). This has previously been stressed by Boetius et al. (2013), who reported that sea-ice thinning may result in an increased export of ice algae to the deep-sea floor, triggering an increase in benthic turnover rates at latitudes >87°N. Arctic deep seas are still largely covered by sea ice on a perennial basis, whereas the presence of sea-ice on the shelves is highly seasonal (Bleil and Thiede, 1990). Thus, it is unclear if changes in benthic remineralization in the Arctic will develop differently on the continental shelves compared to the deep basins.
Benthic remineralization can be studied by measuring sedimentary oxygen uptake (Wenzhöfer and Glud, 2002; Glud, 2008; Link et al., 2013b). The latter can be assessed by measuring either total sedimentary oxygen uptake rates (TOUsed) or diffusive oxygen uptake (DOU) rates and reflects heterotrophic activity (and thus remineralization) in the absence of primary producers. TOUsed is an indicator of the total benthic carbon mineralization, including oxygen consumption induced by macrofauna (Rasmussen and Jørgensen, 1992; Glud, 2008). In contrast, DOU is calculated from oxygen microprofiles profiles in the sediment and mainly assesses microbial respiration (Glud et al., 1994; Wenzhöfer and Glud, 2002). Since macrofauna is dominant in shelf sediments, whereas bacteria and meiofauna dominate at greater depths (Rowe et al., 1991) the differences between TOUsed and DOU should decrease with increasing water depth (Glud et al., 2000; Glud, 2008; Sørensen et al., 2015).
Besides differences in TOUsed and DOU, benthic remineralization rates between shelf and deep-sea habitats may also vary depending on the Arctic region, hampering pan-Arctic predictions based on local studies. For example, benthic remineralization rates are ultimately dependent on a combination of factors, of which water depth and chlorophyll pigments in the sediment (as an indicator of phytodetritus) were shown to be the most important ones (Boetius and Damm, 1998; Bourgeois et al., 2017). However, the availability of phytodetritus is dependent on regional factors, such as nutrient availability and sea-ice conditions (Grebmeier et al., 2006; Arrigo et al., 2008; Hoffmann et al., 2018).
A few studies have recently improved our understanding of benthic oxygen uptake and the respective influence of environmental predictors in the Arctic Ocean (Cathalot et al., 2015; Bourgeois et al., 2017; Hoffmann et al., 2017, 2018). Still, the prevailing lack of measurements in the central Arctic Ocean (as well as for the Russians Seas and main Arctic rivers) stresses the need for further investigations in these areas to provide a benchmark and to confirm and sharpen models of pan-Arctic sedimentary oxygen demand and food supply.
To estimate the impact of environmental changes on benthic remineralization as an important ecosystem function, we need to set a baseline for sediment oxygen consumption rates in shelf and deep-sea habitats and identify drivers for regional differences across the Arctic. Here, we address this knowledge gap by contrasting benthic oxygen uptake (TOUsed and DOU) and selected environmental parameters between the Barents Sea Shelf and the deep central Arctic Ocean, and comparing those to previously published measurements from the Beaufort and Laptev Sea. We specifically address the following three questions: (1) How large are variations in TOUsed, DOU and environmental parameters among the Barents Sea shelf and the central Arctic deep sea? (2) How much of the variability in TOUsed and DOU can be explained by environmental proxies and microbial abundance? (3) How do variations in benthic activity and environmental parameters among shelf and deep seas compare across different regions in the Arctic Ocean?
Materials and Methods
Study Area
The Arctic seas are characterized by low water temperatures, seasonal ice cover among most shelf seas and long lasting ice cover above the basins. Furthermore, seasonal fluctuations in solar irradiation determine patterns of primary production (Piepenburg, 2005). Differences in primary production found in the literature illustrate a latitudinal gradient, representing the distinctness between Arctic shelf and deep seas (Codispoti et al., 2013). Primary production rates vary from highest values in the Barents Sea, with 110 g C m–2 a–1 (Sakshaug, 1997), to lowest values found in the central Arctic, where for the Lomonosov Ridge values of 18 g C m–2 a–1 have been estimated (Harada, 2016).
Stations in the Barents Sea and central Arctic Ocean were investigated during RV Polarstern expedition PS 94 between August and October 2015, hereafter referred to as “this study.” During the cruise, a total of 12 stations were sampled, five of which located on the Barents Sea shelf and seven in the central Arctic deep-sea basin (Table 1 and Figure 1). Shelf stations are hereafter also referred to as Barents Sea and deep-sea stations as the central Arctic Ocean. In Tables 1, 2, station names are reported following the regulations of the PANGAEA data repository; throughout the text, we only report the station numbers (e.g., 20 instead of PS94/020-2).
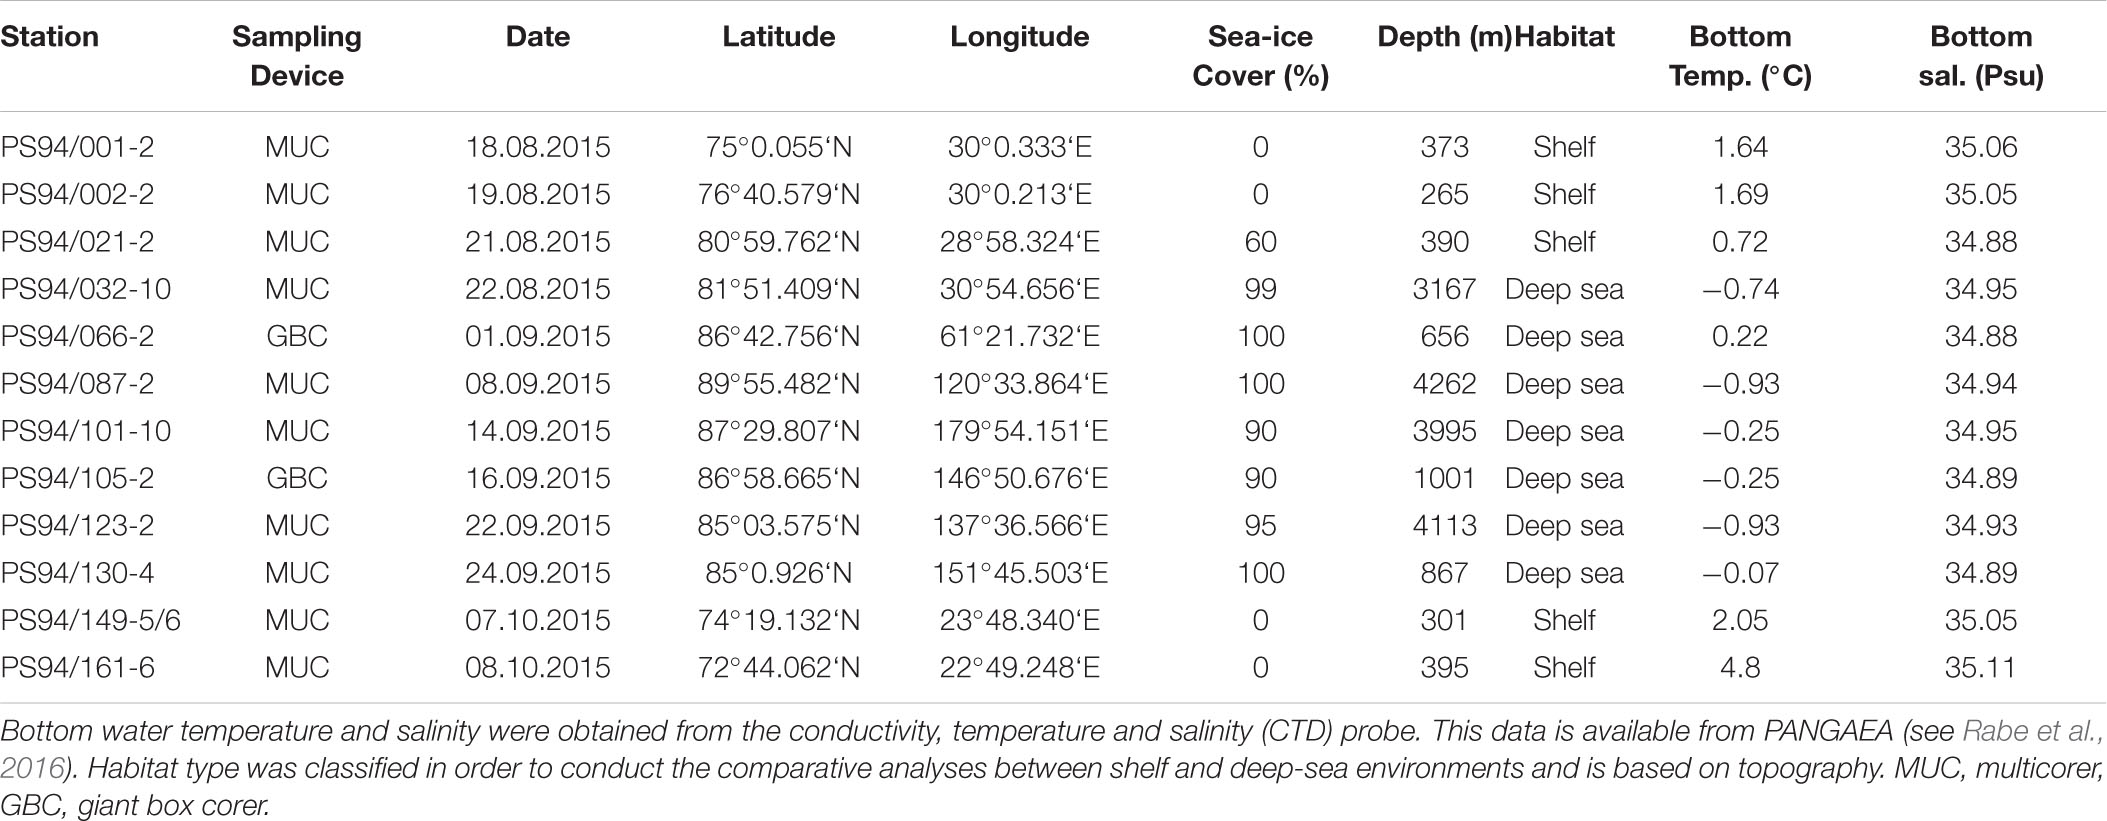
Table 1. List of stations and metadata of PS94.
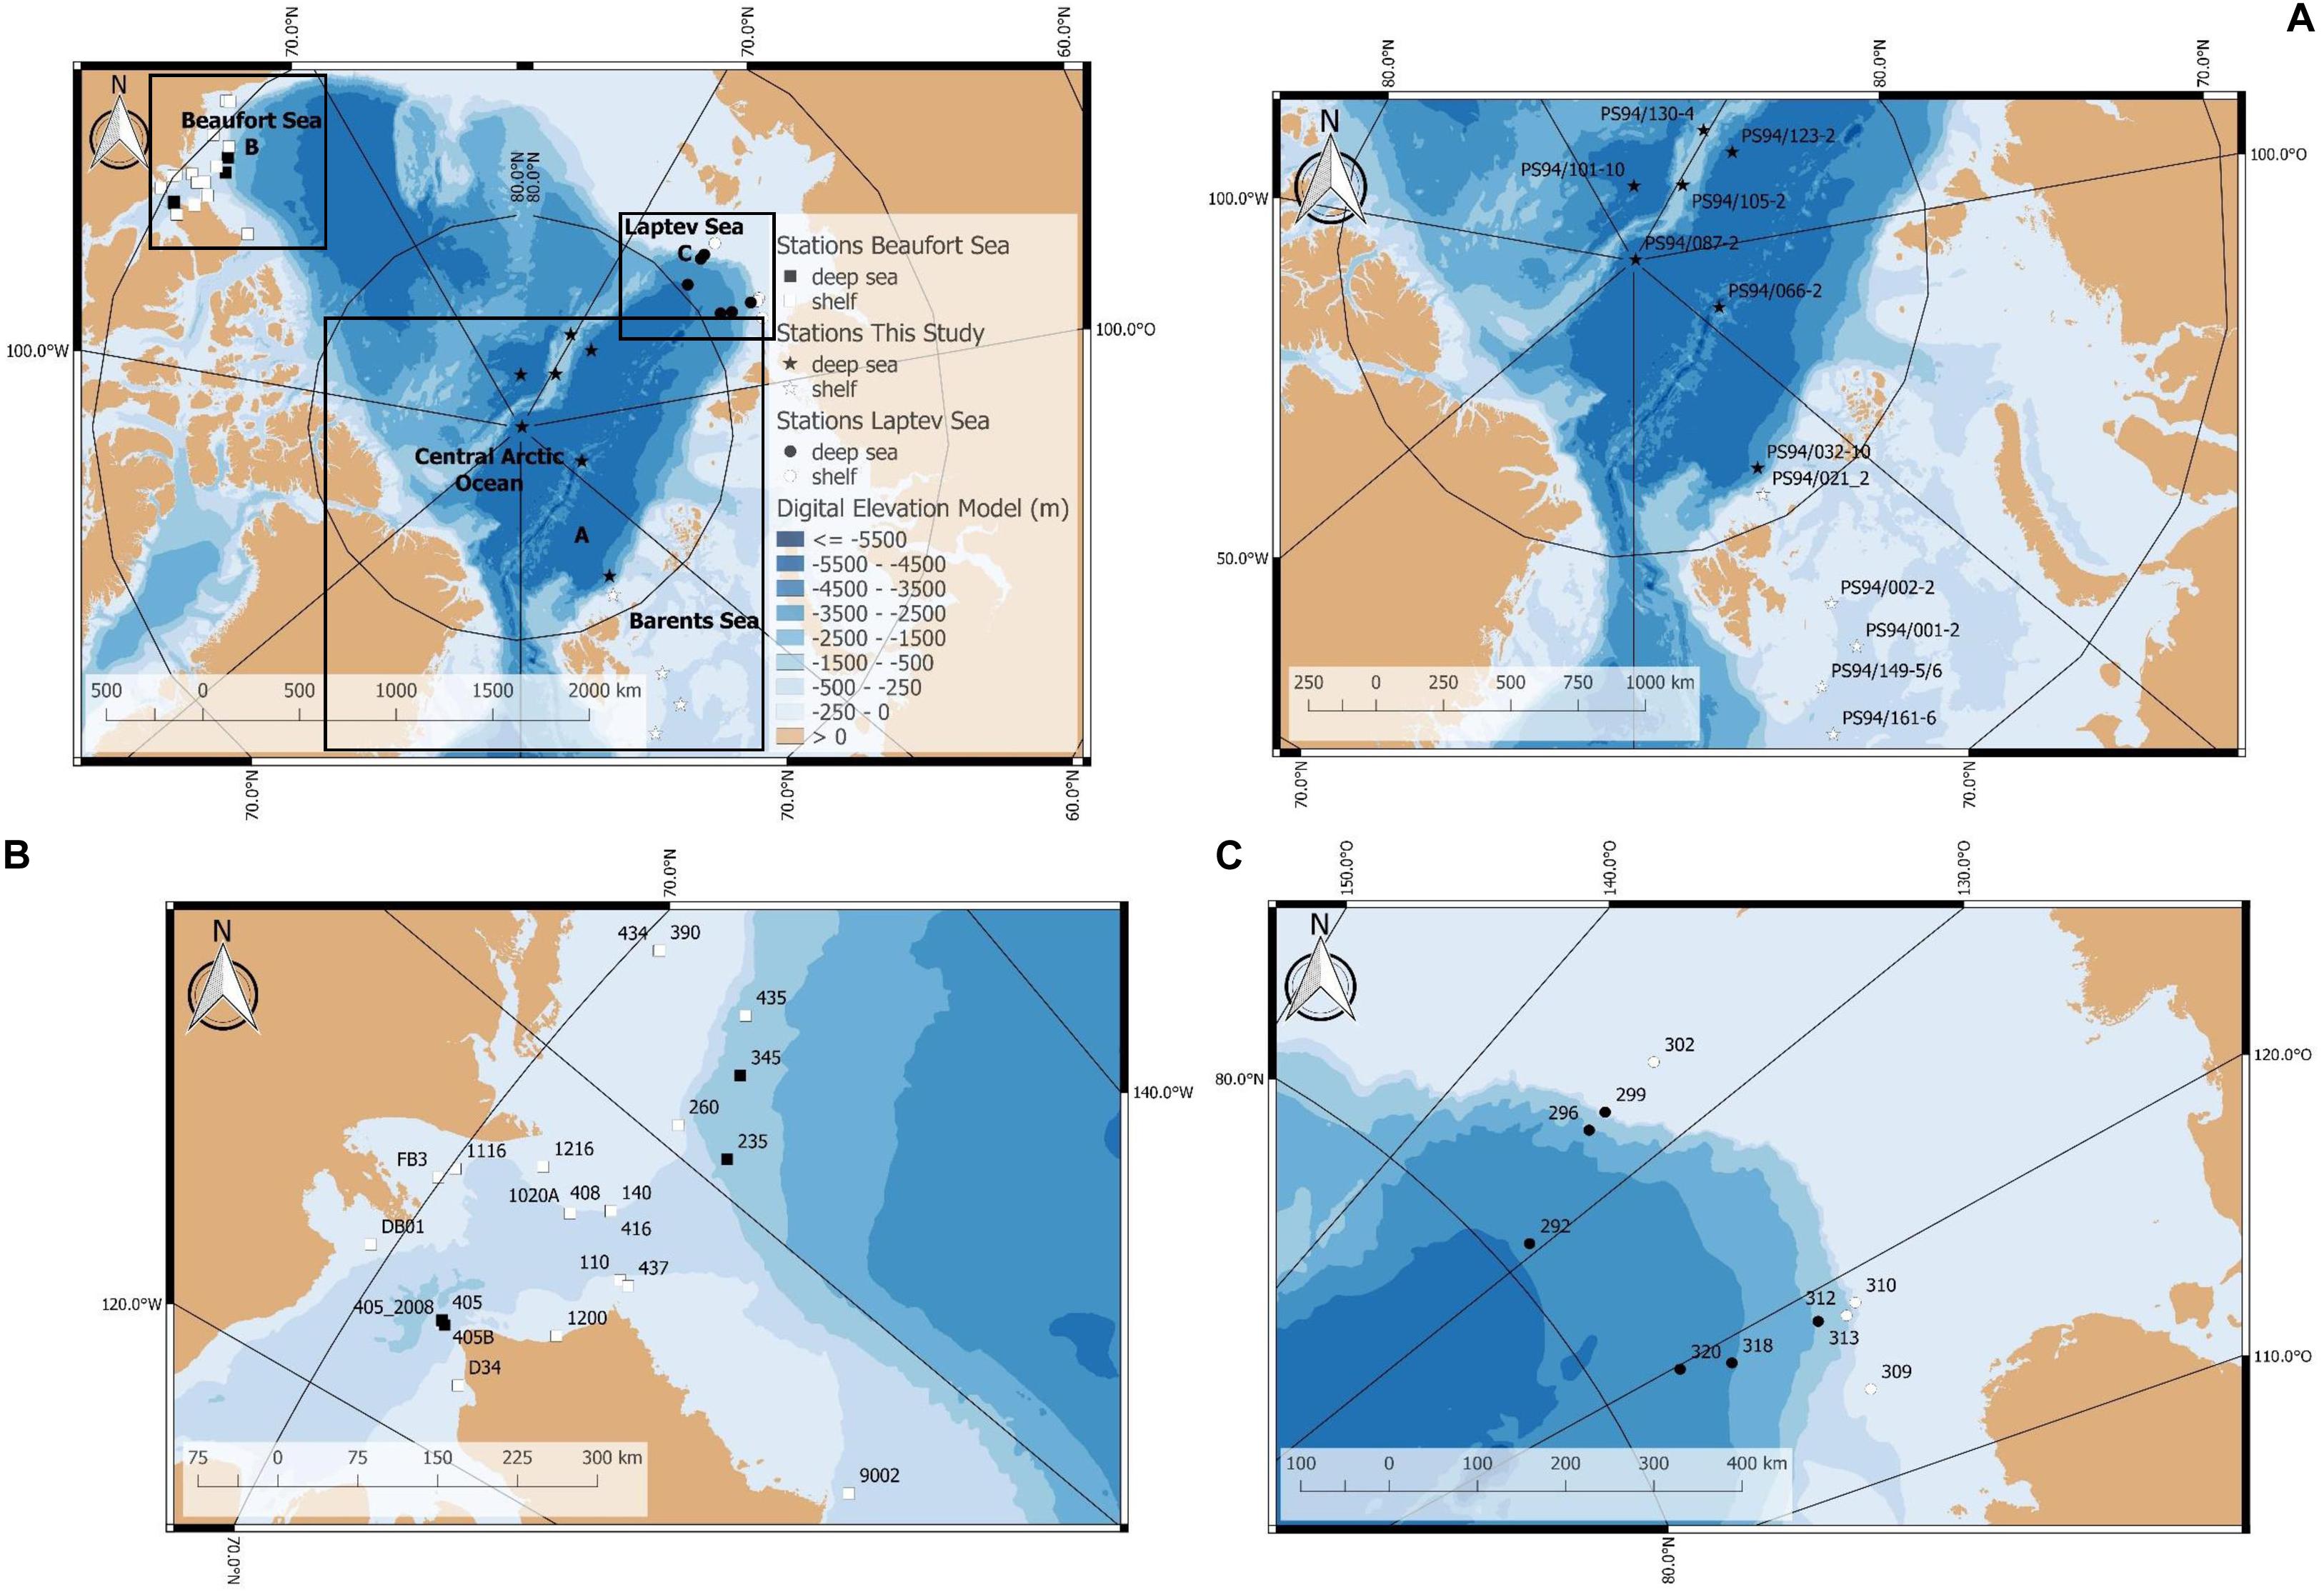
Figure 1. Map of stations sampled for this study (PS94) and comparative datasets from two previous surveys from the Laptev and Beaufort seas. (A) Stations sampled for this study during RV Polarstern expedition PS94 in 2015 (stations on the map indicated by stars), (B) stations sampled in the Beaufort Sea in 2008 and 2009 (stations indicated by squares), and (C) stations sampled in the Laptev Sea during RV Polarstern expedition PS80 in 2012 (stations indicated by circles). The underlying bathymetric chart was provided by Jakobsson et al. (2012).
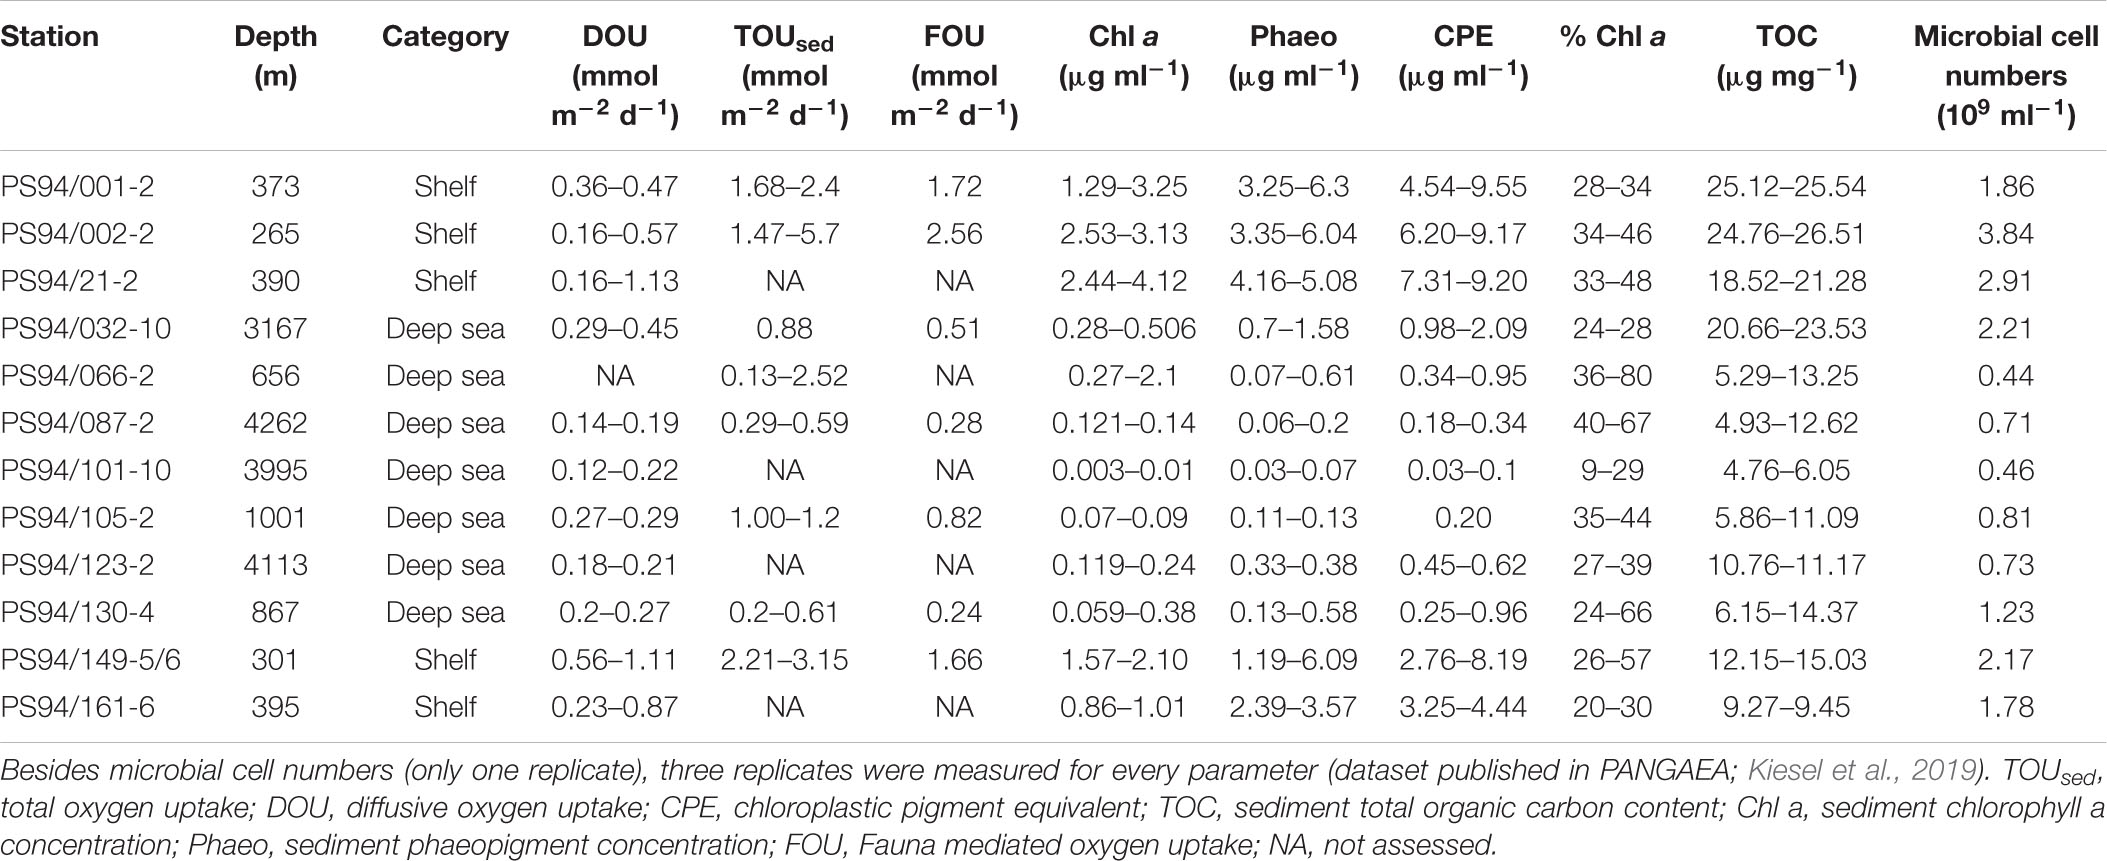
Table 2. Range of all parameters assessed during PS94 (min/max).
Some stations in the central Arctic deep sea are particularly noteworthy. One of them constitutes station 32, which was measured at 3167 m water depth, situated at the foot of the Barents Sea slope. The Barents Sea is considered a “flow through shelf”, a major passage for waters from the North Atlantic which enter the central Arctic Ocean. It comprises 49% of the total pan-Arctic shelf primary production (Sakshaug, 2004; Wassmann et al., 2006). Another exceptional deep-sea station (66) was located on the edge of the Gakkel Ridge, on top of the Karasik Mountain. This site is comparatively shallow with 656 m, but also unique in its setting on top of a lapsed volcano. Stations 105 and 130 are situated on the Lomonosov Ridge. At the time of sampling, all shelf stations (except station 21) had no ice cover, while deep-sea stations were ice-covered (Table 1).
In order to investigate regional differences in DOU, TOUsed and environmental parameters, we further analyzed comparable measurements from the Beaufort (measured 2008/9) (Link et al., 2019) and the Laptev Sea (measured in 2012) (Bienhold and Boetius, 2016, 2018a,b; Wenzhöfer et al., 2018). For information on the methods used by both studies to measure the parameters presented in this article, we refer to the respective publications.
General Sampling
Undisturbed sediment samples were collected by deploying both a multiple corer (MUC) (Barnett et al., 1984) and a giant box corer (GBC) (Table 1). The MUC was equipped with eight core liners, each with an inner diameter of 9.4 cm and 50 cm length. After MUC retrieval, replicate sediment cores with a visibly intact sediment surface were chosen for further laboratory analysis. The GBC retrieves an undisturbed and coherent patch of seafloor sediments (50 × 50 × 30 cm) with bottom water on top. Replicate cores were taken from the GBC on board by using the same core liners as for the MUC. Overall, six replicate cores where taken from the MUC and the GBC, respectively, three of which were used for measuring diffusive oxygen uptake rates and selected environmental parameters (see sections “Chlorophyll Pigment Analyses,” “Total Organic Carbon,” and “Microbial Cell Numbers”) and three to derive total oxygen uptake rates. The selected cores were closed with a bottom lid and carefully pushed up with an extruder, so that the overlying water phase had a height of about 15 cm. Afterward cores were brought to the laboratory for further analysis of diffusive and total oxygen uptake rates, as well as for taking sediment samples for the subsequent analysis of environmental parameters. Bottom water temperature and salinity were derived from CTD (conductivity, temperature and depth) measurements, which were taken at the same location as MUC or GBC samples. CTD data (Rabe et al., 2016) and all further data from this study are available from PANGAEA (Kiesel et al., 2019).
Diffusive Oxygen Uptake
We assessed diffusive oxygen uptake rates by measuring ex situ porewater oxygen microprofiles in retrieved sediment cores. After retrieval and preparation on deck, three cores were immediately taken to a temperature-controlled water bath and kept at a constant temperature of 2°C. After placing the cores in the water bath, a magnetic stirring device was implemented in each core to homogenize the overlying water column and to create a diffusive boundary layer (DBL) that was similar to in situ conditions (Wenzhöfer et al., 2001).
In each of the three sediment cores one oxygen microprofile was measured within the first 2 to 3 h after core recovery (n = 3 per station), except stations 32, 87, 105, and 123, where only two profiles could be obtained. Two types of fiber-optical needle sensors, OXR50 (tip diameter 50 μm, response time (t90) < 2 s) and OXR230 (tip diameter 230 μm, response time (t90) < 2 s; both from Pyroscience, Germany) were used. All sensors were two-point calibrated (zero and 100% air saturation) at 2°C with bottom water taken from the rosette. Afterward, the sensors were connected to a Firesting O2 oxygen meter (Pyroscience, Germany). Oxygen microprofiles were measured with a vertical resolution of 100 μm controlled by a motor-driven micromanipulator, with resting time per data point of 5 s. Total profile length was programmed to be 6.5 cm. Examples of four microprofiles are shown in the Supplementary Material (Supplementary Figure S1).
The diffusive oxygen uptake (DOU in mmol m–2 d–1) was calculated from the obtained microprofiles using the linear O2 concentration gradient in the DBL applying Fick’s first law of diffusion (Jørgensen and Revsbech, 1985; Glud et al., 1994; Boetius and Damm, 1998; Wenzhöfer and Glud, 2002; Jørgensen et al., 2005):
where D0 (cm–2 s–1) is the molecular diffusion coefficient, recalculated to the temperature of the water bath and its salinity, taken from Schulz and Zabel (2006). C (μM) is the solute O2 concentration at depth z (cm) within the DBL.
Total Sedimentary Oxygen Uptake (TOUsed)
Total Sedimentary Oxygen Uptake rates were assessed by conducting sediment core incubations. After MUC retrieval and sediment core preparation on deck, three cores were taken to a dark, temperature-controlled laboratory that was refrigerated to 2–4°C. Incubation procedure generally followed the approach described by Link et al. (2013a, b). At the onset of each incubation, sediment cores were carefully topped with bottom water from the same station, taken from the rosette. Additionally, three control cores, which were exclusively filled with bottom water, were established. Cores were acclimatized for 6 to 8 h, while being saturated with air to avoid suboxic conditions during incubation (Link et al., 2013b). After acclimatization, cores were hermetically closed and a magnetic stirring device was implemented in each core. The magnetic stirring device was used to homogenize the water column without resuspending the sediment as turbulence or currents are known to affect benthic oxygen uptake rates (Hall et al., 1989; Link et al., 2013b). Oxygen was periodically measured a few centimeters above the sediment surface, with an optical sensor spot attached to the inner liner wall and measured with a non-invasive optical probe (Fibox 3 LCD, PreSens, Regensburg, Germany). Measurements were repeated every 5 to 6 h for overall 2 to 4 days. Only those measurements were considered, where oxygen concentration had not fallen below 70%, in order to avoid the influence of suboxic conditions on the oxygen uptake rates. TOU (mmol m–2 d–1) from the retrieved sediment core and overlying bottom water was calculated from the slope of the linear regression of the oxygen concentration change (dC) over the incubation time (dt), taking the area enclosed by the microcosm (Ach) as well as the bottom water volume Vbw into consideration (Link et al., 2011, 2013a,b).
To estimate the total sedimentary oxygen uptake (TOUsed), TOU was corrected for the bottom water oxygen uptake (BWU).
An example of a time series core incubation showing the linear regression of oxygen consumption over time is shown in the Supplementary Material (Supplementary Figure S2).
Fauna Mediated Oxygen Uptake (FOU)
Since DOU mostly assesses microbial respiration (Glud et al., 1994; Wenzhöfer and Glud, 2002) and TOUsed additionally involves oxygen consumption by meio- and macrofauna, we used the difference between both (TOUsed–DOU) as a proxy for fauna-mediated oxygen uptake (FOU, Wenzhöfer and Glud, 2002). Since different sediment cores were used for the calculation of DOU and TOUsed, we subtracted mean DOU of each station from mean TOUsed of the same station, which is why only one replicate per station exists. Using the difference between TOUsed and DOU as a proxy for FOU has been suggested previously by many studies, which have shown that FOU correlates with the biomass of benthic fauna (Archer and Devol, 1992; Glud et al., 1994, 1998; Wenzhöfer and Glud, 2002).
Chlorophyll Pigment Analyses
Three subsamples from three different cores were obtained per station, taking the top first cm of sediment using cut-off 5 ml plastic syringes. Samples for chlorophyll pigment analyses were stored dark and frozen at −20°C until further analyses in the home laboratory. Chlorophyll pigments were extracted from 1 ml sediment in 90% acetone, after addition of glass beads and grinding in a cell mill (Vibrogenzellmühle VI 6, Edmund Bühler GmbH). Extraction was repeated three times. After each extraction, samples were centrifuged and after each of the three extraction steps, 2 ml of supernatant were collected and combined for the subsequent measurement. Concentrations of chlorophyll a and phaeopigments (after acidification with 20% hydrochloric acid) were determined with a Turner Trilogy fluorometer (Turner Designs), equipped with a “Chlorophyll a – Acidification fluorescent module” (excitation at 485 nm, emission at 685 nm). The sum of chlorophyll a and phaeopigments (Phaeo) is expressed as chloroplast pigment equivalents (CPE). The proportion of chlorophyll a from CPE (% Chl a) is an indicator of the freshness of phytodetritus (Pastor et al., 2011). Pigment concentrations are provided in μg ml–1 sediment.
Total Organic Carbon
Three subsamples from three different cores were also obtained per station, taking the top first cm of sediment using cut-off 20 ml plastic syringes. Samples were stored frozen at −20°C until further analyses in the home laboratory. Samples of at least 1 g were lyophilized and homogenized using a mortar and pestle. The total carbon content of sediment samples was determined in about 20 mg of dried sample material by combustion and gas chromatography with a Carlo Erba NA-1500 CNS elemental analyzer. An aliquot of the freeze-dried sample material was acidified with hydrochloric acid (6–10 mol l–1) to remove the fraction of inorganic carbon and to determine the total amount of organic carbon (TOC).
Microbial Cell Numbers
For the determination of prokaryotic cell numbers, 1 ml sediment was fixed with sterile filtered formalin/seawater at a final concentration of 2% and stored at 4°C until further analyses in the home laboratory. Samples were 4,000-fold diluted and filtered on 0.2 μm polycarbonate filters, stained with acridine orange (Meyer-Reil, 1983), and counted using an epifluorescence microscope (Axiophot II Imaging, Zeiss, Jena, Germany). For each sample, 30 random grids from two replicate filters were counted and averaged.
Statistical Analyses
All stations were categorized by region, i.e., separating samples from this study (central Arctic and Barents Sea), the Beaufort Sea (Link et al., 2013a, 2019) and the Laptev Sea (Bienhold and Boetius, 2016, 2018a,b; Wenzhöfer et al., 2018), and further divided into shelf (ranging from 45 m – 520 m) or deep-sea (5200 m – 546 m) sites, which in the following we refer to as habitats. Stations of this study varied from 265 to 395 m on the shelf and from 656 to 4262 m in the central Arctic deep sea. In the Beaufort Sea, 19 stations on the shelf varied from 45 to 400 m and from 546 to 596 m in the deep sea (five stations). Stations in the Laptev Sea varied from 57 to 520 m on the shelf (four stations) and between 774 and 3437 m in the deep sea (six stations). For a summary of the stations and parameters sampled in each region see Supplementary Table S1 in the Supplementary Material. The differentiation between shelf and deep-sea sites of all three regions was based on water depth and topography.
We tested for significant differences in benthic oxygen uptake (DOU and TOUsed) and environmental parameters (Chl a, CPE, % Chl a, TOC, and microbial cell numbers) between shelf and deep-sea habitats (Question 1). The same approach was used in order to test for differences between the three regions (Question 3). None of the parameters were normally distributed or homoscedastic. We thus used a non-parametric Kruskal–Wallis test to test for differences between the three regions and a Wilcoxon rank sum test to test for differences between the two habitat types, i.e., shelf and deep sea.
Additionally, a partitioning of the variation in DOU (n = 11) and TOUsed (n = 8) measurements between different environmental parameters was performed across all stations from this study (including both shelf and deep-sea stations). We tested different variation partitioning models using the following combinations of environmental parameters to explain variations in DOU and TOUsed. Models 1–3 included CPE or Chl a or % Chl a, TOC, microbial cell numbers and bottom water temperature. Models 4–6 included CPE or Chl a or % Chl a, TOC and microbial cell numbers. Chl a, Phaeopigments and CPE were inherently all highly correlated (Pearson correlation >0.9, p < 0.01 for all pairwise comparisons), while % Chl a was not correlated to any of the other pigment parameters. Variation partitioning models were thus tested using CPE as an estimate of total pigments and Chl a as well as % Chl a as an indicator for fresh phytodetrital material. CPE and Chl a were log10-transformed to normalize their distribution prior to subsequent analyses. In this paper, we only refer to those models, which were overall statistically significant (models 1 and 2), while the results of other models are provided as Supplementary Material (Supplementary Table S2). We did not include water depth in the models, since our data shows the bimodal distribution between shelf and deep sea. For discussion purpose only, we did, however, test the simple correlations between water depth and DOU, TOU as well as the environmental parameters (see Supplementary Figure S3). For additional information about covarying parameters we also tested for simple correlations between microbial cell numbers and DOU, CPE, phaeopigments and Chl a. Variation partitioning was conducted according to Legendre (2008). Analyses were performed in RStudio version 1.1.447, using the package vegan (Oksanen et al., 2019) and custom R scripts.
Results
How Large Are Variations in TOUsed, DOU and Environmental Parameters Between the Barents Sea Shelf and the Central Arctic Deep Sea?
Benthic Activity (DOU, TOUsed, and FOU)
During this study, highest DOU rates were measured on the Barents Sea shelf. Here, DOU ranged from 0.16 mmol m–2 d–1 at stations 2 and 21 (265 and 390 m) to 1.13 mmol m–2 d–1 at station 21 (390 m), with a mean value of 0.59 mmol m–2 d–1. At deep-sea stations in the central Arctic, values varied from 0.12 mmol m–2 d–1 at station 101 (3995 m) to 0.45 mmol m–2 d–1 at station 32 (3164 m), which is situated at the foot of the Barents Sea slope (Table 2). Mean DOU in the deep sea was 0.23 mmol m–2 d–1. The Wilcoxon rank sum test revealed that DOU on the shelf was significantly different from the deep sea (p = 0.0015) (Figure 2).
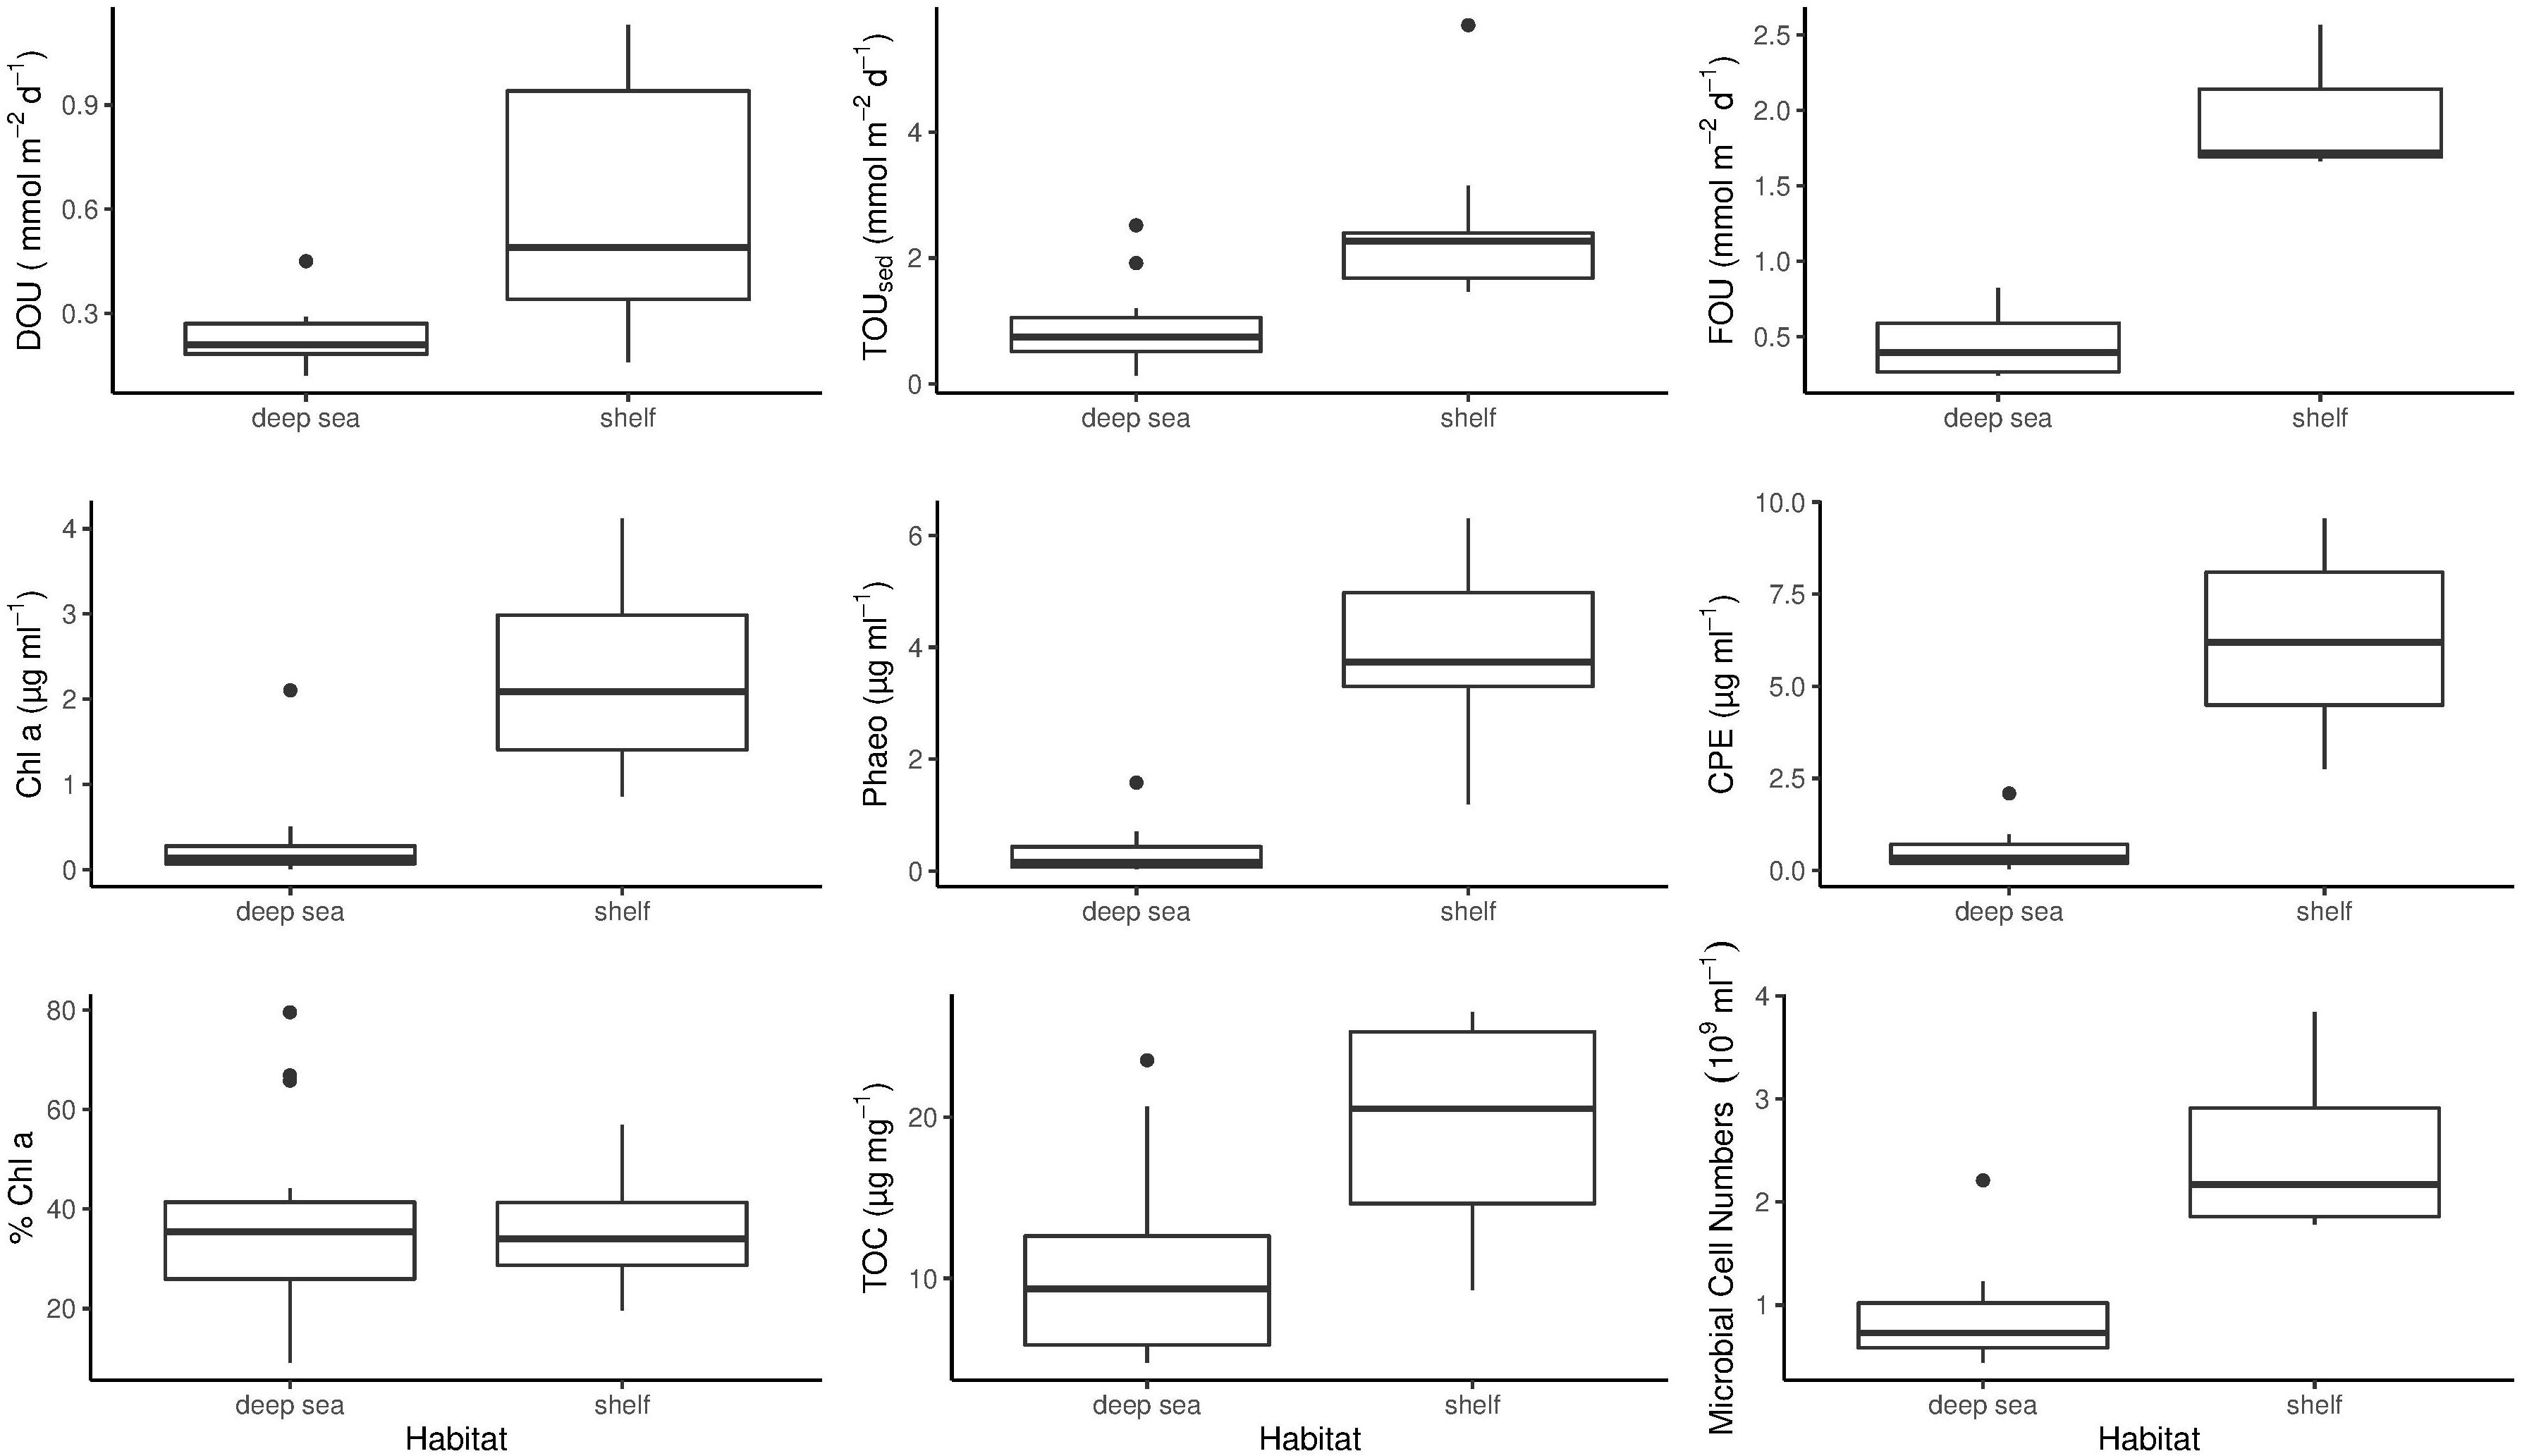
Figure 2. Benthic oxygen uptake and environmental parameters measured during PS94. Differences between shelf and deep-sea habitats are shown. The bottom and top of the box refer to the 25th and 75th percentile, respectively. The centreline constitutes the median and the upper and lower whiskers are calculated as the upper and lower boundary of the box + 1.5 ∗ the interquartile range. Data points outside this range are plotted as outliers. TOUsed, Total oxygen uptake; DOU, Diffusive oxygen uptake; CPE, Chloroplastic pigment equivalent; TOC, Sediment total organic carbon content; Chl a, Sediment chlorophyll a concentration; Phaeo, Sediment phaeopigment concentration; FOU, Fauna mediated oxygen uptake.
On the shelf, benthic activity measured by means of TOUsed was higher compared to DOU. In the Barents Sea, TOUsed rates ranged from 1.47 to 5.7 mmol m–2 d–1, both measured at station 2. Mean TOUsed across shelf stations was 2.53 mmol m–2 d–1 (Table 2). In the deep sea, TOU ranged from 0.13 to 2.52 mmol m–2 d–1, with a mean of 0.9 mmol m–2 d–1. The result of a Wilcoxon rank sum test clarified that the difference between shelf and deep-sea stations was statistically significant (p = 0.0019) (Figure 2).
The importance of macrofauna on sedimentary oxygen uptake, as expressed in FOU, was not significantly different between the Barents Sea shelf and the central Arctic Ocean (Wilcoxon rank sum test p = 0.057) (Figure 2). Highest FOU was measured at station 2 (2.56 mmol m–2 d–1), while lowest FOU was assessed at station 130 on the Lomonosov Ridge (0.24 mmol m–2 d–1). Second lowest FOU was found at station 87 (0.28 mmol m–2 d–1), located at the North Pole. Two deep-sea stations exhibited above average FOU rates. These were station 32 (0.51 mmol m–2 d–1), situated at the foot of the Barents Sea slope and station 105 on the Lomonosov Ridge (0.82 mmol m–2 d–1) (Table 2).
Environmental Parameters
Phytodetritus (chlorophyll pigments)
As for DOU and TOUsed, Chl a concentrations on the shelf were significantly different from concentrations in the deep sea (Wilcoxon rank sum test p < 0.0005) (Figure 2). On the shelf, the lowest concentration was measured at station 161 (395 m) exhibiting 0.86 μg ml–1, while the highest concentration was 4.12 μg ml–1, measured at station 21 (390 m) (Table 2). Mean Chl a concentration on the shelf was 2.22 μg ml–1. In the deep sea concentrations were considerably lower. Here, values ranged from 0 (0.003) to 2.1 μg ml–1 at stations 101 and 66, respectively, and mean concentration was 0.29 μg ml–1.
Phaeopigment concentrations were higher compared to Chl a concentrations, exhibiting mean values of 4 μg ml–1 on the Barents Sea shelf and 0.33 μg ml–1 in the central Arctic deep sea. This difference was statistically significant (p < 0.0005) (Figure 2). On the shelf, phaeopigment concentrations ranged from 1.19 μg ml–1 to 6.3 μg ml–1 and in the deep sea they varied between 0.03 μg ml–1 at station 101 and 1.58 μg ml–1 at station 32 (Table 2).
Chloroplast pigment equivalents on the shelf ranged from 2.76 μg ml–1 at station 149 to 9.55 μg ml–1 at station 1, with a mean concentration of 6.22 μg ml–1. Similar to phaeopigments, minimum concentration in the deep sea was measured at station 101, exhibiting 0.03 μg ml–1, while maximum concentrations were found at station 32, with 2.09 μg ml–1 (Table 2). Mean concentration in the deep sea was 0.51 μg ml–1. The difference between CPE concentrations on the shelf and in the deep sea was significant (Wilcoxon rank sum test p < 0.0005) (Figure 2).
In contrast to any other parameter analyzed in this study, the difference in % Chl a between shelf and deep-sea habitats was not statistically significant (Wilcoxon rank sum test p = 0.98) (Figure 2). % Chl a ranged between 20% (station 161) and 57% (station 149) on the shelf. Mean % Chl a on the shelf was 35%. In the deep sea, values scattered from 9% at station 101 to 80% at station 66, which was measured at the top of the Karasik Mountain at 656 m water depth (Table 2). Mean % Chl a in the central Arctic deep sea was 38%.
Total organic carbon
On the shelf, total organic carbon ranged from 9.27 μg mg–1 at station 161 to 26.51 μg mg–1 at station 2. Average TOC concentration on the shelf was 19.48 μg mg–1. In the deep sea, values scattered from 4.76 μg mg–1 to 23.53 μg mg–1 at stations 101 and 32, respectively (Table 2). Here, mean TOC concentration was 10.1 μg mg–1. The difference between shelf and deep sea was found to be significant (Wilcoxon rank sum test p < 0.0005) (Figure 2).
Microbial cell numbers
On the Barents Sea shelf, microbial cell numbers varied from 1.78 × 10⁹ cells ml–1 sediment at station 161 to 3.84 × 10⁹ cells ml–1 sediment at station 2 with an average of 2.51 × 10⁹ cells ml–1 sediment. In the deep sea, cell numbers were lower and ranged from 0.44 × 10⁹ to 2.21 × 10⁹ cells ml–1 sediment at stations 66 and 32, respectively (Table 2). Mean microbial cell number in the deep sea was 0.9 × 10⁹ cells ml–1 sediment. The difference in microbial cell numbers was significantly different between shelf and deep-sea stations (Wilcoxon rank sum test p = 0.018) (Figure 2).
Overall, highest mean values in Chl a and CPE were measured at station 21, whereas highest values for TOUsed, TOC and bacterial cell numbers were found at station 2 (note that TOUsed was not measured at station 21). Station 2 and station 21 were 480 km apart and located at 265 m and 390 m water depth, respectively. Most of the parameters in the deep sea peaked at station 66, situated on top of the Karasik Mountain (TOUsed, Chl a, % Chl a) and station 32 (DOU, CPE, Phaeo, TOC, microbial cell abundance), the latter situated at the foot of the Barents Sea slope.
How Much of the Variation in TOUsed and DOU Can Be Explained by Environmental Proxies and Microbial Abundance?
Variation partitioning models were tested using different combinations of environmental parameters (Table 3). The model explaining most of the variation in DOU across shelf and deep-sea habitats included CPE, TOC, and microbial cell numbers. The overall model explained 64 % of the total variation in DOU (p = 0.035), with CPE explaining 33% (p = 0.03) and co-variation between all fractions summing up to 31%.
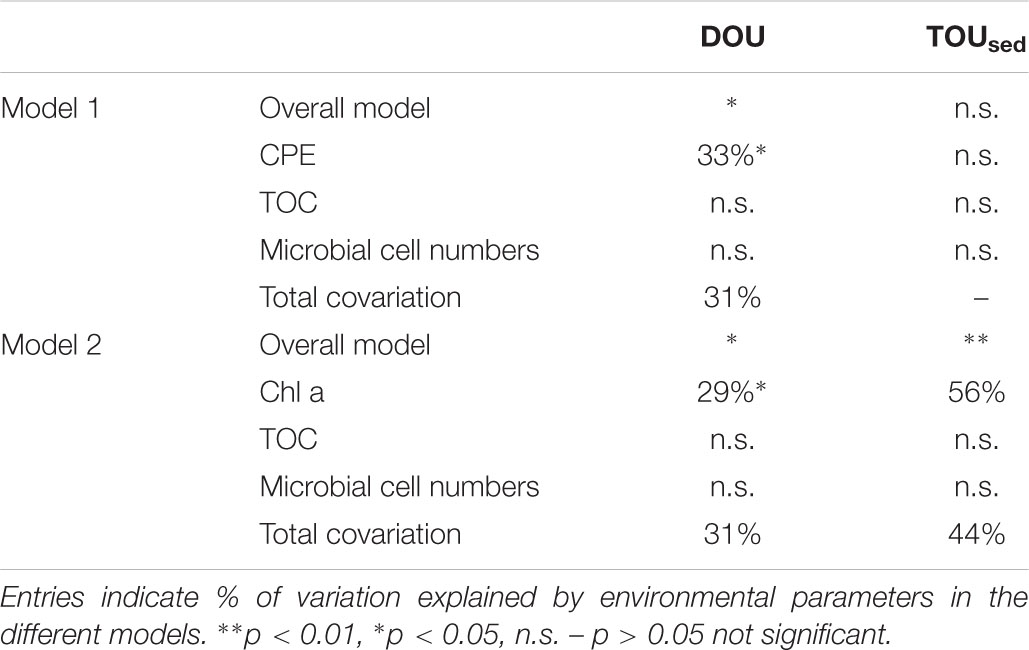
Table 3. Results of partitioning the variation in DOU and TOUsed across shelf and deep-sea stations sampled during Polarstern expedition PS94 (only significant models are shown; for other models tested, see Supplementary Table S2.
For TOUsed the best model included Chl a, TOC, and microbial cell numbers. The overall model was significant (p = 0.008), with Chl a explaining a significant fraction of the variation in TOUsed (56%, p = 0.007). Total co-variation between parameters was 44%. TOC and microbial cell numbers alone did not have significant explanatory power, neither in the models for DOU nor for TOUsed. Bottom water temperature did not explain additional variation in the models we evaluated. Of the environmental parameters tested, chlorophyll pigments (CPE and Chl a) were thus the only parameter with explanatory power. It needs to be noted that the overall number of samples was relatively low (n = 11 for DOU, n = 8 for TOUsed), and results thus need to be treated with caution.
Microbial cell numbers were significantly correlated with Chl a, Phaeo and CPE, respectively (Figure 3), and had a weak but significant relation with DOU (Figure 4).
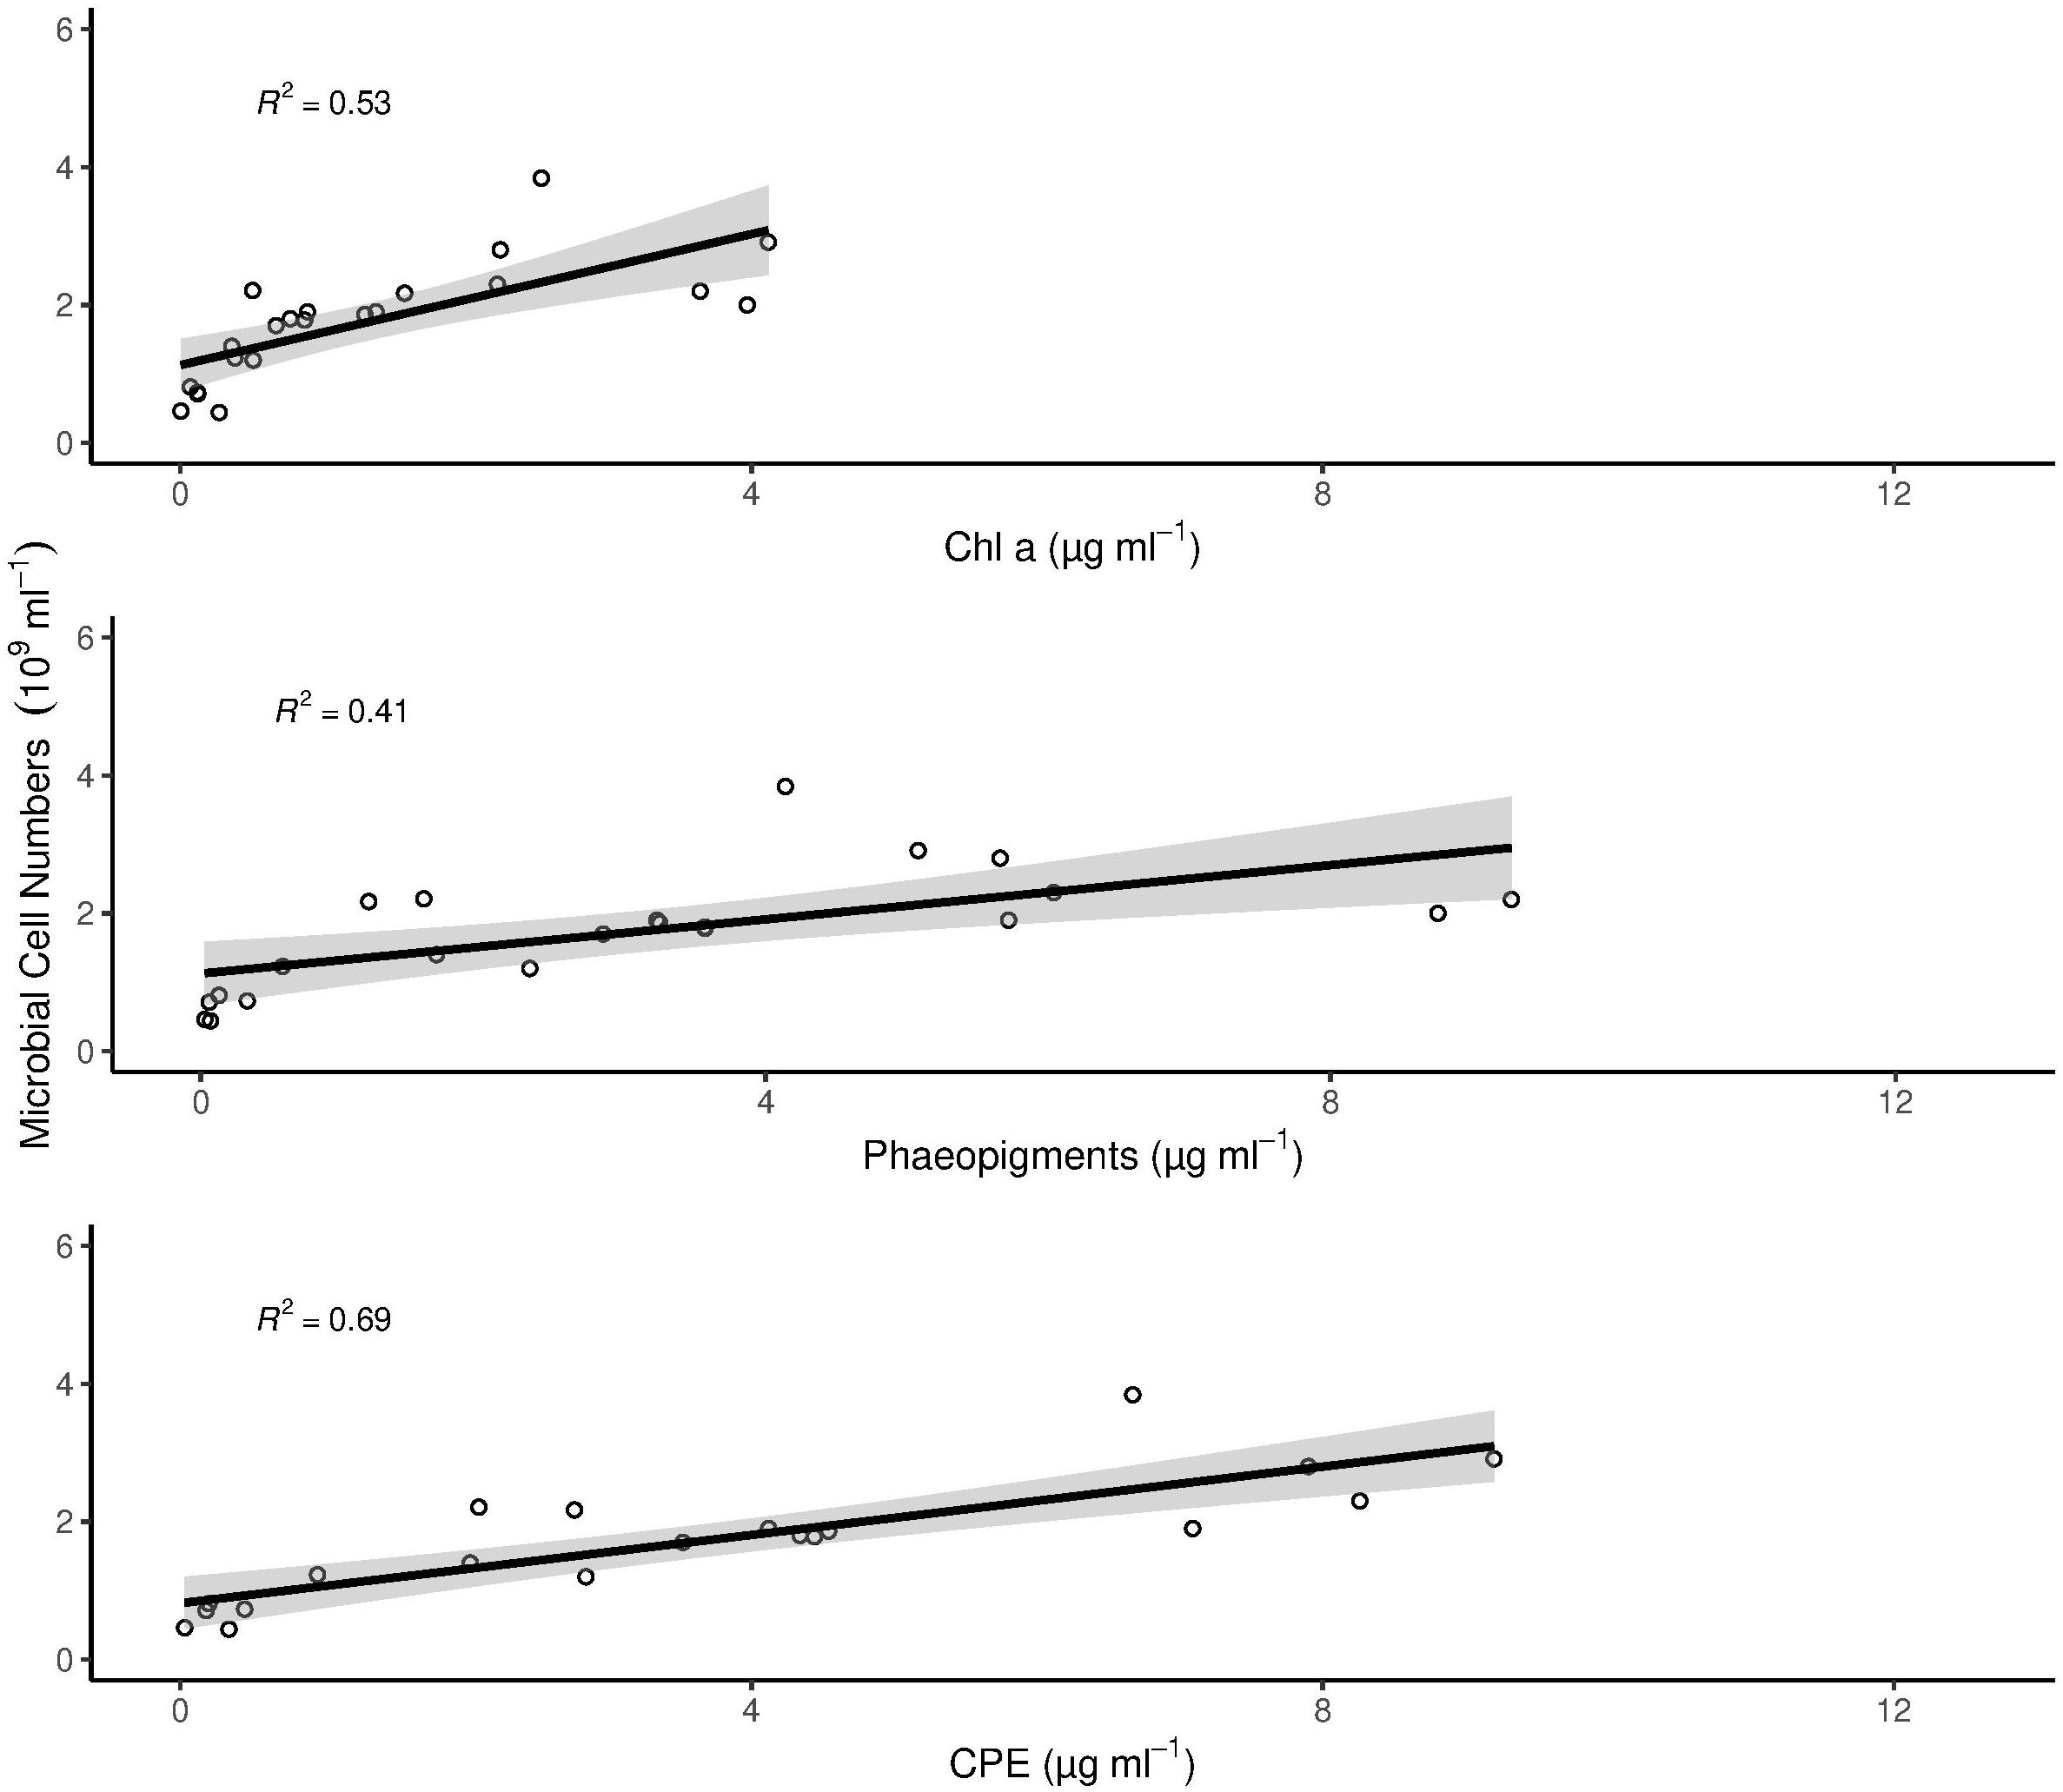
Figure 3. Correlation of chlorophyll pigments with microbial cell numbers. The gray area around the linear model in each panel plot represents the 95% confidence interval. All correlations are statistically significant (p < 0.005). In the figure, multiple R2 is shown. Adjusted R2 for Chl a = 0.5; Phaeopigments = 0.38 and CPE = 0.47.
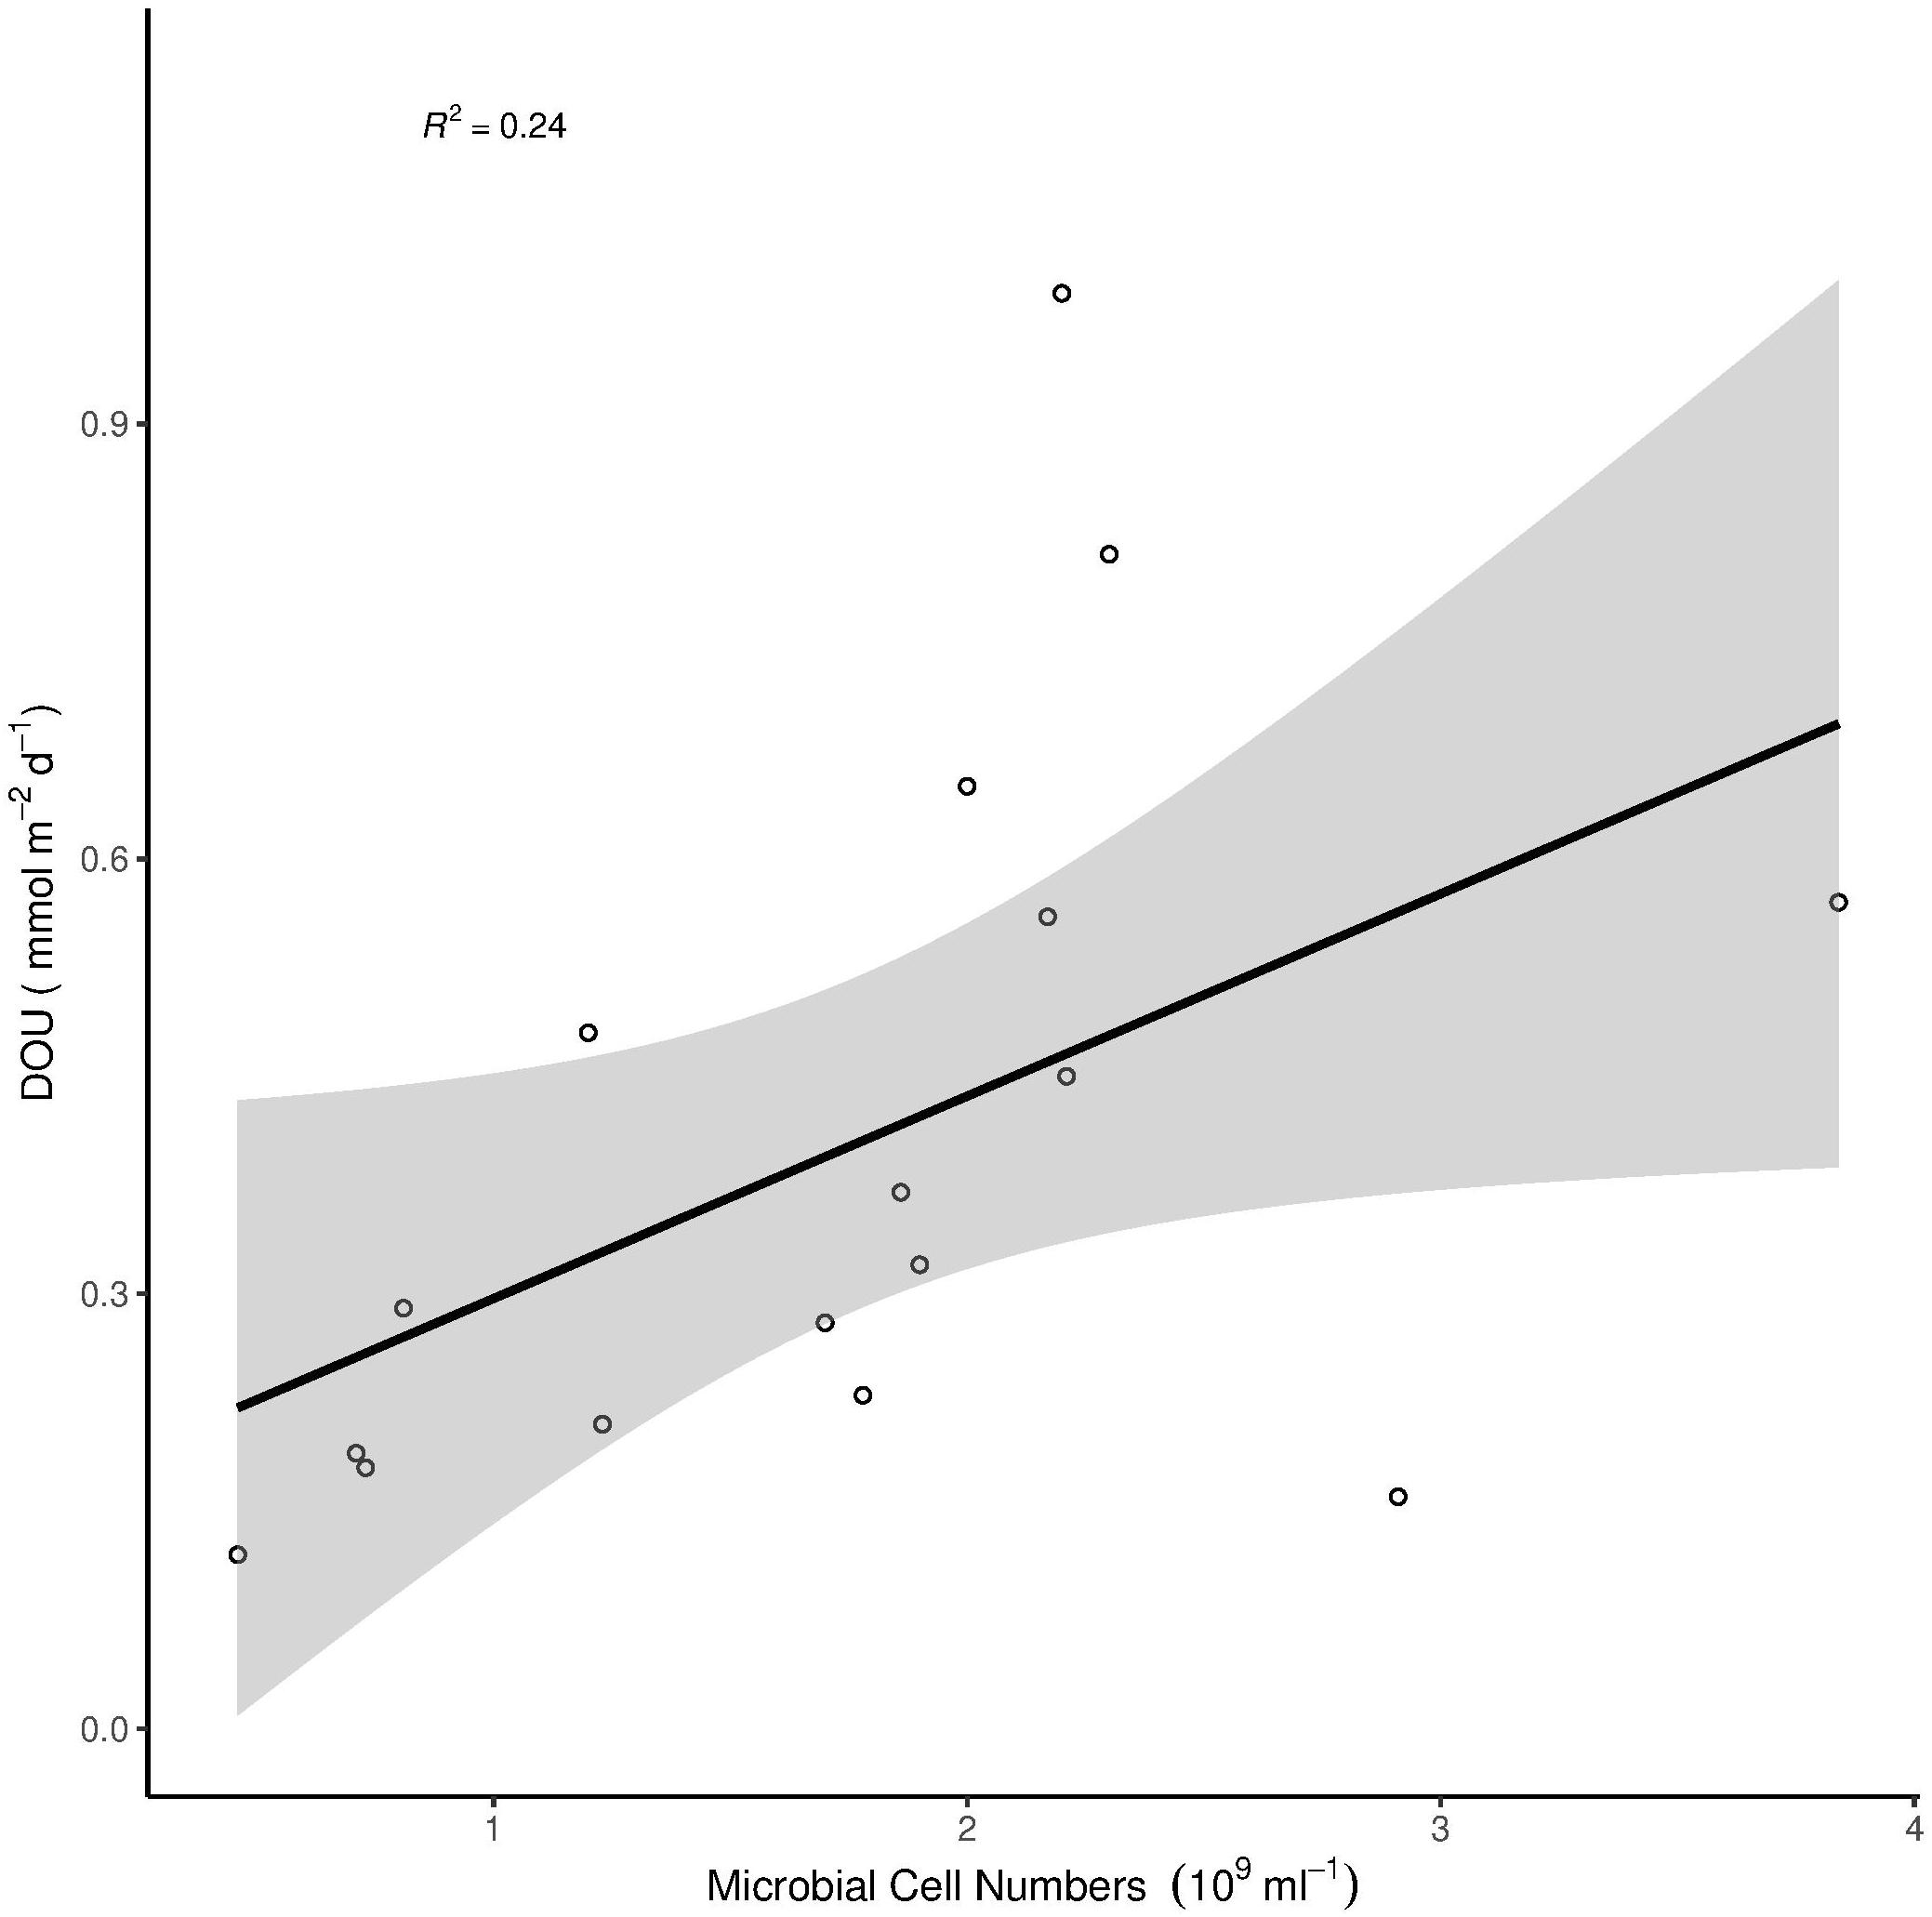
Figure 4. Correlation of DOU with microbial cell numbers. The gray area around the linear model represents the 95% confidence interval. Multiple R2 = 0.24, Adjusted R2 = 0.19, p = 0.046.
How Do Variations in Benthic Activity and Environmental Parameters Among Shelf and Deep Seas Compare Across Different Regions in the Arctic Ocean?
Benthic Activity (DOU and TOUsed)
Diffusive oxygen uptake measurements were available for stations from this study and from the Laptev Sea (Table 4 and Figure 5). In contrast to this study, the Wilcoxon rank sum test revealed that the difference between shelf and deep-sea stations was not statistically significant in the Laptev Sea (p = 0.1). We note, however, that only six values (three per category) were available for this region, which may have compromised the power of the test. The regional comparison revealed similar DOU rates on both shelf habitats (Wilcoxon rank sum test p = 0.43) and significant differences between both deep-sea habitats (p = 0.049). Higher DOU rates in the deep Laptev Sea coincided with higher concentrations of Chl a and CPE (Table 4 and Figure 5). Mean water depth of deep-sea stations measured during this study was 2413 m compared to 2213 m in the deep Laptev Sea.
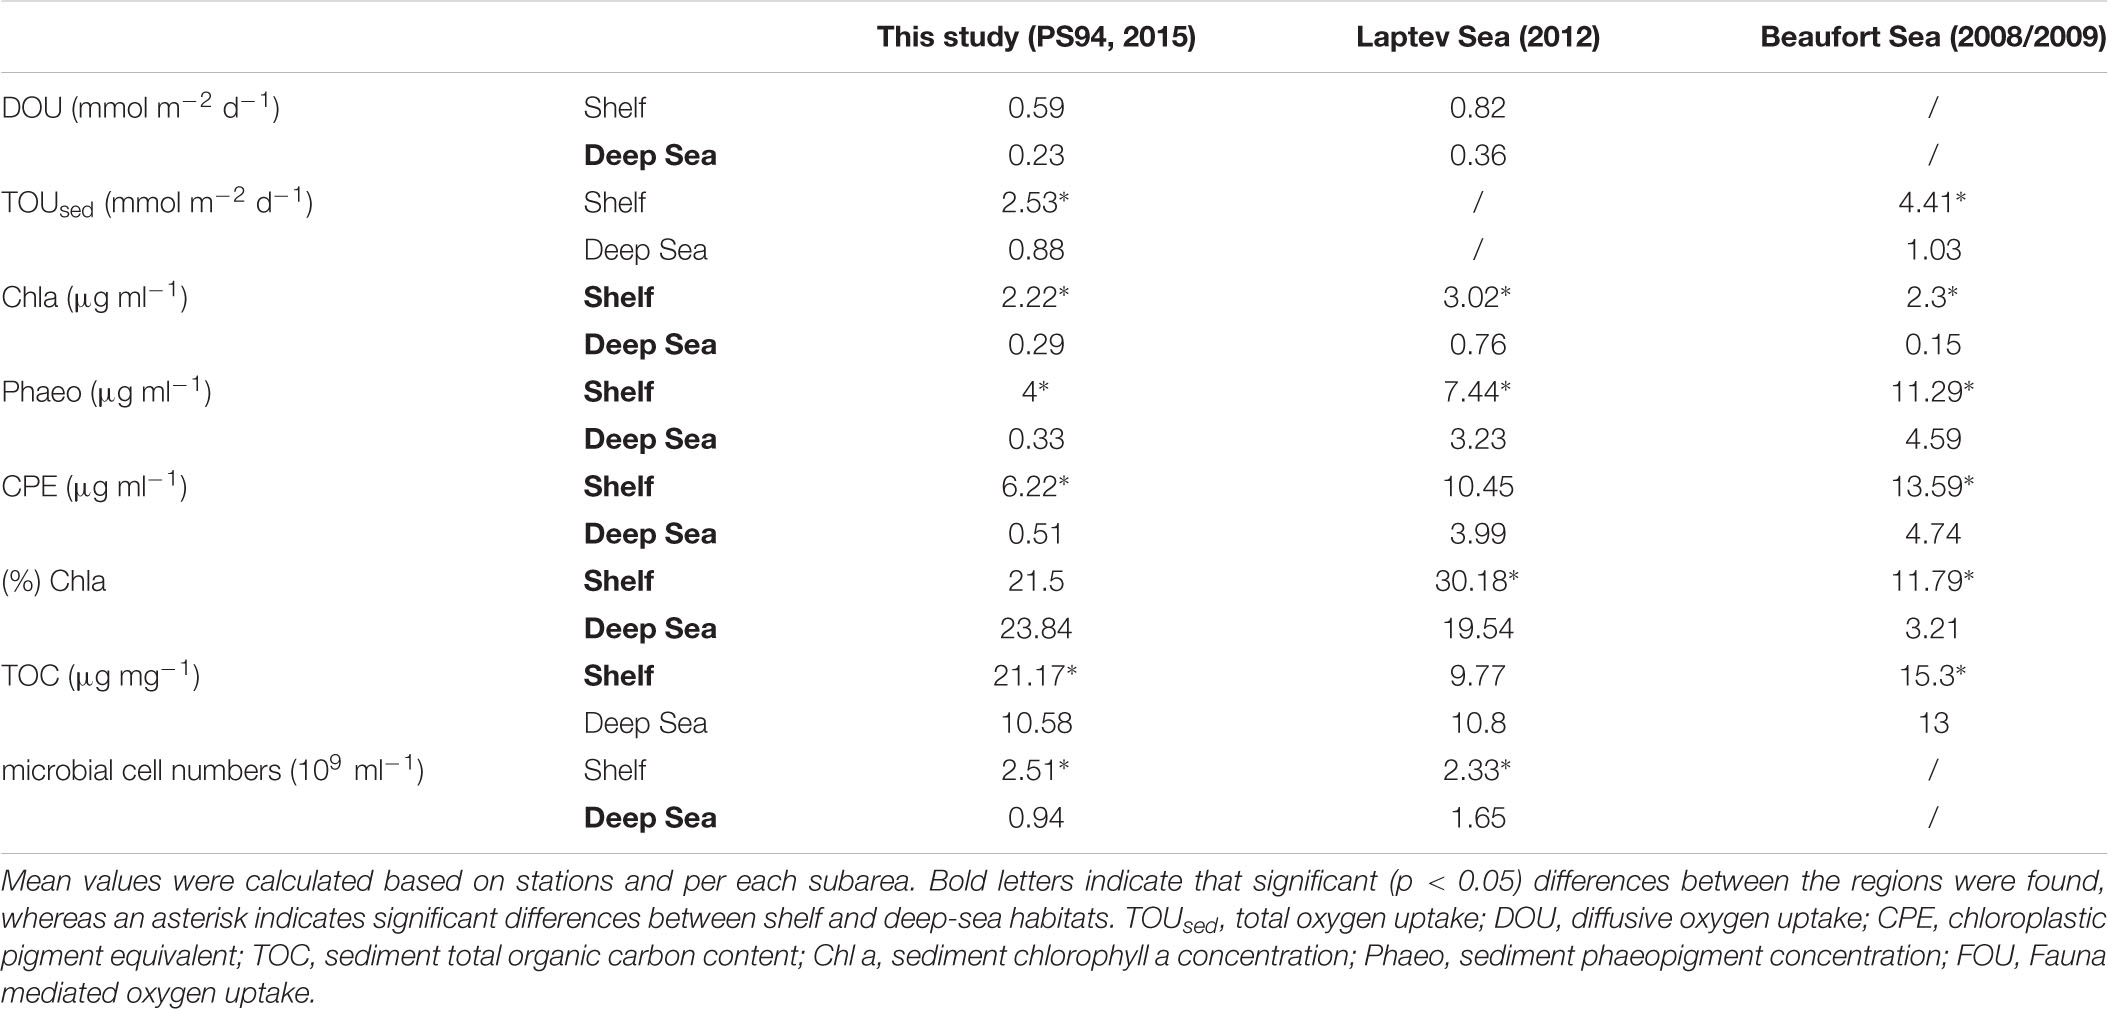
Table 4. Comparison of benthic oxygen uptake and environmental parameters in shelf and deep-sea habitats across the regions of this study, the Laptev and Beaufort Sea.
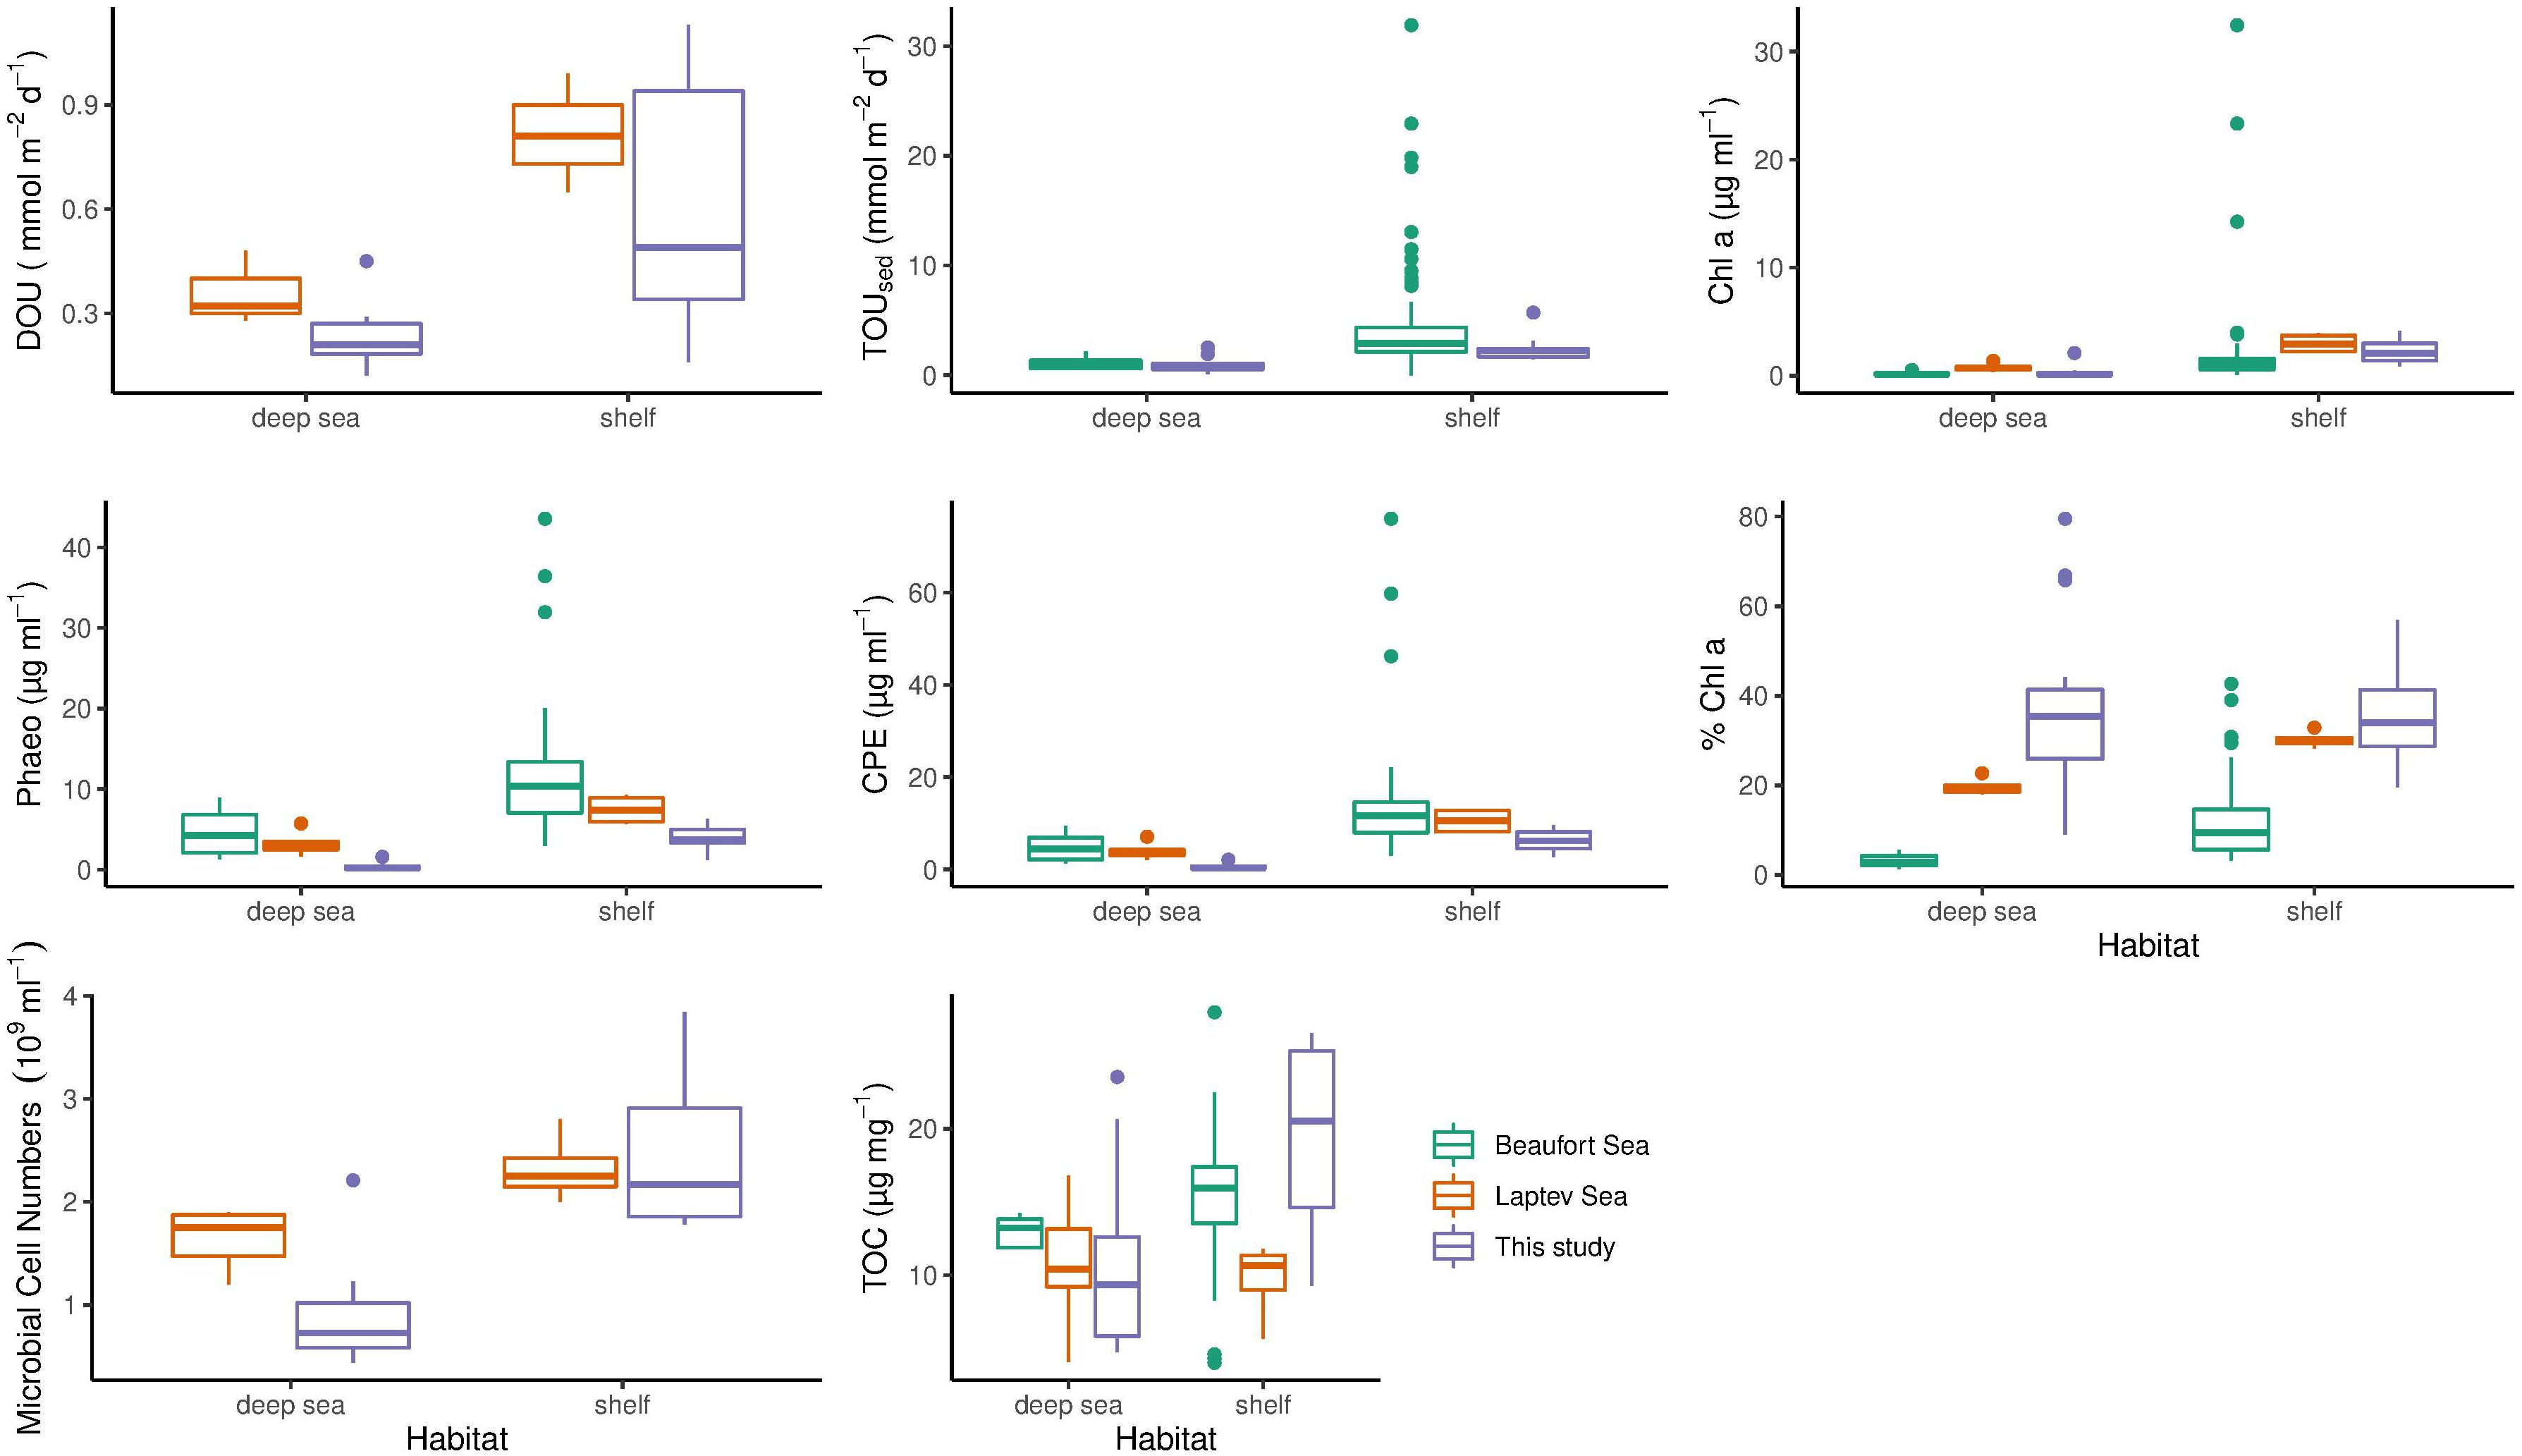
Figure 5. Comparison of benthic oxygen uptake and environmental parameters across the regions of this study (purple boxes), the Laptev (orange boxes) and Beaufort Sea (green boxes). Differences between shelf and deep-sea habitats are shown. The bottom and top of the box refer to the 25th and 75th percentile, respectively. The centreline constitutes the median and the upper and lower whiskers are calculated as the upper and lower boundary of the box + 1.5 * the interquartile range. Data points outside this range are plotted as outliers. TOUsed, Total oxygen uptake; DOU, Diffusive oxygen uptake; CPE, Chloroplastic pigment equivalent; TOC, Sediment total organic carbon content; Chl a, Sediment chlorophyll a concentration; Phaeo, Sediment phaeopigment concentration.
Total sedimentary oxygen uptake rates were available for stations from this study and the Beaufort Sea (Link et al., 2013a, 2019). As for this study, TOUsed in the Beaufort Sea was significantly different between shelf and deep-sea habitats (Wilcoxon rank sum test p < 0.0005). However, similar to DOU, differences between both shelf seas were not statistically significant (Wilcoxon rank sum test p = 0.14). In contrast to DOU, TOUsed rates among both deep seas ranged in the same order of magnitude (p = 0.54). Despite similar TOUsed rates, mean water depth and distance to the shelf were considerably higher in the central Arctic compared to the deep Beaufort Sea.
Environmental Parameters
Phytodetritus (chlorophyll pigments)
As for stations in the Barents Sea and the central Arctic, we also found significant differences in Chl a between shelf and deep-sea habitats for the other two regions investigated (p = 0.01 in the Laptev Sea and p < 0.0005 in the Beaufort Sea). However, regional differences were identified for both shelf (Kruskal Wallis test p = 0.0007) and deep-sea habitats (Kruskal Wallis test p = 0.002). Highest concentrations for both habitats were detected in the Laptev Sea, while lowest Chl a values were found in the deep Beaufort Sea.
The comparison of phaeopigments between shelf and deep-sea habitats also revealed significant differences in the Laptev as well as Beaufort Sea (Wilcoxon rank sum test p = 0.02 and <0.0005, respectively). Moreover, regions differed significantly in phaeopigment concentration in both shelf and deep-sea habitats (Kruskal Wallis p of both <0.0005).
Differences in CPE concentrations between shelf and deep-sea habitats in the Laptev and Beaufort Sea were also statistically significant (Wilcoxon rank sum test p < 0.0005 in both regions). In addition, CPE was also significantly different between the regions, which was valid for both, shelf and deep-sea habitats, respectively (Kruskal Wallis test p < 0.0005 for both habitats). Highest concentrations were detected in both habitats of the Beaufort Sea and lowest concentrations were detected for stations located in the central Arctic Ocean.
Differences in % Chl a between shelf and deep-sea habitats varied between regions. While we did not find significant differences between the Barents Sea shelf and the central Arctic Ocean in this study, % Chl a differed significantly between shelf and deep-sea habitats in the Laptev Sea (Wilcoxon rank sum test, p = 0.01) and in the Beaufort Sea (p < 0.0005). It is thus not surprising that differences between shelf and deep-sea habitats of the three regions were also significant (Kruskal Wallis test <0.0005 for both habitats). The highest % Chl a was measured on the Laptev Sea shelf, while lowest percentages were detected in the deep Beaufort Sea.
Total organic carbon
Difference in TOC concentrations between shelf and deep-sea habitats were statistically significant for this study and the Beaufort Sea (Wilcoxon rank sum test p = 0.03), but not for the Laptev Sea (p = 0.91). The comparison between the three regions revealed significant differences among the shelf seas (Kruskal Wallis test p = 0.01) and non-significant differences between the deep seas (p = 0.11). On the Barents Sea shelf, TOC concentrations were more than two-fold higher compared to stations on the Laptev Sea shelf, whereas the Beaufort Sea ranged almost in the middle between the two (Table 4 and Figure 5).
Microbial cell numbers
Microbial cell numbers were available for this study and the Laptev Sea (Table 4 and Figure 5). As for this study, the difference in microbial cell numbers between shelf and deep-sea habitats was found to be significant in the Laptev Sea (Wilcoxon rank sum test p = 0.01). While microbial cell numbers on the shelf stations ranged in the same order of magnitude between both regions (Wilcoxon rank sum test p = 0.81), the deep Laptev Sea had significantly higher numbers compared to the central Arctic deep sea (p = 0.045).
Discussion
Exceptions in Shelf-to-Deep-Sea Differences Are Related to Regional and Local Environmental Characteristics
Our findings support previous studies, which found water depth to be among the most important variables determining the distribution of available resources and thus, the performance of benthic remineralization (Boetius and Damm, 1998; Bourgeois et al., 2017; Hoffmann et al., 2018).
Most parameters analyzed during this and the comparative studies (besides % Chl a and FOU for this study and DOU and TOC in the Laptev Sea), were significantly different between Arctic shelf and deep-sea habitats (Figure 5 and Table 4). Furthermore, despite of the bimodal distribution of water depths sampled in this study, most of the parameters were significantly correlated with water depth (Supplementary Figure S3; excluding DOU in the Laptev Sea, Chl a and % Chl a for this study, TOC in all three regions and microbial cell numbers for the Laptev Sea and this study).
Exceptions in the relationship between water depth and our measured parameters were identified in the Laptev Sea. Here, our results show that DOU and TOC did not differ between shelf and deep-sea habitats. While TOC was found to range in the same order of magnitude between both habitats, DOU was twice as high on the Laptev Shelf compared to the deep sea (Figure 5 and Table 4). Due to the limited number of replicates, we assume that the Wilcoxon rank sum test was flawed, not rejecting a null hypothesis that was actually false (type II error).
Similar TOC concentrations between shelf and deep-sea habitats were observed before in many continental margin areas of the world’s ocean (Walsh et al., 1985; Archer and Devol, 1992). Archer and Devol (1992) suggested three possible explanations for this phenomenon, including (1) higher rates of organic carbon remineralization on the shelf compared to the deep sea; (2) the shelf sweep hypothesis (much of potential carbon flux to shelf sediments may be swept away by energetic currents and deposited in areas of lower energy) and (3) the dilution of organic carbon on the shelf by loads of non-organic terrigenous material (Walsh et al., 1985; Archer and Devol, 1992). Our data support the idea that higher rates of organic carbon mineralization on the Laptev Sea shelf compared to the adjacent deep sea may have caused the comparatively low concentrations of TOC on the Laptev Sea shelf. However, we cannot exclude the possibility that explanations (2) and (3) have also contributed to similar TOC concentrations on the Laptev Sea shelf and its adjacent deep sea.
In contrast to DOU and TOC, we hypothesize that similar % Chl a values between shelf and deep-sea measurements of this study is a result of comparatively high shares of fresh algal material exported to the central Arctic at the time of sampling. This reasoning is supported as % Chl a in the central Arctic ranged in the same order of magnitude compared to measurements of the Laptev and Beaufort Sea shelf (Table 4). Furthermore, Hoffmann et al. (2018) measured mean % Chl a of 10% at average water depths of 1805 m, which is less than half of what we report for the central Arctic Ocean in this study. Studies found that in the deep sea, microbially mediated respiration dominates (Glud et al., 1994; Wenzhöfer and Glud, 2002; Donis et al., 2016), whereas on the shelf benthic infauna can elevate oxygen fluxes by a factor of three relative to molecular diffusion (Glud et al., 2000). Consequently, the relative importance of meio- and macrofauna (as expressed in FOU) on benthic oxygen uptake at the deep-sea stations 32 and 105, situated at the foot of the Barents Sea slope and the Lomonosov Ridge, respectively, may indicate recent (ice) algal deposits (Boetius et al., 2013; Hicks et al., 2017). At station 105 this hypothesis can be backed up by above average % Chl a, which we use as an indicator for the freshness of the deposited organic material.
The comparison of benthic activity and environmental parameters in shelf and deep-sea habitats in this study revealed that seafloor topography and proximity to land may sometimes superimpose the effect of water depth, which has been suggested before for benthic carbon mineralization rates measured in hadal trenches (Luo et al., 2018). This is indicated by the comparison of oxygen uptake rates and the concentrations of environmental parameters between stations measured on the central Arctic Lomonosov Ridge (101, 105), and at the bottom of the Barents and Laptev Sea slopes. Even if stations at the bottom of the slope were at least an order of magnitude deeper compared to the Lomonosov Ridge, we found higher oxygen uptake rates as well as higher concentrations of chlorophyll pigments (excluding % Chl a), TOC and microbial cell numbers (Table 2). We ascribe this to the close proximity to the shelves of the Barents and Laptev Sea and lateral transport of organic matter nourishing higher benthic oxygen uptake rates (Walsh et al., 1985; Jahnke et al., 1990; Archer and Devol, 1992).
Another example for the importance of distance to the nearest shelf is provided by the analysis of microbial cell numbers. On the shelf, abundances were within the same range between the Barents and Laptev Sea (2.51 × 10⁹ and 2.33 × 10⁹ cells ml–1 sediment, respectively). In the deep sea, however, we found much higher abundances in the Laptev Sea (0.94 × 10⁹ and 1.65 × 10⁹ cells ml–1 sediment in the Barents and Laptev Sea, respectively). Since mean water depth of the Laptev deep-sea stations (2213 m) in fact compares to the deep-sea stations sampled during this study (2413 m), we argue that stations in the Laptev Sea are generally closer to the shelf (on average 92 km compared to 562 km in this study), which has likely affected the availability of organic matter and thus benthic activity (Table 4).
Seamounts, however, may be far away from continental shelves, but due to their hydrography and hydrodynamics, yet sustain rich benthic communities and are furthermore considered to be areas of elevated productivity, particularly in otherwise oligotrophic seas (Dower et al., 1992; Mouriño et al., 2001; White et al., 2007). The Karasik Mountain, for example, is far away from any continental shelf (station 66). This lapsed volcano rises from the middle of the Eurasian Basin and constitutes an oasis in terms of comparatively high concentrations of Chl a and TOC and of elevated benthic activity (TOUsed). Some replicates showed even higher TOUsed rates, Chl a and TOC concentrations than some stations on the shelf, which were only about half as deep (Table 2).
The shortage of available organic matter and concurrent lower benthic activity with increasing distance from the shelf may be particularly pronounced in the Arctic Ocean. The multiyear sea-ice cover above the deep-sea basins impedes primary production and thus exacerbates the already scarce availability of labile organic matter (Piepenburg, 2005; Grebmeier, 2012). In the central Arctic Ocean, ice algal production can contribute up to 60% to net primary production between August and September (Fernández-Méndez et al., 2015). It is not yet clear, whether ice-algal contribution to productivity is on the rise with thinning sea-ice, or whether it will decline due to overall sea-ice reduction (Fernández-Méndez et al., 2015). However, the increase in ice-free areas during summer and the retreat of the sea-ice melting edge far beyond the continental shelf seas (Stroeve et al., 2007; Comiso et al., 2008), will affect pan-Arctic primary production (Kahru et al., 2016). An increased export flux of organic matter to the deep-sea floor may thus alter the magnitude of differences in ecosystem functioning between Arctic shelf and deep seas observed here. This idea is supported by the discovery of deposited ice algae at the central Arctic deep-sea floor and concurrent increases in benthic oxygen uptake (Boetius et al., 2013). We note, however, that limited nutrient availability in the vast central Arctic Ocean will likely remain a major factor that may limit the projected increase in primary production (Slagstad et al., 2015).
Variations in Benthic Activity Are Mostly Driven by the Availability of Phytodetritus
In this study, benthic oxygen uptake (DOU and TOUsed) across both habitats (shelf and deep sea) was mostly driven by concentrations of phytodetritus (CPE or Chl a) and TOC, as proxies for the availability of organic matter. This is in line with findings of previous studies from the Arctic (Clough et al., 2005; Bourgeois et al., 2017; Hoffmann et al., 2018). However, other studies have suggested that bottom water temperature and the quality of the phytodetritus (here assessed as % Chl a) instead of the overall presence of organic matter are the most important drivers of benthic oxygen uptake (Belley et al., 2016; Kotwicki et al., 2018). The similar quality of phytodetritus across both habitats (opposed to organic matter content) in this study indicates a secondary role of phytodetritus lability/freshness for explaining the variations in benthic oxygen uptake rates.
Bacterial cell numbers did not explain variations in benthic oxygen uptake (Table 3), although there were clear differences in microbial cell numbers between habitats (Figure 2), with a positive relationship between the abundance of bacteria and chlorophyll pigments (Figure 3). This is in line with previous studies that have indicated positive relationships between the presence of organic matter and bacterial abundances and related remineralization activity (Smith et al., 1997; Boetius and Damm, 1998; Turley and Dixon, 2002). The correlation between DOU and microbial cell numbers shows a marginally significant relationship between the two parameters (Figure 4). The week correlation illustrates the strong variability of DOU on the shelf. The three strongest outliers at high DOU rates were all measured on the Laptev Sea shelf, while the strongest outlier in the lower range of DOU rates was measured at station 20, situated on the Barents Sea shelf. The lack of a clear relationship between bacterial abundances and oxygen uptake in our study may indicate that a higher availability of organic matter on the shelves increases cell-specific activities rather than total abundances, the latter of which are also controlled by viral lysis (Orcutt et al., 2011; Orsi, 2018). In addition, the presence of benthic fauna (especially meio- and macro-fauna) plays a role (Piot et al., 2014) and has been shown to co-vary with benthic activity in previous studies, while bacterial abundance did not (Hoffmann et al., 2018). Benthic fauna could, however, not be considered in this study. In addition, the permeability of sediments may affect benthic oxygen uptake, with higher uptake rates in cohesive sediments (Fuchsman et al., 2015; Hicks et al., 2017). We did not determine sediment properties in this study, but based on visual inspection all samples were composed of fine-grained, muddy sediments.
In summary, our results support the claim that climate change driven alterations in organic matter input to the Arctic seafloor may most explicitly affect the deep-sea regions, as these are yet characterized by very limited resource availability due to comprehensive sea-ice cover. As a consequence of increased availability of organic matter at the deep-sea floor, we expect benthic activity (DOU, TOUsed, and FOU) to be elevated, potentially diminishing differences (in benthic activity and environmental parameter: phytodetritus, TOC and microbial cell numbers) between Arctic shelf and deep seas during this century.
Regional Differences in Benthic Activity and Environmental Parameters in Relation to Primary Production Regimes
In addition to the general differences in benthic parameters between shelf and deep-sea habitats, our study further confirmed regional variations. These include differences in DOU and microbial cell numbers between the central deep Arctic Ocean and the deep Laptev Sea, TOC on the shelves of all regions, as well as chlorophyll pigments across both habitats and all regions (Table 4). We have also shown that phytodetritus, most of all CPE, is a good predictor of benthic remineralization in shelf and deep-sea habitats, as it explained most of the variation within DOU (and TOUsed) (Table 3). The indicators for phytodetritus were indeed significantly different between both habitats and all three regions.
The varying concentrations in phytodetritus, however, do not necessarily reflect the patterns of primary production in the different regions. In general, primary production illustrates a latitudinal gradient across the Arctic Ocean and is highly dependent on several factors, such as season (light availability), the relatively large share of area covered by continental shelves (less sea ice, available nutrients, inflow of terrigenous organic material) (Jakobsson et al., 2003), sea-ice distribution and thickness (Arrigo et al., 2008; Comiso et al., 2008; Boetius et al., 2013), and nutrient availability (Macdonald et al., 1998; Maslowski et al., 2004; Sakshaug, 2004).
It was shown that highest overall primary production can be found in the Barents Sea, where rates of 108 Tg C a–1 (Pabi et al., 2008) and 132 Tg C a–1 (Arrigo and van Dijken, 2011) were measured. Also Codispoti et al. (2013) have described the Barents Sea as one of the most productive seas within the Arctic Ocean, only exceeded by the Bering and southern Chukchi Sea. However, measurements of net primary production per unit area suggest highest primary production rates in the Laptev Sea, being higher compared to both the Barents and Beaufort Seas (121 g C m–2 a–1, 110 g C m–2 a–1, and 71.3 g C m–2 a–1, respectively) (Arrigo and van Dijken, 2011). On the other hand, primary production rates are temporarily highly variable and highest variabilities were assessed in the Laptev and Beaufort Sea (Pabi et al., 2008). This may help explaining why our measurements of phytodetritus do not necessarily reflect the estimated rates of primary production found in the literature. For example, we measured highest concentrations of CPE in the Beaufort Sea, even though studies have deemed primary production in the Beaufort Sea as comparatively low for an Arctic shelf (Hill et al., 2018). Differences in phytodetritus content between the deep-sea stations of the Beaufort, Laptev and the central Arctic Ocean in fact did reflect the patterns in primary production rates presented above, as primary production was found to be lowest in the central Arctic Ocean (<11 – 18 g C m–2 a–1) (Boetius and Damm, 1998; Sakshaug, 2004; Fernández-Méndez et al., 2015).
In summary, the varying concentrations in phytodetritus on the three analyzed shelves did not reflect integrated patterns of primary production found in the literature. This observation, however, is limited by the coarse scale of patterns compared: primary production patterns are not integrated across the same shelf area we used in our study, and have neither been reported from the same year. Moreover, the rates of vertical export of phytodetritus from the productive ocean layers to the seafloor may differ as well. For example, the low % Chl a values in the Beaufort sediments compared to the Laptev and central Arctic indicates highly degraded material and thus a higher loss of phytodetritus during vertical export. In the future, obtaining primary production and vertical export measures at the fitting scale of benthic uptake sampling could clarify this relationship across Arctic regions.
Other studies in hadal trenches have shown that benthic carbon remineralization (which we show is highly dependent on the availability of phytodetritus) follows patterns in primary production (Luo et al., 2018). However, the analyzed hadal trenches are not covered by sea-ice and the presented rates in primary production for the Arctic Ocean often do not take ice-algal production into account (Pabi et al., 2008; Hill et al., 2018). Watanabe et al. (2019) have estimated pan-Arctic ice-algal production between 1980 and 2009 in the Eurasian Basin, the Canada Basin and the Chukchi and Barents Sea. They found that ice-algal production was lowest in the otherwise highly productive Barents Sea and comparatively low in the central Arctic Ocean (Eurasian Basin). Higher rates were modeled instead for the Laptev Sea and the Canadian Polar shelf. The reason for the comparatively low ice-algal production in the Barents Sea may be that sea-ice does not extend over the entire Barents Sea region and low under ice production in the central Arctic can be explained by the presence of yet comprehensive and thick sea-ice during the studied period (Watanabe et al., 2019). This suggests that the correlation between primary production and benthic ecosystem functioning is more complex in the Arctic Ocean, where ice-algal production has to be considered. In perennially sea-ice covered regions, such as the central Arctic, this will become even more important in the future. Measurements from Fernández-Méndez et al. (2015) have shown that ice-algal production contributed up to 60% of net primary production in the central Arctic during the record sea-ice minimum of 2012. We therefore argue that benthic ecosystem functioning in regions with a currently high sea-ice cover (mostly deep-sea habitats of higher latitudes) will be particularly prone to substantial alterations. These alterations are likely to occur well before the mid of the century, for which an ice free Arctic Ocean during summer has been projected (Notz and Stroeve, 2016). Due to the contribution of ice-algae, net primary production will already be boosted by sea-ice thinning and areal decline.
It is therefore reasonable to assume, that expected changes in ecosystem functioning will differ regionally, depending on primary production regimes (including ice-algal production), sea-ice cover and water depth, but may be particularly pronounced in the nutrient-starved central Arctic Ocean. This finding emphasizes the urgent need for baseline data from pan-Arctic regions, which will allow a better assessment of future changes and their consequences for the pan-Arctic marine ecosystem.
Conclusion
Here we demonstrate that most of the measured benthic ecosystem parameters in the Arctic Ocean differ significantly between shelf and deep-sea habitats. The availability of organic matter, in form of phytodetritus, was the main driver for the patterns observed in benthic oxygen consumption, while bacterial abundance (as well as bottom water temperature) was not a good predictor, possibly indicating the influence of macro-organisms on remineralization in sediments. Indications for the latter were found at stations with high amounts of fresh phytodetritus, which were accompanied by high FOU rates, possibly indicating the exploitation of fresh algal material by benthic fauna.
Bacterial abundances were only weakly correlated with DOU rates. Instead, higher DOU rates may be the result of increased cell-specific activity, triggered by the availability of chlorophyll pigments.
Due to generally low organic matter concentrations compared to other regions of the Arctic Ocean, the projected sea-ice decline may particularly boost benthic remineralization in the central Arctic Ocean, diminishing the differences between benthic shelf and deep-sea habitats. This study indicates first shifts in the input of organic matter to benthic systems in this previously mostly ice-covered area. We speculate that benthic ecosystems in the Arctic Ocean will respond to an increase in organic matter with shifts in benthic ecosystem functioning.
Data Availability Statement
All data from this and the comparative studies are available from the data repository PANGAEA (https://www.pangaea.de). All datasets are cited in the text.
Author Contributions
HL, JK, CB, and FW conceived and designed this study. JK was responsible for sampling and work onboard RV Polarstern expedition PS94. FW and HL helped in preparing the experiments on board and provided relevant equipment and know-how. JK and CB processed samples for TOC, Chl a, and microbial cell numbers. JK performed most data analyses with support from HL and CB and wrote the manuscript with strong support from all co-authors.
Funding
Funding was provided by the German Federal Ministery of Research grant “System Laptev Sea (03G0833E)” (HL and JK) and AWI_PS94_09. Funding was also received from the European Research Council (ERC) under the European Union’s Seventh Framework Program (FP7/2007-2013) research project ABYSS (Grant Agreement No. 294757), as well as from the Helmholtz Association and the Max Planck Society. We acknowledge financial support by the Deutsche Forschungsgemeinschaft and the University of Rostock within the funding program Open Access Publishing.
Conflict of Interest
The authors declare that the research was conducted in the absence of any commercial or financial relationships that could be construed as a potential conflict of interest.
Acknowledgments
We would like to thank Ralf Hoffmann, for providing equipment and essential knowledge for producing oxygen microprofiles and the subsequent calculation of diffusive oxygen uptake rates and Ulrike Hanz, for her work on board PS94, as well as the RV Polarstern officers and crew. Among them we particularly thank TransArcII chief scientist Ursula Schauer. Further thanks go to Martina Alisch, Rafael Stiens, and Florian Krauß for laboratory support and two reviewers, whose comments have greatly improved this manuscript. We also thank Karen von Juterzenka for help preparing the expedition and Dieter Piepenburg for his valuable advice and the opportunity to conduct this study.
Supplementary Material
The Supplementary Material for this article can be found online at: https://www.frontiersin.org/articles/10.3389/fmars.2020.00426/full#supplementary-material
References
Archer, D., and Devol, A. (1992). Benthic oxygen fluxes on the Washington shelf and slope: a comparison of in situ microelectrode and chamber flux measurements. Limnol. Oceanogr. 37, 614–629. doi: 10.4319/lo.1992.37.3.0614
Archer, D., and Maier-Reimer, E. (1994). Effect of deep-sea sedimentary calcite preservation on atmospheric CO 2 concentration. Nature 367, 260–263. doi: 10.1038/367260a0
Arrigo, K. R., van Dijken, G., and Pabi, S. (2008). Impact of a shrinking Arctic ice cover on marine primary production. Geophys. Res. Lett. 35:529.
Arrigo, K. R., and van Dijken, G. L. (2011). Secular trends in Arctic Ocean net primary production. J. Geophys. Res. 116:L19603.
Barnett, P. R. O., Watson, J., and Conelly, D. (1984). A multiple corer for taking virtually undisturbed samples from shelf, bathyal and abyssal sediments. Oceanol. Acta 7, 399–408.
Bauerfeind, E., Nöthig, E. M., Beszczynska, A., Fahl, K., Kaleschke, L., Kreker, K., et al. (2009). Particle sedimentation patterns in the eastern Fram Strait during 2000–2005: results from the arctic long-term observatory HAUSGARTEN. Deep Sea Res. Part I 56, 1471–1487. doi: 10.1016/j.dsr.2009.04.011
Belley, R., Snelgrove, P. V. R., Archambault, P., and Juniper, S. K. (2016). Environmental drivers of benthic flux variation and ecosystem functioning in salish sea and northeast pacific sediments. PLoS One 11:e0151110. doi: 10.1371/journal.pone.0151110
Bienhold, C., and Boetius, A. (2016). Total Carbon and Total Organic Carbon From the Laptev Sea (MUC stations) During POLARSTERN Cruise ARK-XXVII/3 From August-September 2012. Bremerhaven: PANGAEA. doi: 10.1594/PANGAEA.863150
Bienhold, C., and Boetius, A. (2018a). Chlorophyll Pigments From the Laptev Sea (Arctic Ocean) during POLARSTERN cruise ARK-XXVII/3 from August-September 2012. Bremerhaven: PANGAEA. doi: 10.1594/PANGAEA.892280
Bienhold, C., and Boetius, A. (2018b). Prokaryotic Cell Abundance From the Laptev Sea (Arctic Ocean) During POLARSTERN cruise ARK-XXVII/3 From August-September 2012. Bremerhaven: PANGAEA. doi: 10.1594/PANGAEA.892279
Bleil, U., and Thiede, J. (1990). Geological History of the Polar Oceans: Arctic versus Antarctic. Dordrecht: Springer.
Boetius, A., Albrecht, S., Bakker, K., Bienhold, C., Felden, J., Fernández-Méndez, M., et al. (2013). Export of algal biomass from the melting Arctic sea ice. Science 339, 1430–1432. doi: 10.1126/science.1231346
Boetius, A., and Damm, E. (1998). Benthic oxygen uptake, hydrolytic potentials and microbial biomass at the Arctic continental slope. Deep Sea Res. Part I 45, 239–275. doi: 10.1016/s0967-0637(97)00052-6
Bourgeois, S., Archambault, P., and Witte, U. (2017). Organic matter remineralization in marine sediments: a Pan-Arctic synthesis. Glob. Biogeochem. Cycles 31, 190–213. doi: 10.1002/2016gb005378
Canfield, D. E. (1993). “Organic matter oxidation in marine sediments,” in Interactions of C, N, P and S Biogeochemical Cycles and Global Change, eds R. Wollast, F. T. Mackenzie, and L. Chou (Berlin: Springer), 333–363. doi: 10.1007/978-3-642-76064-8_14
Cathalot, C., Rabouille, C., Sauter, E., Schewe, I., and Soltwedel, T. (2015). Benthic oxygen uptake in the arctic ocean margins– a case study at the deep-sea observatory HAUSGARTEN (Fram Strait). PLoS One 10:e0138339. doi: 10.1371/journal.pone.0138339
Clough, L. M., Renaud, P. E., and Ambrose, W. G. Jr. (2005). Impacts of water depth, sediment pigment concentration, and benthic macrofaunal biomass on sediment oxygen demand in the western Arctic Ocean. Can. J. Fish. Aquat. Sci. 62, 1756–1765. doi: 10.1139/f05-102
Codispoti, L. A., Kelly, V., Thessen, A., Matrai, P., Suttles, S., Hill, V., et al. (2013). Synthesis of primary production in the Arctic Ocean: III. Nitrate and phosphate based estimates of net community production. Prog. Oceanogr. 110, 126–150. doi: 10.1016/j.pocean.2012.11.006
Comiso, J. C., Parkinson, C. L., Gersten, R., and Stock, L. (2008). Accelerated decline in the Arctic sea ice cover. Geophys. Res. Lett. 35:413.
Donis, D., McGinnis, D. F., Holtappels, M., Felden, J., and Wenzhoefer, F. (2016). Assessing benthic oxygen fluxes in oligotrophic deep sea sediments (HAUSGARTEN observatory). Deep Sea Res. Part I 111, 1–10. doi: 10.1016/j.dsr.2015.11.007
Dower, J., Freeland, H., and Juniper, K. (1992). A strong biological response to oceanic flow past Cobb Seamount. Deep Sea Res. Part A. Oceanogr. Res. Pap. 39, 1139–1145. doi: 10.1016/0198-0149(92)90061-w
Fernández-Méndez, M., Katlein, C., Rabe, B., Nicolaus, M., Peeken, I., Bakker, K., et al. (2015). Photosynthetic production in the central Arctic Ocean during the record sea-ice minimum in 2012. Biogeosciences 12, 3525–3549. doi: 10.5194/bg-12-3525-2015
Fuchsman, C. A., Devol, A. H., Chase, Z., Reimers, C. E., and Hales, B. (2015). Benthic fluxes on the Oregon shelf. Estuar. Coast. Shelf Sci. 163, 156–166. doi: 10.1016/j.ecss.2015.06.001
Glud, R. N. (2008). Oxygen dynamics of marine sediments. Mar. Biol. Res. 4, 243–289. doi: 10.1080/17451000801888726
Glud, R. N., Gundersen, J. K., Jørgensen, B. B., Revsbech, N. P., and Schulz, H. D. (1994). Diffusive and total oxygen uptake of deep-sea sediments in the eastern South Atlantic Ocean:in situ and laboratory measurements. Deep Sea Res. Part I 41, 1767–1788. doi: 10.1016/0967-0637(94)90072-8
Glud, R. N., Holby, O., Hoffmann, F., and Canfield, D. E. (1998). Benthic mineralization and exchange in Arctic sediments (Svalbard, Norway). Mar. Ecol. Prog. Ser. 173, 237–251. doi: 10.3354/meps173237
Glud, R. N., Risgaard-Petersen, N., Thamdrup, B., Fossing, H., and Rysgaard, S. (2000). Benthic carbon mineralization in a high-Arctic sound (Young Sound, NE Greenland). Mar. Ecol. Prog. Ser. 206, 59–71. doi: 10.3354/meps206059
Grebmeier, J. M. (2012). Shifting patterns of life in the Pacific Arctic and sub-Arctic seas. Ann. Rev. Mar. Sci. 4, 63–78. doi: 10.1146/annurev-marine-120710-100926
Grebmeier, J. M., Cooper, L. W., Feder, H. M., and Sirenko, B. I. (2006). Ecosystem dynamics of the Pacific-influenced Northern Bering and Chukchi Seas in the Amerasian Arctic. Prog. Oceanogr. 71, 331–361. doi: 10.1016/j.pocean.2006.10.001
Hall, P. O. J., Anderson, L. G., van der Loeff, M. M. R., Sundby, B., and Westerlund, S. F. G. (1989). Oxygen uptake kinetics in the benthic boundary layer. Limnol. Oceanogr. 34, 734–746. doi: 10.4319/lo.1989.34.4.0734
Harada, N. (2016). Review: potential catastrophic reduction of sea ice in the western arctic ocean: its impact on biogeochemical cycles and marine ecosystems. Glob. Planet. Change 136, 1–17. doi: 10.1016/j.gloplacha.2015.11.005
Hicks, N., Ubbara, G. R., Silburn, B., Smith, H. E. K., Kröger, S., Parker, E. R., et al. (2017). Oxygen dynamics in shelf seas sediments incorporating seasonal variability. Biogeochemistry 135, 35–47. doi: 10.1007/s10533-017-0326-9
Hill, V., Ardyna, M., Lee, S. H., and Varela, D. E. (2018). Decadal trends in phytoplankton production in the Pacific Arctic Region from 1950 to 2012. Deep Sea Res. Part II 152, 82–94. doi: 10.1016/j.dsr2.2016.12.015
Hoffmann, K., Hassenrück, C., Salman-Carvalho, V., Holtappels, M., and Bienhold, C. (2017). Response of bacterial communities to different detritus compositions in arctic deep-sea sediments. Front. Microbiol. 8:401.
Hoffmann, R., Braeckman, U., Hasemann, C., and Wenzhöfer, F. (2018). Deep-sea benthic communities and oxygen fluxes in the Arctic Fram Strait controlled by sea-ice cover and water depth. Biogeosciences 15, 4849–4869. doi: 10.5194/bg-15-4849-2018
IPCC (2013). “Summary for policymakers,” in Climate Change 2013: The Physical Science Basis. Contribution of Working Group I to the Fifth Assessment Report of the Intergovernmental Panel on Climate Change, eds T. F. Stocker, D. Qin, G.-K. Plattner, M. Tignor, S. K. Allen, J. Boschung, et al. (Cambridge: Cambridge University Press)
Jahnke, R. A., Reimers, C. E., and Craven, D. B. (1990). Intensification of recycling of organic matter at the sea floor near ocean margins. Nature 348, 50–54. doi: 10.1038/348050a0
Jakobsson, M., Grantz, A., Kristoffersen, Y., and Macnab, R. (2003). Physiographic provinces of the Arctic Ocean seafloor. Geo. Society Am. Bull. 115, 1443. doi: 10.1130/b25216.1
Jakobsson, M., Mayer, L., Coakley, B., Dowdeswell, J. A., Forbes, S., Fridman, B., et al. (2012). The International Bathymetric Chart of the Arctic Ocean (IBCAO) Version 3.0. Geophys. Res. Lett. 39:L12609. doi: 10.1029/2012GL052219
Jørgensen, B. B., and Boetius, A. (2007). Feast and famine — microbial life in the deep-sea bed. Nat. Rev. Microbiol. 5, 770–781. doi: 10.1038/nrmicro1745
Jørgensen, B. B., Glud, R. N., and Holby, O. (2005). Oxygen distribution and bioirrigation in Arctic fjord sediments (Svalbard. Barents Sea). Mar. Ecol. Prog. Ser. 292, 85–95. doi: 10.3354/meps292085
Jørgensen, B. B., and Revsbech, N. P. (1985). Diffusive boundary layers and the oxygen uptake of sediments and detritus1. Limnol. Oceanogr. 30, 111–122. doi: 10.4319/lo.1985.30.1.0111
Kahru, M., Lee, Z., Mitchell, B. G., and Nevison, C. D. (2016). Effects of sea ice cover on satellite-detected primary production in the Arctic Ocean. Biol Lett. 12:20160223. doi: 10.1098/rsbl.2016.0223
Kiesel, J., Bienhold, C., Wenzhöfer, F., and Link, H. (2019). Benthic biogeochemical parameters measured during Polarstern expedition PS94 (TransArcII) to the Barents Sea and central Arctic. Bremerhaven: PANGAEA. doi: 10.1594/PANGAEA.907889
Klages, M., Boetius, A., Christensen, J. P., Deubel, H., Piepenburg, D., Schewe, I., et al. (2004). “The benthos of arctic seas and its role for the organic carbon cycle at the seafloor,” in The Organic Carbon Cycle in the Arctic Ocean, eds R. Stein and R. W. MacDonald (Berlin: Springer), 139–167. doi: 10.1007/978-3-642-18912-8_6
Kotwicki, L., Grzelak, K., Opaliński, K., and Wȩsławski, J. M. (2018). Total benthic oxygen uptake in two Arctic fjords (Spitsbergen) with different hydrological regimes. Oceanologia 60, 107–113. doi: 10.1016/j.oceano.2017.11.005
Lalande, C., Nöthig, E.-M., Somavilla, R., Bauerfeind, E., Shevchenko, V., and Okolodkov, Y. (2014). Variability in under-ice export fluxes of biogenic matter in the Arctic Ocean. Glob. Biogeochem. Cycles 28, 571–583. doi: 10.1002/2013gb004735
Legendre, P. (2008). Studying beta diversity: ecological variation partitioning by multiple regression and canonical analysis. J. Plant Ecol. 1, 3–8. doi: 10.1093/jpe/rtm001
Link, H., Archambault, P., Tamelander, T., Renaud, P. E., and Piepenburg, D. (2011). Spring-to-summer changes and regional variability of benthic processes in the western Canadian Arctic. Polar Biol. 34, 2025–2038. doi: 10.1007/s00300-011-1046-6
Link, H., Chaillou, G., Forest, A., Piepenburg, D., and Archambault, P. (2013a). Multivariate benthic ecosystem functioning in the Arctic – benthic fluxes explained by environmental parameters in the southeastern Beaufort Sea. Biogeosciences 10, 5911–5929. doi: 10.5194/bg-10-5911-2013
Link, H., Piepenburg, D., and Archambault, P. (2013b). Are hotspots always hotspots? The relationship between diversity, resource and ecosystem functions in the Arctic. PLoS One 8:e74077. doi: 10.1371/journal.pone.0074077
Link, H., Piepenburg, D., and Archambault, P. (2019). Sediment Oxygen Uptake, Benthic Boundary Fluxes, Macrofaunal Abundance and Biodiversity, Chl a, Phaeopigments and Nitrogen and Organic Carbon Content at the Sediment-Water Interface in the Canadian Arctic in 2008 and 2009. Bremerhaven: PANGAEA. doi: 10.1594/PANGAEA.908091
Luo, M., Glud, R. N., Pan, B., Wenzhöfer, F., Xu, Y., Lin, G., et al. (2018). Benthic carbon mineralization in hadal trenches: insights from in situ determination of benthic oxygen consumption. Geophys. Res. Lett. 45, 2752–2760. doi: 10.1002/2017gl076232
Macdonald, R. W., Solomon, S. M., Cranston, R. E., Welch, H. E., Yunker, M. B., and Gobeil, C. (1998). A sediment and organic carbon budget for the Canadian Beaufort Shelf. Mar. Geol. 144, 255–273. doi: 10.1016/s0025-3227(97)00106-0
Maslowski, W., Marble, D., Walczowski, W., Schauer, U., Clement, J. L., and Semtner, A. J. (2004). On climatological mass, heat, and salt transports through the Barents Sea and Fram Strait from a pan-Arctic coupled ice-ocean model simulation. J. Geophys. Res. 109, 11.
Meyer-Reil, L.-A. (1983). Benthic response to sedimentation events during autumn to spring at a shallow water station in the Western Kiel Bight. Mar. Biol. 77, 247–256. doi: 10.1007/bf00395813
Mouriño, B., Fernandéz, E., Serret, P., Harbour, D., Sinha, B., and Pingree, R. (2001). Variability and seasonality of physical and biological fields at the Great Meteor Tablemount (subtropical NE Atlantic). Oceanol. Acta 24, 167–185. doi: 10.1016/s0399-1784(00)01138-5
Notz, D., and Stroeve, J. (2016). Observed Arctic sea-ice loss directly follows anthropogenic CO2 emission. Science 354, 747–750. doi: 10.1126/science.aag2345
Oksanen, J., Blanchet, F. G., and Kindt, R. (2019). Vegan: Community Ecology Package. R Package Vegan, Vers. 2.2-1. Available online at: https://cran.r-project.org, https://github.com/vegandevs/vegan (September 1, 2019).
Orcutt, B. N., Sylvan, J. B., Knab, N. J., and Edwards, K. J. (2011). Microbial ecology of the dark ocean above, at, and below the seafloor. Microb. Mol. Biol. Rev. 75, 361–422. doi: 10.1128/mmbr.00039-10
Orsi, W. D. (2018). Ecology and evolution of seafloor and subseafloor microbial communities. Nat. Rev. Microbiol. 16, 671–683. doi: 10.1038/s41579-018-0046-8
Pabi, S., van Dijken, G. L., and Arrigo, K. R. (2008). Primary production in the Arctic Ocean, 1998–2006. J. Geophys. Res. 113:225.
Pastor, L., Deflandre, B., Voillier, E., Cathalot, C., Metzger, E., Rabouille, C., et al. (2011). Influence of the organic matter composition on benthic oxygen demand in the Rhône River prodelta (NW Mediterranean Sea). Cont. Shelf Res. 31, 1008–1019. doi: 10.1016/j.csr.2011.03.007
Piepenburg, D. (2005). Recent research on Arctic benthos: common notions need to be revised. Polar Biol. 28, 733–755. doi: 10.1007/s00300-005-0013-5
Piot, A., Nozais, C., and Archambault, P. (2014). Meiofauna affect the macrobenthic biodiversity-ecosystem functioning relationship. Oikos 123, 203–213. doi: 10.1111/j.1600-0706.2013.00631.x
Rabe, B., Schauer, U., Ober, S., Horn, M., Hoppmann, M., Korhonen, M., et al. (2016). Physical Oceanography During POLARSTERN Cruise PS94 (ARK-XXIX/3). Bremerhaven: PANGAEA.
Rasmussen, H., and Jørgensen, B. B. (1992). Microelectrode studies of seasonal oxygen uptake in a coastal sediment: role of molecular diffusion. Mar. Ecol. Prog. Ser. 92, 289–303. doi: 10.3354/meps081289
Rowe, G., Sibuet, M., Deming, J., Khripounoff, A., Tietjen, J., Macko, S., et al. (1991). Total sediment biomass and preliminary estimates of organic carbon residence time in deep-sea benthos. Mar. Ecol. Prog. Ser. 79, 99–114. doi: 10.3354/meps079099
Sakshaug, E. (1997). Biomass and productivity distributions and their variability in the barents sea. ICES J. Mar. Sci. 97, 341–350. doi: 10.1006/jmsc.1996.0170
Sakshaug, E. (2004). “Primary and Secondary Production in the Arctic Seas,” in The Organic Carbon Cycle in the Arctic Ocean, eds R. Stein and R. W. MacDonald (Berlin: Springer), 57–81. doi: 10.1007/978-3-642-18912-8_3
Slagstad, D., Wassmann, P. F. J., and Ellingsen, I. (2015). Physical constrains and productivity in the future Arctic Ocean. Front. Mar. Sci. 2:311.
Smith, C. R., Berelson, W., Demaster, D. J., Dobbs, F. C., Hammond, D., Hoover, D. J., et al. (1997). Latitudinal variations in benthic processes in the abyssal equatorial Pacific: control by biogenic particle flux. Deep Sea Res. Part II 44, 2295–2317. doi: 10.1016/s0967-0645(97)00022-2
Smith, K. L., Ruhl, H. A., Kaufmann, R. S., and Kahru, M. (2008). Tracing abyssal food supply back to upper-ocean processes over a 17-year time series in the northeast Pacific. Limnol. Oceanogr. 53, 2655–2667. doi: 10.4319/lo.2008.53.6.2655
Sørensen, H. L., Meire, L., Juul-Pedersen, T., Stigter, H. C., de, Meysman, F. J. R., et al. (2015). Seasonal carbon cycling in a Greenlandic fjord: an integrated pelagic and benthic study. Mar. Ecol. Prog. Ser. 539, 1–17. doi: 10.3354/meps11503
Stroeve, J., Holland, M. M., Meier, W., Scambos, T., and Serreze, M. (2007). Arctic sea ice decline: faster than forecast. Geophys. Res. Lett. 34:3498.
Turley, C. M., and Dixon, J. L. (2002). Bacterial numbers and growth in surficial deep-sea sediments and phytodetritus in the NE Atlantic: Relationships with particulate organic carbon and total nitrogen. Deep Sea Res. Part I 49, 815–826. doi: 10.1016/s0967-0637(01)00080-2
Turley, C. M., and Lochte, K. (1990). Microbial response to the input of fresh detritus to the deep-sea bed. Palaeogeogr. Palaeoclimatol. Palaeoecol. 89, 3–23. doi: 10.1016/0921-8181(90)90052-e
Walsh, J. J., Premuzic, E. T., Gaffney, J. S., Rowe, G. T., Harbottle, G., Stoenner, R. W., et al. (1985). Organic storage of CO2 on the continental slope off the mid-Atlantic bight, the southeastern Bering Sea, and the Peru coast. Deep Sea Res. Part A. Oceanogr. Res. Pap. 32, 853–883. doi: 10.1016/0198-0149(85)90120-7
Wassmann, P., Reigstad, M., Haug, T., Rudels, B., Carroll, M. L., Hop, H., et al. (2006). Food webs and carbon flux in the Barents Sea. Prog. Oceanogr. 71, 232–287. doi: 10.1016/j.pocean.2006.10.003
Watanabe, E., Jin, M., Hayashida, H., Zhang, J., and Steiner, N. (2019). Multi-model intercomparison of the pan-Arctic ice-algal productivity on seasonal interannual, and decadal timescales. J. Geophys. Res. Oceans 124, 9053–9084. doi: 10.1029/2019jc015100
Wenzhöfer, F., Bienhold, C., and Boetius, A. (2018). Diffusive Oxygen Uptake From the Laptev Sea (Arctic Ocean) During POLARSTERN Cruise ARK-XXVII/3 (IceArc) From August-September 2012. Bremerhaven: PANGAEA. doi: 10.1594/PANGAEA.892286
Wenzhöfer, F., and Glud, R. N. (2002). Benthic carbon mineralization in the Atlantic: a synthesis based on in situ data from the last decade. Deep Sea Res. Part I 49, 1255–1279. doi: 10.1016/s0967-0637(02)00025-0
Wenzhöfer, F., Holby, O., and Kohls, O. (2001). Deep penetrating benthic oxygen profiles measured in situ by oxygen optodes. Deep Sea Res. Part I 48, 1741–1755. doi: 10.1016/s0967-0637(00)00108-4
White, M., Bashmachnikov, I., Arístegui, J., and Martins, A. (2007). “Physical processes and seamount productivity,” in Seamounts: Ecology, Fisheries & Conservation, eds T. J. Pitcher, T. Morato, P. J. B. Hart, M. R. Clark, N. Haggan, and R. S. Santos (Oxford: John Wiley & Sons, Ltd), 62–84. doi: 10.1002/9780470691953.ch4
Keywords: sediment oxygen uptake, organic matter, central Arctic Ocean, shelf, deep-sea, pan-Arctic, Laptev Sea, Beaufort Sea
Citation: Kiesel J, Bienhold C, Wenzhöfer F and Link H (2020) Variability in Benthic Ecosystem Functioning in Arctic Shelf and Deep-Sea Sediments: Assessments by Benthic Oxygen Uptake Rates and Environmental Drivers. Front. Mar. Sci. 7:426. doi: 10.3389/fmars.2020.00426
Received: 21 November 2019; Accepted: 14 May 2020;
Published: 02 July 2020.
Edited by:
Dorte Krause-Jensen, Aarhus University, DenmarkReviewed by:
Hans Røy, Aarhus University, DenmarkNatalie Hicks, University of Essex, United Kingdom
Copyright © 2020 Kiesel, Bienhold, Wenzhöfer and Link. This is an open-access article distributed under the terms of the Creative Commons Attribution License (CC BY). The use, distribution or reproduction in other forums is permitted, provided the original author(s) and the copyright owner(s) are credited and that the original publication in this journal is cited, in accordance with accepted academic practice. No use, distribution or reproduction is permitted which does not comply with these terms.
*Correspondence: Joshua Kiesel, a2llc2VsQGdlb2dyYXBoaWUudW5pLWtpZWwuZGU=; Heike Link, aGVpa2UubGlua0B1bmktcm9zdG9jay5kZQ==