 Ankur D. Bordoloi
 Evan Variano
 Gautier Verhille
- 1Department of Civil and Environmental Engineering, University of California Berkeley, Berkeley, CA, United States
- 2Aix Marseille Univ, CNRS, Centrale Marseille, IRPHE, Marseille, France
Turbulence induces rotation in the living and the non-living materials in the ocean. The time scale of rotation for a living organism is important in understanding an organism's feeding efficiency, mating, prey capture rate, etc. This time scale is also crucial for understanding the migration of non-living materials such as microplastics. Herein, we investigate the tumbling motion of mesoscale particles that resemble organisms of intermediate size, such as zooplankton that appear in the ocean. Using time-resolved measurements of the orientation of rigid inertial fibers in a turbulence-tank, we analyze the autocorrelation of their tumbling rate. The correlation time (τd) is well-predicted by Kolmogorov inertial-range scaling based on the fiber length (L) when the fiber inertia can be neglected. For inertial fibers, we propose a simple model considering fiber inertia (measured by a tumbling Stokes number) and a viscous torque which accurately predicts both the correlation time and the variance of the tumbling rate. Our measurements and the theoretical model provide a basic understanding of the rotational response of an intermediately sized organism to the surrounding turbulence in its non-active state.
1. Introduction
Understanding the dynamic response of a particle suspended in turbulent flow is applicable to many small marine organisms. For instance, the rate of prey capture, predator sensitivity, feeding efficiency, and habitat selection of an organism depend on how an organism responds to the varying intensity of turbulence across the ocean (Rothschild and Osborn, 1988; MacKenzie et al., 1994; Gilbert and Buskey, 2005; Reidenbach et al., 2009; Sutherland et al., 2014; Byron, 2015; Michalec et al., 2017). The alignment and rotation of a non-spherical organism may influence its nutrient uptake by influencing the surrounding boundary layer thickness, and hence the biological cycles of the environment at various scales (Pahlow et al., 1997; Nguyen et al., 2011; Byron, 2015). Further, the local distribution of micro-organisms such as phytoplankton relate to their mechanistic response to the turbulence in the ocean (Durham and Stocker, 2012).
Organisms such as phytoplankton are typically smaller than the smallest scale of oceanic turbulence. Orientation and rotation of sub-Kolmogorov particles in turbulence have been widely studied in the past and are relatively well-understood (Jeffery, 1922; Maxey, 1983; Ferrante and Elghobashi, 2003; Lundell and Carlsson, 2010; Pumir and Wilkinson, 2011; Pujara and Variano, 2017). Of particular interest to this research are the mesoscale organisms such as zooplankton; their sizes exceed the Kolmogorov scale but are within the inertial subrange of turbulence. Earlier studies have shown that the orientation of an organism plays a significant role in their gravitaxis, settlement, and directed swimming (Roberts and Deacon, 2002). Besides, the active swimming characteristics of such organisms add further complexity to the problem (Michalec et al., 2017).
The motion, aggregation and fragmentation of microplastics in the ocean are also affected by turbulence. Such mesoscale particles are also often non-spherical. Besides being an obvious threat to the environment, these particles also act as rafting mechanism in long distance transport for various organisms that influences the ecological connectivity of the ocean (Thiel and Gutow, 2005; Wright et al., 2013). However, the kinematics of rotation of mesoscale particles are complex; because they experience non-linear shear along their size, these organisms respond to the ambient distribution of angular velocities in a non-trivial way.
Several fundamental studies in the past few years have been devoted to the passive rotation induced by turbulence of spheres (Zimmermann et al., 2011; Klein et al., 2013; Mathai et al., 2016), of complex particles (Pujara et al., 2018), and axisymmetric anisotropic particles [Voth and Soldati (2017) and reference therein]. Two important goals related to these inquiries are to understand: (A) how the statistics of rotation relates to the particle size, and (B) once set to motion by the ambient turbulence, how long a particle continues to preserve its rotation. Considering the simple cylindrical shape as analogous to the shape of various oceanic organisms, the first piece of this puzzle has been addressed extensively in the past for both non-inertial (tracer) (Parsa et al., 2012; Marchioli and Soldati, 2013; Pujara and Variano, 2017) and inertial particles (Parsa and Voth, 2014; Bordoloi and Variano, 2017; Sabban et al., 2017; Bounoua et al., 2018; Kuperman et al., 2019). Inertia might arise due to the density difference between the fiber and the fluid, and/or because of the fiber dimensions (length and diameter) being larger than the Kolmogorov length ηK. In the latter category, long fibers with negligible diameter (d ≤ ηK) were shown to obey Kolmogorov inertial-range scaling such that the variance of the tumbling rate, (Parsa and Voth, 2014). Here, ηK and τK are Kolmogorov length and time scales, respectively. For fibers with large diameter (d ≫ ηK) and small aspect ratio (L/d = 1, 4), Bordoloi and Variano (2017) modified this relationship by replacing particle length (L) by the spherical-volume-equivalent diameter . The deq-based scaling was also found to be consistent for particles of other complex shapes, such as cubes, cuboids, and cones (Pujara et al., 2018).
In general, the rotation of a rigid fiber can be described by the conservation of angular momentum, written in the frame of the particle as
Here, Ω is the total rotation (i.e., spinning and tumbling) rate; I is the moment of inertia tensor of the fiber, and Γf is the total torque applied on the fiber by the turbulent flow. Considering a viscous torque (linear in velocity profile), Bounoua et al. (2018) model the torque as . The first term corresponds to the viscous dissipation. The second term is the forcing term which is responsible for the transfer of energy from the fluid to the fiber. The Coriolis term Ω × (I·Ω) is generally neglected for long fibers assuming that the spinning rate is smaller than the relaxation rate of tumbling. This disputable assumption is generally justified by the weak alignment of long fibers with coarse grained vorticity (Pujara et al., 2019). The Equation (1) then reduces to a simplified Langevin equation,
Here, is the rotational response time and is a colored noise related to the background turbulence. The tumbling rate (ṗ) is then determined by the nature of the forcing ξ and by the ratio of the response time of the particle (τr) and the characteristic time of the forcing . This ratio defines the tumbling Stokes number that scales as:
for a cylindrical fiber of length L and diameter d.
In a previous letter (Bounoua et al., 2018), we modeled ξ as a Dirac function peaked at fiber length, L. This provided a theoretical basis to understand the influence of the fiber inertia on the variance of the tumbling rate via:
The model stated in Equation (4) unified results from Parsa and Voth (2014) and Bordoloi and Variano (2017), and our experimental data over a wide range of aspect ratios. This relation has also been verified recently by Kuperman et al. (2019) for long nylon fibers in air.
While the variance of rotation rate has been investigated in detail, few studies have been devoted to the correlation time of rotation. The main results come from numerical simulation, which are limited to either short (L ≈ 10ηK) (Marchioli and Soldati, 2013) or slender (d < ηK) (Shin and Koch, 2005) fibers. Shin and Koch (2005) showed that in the slender body limit, the correlation time is constant for fiber length smaller than 10ηK and then increases with fiber length. For fibers smaller than Kolmogorov length but heavier than the carrying fluid, Marchioli and Soldati (2013) showed that the correlation time increases with the Stokes number, so with the fiber inertia. Extrapolating our previous model (Bounoua et al., 2018) to inertial fibers longer than the Kolmogorov length, we find that the correlation time of the tumbling rate scales with the forcing time scale, independent of fiber inertia (see section 3). The correlation time is important in understanding the temporal response of an organism to the surrounding turbulence and its rotational diffusivity. For example, a comparison between the response time of a copepod with the frequency of fluctuating nutrient field can help better understand the nutrient uptake event of the organism (Peters and Marrasé, 2000).
Herein, we take an experimental approach to measure the correlation time of rotation for inertial fibers over a wide range of length and diameter. We also take the work of Bounoua et al. (2018) a step further and propose a new model that predicts both variance of tumbling rate and the correlation time scale of tumbling. In section 2, we review the experimental setup and describe our data analysis method. In section 3, we present our results and a theoretical model interpreting the results. Finally, we provide concluding remarks with a discussion about future research directions in section 4.
2. Experimental Setup and Method
The experimental setup consists of a cubic tank (each side = 60 cm) filled with water. We generate homogeneous and isotropic turbulence inside the tank by strategically stirring the water using 8 disks (diameter = 17 cm) with straight blades (height = 5 mm), each mounted on one corner of the tank. Each impeller is set to rotate independently via a 1.5 kW brushless motor at the same frequency but with opposite chirality to its adjacent three nearest neighbors. The turbulence inside the tank, set by the impeller frequency (f = 5, 10, or 15 Hz), is characterized using standard PIV measurements (Xu and Chen, 2013), and is found to be fairly homogeneous and isotropic in the central region (volume ≈ 10 × 10 × 10 cm3). The relevant characteristics of turbulence in the tank are summarized in Table 1. Rigid polystyrene fibers cut to specific length (L = 3.2–40 mm) and diameter (d = 0.5–2.5 mm) are introduced in dilute concentration (<0.01% by volume) into the turbulence tank. We perform experiments on 18 different cases with aspect ratio (Λ = L/d) varying between 1.28 and 80. The details of each experimental case is provided in Table 2. The density of polystyrene (ρd = 1.04 g/cm3) makes the fibers near-neutrally buoyant, and the low fiber concentration allows to neglect the interaction between fibers and the retro-action of the fiber on the turbulence.
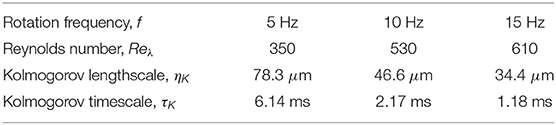
Table 1. Characteristics of turbulence in the cube tank facility.
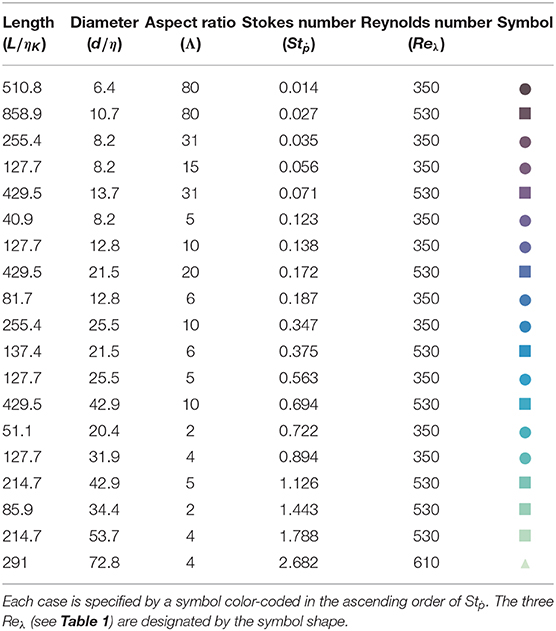
Table 2. Fiber-dimensions (L, d) normalized by Kolmogorov length scale (ηK), aspect ratio (Λ = L/d), and rotational Stokes number (Stṗ) of fibers tested under three specific Reynolds number (Reλ) of the background turbulence.
We image the fibers on two orthogonally arranged 1-MP-high-speed-cameras, all cameras being triggered simultaneously at a frame rate of 0.5–1 kHz. The fibers are backlit onto each camera by an accompanying LED panel with diffuser. Each fiber is reconstructed into the 3D space using a custom MATLAB code. First, the extremities of each fiber are detected in all two images. Then, those extremities are triangulated into the 3D space. Finally, the centroid location (xc, i) and the orientation (pi) of each fiber are optimized such that the difference between the projection of the fiber onto each camera and the actual image is minimized. The measurement volume is that of a cube of ≈ 13 cm length centered at the center of the tank. N ≥ 5, 000 individual trajectories are stored and used to compute the rotation statistics for each case.
The characteristic time of the dynamics of a random signal is given by the correlation function. The correlation function of ṗi(t) is defined as,
Here there is no summation over i. The angle-bracket 〈.〉 indicates mean over all temporal lags, τ = 0 → ∞. For our calculations, we consider trajectories which are longer than 10 ms. Typically, a fast moving particle remains in the camera frame for a shorter duration compared to a slow moving particle. Hence, the trajectory length is dependent on particle speed. To avoid bias in the mean of Cṗi due to the correlation between trajectory length and particle speed, we compute the mean weighted on trajectory length, such that
where Tk is the length of a trajectory and N is the total number of trajectories. The correlation function is normalized by the variance 〈 ṗiṗi〉, such that . For our analysis, we use the average of the three components of , which were statistically indistinguishable. We denote the average as and use it to compute two time scales of rotation. The first time scale is based on the zero-crossing time (τd1) of the Lagrangian autocorrelation function as described in Shin and Koch (2005). The second time scale is the integral time scale computed as:
which is more tractable theoretically as shown later.
Before computing the statistics of rotation, the experimental noise in pi(t) is removed by filtering it through a series of one-dimensional Gaussian kernels of window-size σ ≤ 20 ms (Mordant et al., 2004; Volk et al., 2007). The tumbling rate (ṗi(t)) for each σ is then computed using a symmetric second-order central-difference scheme. Figure 1 demonstrates this method by showing the effect of σ on (a): the mean autocorrelation of tumbling rate , and (b): the integral time-scale of rotational dispersion (τd2). Assuming that the experimentally measured ṗi(t) contains only uncorrelated noise, we extract the noise-free τd2 by fitting a straight line for the linear segment (σ ≥ 10 in this example) of each plot and extrapolating it to σ = 0 (see Figure 1B). We use a critical σc to compute the noise-free mean autocorrelation () of rotation and the zero-crossing time (τd1). We choose σc to be the smallest σ at which the filtered data deviated from the fit by less than 10%. We tested the sensitivity of this criterion by varying it between 5 and 20% and did not find it to affect our results. This is demonstrated in Figure 1B (inset) where we show the evolution of zero-crossing time for the example case.
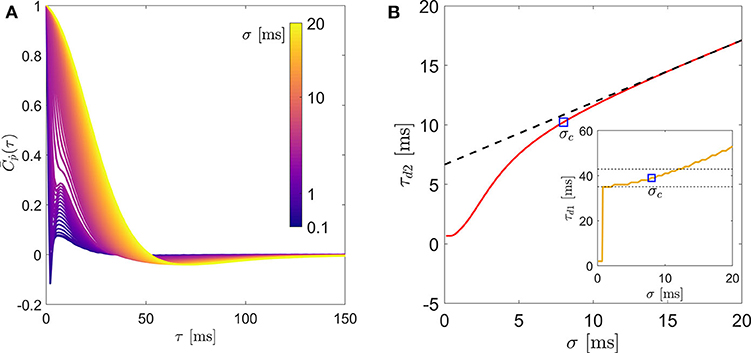
Figure 1. (A) Lagrangian autocorrelation of fiber tumbling rate, (B) the integral time scale of rotation (τd2) and in inset: the zero-crossing time (τd1) of a representative fiber (L = 3.2ηK, d = 0.64ηK) for different filtering window size. The two dashed lines in the inset of (B) indicate a range of ±10% of τd1 obtained from the σc shown by the square symbol.
3. Correlation Time Scale of Tumbling Rate
3.1. Experimental Observation
If we neglect inertia and assume that a fiber of size L is rotated only by eddies of size L, the tumbling rate of the fiber should correlate to a timescale , where uL is the typical velocity at scale L. The mean Lagrangian autocorrelation function of tumbling for various fibers are shown in Figure 2A. This plot includes our measurements and the longest fiber (L = 41.7ηK) simulated by Shin and Koch (2005) at Rλ = 39.9 neglecting fiber inertia (I = 0). With the horizontal-axis normalized by τL, the measurements of the autocorrelation function for fibers with Stṗ < 0.7 are independent of Stṗ and close to the one obtained by Shin and Koch (2005). In all these cases, the zero-crossing time is τd1 = 0.43τL with a 95% confidence interval ±0.02. The difference from the slender body approximation appears after the zero-crossing time, such that our measurements decorrelate on a shorter time scale than simulations by Shin and Koch (2005). For fibers with Stṗ > 0.7, becomes sensitive to Stṗ, such that the zero-crossing time increases with Stṗ.
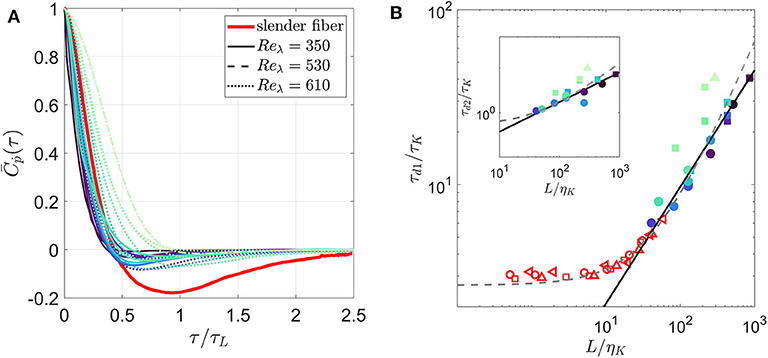
Figure 2. (A) Lagrangian autocorrelation of tumbling rate, (B) the zero-crossing time τd1 and the integral time scale τd2 (see inset) for inertial fibers. Numerical result from Shin and Koch (2005) for a slender fiber with L = 41.7ηK, Reλ = 39.9 is included in (A) and slender fibers at multiple lengths and Reλ = 16.5 ( ), 30.7 (
 ), 39.9 (
 ), and 53.3 (
 ) are included in (B) for comparison. The dashed lines in (B) represent the linear fit (τd/τK = 2.66+0.063L/ηK) suggested in Shin and Koch (2005). This fit is multiplied by the mean ratio of the zero crossing time and the integral time from our data in the inset. Data include particles from very little inertia (
 ) to those with Stṗ > 0.7 (


 ).
).
In Figure 2B, we directly show the evolution of zero-crossing time (τd1) normalized by the Kolmogorov time scale (τK) with respect to normalized fiber length (L/ηK). We also include the zero-crossing time for all slender fibers computed by Shin and Koch (2005). Irrespective of the Reynolds number (Reλ), a 2/3 power-law scaling qualitatively captures the evolution of τd1 for fibers with Stṗ < 0.7. Also, the zero-crossing times reported in Shin and Koch (2005) approach this power-law scaling as their length enters the inertial range. A similar plot for the integral time (τd2) is shown in inset that also demonstrates the 2/3 power-law fit. Shin and Koch (2005) proposed a linear fit for τd1 from their simulations with long fibers (25η < L < 60η); the inertial-range scaling was not obvious there because of the limited range of fiber length they simulated.
Our data agree with the scaling law when Stṗ < 0.7, but not when Stṗ > 0.7. To investigate this effect, we propose an improved version of the model proposed in Bounoua et al. (2018) which captures both the evolution of the variance and the tumbling rate for inertial fibers (L ≥ 10ηK).
3.2. Theoretical Model
In Bounoua et al. (2018), we modeled the forcing torque ξ as a Dirac function peaked at the fiber length, L. As we saw, this assumption fails to predict the effect of fiber inertia on the correlation time scale (τd) measured from our experiments. Here, we assume that the process of filtering due to the integration of the viscous forces along the fiber length is smoother and can be described by a bandpass filter peaked on . In that case, the forcing torque ξ in Fourier space can be scaled as,
with x = ω/ωL and Q is the quality factor of the filter. ξL is the amplitude of the turbulent spectrum at scale L, such that . The quality factor Q determines the width of the band-pass filter as shown on Figure 3. The spectrum reduces to the Dirac function when Q → ∞.
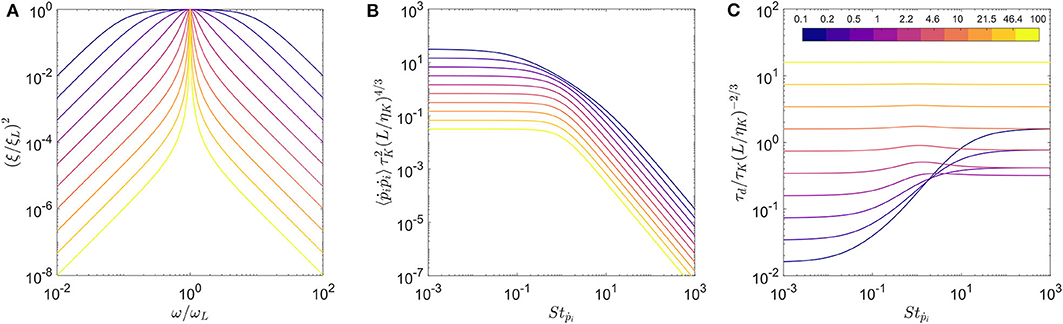
Figure 3. The effect of quality factor (Q) on (A) the white noise spectrum, the transfer functions for (B) variance of tumbling rate and (C) correlation time scale. The colormap indicates the value of Q used for this computation.
The solution of Equation (2) leads to:
For a given spectrum of ξL, one can determine the variance and the correlation time of tumbling rate from Equation (9). For simplicity, we will assume that ξL is a white noise to derive analytical expression for the variance and the tumbling rate. This assumption should hold as long as the quality factor is not too low and that the spectrum is indeed peaked at the frequency ωL. Further, this assumption will be justified by the agreement between the model and our experimental results (which do not match when the Dirac function selects the amplitude of the spectrum only at the frequency ωL). Within this framework, the variance of ṗi is:
In a similar vein, we can derive an analytical expression for the correlation time (τd) of the tumbling rate:
where, Ĉṗ(ω) is the Fourier transform of the autocorrelation of ṗi. Contrary to the definition of the zero-crossing time, this expression is suitable analytically. From Equations (8) and (9), the modulus of the correlation function Ĉ can be written:
Hence, the correlation time τd is,
The solutions for the two transfer functions: and are shown for multiple Q values in Figures 3B,C, respectively. The rescaled variance for all Q values show similar trends with a plateau for low Stokes number, and its value decreasing as for higher Stokes numbers as observed for the Dirac function approximation in Bounoua et al. (2018). Also, the Stokes number where the transition between these two regimes occurs increases with decreasing Q (see Figure 3B). The correlation time for the large values of Q is almost constant irrespective of Stokes number, which is a trend observed for the Dirac function formulation in Bounoua et al. (2018). For smaller values of Q, we observe that the correlation time increases beyond Stṗ ≈ 1 and eventually reaches a plateau.
We test this model on our experimental measurements of 〈 ṗiṗi〉 and τd1 in Figures 4A,B, respectively. We fit Equations (10) and (13) simultaneously using two least-squares fits with 3 fitting parameters: besides the quality factor Q, we introduce a parameter α to compensate the scaling in tumbling Stokes number Stṗ (see Equation 4), and a parameter β to compensate the scaling in the amplitude of the spectrum ξ (see Equation 8). This last parameter is fully justified to compare our prediction with the measurement of the zero-crossing time τd1 and to compensate the finiteness of the trajectory for the evaluation of the correlation time τd2. The best fit for τd1 is reached for Q = 0.72, α = 0.41, and β = 3.12. A similar fit to the integral time (τd2) has yielded the same Q and α, but a smaller scaling factor (β = 0.64) because of the lower magnitude in τd2 seen previously (see Figure 2B). The dashed lines in each plot represent the predictions from Bounoua et al. (2018). Results show that although the previous model is able to predict the variance of tumbling rate, it fails to estimate the evolution of the correlation time. The current model predicts both quantities very well. Our fitted results for Q shows that the inertial effects begin for Stṗ between 0.1 to 1. This agrees qualitatively with the critical Stṗ = 0.7 that we chose by eye in Figure 2.
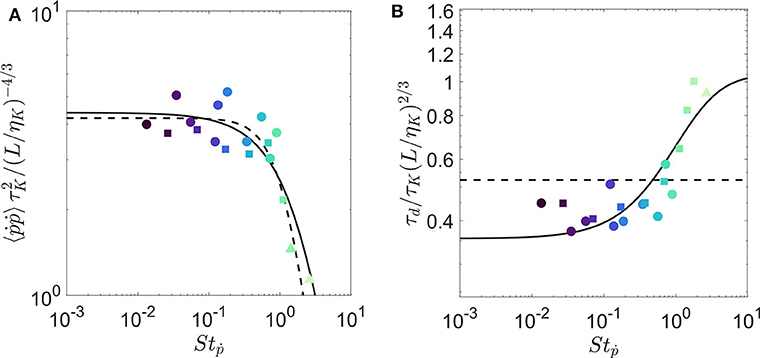
Figure 4. Evolution of transfer functions of (A) variance of tumbling rate and (B) correlation time-scale of rotation with respect to rotational Stokes number for fibers of various length and diameter.
4. Summary and Closing Comments
We report experimental measurements of Lagrangian autocorrelation of tumbling rate of inertial fibers in homogeneous isotropic turbulence that is applicable to zooplankton-like organisms in their non-active state. Based on the zero-crossing and the integral of the mean autocorrelation function, we compute two correlation times (τd1 and τd2) for fibers with a wide range of length and aspect ratio. The inertia of a fiber is quantified using a rotational Stokes number (Stṗ) that takes into account fiber length, diameter, as well as the relative density. For low Stṗ, both correlation times from our measurement follow Kolmogorov's inertial range scaling of . This scaling is further supported by the numerically computed zero-crossing times for long slender fibers (L > 10ηK) in Shin and Koch (2005). For fibers with high Stṗ, the rotation rate escapes this prediction. We find that our previous model (Bounoua et al., 2018) designed for the variance of tumbling rate does not capture the effect of fiber inertia on correlation time. Instead of assuming the spectrum of background excitation to be a simple Dirac function peaked at the fiber length, we model the excitation as a white noise filtered by a bandpass filter (viscous torque). The evolution of the tumbling rate can then be described by a Langevin equation with a response time given by the fiber inertia. We show that this model recovers the evolution of both the variance and the correlation time of tumbling rate for the range of explored Stokes number.
Recent studies on settling of anisotropic particles in turbulent flows (Lopez and Guazzelli, 2017; Gustavsson et al., 2019; Roy et al., 2019) argue that non-linear torque plays an important role on the orientation dynamics. It can be surprising that our model, which only considers viscous torque, is in very good agreement with our measurements. We attribute this contradiction to two main differences between ours and these studies on settling: (a) the settling speed in our case is negligible compared to turbulent fluctuations, and (b) the size of particles considered in the latter case are generally smaller than the Kolmogorov length. A direct estimation of inertial torque requires measurement of fluid velocity around the particle, which is beyond the scope of this work. Future experiments or DNS study will help better understand the importance of inertial torque in the rotational kinematics of fibers.
Oceanic organisms such as zooplankton are capable of active locomotion in turbulence. Results from this investigation will help in addressing the biological aspect of their locomotion by separating the passive rotation from their active swimming.
Finally, to fully characterize the rotation of an anisotropic inertial particle, it is necessary to investigate also its spinning motion, which is currently underway in our laboratory. This quantity has been shown to be larger than the tumbling for fibers smaller than the Kolmogorov length due to a preferential alignment (Parsa et al., 2012). Measuring spinning along with tumbling will also help estimating the total torque and lift experienced by a fiber.
Data Availability Statement
The datasets generated for this study are available on request to the corresponding author.
Author Contributions
GV collected the data. AB and GV analyzed the data. AB, GV, and EV wrote the manuscript. All authors contributed to the article and approved the submitted version.
Funding
This work was carried out in the framework of FlexFiT Project (ANR-17-CE30-0005-01) funded by the French National Research Agency (ANR), the Labex MEC Project (No. ANR-10-LABX-0092) and of the A*MIDEX Project (No. ANR-11-IDEX-0001-02), funded by the Investissements d'Avenir French Government program managed by the French National Research Agency (ANR). In addition to NSF, this work and its open-access publication was supported by the University of California.
Conflict of Interest
The authors declare that the research was conducted in the absence of any commercial or financial relationships that could be construed as a potential conflict of interest.
Acknowledgments
The authors acknowledge the support of S. Bounoua and G. Bouchet in collection of data used in this manuscript.
References
Bordoloi, A. D., and Variano, E. (2017). Rotational kinematics of large cylindrical particles in turbulence. J. Fluid Mech. 815, 199–222. doi: 10.1017/jfm.2017.38
Bounoua, S., Bouchet, G., and Verhille, G. (2018). Tumbling of inertial fibers in turbulence. Phys. Rev. Lett. 121:124502. doi: 10.1103/PhysRevLett.121.124502
Byron, M. L. (2015). The rotation and translation of non-spherical particles in homogeneous isotropic turbulence (Ph.D. thesis). University of California, Berkeley, Berkeley, CA, United States.
Durham, W. M., and Stocker, R. (2012). Thin phytoplankton layers: characteristics, mechanisms, and consequences. Annu. Rev. Mar. Sci. 4, 177–207. doi: 10.1146/annurev-marine-120710-100957
Ferrante, A., and Elghobashi, S. (2003). On the physical mechanisms of two-way coupling in particle-laden isotropic turbulence. Phys. Fluids 15, 315–329. doi: 10.1063/1.1532731
Gilbert, O. M., and Buskey, E. J. (2005). Turbulence decreases the hydrodynamic predator sensing ability of the calanoid copepod Acartia tonsa. J. Plankton Res. 27, 1067–1071. doi: 10.1093/plankt/fbi066
Gustavsson, K., Sheikh, M. Z., Lopez, D., Naso, A., Pumir, A., and Mehlig, B. (2019). Effect of fluid inertia on the orientation of a small prolate spheroid settling in turbulence. N. J. Phys. 21:083008. doi: 10.1088/1367-2630/ab3062
Jeffery, G. B. (1922). The motion of ellipsoidal particles immersed in a viscous fluid. Proc. R. Soc. Lond. Ser. A 102, 161–179. doi: 10.1098/rspa.1922.0078
Klein, S., Gibert, M., Bérut, A., and Bodenschatz, E. (2013). Simultaneous 3d measurement of the translation and rotation of finite size particles and the flow field in a fully developed turbulent water flow. Meas. Sci. Techol. 24:024006. doi: 10.1088/0957-0233/24/2/024006
Kuperman, S., Sabban, L., and van Hout, R. (2019). Inertial effects on the dynamics of rigid heavy fibers in isotropic turbulence. Phys. Rev. Fluids 4:064301. doi: 10.1103/PhysRevFluids.4.064301
Lopez, D., and Guazzelli, E. (2017). Inertial effects on fibers settling in a vortical flow. Phys. Rev. Fluids 2:024306. doi: 10.1103/PhysRevFluids.2.024306
Lundell, F., and Carlsson, A. (2010). Heavy ellipsoids in creeping shear flow: transitions of the particle rotation rate and orbit shape. Phys. Rev. E 81:016323. doi: 10.1103/PhysRevE.81.016323
MacKenzie, B. R., Miller, T. J., Cyr, S., and Leggett, W. C. (1994). Evidence for a dome-shaped relationship between turbulence and larval fish ingestion rates. Limnol. Oceanogr. 39, 1790–1799. doi: 10.4319/lo.1994.39.8.1790
Marchioli, C., and Soldati, A. (2013). Rotation statistics of fibers in wall shear turbulence. Acta Mech. 224, 2311–2329. doi: 10.1007/s00707-013-0933-z
Mathai, V., Neut, N. W. M., van der Poel, E. P., and Sun, C. (2016). Translational and rotational dynamics of a large buoyant sphere in turbulence. Exp. Fluids 57:51. doi: 10.1007/s00348-016-2136-6
Maxey, M. R. (1983). Equation of motion for a small rigid sphere in a nonuniform flow. Phys. Fluids 26:883. doi: 10.1063/1.864230
Michalec, F.-G., Fouxon, I., Souissi, S., and Holzner, M. (2017). Zooplankton can actively adjust their motility to turbulent flow. Proc. Natl. Acad. Sci. U.S.A. 114, E11199–E11207. doi: 10.1073/pnas.1708888114
Mordant, N., Crawford, A., and Bodenschatz, E. (2004). Experimental Lagrangian acceleration probability density function measurement. Phys. D Nonlinear Phenomena 193, 245–251. doi: 10.1016/j.physd.2004.01.041
Nguyen, H., Karp-Boss, L., Jumars, P. A., and Fauci, L. (2011). Hydrodynamic effects of spines: a different spin. Limnol. Oceanogr. Fluids Environ. 1, 110–119. doi: 10.1215/21573698-1303444
Pahlow, M., Riebesell, U., and Wolf-Gladrow, D. A. (1997). Impact of cell shape and chain formation on nutrient acquisition by marine diatoms. Limnol. Oceanogr. 42, 1660–1672. doi: 10.4319/lo.1997.42.8.1660
Parsa, S., Calvazarini, E., Toschi, F., and Voth, G. A. (2012). Rotation rate of rods in turbulent fluid flow. Phys. Rev. Lett. 109:134501. doi: 10.1103/PhysRevLett.109.134501
Parsa, S., and Voth, G. A. (2014). Inertial range scaling in rotations of long rods in turbulence. Phys. Rev. Lett. 112:024501. doi: 10.1103/PhysRevLett.112.024501
Peters, F., and Marrasé, C. (2000). Effects of turbulence on plankton: an overview of experimental evidence and some theoretical considerations. Mar. Ecol. Prog. Ser. 205, 291–306. doi: 10.3354/meps205291
Pujara, N., Oehmke, T. B., Bordoloi, A. D., and Variano, E. A. (2018). Rotations of large inertial cubes, cuboids, cones, and cylinders in turbulence. Phys. Rev. Fluids 3:054605. doi: 10.1103/PhysRevFluids.3.054605
Pujara, N., and Variano, E. A. (2017). Rotations of small, inertialess triaxial ellipsoids in isotropic turbulence. J. Fluid Mech. 821, 517–538. doi: 10.1017/jfm.2017.256
Pujara, N., Voth, G. A., and Variano, E. A. (2019). Scale-dependent alignment, tumbling and stretching of slender rods in isotropic turbulence. J. Fluid Mech. 860, 465–486. doi: 10.1017/jfm.2018.866
Pumir, A., and Wilkinson, M. (2011). Orientation statistics of small particles in turbulence. N. J. Phys. 13:093030. doi: 10.1088/1367-2630/13/9/093030
Reidenbach, M. A., Koseff, J. R., and Koehl, M. A. R. (2009). Hydrodynamic forces on larvae affect their settlement on coral reefs in turbulent, wave-driven flow. Limnol. Oceanogr. 54, 318–330. doi: 10.4319/lo.2009.54.1.0318
Roberts, A. M., and Deacon, F. M. (2002). Gravitaxis in motile micro-organisms: the role of fore-body asymmetry. J. Fluid Mech. 452, 405–423. doi: 10.1017/S0022112001006772
Rothschild, B., and Osborn, T. (1988). Small-scale turbulence and plankton contact rates. J. Plankton Res. 10, 465–474. doi: 10.1093/plankt/10.3.465
Roy, A., Hamati, R. J., Tierney, L., Koch, D. L., and Voth, G. A. (2019). Inertial torques and a symmetry breaking orientational transition in the sedimentation of slender fibres. J. Fluid Mech. 875, 576–596. doi: 10.1017/jfm.2019.492
Sabban, L., Cohen, A., and van Hout, R. (2017). Temporally resolved measurements of heavy, rigid fibre translation and rotation in nearly homogeneous isotropic turbulence. J. Fluid Mech. 814, 42–68. doi: 10.1017/jfm.2017.12
Shin, M., and Koch, D. (2005). Rotational and translational dispersion of fibres in isotropic turbulent flows. J. Fluid Mech. 540:143. doi: 10.1017/S0022112005005690
Sutherland, K. R., Costello, J. H., Colin, S. P., and Dabiri, J. O. (2014). Ambient fluid motions influence swimming and feeding by the ctenophore Mnemiopsis leidyi. J. Plankton Res. 36, 1310–1322. doi: 10.1093/plankt/fbu051
Thiel, M., and Gutow, L. (2005). “The ecology of rafting in the marine environment. II. The rafting organisms and community,” in Oceanography and Marine Biology, eds R. N. Gibson, R. J. A. Atkinson, and J. D. M. Gordon (Boca Raton, FL: CRC Press), 279–418. doi: 10.1201/9781420037449.ch7
Volk, R., Mordant, N., Verhille, G., and Pinton, J.-F. (2007). Laser doppler measurement of inertial particle and bubble accelerations in turbulence. Europhys. Lett. 81:34002. doi: 10.1209/0295-5075/81/34002
Voth, G., and Soldati, A. (2017). Anisotropic particles in turbulence. Annu. Rev. Fluid Mech. 49:249. doi: 10.1146/annurev-fluid-010816-060135
Wright, S. L., Thompson, R. C., and Galloway, T. S. (2013). The physical impacts of microplastics on marine organisms: a review. Environ. Pollut. 178, 483–492. doi: 10.1016/j.envpol.2013.02.031
Xu, D., and Chen, J. (2013). Accurate estimate of turbulent dissipation rate using PIV data. Exp. Thermal Fluid Sci. 44, 662–672. doi: 10.1016/j.expthermflusci.2012.09.006
Keywords: fiber in turbulence, Lagrangian turbulence, timescale, microplasitcs, tumbling, marine organism
Citation: Bordoloi AD, Variano E and Verhille G (2020) Lagrangian Time Scale of Passive Rotation for Mesoscale Particles in Turbulence. Front. Mar. Sci. 7:473. doi: 10.3389/fmars.2020.00473
Received: 08 January 2020; Accepted: 27 May 2020;
Published: 26 June 2020.
Edited by:
David Murphy, University of South Florida, United StatesReviewed by:
Perry Johnson, Stanford University, United StatesGaetano Sardina, Chalmers University of Technology, Sweden
Copyright © 2020 Bordoloi, Variano and Verhille. This is an open-access article distributed under the terms of the Creative Commons Attribution License (CC BY). The use, distribution or reproduction in other forums is permitted, provided the original author(s) and the copyright owner(s) are credited and that the original publication in this journal is cited, in accordance with accepted academic practice. No use, distribution or reproduction is permitted which does not comply with these terms.
*Correspondence: Ankur D. Bordoloi, YWVyaWFsczAwQGdtYWlsLmNvbQ==