 Andrea Anton1*
 Hanan Almahasheer2
 Antonio Delgado3
 Neus Garcias-Bonet1
 Paloma Carrillo-de-Albornoz1
 Núria Marbà4
 Iris Eline Hendriks4
 Dorte Krause-Jensen5
 Vincent Saderne1
 Kimberlee Baldry6
 Carlos M. Duarte1
- 1Red Sea Research Center and Computational Bioscience Research Center, King Abdullah University of Science and Technology, Thuwal, Saudi Arabia
- 2Department of Biology, College of Science, Imam Abdulrahman Bin Faisal University (IAU), Dammam, Saudi Arabia
- 3Instituto Andaluz de Ciencias de la Tierra, CSIC-UGR, Armilla, Spain
- 4Global Change Research Group, Instituto Mediterráneo de Estudios Avanzados, CSIC-UIB, Esporles, Spain
- 5Department of Bioscience, Aarhus University, Silkeborg, Denmark
- 6Institute for Marine and Antarctic Studies, University of Tasmania, Hobart, NSW, Australia
Mangroves are important coastal ecosystems of warm climatic regions that often grow in shallow saline or brackish waters of estuaries and river mouths which are affected by wide tidal intervals and receive abundant nutrient supply. However, mangroves also occur in areas of little tidal influence and devoid of riverine inputs, where they can develop a stunted plant form. Here we report that Avicennia marina trees in the fringe of the Red Sea have maximum heights toward the lower range of that reported elsewhere (average maximum canopy height of 4.95 m), especially in the central region, where mangroves are stunted with an average tree height of 2.7 m. Maximum tree height and chlorophyll a concentration correlated positively with nitrogen concentration in the leaves of A. marina. We conclude that the stunted nature of mangrove trees in the central Red Sea is likely driven by nitrogen limitation.
Introduction
Mangroves are halophytic trees that can form extensive forests along tropical and subtropical coastlines. Mangroves are highly productive ecosystems (average of 218 ± 72 Tg C year–1; Bouillon et al., 2008) and intense carbon sinks (global average of >1,000 Mg C ha–1 mostly stored locally on their sediments; Donato et al., 2011), conforming to important Blue Carbon ecosystems (Macreadie et al., 2019). Mangrove habitats deliver many additional ecosystem services, such as the provision of important nursery habitat, protection of the coastline from erosion, and provision of thermal refuge for fauna (Mumby et al., 2004; Barbier et al., 2011; Giomi et al., 2019; Saderne et al., 2019b). Mangroves occur in 118 countries worldwide, covering an estimated global area of almost 140,000 km2 (Giri et al., 2011), which sharply declined in the second half of the 20th century at rates of 1–3% year–1 (Valiela et al., 2001), resulting in an estimated global decline in mangrove area of 30–50% over the past century (Donato et al., 2011).
Along the Red Sea coast, Avicennia marina mangrove forests—first known to Western science in the Red Sea by Pliny the Elder (23–79 AD)—grow from their northern latitudinal limit at 27.7°N (Hickey et al., 2017) to the Bab-el-Mandeb Strait, connecting the Red Sea to the Indian Ocean. Due to the small tidal range, they form a narrow belt in the region (Hickey et al., 2017). Red Sea mangroves cover about 135 km2 of the coastline and are slowly expanding (Almahasheer et al., 2016a), in contrast with their estimated global decline (Valiela et al., 2001; Hamilton and Casey, 2016). Mangrove trees in the Red Sea are suspected to be stunted as trees in the central Red Sea reach short heights of ∼2–3 m, whereas they have been observed to grow taller toward the southern Red Sea (Almahasheer et al., 2016b). The stunted nature of mangroves in the central Red Sea has been hypothesized to reflect nutrient limitation, rather than climatic constraints, as supported by strong evidence of nutrient (largely nitrogen and iron) limitation derived from the assessment of responses of seedlings to experimental nutrient inputs (Almahasheer et al., 2016b) and the analyses of leaf nutrient concentration (Almahasheer et al., 2016c). Experimental fertilization elsewhere demonstrate site-specific mangrove nutrient limitation by nitrogen—N, phosphorous—P, and/or iron—Fe (Feller, 1995; Feller et al., 2003; Lovelock et al., 2004, 2006; Naidoo, 2009), with N limitation associated previously with the height of A. marina trees in South Africa (Naidoo, 2009).
The Red Sea is characterized by a strong nutrient gradient, with nutrient-rich Indian Ocean waters entering the Red Sea in the south and waters becoming progressively oligotrophic toward the north due to the absence of riverine nutrient inputs (Raitsos et al., 2015). In fact, this latitudinal nutrient gradient is reflected in a decrease in sediment N stocks in mangroves and seagrass meadows from south to north and a subsequent increase in the sediment C/N ratio (Garcias-Bonet et al., 2019). Similarly, the stable N isotopic composition of Red Sea mangrove leaves and sediments, which become lighter toward the north, suggests a change in N sources from nitrates in the south to atmospheric N fixation in the north (Duarte et al., 2018; Garcias-Bonet et al., 2019). Therefore, nutrient limitation of mangrove stands is expected to increase from south to north along the Red Sea. However, salinity increases from the south to the hypersaline conditions in the north and temperature declines along the latitudinal gradient (Sawall et al., 2015; Saderne et al., 2019a; Anton et al., 2020). High salinity has been shown to also contribute to dwarfing of A. marina in South Africa (Naidoo, 2006) and to influence growth and leaf turnover of the mangrove Avicennia germinans in the Caribbean (Suárez and Medina, 2005). In the Red Sea, these latitudinal gradients could contribute to regulating the growth and the maximum height of A. marina.
Here we test the hypothesis that nutrient status is related to mangrove tree maximum height and plant performance (growth rate and photosynthesis rates), resulting in parallel increases in tree height, plant performance, and nutrient status southward along the Red Sea. We do so by measuring the nutrient concentration (N, P, and Fe) in leaves and sediments as well as the maximum tree height, growth rates, and photosynthetic parameters (Pmax and quantum yield) of A. marina in 18 stands along the Saudi coast of the Red Sea and testing the relationships between nutrient status and plant height and performance.
Materials and Methods
Study Sites
We visited 18 mangrove stands along the Saudi coast in the Red Sea, spanning almost nine latitudinal degrees (from 18.009 to 26.915 latitude; Figure 1). Most study sites were visited during two cruises on board of the R/V Thuwal in February 2016 and March 2017, with each cruise spanning 2 weeks. Additionally, the sites in the central Red Sea were accessed using small local boats in November 2015 and April 2016. At each site, we surveyed the fringe zone and measured the maximum tree height, branch elongation, and internode production as proxies of growth and leaf fluorescence as proxy of leaf physiological performance. We also collected mangrove leaves and sediments to measure the nutrient concentration and the chlorophyll a (chl a) abundance of leaves.
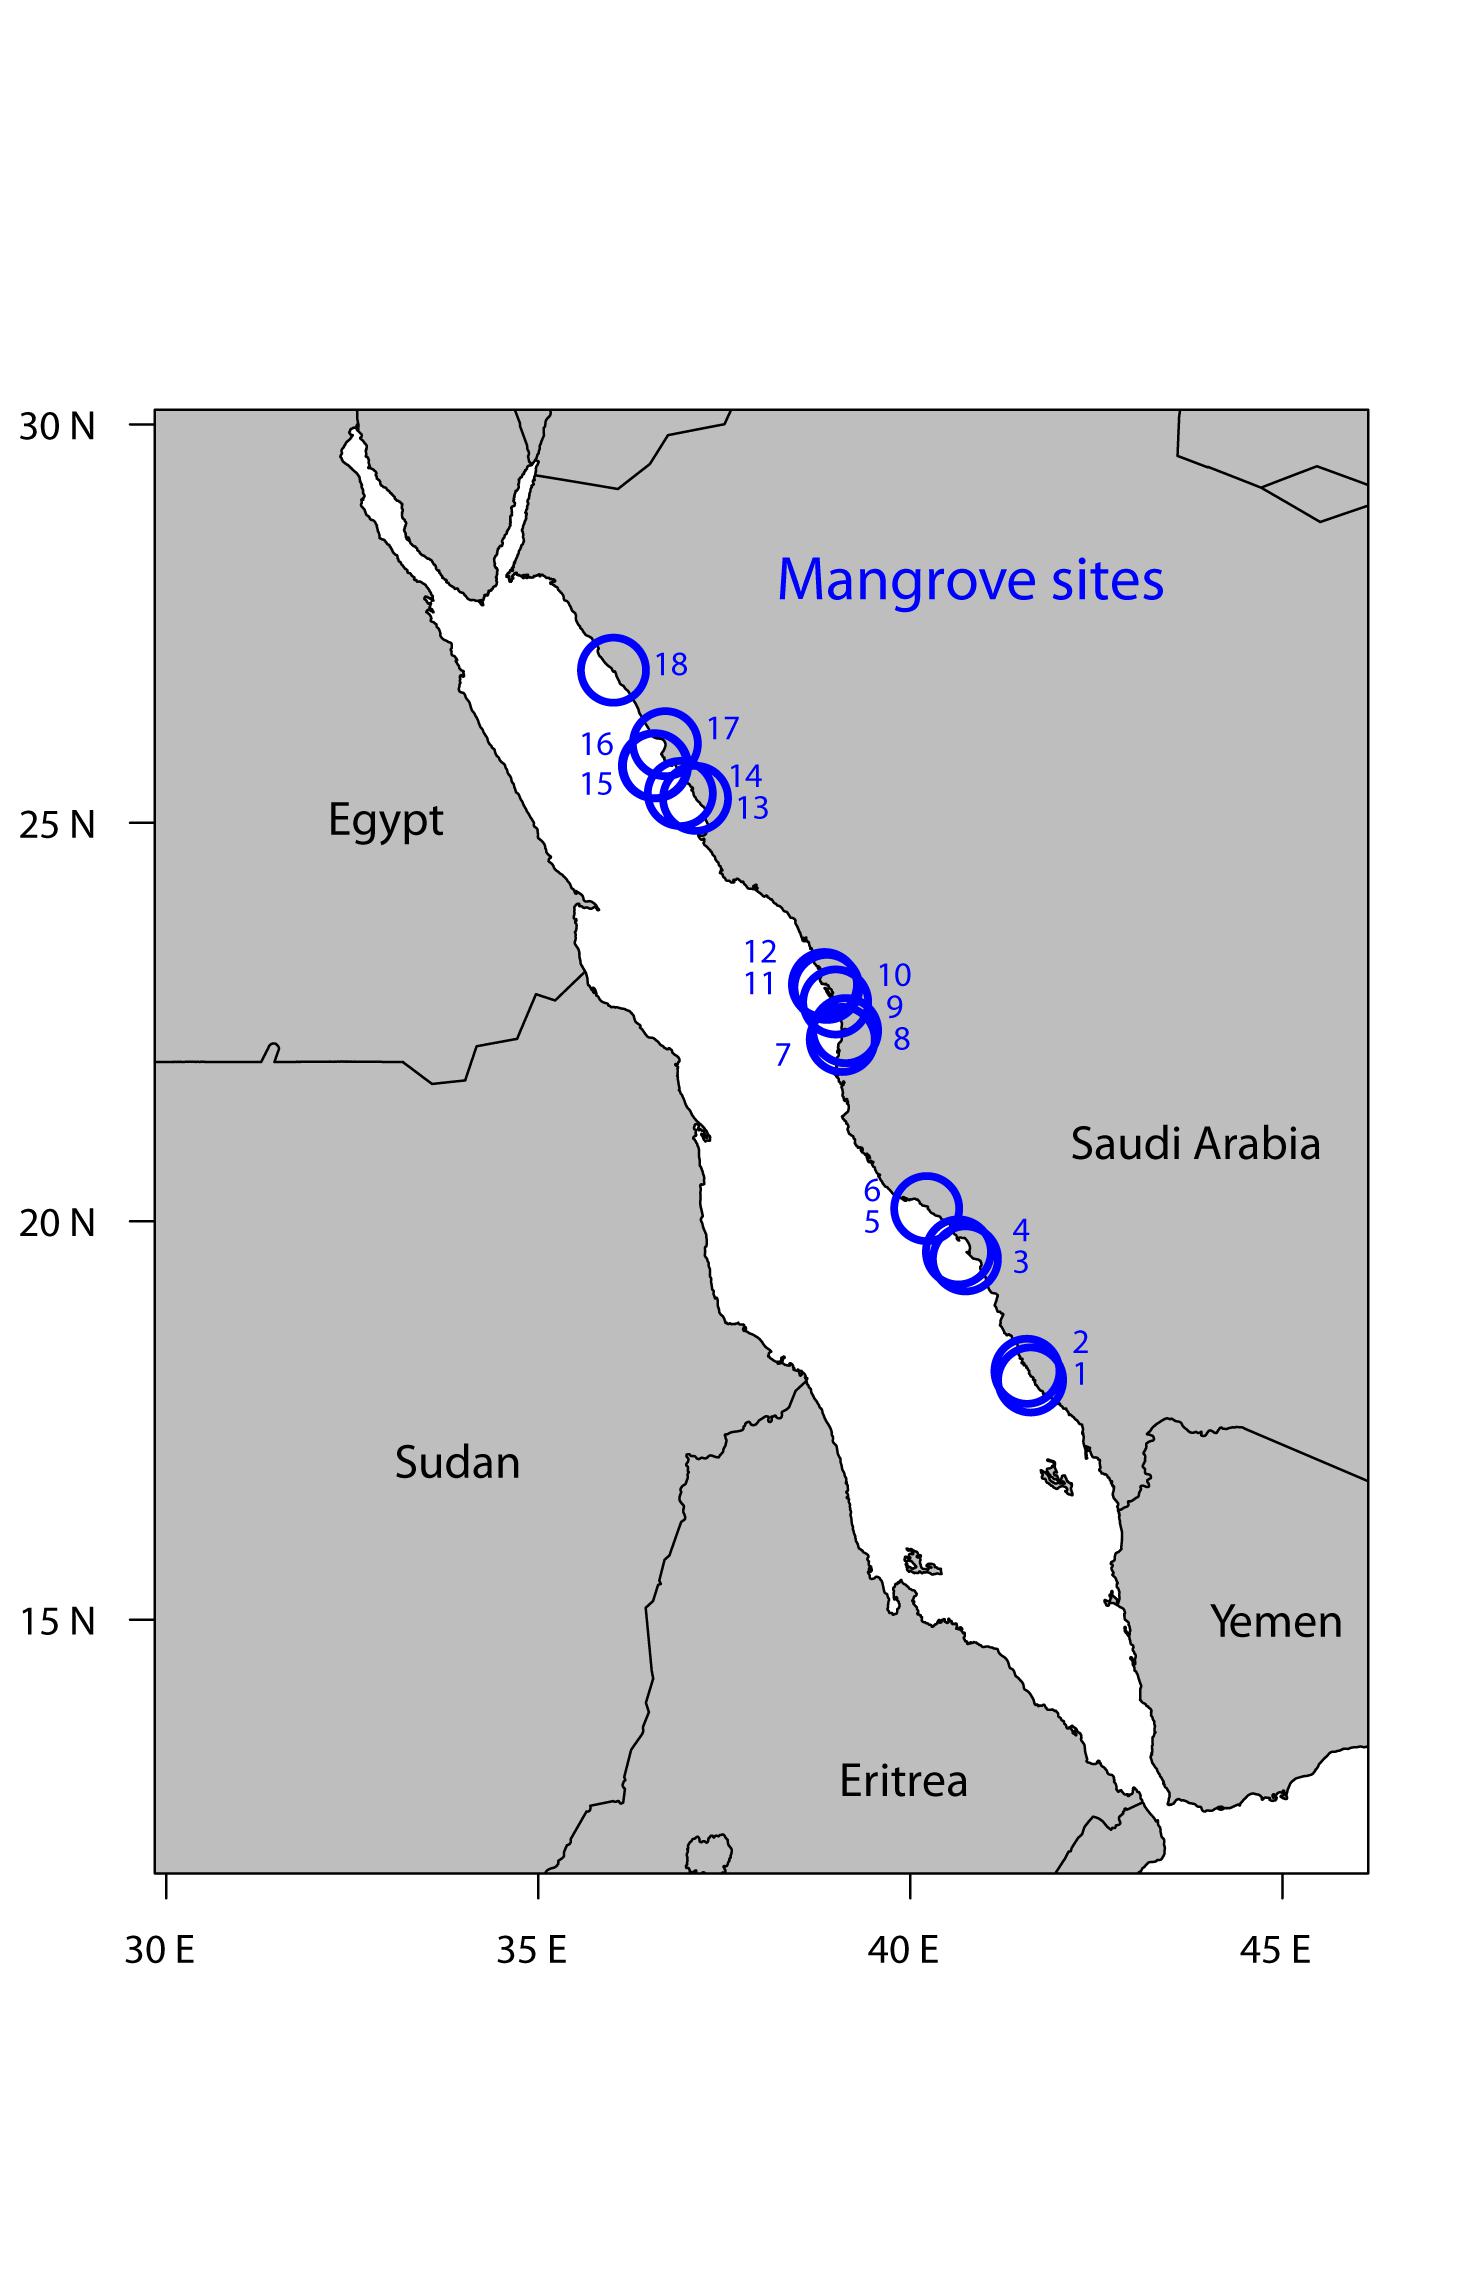
Figure 1. Map of the 18 study sites along the Saudi Arabian coast in the Red Sea. Additional information about the sampling locations can be found in Supplementary Table S1. The sites are numbered by increasing latitude.
Assessment of Mangrove Tree Height and Growth
Maximum tree height was estimated by measuring the height of the tallest three to four trees (except in two sites on which one and two trees were assessed) along 100 m of the fringing mangrove. Tree height was estimated by measuring the distance from the tree to the observer and the angle to the top of the tree, based on trigonometric principles and facilitated by an iPad application. On each tree stand, we measured the length of consecutive internodes along tree branches (and along the main axis) of A. marina from the apical meristem to the hypocotyl. The seasonality imprinted on the length of the internodes—the tree producing shorter internodes in winter and longer ones in summer—allowed the estimation of annual growth rates assessed as the number of internodes (number of internodes produced per year) and branch (including the main axis) elongation in between consecutive maxima or minima of internodal length (Coulter et al., 2001; Padilla et al., 2004; Almahasheer et al., 2016c).
In situ Physiological Performance of the Mangrove Leaves
In eight locations, chl a fluorescence measurements were performed in situ on the leaves of five to seven trees per site using a Pulse Amplitude Modulated Diving-PAM (Walz, Germany). All measurements were conducted for the leaves located at a medium height of the tree and exposed to full sunlight. Rapid light curves (RLCs; Ralph and Gademann, 2005) were generated after 5 min of dark adaptation of the leaves by applying a saturating pulse followed by a series of eight increasing actinic light intensities (μmol photons m–2 s–1). At the end of each interval, the effective quantum yield was recorded after illuminating the sample with a saturating light pulse. The relative electron transport rate (ETRr) was calculated at each increasing light intensity following Beer et al. (2001):
where the average ratio of PSII reaction centers to PSI reaction centers was considered as 0.5 and the absorbance factor for mangrove leaves was estimated as 1 by measuring light transmission through the leaves of A. marina following Beer (1998). The RLCs were fitted to the eight ETRr measurements (μmol electrons m–2 s–1) per sample using the equations defined by Eilers and Peeters (1988); then, maximum ETRr was obtained from each curve. This maximum ETRr was used as a proxy of maximum productivity (or Pmax). Effective quantum yield efficiency (Y) was calculated as follows:
where Fm is the maximal fluorescence in dark-adapted leaves and F0 is the initial fluorescence in dark-adapted leaves.
Analysis of Elemental N, P, and Fe and the Concentration of chl a in the Mangrove Leaves
For the elemental analysis of C, N, P, and Fe, we analyzed two pairs of the first leaves from four to seven trees at each study site (except for two sites on which we analyzed only one sample and one site on which we analyzed two samples). The leaves were dried at 60°C and powderized using an agate mortar and pestle. The elemental nitrogen content was quantified from 8–9 mg of this powderized mangrove leaf tissue using the thermal conductivity detector of Organic Elemental Analyzer Flash 2000 (Thermo Fisher Scientific, MA, United States). The detection limit of this machine is 0.001 mg of organic N, and none of our samples was close to this value. Two to four sediment samples were collected per study site using cylindrical plastic cores of 9.5 cm in diameter by 30 cm in length containing at least 10 cm of sediment. The sediments were dried at 60°C and acidified with hydrochloric acid (3 M) to remove inorganic carbon. Sediment organic N content in 10–11 mg of the sediment samples was also assessed using Organic Elemental Analyser Flash 2000 (Thermo Fisher Scientific, MA, United States). For assessing the P and the Fe concentrations of the leaves and the sediments, 50–100 mg of powderized sample material was digested with 5 ml of HNO3 (69%) and 1 ml of H2O2 (30%) using a two-step temperature heating protocol [see Anton et al. (2018) for further details]. The samples were analyzed using an inductively coupled plasma-optical emission spectrometer (Varian Inc. model 720-ES, CA, United States).
The chl a concentration was assessed on the leaves of seven trees per site (except in three sites for which three, four, and five measurements were performed) by cutting a 1-cm-diameter disk of frozen leaf tissue. The samples were broken using beads on a TissueLyser II (Qiagen, Germany), and chl a was extracted by placing the sample overnight in 10 ml of 80% acetone in the dark. The pigment concentration was calculated spectrophotometrically by measuring the absorbance at 646-, 663-, and 710-nm wavelengths and calculating following Wellburn (1994) [see Anton et al. (2018) for further details].
Statistical Analyses
To assess the effect of latitude on different mangrove biological parameters (i.e., tree height, internode production, branch elongation, chl a concentration, Pmax, and quantum yield) and the elemental composition of the leaves (N, P, and Fe%) and the sediments (N, P, and Fe%), we first calculated the mean per site. We then ran independent models–linear, polynomial, and exponential—using latitude as a continuous predictor and the biological parameters (e.g., tree height, internode production, branch elongation, chl a concentration, maximum ETRr, and quantum yield) as continuous response variables. The three models that we compared were (1) simple regressions (y∼x), (2) polynomial type 2 models (y∼x + x2), and (3) exponential non-linear models with two parameters y∼a ∗ exp (b∗x). We used Akaike Information Criterion (AIC) to select the best model among those three for each relationship (Burnham and Anderson, 2004). To test the relationship between the elemental composition of the leaves and mangrove biological parameters, we also used the mean value per site and then ran the three types of models (linear, polynomial, and exponential as specified above) and selected the best one also using AIC.
Results
The mangrove stands ranged almost 10-fold in maximum canopy height from stunted (mean ± SD, 2.2 ± 0.20 m on site 10; Figure 2A) to tall (mean ± SD, 14.03 ± 2.32 m on site 5) A. marina trees. The tallest trees were found in one of the southern sites of the Red Sea (>13.5 m at site 5 in Al Lith, latitude 20.16° N), while the smallest canopies were found in the central Red Sea (slightly over 2-m tall at sites 7, 10, and 12, latitudes between 22.28 and 22.75 N, respectively; Figure 1 and Supplementary Table S1), with the mangrove trees near the latitudinal limit in the northern Red Sea having intermediate canopy heights (3.75 m in site 18; Figure 2A). However, small mangrove trees (<5 m) were also present in the southern Red Sea (Figure 2A). Consequently, there was no significant relationship between maximum tree height and latitude (p-values > 0.05; Figure 2A and Supplementary Table S2). While the internode production rates (9.19 ± 0.62 internodes branch–1 year–1) were rather uniform along the Saudi coast of the Red Sea (Figure 2C), the branch elongation rate was lowest in the central Red Sea (polynomial relationship; p = 0.041; Figure 2B and Supplementary Table S2).
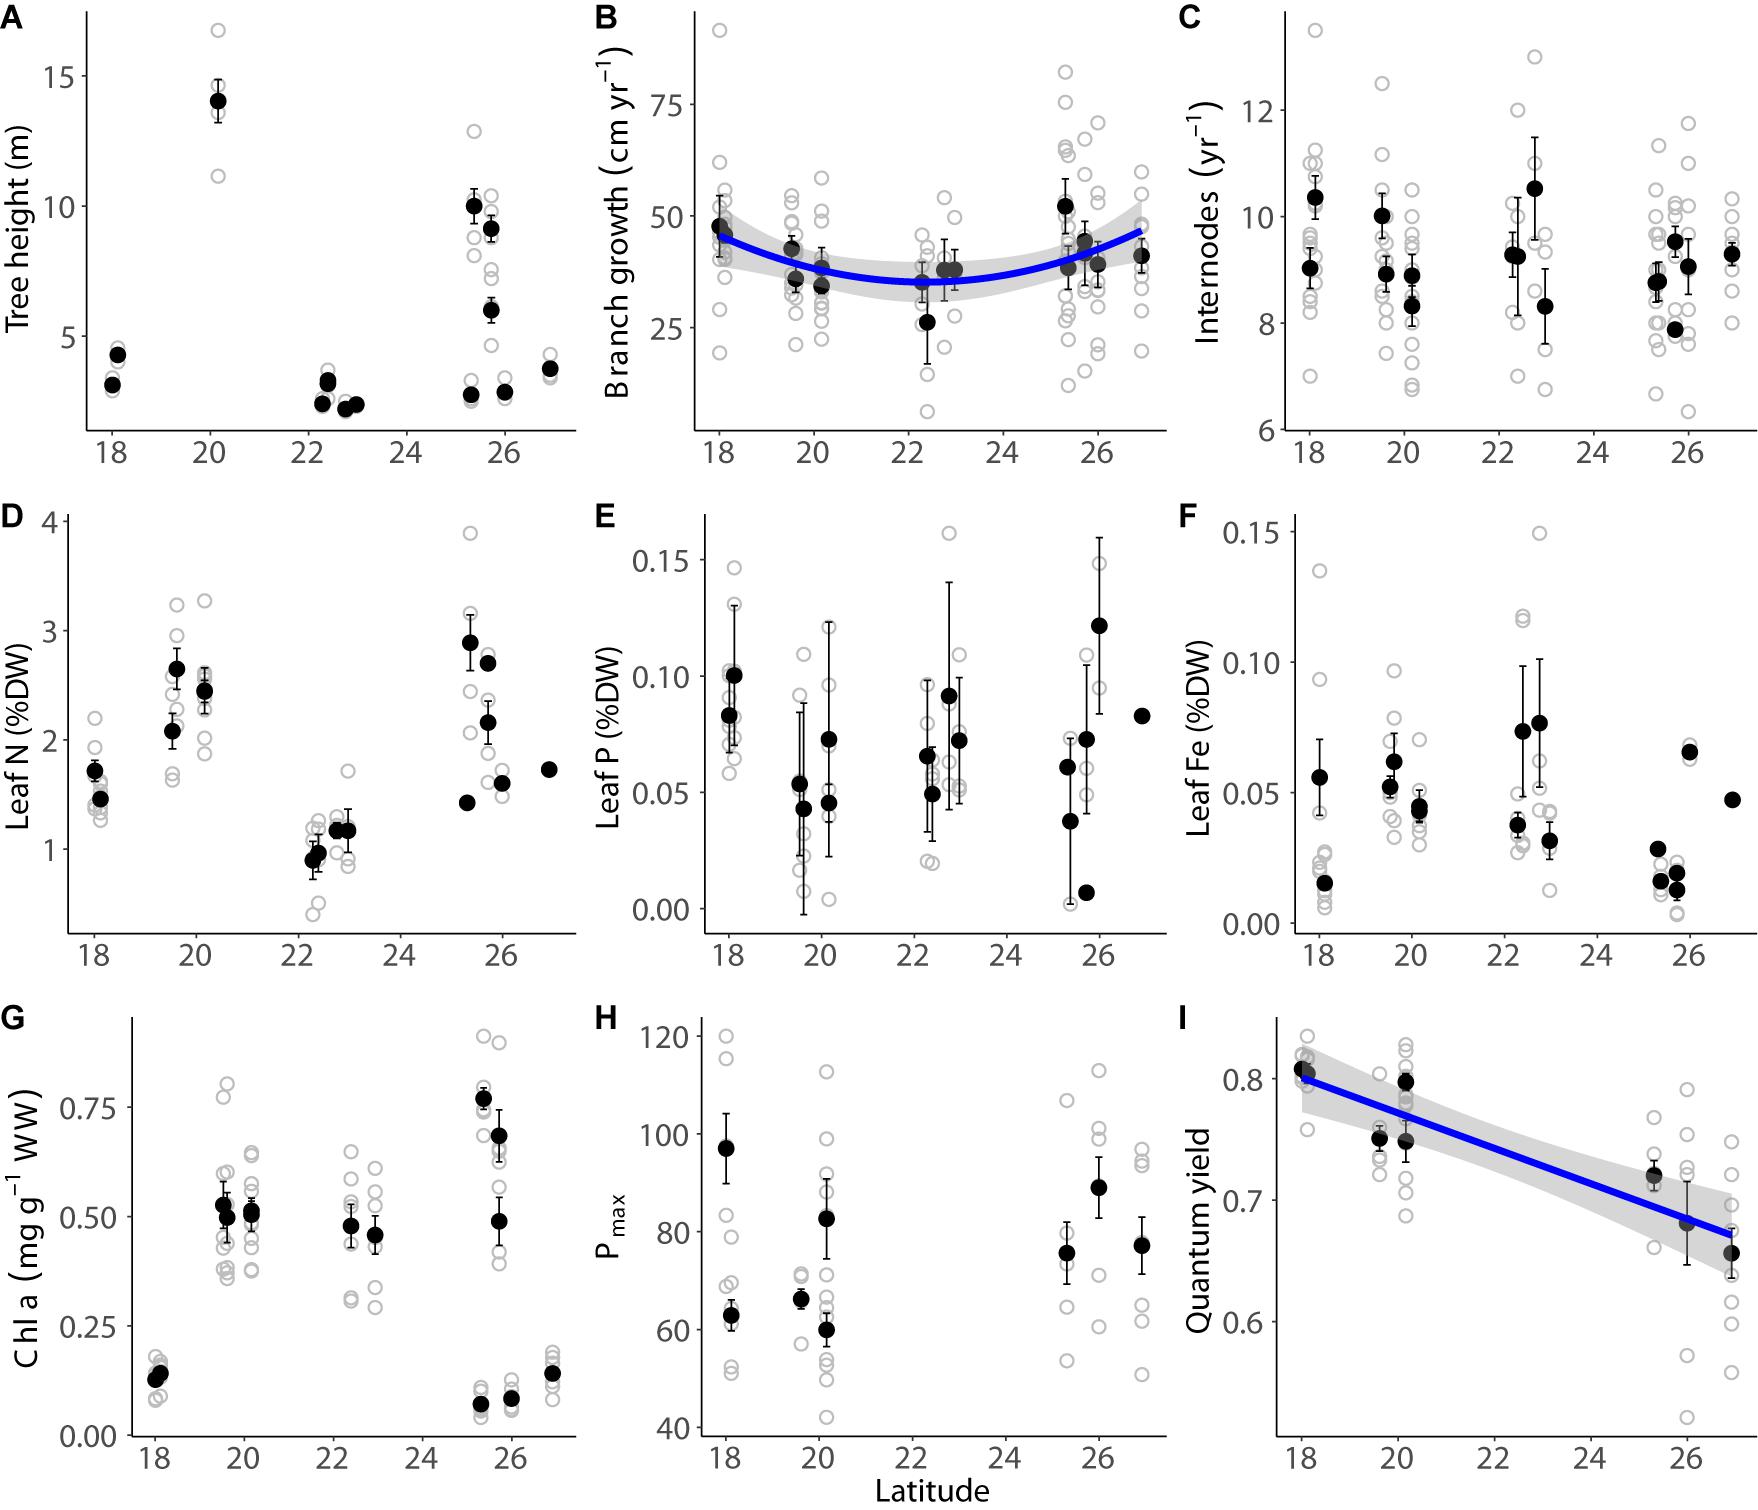
Figure 2. Latitudinal variability of maximum mangrove height (m; A), branch growth (cm year–1; B), internode rate (year–1; C), leaf N (%DW; D), leaf P (%DW; E), leaf Fe (%DW; F), chl a concentration (mg g–1 WW; G), and physiological performance parameters Pmax (H) and quantum yield (I). The black dots indicate the mean ± SE per site and the gray dots indicate raw measurements. The blue lines indicate significant fitted models (p < 0.05) and the standard error of the model is indicated in gray.
The mangrove leaves had low average concentrations of N (1.84 ± 0.65% DW; Table 1), P (0.07 ± < 0.03% DW; Table 1), and Fe (0.04 ± 0.02% DW; Table 1). The chl a concentration in the leaves was 0.39 ± 0.23 mg chl a g–1 WW, while the mean Pmax and quantum yield were 39.3 ± 6.8 μmol electrons m–2 s–1 and 0.75 ± 0.06, respectively (Table 1). The concentration of %N, %P, and %Fe in the sediments was (as %DW) 0.18 ± 0.16, 0.066 ± 0.022, and 0.55 ± 0.85, respectively (Table 1).
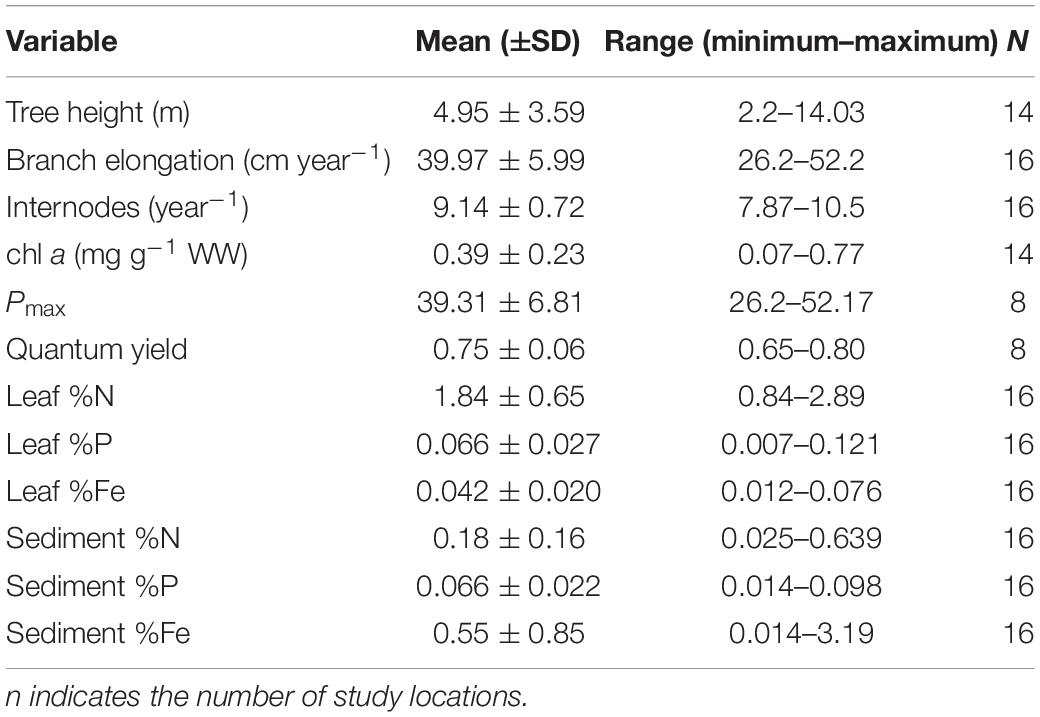
Table 1. Mean (±SD) and number of replicates of the response variables in 18 mangrove stands across the Saudi coast of the Red Sea.
The variability in the concentrations of N, P, and Fe in mangrove leaves, chl a concentration, and Pmax was uncoupled to the latitudinal gradient (p > 0.05; Figure 2 and Supplementary Table S2). Quantum yield increased linearly toward the southern Red Sea (linear relationship, p < 0.001, Figure 2I and Supplementary Table S2). There was no correlation between the concentrations of the various nutrient elements (i.e., N, P, and Fe) of the tree leaves nor between the nutrient concentration in the leaves and the sediment, except for the concentration of N and P in the leaves (Figure 3A and Supplementary Table S2), and the organic P in the leaves and the sediment (Figure 3E and Supplementary Table S2).
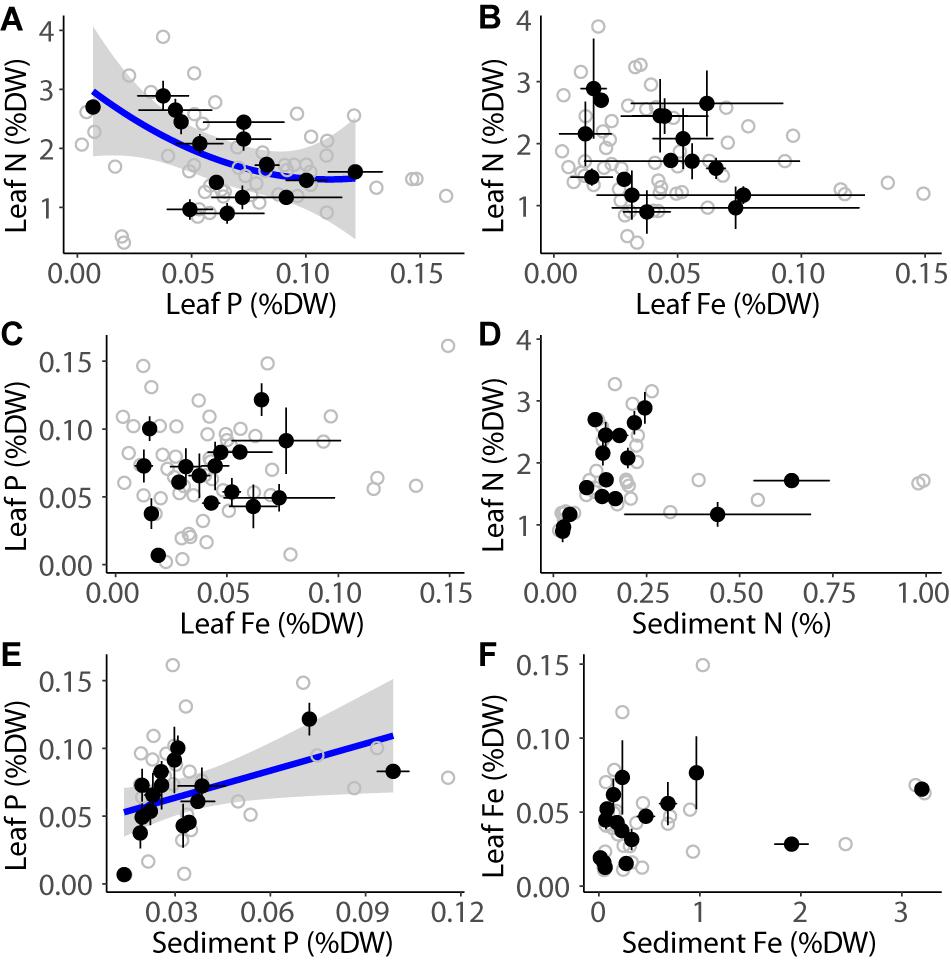
Figure 3. Relationship between leaf N (%DW) and leaf P (%DW; A), leaf N(%DW) and leaf Fe (%DW; B), leaf P (%DW) and leaf Fe (%DW; C), leaf N (%DW) and sediment N (%DW; D), leaf P (%DW) and sediment P (%DW; E), and leaf Fe (%DW) and sediment Fe (%DW; F) on the mangrove stands in the Red Sea. The black dots indicate the mean ± SE per site and the gray dots indicate raw measurements. The blue lines indicate significant fitted models (p < 0.05) and the standard error of the models is indicated in gray.
The maximum canopy height and chl a concentration strongly increased with the concentration of N in the mangrove leaves (linear relationship, p < 0.001; Figures 4A,D, and Supplementary Table S2). Branch elongation rates and internode production were independent from N concentration in the leaves of mangroves (p > 0.05; Figures 4B,C, and Supplementary Table S2). The photosynthetic performance of the leaves (Pmax and quantum yield) varied greatly among stands, but both parameters were unrelated to N concentration in the mangrove leaves (p > 0.05; Figures 4E,F, and Supplementary Table S2).
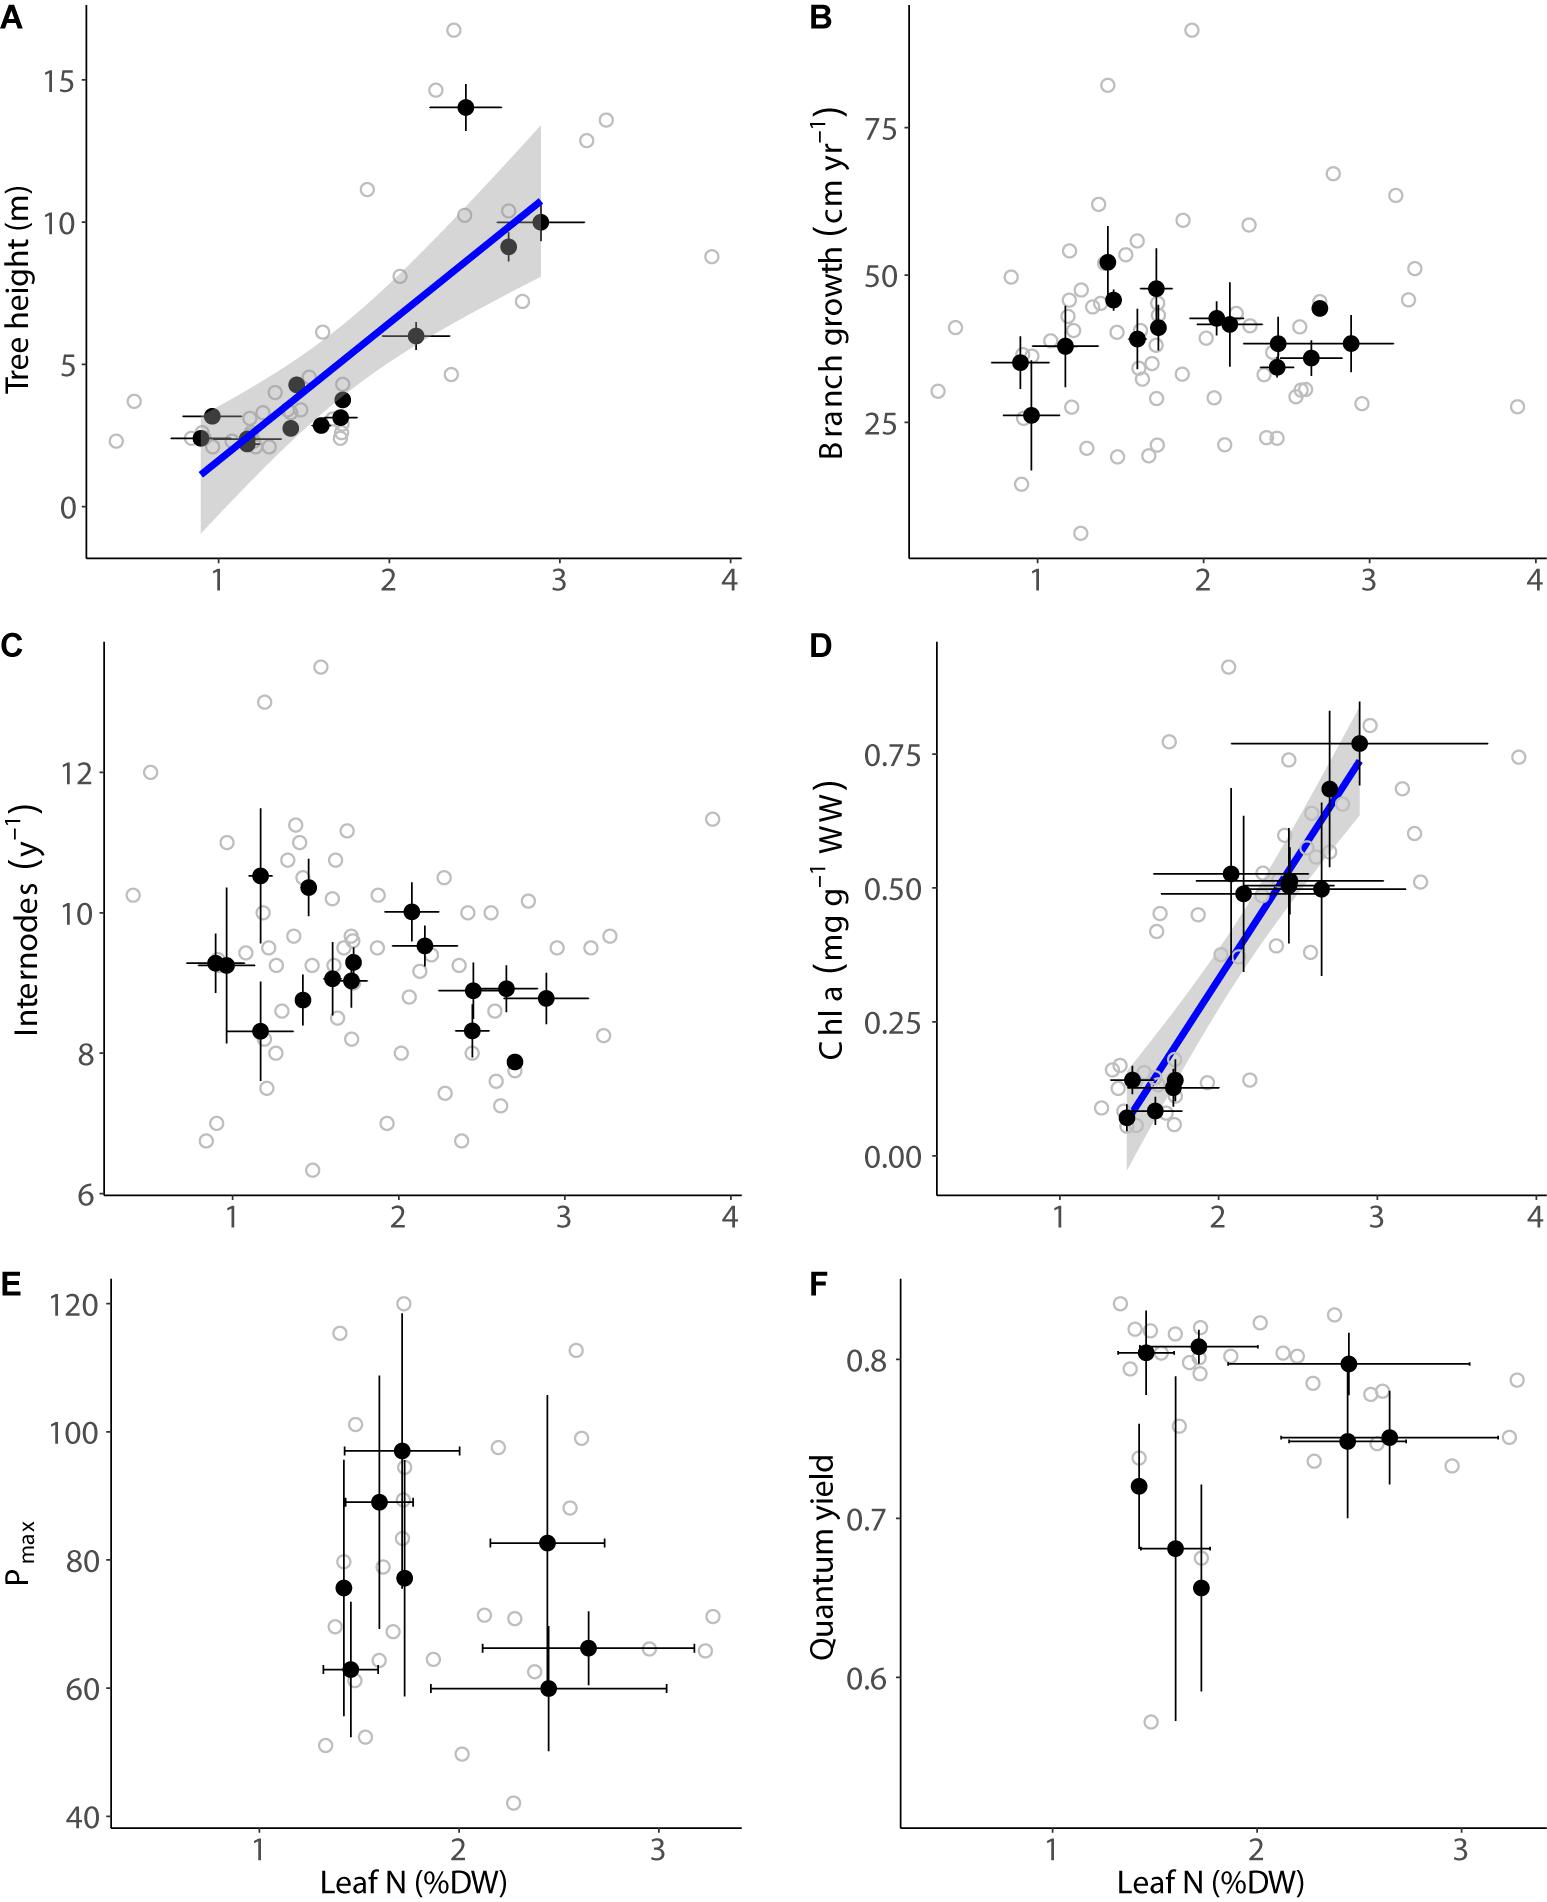
Figure 4. Relationship between carbon to nitrogen ratio in the mangrove leaves and mangrove height (A), branch growth (B), internode rate (C), chl a concentration (D), Pmax (E), and quantum yield (F) on mangrove stands in the Red Sea. The black dots indicate the mean ± SE per site and the gray dots indicate raw measurements. The blue lines indicate significant fitted models (p < 0.05) and the standard error of the model is indicated in gray.
Discussion
Mangrove stands are the only forests growing along the extremely arid and oligotrophic coast of the Red Sea. The A. marina maximum canopy height was overall low in the Red Sea, with a mean maximum tree height (±SD) of 4.95 ± 3.59 m and a maximum of 14 m along the sites sampled in the Red Sea. While the northern and southern regions had, on average, taller although variable maximum tree heights, the shortest trees in the Red Sea were found in central Red Sea, with a mean maximum of 2.7 m. In this central region, branch growth calculated from internode observations (Almahasheer et al., 2016c) was also smaller than that in the northern or the southern regions. These small canopy of A. marina growing in the fringe of the central Red Sea (maximum canopy 2.7 m) are three and five times shorter than those reported in South Africa (maximum canopy height of 10 m; Naidoo, 2006) and Kenya (14 m; Dahdouh-Guebas et al., 2004), respectively. In addition, the A. marina trees in the Sundarbans in the Bay of Bengal (India) were described with a maximum tree height that ranged from 4.9 to 10.6 m (Ray et al., 2011), also supporting the stunted nature of the tree canopies in the central Red Sea.
Stunted mangroves have been previously reported in areas with similar characteristics as those found in the Red Sea basin, such as arid environment [e.g., Arabian Gulf in the United Arab Emirates (Saenger et al., 2004)], the south coast of Puerto Rico (Cintron et al., 1978), and karstic areas (e.g., in the Caribbean; Lara-Domínguez et al., 2005; Spalding, 2010; Lovelock et al., 2015). The Red Sea is characterized also by a moderate salinity gradient (Raitsos et al., 2013; Anton et al., 2020), with Indian Ocean waters entering the Red Sea in the south and waters becoming progressively saltier due to evaporative losses toward the north (ranging from ∼36‰ in the southern part to 41‰ around the Gulf of Suez in the north). Salinity has been shown to influence the growth of Avicennia spp. in other locations (Suárez and Medina, 2005; Naidoo, 2006), with a maximal growth of A. marina expected to occur outside this range (in 50–75% seawater; Nguyen et al., 2015). In our study, the maximum height of A. marina trees was unrelated to latitude, suggesting a lack of a major influence of salinity on mangrove height in the Red Sea Basin. A recent global analysis (Simard et al., 2019) determined that mangrove canopy height is generally driven by environmental factors associated to latitude (such as precipitation and temperature) and predicted a maximum tree height of 12–23 m for Red Sea latitudes (27–18°N). Hence, the maximum mangrove tree height that we found in the Red Sea (14 m) falls within the lower range of those expected based on relationships derived for mangrove forests worldwide—with only one site within this range and the remaining 13 sites (93% of the study locations) beneath the lower bound (12 m) of the predicted range. This shortness of mangrove trees in the Red Sea, especially in the central area, points out that constraints other than climatic factors lead to stunted mangroves.
Mangrove height varied almost 10-fold along the Red Sea (ranging from 2.2 to 14.1 m among stands), allowing us to explore what might control maximum tree height. In contrast to previous suggestions (Almahasheer et al., 2016b) of A. marina tree height said to increase with decreasing latitude, we found the minimum values in the central Red Sea, with a mean of 2.7-m-tall trees at about 22.5°N. In the central Red Sea, we also found lower branch elongation rates. The strong positive relationship between maximum tree height and N concentration in the leaves indicates that N availability, rather than latitude-driven climatic factors, could regulate A. marina canopy height in the Red Sea. We could not, however, test for the relationship between maximum tree height and %N in the mangrove leaves within sites as we did not pair these two measurements at the tree level, yet leaf nitrogen concentration was variable within the mangrove stands (coefficient of variation ranging from 9 to 39%), suggesting that nitrogen status varies within stands and may also help explain the variability in tree height within locations. We, therefore, suggest that future studies pair nitrogen concentrations in leaves with tree height measurements on the same location to ascertain if nitrogen status can also explain the variability within mangrove stands. The P and the Fe concentrations in the leaves were low (mean 0.066 and 0.042% DW for P and Fe, respectively) when compared with the concentrations reported in A. marina in South Africa (0.37% DW P; Naidoo, 2006) and other mangrove species elsewhere (e.g., Rhizosphora spp. in Australia; Boto and Wellington, 1983). However, these two nutrients did not show any clear pattern along the latitudinal Red Sea gradient and were not related to maximum tree height, indicating that they are unlikely to limit the growth of A. marina in the Red Sea. Similar to maximum tree height, chl a concentration in the mangrove leaves increased linearly with N concentration, providing evidence for the importance of N potentially limiting pigment concentration, which ultimately could influence mangrove maximum height. In fact, lower chlorophyll concentration has been reported in stunted A. marina trees as compared to taller ones in South Africa (Naidoo, 2006). The chl a concentration in the leaves of A. marina reported here (mean 0.39 mg g–1 WW) was low compared with the concentrations reported for the same species in the Arabian Gulf which ranged 0.42–0.69 mg g–1 WW (Abou Seedo et al., 2018).
The central Red Sea is possibly the most oligotrophic region within the basin as the southern area receives nutrient inputs from the Indian Ocean and modest runoff, whereas the northern region receives nutrient inputs from winter overturning and moderate upwelling (Edwards, 2013; Sola et al., 2019). These known oceanographic patterns match one latitudinal pattern, branch growth, in our study. Nutrient limitation—specifically by iron—was identified for mangrove seedlings in the central Red Sea based on nutrient concentrations in the leaves and on fertilization experiments (Almahasheer et al., 2016b). While Fe-limited growth has been previously reported for the seedlings of several mangrove species elsewhere (Alongi, 2010), the maximum height of mangrove trees in the Red Sea appears to be driven by nitrogen limitation instead of Fe or P. This finding is consistent with that of Feller et al. (2003), who reported strong N limitation of tree growth on Rhizophora mangle in the Caribbean. Similarly, the growth of juvenile stunted 1-year-old trees of A. marina is N-limited in South Africa (Naidoo, 2009).
The potential N limitation reported here in central Red Sea mangroves contrasts with the recently suggested P and Fe deficiency (based on leaf content), but not of N, of seagrass meadows throughout the Red Sea (Anton et al., 2020). This apparent differential nutrient status between mangroves and seagrass meadows within the region might derive from a differential sediment composition or requirements between these two biogenic habitats. Seagrass meadows in the Red Sea grow in sediments that are more carbonate-rich than those of mangroves, where inorganic P and Fe may be bound in unavailable forms (Duarte et al., 1995; Brodersen et al., 2017; Anton et al., 2020). Therefore, these two nutrients (P and Fe) are likely to be less available in seagrass compared to mangrove sediments in the Red Sea. In addition, sediments on the fringing mangroves in the Red Sea are more depleted in N relative to organic carbon than seagrass sediments (Garcias-Bonet et al., 2019), providing further evidence for inorganic N to be a limiting source for mangroves in the basin. Nevertheless, the mean Fe concentration in the Red Sea mangrove sediment was 0.58 ± 0.85%, which is much lower than the mean for marine sediment (4.1% DW; Bowen, 1979), and within the lower end of the global range for mangrove sediments (0.14–14.6% DW; Billah et al., 2014), highlighting the overall extremely oligotrophic conditions for mangroves in the Red Sea. This is indeed expected due to the lack of rivers and, therefore, riverine inputs to the Red Sea, which are major sources of Fe and P inputs to coastal waters elsewhere (Doney, 2010).
The N concentrations in mangrove sediments were more variable (coefficient of variation, mean 89%) than those in mangrove leaves (coefficient of variation, mean 35%), and leaf N did not correlate with sediment organic N in the Red Sea. This may be due to the high loss rates of nitrogen in mangrove sediments, which often support high denitrification and anammox rates (Fernandes et al., 2012; Cao et al., 2017; Xiao et al., 2018), although these have not yet been resolved for the mangrove sediments in the Red Sea. Sediment concentrations are not subject to biological constraints; however, N content in the leaves is constrained by minimum functional requirements. N limitation, thus, is reflected in low mangrove canopy heights, while keeping N levels above minimum requirements for functional mangrove leaves. In addition, the variation in sediment nitrogen concentration could have been partially affected by the variation in sediment bulk density, which ranged from 0.7 to 1.2 g cm–3 across our study sites (Garcias-Bonet et al., 2019). Bulk density has been shown to negatively correlate with soil nitrogen in coastal biogenic habitats (Fourqurean et al., 2012), although we did not find a correlation between bulk density and the concentration of N in the sediment or the mangrove leaves (linear regression; p = 0.122 and 0.874, respectively). Nevertheless, bulk density could have influenced the amount of nitrogen available in the sediment to our mangrove stands in the Red Sea as, for the same nitrogen concentration (%N), bulky sediments contain more nitrogen per volume of sediment than coarse ones.
We found that N concentration in the mangrove leaves was not related to differences in photosynthetic leaf performance, such as Pmax and quantum yield. This lack of relationship of Pmax and quantum yield with increasing N content in the mangrove leaves was expected since these relationships are commonly reported as positive (Reich et al., 1994) in fast-growing species but can be weak in woody trees (Wright and Westoby, 2001), such as A. marina. In fact, a similar finding was reported for blades of seagrasses and macroalgae in the Red Sea (Anton et al., 2018), where Pmax and iron blade concentration were unrelated.
Since four electrons move through PSII for each O2 produced, ETR (μmol electron m–2 s–1) can be divided by four to obtain a rough estimation of plant productivity (in μmol O2 m–2 s–1; Figueroa et al., 2003). On this basis, the mean Pmax of 39.31 μmol electrons m–2 s–1 for Red Sea mangrove leaves can translate to 9.8 μmol O2 m–2 s–1, which is about half the mean net productivity of A. marina of 22 μmol CO2 m–2 s–1 reported in Australia (Alongi, 2009). In addition, the mean ETR values reported here are three times lower than those reported in fringing A. marina mangroves in South Africa ∼120 μmol electrons m–2 s–1; Naidoo, 2006), providing further evidence of limiting mangrove productivity in the Red Sea.
In conclusion, the A. marina trees in the central Red Sea basin can be classified as stunted when compared to those across the broad biogeographical range of this species. Our results suggest the maximum tree height and the pigment concentration to be N-controlled rather than being regulated by latitude-driven climatic parameters or other inorganic nutrients such as P or Fe. Our results fill a gap of understanding mangrove ecology in the Red Sea, where most studies have been performed in the central region (Almahasheer et al., 2016b, c, 2017), by providing baseline information on mangrove tree structural and physiological parameters along a large latitudinal range, which highlights the important role of N as a predictor of mangrove maximum canopy height in the largely oligotrophic Red Sea.
Data Availability Statement
The datasets generated for this study are available on request to the corresponding author.
Author Contributions
CD, DK-J, NM, and AA designed the study. CD, HA, PC-A, NM, DK-J, VS, and KB performed the surveys. AA performed the analyses. AA, DK-J, and CD interpreted the data with contribution from all authors, AA wrote the first draft of the manuscript with contributions from CD. All authors improved the manuscript and approved it for submission.
Funding
This research was supported by the King Abdullah University of Science and Technology through baseline funding and funds by the Tarek Ahmed Juffali Research Chair in Red Sea Ecology to CD.
Conflict of Interest
The authors declare that the research was conducted in the absence of any commercial or financial relationships that could be construed as a potential conflict of interest.
Acknowledgments
We thank Vijayalaxmi Dasari, Isidora Mendia Saez de Zuazola, Mongi Ennasri, Joao Curdia, and Arsenio Granados for support in the laboratory analyses, Brian Hession, CMOR, and the RV Thuwal crew for logistical support, and Nathan Geraldi for comments on early drafts of the manuscript.
Supplementary Material
The Supplementary Material for this article can be found online at: https://www.frontiersin.org/articles/10.3389/fmars.2020.00597/full#supplementary-material
FIGURE S1 | Photosynthetic active radiation vs relative electron transport rate (ETRr) on eight study sites obtained using pulse amplitude modulated diving (Walz, Germany). Rapid light curves were fitted to the eight ETRr measurements per sample using the equations defined by Eilers and Peeters (1988), and then maximum ETRr was obtained from each curve.
TABLE S1 | Study site information. Figure 1 shows the study locations in a map.
TABLE S2 | Results of the statistical analyses associated to Figure 2, Figure 3, and Figure 4.
References
Abou Seedo, K., Abido, M. S., Salih, A., and Abahussain, A. (2018). Morphophysiological traits of gray mangrove (Avicennia marina (Forsk.) Vierh.) at different levels of soil salinity. Int. J. For. Res. 2018:e7404907. doi: 10.1155/2018/7404907
Almahasheer, H., Aljowair, A., Duarte, C. M., and Irigoien, X. (2016a). Decadal stability of Red Sea mangroves. Estuar. Coast. Shelf Sci. 169, 164–172. doi: 10.1016/j.ecss.2015.11.027
Almahasheer, H., Duarte, C. M., and Irigoien, X. (2016b). Nutrient imitation in Central Red Sea mangroves. Front. Mar. Sci. 3:271. doi: 10.3389/fmars.2016.00271
Almahasheer, H., Duarte, C. M., and Irigoien, X. (2016c). Phenology and Growth dynamics of Avicennia marina in the Central Red Sea. Sci. Rep. 6:sre37785. doi: 10.1038/srep37785
Almahasheer, H., Serrano, O., Duarte, C. M., Arias-Ortiz, A., Masque, P., and Irigoien, X. (2017). Low Carbon sink capacity of Red Sea mangroves. Sci. Rep. 7:9700. doi: 10.1038/s41598-017-10424-9
Alongi, D. M. (2010). Dissolved iron supply limits early growth of estuarine mangroves. Ecology 91, 3229–3241. doi: 10.1890/09-2142.1
Anton, A., Baldry, K., Coker, D. J., and Duarte, C. M. (2020). Drivers of the low metabolic rates of seagrass meadows in the Red Sea. Front. Mar. Sci. 7:69. doi: 10.3389/fmars.2020.00069
Anton, A., Hendriks, I. E., Marbà, N., Krause-Jensen, D., Garcias-Bonet, N., and Duarte, C. M. (2018). Iron deficiency in seagrasses and macroalgae in the Red Sea is unrelated to latitude and physiological performance. Front. Mar. Sci. 5:74. doi: 10.3389/fmars.2018.00074
Barbier, E. B., Hacker, S. D., Kennedy, C., Koch, E. W., Stier, A. C., and Silliman, B. R. (2011). The value of estuarine and coastal ecosystem services. Ecol. Monogr. 81, 169–193. doi: 10.1890/10-1510.1
Beer, S. (1998). Measuring photosynthetic rates in seagrasses by pulse amplitude modulated (PAM) fluorometry. Mar. Ecol. Prog. Ser. 174, 293–300. doi: 10.3354/meps174293
Beer, S., Bjork, M., Gademann, R., and Ralph, P. J. (2001). “Measurements of photosynthetic rates in seagrasses,” in Global Seagrass Research Methods, eds F. T. Short and R.G. Coles (Netherlands: Elsevier Publishing).
Billah, M. M., Kamal, A. H. M., Idris, M. H. B., Ismail, J. B., and Bhuiyan, M. K. A. (2014). Cu, Zn, Fe, and Mn in mangrove ecosystems (sediment, water, oyster, and macroalgae) of Sarawak, Malaysia. Zool. Ecol. 24, 380–388. doi: 10.1080/21658005.2014.978527
Boto, K. G., and Wellington, J. I. (1983). Phosphorus and nitrogen nutritional status of a Northern Australian mangrove forest. Mar. Ecol. 11, 3–69. doi: 10.3354/meps011063
Bouillon, S., Borges, A. V., Castaneda-Moya, E., Diele, K., Dittmar, T., Duke, N. C., et al. (2008). Mangrove production and carbon sinks: a revision of global budget estimates. Glob. Biogeochem. Cycles 22:GB2013. doi: 10.1029/2007GB003052
Brodersen, K. E., Koren, K., Moßhammer, M., Ralph, P. J., Kühl, M., and Santner, J. (2017). Seagrass-mediated phosphorus and iron solubilization in tropical sediments. Environ. Sci. Technol. 51, 14155–14163. doi: 10.1021/acs.est.7b03878
Burnham, K. P., and Anderson, D. R. (eds) (2004). Model Selection and Multimodel Inference. New York, NY: Springer.
Cao, W., Guan, Q., Li, Y., Wang, M., and Liu, B. (2017). The contribution of denitrification and anaerobic ammonium oxidation to N2 production in mangrove sediments in Southeast China. J. Soils Sediments 17, 1767–1776. doi: 10.1007/s11368-017-1653-0
Cintron, G., Lugo, A. E., Pool, D. J., and Morris, G. (1978). Mangroves of arid environments in puerto rico and adjacent Islands. Biotropica 10, 110–121. doi: 10.2307/2388013
Coulter, S. C., Duarte, C. M., Tuan, M. S., Tri, N. H., Ha, H. T., Giang, L. H., et al. (2001). Retrospective estimates of net leaf production in Kandelia candel mangrove forests. Mar. Ecol. Prog. Ser. 221, 117–124. doi: 10.3354/meps221117
Dahdouh-Guebas, F., De Bondt, R., Abeysinghe, P. D., Kairo, J. G., Cannicci, S., Triest, L., et al. (2004). Comparative study of the disjunct zonation pattern of the grey mangrove Avicennia marina (Forsk.) Vierh. in Gazi Bay (Kenya). Bull. Mar. Sci. 74, 237–252.
Donato, D. C., Kauffman, J. B., Murdiyarso, D., Kurnianto, S., Stidham, M., and Kanninen, M. (2011). Mangroves among the most carbon-rich forests in the tropics. Nat. Geosci. 4, 293–297. doi: 10.1038/NGEO1123
Doney, S. C. (2010). The growing human footprint on coastal and open-ocean biogeochemistry. Science 328, 1512–1516. doi: 10.1126/science.1185198
Duarte, C. M., Delgado-Huertas, A., Anton, A., Carrillo-de-Albornoz, P., López-Sandoval, D. C., Agustí, S., et al. (2018). Stable isotope (δ13C, δ15N, δ18O, δD) composition and nutrient concentration of Red Sea primary producers. Front. Mar. Sci. 5:298. doi: 10.3389/fmars.2018.00298
Duarte, C. M., Merino, M., and Gallegos, M. (1995). Evidence of iron deficiency in seagrasses growing above carbonate sediments. Limnol. Oceanogr. 40, 1153–1158. doi: 10.4319/lo.1995.40.6.1153
Eilers, P. H. C., and Peeters, J. C. H. (1988). A model for the relationship between light intensity and the rate of photosynthesis in phytoplankton. Ecol. Model. 42, 199–215. doi: 10.1016/0304-3800(88)90057-9
Feller, I. C. (1995). Effects of nutrient enrichment on growth and herbivory of dwarf red mangrove (Rhizophora mangle). Ecol. Monogr. 65, 477–505. doi: 10.2307/2963499
Feller, I. C., McKee, K. L., Whigham, D. F., and O’Neill, J. P. (2003). Nitrogen vs. phosphorus limitation across an ecotonal gradient in a mangrove forest. Biogeochemistry 62, 145–175. doi: 10.1023/A:1021166010892
Fernandes, S. O., Michotey, V. D., Guasco, S., Bonin, P. C., and Loka Bharathi, P. A. (2012). Denitrification prevails over anammox in tropical mangrove sediments (Goa, India). Mar. Environ. Res. 74, 9–19. doi: 10.1016/j.marenvres.2011.11.008
Figueroa, F. L., Conde-Álvarez, R., and Gómez, I. (2003). Relations between electron transport rates determined by pulse amplitude modulated chlorophyll fluorescence and oxygen evolution in macroalgae under different light conditions. Photosynth. Res. 75, 259–275. doi: 10.1023/A:1023936313544
Fourqurean, J. W., Kendrick, G. A., Collins, L. S., Chambers, R. M., and Vanderklift, M. A. (2012). Carbon, nitrogen and phosphorus storage in subtropical seagrass meadows: examples from Florida Bay and Shark Bay. Mar. Freshw. Res. 63, 967–983. doi: 10.1071/MF12101
Garcias-Bonet, N., Delgado-Huertas, A., Carrillo-de-Albornoz, P., Anton, A., Almahasheer, H., Marbà, N., et al. (2019). Carbon and nitrogen concentrations, stocks, and isotopic compositions in red sea seagrass and mangrove sediments. Front. Mar. Sci. 6:267. doi: 10.3389/fmars.2019.00267
Giomi, F., Barausse, A., Duarte, C. M., Booth, J., Agusti, S., Saderne, V., et al. (2019). Oxygen supersaturation protects coastal marine fauna from ocean warming. Sci. Adv. 5:eaax1814. doi: 10.1126/sciadv.aax1814
Giri, C., Ochieng, E., Tieszen, L. L., Zhu, Z., Singh, A., Loveland, T., et al. (2011). Status and distribution of mangrove forests of the world using earth observation satellite data. Glob. Ecol. Biogeogr. 20, 154–159. doi: 10.1111/j.1466-8238.2010.00584.x
Hamilton, S. E., and Casey, D. (2016). Creation of a high spatio-temporal resolution global database of continuous mangrove forest cover for the 21st century (CGMFC-21). Glob. Ecol. Biogeogr. 25, 729–738. doi: 10.1111/geb.12449
Hickey, S. M., Phinn, S. R., Callow, N. J., Van Niel, K. P., Hansen, J. E., and Duarte, C. M. (2017). Is climate change shifting the poleward limit of mangroves? Estua. Coasts 40, 1215–1226. doi: 10.1007/s12237-017-0211-8
Lara-Domínguez, A. L., Day, J. W., Zapata, G. V., Twilley, R. R., Guillén, H. A., and Yáñez-Arancibia, A. (2005). Structure of a unique inland mangrove forest assemblage in fossil lagoons on the Caribbean Coast of Mexico. Wetl. Ecol. Manag. 13, 111–122. doi: 10.1007/s11273-004-5197-x
Lovelock, C. E., Feller, I. C., Ball, M. C., Engelbrecht, B. M. J., and Ewe, M. L. (2006). Differences in plant function in phosphorus- and nitrogen-limited mangrove ecosystems. New Phytol. 172, 514–522. doi: 10.1111/j.1469-8137.2006.01851.x
Lovelock, C. E., Feller, I. C., Mckee, K. L., Engelbrecht, B. M. J., and Ball, M. C. (2004). The effect of nutrient enrichment on growth, photosynthesis and hydraulic conductance of dwarf mangroves in Panamá. Funct. Ecol. 18, 25–33. doi: 10.1046/j.0269-8463.2004.00805.x
Lovelock, C. E., Simpson, L. T., Duckett, L. J., and Feller, I. C. (2015). Carbon budgets for caribbean mangrove forests of varying structure and with phosphorus enrichment. Forests 6, 3528–3546. doi: 10.3390/f6103528
Macreadie, P. I., Anton, A., Raven, J. A., Beaumont, N., Connolly, R. M., Friess, D. A., et al. (2019). The future of Blue Carbon science. Nat. Commun. 10:3998. doi: 10.1038/s41467-019-11693-w
Mumby, P. J., Edwards, A. J., Ernesto Arias-González, J., Lindeman, K. C., Blackwell, P. G., Gall, A., et al. (2004). Mangroves enhance the biomass of coral reef fish communities in the Caribbean. Nature 427, 533–536. doi: 10.1038/nature02286
Naidoo, G. (2006). Factors contributing to dwarfing in the mangrove Avicennia marina. Ann. Bot. 97, 1095–1101. doi: 10.1093/aob/mcl064
Naidoo, G. (2009). Differential effects of nitrogen and phosphorus enrichment on growth of dwarf Avicennia marina mangroves. Aquat. Bot. 90, 184–190. doi: 10.1016/j.aquabot.2008.10.001
Nguyen, H. T., Stanton, D. E., Schmitz, N., Farquhar, G. D., and Ball, M. C. (2015). Growth responses of the mangrove Avicennia marina to salinity: development and function of shoot hydraulic systems require saline conditions. Ann. Bot. 115, 397–407. doi: 10.1093/aob/mcu257
Padilla, C., Fortes, M. D., Duarte, C. M., Terrados, J., and Kamp-Nielsen, L. (2004). Recruitment, mortality and growth of mangrove (Rhizophora sp.) seedlings in Ulugan Bay, Palawan, Philippines. Trees 18, 589–595. doi: 10.1007/s00468-004-0351-x
Raitsos, D. E., Pradhan, Y., Brewin, R. J. W., Stenchikov, G., and Hoteit, I. (2013). Remote sensing the phytoplankton seasonal succession of the Red Sea. PLoS One 8:e64909. doi: 10.1371/journal.pone.0064909
Raitsos, D. E., Yi, X., Platt, T., Racault, M.-F., Brewin, R. J. W., Pradhan, Y., et al. (2015). Monsoon oscillations regulate fertility of the Red Sea. Geophys. Res. Lett. 42, 855–862. doi: 10.1002/2014GL062882
Ralph, P. J., and Gademann, R. (2005). Rapid light curves: a powerful tool to assess photosynthetic activity. Aquat. Bot. 82, 222–237. doi: 10.1016/j.aquabot.2005.02.006
Ray, R., Ganguly, D., Chowdhury, C., Dey, M., Das, S., Dutta, M. K., et al. (2011). Carbon sequestration and annual increase of carbon stock in a mangrove forest. Atmos. Environ. 45, 5016–5024. doi: 10.1016/j.atmosenv.2011.04.074
Reich, P. B., Walters, M. B., Ellsworth, D. S., and Uhl, C. (1994). Photosynthesis-nitrogen relations in Amazonian tree species. Oecologia 97, 62–72. doi: 10.1007/BF00317909
Saderne, V., Baldry, K., Anton, A., Agustí, S., and Duarte, C. M. (2019a). Characterization of the CO2 system in a coral reef, a seagrass meadow, and a mangrove forest in the central Red Sea. J. Geophys. Res. Oceans 124, 7513–7528. doi: 10.1029/2019JC015266
Saderne, V., Geraldi, N. R., Macreadie, P. I., Maher, D. T., Middelburg, J. J., Serrano, O., et al. (2019b). Role of carbonate burial in Blue Carbon budgets. Nat. Commun. 10:1106. doi: 10.1038/s41467-019-08842-6
Saenger, P., Blasco, F., Youssef, A. M. M., and Loughland, R. A. (2004). “Mangroves of the United Arab Emirates with particular emphasis on those of Abu Dhabi Emirate,” in Marine atlas of Abu Dhabi, eds R. A. Loughland, F. S. A. Muhairi, S. S. Fadel, A. M. A. Mehdi, and P. Hellyer (Abu Dhabi: Emirates Heritage Club), 58–69.
Sawall, Y., Al-Sofyani, A., Hohn, S., Banguera-Hinestroza, E., Voolstra, C. R., and Wahl, M. (2015). Extensive phenotypic plasticity of a Red Sea coral over a strong latitudinal temperature gradient suggests limited acclimatization potential to warming. Sci. Rep. 5:8940. doi: 10.1038/srep08940
Simard, M., Fatoyinbo, L., Smetanka, C., Rivera-Monroy, V. H., Castañeda-Moya, E., Thomas, N., et al. (2019). Mangrove canopy height globally related to precipitation, temperature and cyclone frequency. Nat. Geosci. 12, 40–45. doi: 10.1038/s41561-018-0279-1
Sola, J., Klein, S. G., Martin, C., Agustí, S., and Duarte, C. M. (2019). Gelatinous zooplankton in the surface layers of the coastal central Red Sea. Front. Mar. Sci. 6:726. doi: 10.3389/fmars.2019.00726
Suárez, N., and Medina, E. (2005). Salinity effect on plant growth and leaf demography of the mangrove, Avicennia germinans L. Trees 19:722. doi: 10.1007/s00468-005-0001-y
Valiela, I., Bowen, J. L., and York, J. K. (2001). Mangrove Forests: one of the World’s threatened major tropical environmentsat least 35% of the area of mangrove forests has been lost in the past two decades, losses that exceed those for tropical rain forests and coral reefs, two other well-known threatened environments. BioScience 51, 807–815.
Wellburn, A. R. (1994). The spectral determination of chlorophylls a and b, as well as total carotenoids, using various solvents with spectrophotometers of different resolution. J. Plant Physiol. 144, 307–313. doi: 10.1016/s0176-1617(11)81192-2
Wright, I. J., and Westoby, M. (2001). Understanding seedling growth relationships through specific leaf area and leaf nitrogen concentration: generalisations across growth forms and growth irradiance. Oecologia 127, 21–29. doi: 10.1007/s004420000554
Keywords: Red Sea, Avicennia marina, oligotrophic, desert, nitrogen limitation
Citation: Anton A, Almahasheer H, Delgado A, Garcias-Bonet N, Carrillo-de-Albornoz P, Marbà N, Hendriks IE, Krause-Jensen D, Saderne V, Baldry K and Duarte CM (2020) Stunted Mangrove Trees in the Oligotrophic Central Red Sea Relate to Nitrogen Limitation. Front. Mar. Sci. 7:597. doi: 10.3389/fmars.2020.00597
Received: 31 October 2019; Accepted: 29 June 2020;
Published: 31 July 2020.
Edited by:
Angel Borja, Technological Center Expert in Marine and Food Innovation (AZTI), SpainReviewed by:
Tapan Kumar Jana, University of Calcutta, IndiaRichard Hugh Bulmer, The University of Auckland, New Zealand
Copyright © 2020 Anton, Almahasheer, Delgado, Garcias-Bonet, Carrillo-de-Albornoz, Marbà, Hendriks, Krause-Jensen, Saderne, Baldry and Duarte. This is an open-access article distributed under the terms of the Creative Commons Attribution License (CC BY). The use, distribution or reproduction in other forums is permitted, provided the original author(s) and the copyright owner(s) are credited and that the original publication in this journal is cited, in accordance with accepted academic practice. No use, distribution or reproduction is permitted which does not comply with these terms.
*Correspondence: Andrea Anton, YW5kcmVhLmFudG9uZ2FtYXpvQGthdXN0LmVkdS5zYQ==