 Stephanie H. O’Daly1*
 Seth L. Danielson1
 Sarah M. Hardy1
 Russell R. Hopcroft1
 Catherine Lalande2
 Dean A. Stockwell3
 Andrew M. P. McDonnell1
- 1College of Fisheries and Ocean Sciences, University of Alaska Fairbanks, Fairbanks, AK, United States
- 2Amundsen Science, Université Laval, Québec, QC, Canada
- 3Institute of Marine Sciences, University of Alaska Fairbanks, Fairbanks, AK, United States
The shallow Pacific Arctic shelf has historically acted as an effective carbon sink, characterized by tight benthic pelagic coupling. However, the strength of the biological carbon pump in the Arctic has been predicted to weaken with climate change due to increased duration of the open-water period for primary production, enhanced nutrient limitation, and increased pelagic heterotrophy. In order to gain insights into how the biological carbon pump is functioning under the recent conditions of extreme warming and sea ice loss on the Pacific Arctic shelf, we measured sinking particulate organic carbon (POC) fluxes with drifting and moored sediment traps, as well as rates of primary production and particle-associated microbial respiration during June 2018. In Bering Shelf/Anadyr Water masses, sinking POC fluxes ranged from 0.8 to 2.3 g C m–2 day–1, making them among the highest fluxes ever documented in the global oceans. Furthermore, high export ratios averaging 82% and low rates of particle-associated microbial respiration also indicated negligible recycling of sinking POC in the water column. These results highlight the extraordinary strength of the biological carbon pump on the Pacific Arctic shelf during an unusually warm and low-sea ice year. While additional measurements and time are needed to confirm the ultimate trajectory of these fluxes in response to ongoing climate change, these results do not support the prevailing hypothesis that the strength of the biological carbon pump in the Pacific Arctic will weaken under these conditions.
Introduction
Arctic marine systems are currently undergoing rapid and profound changes due to the effects of climate change, including reduced sea ice extent, earlier sea ice retreat, protracted ice-free seasons, warming air and ocean temperatures, and shifts in currents and water column stratification (Vaughan et al., 2013; Richter-Menge et al., 2019). These environmental changes have recently accelerated on the Pacific Arctic’s Bering and Chukchi Sea shelves (Stabeno and Bell, 2019; Huntington et al., 2020; Thoman et al., 2020). During 2017 and 2018, bottom water temperatures in the Bering Sea were 3°C higher than the 2005–2016 baseline (Stabeno and Bell, 2019), and the four lowest maximum sea ice extents since 1979 in the Bering and Chukchi Seas have occurred after 2015 (Fetterer et al., 2017). Cascading impacts on the regional ecosystems, biogeochemical cycles, climate, and human communities on and around the Pacific Arctic shelf are expected, although the nature and magnitude of these impacts remain largely speculative (Carroll and Carroll, 2003; Grebmeier, 2012; Moore and Stabeno, 2015; Stabeno and Bell, 2019).
The shallow Pacific Arctic shelf, averaging 50 m depth, has historically acted as a strong sink of carbon (Bates, 2006; Chen and Borges, 2009). Water movement on these shelves is generally northward carrying different water masses of Pacific origin into the Arctic (Pickart et al., 2016; Danielson et al., 2017), with a significant seasonal modulation (Woodgate et al., 2015) (see Supplementary Figure 1 for visualization of currents). This region is also characterized by a strong biological carbon pump having pelagic primary productivity (Walsh et al., 1989; Springer and McRoy, 1993), sedimentation (Naidu et al., 2004), and benthic productivity (Grebmeier and McRoy, 1988; Grebmeier and McRoy, 1989) rates that are all amongst the highest measured in any marine system. When light is sufficient, pelagic primary productivity may reach up to 16 g C m–2 day–1 and 470–840 g C m–2 year–1 (Walsh et al., 1989; Springer and McRoy, 1993) due to elevated nutrient concentrations (5–20 μM) (Danielson et al., 2017) advected into the region with the Anadyr current from deep Pacific upwelling (Walsh et al., 1989; Springer and McRoy, 1993). The spring phytoplankton bloom is typically dominated by large, rapidly sinking sympagic or pelagic diatoms (Springer and McRoy, 1993; Gradinger, 1999, 2009) that contributed to an annual particulate organic carbon (POC) flux of up to 145 g C m–2 year–1 near Hanna Shoal (Lalande et al., 2020) and likely facilitate substantial carbon burial in sediments. Similar to other Arctic shelves (Grebmeier and Barry, 1991), total organic carbon on the Pacific Arctic shelf averages 1% and reaches up to 2% in surface layers (Grebmeier and McRoy, 1989; Grebmeier and Barry, 1991; Bluhm and Gradinger, 2008). This active biological carbon pump supports large populations of benthic-feeding pelagic seabirds and marine mammals (Bluhm and Gradinger, 2008; Moore and Kuletz, 2019), many of which are important to Indigenous communities that rely on subsistence hunting (Hovelsrud et al., 2008).
The strength of the biological carbon pump in the Arctic is predicted to weaken with climate change due to increased duration of the open-water period for primary production and enhanced nutrient limitation (Piepenburg, 2005; Wassmann and Reigstad, 2011; Grebmeier, 2012). Warmer waters could increase metabolic rates of pelagic grazers and heterotrophic bacteria and potentially favor smaller phytoplankton and faster-growing grazers that more rapidly recycle organic matter within the water column (Wassmann and Reigstad, 2011; Neeley et al., 2018). Additionally, increased frequency of storms could increase mixing and efflux of carbon dioxide (Hauri et al., 2013; Slats et al., 2019). If these predictions prove accurate, such mechanisms could accelerate feedback processes on the services supported by the biological carbon pump. While the effects of changing ice conditions and warming water on production on the Pacific Arctic shelf have been investigated for many years (Lee et al., 2012; Arrigo et al., 2014; Hill et al., 2018), few studies have directly measured pathways within the biological carbon pump (Fukuchi et al.,1993; Lalande et al., 2020). As part of the Arctic Shelf Growth, Advection, Respiration, and Deposition rate experiments (ASGARD) project, we measured the strength and efficiency of the biological carbon pump by directly quantifying and comparing rates of primary productivity, sinking POC flux, and microbial respiration associated with trap-collected sinking particulate matter during June of 2018 on the Pacific Arctic Shelf. This study occurred after the winter with the lowest maximum sea ice extent on record and in a prolonged time of abnormally warm water (Stabeno and Bell, 2019; Danielson et al., 2020; Huntington et al., 2020). These unique environmental conditions, described in detail in Huntington et al. (2020), provided an opportunity to test the prevailing hypothesis that the biological carbon pump will decrease in strength with climate change (Piepenburg, 2005; Wassmann and Reigstad, 2011; Grebmeier, 2012).
Materials and Methods
Hydrography Sampling
All cruise operations were performed on the R/V Sikuliaq. The CTD unit consisted of a Seabird SBE16plus unit coupled with WetLabs fluorometer and transmissometer. A Satlantic SUNA V2 instrument was also mounted to the rosette to measure nitrate. To characterize the water mass at each station, surface salinity and temperature data were retrieved from the CTD profiles at each station, then plotted on a temperature–salinity (T/S) diagram.
Drifting Sediment Trap Sampling
A standard Lagrangian-type surface-tethered drifting sediment trap (KC Denmark model number 28.200) was used to collect sinking particles (Moran et al., 2012) at seven locations (Figure 1). Two of the four tubes contained a removable clear-bottomed cup filled with 250 mL of viscous polyacrylamide gel. The cups were fitted with a thin sloping ramp to funnel all sinking particles into the gel within the cup and prevent particles from settling between the inside of the tube and the outside of the cup. All four tubes were filled with chilled (0°C) filtered seawater (0.3 μm) collected in Niskin bottles from the same depth and station at which the drifting sediment trap was deployed. The remaining two tubes collected sinking particles in bulk, maintaining in situ chemistry as much as possible. The trap array was deployed at 30 m below the surface at each station, estimated to correspond to the bottom of the euphotic zone, for 3–12 h depending on the timing of other cruise operations (Table 1). We used the same depth for consistency and to reduce issues of resuspension by sampling too close to the seafloor. The drifting sediment trap was fitted with an ARGOS beacon and a go-Tele GPS tracker unit to track its real-time location.
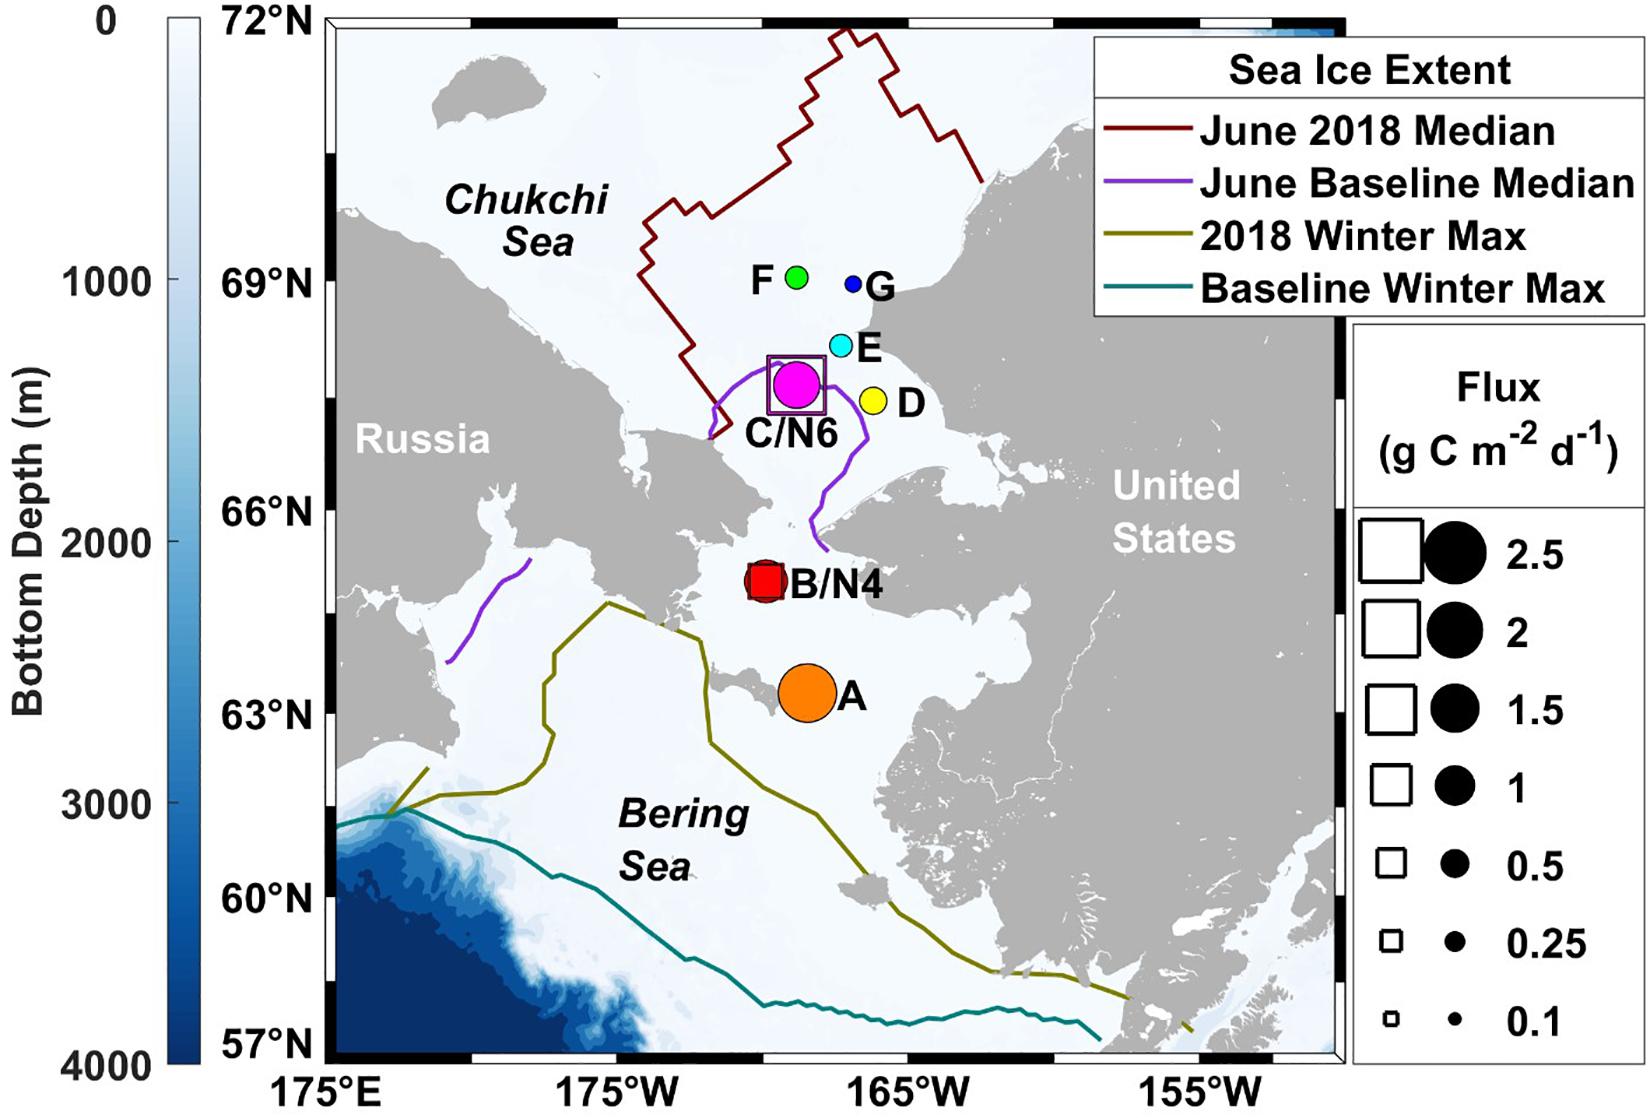
Figure 1. Spatial patterns of sinking particulate organic carbon fluxes on the Pacific Arctic shelf in June 2018. Drifting sediment trap measurements are depicted relative to the diameters of the circles, while moored sediment traps fluxes are shown as the length of the squares. Colored lines represent sea ice extent (Fetterer et al., 2017), where the 2018 June median ice extent (maroon) is compared with the 1981–2010 median June baseline (purple) and the record breaking 2018 maximum ice extent (olive) is compared with the 1981–2010 median winter maximum (teal).
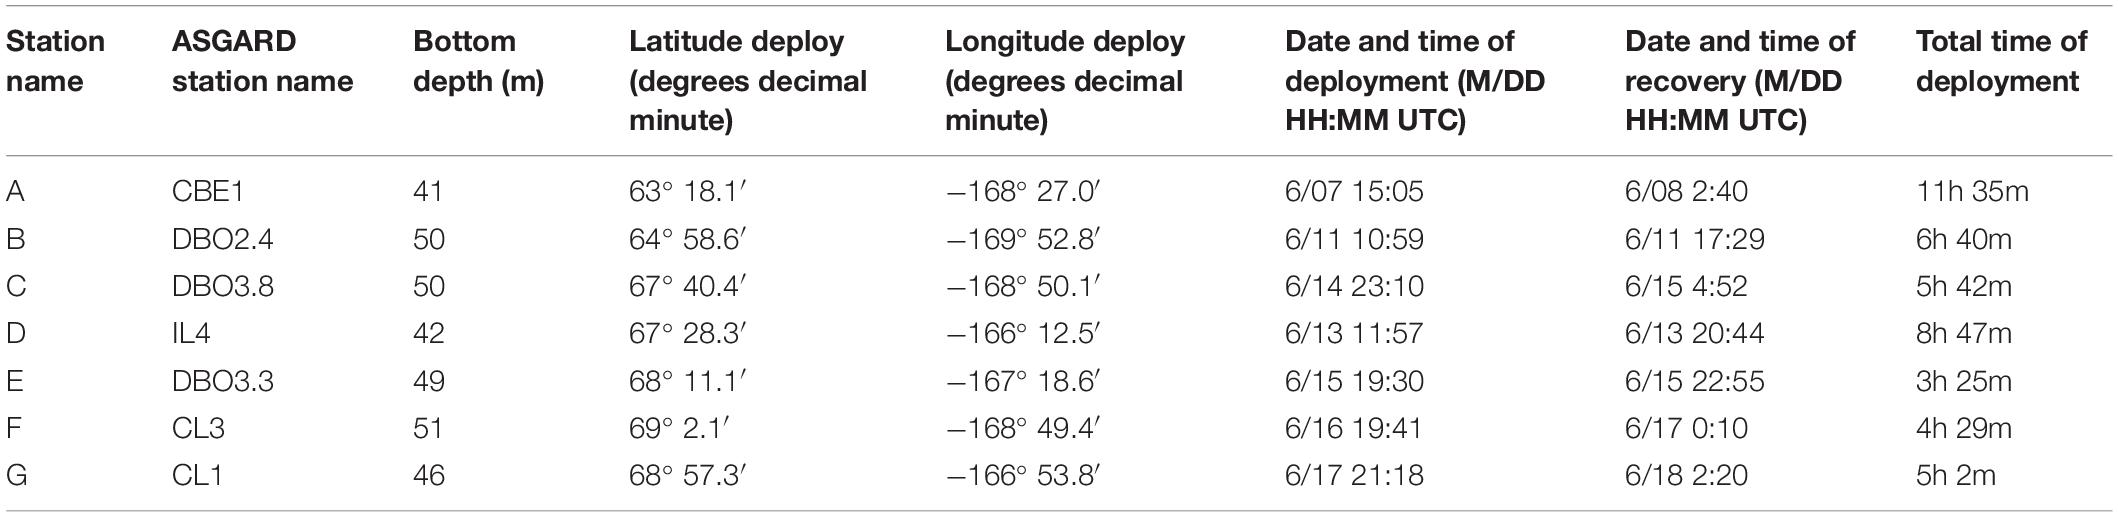
Table 1. Location and duration of drifting sediment trap deployments 30 m below the sea surface in 2018.
Flux Rate Measurements
Sinking particles collected in the drifting sediment trap were used to determine POC fluxes. Once the trap was recovered, the following steps were performed as quickly as possible in an environmental chamber that fluctuated in temperature from 3 to 5°C in order to maintain as close to in situ conditions for particle-associated microbes as possible. Overlying water was siphoned using a vacuum pump down to a boundary layer above the settled particles at the bottom of all four tubes. In the two bulk particle collection tubes, the material that remained in the tubes after siphoning was quantitatively split into four subsamples using a Folsom plankton splitter. Three subsamples were used for triplicate analytical flux measurements. These subsamples were filtered onto pre-combusted 25-mm Whatman GF/F filters and placed in a dehydrator at 60°C for 12 h. Once dried, the filters were sealed in Petri dishes until further analysis (See section “Elemental POC/PN/δ13C/δ15N Analysis” for details). Particulate organic carbon values were converted to daily fluxes depending on the deployment period and the collecting area (g C m–2 day–1).
Respiration Rate Measurements
One subsample from each of the two drifting sediment trap tubes was used to estimate particle-associated microbial respiration rates. This material was homogenized by swirling the container and pipetted with a wide-bore pipette into eight replicate 2-mL glass vials (Batch PSTS-1721-01) fitted with Pre-Sens Oxygen Optode Sensor Spots (Regensburg, Germany) per drifting sediment trap tube, totaling 16 experimental samples. Filtered seawater controls were obtained from a Niskin bottle closed at 30 m depth during a CTD cast upon recovery of the drifting sediment trap. Water for the control samples was filtered (0.3 μm) to remove particles and particle-associated microbes. The filtrate was pipetted into eight replicate vials that were identical to the experimental vials. All 24 vials were checked for air bubbles, and vials were then placed inside a sealable, clear, plastic water-bath and placed on top of a PreSens SDR SensorDish Reader The water-bath was located inside a dimly lit cold room that varied from 3–5°C and connected to a Fisherbrand Isotemp 500LCSU Circulator, now referred to as a chiller, which maintained temperature at precisely 4.0°C during the incubation. The concentration of oxygen in each vial and temperature in the incubation chamber were recorded every 30 s for the duration of the incubation using PreSens – Sensor Dish Reader Version 4 Software. Incubations lasted for between 3 and 12 h. After the incubations, the remaining material from each vial was filtered onto individual GF/F filters and treated the same as the flux measurement samples.
A few modifications were made to the methods used for measuring particle-associated microbial respiration rates during the course of the study in order to try to improve the accuracy of our measurements. During the first incubation at station A, a low-oxygen micro-environment formed around the sensor spot, located at the bottom of the vial. For all subsequent incubations, the entire incubation chamber was repeatedly inverted for 5 s every 3 min to mix the sample. Additionally, we noticed the concentration of oxygen increased over time in a few of the experimental samples (i.e., at stations A, C, and E), suggesting photosynthetic activity. During the last two incubations at stations F and G, a black cloth was used to cover the incubation chamber in order to prevent any light from reaching the samples, theoretically preventing light reactions associated with photosynthesis. However, it should be noted that dark reactions associated with photosynthesis can continue for several hours after the removal of light in cold water.
The data recorded by the PreSens software were downloaded and analyzed using the following steps in Matlab 2017a computing software. Data collected before the incubation temperature stabilized were trimmed so that only the time during which the incubation temperature remained stable was analyzed. The first 188 min of data after temperature stabilization was used to determine respiration rates. Linear regression analysis was performed on the oxygen concentration data from each vial. The average and standard deviation of the eight replicate control slopes (rcontrol) was taken, and for each of the two experimental samples. Then the average slopes for each of the experimental incubations were averaged together and the error was propagated (rexp). We calculated the carbon-specific particle-associated microbial respiration rate (R_PAM) using a 117:170 organic carbon to oxygen molar respiratory quotient (VOC:O2), assuming a one to one relationship with organic carbon degradation and carbon dioxide production (Anderson and Sarmiento, 1994), an incubation volume (vol) of 2 mL, and the final concentration of POC at the end of the incubation ([POC]) (Eq. 1).
The average R_PAM ± 1 standard deviation was compared with those from other studies (Ploug and Jorgensen, 1999; Ploug and Grossart, 2000; Iversen and Ploug, 2010; Collins et al., 2015; McDonnell et al., 2015; Belcher et al., 2016a,b) at different locations.
Sinking Particle Visualization
Collecting particles in polyacrylamide gel kept sinking particles intact and allowed for particle imaging and identification (Ebersbach and Trull, 2008; McDonnell and Buesseler, 2010; Durkin et al., 2015). The contents of the cups were photographed within 6 h of sediment trap recovery using a 42.4 MP digital camera equipped with a 90 mm macro-lens and a flash unit. A length to pixel relationship was determined for each image in Adobe Photoshop CS6. These samples were used to qualitatively determine sinking particle type.
Primary Productivity Rate Measurements
13C-15N dual-isotope tracer technique was used to measure integrated rates of primary productivity at the seven stations following a standard protocol (Dugdale and Goering, 1967; Hama et al., 1983). For primary productivity rate measurements, water was collected at six depths corresponding to the 100, 50, 30, 12, 5, and 1% light levels. The 1% light level is estimated to be the minimum amount of light necessary for photosynthesis to occur, i.e., the bottom of the euphotic zone. The incubations lasted between 4 and 7 h, and measurements were extrapolated to daily production by adjusting to total daylight for each incubation site. At the end of the experiment, contents in each incubation bottle were filtered onto pre-combusted GF/F filters and frozen at −80°C until further analysis. These depth-specific rates were then integrated over the entire depth of the euphotic zone to determine total water column primary productivity rates in units of g C m–2 day–1.
Elemental POC/PN/δ13C/δ15N Analysis
All dried or frozen GF/F filters were processed in the Alaska Stable Isotope Facility at the University of Alaska Fairbanks’s Water and Environmental Research Center. Filters were acidified with 10% hydrochloric acid for 24 h to remove particulate inorganic carbon (PIC). The filters were pelletized in tin cups. Stable isotope data were obtained using continuous-flow isotope ratio mass spectrometry. Stable isotope ratios were reported in δ notation as parts per thousand (‰) deviation from the international standards VPDB (carbon) and air (nitrogen). Typically, instrument precision was <0.2‰.
Moored Sediment Trap Sampling
Two 24-cup Hydro-Bios sediment traps were moored at stations B south of Bering Strait (trap depth 37 m, bottom depth 49 m) and C north of Bering Strait (trap depth 35 m, bottom depth 50 m) from June 2017 to June 2018 (see Table 2 and Figure 1 for location of traps). Sample cups were filled with a hyper-saline (salinity 38) 5% formalin solution in filtered seawater to preserve samples during and after deployment (Lalande et al., 2020). The carousel rotated at pre-programmed intervals ranging from seven to 40 days.

Table 2. Location and duration of moored sediment traps.
As the trap at station B was recovered before the end of its rotation, the material in the last open cup was excluded from analysis. Subsamples from each cup were filtered onto pre-combusted (500°C overnight) GF/F filters (0.7 μm), exposed to 1 N hydrochloric acid overnight for removal of inorganic carbon, and dried at 60°C overnight before encapsulation for POC measurements (Lalande et al., 2020). Particulate organic carbon measurements were conducted on a Perkin Elmer CHNS 2400 Series II elemental analyzer. Particulate organic carbon measurements were converted to daily flux rates depending on the open cup duration of each sample.
Instruments measuring physical and biological parameters in tandem with sinking POC flux were deployed on the moorings at stations B and C. A 300 kHz RDI workhorse ADCP measured bottom current velocity ∼5 m off the seafloor at each site. Lowpass-filtered bottom current velocity were plotted overlaid with a 12-h smoothing. A Seabird SBE16plus unit coupled with a Wetlabs fluorometer measured temperature, salinity and fluorescence at 27 m at station B and 25 m at station C.
Remote Sensing
Daily sea ice concentrations were retrieved from the National Snow and Ice Data Center satellite records for the deployment period at both mooring sites (Fetterer et al., 2017). Wind velocity was obtained from modeled wind reanalysis for the deployment period at both mooring sites (European Centre for Medium-Range Weather Forecasts, 2019). Twenty-four hour smoothing was performed on wind data.
Results
Environmental Conditions
Sea surface temperatures ranged from 1 to 10°C during the ASGARD expedition in June 2018, with the warmest water temperature above 8°C observed south of Nome and west of Norton Sound. These warm waters were characteristically fresher, with salinities ranging from 30 to 30.5, consistent with Alaska Coastal Water (ACW) characteristics and a shift to wind direction from the south (see Supplementary Figure 1 for a map depicting regional currents in the study area). Wind speed ranged from 0 to 36 kt during the course of the cruise as measured by a vessel-mounted anemometer corrected for ship motion. Throughout the water column, temperatures ranged from −0.5 to 10°C and salinities ranged from 30 to 33.5. Chlorophyll fluorescence ranged from 0 to 15 μg L–1 while nitrate concentration ranged from 0 to 20 μmol L–1 and was highest along the northernmost Cape Lisburne line. SUNA-derived nitrate concentration measurements were confirmed with bottle-derived nitrate concentration measurements. Sea ice was absent during the cruise. A salinity of 31 delimited stations A, B, and C into the Bering Shelf/Anadyr Waters (BSAW) (salinity > 31) and stations D, E, F, and G into ACW waters (salinity < 31) (Figure 2).
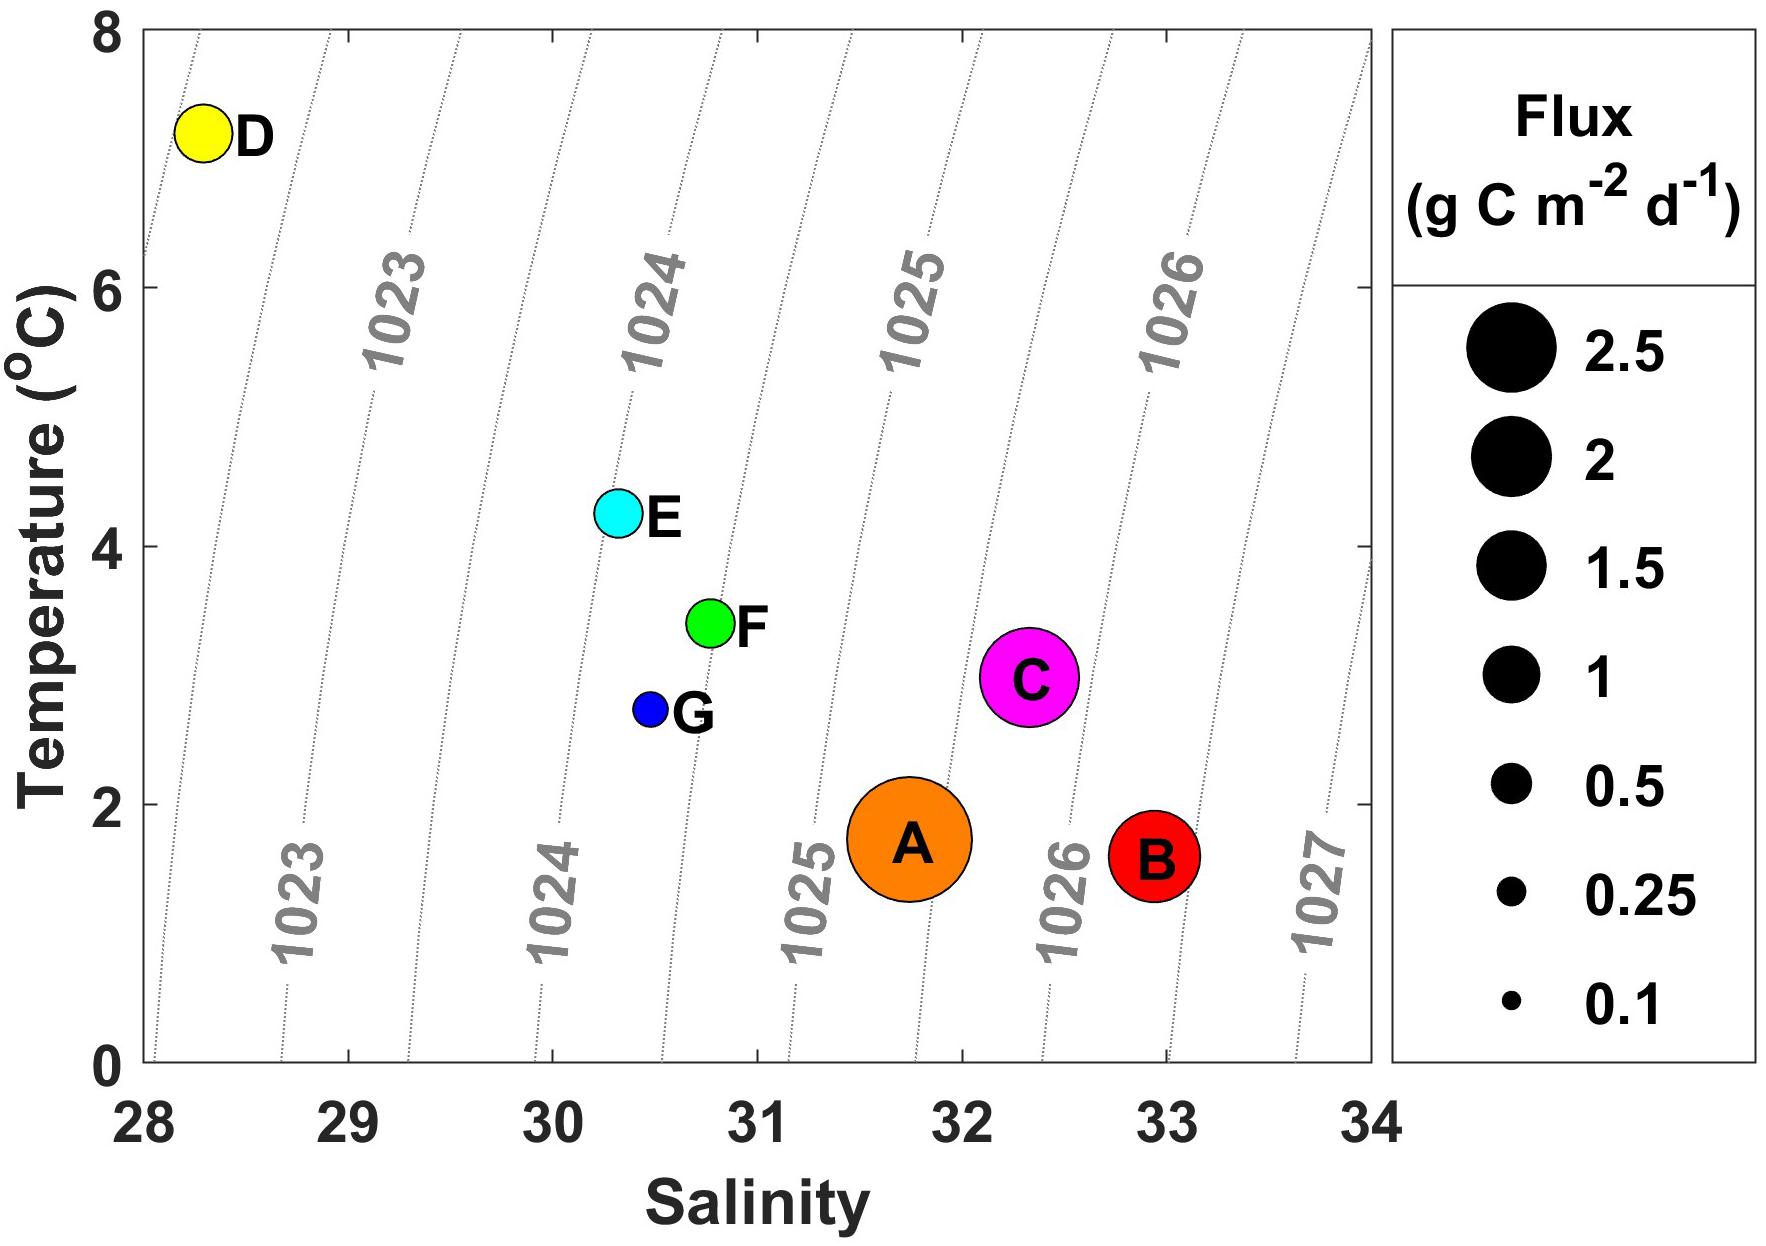
Figure 2. Water mass characteristics from each station where drifting sediment traps were deployed. The size of the circle is indicative of the amount of particulate organic carbon (POC) flux, labeled with station name. Warmer, fresher water characteristic of Alaska Coastal Water (ACW) has lower flux values compared with cooler, more saline water characteristic of Bering Shelf/Anadyr Water (BSAW), which has higher flux values.
Drifting Sediment Trap Flux Rate Measurements
The depth of the water column varied little at our seven stations, ranging from 41 to 51 m and averaging 47 m, 17 m deeper than the drifting sediment traps sampling depths at 30 m (1% Photosynthetically Active Radiation (PAR)). The actual 1% PAR varied from between 16 and 30 m, except for station F having a 1% PAR reaching 38 m (Table 3). The overall average depth of the euphotic zone was 26 m, comparable to POC export measurements at 30 m. Sinking POC fluxes were high (up to 2.2 g C m–2 day–1) but spatially variable. Bering Shelf/Anadyr Waters were associated with higher fluxes (1.2–2.2 g C m–2 day–1) at stations A, B, and C, while lower fluxes (0.2–0.5 g C m–2 day–1) were characteristic of ACW at stations D, E, F, and G (Figure 2). For stations in the BSAW, sinking particles consisted mostly of aggregated diatoms and viable diatom cells while the ACW stations contained more diverse particles including fecal pellets, zooplankton, and diatom cells (Figure 3).
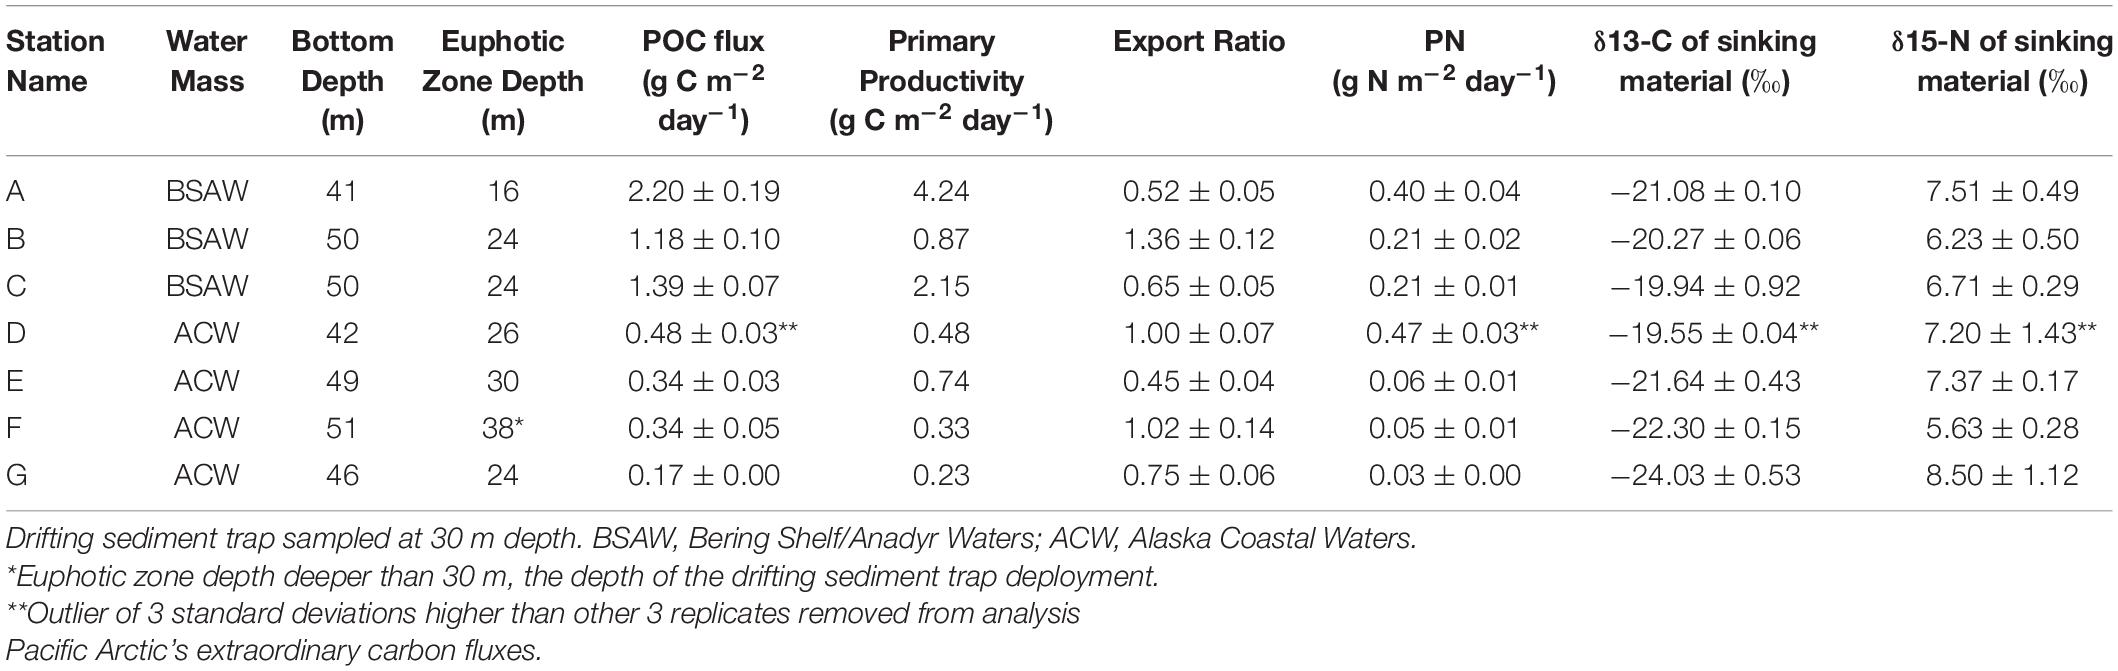
Table 3. Particulate organic carbon (POC) flux, primary productivity, and export ratios at seven stations in the Bering and Chukchi seas at drifting sediment trap sites.
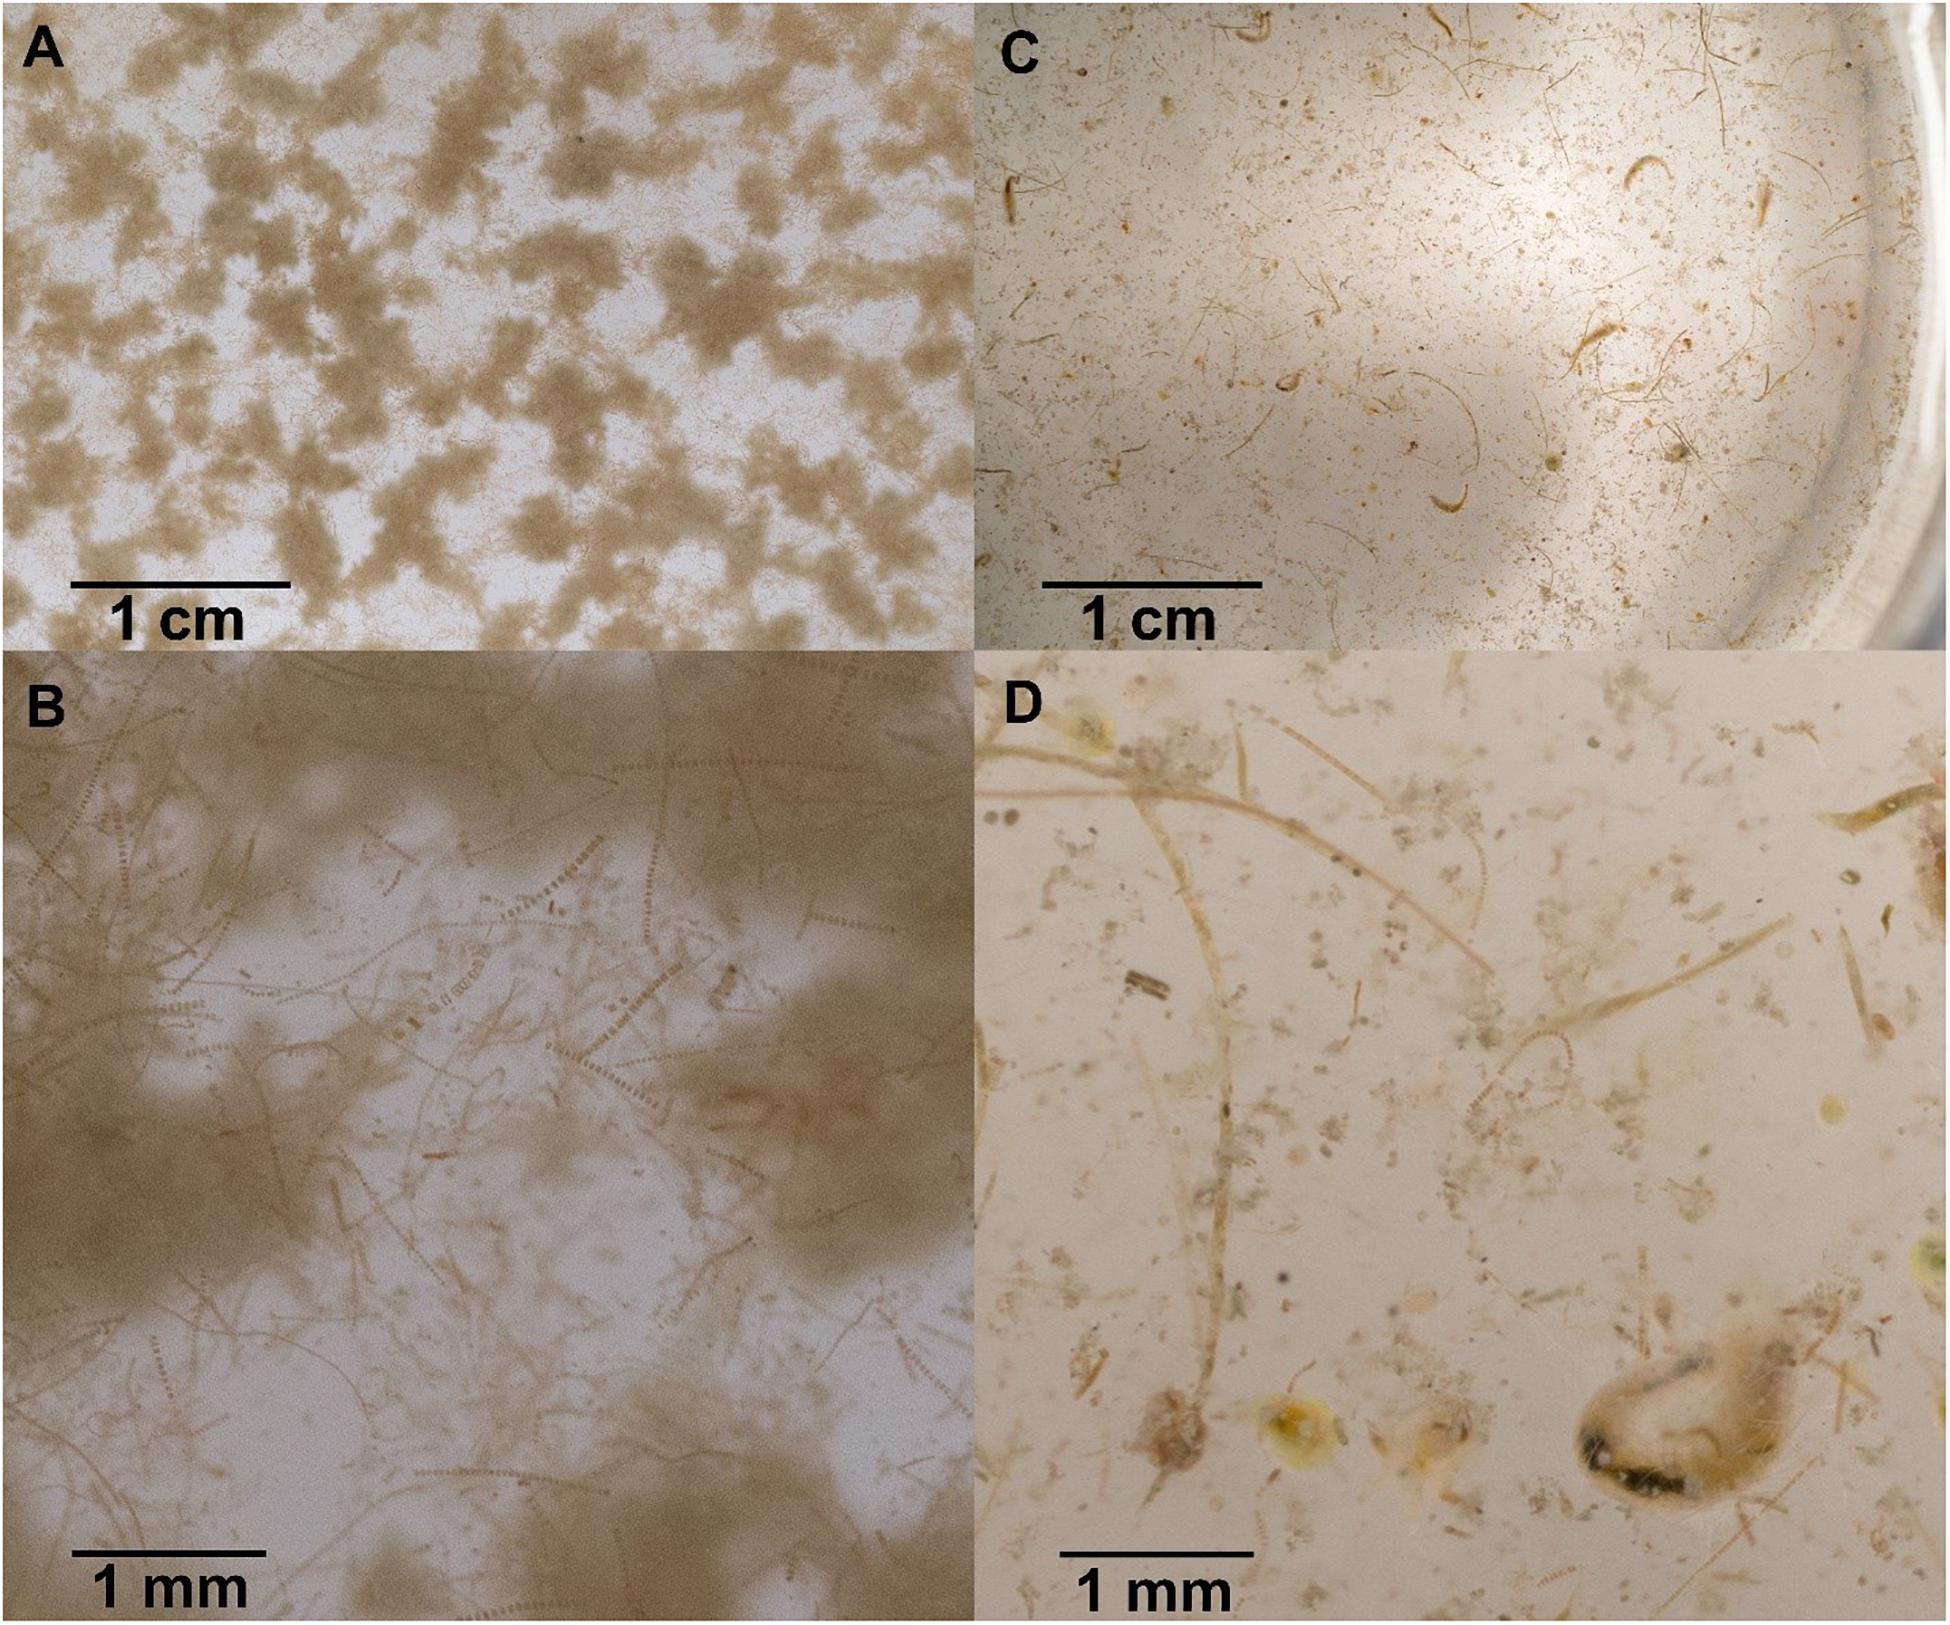
Figure 3. Sinking particles collected in polyacrylamide gel traps at station A (A,B) and station D (C,D). Sinking particles at station A are characteristic of Bering Shelf/Anadyr Water stations and consist exclusively of fluffy aggregates made of diatoms and viable diatom chains. Sinking particles at station D are characteristic of Alaska Coastal Water stations and consist of a more diverse set of particles, including fecal pellets, zooplankton swimmers, as well as still viable and senescent diatoms.
The particulate nitrogen (PN) flux ranged from 0.03 to 0.47 g N m–2 day–1. Both the highest and lowest PN flux were measured in the ACW (Table 3). PN flux was slightly, though not significantly, higher in the BSAW (0.27 g N m–2 day–1) than in the ACW (0.15 g N m–2 day–1). Delta 13C ranged from −24.03 to −19.94‰ with no clear distinction in δ13C values between the ACW and BSAW. Both the least negative and most negative δ13C values were located at stations in the ACW. A similar pattern was true for δ15N values with values ranging from 5.63 to 8.5‰. There was no spatial pattern in δ15N values and both the highest and lowest δ15N values were found in stations in the ACW.
Respiration Rate Measurements
Overall carbon specific particle-associated microbial respiration ranged from −13.7 to 12.8% day–1 (Table 4). Negative carbon specific particle-associated microbial respiration indicates net respiration of carbon while positive values indicate net production of carbon. Five of the seven stations had carbon specific particle-associated microbial respiration that were indistinguishable from zero where carbon specific particle-associated microbial respiration could not be distinguished from free living microbial respiration. The two respiration measurements that were distinguishable from zero were from stations B (−13.7 ± 10.5% day–1) and C (12.8 ± 6.7% day–1), both of which are in BSAW. Therefore, all carbon specific particle-associated microbial respiration from stations in ACW were indistinguishable from zero. Average carbon specific particle-associated microbial respiration from BSAW stations (3.1 ± 14.6% day–1, average ± 1 standard deviation), ACW stations (1.7 ± 2.9% day–1), as well as all stations combined (2.3 ± 8.7% day–1) were indistinguishable from zero. Additionally, there was no statistical difference in carbon specific particle-associated microbial respiration between the ACW and BSAW.
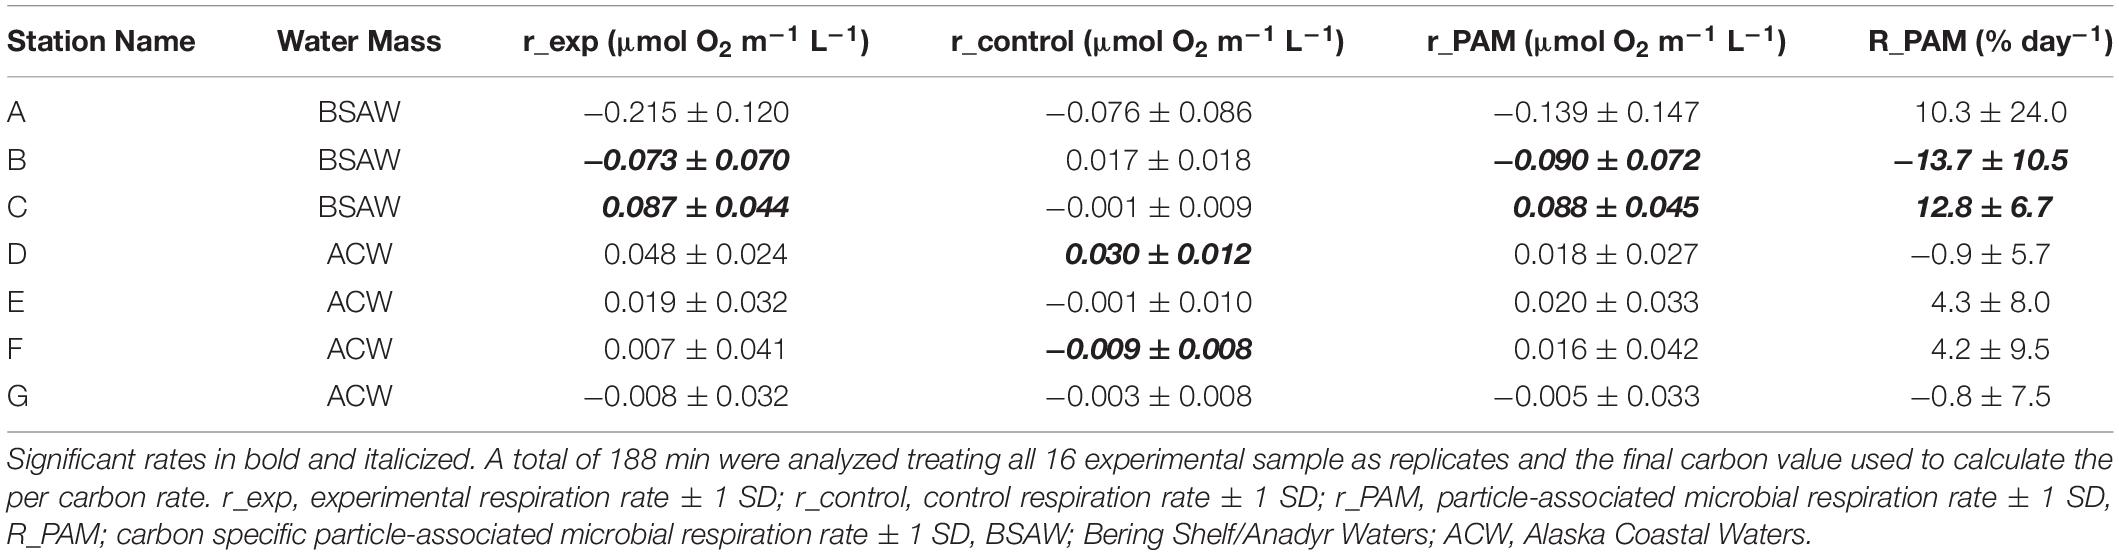
Table 4. Particle-associated microbial respiration rates and carbon specific rates for sinking material.
Primary Productivity Rate Measurements
Primary productivity rates were spatially variable with an overall range of 0.23–4.24 g C m–2 day–1. Station A had the highest rate of primary productivity and had the highest fluorescence signal of the seven stations (full depth CTD profiles are shown in Supplementary Figure 2). Here, a slight chlorophyll-a maximum of 10 mg m–3 fluorescence was present at 5 m depth and the water column was well-mixed. More pronounced, though lower chlorophyll-a maximums occurred at stations C (30 m) and F (38 m). Station F had the deepest 1% PAR depth of 38 m, co-occurring with the chlorophyll-a maximum, but had the second lowest rate of primary productivity of 0.34 g C m–2 day–1. Overall, primary productivity was higher in the BSAW (0.87–4.24 g C m–2 day–1) than in the ACW (0.23–0.74 g C m–2 day–1). All three stations in the BSAW had less stratified water columns, while all four stations in the ACW had more stratified water columns.
Export Ratios
Export ratios are a metric that characterizes the efficiency of the biological carbon pump, calculated using Eq. 2.
Higher export ratios indicate a more efficient biological carbon pump and lower ones less efficient. Export ratios ranged from 0.45 to 1.36 with the lowest export ratio observed at station E and the highest at station B (Table 3). There was no significant difference in export ratios between water masses (BSAW: 0.84 ± 0.45 and ACW: 0.81 ± 0.27 mean ± 1 SD). Three stations (B, D, and F) had export ratios at or above 1 and the overall study average export ratio was 0.82 ± 0.32 (mean ± 1 SD).
Moored Sediment Trap Time Series Flux Rate Measurements
Moored sediment trap-derived POC fluxes provide independent measures to compare with the fluxes observed with drifting sediment trap sampling. Drifting sediment trap sampling at stations B and C took place three and six days following the end of the moored sediment trap sampling, respectively. Particulate organic carbon fluxes of 0.8 and 1.2 g C m–2 day–1 at station B and 2.3 and 1.4 g C m–2 day–1 at station C were obtained with the moored and drifting sediment traps, respectively (Table 3 and Figure 4).
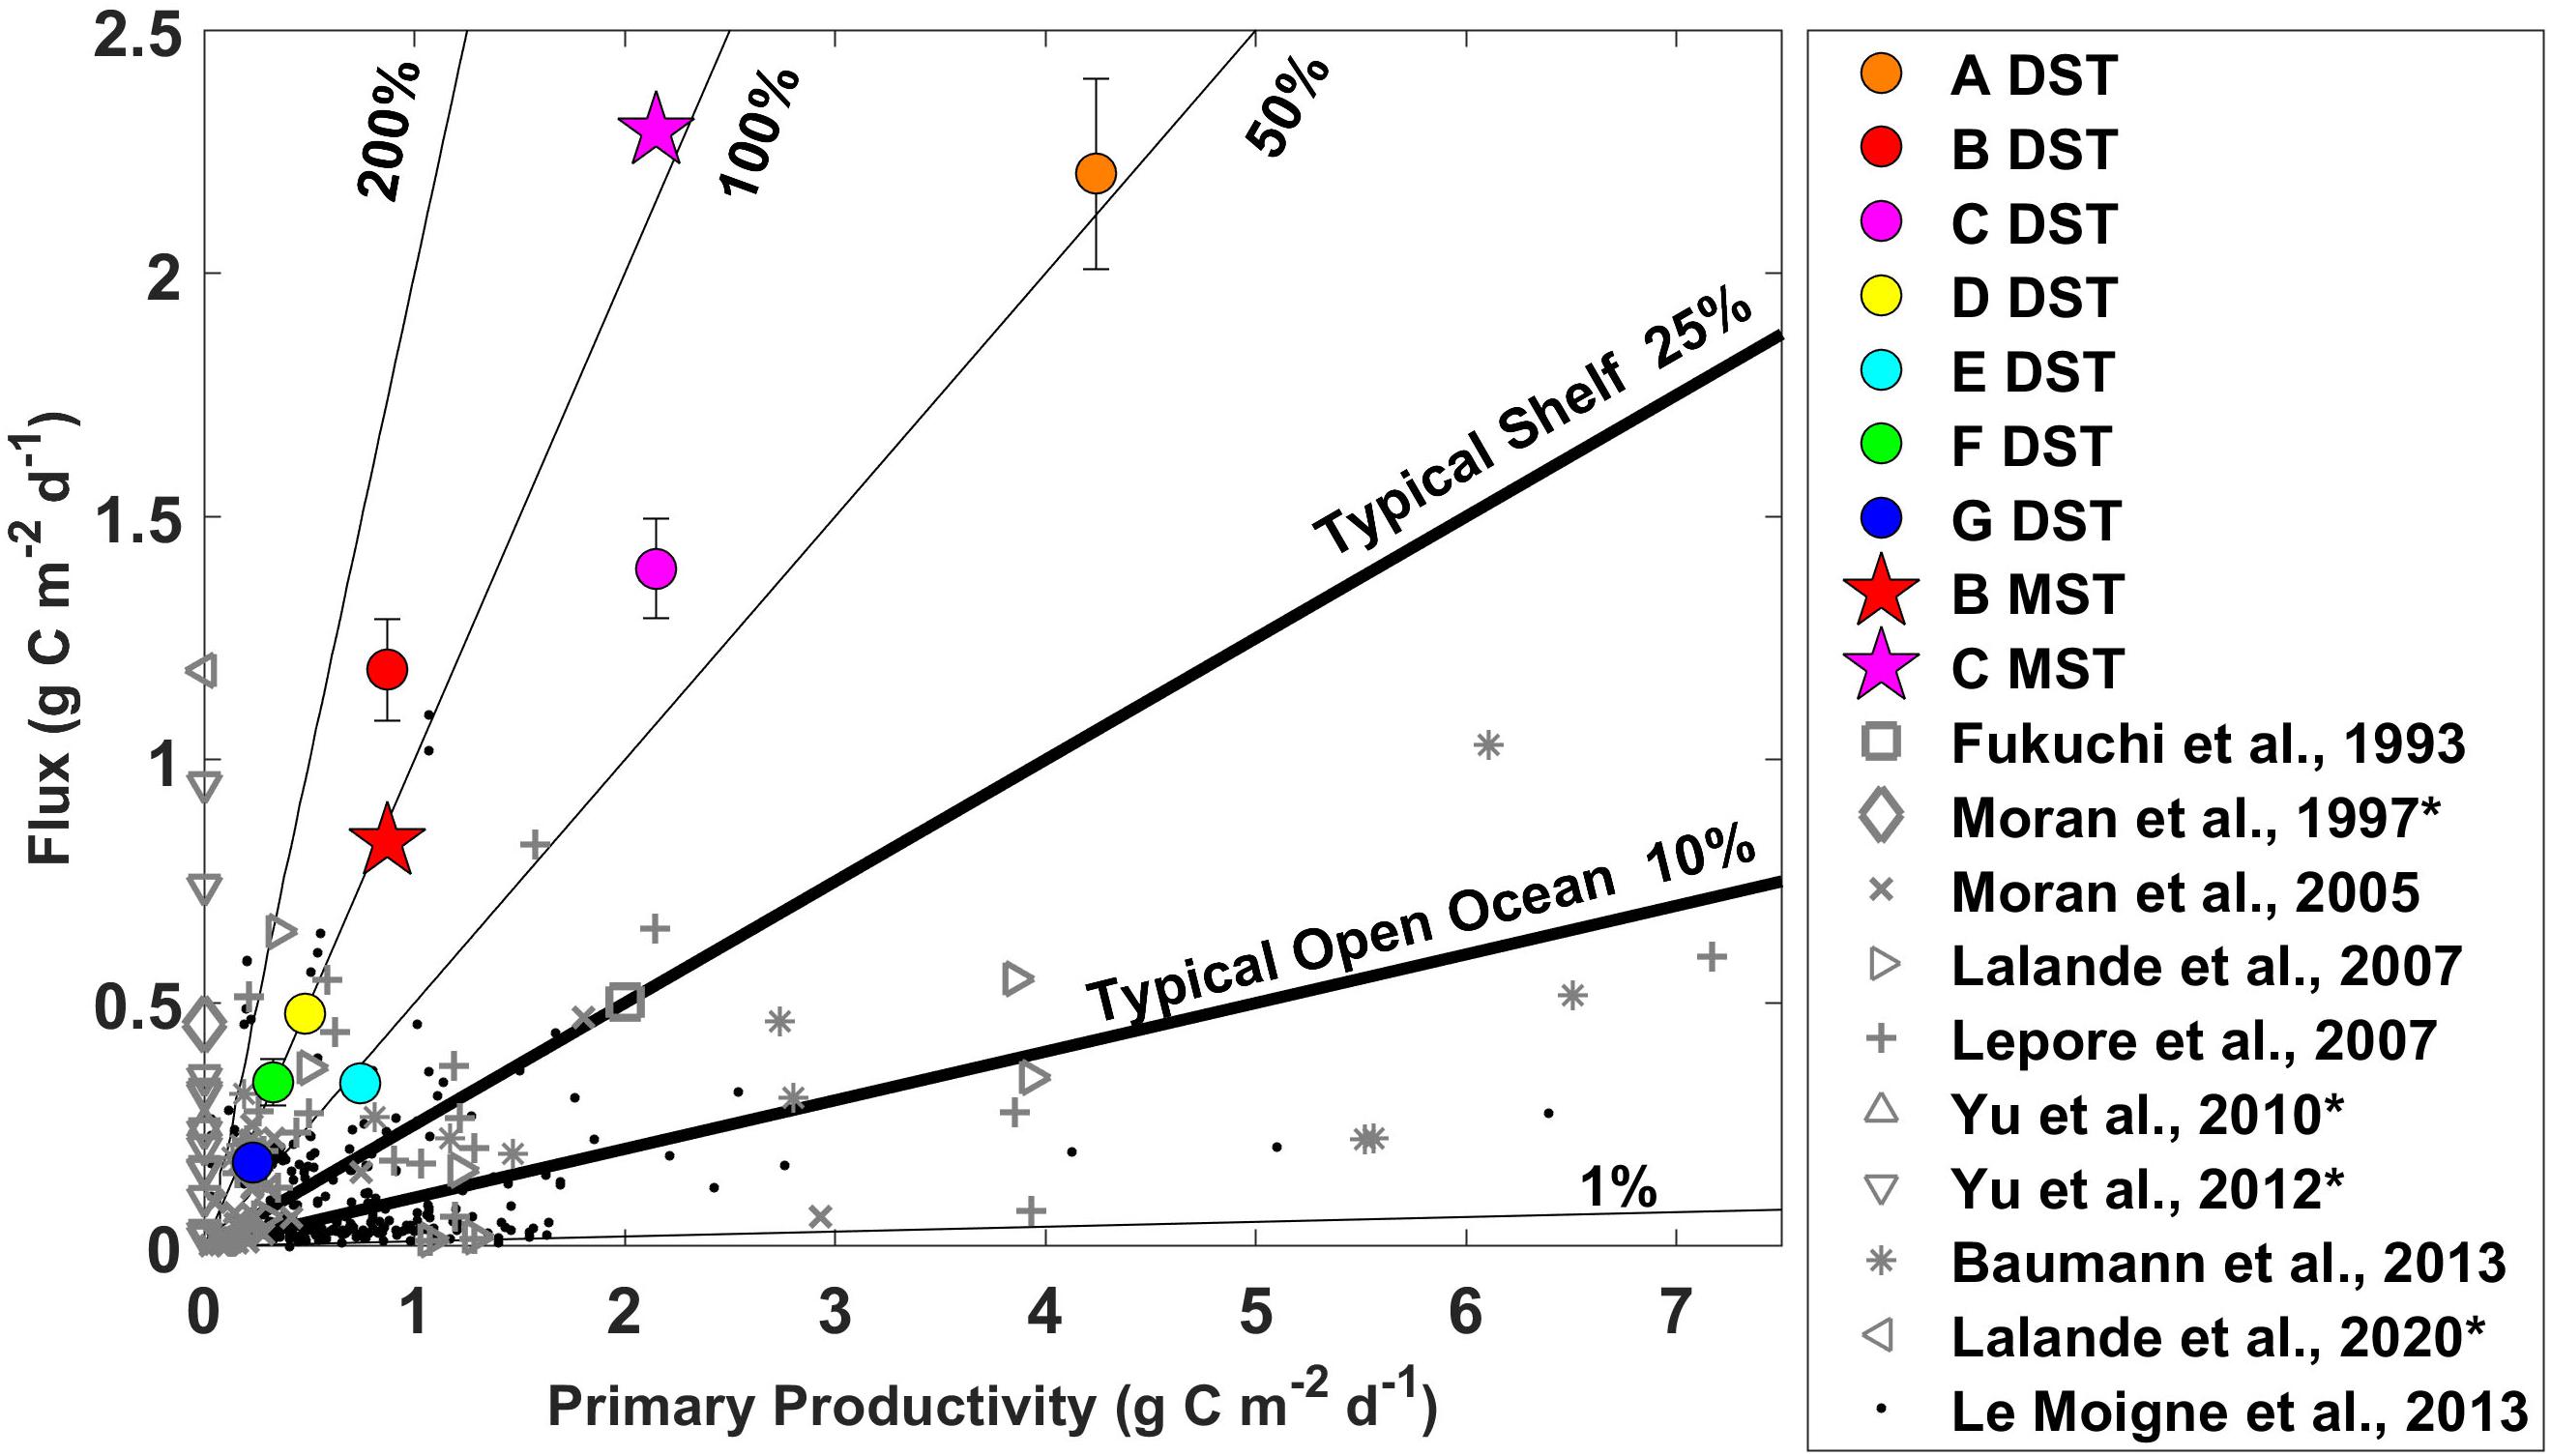
Figure 4. Sinking particulate organic carbon fluxes and primary productivity rates with contours of the export ratio between these two parameters measured during June 2018 on the Pacific Arctic shelf. The circles represent flux measurements from the drifting sediment trap. The stars represent the final flux measurement from the moored sediment traps (values plotted against the same primary productivity rates). Gray markers provide regional (Fukuchi et al., 1993; Moran et al., 1997, 2005; Lalande et al., 2007, 2020; Lepore et al., 2007; Yu et al., 2010, 2012; Baumann et al., 2013) and black markers global context (Le Moigne et al., 2013). *No corresponding productivity data with Moran et al., 1997 (Moran et al., 1997), Yu et al. (2010, 2012), and Lalande et al., 2020 (Lalande et al., 2020).
At station B, POC fluxes were generally low (<0.25 g C m–2 day–1) from June through October 2017 with brief periods of elevated POC fluxes (0.6–1.3 g C m–2 day–1) occurring around the same time as peaks in fluorescence (Figure 5). Particulate organic carbon fluxes increased along with wind speed during November and December 2017 (0.9–1.4 g C m–2 day–1), decreased during January 2018, and remained relatively low (<0.65 g C m–2 day–1) when sea ice was present from January through late April 2018. Fluorescence remained low from mid-October 2017 through April 2018. Sea ice melted at the end of April 2018 and the highest POC fluxes were observed about one month later during late May 2018 (1.5 g C m–2 day–1).
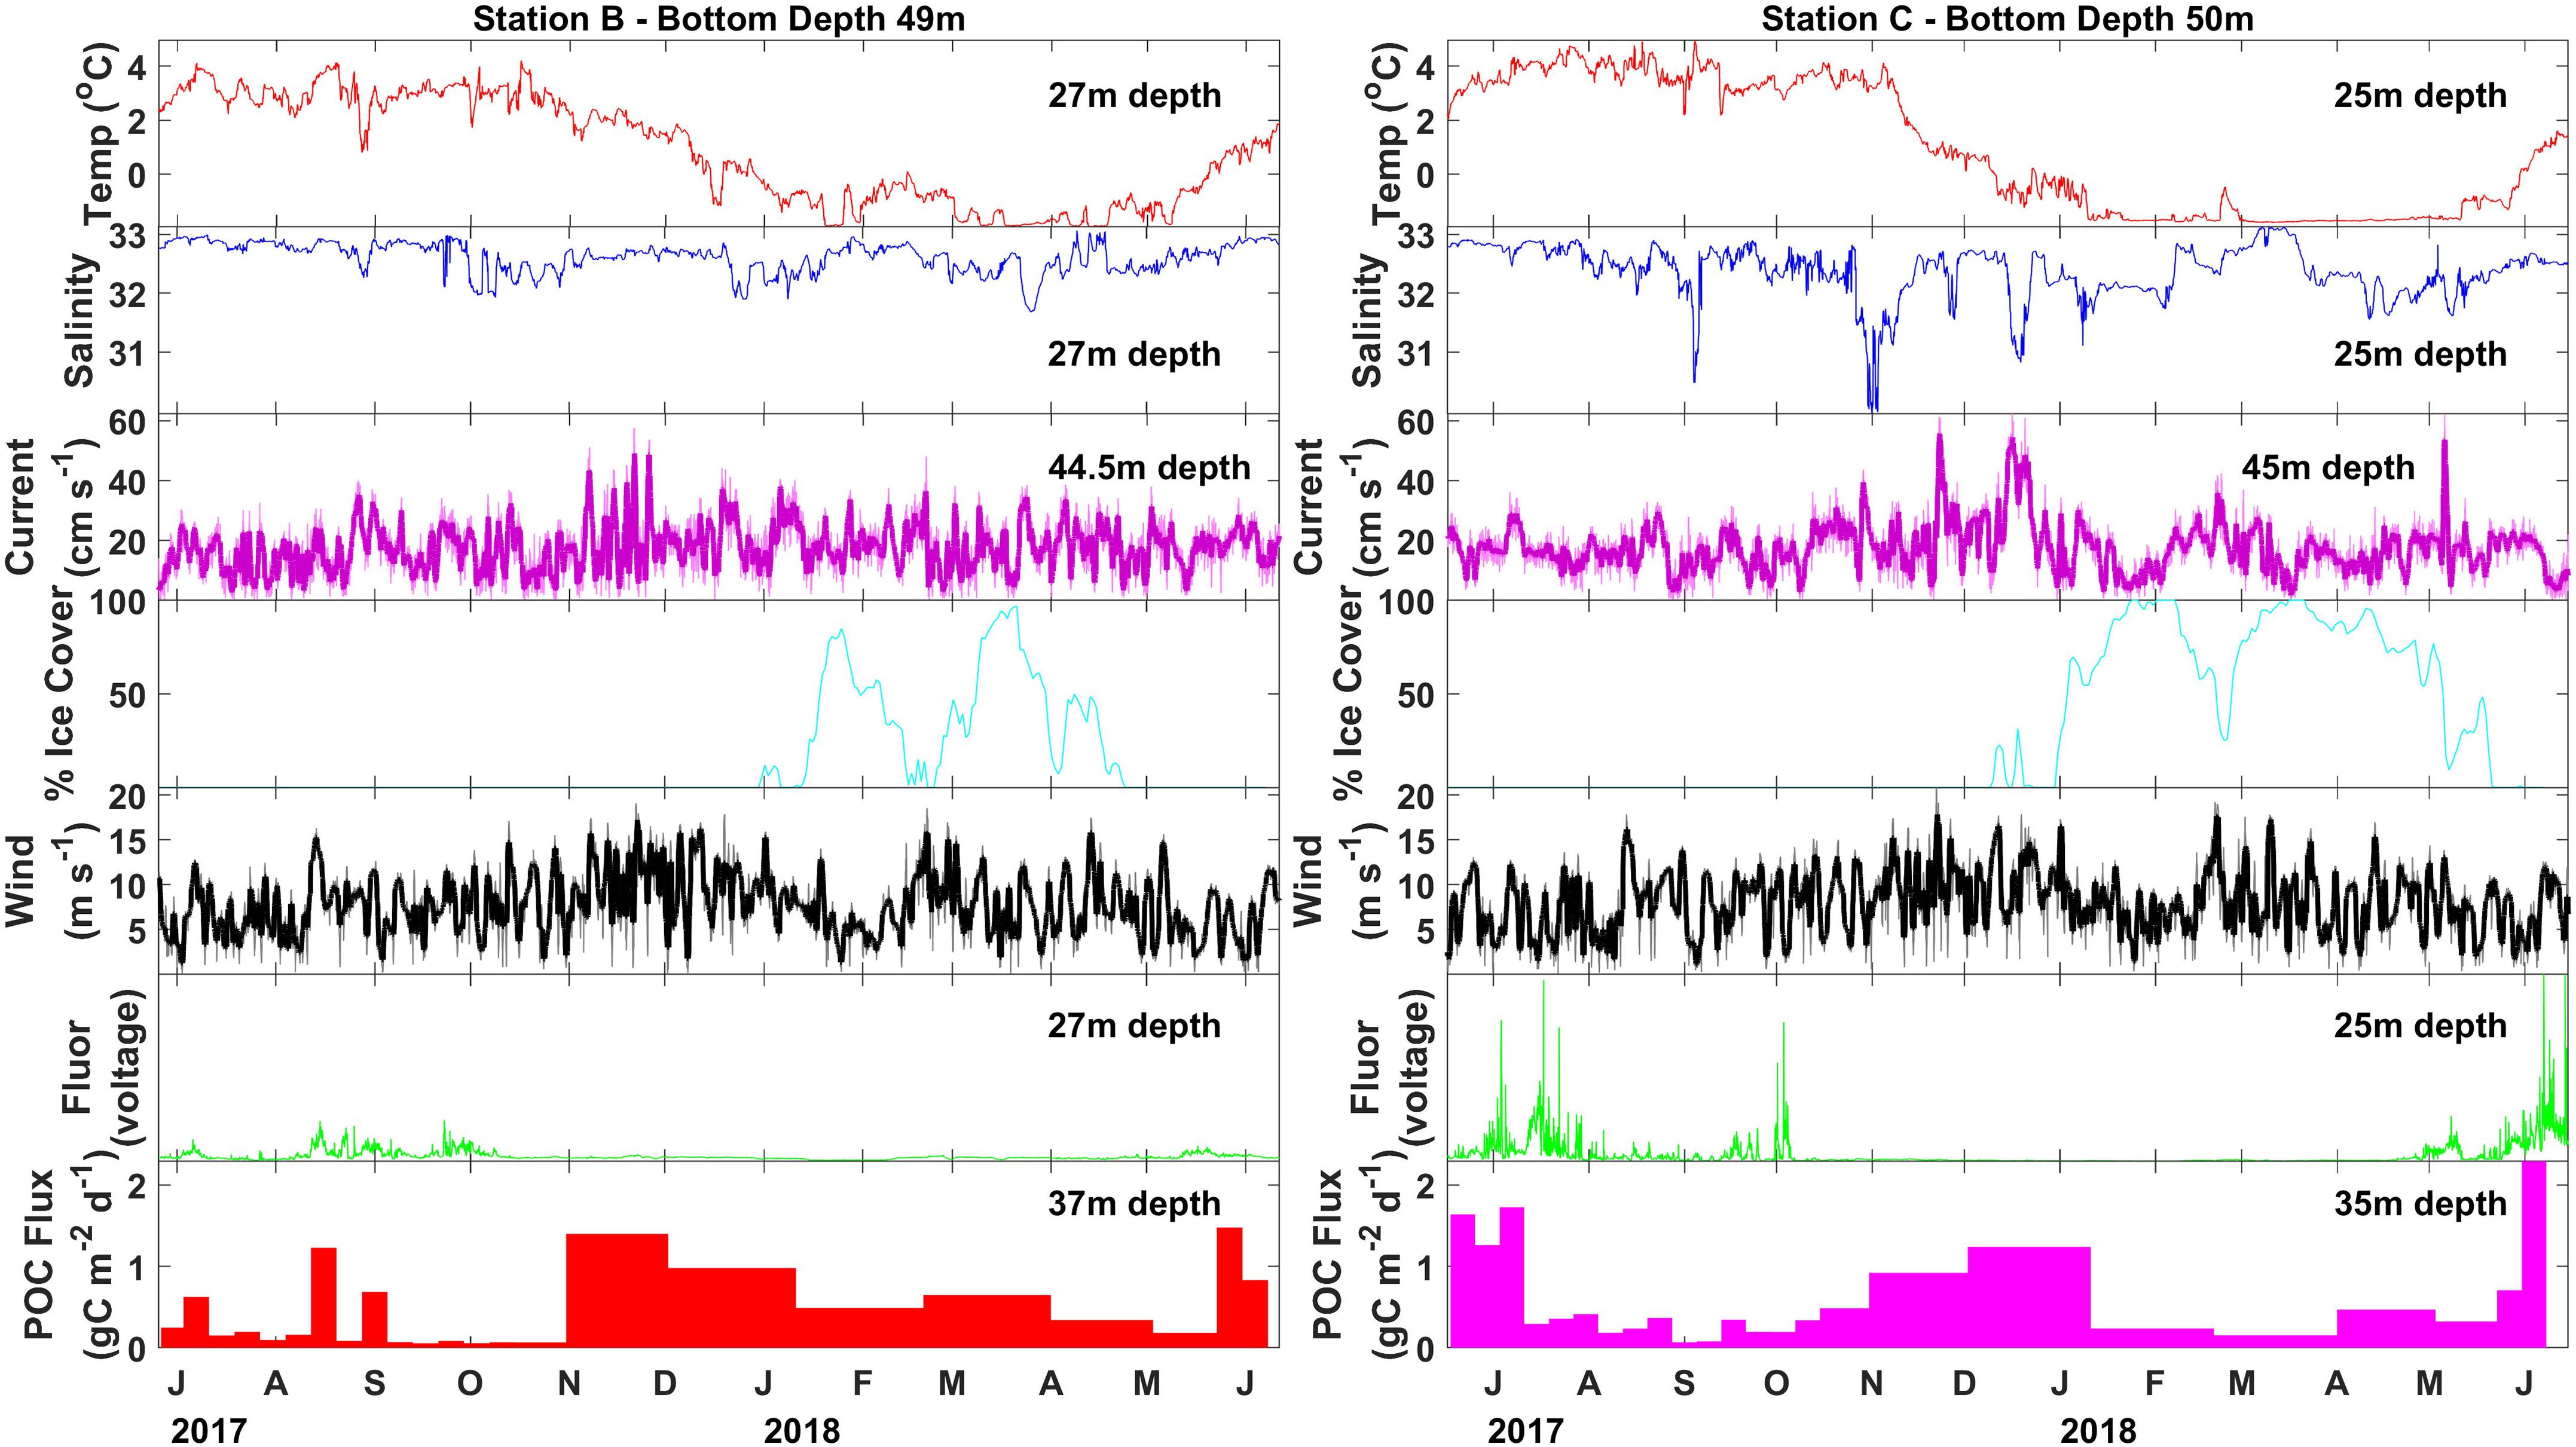
Figure 5. Particulate organic carbon flux (colored bars) measured with moored sediment traps at stations N4 and N6 between June 2017 and June 2018. Sea ice percent cover (cyan line) taken from NSIDC satellite records (Fetterer et al., 2017). Wind velocity (black line) taken from modeled wind reanalysis (European Centre for Medium-Range Weather Forecasts, 2019). Twenty-four hour smoothing is shown with the thick black line. Lowpass-filtered current velocity (magenta line) taken from AD, with 12 h smoothing shown with the thick magenta line, temperature (red line), salinity (blue line), fluorescence (green line) taken from seabird SBE16plus unit coupled with a WetLabs fluorometer on each of the moorings.
At station C, high POC fluxes were recorded from June to mid-July 2017 (1.2–1.7 g C m–2 day–1), followed by a period of low POC fluxes from mid-July through mid-October 2017 (<0.5 g C m–2 day–1) (Figure 5). Spikes in fluorescence occurred sporadically from June until early October 2017. Particulate organic carbon fluxes increased starting in mid-October 2017 and were elevated throughout November and December 2017 (0.9–1.2 g C m–2 day–1). Particulate organic carbon flux dramatically decreased when sea ice formed during January 2018. A period of low POC fluxes was observed between January and May 2018 (<0.5 g C m–2 day–1), while sea ice was consistently present. The highest POC fluxes were measured at the beginning of June 2018 (2.3 g C m–2 day–1), at the same time as the highest peaks of fluorescence soon after sea ice retreated from this station.
The moored sediment trap time series indicates that POC flux had recently peaked at station B before drifting sediment trap sampling took place during early June 2018, but was likely at or near the period of peak annual flux at station C (Figure 5). The composition of the material collected in the moored sediment trap samples during June 2018 indicated the occurrence of a pelagic phytoplankton bloom at station B, reflected by the export of the exclusively pelagic centric diatoms Chaetoceros spp. and Thalassiosira spp. that usually dominate spring blooms on Arctic shelves (Degerlund and Eilertsen, 2010; Lalande et al., 2019). Diatom fluxes, composed of several pennate and centric diatom groups, were nearly three times higher at station C than at station B, reflecting a large diatom bloom.
Discussion
The overall objectives of this study were to characterize the strength and efficiency of the biological carbon pump on the Pacific Arctic shelf during a warm, low-ice year in order to shed light on potential current and future changes in carbon cycling in this region. We addressed this by considering three major aspects of relevance: primary productivity, sinking POC flux, and particle-associated microbial respiration during June of 2018.
Regional Spatial Trends
The largest distinction of regional spatial trends occurred between the two water masses present in this region (ACW and BSAW). Consistent with previous studies, the ACW was warmer and fresher with lower nutrients than the BSAW during June 2018 (Walsh et al., 1989; Springer and McRoy, 1993). Both regions were warmer than normal for this time of year and had experienced much less sea ice than normal (Danielson et al., 2020; Huntington et al., 2020).
We measured consistently lower POC flux rates in ACW than BSAW. These results support the previously untested hypothesis that POC fluxes would be higher in the BSAW compared to ACW (Grebmeier and McRoy, 1989). This distinction in primary productivity and POC flux between the ACW and BSAW could partially be attributed to differences in stratification between these regions; we found a less stratified water column in the BSAW, which could contribute to nutrient input to the surface and allow for higher primary productivity rates. Well-mixed water could also help facilitate POC mixing out of the euphotic zone, however it is more likely that this material could be brought back up to the surface through the same mechanism. The differences in primary productivity and POC flux cannot be fully explained by differences in water column stratification. The two regions were characterized by different types of sinking particles: more uniform aggregated diatoms and viable diatoms were found in the BSAW, while more processed material like fecal pellets and zooplankton were found in the ACW in addition to living diatoms. This distinction suggests more processing of POC by zooplankton or heterotrophic bacteria in the ACW. However, there was no difference in export ratio or particle-associated microbial respiration between the two water masses, indicating that POC fluxes are mostly regulated by primary production rates rather than heterotrophic processing. The spatially uniform particle associated microbial respiration rates we measured do not support the postulation that the ACW would have higher particle-associated microbial respiration rates (Andersen, 1988; Grebmeier and Barry, 1991). Nonetheless, the higher primary productivity and POC fluxes in the BSAW demonstrate a stronger biological carbon pump in the BSAW region.
PN, δ13C, and δ15N values were not significantly different between the BSAW and the ACW. Higher PN in sinking material are associated with more nutritious food for the benthos (Grebmeier et al., 1988). Less negative δ13C values tend to indicate a larger influence of ice algae or a marine signature while more negative δ13C values tend to indicate a more coastal or terrigenous signature (Wooller et al., 2007). Larger δ15N values were associated with material that is higher on the food chain (i.e., secondary and tertiary producers), while lower δ15N values are associated with material lower on the food chain (i.e., primary producers) (Post, 2002).
The ACW had lower primary productivity than the BSAW. This regional pattern has been well described previously (Walsh et al., 1989; Springer and McRoy, 1993) and is attributed to the lower nutrient concentrations in ACW compared with BSAW (Danielson et al., 2017). Primary productivity values in both water masses fell within a typical range for these regions (Lee et al., 2007; Arrigo et al., 2014; Hill et al., 2018). However, a primary productivity rate of 16 g C m–2 day–1 has been previously observed in the Pacific Arctic Shelf (Walsh et al., 1989; Springer and McRoy, 1993), much higher than what we measured and what is typically measured. If these higher production rates were associated with export ratios similar to what we observed here, then the associated fluxes would be even more remarkable than the values we observed with the DSTs and MSTs during this study.
Stations with higher rates of primary productivity tended to have higher rates of POC flux. However, there was not a perfect relationship between primary productivity and POC flux, which caused some variations in the export ratios. The stations with export ratios over 1 and the high average export ratio indicate an extremely efficient biological carbon pump or temporal or spatial decoupling between primary production and flux.
While the dominant regional patterns were associated with water masses, we also expected some patterns falling along a latitudinal gradient. It is difficult to separate the signal of water mass from latitude because most of the stations that were classified as BSAW were located south of the stations classified as ACW. We found higher daily primary productivity rates and POC fluxes at the southern stations in the BSAW than at the northern stations in the ACW. The annual POC flux was higher at station C (215 g C m–2 year–1) than at station B (204 g C m–2 year–1), indicating an increase in POC flux with latitude. However, an annual POC flux lower than these (145 g C m–2 year–1) was measured at about 200 miles north of our study area (Lalande et al., 2020). Drifting sediment trap sampling at more stations in the southern portion of the ACW and moored sediment trap sampling in the ACW are needed to better tease apart the differences associated with latitude and water mass in this region.
The annual pattern of POC flux shows some latitudinal distinction between the more northern station C and the more southern station B. The peak annual flux occurred during early June 2018 at station C, while the peak annual flux occurred a couple of weeks earlier at station B (late May 2018). The spring peak flux was higher at station C (2.3 g C m–2 day–1) compared to station B (1.5 g C m–2 day–1). Increased POC flux measurements occurred in the absence of peaks in fluorescence at both stations from November 2017 to January 2018 strongly suggesting episodic resuspension events during fall. Particulate organic carbon fluxes decreased in the presence of sea ice, reducing wind mixing and resuspension. This is particularly evident at station C under higher sea ice concentrations. It is likely that these fall high flux events do not represent increased net flux, as they are likely partly the result of material that previously fell to the seafloor being resuspended and collected in the moored sediment trap again.
Role of Heterotrophy in the Water Column
Bacterial production largely controls how much exported POC reaches the seafloor and might increase in Arctic waters under more acidic, warmer, and lower-ice conditions (Garneau et al., 2009; Vaqué et al., 2019), which could result in higher pelagic community carbon demand (Sala et al., 2010). One factor that has received a lot of thought for the Pacific Arctic shelf region is how a reduction in ice algae relative to to pelagic phytoplankton as primary producers might impact the benthic-pelagic coupling, with the prediction that smaller pelagic phytoplankton will have slower sinking rates and will therefore be more likely to be consumed by zooplankton or bacteria in the water column, resulting in less material reaching the seafloor (Carroll and Carroll, 2003; Grebmeier, 2012; Moore and Stabeno, 2015). A slower particle sinking rate will give more time for bacteria to both colonize and degrade sinking particles. In our study, we mostly collected pelagic diatoms in the drifting sediment traps rather than species associated with ice. However, our direct measurements of microbial respiration rates associated with sinking particles were mostly indistinguishable from zero. This is not unprecedented in high latitude regions (McDonnell et al., 2015).
Conducting a comparison of measured particle-associated microbial respiration rates from around the globe, we found that particle-associated microbial respiration generally decreases with increasing latitude (Figure 6). In our study, the rate of particle-associated microbial respiration was 2% day–1 on average, with a 95% confidence interval ranging from −24.2 to 34.3% day–1. Given the shallow nature of the Pacific Arctic shelf (20 m average distance from base of euphotic zone to seafloor) and rapid sinking velocity of material caught in the traps (greater than 100 m day–1), even under the fastest respiration rate (−24.2% day–1) we calculated that less than 5% of the exported organic carbon would be remineralized within the water column before being deposited on the seafloor. Considering our conservative estimates, the true consumption is likely much smaller than this value. We conclude that particle-associated microbial respiration does not play a large role in recycling POC below the euphotic zone in this region, implying that most of the material that is exported from the euphotic zone will likely reach the shallow seafloor.
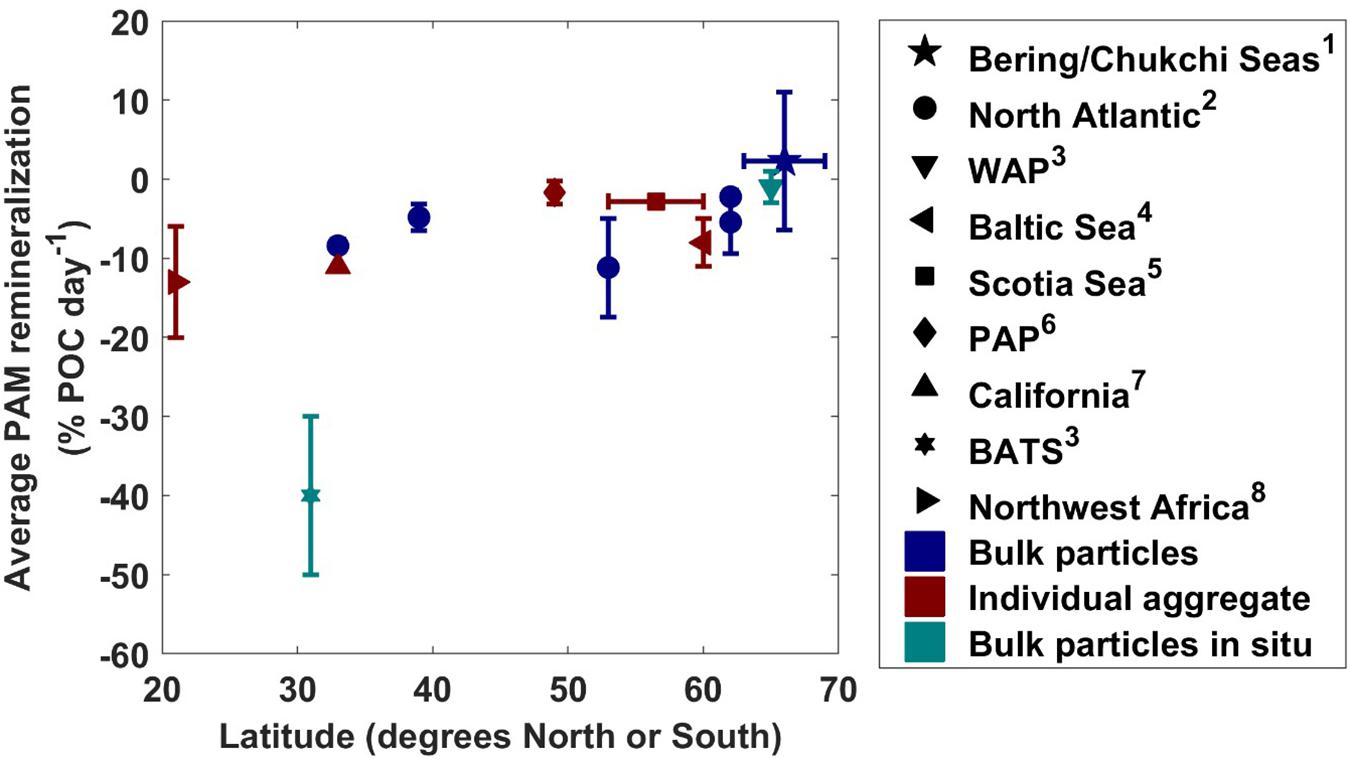
Figure 6. Average particle-associated microbial respiration rates (with one standard deviation plotted as vertical error bars) from this study along with previous measurements at other latitudes. Symbols colored with navy indicate bulk particle respiration measurements, teal indicate measurements taken with RESPIRE in situ incubator, and maroon indicate rates measured from individual aggregates. WAP, Western Antarctic Peninsula; PAP, Porcupine Abyssal Plain; BATS, Bermuda Atlantic Time Series. Measurements were taken from this study1, Collins et al. (2015)2, McDonnell et al. (2015)3, Ploug and Grossart (2000)4, Belcher et al. (2016a)5, Belcher et al. (2016b)6, Ploug and Jorgensen (1999)7, and Iversen and Ploug (2010)8.
One mitigating factor in how much organic matter is deposited on the seafloor is the role zooplankton and free-living heterotrophic microbes play in consuming organic matter in the water column. Historically, zooplankton have not consumed large proportions of organic matter in the water column (Ashjian et al., 2003; Campbell et al., 2009; Hopcroft et al., 2010; Kitamura et al., 2017; Lalande et al., 2020), but it is possible they may play a larger role in the future. One study from just north of our study area found that primary production rates were similar to free-living community microbial respiration rates during the summer, indicating a large proportion of primary production could be consumed by free-living microbes (Cota et al., 1996). High export ratios in the present study point to zooplankton and free-living heterotrophic microbes playing a small role in consuming organic matter within the euphotic zone. It is possible that zooplankton and bacteria may play a larger role in consuming POC later in the summer. We suggest measuring export ratios and particle associated microbial respiration rates in August on the Pacific Arctic shelf to answer this remaining question.
Comparison of Drifting and Moored Sediment Trap POC Fluxes
The POC flux measurements measured with the drifting and moored traps at stations B and C, while of similar magnitude, were not the same. Many factors potentially caused variations between POC flux values obtained with drifting and moored traps. One reason is the different sampling times as POC fluxes may have changed on time scales much shorter than three or six days. In addition, the moored sediment trap measured flux over eight days, while the drifting sediment traps measured flux for six and a half hours and station B and five and a half hours at station C. If there is a diurnal cycle in flux regulated by zooplankton or phytoplankton it can be captured in the drifting sediment trap sampling and masked in the moored sediment trap sampling. Our study took place on a shallow Arctic shelf over the summer solstice. It is unlikely there was a diurnal cycle of primary production due the nearly 24 h of sunlight that were present. Additionally, due to the shallowness of the shelf, zooplankton in this region are not know to exhibit diel vertical migration (Ashjian et al., 2003; Campbell et al., 2009). It is unlikely that any differences in POC flux are a result of any changes in flux as a diurnal cycle, and, if present, are likely due to changes in the rate of primary production controlled by variable cloud cover and nutrient availability. Finally, the locations of the moored sediment trap and drifting sediment trap sampling did not perfectly overlap, although the drifting sediment traps were deployed within half a mile of the moored sediment traps.
Even if the sampling of these two traps perfectly overlapped in time and space, it is unlikely that they would produce the same POC flux values. One reason is because the moored sediment traps sample with a Eulerian framework, being moored in one location sampling various water masses as they flow, while drifting sediment traps sample with a Lagrangian approach, staying with one parcel of water and sampling it continuously as it moves with the currents. Another reason is that each of these trap designs have their own individual biases. In high current environments moored sediment traps can tilt to the side, affecting the collection of sinking particles. However, no tilt occurred at stations B and C based on CTD data. In contrast, drifting sediment traps may reduce the vertical shear in high current environments by floating freely within the water column. Additionally, we minimized other hydrodynamic concerns by using a bungee to dampen surface motion, tubes with a high aspect ratio, and bottom weighted tubes to keep them upright (Butman et al., 1986; Nodder et al., 2001, Buesseler et al., 2007). However, sinking POC flux may be incorrectly measured with drifting sediment traps because the tubes are open during deployment and recovery, contrary to the moored sediment traps (Buesseler et al., 2007). This source of error is minimized by deploying the drifting sediment traps at a shallow depth (i.e., 30 m).
With these sources of error, it is helpful to have two independent measurements of POC flux using different methods. The overall range of POC flux values in June 2018 was 1.48 to 2.29 g C m–2 day–1 with the moored sediment traps and 0.17 to 2.20 g C m–2 day–1 with the drifting sediment traps. Comparable maximum flux magnitudes from these two different methods minimize the concerns of collection biases common with sediment traps and provide some supporting evidence of the validity of POC fluxes of this magnitude.
Comparing POC Flux, Primary Productivity, and Export Ratios
Primary productivity rates, sinking flux, and export ratios were compared with previous measurements from the same study area (Fukuchi et al., 1993; Moran et al., 1997; Yu et al., 2010, 2012; Lalande et al., 2020), the broader Bering and Chukchi shelf system (Moran et al., 2005; Lalande et al., 2007; Lepore et al., 2007; Baumann et al., 2013), the greater Arctic area (Supplementary Table 1), and from a global compilation (Le Moigne et al., 2013; Figure 4, and Supplementary Figure 2). The upper range of our POC flux measurements (2.2 g C m–2 day–1 from drifting sediment trap and 2.3 g C m–2 day–1 from moored sediment trap) was unprecedentedly high compared to other measurements in this region and among the highest recorded in the surrounding areas, the broader Arctic, and globally.
Five previous studies report particulate flux estimates for the Bering and Chukchi shelves (Fukuchi et al., 1993; Moran et al., 1997; Yu et al., 2010, 2012; Lalande et al., 2020), two based on sediment trap measurements. A moored sediment trap deployed (36 m water depth, 49 m bottom depth) from late June to late September 1988, about 500 miles south of Bering Strait, measured flux ranging from 253 to 654 mg C m–2 day–1 (Fukuchi et al., 1993). More recently, a moored sediment trap deployed (37 m water depth, 45 m bottom depth) from August 2015 to July 2016, about 200 miles north of our most northern stations on the Chukchi shelf, measured POC fluxes ranging from 72 to 1184 mg C m–2 day–1 (Lalande et al., 2020). An estimate of 456 mg C m–2 day–1 (36 m water depth, 49 m bottom depth) was calculated using the 234Th/238U disequilibrium method on the Chukchi Sea shelf in August 1994 (Moran et al., 1997). Yu et al. (2010) measured a POC flux value of 243.8 mg C m–2 day–1 (40 m water depth, 50 m bottom depth) using the 234Th/238U disequilibrium method sometime between July and September on the Chukchi shelf within the bounds of our study area. Finally, during a study on the Chukchi shelf from July to September, a POC flux measurement of 951.1 mg C m–2 day–1 (30 m water depth, 40 m bottom depth) was made using the 234Th/238U disequilibrium method within the bounds of and to the north of our study area (Yu et al., 2012). We selected the peak annual POC flux value from Lalande et al. (2020) and the flux measurement from Moran et al. (1997) and Yu et al. (2010, 2012) and plotted them directly on the y-axis indicating no known corresponding primary productivity value (Figure 4). The spatial extent of these studies are shown along with that of this study in Supplementary Figure 3. It should be noted that the 234Th/238U disequilibrium method for calculating sinking POC flux has its own biases, especially in areas with non-steady state flux events and advection and dispersion processes (Buesseler et al., 2007), such as on a shallow Arctic shelf. The measurements of POC flux we made in this study were the same or higher than previous measurements made in this region.
We expanded our region of comparison to include the Bering and Chukchi shelf breaks. Particulate organic carbon flux has been estimated more frequently on the Bering and Chukchi shelf breaks, with a maximum flux value at the base of the euphotic zone of 1.381 g C m–2 day–1 reported slightly south of our study area on the Bering Sea shelf break (40 m water depth, >125 m bottom depth) in July 2010 (Figure 6; Baumann et al., 2013). Additionally, our average regional flux for the BSAW, 1.59 ± 0.54 g C m–2 day–1 (mean ± 1 SD) is much higher than previous average regional flux estimates from the shelf breaks just north and south of this region, which range from 34 mg C m–2 day–1 (50 m water depth, bottom depth average 1275 m, May and June sampling period) to 376 mg C m–2 day–1 (50 m water depth, bottom depth average 838 m, May and June sampling period) (Moran et al., 2005, 2012; Lalande et al., 2007; Lepore et al., 2007; Baumann et al., 2013). Although individual measurements of export ratios approaching 1 are somewhat common (Lepore et al., 2007; Baumann et al., 2013), our average export ratio of 0.82 ± 0.32 (mean ± 1 SD) is very high. These observations illustrate the exceptional efficiency and strength of the biological carbon pump in the shallow Pacific Arctic shelf and shelf breaks.
Sinking POC flux and primary productivity values were also compared with a global review of POC flux measurements obtained using the 234Th/238U disequilibrium method (Le Moigne et al., 2013). We plotted all values with both POC flux and primary productivity rate measurements from Le Moigne et al. (2013), along with previous measurements from the broader Pacific shelf system, and our specific study area with the values we measured in this study from the drifting sediment traps and the last values of POC flux from the moored sediment traps (Figure 4). When available, sinking POC flux measurements at the base of the euphotic zone were selected, a metric shown to be comparable at sites with different bottom and euphotic zone depths (Buesseler et al., 2020). From this analysis, it is evident that the primary productivity rates from this study mostly fall within the upper range of what has been measured in this region before. Flux measurements at the BSAW stations (0.8–2.3 g C m–2 day–1) are very high compared to what has been measured previously (0–1.4 g C m–2 day–1).
In addition to the global review by Le Moigne et al. (2013), we compiled POC fluxes, primary productivity rates, and export ratios from other high latitude studies. The results of this review can be found in Supplementary Table 1. We categorized the studies by region, including the Baffin Bay, Baltic Sea, Barents Sea, Beaufort Sea, Bering Sea, Canadian Archipelago, Chukchi Sea, Fram Strait, Greenland Sea, Hudson Bay, Kara Sea, Labrador Sea, Laptev Sea, North Atlantic, North Sea, White Sea, as well as the high Arctic. We considered studies that measured sinking POC flux rates using drifting, moored, or neutrally buoyant sediment traps, marine snow catchers, or 234Th/238U disequilibrium. When possible, we selected samples from as close to the euphotic zone as possible. Primary productivity rates ranged from 0 to 2.6 g C m–2 day–1 and export ratios ranged from 0.03 to 1.67. These ranges are consistent with the primary productivity and export ratios measured in this study. Out of 79 studies, only nine measured rates of POC flux greater than 1 g C m–2 day–1 that were measured in the Baffin Bay (Michel et al., 2002), the Barents Sea (Andreassen and Wassmann, 1998; Olli et al., 2002; Lalande et al., 2008; Gustafsson et al., 2013), the Bering Sea (Baumann et al., 2013), the Beaufort Sea (Amiel and Cochran, 2008), the Chukchi Sea (Lalande et al., 2020), and the North Atlantic (Buesseler et al., 1992). The highest POC flux measurement of 2.5 g C m–2 day–1 was measured in the Beaufort Sea near the Makenzie River drainage in June at 50 m depth and 230 m water depth (Amiel and Cochran, 2008). The second highest POC flux measurement of 1.5 g C m–2 day–1 was measured in the Barents Sea in May at 30 m depth and 239 m bottom depth (Olli et al., 2002). We also selected some studies of POC flux from known high productivity and/or high flux regions from around the world (Supplementary Table 2). These POC flux values ranged from 1 to 620 mg C m–2 day–1. Two POC flux values recorded in the present study were among the highest ever recorded at the base of the euphotic zone (2.20 g C m–2 day–1 at station A with a drifting sediment trap and 2.29 g C m–2 day–1 at station C with a moored sediment trap). With individual flux values from different methods at different stations ranking among the highest ever recorded, it is clear that the Pacific Arctic shelf exported a massive amount of organic carbon out of the euphotic zone, even in an anomalously warm year with low sea ice.
Limitations and Implications
Even with strong efforts in place to study the processes on the Pacific Arctic Shelf with the ASGARD program, there is still a lack of available data. While POC flux and water column oceanographic measurements are being obtained more frequently with moored sediment traps, temporally overlapping primary productivity rate measurements are not often available, notably later in the summer or earlier in the spring, when production is highest. Previous primary productivity measurements obtained later in the summer (Springer and McRoy, 1993; Lee et al., 2007; Hill et al., 2018) may no longer be representative of current conditions. Additionally, particle-associated microbial respiration rates are likely variable throughout the spring, summer and fall and therefore cannot be extrapolated beyond spring. Therefore, there are still many unknowns regarding how the Pacific Arctic is responding and will respond to climate change. It is possible that only after many years of consistently warm and low-ice conditions changes in the strength and efficiency of the biological carbon pump on the Pacific Arctic shelf will become apparent.
It has been hypothesized that the strength of the biological carbon pump in the Arctic may weaken with climate change due to increased duration of the open-water period for primary production and enhanced nutrient limitation (Piepenburg, 2005; Wassmann and Reigstad, 2011; Grebmeier, 2012). Warmer waters have been predicted to increase metabolic rates of pelagic grazers and heterotrophic bacteria and potentially favor smaller phytoplankton and faster-growing grazers that more rapidly recycle organic matter within the water column (Wassmann and Reigstad, 2011; Neeley et al., 2018). We postulate that high nutrient concentrations, the shallow nature of the Pacific Arctic shelf, and the large-celled, fast-sinking phytoplankton that dominate pelagic productivity create conditions unique to this Arctic shelf (Springer and McRoy, 1993; Gradinger, 2009). Nutrients are unlikely to become more limited, especially in the BSAW, because of the consistent influx of the Anadyr Current, which is nutrient replete from Pacific upwelling. High nutrient concentrations favor large-cell phytoplankton (Li et al., 2009). Therefore, it is possible the Pacific Arctic shelf will not experience as dramatic of a shift from large cells to small cells with warming conditions when compared to other Arctic shelves. Finally, the Pacific Arctic shelf is shallower than most other Arctic shelves (averaging only 50 m deep). It will never take very long for sinking material leaving the euphotic zone to reach the seafloor, as it only has to sink about 20 m. Even if there is some increased heterotrophy in zooplankton or bacteria or decrease in cell size, the shallow nature of the shelf will allow for a higher proportion of organic matter to reach the seafloor than over deeper shelves, such as the Canadian Arctic Archipelago and European Arctic shelf. Increased frequency of storms are predicted with a changing Arctic (Slats et al., 2019). This could have major implications for the long-term carbon storage that historically has occurred on the Pacific Arctic shelf. Hauri et al. (2013) found that significant portions of carbon once thought to be stored in sediments on the Chukchi shelf are mixed up during fall storms. Given these features, we speculate that this system may retain strong coupling between the pelagic and benthic realms, continue to support highly productive pelagic and benthic ecosystems, and act as a strong sink for atmospheric carbon dioxide, possibly mediated by increased frequency of fall and winter storms. If these results prove to be a sustained feature of the rapidly changing Pacific Arctic, the biological carbon pump could represent an important element of resilience for regional ecosystems and biogeochemical cycles.
Conclusion
Measurements from both drifting and moored sediment traps indicate that fluxes of sinking POC on the Pacific Arctic shelf in June 2018 ranged from 0.8 to 2.3 g C m–2 day–1 in BSAW, making them amongst the highest fluxes ever documented in the global oceans. This region was also characterized by high export ratios and low rates of particle associated microbial respiration. These observations indicate that the biological carbon pump on the Pacific Arctic shelf is exceptionally strong and efficient despite a recent multi-year shift to warmer and relatively ice-free conditions (Fetterer et al., 2017; Stabeno and Bell, 2019; Danielson et al., 2020; Huntington et al., 2020). While the majority of the fluxes we observed during June 2018 were unprecedented relative to the limited number of historical flux measurements from this region, the data are still insufficient to determine whether functioning of the biological carbon pump has changed significantly relative to earlier, colder, and ice-replete years. Nonetheless, our observations do not provide supporting evidence for the common prediction that a weaker biological carbon pump and increased pelagic heterotrophy will prevail on the Pacific Arctic’s continental shelves under future change.
Data Availability Statement
The datasets generated for this study section can be found in the DataONE system (10.24431/rw1k46v).
Author Contributions
SO, SD, SH, RH, DS, and AM: conceptualization. SD, SH, RH, DS, and AM: funding acquisition and project administration. SO, RH, CL, DS, and AM: methodology. SO, SD, CL, DS, and AM: investigation and formal analysis. SD, SH, and AM: supervision. SO and RH: software. SO: data visualization, writing-original draft. SO, SD, SH, RH, CL, DS, and AM: writing-reviewing and editing.
Funding
Research funded by the NPRB (Grant A91-00a, A91-88 and A91-99a to SD, SH, RH, AM, and DS).
Conflict of Interest
The authors declare that the research was conducted in the absence of any commercial or financial relationships that could be construed as a potential conflict of interest.
Acknowledgments
We thank Captain and crew of the R/V Sikuliaq as well as all collaborators in the ASGARD project, for making this project possible. Additionally, we thank S. B. Moran for the use of the drifting sediment traps, the Alaska Stable Isotope Facility for technical support and analytical assistance (University of Alaska, Fairbanks), and the two reviewers for their constructive comments. NPRB Publication Number “ArcticIERP-40”.
Supplementary Material
The Supplementary Material for this article can be found online at: https://www.frontiersin.org/articles/10.3389/fmars.2020.548931/full#supplementary-material
Abbreviations
ACW, Alaska Coastal Waters; ASGARD, Arctic Shelf Growth Advection, Respiration and Deposition rate experiments project; BSAW, Bering Shelf/Anadyr Waters; PN, particulate nitrogen; POC, particulate organic carbon.
References
Amiel, D., and Cochran, J. K. (2008). Terrestrial and marine POC fluxes derived from 234Th distributions and δ13C measurements on the Mackenzie Shelf. J. Geophys. Res. 113:C03S06. doi: 10.1029/2007JC004260
Andersen, P. (1988). The quantitative importance of the “Microbial loop” in the marine pelagic: a case study for the North Bering/Chukchi Sea. Arch. Hydrobiol. Bieh. 31, 243–251.
Anderson, L. A., and Sarmiento, J. L. (1994). Redfield ratios of remineralization determined by nutrient data-analysis. Global Biogeochem. Cycles 8, 65–80. doi: 10.1029/93GB03318
Andreassen, I. J., and Wassmann, P. (1998). Vertical flux of phytoplankton and particulate biogenic matter in the marginal ice zone of the Barents Sea in May 1993. Mar. Ecol. Prog. Ser. 170, 1–14. doi: 10.3354/meps170001
Arrigo, K. R., Perovich, D. K., Pickart, R. S., Brown, Z. W., van Dijken, G. L., Lowry, K. E., et al. (2014). Phytoplankton blooms beneath the sea ice in the Chukchi sea. Deep Sea Res. II 105, 1–16. doi: 10.1016/j.dsr2.2014.03.018
Ashjian, C. J., Campbell, R. C., Welch, H. E., Butler, M., and Van Keuren, D. (2003). Annual cycle in abundance, distribution, and size in relation to hydrography of important copepod species in the western Arctic Ocean. Deep Sea Res. I 50, 1235–1261. doi: 10.1016/S0967-0637(03)00129-8
Bates, N. R. (2006). Air-sea CO2 fluxes and the continental shelf pump of carbon in the Chukchi Sea adjacent to the Arctic Ocean. J. Geophys. Res. Ocean 111, 1–21. doi: 10.1029/2005JC003083
Baumann, M. S., Moran, S. B., Lomas, M. W., Kelly, R. P., and Bell, D. W. (2013). Seasonal decoupling of particulate organic carbon export and net primary production in relation to sea-ice at the shelf break of the eastern Bering Sea: Implications for off-shelf carbon export. J. Geophys. Res. Ocean 118, 5504–5522. doi: 10.1002/jgrc.20366
Belcher, A., Iversen, M., Giering, S., Riou, V., Henson, S. A., Berline, L., et al. (2016a). Depth-resolved particle-associated microbial respiration in the northeast Atlantic. Biogeosciences 13, 4927–4943. doi: 10.5194/bg-13-4927-2016
Belcher, A., Iversen, M., Manno, C., Henson, S. A., Tarling, G. A., and Sanders, R. (2016b). The role of particle associated microbes in remineralization of fecal pellets in the upper mesopelagic of the Scotia Sea, Antarctica. Limnol. Oceanogr. 61, 1049–1064. doi: 10.1002/lno.10269
Bluhm, B. A., and Gradinger, R. R. (2008). Regional variability in food availability. Ecol. Appl. 18, S77–S96. doi: 10.1890/06-0562.1
Buesseler, K. O., Bacon, M. P., Livingston, H. D., and Cochrant, K. (1992). Carbon and nitrogen export during the JGOFS North Atlantic Bloom experiment estimated from 234Th: 238U disequilibria. Deep. Sea Res. 39, 1115–1137. doi: 10.1016/0198-0149(92)90060-7
Buesseler, K. O., Boyd, P. W., Black, E. E., and Siegel, D. A. (2020). Metrics that matter for assessing the ocean biological carbon pump. Proc. Natl. Acad. Sci. U.S.A. 117, 9679–9687. doi: 10.1071/pnas.1918114117
Buesseler, K. O., Chen, M., Harada, K., Gustafsson, O., Trull, T., Rutgers van der Loeff, M., et al. (2007). An assessment of the use of sediment traps for estimating upper ocean particle fluxes. J. Mar. Res. 65, 345–416. doi: 10.1357/002224007781567621
Butman, C. A., Grand, W. D., and Stolzenback, K. D. (1986). Predictions of sediment trap biases in turbulent flows, a theoretical analysis based on observations from the literature. J. Mar. Res. 44, 601–644. doi: 10.1357/002224086788403024
Campbell, R. G., Sherr, E. B., Ashjian, C. J., Plourde, S., Sherr, B. F., Hill, V., et al. (2009). Mesozooplankotn prey preference and grazing impact in the western Arctic Ocean. Deep Sea Res. II 56, 1274–1289. doi: 10.1016/j.dsr2.2008.10.027
Carroll, M. L., and Carroll, J. (2003). “The arctic seas,” in Biogeochemistry of Marine Systems, eds K. D. Black and G. B. Shimmield (Boca Raton, FL: CRC Press), 127–156.
Chen, C. A., and Borges, A. V. (2009). Reconciling opposing views on carbon cycling in the coastal ocean: continental shelves as sinks and near-shore ecosystems as sources of atmospheric CO2. Deep Sea Res. II 56, 578–590. doi: 10.1016/j.dsr2.2008.12.009
Collins, J. R., Edwards, B. R., Thamatrakoln, K., Ossolinski, J. E., Ditullio, G. R., Bidle, K. D., et al. (2015). The multiple fates of sinking particles in the North Atlantic Ocean. Glob. Biogeochem. Cycles 29, 1471–1494. doi: 10.1002/2014GB005037
Cota, G. F., Pomeroy, L. R., Harrison, W. G., Jones, E. P., Peters, F., Sheldon, W. M., et al. (1996). Nutrients, primary production and microbial heterotrophy in the southeastern Chukchi Sea: arctic summer nutrient depletion and heterotrophy. Mar. Ecol. Prog. Ser. 135, 247–258. doi: 10.3354/meps135247
Danielson, S. L., Ahkinga, O., Ashjian, C., Basyuk, E., Cooper, L. W., Eisner, L., et al. (2020). Manifestation and consequences of warming and latered heat fluxes over the Bering and Chukchi Sea continental shelves. Deep Sea Res. II 177:104781. doi: 10.1016/j.dsr2.2020/104781
Danielson, S. L., Eisner, L., Ladd, C., Mordy, C., Sousa, L., and Weingartner, T. J. (2017). A comparison between late summer 2012 and 2013 water masses, macronutrients, and phytoplankton standing crops in the northern Bering and Chukchi Seas. Deep Sea Res. II 135, 7–26. doi: 10.1016/j.dsr2.2016.05.024
Degerlund, M., and Eilertsen, H. C. (2010). Main species characteristics of phytoplankton spring blooms in NE Atlantic and Arctic waters (68-80° N). Estuar. Coasts 33, 242–269. doi: 10.1007/s12237-009-9167-7
Dugdale, R. C., and Goering, J. J. (1967). Uptake of new and regenerated forms of nitrogen in primary productivity. Limnol. Oceanogr. 12, 196–206. doi: 10.4319/lo.1967.12.2.0196
Durkin, C. A., Estapa, M. L., and Buesseler, K. O. (2015). Observations of carbon export by small sinking particles in the upper mesopelagic. Mar. Chem. 175, 72–81. doi: 10.1016/j.marchem.2015.02.011
Ebersbach, F., and Trull, T. W. (2008). Sinking particle properties from polyacrylamide gels during the KErguelen Ocean and Plateau compared Study (KEOPS): zooplankton control of carbon export in an area of persistent natural iron inputs in the Southern Ocean. Limnol. Oceanogr. 53, 212–224. doi: 10.4319/lo.2008.53.1.0212
European Centre for Medium-Range Weather Forecasts (2019). Updated Monthly. ERA5 Reanalysis (0.25 Degree Latitude-Longitude Grid). Research Data Archive at the National Center for Atmospheric Research, Computational and Information Systems Laboratory. Reading: European Centre for Medium-Range Weather Forecasts.
Fetterer, F., Knowles, K., Meier, W. N., Savoie, M., and Windnagel, A. K. (2017). Updated Daily. Sea Ice Index, Version 3. Boulder, CO: National Snow and Ice Data Center.
Fukuchi, M., Sasaki, H., Hattori, H., Matsuda, O., Tanimura, A., Handa, N., et al. (1993). Temporal variability of particulate flux in the northern Bering Sea. Cont. Shelf Res. 13, 693–704. doi: 10.1016/0278-4343(93)90100-C
Garneau, M. È, Vincent, W. F., Terrado, R., and Lovejoy, C. (2009). Importance of particle-associated bacterial heterotrophy in a coastal Arctic ecosystem. J. Mar. Syst. 75, 185–197. doi: 10.1016/j.jmarsys.2008.09.002
Gradinger, R. (1999). Vertical fine structure of the biomass and composition of algal communities in Arctic pack ice. Mar. Biol. 133, 745–754. doi: 10.1007/s002270050516
Gradinger, R. (2009). Sea-ice algae: major contributors to primary production and algal biomass in the Chukchi and Beaufort Seas during May/June 2002. Deep Sea Res. II 56, 1201–1212. doi: 10.1016/j.dsr2.2008.10.016
Grebmeier, J. M. (2012). Shifting patterns of life in the Pacific Arctic and Sub-Arctic seas. Ann. Rev. Mar. Sci. 4, 63–78. doi: 10.1146/annurev-marine-120710-100926
Grebmeier, J. M., and Barry, J. P. (1991). The influence of oceanographic processes on pelagic-benthic coupling in polar regions?: a benthic perspective. J. Mar. Syst. 2, 495–518. doi: 10.1016/0924-7963(91)90049-z
Grebmeier, J. M., and McRoy, C. P. (1988). Pelagic-benthic coupling on the shelf of the northern Bering and Chukchi Seas. I. Food supply and source and benthic biomass. Mar. Ecol. Prog. Ser. 48, 57–67. doi: 10.3354/meps053079
Grebmeier, J. M., and McRoy, C. P. (1989). Pelagic-benthic coupling on the shelf of the northern Bering and Chukchi Seas. III. Benthic food supply and carbon cycling. Mar. Ecol. Prog. Ser. 53, 93–100.
Grebmeier, J. M., McRoy, C. P., and Feder, H. M. (1988). Pelagic-benthic coupling on the shelf of the northern Bering and Chukchi Seas. I. Food supply and source and benthic biomass. Mar. Ecol. Prog. Ser. 48, 57–67. doi: 10.3354/meps053079
Gustafsson, Ö, Larsson, U., Andersson, P., Gelting, J., and Roos, P. (2013). An assessment of upper ocean carbon and nitrogen export fluxes on the boreal continental shelf: a 3-year study in the open Baltic Sea comparing sediment traps, 234Th proxy, nutrient, and oxygen budgets. Limnol. Oceanogr. Methods 11, 495–510. doi: 10.4319/lom.2013.11.495
Hama, T., Miyazaki, T., Ogawa, Y., Iwakuma, T., Takahashi, M., Otsuki, A., et al. (1983). Measurement of photosynthetic production of a marine phytoplankton population using a stable 13C isotope. Mar. Biol. 73, 31–36. doi: 10.1007/BF00396282
Hauri, C., Winsor, P., Juranek, L. W., McDonnell, A. M. P., Takahashi, T., and Mathis, J. T. (2013). Wind-driven mixing causes a reduction in the strength of the continental shelf carbon pump in the Chukchi Sea. Geophys. Res. Lett. 40, 5932–5936. doi: 10.1002/2013GL058267
Hill, V., Ardyna, M., Lee, S. H., and Varela, D. E. (2018). Decadal trends in phytoplankton production in the Pacific Arctic region from 1950 to 2012. Deep Sea Res. II 152, 82–94. doi: 10.1016/j.dsr2.2016.12.015
Hopcroft, R. R., Kosobokova, K. N., and Pinchuk, A. I. (2010). Zooplankton community patterns in the Chukchi Sea during summer 2004. Deep Sea Res. II 57, 27–39. doi: 10.1016/j.dsri.2009.08.003
Hovelsrud, G. K., Mckenna, M., and Huntington, H. P. (2008). Marine mammal harvests and other interactions with humans. Ecol. Appl. 18, 135–147. doi: 10.1890/06-0843.1
Huntington, H. P., Danielson, S. L., Wiese, F. K., Baker, M., Boveng, P., Citta, J. J., et al. (2020). Evidence suggests potential transformation of the Pacific Arctic ecosystem is underway. Nat. Clim. Chang. 10, 342–348. doi: 10.1038/s41558-020-0695-2
Iversen, M. H., and Ploug, H. (2010). Ballast minerals and the sinking carbon flux in the ocean: carbon-specific respiration rates and sinking velocity of marine snow aggregates. Biogeosciences 7, 2613–2624. doi: 10.5194/bg-7-2613-2010
Kitamura, M., Amakasu, K., Kikuchi, T., and Nishino, S. (2017). Seasonal dynamics of zooplankton in the southern Chukchi Sea revealed from acoustic backscattering strength. Cont. Shelf Res. 133, 47–58. doi: 10.1016/j.csr.2016.12.009
Lalande, C., Grebmeier, J. M., Hopcroft, R. R., and Danielson, S. L. (2020). Annual cycle of export fluxes of biogenic matter near Hanna Shoal in the northeast Chukchi Sea. Deep Sea Res. II 177:104730. doi: 10.1016/j.dsr2.2020.104730
Lalande, C., Lepore, K., Cooper, L. W., Grebmeier, J. M., and Moran, S. B. (2007). Export fluxes of particulate organic carbon in the Chukchi Sea: a comparative study using 234Th/238U disequilibria and drifting sediment traps. Mar. Chem. 103, 185–196. doi: 10.1016/j.marchem.2006.07.004
Lalande, C., Moran, S. B., Wassmann, P., Grebmeier, J. M., and Cooper, L. W. (2008). 234Th-derived particulate organic carbon fluxes in the northern Barents Sea with comparison to drifting sediment trap fluxes. J. Mar. Syst. 73, 103–113. doi: 10.1016/j.marsys.2007.09.004
Lalande, C., Nöthig, E. M., and Fortier, L. (2019). Algal export in the arctic ocean in times of global warming. Geophys. Res. Lett. 46, 5959–5967. doi: 10.1029/2019GL083167
Le Moigne, F. A. C., Henson, S. A., Sanders, R. J., and Madsen, E. (2013). Global database of surface ocean particulate organic carbon export fluxes diagnosed from the 234Th technique. Earth Syst. Sci. Data 5, 295–304. doi: 10.5194/essd-5-295-2013
Lee, S. H., Joo, H. M., Liu, Z. L., Chen, J. F., and He, J. F. (2012). Phytoplankton productivity in the newly opened waters of the Western Arctic Ocean. Deep Sea Res II 81-84, 18–27. doi: 10.1016/j.dsr2.2011.06.005
Lee, S. H., Whitledge, T. E., and Kang, S. H. (2007). Recent carbon and nitrogen uptake rates of phytoplankton in Bering Strait and the Chukchi Sea. Cont. Shelf Res. 27, 2231–2249. doi: 10.1016/j.csr.2007.05.009
Lepore, K., Moran, S. B., Grebmeier, J. M., Cooper, L. W., Lalande, C., Maslowski, W., et al. (2007). Seasonal and interannual changes in particulate organic carbon export and deposition in the Chukchi Sea. J. Geophys. Res. Ocean 112, 1–14. doi: 10.1029/2006JC003555
Li, W. K., McLaughlin, F. A., Lovejoy, C., and Carmack, E. C. (2009). Smallest algae thrive as the arctic ocean freshens. Science 326:539. doi: 10.1126/science.1179798
McDonnell, A. M. P., and Buesseler, K. O. (2010). Variability in the average sinking velocity of marine particles. Limnol. Oceanogr. 55, 2085–2096. doi: 10.4319/lo.2010.55.5.2085
McDonnell, A. M. P., Boyd, P. W., and Buesseler, K. O. (2015). Effects of sinking velocities and microbial respiration rates on the attenuation of particulate carbon fluxes through the mesopelagic zone. Glob. Biogeochem. Cycles 29, 175–193. doi: 10.1002/2014GB004935
Michel, C., Nielsen, T. G., Nozais, C., and Gosselin, M. (2002). Significance of sedimentation and grazing by ice micro- and meiofauna for carbon cycling in annual sea ice (northern Baffin Bay). Aquat. Microb. Ecol. 30, 56–68. doi: 10.3354/ame030057
Moore, S. E., and Kuletz, K. J. (2019). Marine birds and mammals as ecosystem sentinels in and near distributed biological observatory regions: an abbreviated review of published accounts and recommendations for integration to ocean observatories. Deep Sea Res. II 162, 211–217. doi: 10.1016/j.dsr2.2018.09.004
Moore, S. E., and Stabeno, P. J. (2015). Synthesis of arctic research (SOAR) in marine ecosystems of the Pacific Arctic. Prog. Oceanogr. 136, 1–11. doi: 10.1016/j.pocean.2015.05.017
Moran, S. B., Ellis, K. M., and Smith, J. N. (1997). 234Th/238U disequilibrium in the central Arctic ocean: implications for particulate organic carbon export. Deep Sea Res. II 44, 1593–1606. doi: 10.1016/S0967-0645(97)00049-0
Moran, S. B., Kelly, R. P., Hagstrom, K., Smith, J. N., Grebmeier, J. M., Cooper, L. W., et al. (2005). Seasonal changes in POC export flux in the Chukchi Sea and implications for water column-benthic coupling in Arctic shelves. Deep Sea Res. II 52, 3427–3451. doi: 10.1016/j.dsr2.2005.09.011
Moran, S. B., Kelly, R. P., Iken, K., Mathis, J. T., Lomas, M. W., and Gradinger, R. (2012). Seasonal succession of net primary productivity, particulate organic carbon export, and autotrophic community composition in the eastern Bering Sea. Deep Sea Res. II 65-70, 84–97. doi: 10.1016/j.dsr2.2012.02.011
Naidu, A. S., Cooper, L. W., Grebmeier, J. M., Whitledge, T. E., and Hameedi, M. J. (2004). “The continental margin of the north Bering-Chukchi Sea: concentrations, sources, fluxes, accumulation and burial rates of organic carbon,” in The Organic Carbon Cycle in the Arctic Ocean, eds R. Stein and R. W. Macdonald (Heidelberg: Springer-Verlag), 193–203. doi: 10.1007/978-3-642-18912-8
Neeley, A. R., Harris, L. A., and Frey, K. E. (2018). Unraveling phytoplankton community dynamics in the Northern Chukchi Sea under sea-ice-covered and sea-ice-free conditions. Geophys. Res. Lett. 45, 7663–7671. doi: 10.1029/2018GL077684
Nodder, S. D., Charette, M. A., Waite, A. M., Trull, T. W., Boyd, P. W., Zeldis, J., et al. (2001). Particulate transformations and export flux during an in situ iron-stimulated bloom in the Southern Ocean. Geophys. Res. Lett. 28, 2409–2412. doi: 10.1029/2001GL013008
Olli, K., Riser, C. W., Wassmann, P., Ratkova, T., Arashkevich, E., and Pasternak, A. (2002). Seasonal variation in vertical flux of biogenic matter in the marginal ice zone and the central Barents Sea. J. Mar. Syst. 38, 189–204. doi: 10.1016/S0924-7963(02)00177-X
Pickart, R. S., Moore, G. W. K., Chongyuan, M., Bahr, F., Nobre, C., and Weingartner, T. J. (2016). Circulation of winter water on the Chukchi shelf in early summer. Deep Sea Res. II 130, 56–75. doi: 10.1016/j.dsr2.2016.05.001
Piepenburg, D. (2005). Recent research on Arctic benthos: common notions need to be revised. Polar Biol. 28, 733–755. doi: 10.1007/s00300-005-0013-5
Ploug, H., and Grossart, H. P. (2000). Bacterial growth and grazing on diatom aggregates: respiratory carbon turnover as a function of aggregate size and sinking velocity. Limnol. Oceanogr. 45, 1467–1475. doi: 10.4319/lo.2000.45.7.1467
Ploug, H., and Jorgensen, B. (1999). A net-jet flow system for mass transfer and microsensor studies of sinking aggregates. Mar. Ecol. Prog. Ser. 176, 279–290. doi: 10.3354/meps176279
Post, D. M. (2002). Using stable isotopes to estimate trophic position: models, methods and assumptions. Ecology 83, 703–718. doi: 10.1890/0012-9658(2002)083[0703:usitet]2.0.co;2
Richter-Menge, J., Druckenmiller, M. L., and Jeffries, M. (eds). (2019). Arctic Report Card 2019. https://www.arctic.noaa.gov/Report-Card
Sala, M. M., Arrieta, J. M., Boras, J. A., Duarte, C. M., and Vaqué, D. (2010). The impact of ice melting on bacterioplankton in the Arctic Ocean. Polar Biol. 33, 1683–1694. doi: 10.1007/s00300-010-0808-x
Slats, R., Oliver, C., Bahnke, R., Bell, H., Miller, A., Pungowiyi, D., et al. (2019). Voices from the Front Lines of a Changing Bering Sea. Arctic Report Card 2019. Available online at: http://www.arctic.noaa.gov/Report-Card (accessed January 2, 2020).
Springer, A. M., and McRoy, C. P. (1993). The paradox of pelagic food webs in the northern Bering Sea-III. Patterns of primary production. Cont. Shelf Res. 13, 575–599. doi: 10.1016/0278-4343(93)90095-F
Stabeno, P. J., and Bell, S. W. (2019). Extreme conditions in the bering Sea (2017-2018): record-breaking low sea-ice extent. Geophys. Res. Lett. 46, 8952–8959. doi: 10.1029/2019gl083816
Thoman, R. L., Bhatt, U. S., Bieniek, P. A., Brettschneider, B. R., Brubaker, M., Danielson, S. L., et al. (2020). The record low Bering Sea ice extent in 2018: context, impacts, and an assessment of the role of anthropogenic climate change. Bull. Am. Meteorol. Soc. 101, S53–S58. doi: 10.1175/BAMS-D-19-0175.1
Vaqué, D., Lara, E., Arrieta, J. M., Holding, J., Sà, E. L., Hendriks, I. E., et al. (2019). Warming and CO2 enhance arctic heterotrophic microbial activity. Front. Microbiol. 10:494. doi: 10.3389/fmicb.2019.00494
Vaughan, D. G., Comiso, J. C., Allison, I., Carrasco, J., Kaser, G., Kwok, R., et al. (2013). “Observations: Cryosphere,” in Climate Change 2013: The Physical Science Basis. Contribution of Working Group I to the Fifth Assessment of the Intergovernmental Panel on Climate Change, eds T. F. Stocker, D. Qin, G.-K. Plattner, M. Tignor, S. K. Allen, J. Boschung, et al. (Cambridge: Cambridge University Press), 317–382. doi: 10.1017/CBO9781107415324.012
Walsh, J. J., McRoy, C. P., Coachman, L. K., Goering, J. J., Nihoul, J. J., Whitledge, T. E., et al. (1989). Carbon and nitrogen cycling within the Bering/Chukchi Seas: source regions for organic matter effecting AOU demands of the Arctic Ocean. Prog. Oceanogr. 22, 277–359. doi: 10.1016/0079-6611(89)90006-2
Wassmann, P., and Reigstad, M. (2011). Future Arctic Ocean seasonal ice zones and implications for pelagic-benthic coupling. Oceanography 24, 220–231. doi: 10.5670/oceanog.2011.74
Woodgate, R. A., Stafford, K. M., and Prahl, F. G. (2015). A synthesis of year-round interdisciplinary mooring measurements in the Bering Strait (1990-2014) and the RUSALCA years (2004-2011). Oceanography 28, 46–67. doi: 10.5670/oceanog.2015.57
Wooller, M. J., Zazula, G. D., Edwards, M., Froese, D. G., Boone, R. D., Parker, C., et al. (2007). Stable carbon isotope compositions of eastern beringian grasses and sedges: investigating their potential as paleoenvironmental indicators. Arctic Antarct. Alpine Res. 39, 318–331. doi: 10.1657/1523-0430(2007)39[318:scicoe]2.0.co;2
Yu, W., Chen, L., Cheng, J., He, J., Yin, M., and Zeng, Z. (2010). 234Th-derived particulate organic carbon export flux in the western Arctic Ocean. Chin J. Oceanog. Limnol. 28, 1146–1151. doi: 10.1007/s00343-010-9933-1
Keywords: carbon cycling, particulate organic carbon, Bering and Chukchi Sea Shelves, marine particles, marine snow, Arctic, climate change, biological carbon pump
Citation: O’Daly SH, Danielson SL, Hardy SM, Hopcroft RR, Lalande C, Stockwell DA and McDonnell AMP (2020) Extraordinary Carbon Fluxes on the Shallow Pacific Arctic Shelf During a Remarkably Warm and Low Sea Ice Period. Front. Mar. Sci. 7:548931. doi: 10.3389/fmars.2020.548931
Received: 04 April 2020; Accepted: 27 October 2020;
Published: 19 November 2020.
Edited by:
Robyn E. Tuerena, Scottish Association For Marine Science, United KingdomReviewed by:
Henry Ruhl, Monterey Bay Aquarium Research Institute (MBARI), United StatesMark Andrew Stevenson, Newcastle University, United Kingdom
Copyright © 2020 O’Daly, Danielson, Hardy, Hopcroft, Lalande, Stockwell and McDonnell. This is an open-access article distributed under the terms of the Creative Commons Attribution License (CC BY). The use, distribution or reproduction in other forums is permitted, provided the original author(s) and the copyright owner(s) are credited and that the original publication in this journal is cited, in accordance with accepted academic practice. No use, distribution or reproduction is permitted which does not comply with these terms.
*Correspondence: Stephanie H. O’Daly, c2hvZGFseTJAYWxhc2thLmVkdQ==; c3RlcGhhbmllLm9kYWx5QG91dGxvb2suY29t