 Namrata Kaile1
 Mathilde Lindivat2
 Javier Elio2,3
 Gunnar Thuestad2
 Quentin G. Crowley1
 Ingunn Alne Hoell2*
- 1Centre for the Environment, Trinity College, Dublin, Ireland
- 2Applied Marine Microbiology Research Group, Western Norway University of Applied Sciences, Haugesund, Norway
- 3Department of Planning, Aalborg University Copenhagen, Copenhagen, Denmark
Microplastics are globally recognized as contaminants in freshwater and marine aquatic systems. To date there is no universally accepted protocol for isolation and quantification of microplastics from aqueous media. Various methodologies exist, many of which are time consuming and have the potential to introduce contaminants into samples, thereby obscuring characterization of the environmental microplastic load. Here, we present first steps in the detection of microplastics in liquid samples, based on their fluorescent staining followed by high throughput analysis and quantification using Flow Cytometry. Using controlled laboratory settings nine polymer types [polystyrene (PS); polyethylene (PE); polyethylene terephthalate (PET/PETE); high density polyethylene (HDPE); low density polyethylene (LDPE); polyvinyl chloride (PVC); polypropylene (PP); nylon (PA); polycarbonate (PC)] were tested for identification and quantification in freshwater. All nine plastic types were stained with 10 μg/mL Nile Red in 10% dimethyl sulfoxide with a 10 min incubation time. The lowest spatial detectable limit for plastic particles was 200 nm. Out of the nine polymer types chosen for the study PS, PE, PET, and PC were well-identified; however, results for other plastic types (PVC, PP, PA, LDPE, and HDPE) were masked to certain extent by Nile Red aggregation and precipitation. The methodology presented here permits identification of a range of particle sizes and types. It represents a significant step in the quantification of microplastics by replacing visual data interpretation with a sensitive and automated method.
Introduction
Plastics are extensively used in a wide range of industrial sectors due to their versatile, durable, and lightweight nature. However, plastic debris has escalated global environmental concerns (Li et al., 2018). More than 150 million tons of plastic has accumulated in the world’s oceans, and about 4.6–12.7 million metric tons of plastics are added every year (Jambeck et al., 2015). Their presence ranges from soil, air, oceans, estuaries, freshwater (Andrady, 2017) to the remote arctic ice (Lusher et al., 2015) and also the Antarctic waters (Li et al., 2018). Microplastics are generally defined as plastic particles having a size ranging between 1 μm to 5 mm (Frias and Nash, 2019).
Microplastics can be divided into primary and secondary types. Primary microplastics are those released directly into the environment in micrometer dimensions. They are used commonly as abrasives in industries for sandblasting, polyester beads, domestic products, in personal care products as exfoliating agents, and even in 3D printing (Horton et al., 2017). Secondary microplastics are formed as a result of meso- and macro-plastic litter fragmentation by photo-oxidation, physical, chemical, or biological interactions which increases the surface area of these particles making them further susceptible for degradation (Ivar do Sul and Costa, 2014). Secondary microplastic particles may be produced from a variety of sources, including synthetic fibers, car tire wear-off, fishing nets, road paints, airborne fibers or fragments and disintegration of polyethylene applied for mulching activity in agriculture (Lusher et al., 2017).
Ingestion of microplastics may affect species at various organizational levels including detritivores, filter feeders and predators and the trophic transfer to various marine species especially bivalves and crustaceans (Watts et al., 2014). Ingestion of microplastic particles by invertebrates results in various sub-lethal effects of reduced reproduction and growth, internal damage such as lacerations and inflammatory responses (Horton et al., 2017) and can also compromise their ability to capture and digest food, predation, impairment of locomotion and migration (Avio et al., 2017). The plastic size, shape, density, chemical composition and abundance greatly affects bioavailability in the environment and together contributes to their environmental impacts (Rocha-Santos and Duartea, 2015).
At present, there is a limitation in the determination of plastic concentration and particle size. The wide range of analytical methodologies adopted may compromise data quality and hamper comparison of results from different studies (Löder and Gerdts, 2015; Rios Mendoza et al., 2018). Furthermore, the most processes used so far for microplastic analysis are time-consuming, laborious and can lead to inadvertent contamination of samples (Lusher et al., 2017). Analysis and identification of qualitative and quantitative properties of microplastics have been determined using a range of methodologies, including pyrolysis gas chromatography coupled to mass spectrometry, liquid chromatography, stereomicroscopy, scanning electron microscopy (SEM), scanning electron microscopy-energy dispersive X-ray spectroscopy (SEM-EDS), and environmental scanning microscopy-energy dispersive X-ray spectroscopy (ESEM-EDS) (Silva et al., 2018). Analysis of polymeric composition of microplastics is widely accomplished by Fourier transform infrared (FT-IR) Spectroscopy, or by Raman Spectroscopy (Van Cauwenberghe et al., 2015). It is difficult to quantify and qualify microplastics by a single analytical method, and in many cases both microscopic and spectroscopic analysis are carried out together (Li et al., 2018). Moreover, the visual interpretation of the data in the above-mentioned techniques is another major factor contributing to the inaccuracy in results.
Given the urgent need to evaluate environmental plastic pollution, here we present preliminary results from detection of microplastic particles in liquid samples using flow cytometry. We have developed a two-stages protocol using staining of microplastics by Nile Red, followed by rapid identification and quantification of microplastic particles in freshwater using flow cytometry (FC). Using laboratory prepared samples, we have tested the technique in nine polymer types [polystyrene (PS); polyethylene (PE); polyethylene terephthalate (PET/PETE); polycarbonate (PC); polyvinyl chloride (PVC); polypropylene (PP); nylon (= polyamide) (PA); low and high-density polyethylene (LDPE and HDPE)]. Here we evaluate the advantages and limitations of our protocol in comparison to other techniques, and discuss its possible future development for application to environmental samples.
Flow cytometry enables high precision particle detection by light scattering and/or fluorescence. It is applied to liquid samples for detection and analyses of particles hydrodynamically or acoustically, focused in a stream so that they, one by one, pass light beams from one or more lasers. The scatter and fluorescence intensity of particles is measured by sensitive photomultiplier tubes. This allows individual measurements according to size (forward scatter), surface/granularity/complexity (side scatter), and fluorescence either caused by concomitant pigments or by added fluorescent dye markers. A major advantage of FC is that it does not require visual interpretation of particles, thereby increasing the accuracy and standardization of results. FC can also enumerate and measure the size of particles, and some instruments can sort particles. FC can also analyze large volumes (from 25 μL/min to 1 mL/min), and can be combined with staining techniques to separate abiotic and biotic particles. Finally, digital photography of particles (such as FlowCam, CytoSense, and ImageStream flow cytometers) may be adapted. The main precaution using FC is that large particles do not clog the instrument; so the flow tip of the instrument must be larger than the diameter of the particles analyzed. In this regard, commercial instruments generally admit particles sizes of up to 800–1000 μm depending on the FC configuration. The minimum particle size FC is able to measure is in the order of 50 nm (Steen, 2004) which imply that small microplastics (1–100 μm) can be measured. FC has been widely applied to liquid cell samples for various analyses of diseases, cell cycles, analysis of microbial community, microbial monitoring in water, in cancer research (Hoell et al., 2017) and to study cellular components like DNA, RNA, chromosomes, various hormones and proteins (Adan et al., 2016). FC coupled to viSNE has been used for detection of microplastic contamination during analysis of microbial biofilms (Sgier et al., 2016). Recently, microplastics in solution have been quantified using FC (Bringer et al., 2020; Le Bihanic et al., 2020).
As far as we are aware, our study is the first to systematically analyze the application of FC for the specific purpose of monitoring microplastics in aqueous media.
Fluorescent staining may be used to enhance optical contrast in samples at microscopic levels and to provide a sensitive and simple method to detecting plastic polymers in a mixed marine sample type (Maes et al., 2017). Various dyes such as oil red EGN, Eosin B, Rose Bengal, Hostasol Yellow 3G, Nile Red (Maes et al., 2017), Acridine Orange, Basic Blue 24, Crystal Violet, Lactophenol Blue, Neutral Red, Safranin-T, and Tryphan Blue (Prata et al., 2019b) have been used to stain microplastics for analysis by fluorescence microscopy or FT-IR. A number of stains are available, but the problem arises with the affinity of dye for the plastics. Currently, Nile Red (NR) (9-diethylamino-5H-henzo[alpha]phenoxazine-5-one) seems to be the most promising stain due to high adsorption and fluorescence intensity, shorter incubation time and a good affinity for a range of polymers (Maes et al., 2017; Prata et al., 2019a,b). NR is a hydrophobic fluorophore and fluorescent dye is used commonly to stain neutral lipids in biological samples and synthetic polymers (Shim et al., 2016). NR is especially interesting for plastics because they are constituted of hydrocarbons derived from petroleum, natural gas or biomass and therefore have a hydrophobic nature (Andrady, 2011). NR has been suggested for fluorescently staining microplastics (Cole, 2016; Shim et al., 2016; Wiggin and Holland, 2019). The use of NR has also been demonstrated in conjunction with FC, wherein microalgae samples were stained by NR in acetone at a concentration of 3 μM and analyzed using flow cytometric cell sorting (Katayama et al., 2019).
Materials and Methods
Laboratory Preparation of Microplastic Particles
Nine different plastic types were chosen for the study, including PS, PE, PET/PETE, HDPE, LDPE, PVC, PP, PA, and PC. For microplastic preparation, the surface of each plastic type was scraped off using a clean sterilized surgical steel scalpel onto a thick aluminum foil paper which was then transferred to a glass bottle. 40 mL 75% ethanol was added, followed by homogenization using an Ultra Turrax T25 Electric Homogenizer (IKA Labortechnik, China). The samples were cooled during the process by placing them in a plastic beaker containing 100 ml of ethanol (75%) freezed at −80°C, placed in an insulated box. This was done to avoid over-heating. Each sample was homogenized for 4 × 5 min, with 1 minute cooling in between. When changing plastic type, the homogenizer was washed once with ethanol and three times with distilled water. This washing process was repeated twice (in total three times), to reduce the chances of contamination.
The glass bottles containing plastic particles in ethanol were covered with a 100 μm filter paper (Schleicher & Schuell, Germany) and incubated at 60°C for around 48 h. Once the plastic particles were completely dried, 4 mL of milli-Q water was added, followed by sonication using a Sonorex Super RK 514, D-12207 Sonicator (Bandelin, Berlin) for 2 min. 3 mL solution was then filtered through a 100 μm filter (BD Falcon REF- 352360, United States, made out of a strong nylon mesh), and transferred into a small glass vial with lid. The microplastic samples, now containing only particles below 100 μm, were stored at room temperature.
Despite these stringent washing steps in between each polymer type, some cross contamination was observed due to the plastic particles being stuck in the machinery of the homogenizer.
Developing a Staining Protocol for Microplastics Using Nile Red
In order to find a favorable solvent to prevent precipitation and aggregation, a concentration of 10 μg/mL NR (Invitrogen, by Thermo Fisher, United States) was dissolved in three different solvents; DMSO, ethanol, and methanol. To identify the optimal concentration of each solvent, the absorbance at 549 nm (A549) was measured using a UV-1201, UV-VIS Spectrophotometer (Shimadzu, Japan). Solvent concentrations of 10, 25, 50, and 75% were first analyzed for a rough grouping, followed by analysis of intermediate concentrations. Milli-Q water was used as reference blank, and control samples of DMSO, ethanol, and methanol without NR added were also analyzed. The quartz cuvette (45 mm × 12.5 mm × 12.5 mm) was rinsed once with ethanol and three times with milli-Q water in between samples. Three replicate samples were analyzed for each solvent concentration for statistical purposes. The precipitation of NR was observed by the changes in absorbance at 0 and 10 min incubation time.
The optimum concentration of NR, which provided a good balance between effective plastic particle staining, speed, less background signal and minimal dye precipitation was determined by comparing 1000, 100, 10, and 1 μg/mL of NR in 10% DMSO. NR solutions were analyzed by spectrophotometer before and after 10 min incubation at 22°C and 300 rpm using a thermomixer comfort incubator (Eppendorf, Germany).
The effect of pH on the solubility of NR was tested. The pH of solutions containing 10 μg/mL NR in 10% DMSO was adjusted using either hydrochloric acid (0.1M) or sodium hydroxide (0.1M). NR solutions with a pH range between 3 and 10 were analyzed in triplets on a spectrophotometer at 549 nm. In between each solution the glass cuvette was washed once with ethanol and thrice with milli-Q water.
Analysis of Microplastics by Microscopy
1 mg/mL stock solutions of NR in DMSO (99.9%) or alternatively ethanol (95%) were sonicated for 2 min each. The vials were stored at room temperature in the dark. The filtered plastic samples were added to NR (concentration of NR: 10 μg/mL) and incubated on thermomixer comfort incubator (Eppendorf, Germany) at 22°C and 300 rpm for 10, 30, and 60 min. Next, 10 μL of each stained plastic sample was analyzed under an epifluorescence microscope (Optiphot-2, Nikon, Japan) with a mercury lamp, to test the optimum staining time for each sample type. The samples were analyzed using G2A filter (Chroma Technology, Corp., United States), i.e., at an excitation range of 510–560 nm (excitation/emission maxima for NR is ∼552/636 nm) at an exposure time of 1, 1/2, and 1/10 s. The microscopy results were documented using a DS-Fi1, Nikon, Japan camera. Unstained plastic particles were also observed under a light microscope for size and shape of the various particles For PE, PC and PETE, the concentration of microplastic was estimated in a Bürker counting chamber, containing nine A-squares with a volume of 1/10 mm3 each. 10 μl of unstained microplastic solution was transferred to the counting chamber, and the number of microplastic particles were detected by eye at 100 x magnification. This was repeated in total three times for each plastic type.
Higher DMSO concentration tends to dissolve NR efficiently, however, it is not advisable to have very high concentrations of solvents to be analyzed by the FC. Feasibility of a stain washing step was evaluated. Microplastic sample was prepared in 55% DMSO and 10 μg/mL NR. A 0.2 μm Whatman filter (Cyclopore track etched membrane) was placed with shiny side up on a polymeric vacuum filter. The filter was rinsed with milli-Q water (5 mL) followed by 55% DMSO (200 μL). The plastic sample was poured next onto the filter and rinsed twice with 55% DMSO and twice with milli-Q water to wash off the extra unbound stain to prevent it for precipitating out and aggregating. The above process was repeated twice. One of the filter was rinsed into a glass tube to bring the microplastic particles from the filter into the solution. For the other filter paper this step was omitted. Filters were then analyzed under fluorescence microscope along with the solution prepared by washing off the first filter paper.
Flow Cytometry
Flow cytometry analysis was conducted using Attune NxT Acoustic Focusing Cytometer by Thermo Fisher Scientific (United States) having violet laser 405 nm (50 mW), blue laser 488 nm (50 mW) and red laser 638 nm (100 mW), and Attune NxT Software v-3.1.1 was used for the data analysis. The lowest detection limit of our FC instrument was calculated by analyzing reference beads. The Flow Cytometry Sub-Micron Size Reference Kit containing six suspensions of polystyrene microspheres in size range of 2, 1, 0.5, 0.2, 0.1, and 0.02 μm with Green Fluorescence were used. The testing solution was prepared by adding 1 drop of each size beads to 1 mL of milli-Q water. Beads were vortex mixed and briefly sonicated (30 s) to suspend the microspheres in solution before analysis. The threshold was set at side scatter at 100, and the optimum voltages for forward scatter (FSC-H), side scatter (SSC-H), and BL1 tested were 340, 340, and 260 respectively. Samples were analyzed at a slow flow rate of 25 μL/min.
Microplastics with NR were analyzed under the FC using a red laser (638 nm) with BL3 emission filter (695/40) (Thermo Fisher Scientific, 2019). A plastic sample was diluted 10 times with milli-Q water to a final volume of 1 mL before FC analysis. The following sample and controls were prepared: (1) a blank sample containing 1 mL of milli-Q water with 10% DMSO; (2) 1 mL of unstained plastic sample in milli-Q water and 10% DMSO; (3) 1 mL of 10 μg/mL NR and 10% DMSO in milli-Q water; and (4) 1 mL of plastic sample in milli-Q water with 10 μg/mL NR and 10% DMSO. All the solutions were vortexed before analysis. Threshold was set at side scatter at 100, and the optimum voltages tested for forward scatter (FSC-H), side scatter (SSC-H) and BL3 were 140, 280, and 360, respectively. Samples were analyzed at a slow flow rate of 25 μL/min. All the nine plastic types were analyzed using the same method and settings specified. Due to the excessively sticky nature of the plastic particles and NR aggregation, a deep clean washing step of the FC was necessary in between two plastic samples to thoroughly clean all the tubing in the FC for any residual particles. This minimized cross contamination in between plastic samples. The washing step is automatically performed by the FC. Milli-Q water with 10% DMSO was used as a cleaning buffer for the process and it helps maintain cleanliness of the fluidics line and to minimize contamination. As a routine, the unstained plastics were analyzed first, followed by stained plastics, after which a quick deep clean was done before analyzing the NR in milli-Q water for each sample to get distinct plots.
Results
Development of Staining Protocol for Microplastics Using Nile Red
A rough grouping showed that the highest absorbance of NR was when using 50 and 75% DMSO (Figure 1), thus absorbance for in between concentrations of 55, 60, 65, and 70% were also determined. The optimum concentration of DMSO was found to be 55%. At 55% DMSO, the absorbance was high and also didn’t alter significantly before and after incubation, indicating that less dye was precipitating and aggregating at this concentration. For ethanol and methanol, similar experiments revealed that the optimum solvent concentrations were 35 and 40%, respectively. Since NR in DMSO and in ethanol/methanol, showed equivalently good staining results when evaluated using microscopy for PA plastic type, DMSO was selected as the standard solvent for later experiments as it has been used previously on the Attune NxT FC (Perelman et al., 2012; Satpati and Pal, 2015; Olsen et al., 2016).
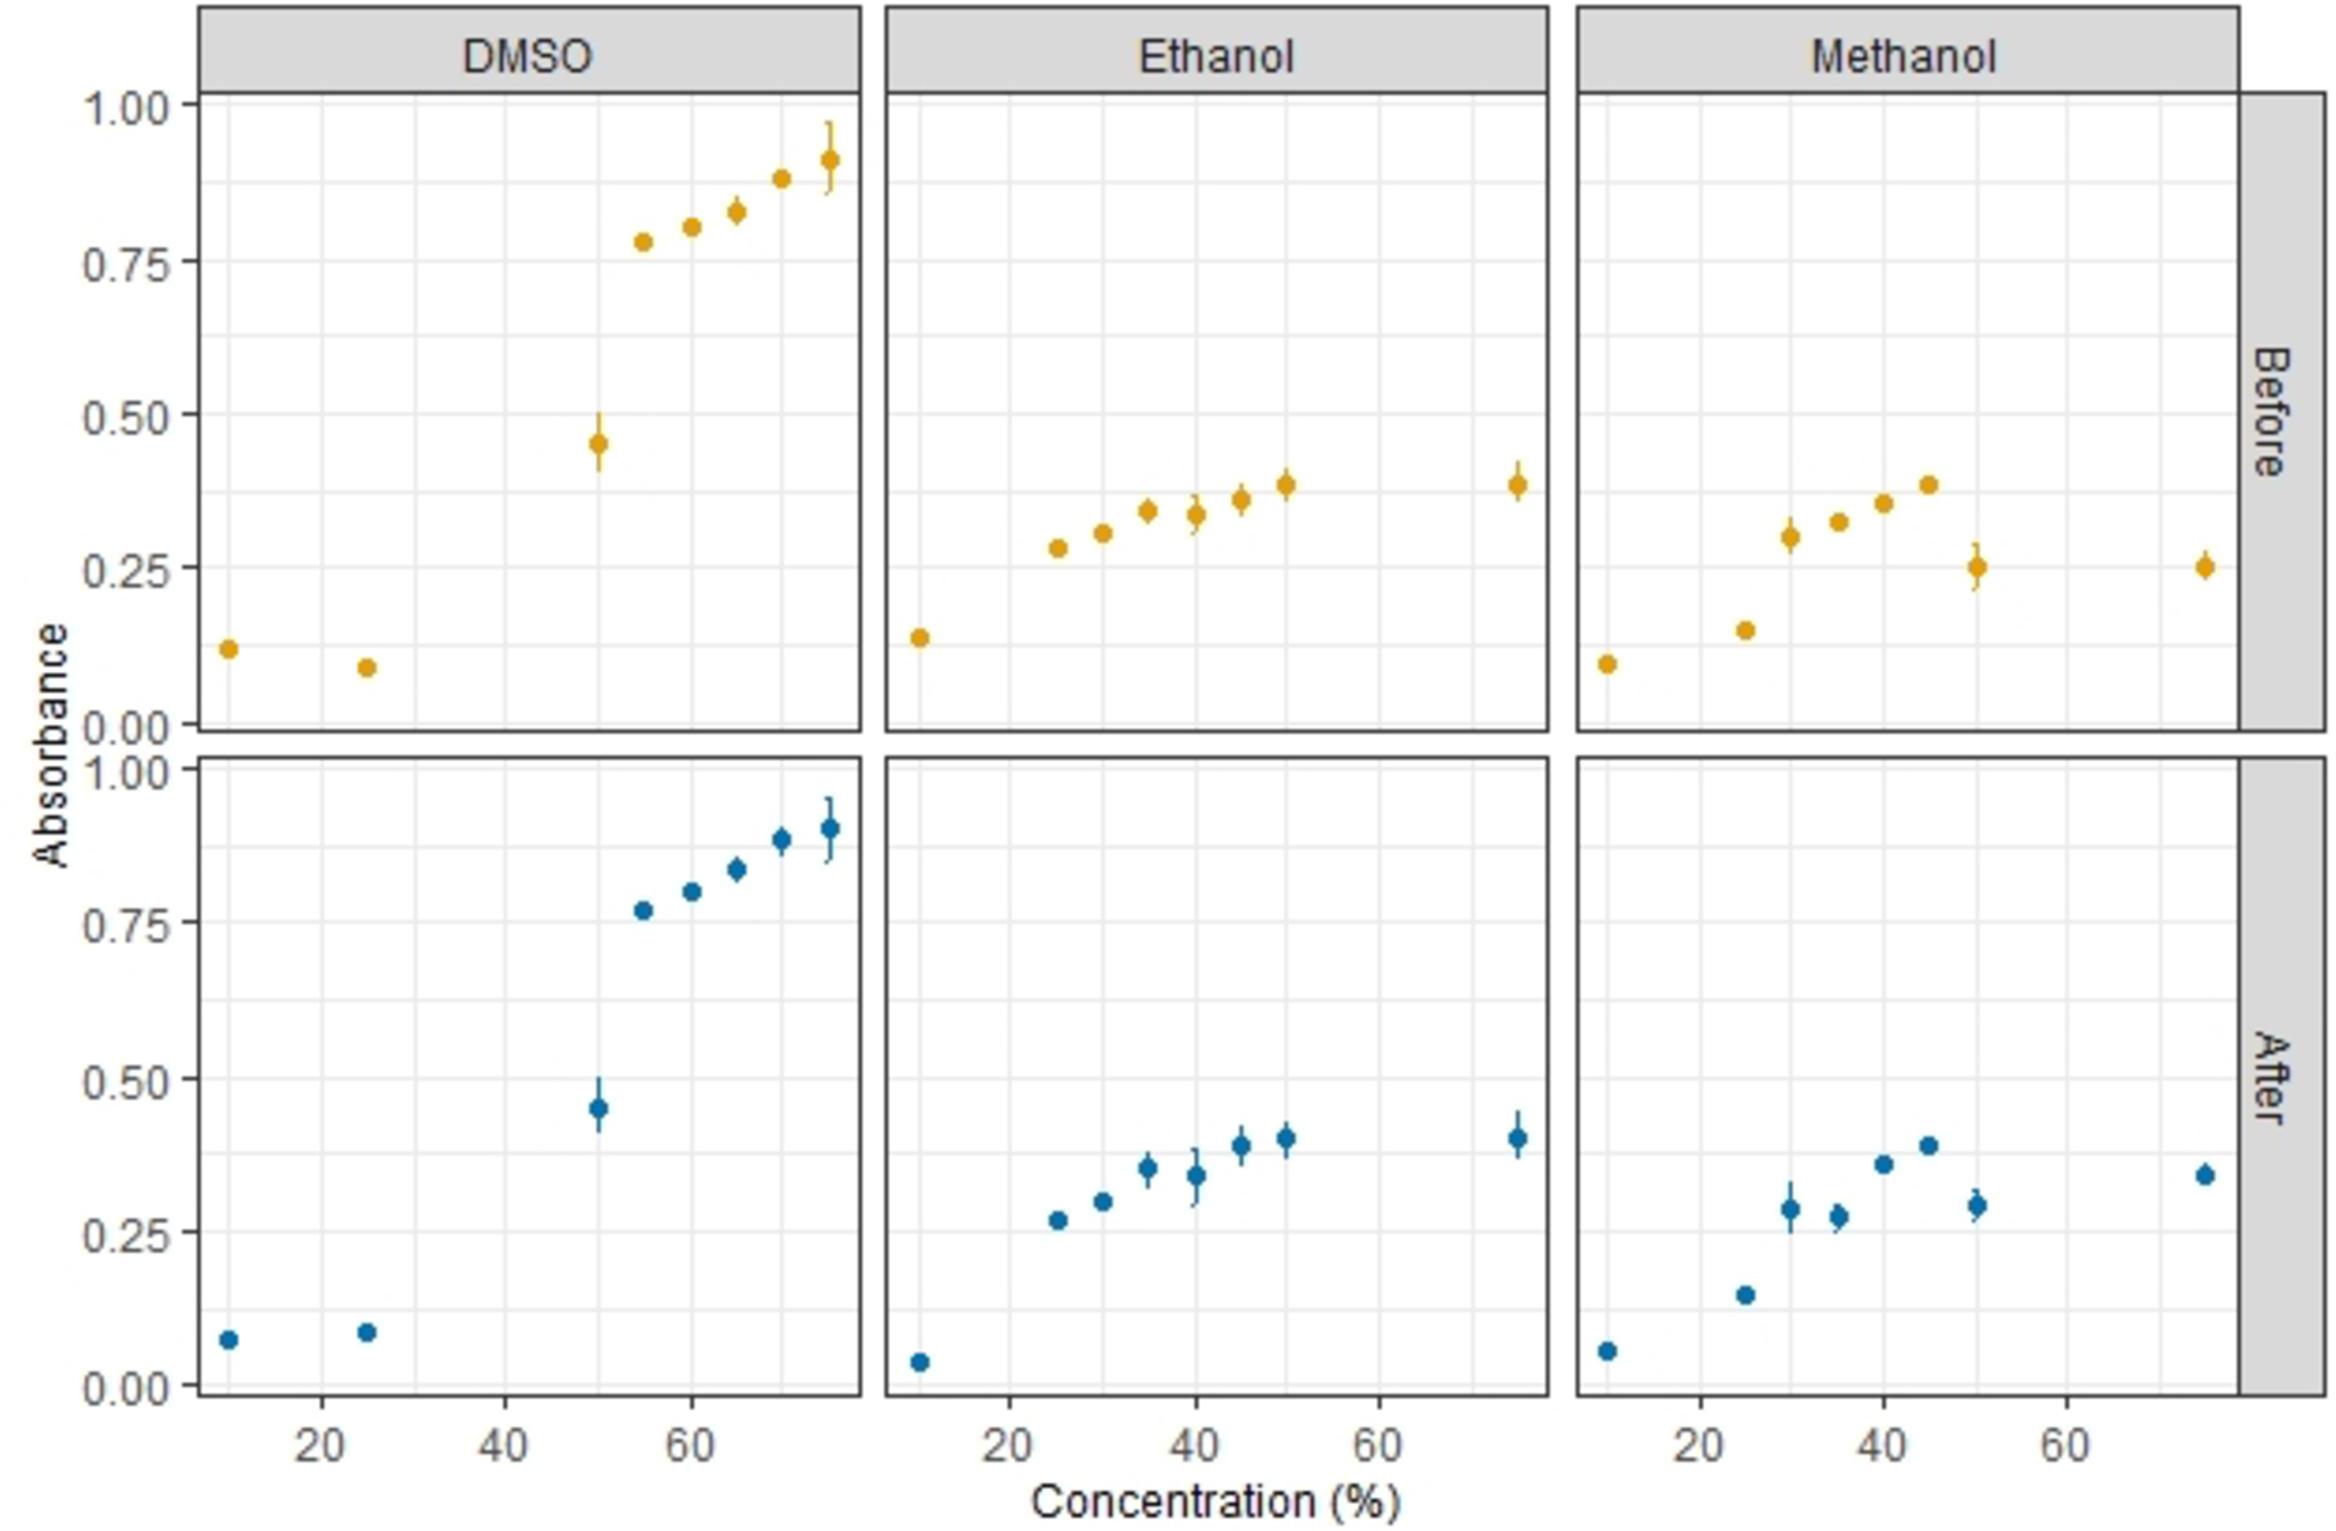
Figure 1. Absorbance with 10 μg/ml NR in the different solvents (before and after incubation).
The optimum NR concentration was found to be 10 μg/mL. This NR concentration showed the least difference in absorbance before and after a 10 min incubation period (Figure 2A), thereby indicating that less dye precipitated and aggregated at this concentration. Precipitation and aggregation increased with higher NR concentrations. Alteration in pH of the 10% DMSO solvent did not affect much the solubility of NR in solution (Figure 2B). The 10% DMSO solution without any adjustments in pH showed a pH value ∼5. The pH value lower and greater than 5 showed increased absorbance but it was not large enough and for further analysis pH was not altered.
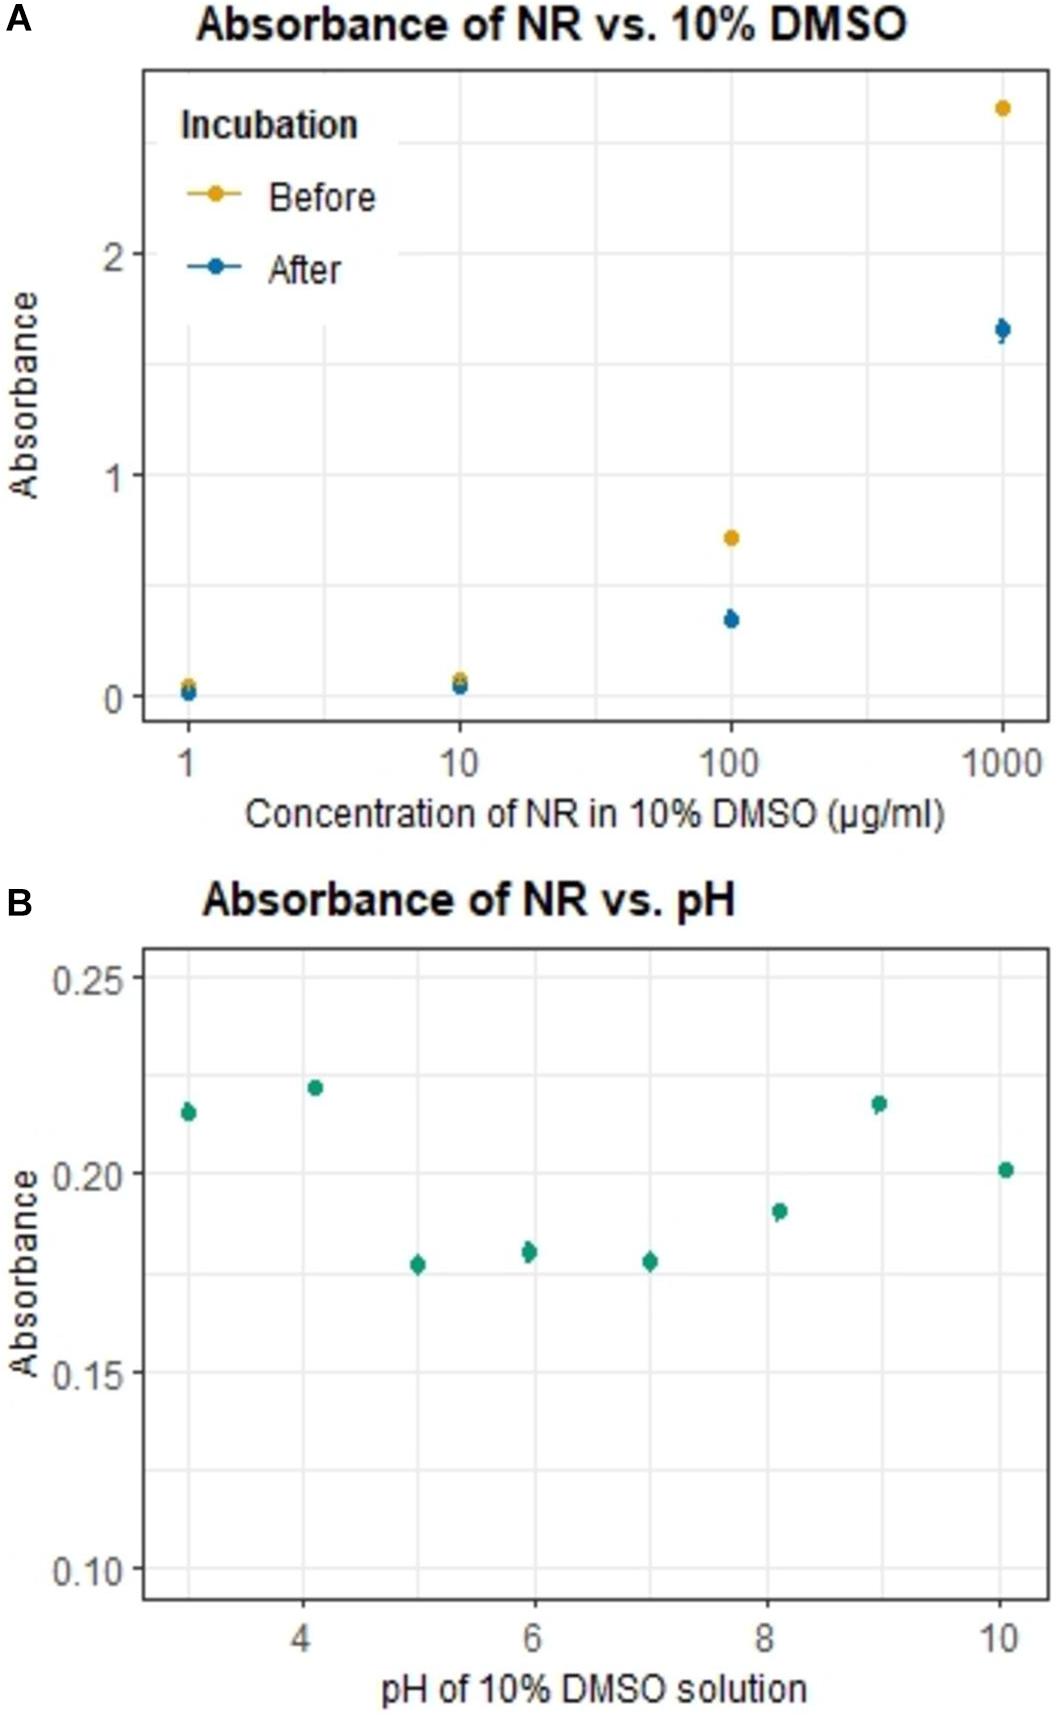
Figure 2. Variation of the absorbance of NR (10 μg/ml) by (A) its concentration in 10% DMSO before and after incubation (note that NR concentration is in logarithm scale), and (B) pH of the 10% DMSO solution.
Microscopic Evaluation of Different Polymer Types
All plastic particles yielded bright red fluorescence after 10 min of staining (Figure 3). Background fluorescence was visible in some of the images (e.g., PP, PVC). Increasing the incubation time resulted in aggregation of unabsorbed dye, fading of the dye, and increase in background coloration, with some variation between different plastic types.
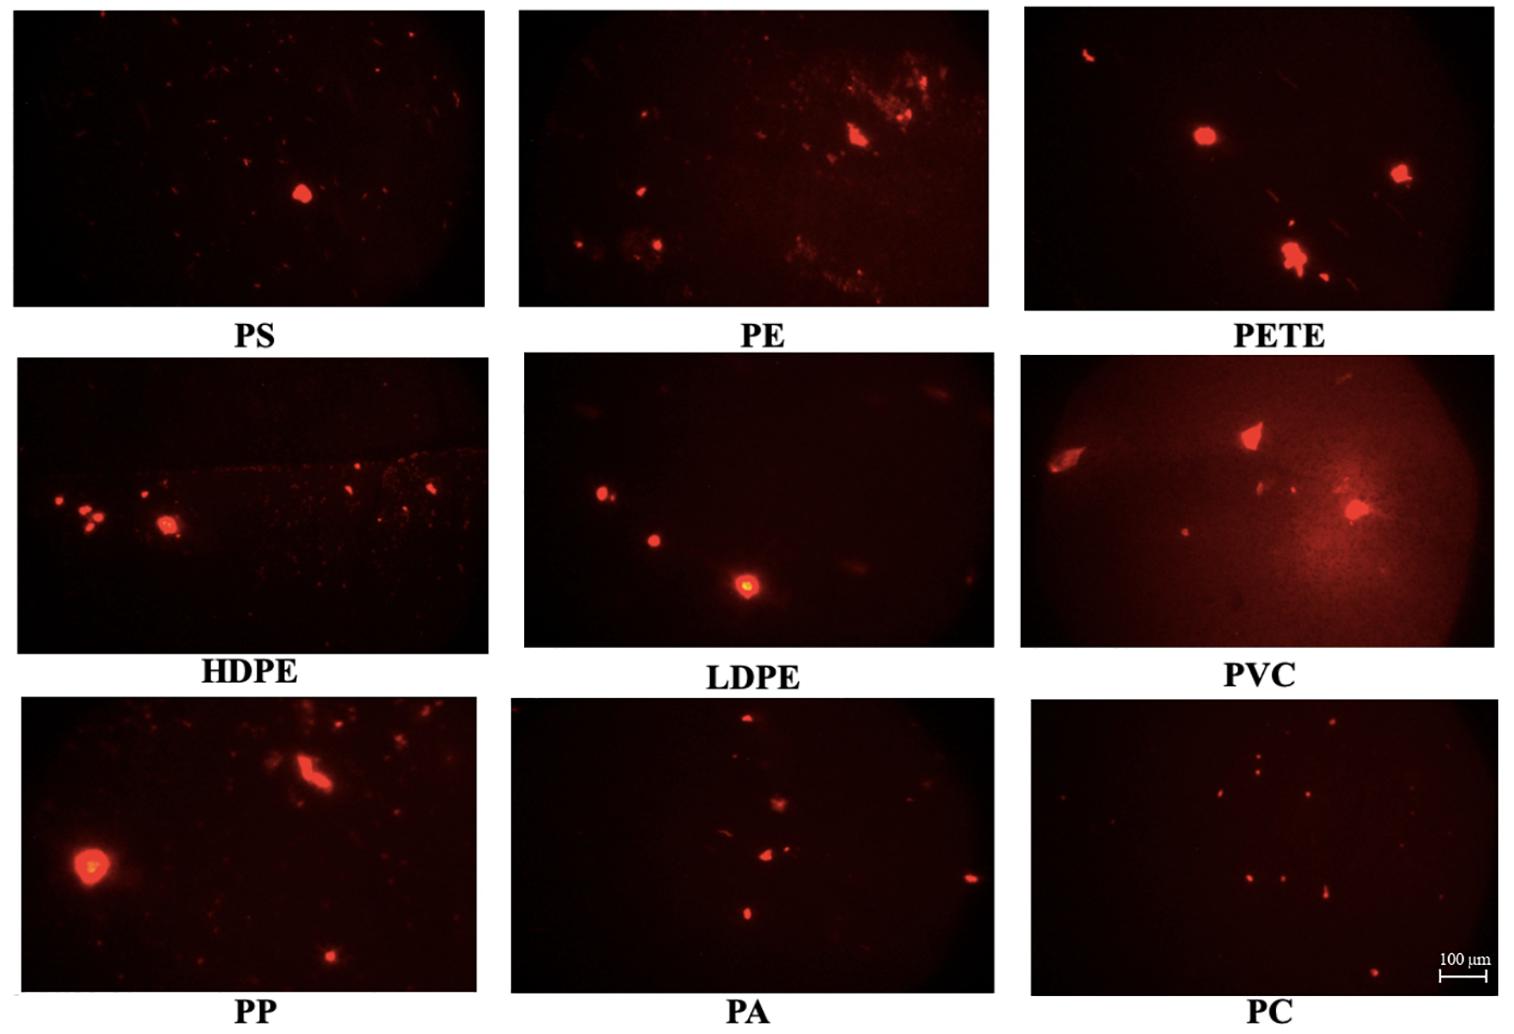
Figure 3. Microscopy photos of stained microplastic polymers at excitation range of 510–560 nm (G2A filter) at 1 min exposure time after 10-min incubation. Scale bar represents 100 μm.
The smallest, largest, and longest particles were identified for each polymer type, this was to avoid clogging of the FC instrument. All the particles were in the same size range, and well below the flow cell dimension of the FC (i.e., 200 μm). The smallest, largest and longest particle sizes were in the size range 1–2, 90–100, and 120–190 μm, respectively. Some more variations were observed for the length of the microplastic particles. The microplastic shapes observed were mainly pellets, fragments, lines, and fibers.
A filtering and washing step using a vacuum filter was also tested which could have been beneficial for washing off the excess unbound stain to prevent aggregation. The filter papers were observed under the fluorescence microscope, and not much dye aggregation was observed. However, the solution obtained after rinsing off one of the filter paper did not yield any fluorescence under the microscope. It was due to the plastic particles being so strongly stuck to the filter paper that they did not retrieve from the filter paper by a simple washing off step.
Flow Cytometry Analysis
The analysis of plastic beads with green fluorescence from the Sub-Micron Reference Kit showed that out of the six bead sizes only the larger four (i.e., 2, 1, 0.5, and 0.2 μm) were recognized, while the smallest size beads (i.e., 0.1 and 0.02 μm) were not distinguishable from background noise (Figure 4). Since the beads had a green fluorescence, the BL1 emission filter (530/30) was used. The lowermost detectable limit for microplastic particles was estimated to be therefore 0.2 μm.
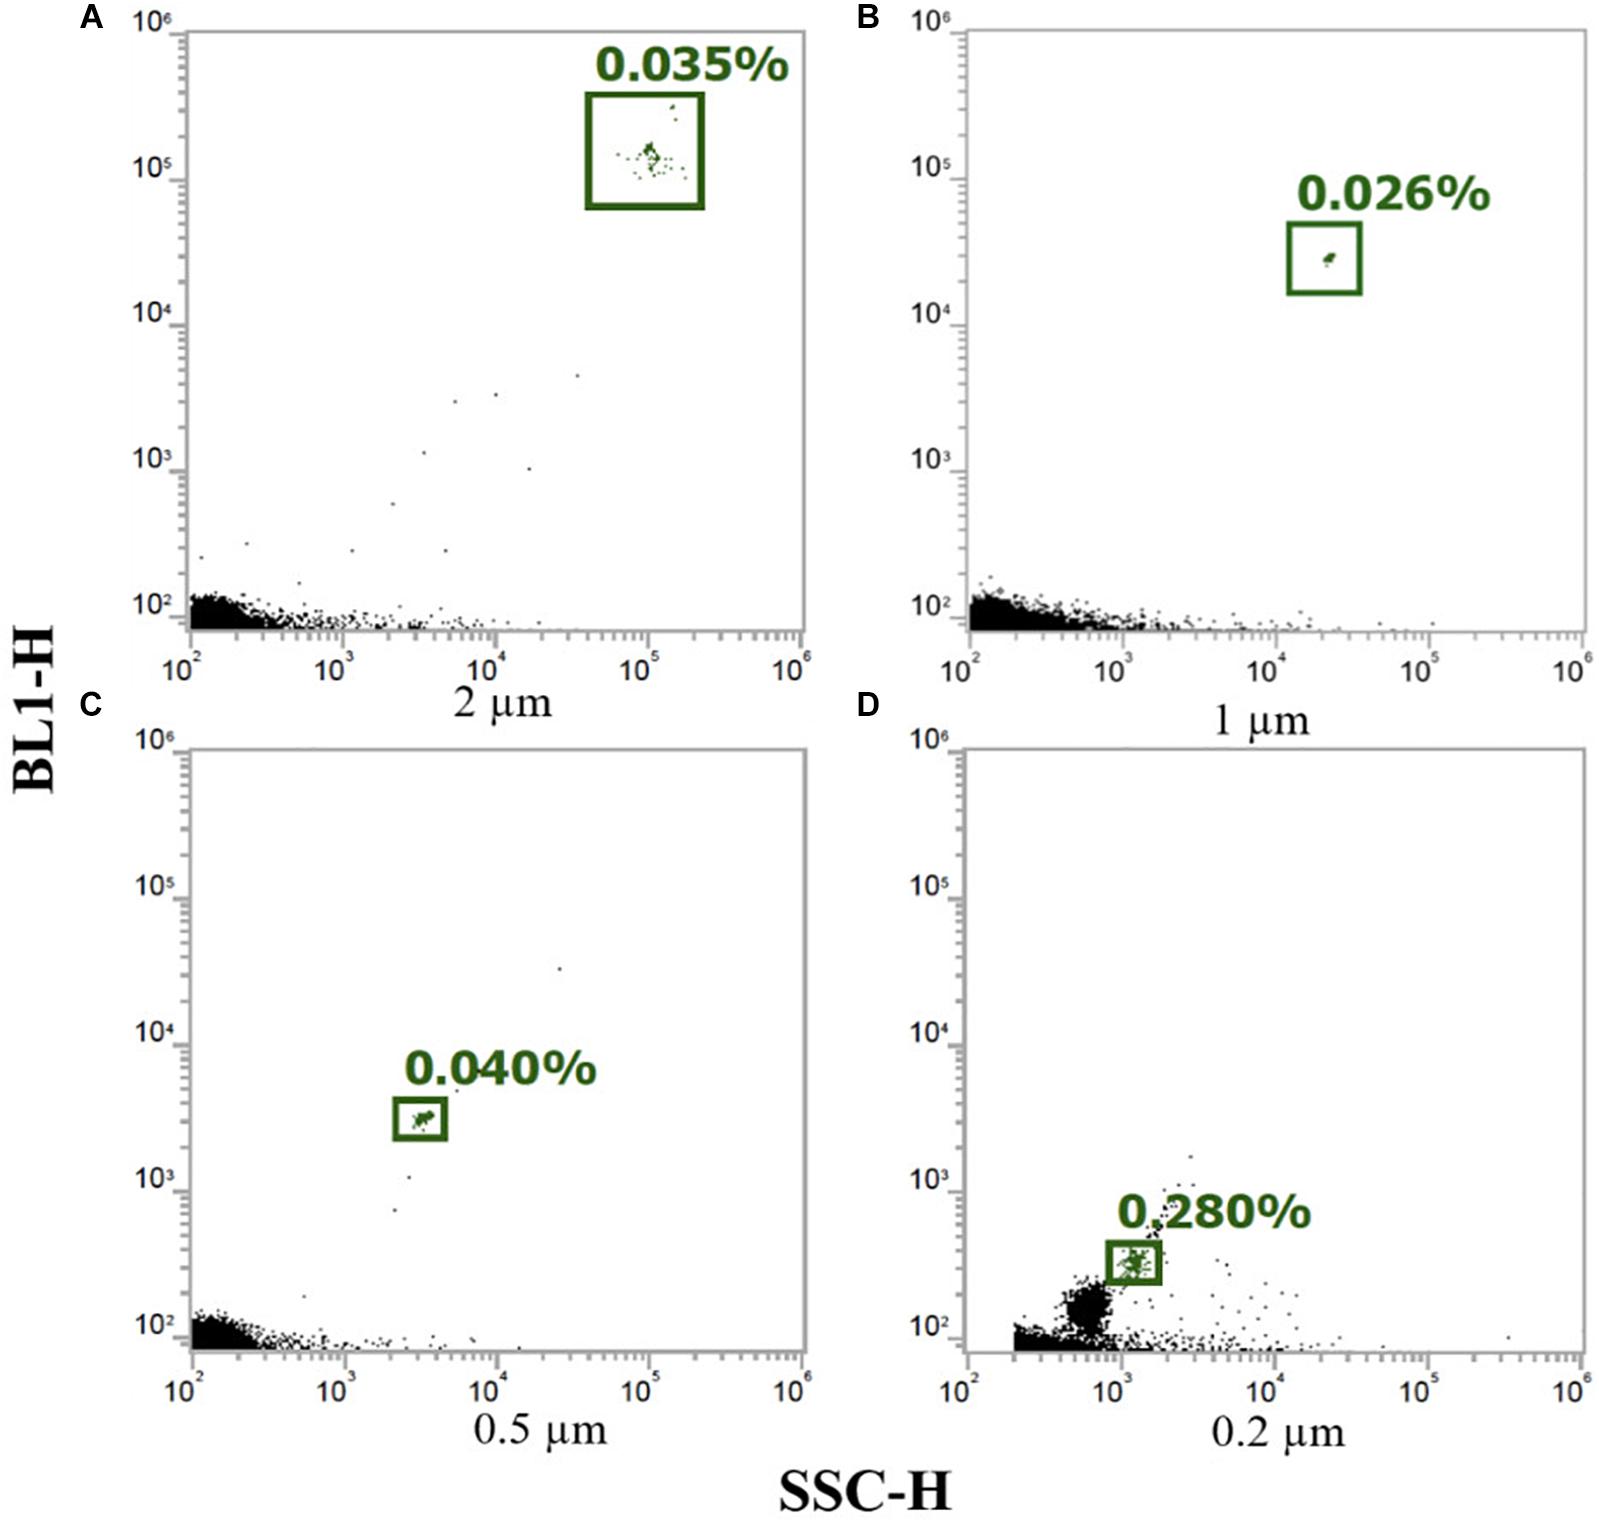
Figure 4. Flow cytometry dot plots for the plastic size beads from the reference kit, (A) 2 μm, (B) 1 μm, (C) 0.5 μm, and (D) 0.2 μm. The green-gated populations represent the size beads and the black particles the background (particles smaller than 0.2 μm were not distinguishable from the background noise).
All microplastic samples were analyzed in a similar way with FCM, as demonstrated for PE (see Figure 5). Dot plot analysis of PE microplastics [side scatter (SSC-H) v/s red fluorescence (BL3-H)] and controls, show that it is impossible to separate unstained PE particles from the background noise in the blank sample (milli-Q water with 10% DMSO). On the other hand, staining of PE with NR clearly separate the microplastic particles from the background noise. For the negative control sample with NR and DMSO (and without PE particles), a population appears that can only be precipitation of NR. However, the population of stained PE particles is more concentrated and with some reduced red fluorescence compared to the NR precipitation.
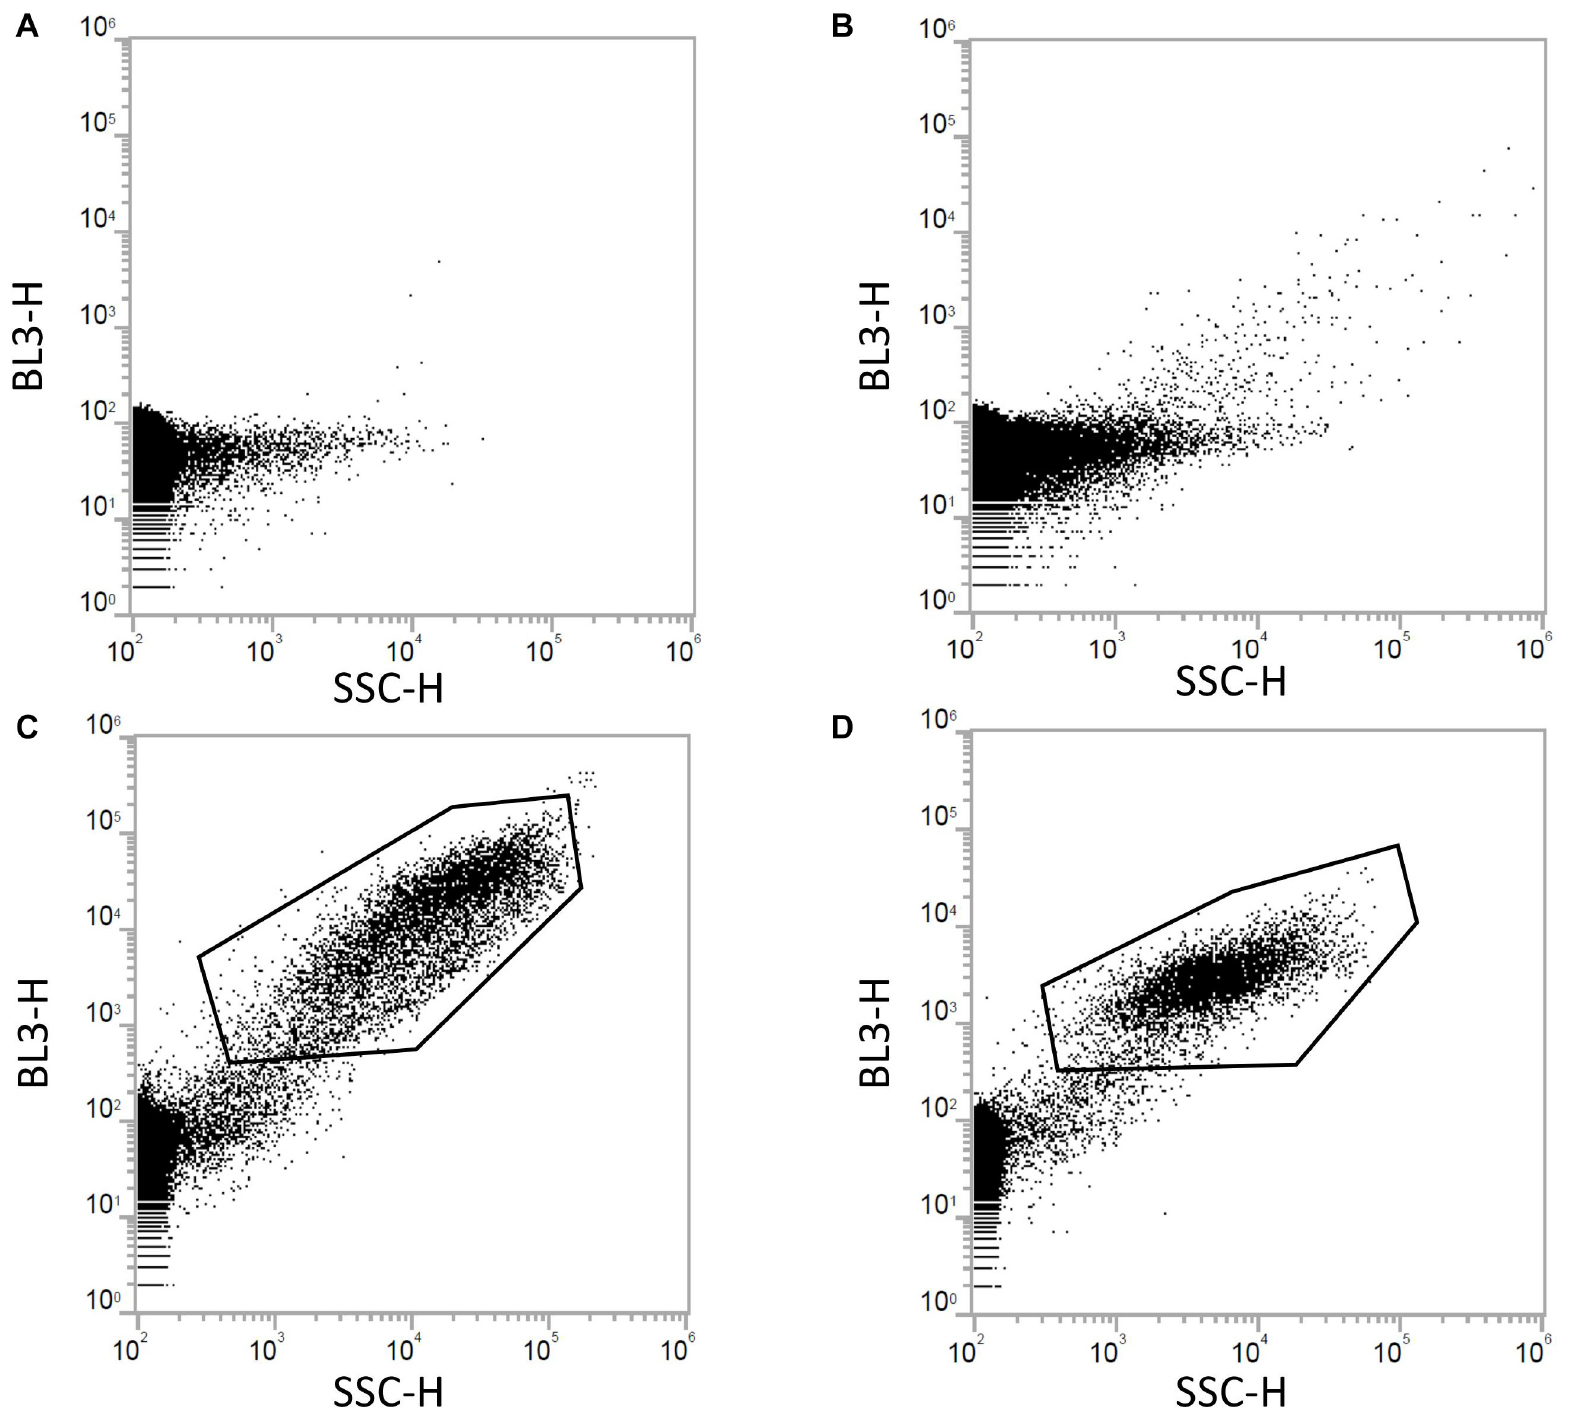
Figure 5. This figure demonstrates how the FCM analysis were performed. Control samples consisting of (A) a blank sample with a final concentration of 10% DMSO in milli-Q water, (B) unstained PE microplastic particles in milli-Q water and 10% DMSO, and (C) a sample without microplastics, but with milli-Q water, 10 μg mL–1 NR, and 10% DMSO, were compared with (D) PE microplastic particles stained with 10 μg mL–1 NR and a final concentration of 10% DMSO. From these results, it is clear that unstained microplastic particles cannot be separated from the background noise in the blank. Some autofluorescence is detected in BL3 of the unstained PE microplastic particles, as shown by single dots with high red fluorescence. For the stained microplastic particles, the population is clearly separated from the background noise, as seen in the gated population in (D). The gated population in (C) is precipitated NR.
The dot plots [side scatter (SSC-H) v/s red fluorescence (BL3-H)] in Figure 6 represents each type of plastic particles stained and incubated with 10 μg/mL NR and 10% DMSO for 10 min. NR in milli-Q water and 10% DMSO (without microplastic particles) was analyzed as negative control, revealing that one of the populations was formed from the precipitated and aggregated NR-stain. Gating was done to separate the two populations by selecting the specific area on the scatterplot generated. This can be seen as red dots in the dot plots. The green dots in the dot plots represented the fluorescent signals from stained plastic particles. The lowermost black colored population is the background noise. PS, PE, PETE, and PC were well-distinguished from both the background noise and from the population of NR aggregation, while there was some overlap of plastic particles and NR aggregation in HDPE, PVC, PP and PA. Though similar conditions of NR concentration, incubation time and analysis were used, precipitation of NR was unpredictable.
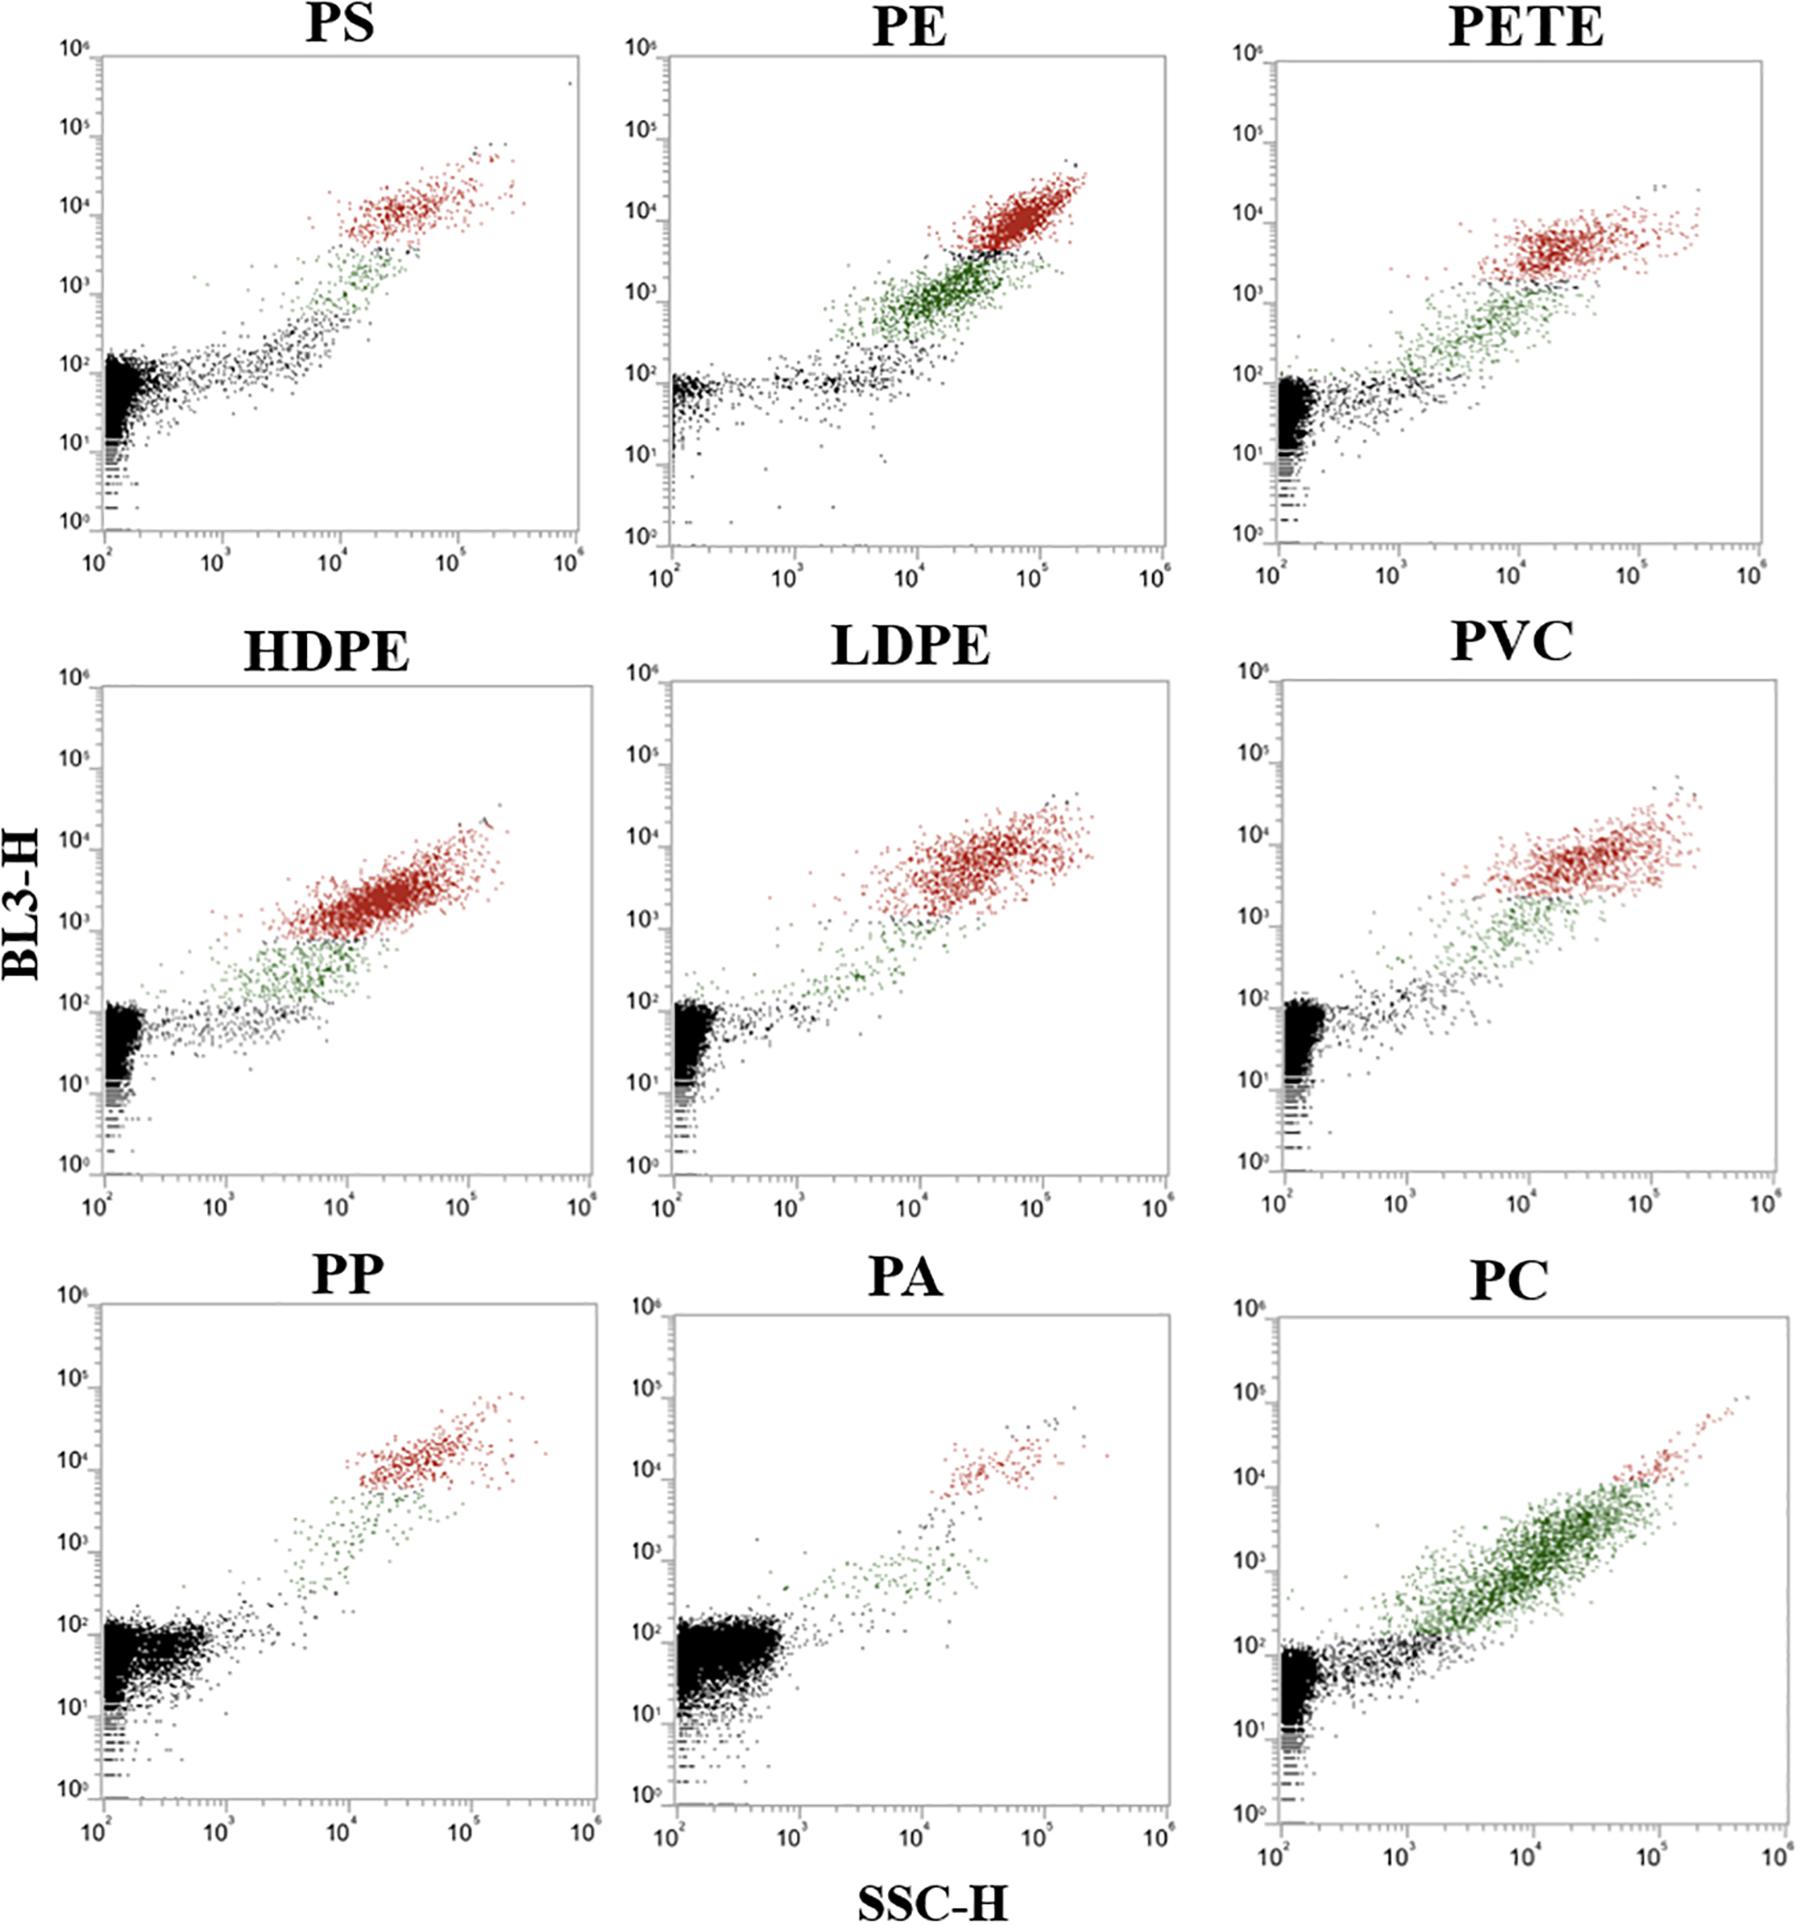
Figure 6. Initial dot plot screen (red fluorescence v/s side scatter) for all the nine plastic types stained with NR, along with the dot plots for NR (without microplastics). The plastic types analyzed were polystyrene (PS), polyethylene (PE), polyethylene terephthalate (PETE), high density polyethylene (HDPE), low density polyethylene (LDPE), polyvinyl chloride (PVC), polypropylene (PP), nylon (PA), polycarbonate (PC). The black coloration shows the background noise, green and red coloration represents the stained plastic particles and aggregated NR, respectively.
Three plastic types (PE, PC and PETE) were therefore selected for a more detailed study (Figure 7 and Table 1). The concentrations of microplastics were estimated in two different ways: (1) unstained microplastic particles minus the number of particles in the blank sample, and (2) stained microplastic particles minus the number of precipitated NR particles. The results are also compared with the concentration of microplastics estimated by microscopy counts in Table 1.
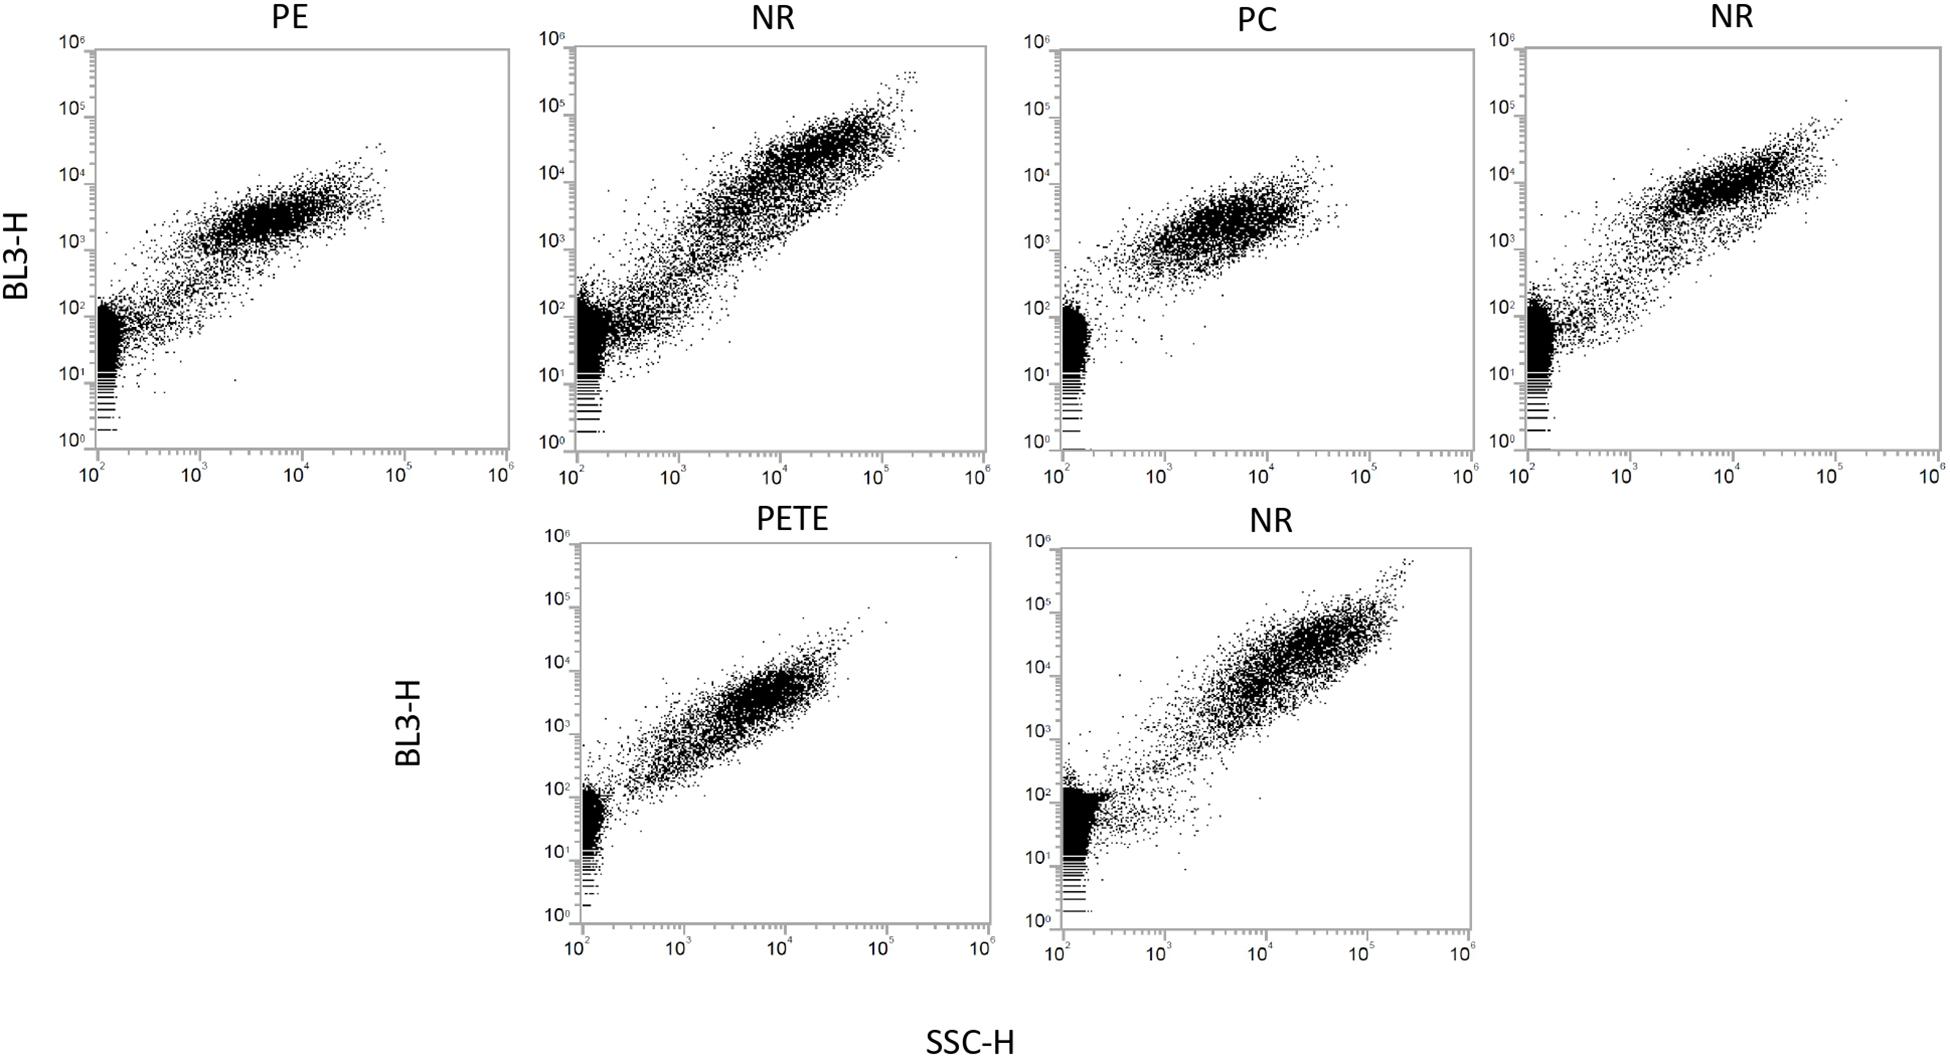
Figure 7. Dot plots for three selected plastic types, polyethylene (PE), polycarbonate (PC), and polyethylene terephthalate (PETE), along with dot plots for NR (without microplastics). All three stained microplastic types are clearly separated from the background noise. NR precipitation is subtracted from the microplastic population to estimate the concentration of microplastics in Table 1.
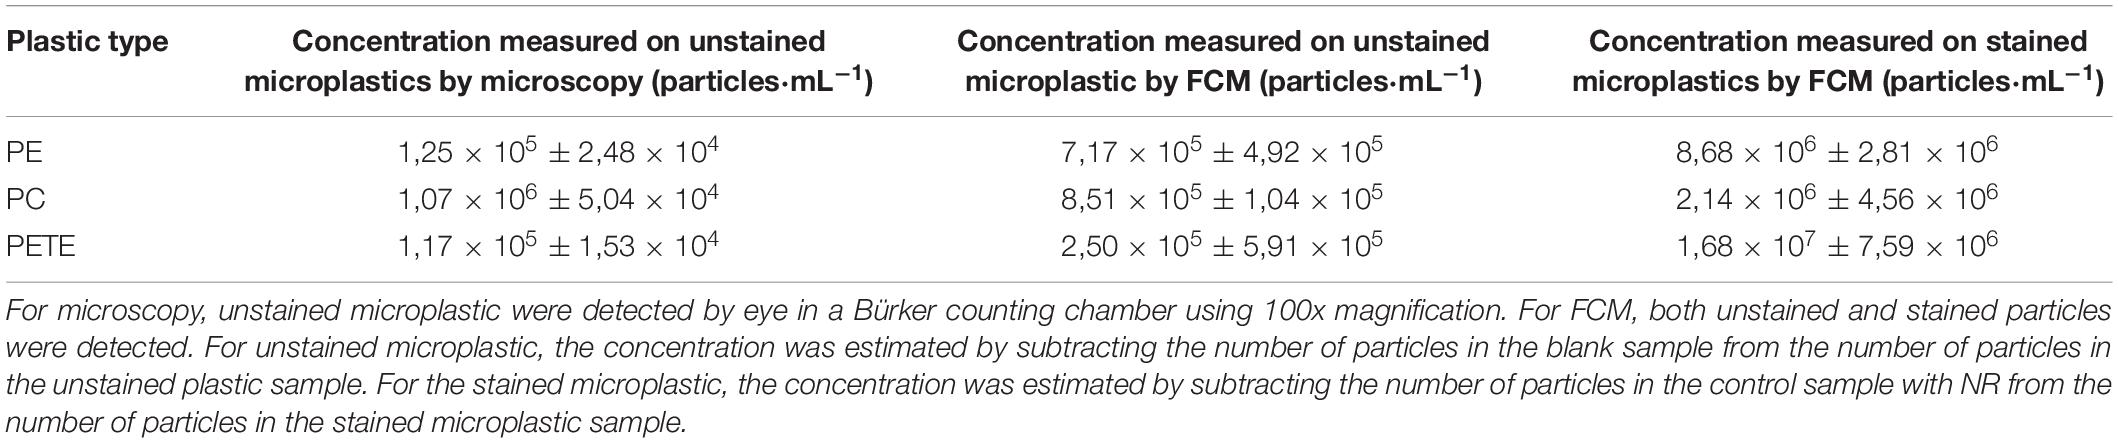
Table 1. Overview of the concentrations of PE, PC, and PETE measured with microscopy counts and with FCM.
Discussion
The selection of an appropriate solvent of NR is a critical step in the method. NR is a solvatochromic dye, and thus its fluorescence emission is dependent on the polarity of the solvent (Maes et al., 2017; Prata et al., 2019a). Various types has been suggested in the literature; e.g., acetone, chloroform, n-hexane (Tamminga, 2017; Wiggin and Holland, 2019) toluene, cyclohexane, ethanol, ethylacetate, acetonitrile, dichloromethane (Shim et al., 2016); methanol (Shim et al., 2016; Erni-Cassola et al., 2017). Furthermore, solvents such as dimethyl sulfoxide (DMSO), glycerol, and ethylene diaminotetraacetic acid (EDTA) have been used to dissolve NR while staining neutral lipids (Satpati and Pal, 2015; Alemán-Nava et al., 2016).
In this sense, we selected DMSO as the potential solvent since it has been used widely in other FC experiments (Perelman et al., 2012; Satpati and Pal, 2015; Olsen et al., 2016), and it showed equivalently good staining results as ethanol/methanol. However, other options would need to be further evaluated in future investigations. A potential issue is that Attune NxT (as many other FC instruments) is a highly sensitive apparatus and it can be damaged if strong reagents are used. We therefore decided to minimize the solvent concentration, and a 10% DMSO was used as solvent for NR. Although this concentration is not the optimal in terms of getting the highest absorbance of NR (i.e., 55%), it was a compromise between getting a good signal and instrument operability.
Higher concentrations of NR and longer incubation times also give better results in the staining process. However, we have observed that increasing these parameters lead to the aggregation and precipitation of the unabsorbed dye, as also suggested by other authors (e.g., Erni-Cassola et al., 2017; Maes et al., 2017; Wiggin and Holland, 2019). This generates two problems: (1) NR aggregations and precipitations increase the background staining, making more difficult to identify any particle and (2) they may generate solid particles that can be interpreted as plastic particles, leading to a problem of false positives and overestimation of microplastic content in the sample. These issues are not only a problem for FC, but for any technique that use NR for staining microplastics. With regard to microplastic aggregation before filtering the plastic particles, the samples were sonicated using Sonorex Super RK 514, D-12207 Sonicator (Bandelin, Berlin) for 2 min to suspend the plastic particles in solutions and to prevent their aggregation. On analyzing samples under fluorescence microscopy no signs of microplastic particle aggregation were observed.
A possible solution to prevent NR aggregation would be to add a washing step to remove the unbound NR (Cole, 2016; Shim et al., 2016; Prata et al., 2019b). We therefore tested to stain the microplastic particles on filter papers, and then put them in solution for being measured in the FC. We detect however two problems: (1) the sticky nature of microplastics prevented the particles from being released into suspension after the washing step, and (2) the washing step requires an extra handling of the samples (and therefore potential bias), compromising one of the advantages of FC – analyzing water samples directly.
We consider therefore that a NR concentration of 10 μg/mL in 10% DMSO with a 10 min incubation time is sufficient for staining the plastic particles. The optimal NR concentration of 10 μg/mL is in agreement with other studies, which also has found that this concentration produced the least background fluorescence but still managed to stain the plastic types and provided a good balance between speed, visibility and background signal (Maes et al., 2017; Wiggin and Holland, 2019). Moreover, we have seen that an incubation time of 10 min was enough for staining the plastic particles (Figure 1), making the process even faster than previously suggested (i.e., 30 min; Wiggin and Holland, 2019).
Apart from precipitation and aggregation of the unabsorbed NR, one main limitation of applying the NR staining protocol to environmental samples is the co-staining of natural organic matter as NR binds to lipids easily. However, this limitation can be overcome by using a DNA stain such as SYBR Green (Khalil et al., 2016) to differentially stain plastic particles and living organisms. Alternatively, it is possible to degrade and digest the organic matter using potassium hydroxide, hydrogen peroxide or Fenton’s reagent (Prata et al., 2019a) before staining the microplastics.
A mixture of different plastic type was not tested in this study. The problem of polymer identification in a mixed sample could potentially be addressed by using differential staining. It would be possible to add a cell sorter to the FC, which may segregate and retrieve the gated population on the FC data plots. This step would be followed by analysis for polymer identification with the help of the most suited spectroscopic technique. In our study we validated the results using fluorescence microscopy, where stained plastic particles were analyzed for their size and shape. Finally, autofluorescence characteristics of the plastic particles can also help segregate and differentiate between different plastics in a mixed sample. It was suggested in literature that PS exhibits autofluorescence in 300–400 nm wavelength range (Young et al., 2013) and also PC shows a weak autofluorescence at 403 nm (Piruska et al., 2005). However, we did not observe autofluorescence in our samples under the fluorescence microscopy as well as while checking unstained particles on the FC. An explanation for this could be that the samples were prepared from biology laboratory-grade plasticware, and thus they may have been treated to remove any autofluorescence. In future analyzing different stains for differentially staining the polymer types particles can also help segregate and differentiate between different plastics in a mixed sample.
The concentrations of microplastics were estimated in two different ways: (1) unstained microplastic particles minus the number of particles in the blank sample, and (2) stained microplastic particles minus the number of precipitated NR particles. The results showed large standard deviations and also the concentration of particles as determined by the two methods showed significant differences among them. It can be concluded that there is no ideal method for quantification of microplastics. Both the methods have their shortcomings, while microscopy is a subjective method and can be used to detect particles only visible to human eye, results from FC method are biased by precipitation of NR as the concentration of stained particles differs from the unstained ones.
Microplastics have been quantified recently in other studies where microplastics of known sizes were added and subsequently detected on the FC, without any staining steps (Bringer et al., 2020; Le Bihanic et al., 2020). We, on the other hand, are trying to identify particles of unknown sizes and concentrations in a liquid sample. To do so, it will be necessary to stain microplastic particles before analyzing them on the FC. Though FC is starting to be used in the microplastic research community, we have detected some limitations that should be overcome before it can be broadly used in the field of microplastic detection in water samples. We try to highlight these shortcomings and the need for further research with help of this article.
The detected range particle size of 0.2 to 2 μm demonstrates the advantage of FC techniques for detecting small particles sizes over other common methods such as FT-IR and Raman Spectroscopy, which commonly identify particles in range of 35–50 and 1–2 μm, respectively (Welker, 2012). The use of acoustic focusing (as in the Attune NxT instrument) is also advantageous over traditional FCs as it is faster and helps runs larger volume/number of samples without compromising on data quality. The fast sample processing, minimum sample preparation and automated deep cleaning system of the FC also reduces the chances of cross contamination.
Data Availability Statement
The datasets generated for this study are available on request to the corresponding author.
Author Contributions
IH, QC, and JE initiated and supervised the study. NK, ML, and GT performed the experimental part. NK wrote the manuscript, with significant inputs from IH, QC, JE, ML, and GT. All authors contributed to the article and approved the submitted version.
Conflict of Interest
The authors declare that the research was conducted in the absence of any commercial or financial relationships that could be construed as a potential conflict of interest.
References
Adan, A., Alizada, G., Kiraz, Y., Baran, Y., and Ayten, N. (2016). Flow cytometry: basic principles and applications. Crit. Rev. Biotechnol. 37, 163–176.
Alemán-Nava, G. S., Cuellar-Bermudez, S. P., Cuaresma, M., Bosma, R., Muylaert, K., Ritmann, B. E., et al. (2016). How to use Nile Red, a selective fluorescent stain for microalgal neutral lipids. J. Microbiol. Methods 128, 74–79. doi: 10.1016/j.mimet.2016.07.011
Andrady, A. L. (2011). Microplastics in the marine environment. Mar. Pollut. Bull. 62, 1596–1605. doi: 10.1016/j.marpolbul.2011.05.030
Andrady, A. L. (2017). The plastic in microplastics: a review. Mar. Pollut. Bull. 119, 12–22. doi: 10.1016/j.marpolbul.2017.01.082
Avio, C. G., Gorbi, S., and Regoli, F. (2017). Plastics and microplastics in the oceans: from emerging pollutants to emerged threat. Mar. Environ. Res. 128, 2–11. doi: 10.1016/j.marenvres.2016.05.012
Bringer, A., Thomas, H., Prunier, G., Dubillot, E., Bossut, N., Churlaud, C., et al. (2020). High density polyethylene (HDPE) microplastics impair development and swimming activity of Pacific oyster D-larvae, Crassostrea gigas, depending on particle size. Environ. Pollut. 260:113978. doi: 10.1016/j.envpol.2020.113978
Cole, M. (2016). A novel method for preparing microplastic fibers. Sci. Rep. 6, 1–7. doi: 10.1038/srep34519
Erni-Cassola, G., Gibson, M., Thompsom, R., and Christie-Oleza, J. (2017). Lost, but Found with Nile Red: A Novel Method for Detecting and Quantifying Small Microplastics (1 mm to 20 μm) in Environmental Samples. Environmental Science and Technology.
Frias, J. P. G. L., and Nash, R. (2019). Microplastics: finding a consensus on the definition. Mar. Pollut. Bull. 138, 145–147. doi: 10.1016/j.marpolbul.2018.11.022
Hoell, I. A., Olsen, R. O., Hess-Erga, O. K., Thuestad, G., and Larsen, A. (2017). Application of flow cytometry in ballast water analysis—biological aspects. Manage. Biol. Invas. 8, 575–588. doi: 10.3391/mbi.2017.8.4.13
Horton, A., Walton, A., Spurgeon, D. J., Lahive, E., and Svendsen, C. (2017). Microplastics in freshwater and terrestrial environments: evaluating the current understanding to identify the knowledge gaps and future research priorities. Sci. Total Environ. 586, 127–141. doi: 10.1016/j.scitotenv.2017.01.190
Ivar do Sul, J. A., and Costa, M. F. (2014). The present and future of microplastic pollution in the marine environment. Environ. Pollut. 185, 352–364. doi: 10.1016/j.envpol.2013.10.036
Jambeck, J., Geyer, R., Wilcox, C., Siegler, T. R., Perryman, M., Andrady, A., et al. (2015). Plastic waste inputs from land into the ocean. Science 347, 768–771. doi: 10.1126/science.1260352
Katayama, T., Kishi, M., Takahashi, K., Furuya, K., Wahid, M. E. A., Khatoon, H., et al. (2019). Isolation of lipid-rich marine microalgae by flow cytometric screening with Nile Red staining. Aquac. Int. 27, 509–518. doi: 10.1007/s10499-019-00344-y
Khalil, J. Y. B., Robert, S., Reteno, D. G., Andreani, J., Raoult, D., and La Scola, B. (2016). High-throughput isolation of giant viruses in liquid medium using automated flow cytometry and fluorescence staining. Front. Microbiol. 7:26. doi: 10.3389/fmicb.2016.00026
Le Bihanic, F., Clérandeau, C., Cormier, B., Crebassa, J. C., Keiter, S. H., Beiras, R., et al. (2020). Organic contaminants sorbed to microplastics affect marine medaka fish early life stages development. Mar. Pollut. Bull. 154:111059. doi: 10.1016/j.marpolbul.2020.111059
Li, J., Liu, H., and Paul Chen, J. (2018). Microplastics in freshwater systems: a review on occurrence, environmental effects, and methods for microplastics detection. Water Res. 137, 362–374. doi: 10.1016/j.watres.2017.12.056
Löder, M. G. J., and Gerdts, G. (2015). “Methodology Used for the Detection and Identification of Microplastics— A Critical Appraisal”, in Marine Anthropogenic Litter, 395–428. doi: 10.1007/978-3-319-16510-3_15
Lusher, A., Bråte, I. L. N., Hurley, R., Iversen, K., and Olsen, M. (2017). Testing of Methodology for Measuring Microplastics in Blue Mussels (Mytilus spp) and Sediments, and Recommendations for Future Monitoring of Microplastics (R & D-project), Report number: 7209-2017. Oslo: Norwegian Institute for Water Research, 87.
Lusher, A. L., Tirelli, V., O’Connor, I., and Officer, R. (2015). Microplastics in Arctic polar waters: the first reported values of particles in surface and sub-surface samples. Sci. Rep. 5, 1–9. doi: 10.1038/srep14947
Maes, T., Jessop, R., Wellner, N., Haupt, K., and Mayes, A. G. (2017). A rapid-screening approach to detect and quantify microplastics based on fluorescent tagging with Nile Red. Sci. Rep. 7, 1–10. doi: 10.1038/srep44501
Olsen, R. O., Hoffmann, F., Hess-Erga, O. K., Larsen, A., Thuestad, G., and Hoell, I. A. (2016). Ultraviolet radiation as a ballast water treatment strategy: inactivation of phytoplankton measured with flow cytometry. Mar. Pollut. Bull. 103, 270–275. doi: 10.1016/j.marpolbul.2015.12.008
Perelman, A., Wachtel, C., Cohen, M., Haupt, S., Shapiro, H., and Tzur, A. (2012). JC-1: Alternative excitation wavelengths facilitate mitochondrial membrane potential cytometry, Cell Death and Disease. Nature Publishing Group 3(11), 1–7. doi: 10.1038/cddis.2012.171
Piruska, A., Nikcevic, I., Lee, S. H., Ahn, C., Heineman, W. R., Limbach, P. A., et al. (2005). The Autofluorescence of Plastic Materials and Chips Measured Under Laser Irradiation. London: Royal Society of Chemistry, 1348–1354.
Prata, J. C., da Costa, J. P., Duarte, A. C., and Rocha-Santos, T. (2019a). Methods for sampling and detection of microplastics in water and sediment: a critical review. TrAC Trends Anal. Chem. 110, 150–159. doi: 10.1016/j.trac.2018.10.029
Prata, J. C., Reis, V., Matos, J. T. V., da Costa, J. P., Duarte, A. C., and Rocha-Santos, T. (2019b). A new approach for routine quantification of microplastics using Nile Red and automated software (MP-VAT). Sci. Total Environ. 690, 1277–1283. doi: 10.1016/j.scitotenv.2019.07.060
Rios Mendoza, L. M., Karapanagioti, H., and Álvarez, N. R. (2018). Micro(nanoplastics) in the marine environment: current knowledge and gaps. Curr. Opin. Environ. Sci. Health 1, 47–51. doi: 10.1016/j.coesh.2017.11.004
Rocha-Santos, T., and Duartea, A. C. (2015). A critical overview of the analytical approaches to the occurrence, the fate and the behavior of microplastics in the environment. TrAC Trends Anal. Chem. 65, 47–53. doi: 10.1016/j.trac.2014.10.011
Sgier, L., Freimann, R., Zupanic, A., and Kroll, A. (2016). Flow cytometry combined with viSNE for the analysis of microbial biofilms and detection of microplastics. Nat. Commun. 7, 1–10. doi: 10.1038/ncomms11587
Satpati, G. G., and Pal, R. (2015). Rapid detection of neutral lipid in green microalgae by flow cytometry in combination with Nile red staining-an improved technique. Ann. of Microbiol. 65(2), 937–949.
Shim, W. J., Song, Y. K., Hong, S. H., and Jang, M. (2016). Identification and quantification of microplastics using Nile Red staining. Mar. Pollut. Bull. 113, 469–476. doi: 10.1016/j.marpolbul.2016.10.049
Silva, A. B., Bastos, A. S., Justino, C. I. L., da Costa, J. P., Duarte, A. C., and Rocha-Santos, T. A. P. (2018). Microplastics in the environment: challenges in analytical chemistry – a review’. Anal. Chim. Acta 1017, 1–19. doi: 10.1016/j.aca.2018.02.043
Steen, H. B. (2004). Flow cytometer for measurement of the light scattering of viral and other submicrosopic particles. Cytometry 57A, 94–99. doi: 10.1002/cyto.a.10115
Tamminga, M. (2017). Nile Red staining as a subsidiary method for microplastic quantification: a comparison of three solvents and factors influencing application reliability. SDRP J. Earth Sci. Environ. Stud. 2, 165–172. doi: 10.15436/jeses.2.2.1
Thermo Fisher Scientific (2019). 2020 Attune NxT Flow Cytometer. Available online at: https://www.googleadservices.com/pagead/aclk?sa=L&ai=DChcSEwjPy4CRo57sAhWM7u0KHeSVDXAYABAAGgJkZw&ohost=www.google.co.in&cid=CAASE-Rot12FxRXDY5bPfxg5ChrSxyk&sig=AOD64_3nNStH8_mTBPM30tC44GZZUvYgww&q&adurl&ved=2ahUKEwi-7fiQo57sAhV1wuYKHVuwCGYQ0Qx6BAggEAE.
Van Cauwenberghe, L., Devriese, L., Galgani, F., Robbens, J., and Janssen, C. R. (2015). Microplastics in sediments: a review of techniques, occurrence and effects. Mar. Environ. Res. 111, 5–17. doi: 10.1016/j.marenvres.2015.06.007
Watts, A. J. R., Lewis, C., Goodhead, R. M., Beckett, S. J., Moger, J., Tyler, C. R., et al. (2014). Uptake and retention of microplastics by the shore crab carcinus maenas. Environ. Sci. Technol. 48, 8823–8830. doi: 10.1021/es501090e
Welker, R. W. (2012). “Size analysis and identification of particles,” in Developments in Surface Contamination and Cleaning: Detection, Characterisation, and Analysis of Contaminants, eds R. Kohli and K. L. Mittal (Oxford: Elsevier), 179–213. doi: 10.1016/b978-1-4377-7883-0.00004-3
Wiggin, K. J., and Holland, E. B. (2019). Validation and application of cost and time effective methods for the detection of 3–500 Mm sized microplastics in the urban marine and estuarine environments surrounding Long Beach, California. Mar. Pollut. Bull. 143, 152–162. doi: 10.1016/j.marpolbul.2019.03.060
Keywords: microplastics, flow cytometry, plastic pollution, Nile red, staining technique
Citation: Kaile N, Lindivat M, Elio J, Thuestad G, Crowley QG and Hoell IA (2020) Preliminary Results From Detection of Microplastics in Liquid Samples Using Flow Cytometry. Front. Mar. Sci. 7:552688. doi: 10.3389/fmars.2020.552688
Received: 16 April 2020; Accepted: 22 September 2020;
Published: 21 October 2020.
Edited by:
Jérôme Cachot, Université de Bordeaux, FranceReviewed by:
Florane Le Bihanic, UMR 5805 Environnements et Paléoenvironnements Océaniques et Continentaux (EPOC), FranceAurore Zalouk-Vergnoux, Université de Nantes, France
Copyright © 2020 Kaile, Lindivat, Elio, Thuestad, Crowley and Hoell. This is an open-access article distributed under the terms of the Creative Commons Attribution License (CC BY). The use, distribution or reproduction in other forums is permitted, provided the original author(s) and the copyright owner(s) are credited and that the original publication in this journal is cited, in accordance with accepted academic practice. No use, distribution or reproduction is permitted which does not comply with these terms.
*Correspondence: Ingunn Alne Hoell, aW5ndW5uLmhvZWxsQGh2bC5ubw==