 Morgane Travers-Trolet
 Pierre Bourdaud
 Mathieu Genu3
- 1Ifremer, EMH, Rue de l’Île d’Yeu, Nantes, France
- 2Laboratoire des Sciences de l’Environnement Marin (LEMAR), IUEM Technopôle Brest-Iroise, Plouzané, France
- 3Observatoire PELAGIS, UMS 3462, CNRS-La Rochelle Université, La Rochelle, France
- 4MARBEC, Univ. Montpellier, CNRS, Ifremer, IRD, Montpellier, France
In Europe, implementation of sustainable fisheries management has been reinforced in the latest common fisheries policy, and presently marine fish stocks are mostly managed through assessment of their exploitation and ecological status compared to reference points such as Maximum Sustainable Yield (MSY). However, MSY and its associated fishing mortality rate FMSY are sensitive to both stock characteristics and environment conditions. In parallel, climate change impacts are increasingly affecting fish stocks directly and indirectly but might also change the exploitation reference points and the associated level of catch. Here we explored the variability of MSY reference points under climate change by using a multi-species model applied to the Eastern English Channel, a highly exploited semi-continental sea. The spatial individual-based OSMOSE explicitly represents the entire fish life cycle of 14 species interacting through size-based opportunistic predation. The model was first parameterized and run to fit the historical situation (2000–2009) and then used to assess the ecosystem state for the 2050–2059 period, using two contrasting climate change scenarios (RCP 4.5 and RCP 8.5). For each condition, a monospecific MSY estimation routine was performed by varying species fishing mortality independently and allowed estimation of reference points for each species. The FMSY estimated with OSMOSE were mostly in accordance with available values derived from stock assessment and used for fishing advice. Evolution of reference points with climate change was compared across species and highlighted that overexploited cold-water species are likely to have both MSY and FMSY declining with climate warming. Considering all species together, MSY under RCP scenarios was expected to be higher than historical MSY for half of them, with no clear link with species temperature preferences, exploitation status or trophic level, but in relation with expected change of species biomass under climate change. By contrast, for 80% of cases FMSY projections showed consistent decreasing pattern as climate conditions changed from historical to RCP scenarios in the Eastern English Channel. This result constitutes a risk for fisheries management, and anticipation of climate change impacts on fish community would require targeting a smaller fishing mortality than FMSY to ensure sustainable exploitation of marine stocks.
Introduction
Sustainable fisheries management has been advocated worldwide for decades, with several milestones reinforcing this principle. Adopted by more than 17O Members of the Food and Agriculture Organization of the United Nations (UN) in 1995, the Code of Conduct for Responsible Fisheries provides principles applicable to the conservation, management and development of all fisheries and aims at promoting sustainable development and exploitation of world fisheries (Food and Agriculture Organization [FAO], 1995). The 2002 World Summit on Sustainable Development held at Johannesburg reaffirmed the necessity of continuing efforts toward sustainable development of the oceans and ecosystem approach for fisheries management. Particularly, UN member states committed themselves to maintain or restore fish stocks to a level that can produce their maximum sustainable yield (MSY) no later than 2015 (Froese and Quaas, 2013). This decision has been implemented in Europe through the 2013 reform of the Common Fisheries Policy (CFP; European Union [EU], 2013), in which a sustainable exploitation rate corresponding to MSY should be achieved by 2015, or in 2020 at the latest depending on the socio-economic context of the stocks considered (Salomon et al., 2014). The same reference point is used as one of the primary criteria to assess the good environmental status of commercially exploited fish and shellfish under the descriptor 3 of the Marine Strategy Framework Directive (MSFD, European Commission, 2017).
The concept of optimum or maximum yield started to be presented as management objective in the middle of the 20th century (Mesnil, 2012), but MSY was not specifically used as reference point for fishery management in European Union (EU) prior the 2013 CFP reform. MSY is defined as the largest yield that can be continuously taken on average from a stock under average environmental conditions without affecting significantly the reproduction process. The fishing mortality rate FMSY is the level at which average yield is equal to MSY, and corresponds to the target reference point explicitly mentioned in the CFP (European Union [EU], 2013). FMSY is a manageable target reference point directly linked to fishing effort in contrast to biomass reference points that are also influenced by the ecosystem state. However, reaching FMSY does not imply that fish stocks are truly exploited at levels allowing MSY as other factors than fishing pressure can affect stock dynamics and status.
In EU, operational FMSY values are mainly estimated by ICES (International Council for the Exploration of the Sea) working groups using monospecific stock assessment models. Estimations of current stock status and reference points are based on analysis of catch/biomass time series, and life history characteristics such as population growth rates and stock–recruitment relationships. Furthermore, models used for stock assessment typically assume constant values of factors not explicitly considered in the models, such as trophic interactions or abiotic environment (ICES, 2019). Reviewing the effects of fisheries-induced evolution on life-history traits and resultant stock properties, Heino et al. (2013) highlighted the possible change these effects can have on reference points. They particularly noted that FMSY was expected to increase through fisheries-induced evolution, while MSY change was ambiguous. As environmental conditions are expected to drift from the historical mean due to climate change, fishing reference points estimated under average conditions might be inappropriate under future climate conditions (Perry et al., 2010). Using scenarios of temperature increase on North Sea cod (Gadus morhua), Kell et al. (2005) showed that reference points based on fishing mortality were more robust to uncertainty about dynamic processes and future conditions than those based on biomass. Specifically FMSY was found not to be affected by changes in carrying capacity, but was found to decrease when temperature increased, resulting in decreased juvenile survival. To compensate the possible evolution of reference points, ICES considers MSY reference points to be valid only in the medium term, and regularly assesses the validity of the estimations through regular reviews (ICES, 2019). During benchmarks (classically every 5 years), data sources, stock-assessment model and assumptions are updated to include possible evolution of abiotic (e.g., habitat), biotic (e.g., trophic interactions and predation mortality) and exploitation conditions (e.g., fishing selectivity). This pragmatic approach allows producing advice and reference points in a dynamic mode, however, anticipation of future evolution of reference points would make fisheries management more sustainable.
Here we aim at exploring how fishing reference points would evolve under climate change, and if general patterns emerge that could be used in anticipation for fisheries management. To do so, we applied the multi-species model OSMOSE to an exploited shallow sea ecosystem and estimate FMSY for several species in different long term abiotic conditions. This model has been successfully applied to a variety of ecosystems, such as upwellings (e.g., Marzloff et al., 2009; Travers-Trolet et al., 2014a), estuaries (e.g., Brochier et al., 2013), semi-enclosed seas (Fu et al., 2012) and shelf seas (e.g., Grüss et al., 2015; Halouani et al., 2016), and has been used for addressing various objectives. Particularly OSMOSE has been used for exploring combined effects of fishing and climate on the food web (Travers-Trolet et al., 2014b; Fu et al., 2018), management strategy evaluation of total allowable catch strategies (Grüss et al., 2016) and for exploration of multi-species reference points (Briton et al., 2019; Guo et al., 2019). It was also used to investigate sensitivity of various ecosystem indicators to fishing or environmental conditions (Travers et al., 2006; Shin et al., 2018), but it has never been used to explore the evolution of management reference points under climate change projections.
Materials and Methods
Eastern English Channel Fish Community Modeled With OSMOSE
Object-oriented Simulator of Marine Ecosystems (OSMOSE) is a spatial multispecies size-structured model based on opportunistic predation between a predator and its prey (Shin and Cury, 2001, 2004; Travers et al., 2009)1. This individual-based model represents the whole life cycle of several fish species from eggs and larvae up to juveniles and adults. Each individual element corresponds to a “school” or super-individual of identical fish, i.e., of the same size, same age, same trophic level (TL), same location and belonging to the same species. At each time step of 2-weeks schools undergo different processes: foraging movement, interactions with the environment and other schools (resulting in explicit predation and several sources of mortality: predation, starvation and fishing mortalities, and residual mortality due to causes not explicitly modeled), growth and reproduction. Opportunistic predation relies on spatio-temporal co-occurrence and size adequacy between a predator and its prey, which allows food web structure not to be fixed but to emerge from local trophic interactions between schools (Travers-Trolet et al., 2019). Fishing pressure is modeled through a species-specific fishing mortality rate F that can vary temporally and/or spatially according to available knowledge and which affects only recruited fish (here a knife-edge selectivity was used, i.e., only fish older than the species age at recruitment were caught). An extended description of the OSMOSE model and its parameterization is available as Supplementary Material S1 and Supplementary Table S1.
OSMOSE has been applied to the Eastern English Channel (EEC) to better understand the trophic functioning of this shallow-water sea ecosystem, by explicitly representing 14 species which constitute 80% of the international landings from this area (ICES area 7d, excluding invertebrates), more than two-thirds of the fish biomass sampled during the scientific bottom trawl Channel Ground Fish Survey (CGFS, Coppin et al., 1988) and represent important trophic groups. This set of species is composed of mackerel (Scomber scombrus), horse mackerel (Trachurus trachurus), sardine (Sardina pilchardus), herring (Clupea harengus), poor cod (Trisopterus minutus), North Sea cod, whiting (Merlangius merlangus), pouting (Trisopterus luscus), striped red mullet (Mullus surmuletus), dragonet (mostly Callionymus lyra), lesser spotted dogfish (Scyliorhinus canicula), sole (Solea solea), plaice (Pleuronectes platessa), and squids (Loligo forbesii and Loligo vulgaris). This high TL community can additionally feed on spatially and temporally variable biomass prey fields of both pelagic and benthic resource groups coming from the forcing ECO-MARS3D biogeochemical model (Vanhoutte-Brunier et al., 2008; Le Goff et al., 2017). OSMOSE has been parameterized to represent the average state of the EEC ecosystem over the period 2000–2009 using biological parameters from the literature and information derived from surveys (Travers-Trolet et al., 2019; Supplementary Table S1). The model was then calibrated with an automatic evolutionary algorithm (Oliveros-Ramos et al., 2017) during which the remaining unknown parameters were tuned in order for the simulated biomass and catch to approach the values observed over 2000–2009. Plankton accessibilities, larval mortalities (applied at the first time step only, i.e., when organisms are 2 weeks old) and fishing mortalities (applied to all fish older than recruitment age) have been adjusted during this phase. Observed catches have been extracted from the ICES Fisheries Statistics official database (ICES, 2011a) for the ICES area 7d (corresponding to the EEC) over the period 2000–2009. Total stock biomass estimates were not available for all species. They came directly from stock assessment reports for sole and plaice (ICES, 2011b), while for whiting, North Sea cod, mackerel and herring, total stock biomass estimates were derived from stock assessments covering a wider area (ICES, 2011b, 2012) and were therefore scaled to the EEC proportionally to the relative landings in this area. Finally, the EEC OSMOSE application was validated using independent data, i.e., neither used during parameterization nor calibration. Simulated mean TL per species and pattern of TL evolution with size were similar to trophic observations available in the EEC during the same period (Travers-Trolet et al., 2019).
Climate Change Scenarios
Projections of the fish community under climate change were performed using two contrasting greenhouse gas concentration scenarios for which downscaled biogeochemical runs were available regionally (CERES, 2018). The scenarios are the Representative Concentration Pathway (RCP) 4.5 and RCP 8.5 used by the Intergovernmental Panel on Climate Change (IPCC, 2014), which correspond at the EEC scale to an averaged increase of sea temperature of respectively +0.24 and +0.83°C at the 2050–2059 horizon compared to the historical state (13.11°C in average over 2000–2009). The 2050–2059 time frame corresponds to mid-term projections, i.e., a compromise far enough in the future to perceive the impacts of climate change on the ecosystem, but close enough for fisheries management tools (reference points) to stay relevant. As temperature is not explicitly integrated in the formulation of OSMOSE processes, effects of global warming were simulated through the modification of parameters of several processes classically impacted by climate change (Scheffers et al., 2016). Primary and secondary productions were slightly decreased, following the projections of the downscaled POLCOMS-ERSEM biogeochemical model (Butenschön et al., 2016) available for the North East Atlantic. Growth parameters were modified following Kielbassa et al. (2010) approach, either through an increase or decrease of the parameters depending on the optimal temperature computed for each species, the historical temperature and the projected temperature of the RCP scenarios. Reproduction phenology was advanced depending on the cumulated degree × day duration in each scenario (resulting in earlier reproduction season, up 14 days in advance depending on the scenario and the species considered). Spatial distribution was only impacted for species in their southern boundaries of distribution (North Sea cod, whiting, herring, and plaice), by cutting their spatial distribution according to thermal clines for both scenarios. Details on the references used and computations realized to change parameters values and on the resulting ecosystem response to climate change simulated with OSMOSE can be found in Genu (2017) and Supplementary Material S2.
To assess the importance of species sensitivity to temperature in the possible evolution of reference points under climate change, a temperature status was computed for each species relative to their optimal temperature Topt (Eq. 1).
where Thist is the reference state of the historical EEC temperature equal to 13.11°C.
According to this metric, species with a temperature optimum smaller than the current temperature, i.e., susceptible to negative impact from warming, were North Sea cod, herring, whiting, and to a lesser extent plaice, mackerel, lesser spotted dogfish, striped red mullet and poor cod. Species with a relatively high optimal temperature were squids, sardine, sole, pouting, dragonet and horse mackerel (Table 1 and Supplementary Table S2).
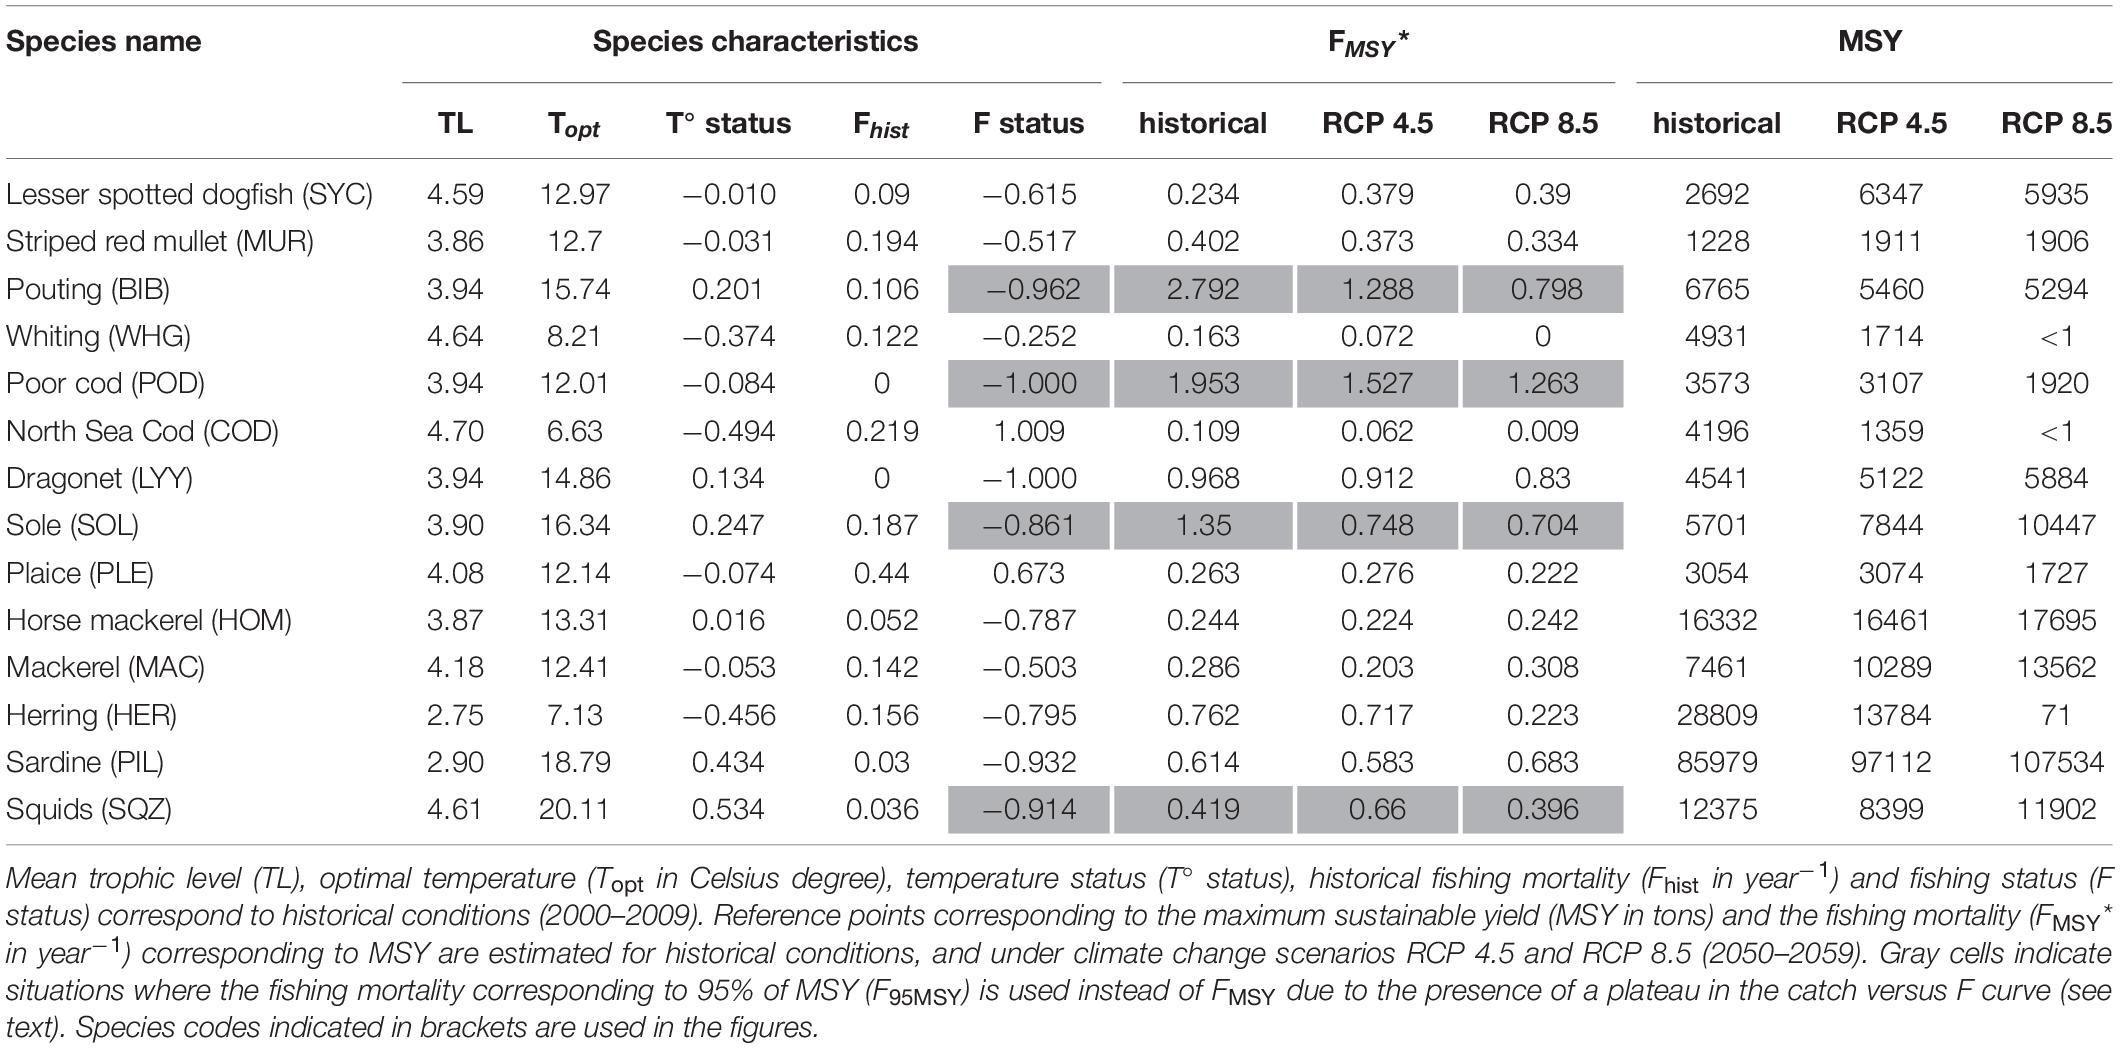
Table 1. Species characteristics and reference points estimated under different conditions.
Estimation of MSY Reference Points
Maximum Sustainable Yield reference points were estimated for each species by analyzing the simulated catch obtained for a wide range of fishing mortality rates F. The F space is explored regularly from 0 to 0.5 year–1 or up to 5 year–1 depending on species (resulting in about 100 F values for each species, see Supplementary Material S4). This exploration was performed for each species independently, i.e., while the F values of the species of interest were modified the F values of other species were kept constant at their historical levels. For each value of fishing mortality, 30 replicates were run as OSMOSE is a stochastic model and the corresponding simulated catches were saved. To determine the maximal catch corresponding to MSY and the associated annual fishing mortality rate (FMSY), local polynomial regressions were adjusted to catch data points using the loess function in R (Briton et al., 2019).
To investigate the possible importance of the current exploitation status compared to MSY in the evolution of reference points under climate change, a fishing status was computed for each species (Eq. 2) based on the relative difference between the historical Fhist value (corresponding to the calibrated values over the 2000–2009 period) and FMSY determined as previously described.
For some species the yield versus F curve can display a plateau rather than the classic dome-shape curve. To deal with this pattern, Briton et al. (2019) computed the yield at 98% of the MSY as it usually corresponds to the beginning of the plateau in their study. Here we used a similar approach: the yield at 95% of MSY was computed and used to derive the corresponding fishing mortality (F95MSY). This percentage corresponds to the precautionary approach followed by ICES when providing advice on F ranges from stock assessment (ICES, 2016).
First, the MSY computation procedure was applied under historical (2000–2009) conditions, to determine current MSY, FMSY and F95MSY as well as fishing status for all species. The same procedure was then applied under climate change (2050–2059) conditions, using RCP scenarios as described above, to estimate the reference points for all species under two scenarios of climate change.
Results
MSY Estimation Under Historical Period
A total of 40050 simulations (including replicates) were run on a super-computer to compute MSY reference points for all species under historical conditions (Table 1). For most species, the relationship between catch and F followed a dome shape curve of variable width (Figure 1). However, for few species (pouting, poor cod, sole and squids) a plateau was observed as F increased. While the estimate of MSY remains valid in case of a plateau, the value obtained for FMSY is highly variable and depends on the regression function used. Therefore, F95MSY is more reliable and was used as reference point and for the computation of F-status for these four species (Table 1).
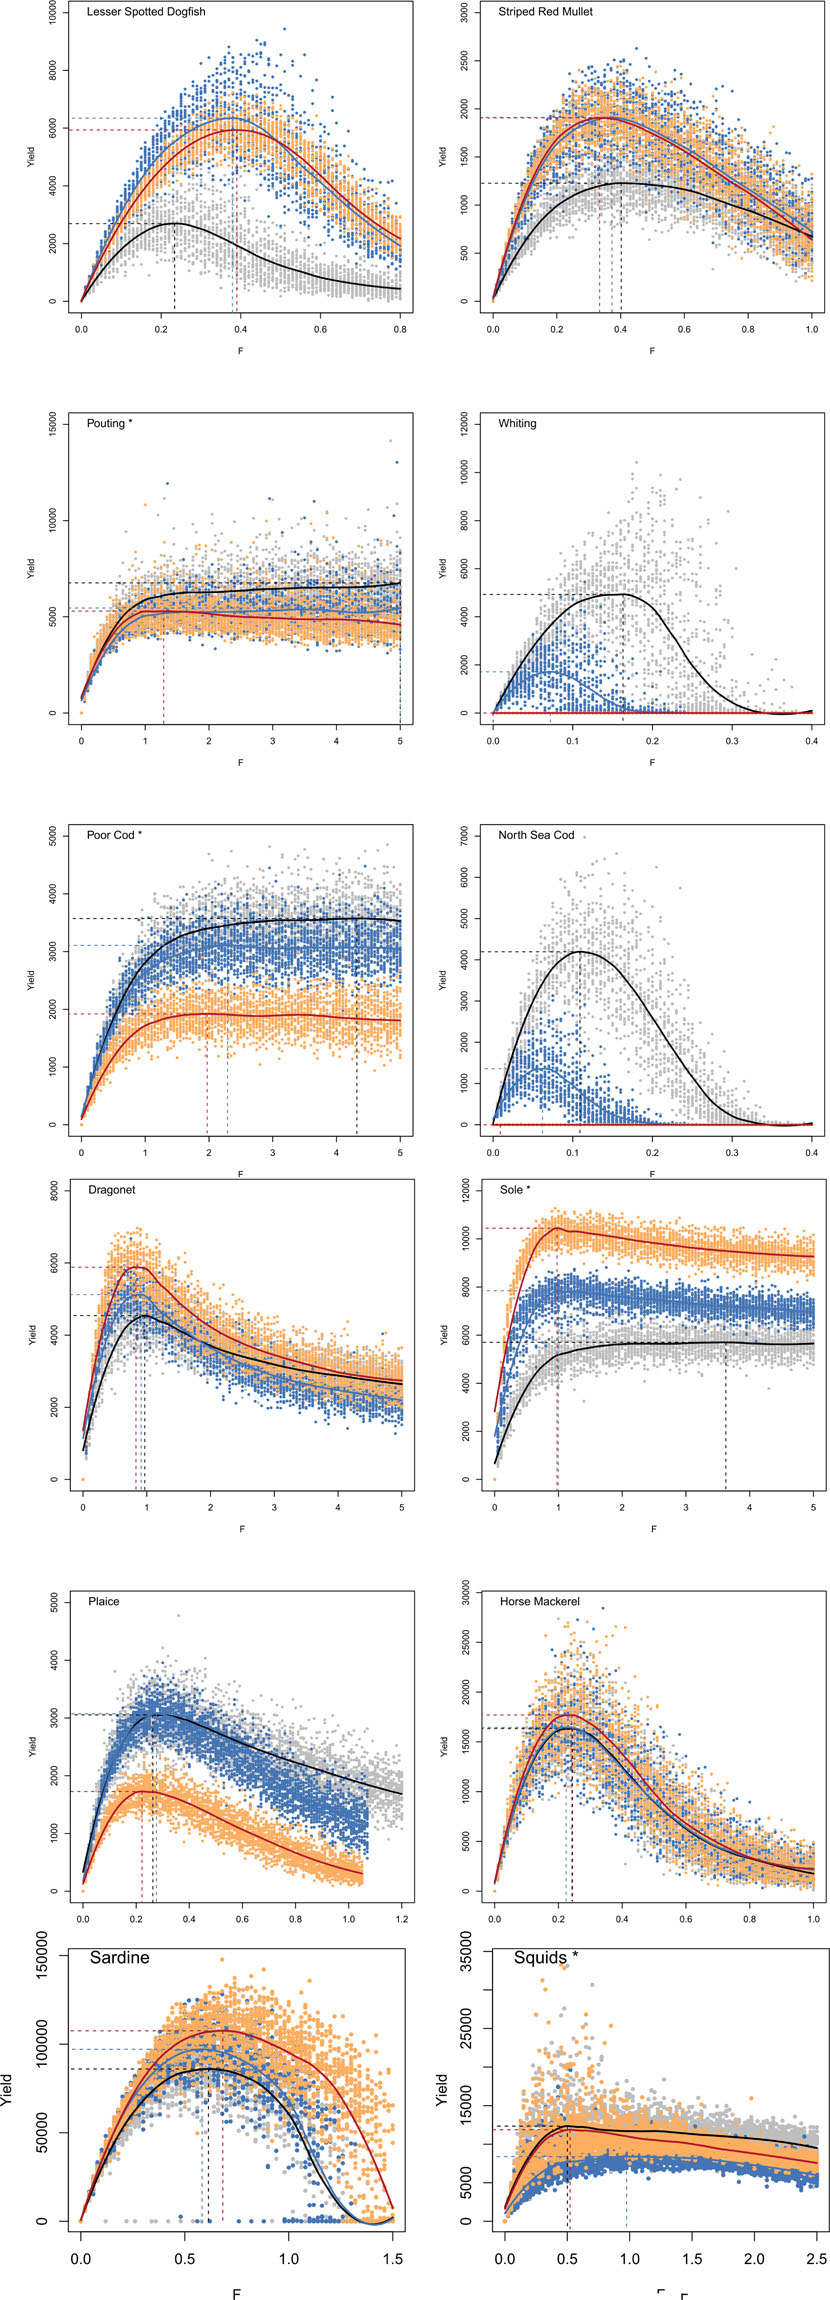
Figure 1. Evolution of yield with fishing mortality rate (F) for each species, under historical conditions (gray and black), and under climate change scenarios RCP 4.5 (blue) and RCP 8.5 (orange and red). Dots correspond to the simulated yield (using 30 replicates) and the line corresponds to the adjusted loess function. Horizontal dashed lines indicate MSY, and vertical dashed lines indicate FMSY for most species and F95MSY for species for which the curve shows a plateau (indicated by * next to species name).
According to the FMSY estimates determined using OSMOSE, most species were under-exploited (negative F status) during the 2000–2009 period. The two over-exploited species, i.e., having a fishing mortality rate over 2000–2009 higher than the reference point FMSY, were North Sea cod and plaice. Absolute values of reference points derived from single stock assessments cannot be compared directly to estimates determined in this study because the models used largely differ, but relative values can be helpful. Only few species inhabiting the EEC are assessed by ICES stock assessment groups at a level allowing MSY estimation. Analysis of plaice stock assessment for the same area (ICES 7d) indicated that the fishing mortality averaged over 2000–2009 corresponded to 1.3 times the FMSY estimate (ICES, 2017, values reported in Supplementary Table S5). Using OSMOSE, historical fishing mortality of plaice were found to be 1.7 times the level of the reference FMSY. Sole was also found to be overfished in the ICES area 7d from stock assessment, with average fishing mortality rates being 1.43 times higher than FMSY (ICES, 2017). Conversely, in OSMOSE this species appeared to be exploited at a smaller level than MSY (Fhist corresponds to only 0.14 times F95MSY, the reference point preferably used as the catch versus F curve displayed a plateau). Stock assessment of North Sea cod performed over a broader area (ICES areas 4 and 7d), indicated that this stock was over-exploited with 2000s averaged fishing mortality rates being 2.7 times higher than FMSY determined via stock assessment (ICES, 2017). In OSMOSE, North Sea cod was also found to be overexploited, with a fishing mortality averaged over 2000–2009 corresponding to twice the FMSY. Finally, whiting was also assessed over the wider area ICES 4 and 7d and was estimated to be exploited during the 2000s at half the level of FMSY (ICES, 2017). Similarly in OSMOSE the exploitation level was found to be smaller than FMSY (0.75 times the reference value FMSY).
Evolution of MSY and FMSY Under Climate Change
Under RCP scenarios, the evolution of fish community structure was characterized by a strong decrease of cold-water species (North Sea cod, whiting, herring), especially under RCP 8.5 with North Sea cod and whiting collapsing in the EEC. Conversely, other species increased in biomass, notably lesser spotted dogfish, mackerel, striped red mullet and sole (Supplementary Table S3). Associated to these changes in species biomass, similar changes were simulated for species catch under climate change because fishing mortality rates were not modified compared to historical values. In the same vein, evolution of MSY reference points tends to scale with evolution of biomass (Figure 2A), except for lesser spotted dogfish for which the biomass increased by 1.5 under climate change was associated with an increase of MSY by more than 2. While species with a T° status smaller than −0.1 displayed a strong decrease in biomass under RCP scenarios, species with intermediate (between −0.1 and 0.1) and high T° status (higher than 0.1) showed either a decrease or increase in biomass, with no consistent pattern. Biomass changes under climate change were not directly linked to species T° status as the flexible trophic links of OSMOSE allowed multiple indirect effects of climate change. In contrast to MSY, FMSY evolution under climate change was not linked to changes in biomass of the associated species (Figure 2B). Again, except for species with low T° status which showed a decrease of FMSY under climate change, no link was evidenced between T° status and FMSY evolution. Under RCP scenarios, the species catch versus F curves displayed similar shape than under historical conditions, i.e., a plateau was observed for the same four species (Figure 1).
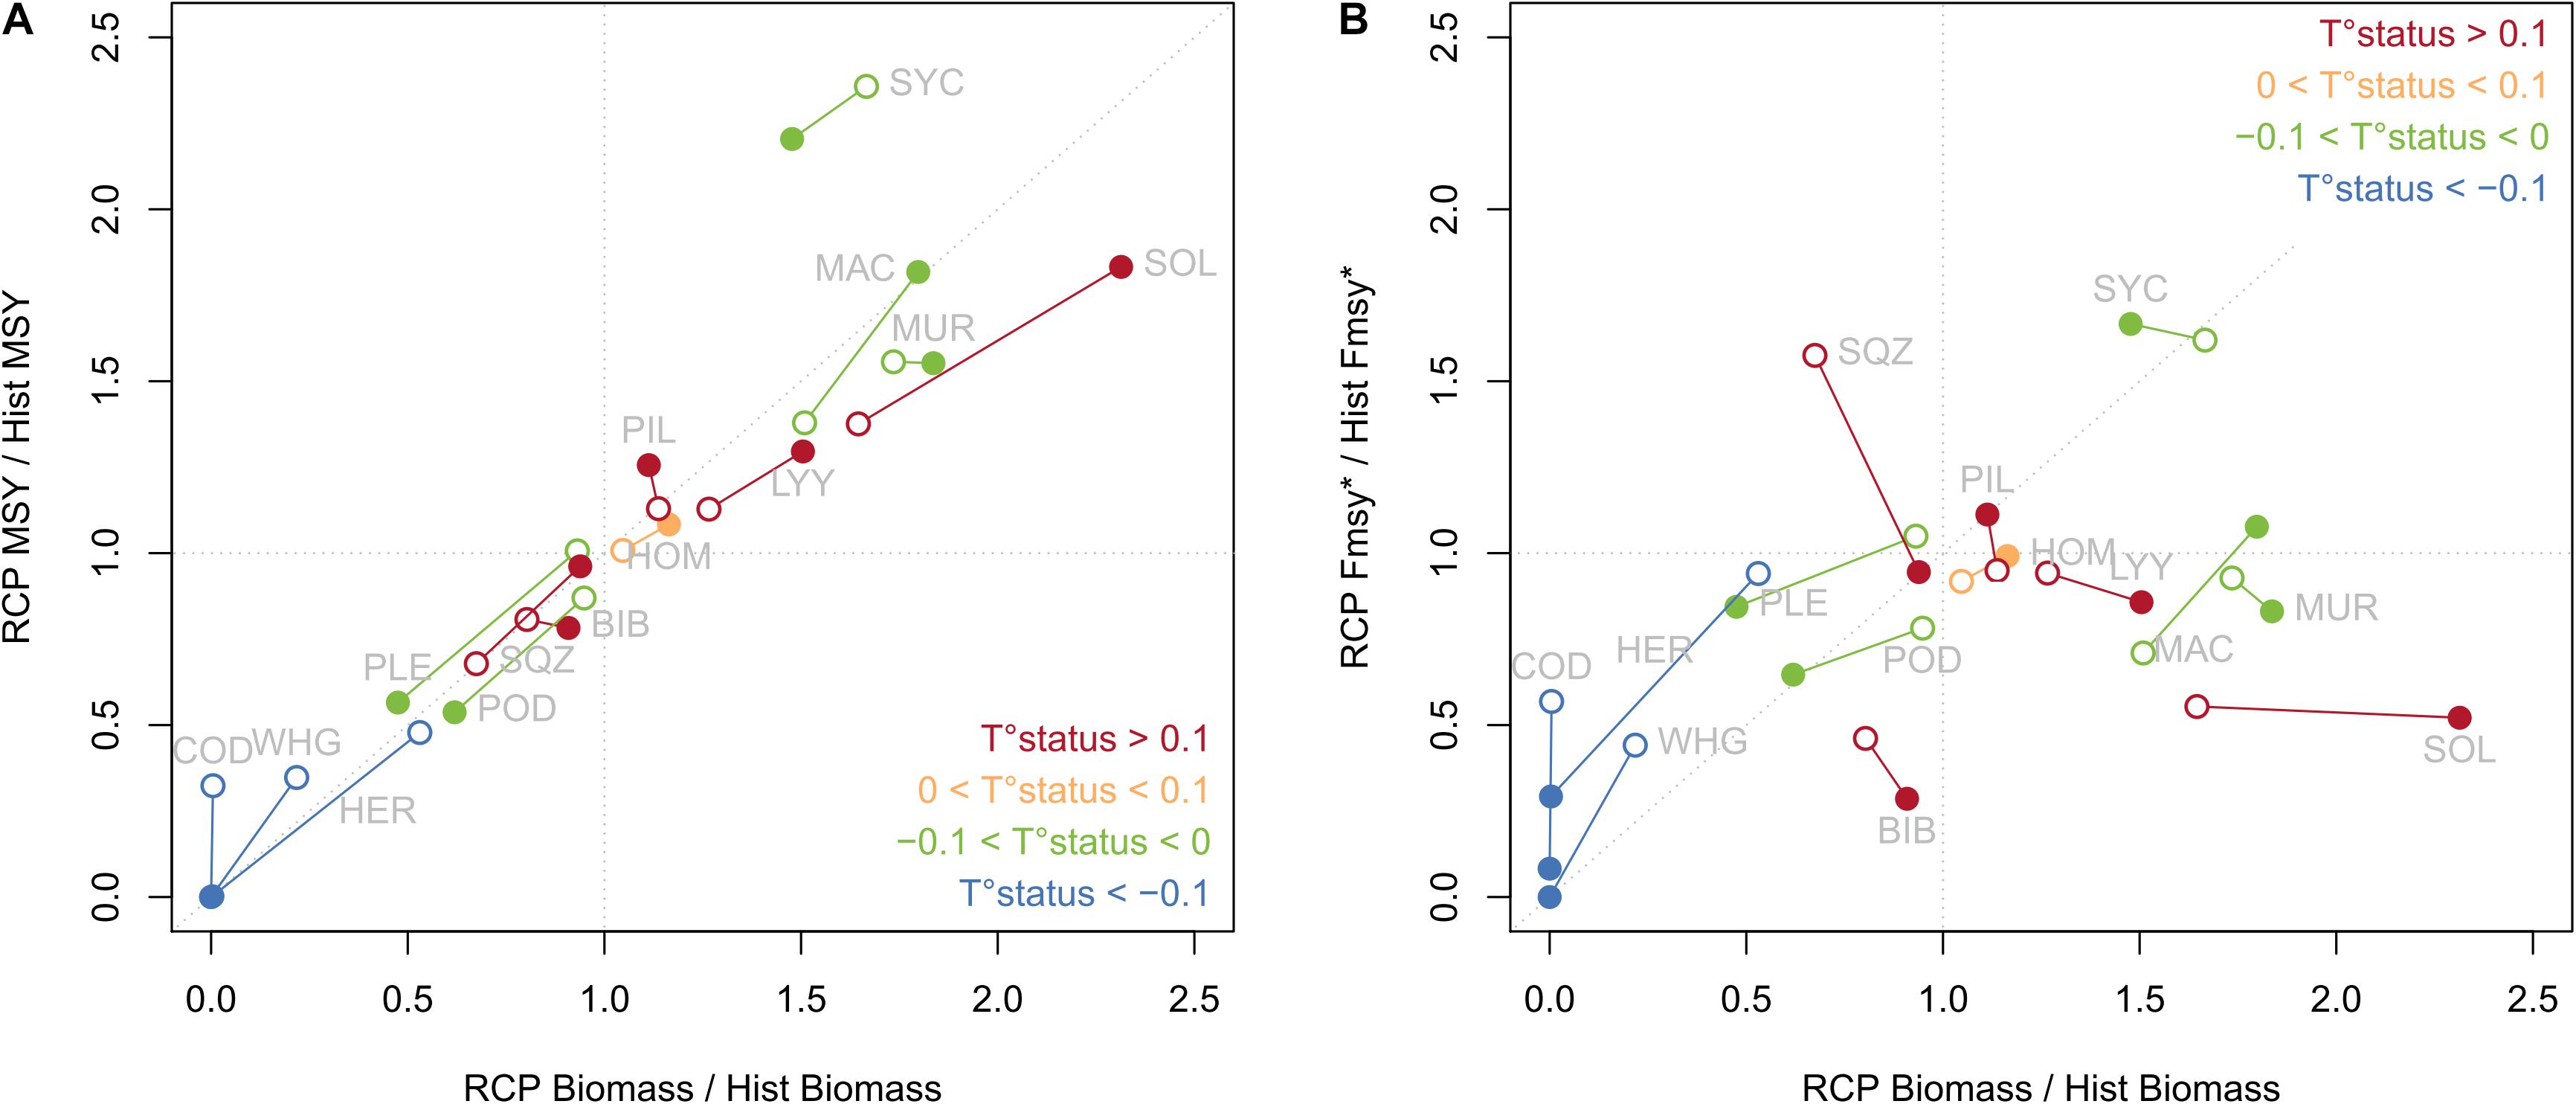
Figure 2. Evolution of MSY (A) and FMSY* (B) (corresponding to FMSY for most species, and to F95MSY for species displaying a plateau in their catch-F curve) under RCP 4.5 (open dots) and RCP 8.5 (filled dots) compared to historical values. Color of the dots indicates the T° status of the species. Species code name are explicit in Table 1.
The co-evolution of both MSY and FMSY reference points displayed different patterns for different species (Table 1). For instance, both MSY and FMSY decreased under climate change for North Sea cod and whiting, with an intensity proportional to warming. Conversely, both reference points increased for lesser spotted dogfish under climate change, but with little difference between the two RCP scenarios. For plaice, reference points were similar between historical state and moderate climate change (RCP 4.5), but decreased under stronger warming (RCP 8.5). Under RCP 4.5, FMSY for striped red mullet did not change much, but it was associated with higher MSY. Reference points for horse mackerel showed very little evolution under climate change, whatever the scenario considered.
To explore the evolution of reference points globally under climate change, relative changes of MSY and FMSY compared to historical values were displayed on a biplot for each species (Figure 3). For most cases (79% i.e., for 22 cases in the 28 combinations of species and RCP scenarios), a decrease of FMSY was projected under climate change. Except for squids under RCP 4.5 (for which the catch-F curve showed a plateau and might provide less reliable estimates), no situation associated an increase of FMSY with a decrease of MSY. However, the opposite can be true, i.e., for sole, striped red mullet, dragonet for both scenarios but also for sardine and mackerel under RCP 4.5, climate change induced a decrease of FMSY associated with an increase of MSY. It is worth noting that evolution of reference points under RCP 8.5 was not always a stronger evolution than the one simulated for RCP 4.5, and changed sometimes in the opposite direction. For instance, FMSY for mackerel decreased under RCP 4.5 but increased under RCP 8.5, MSY of lesser spotted dogfish increased strongly between RCP 4.5 and historical level, but decreased between RCP 4.5 and RCP 8.5.
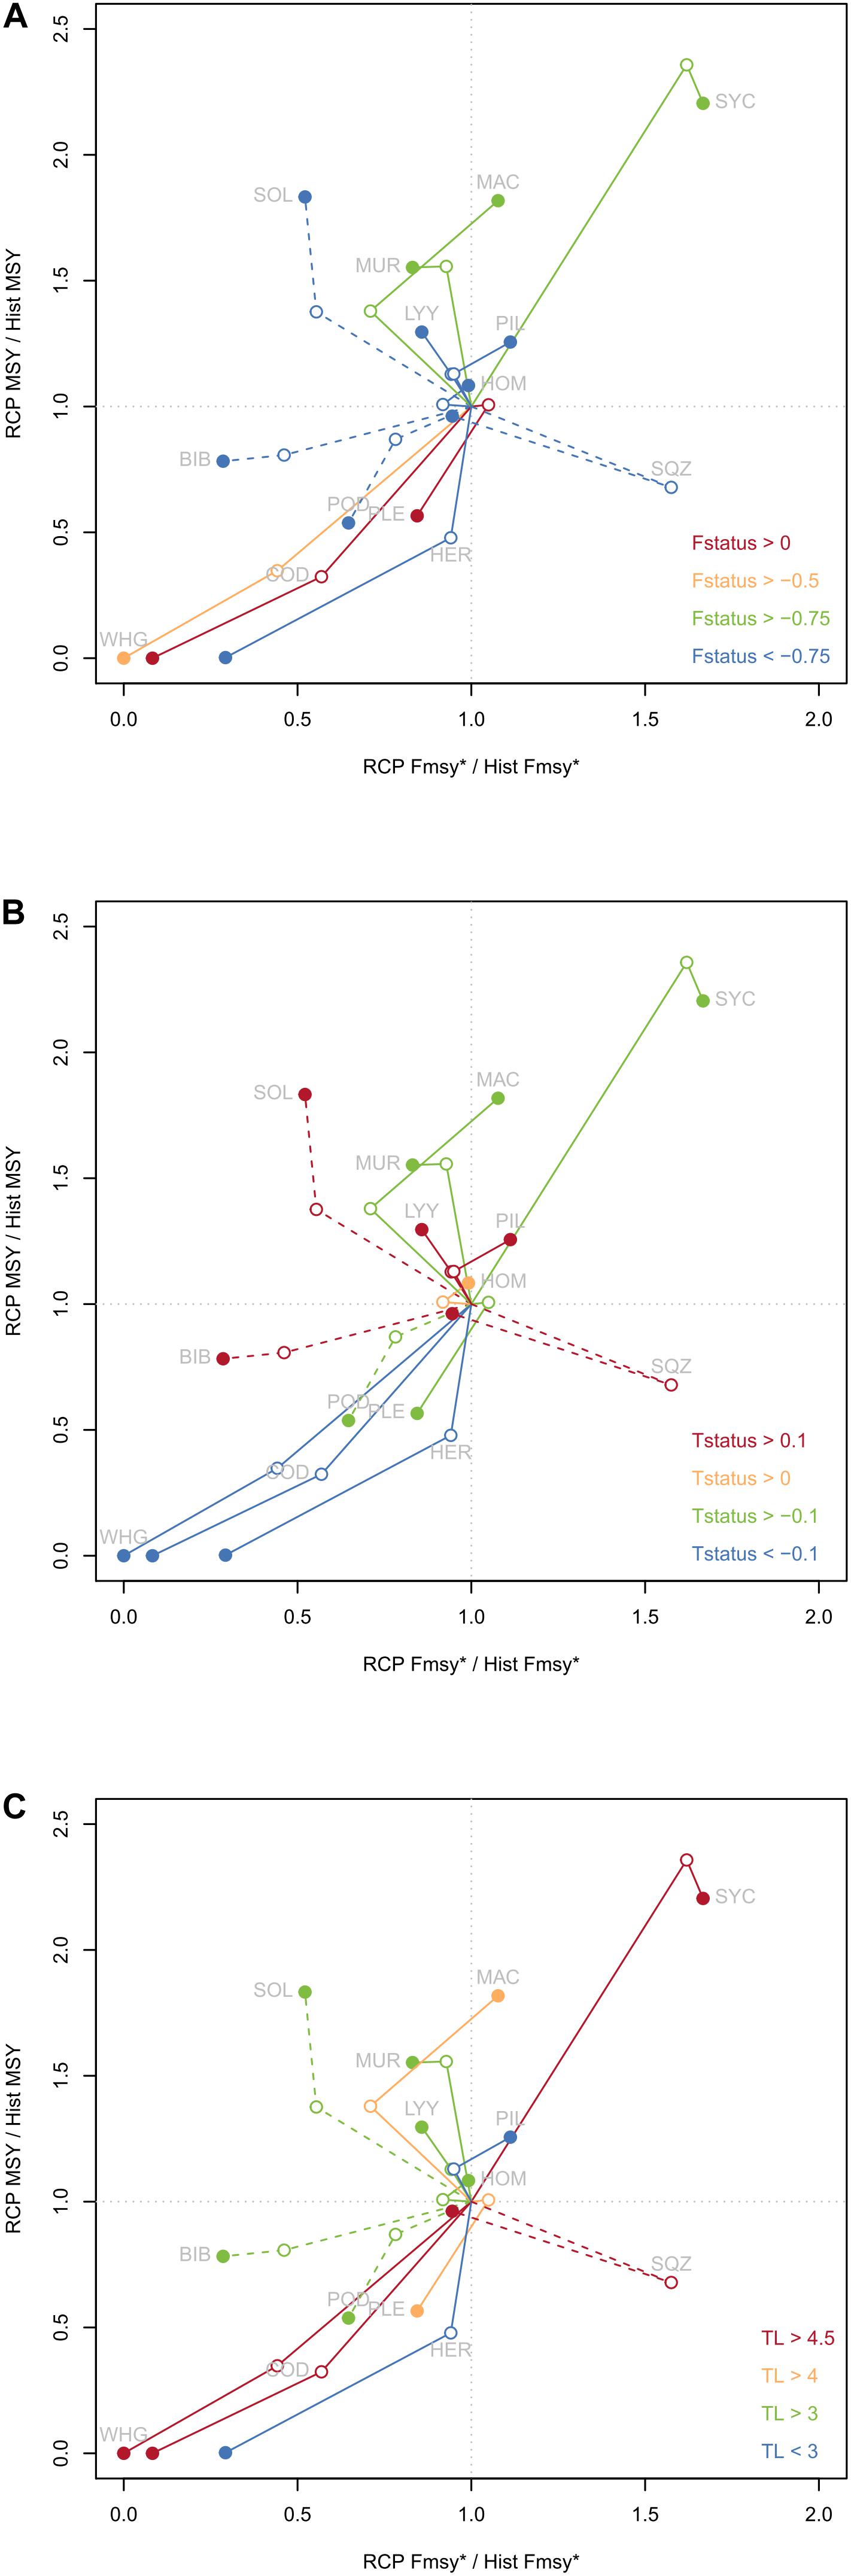
Figure 3. Evolution of reference points under climate change scenarios compared to historical values of reference points. Relative MSY is plotted on the y-axis. Relative FMSY* corresponds to relative FMSY for most species and to relative F95MSY for species displaying a plateau in their catch-F curve, and is displayed on x-axis. Dashed lines indicate those species. Historical references points are situated at coordinates (1,1) by construction, references points under RCP 4.5 are indicated by open dots and reference points under RCP 8.5 are indicated by filled dots. Colors are associated to species characteristics, either F status (A), T° status (B) or TL (C).
When considering the potential link between F status and evolution of reference points (Figure 3A), we found that for both overexploited species climate change induced a decrease of MSY and FMSY, but only under RCP 8.5 for plaice. For moderately exploited species such as whiting, a decrease of both reference points was also observed. However, for lightly exploited species, various directions of change of reference points were observed, from a decrease of both MSY and FMSY for herring to an increase of MSY but decrease of FMSY for striped red mullet and to an increase of both reference points (lesser spotted dogfish). The analysis of reference points evolution according to T° status (Figure 3B) showed that for cold water species (high negative T° status) both reference points decreased under global warming. Conversely, warmer water species (with high positive T° status) seemed to display a small increase of MSY under climate change, and no clear direction for FMSY (small increase for sardine, small decrease for dragonet). No clear pattern emerged from species with intermediate values of T°status. Finally, the consideration of species TL (Figure 3C) did not allow identifying trophic groups for which reference points would behave the same, but conversely illustrated some balance within the ecosystem: when reference points of predators North Sea cod and whiting decreased, reference points of another predator (lesser spotted dogfish) increased. Similar balance was observed for planktivorous species (sardine and herring, TL < 3). For intermediate TL species, this pattern was dampened, probably due to the numerous complex interactions linking the species at the center of the food web.
Discussion
The expected evolution of reference points under climate change is not mono-directional and depends on species considered. MSY evolution appears to be strongly linked to species biomass evolution, which cannot be derived a priori from temperature preference of fish species. Indeed, climate change is applied on several processes within OSMOSE (Genu, 2017; Supplementary Material S2) and the representation of the full life cycle coupled with the multiple and flexible trophic links between fish individuals allows simulations of both direct and indirect effects of climate change, leading to unpredictable species biomass evolution. This results in expected decrease of MSY under climate change for half of the modeled species. Both directions of change of MSY have been reported with observed increasing temperature and have been projected under climate change scenarios. When analyzing the evolution of MSY with historical temperature for 235 populations worldwide, Free et al. (2019) showed that MSY increased for nine populations and decreased for 19 populations. This decrease was particularly observed for populations inhabiting the North Sea, a neighbor ecosystem to the EEC, and for species that had experienced overfishing, warming and were located at the warm ends of their thermal niches (Free et al., 2019). Another time series analysis realized in the North Sea emphasized that MSY of five planktivorous species have been halved between the late 1970s and the most recent period, illustrating this time a common decrease of forage fish productivity probably induced by a precedent shift in plankton community (Clausen et al., 2018) that have been linked to temperature (Beaugrand et al., 2003). Complementary to time series analysis, studies using projections of ecosystem under climate change give also contrasting results. Cheung et al. (2010) showed that the projected maximum catch potential (computed from estimated species MSY) under Special Report on Emissions Scenarios (SRES) scenarios was highly variable across regions and ranges from −20% for Indonesia EEZ to +45% for Norway EEZ, with almost no change for United Kingdom EEZ which includes part of the EEC. From projections under four recent RCP scenarios, total global MSY from almost a thousand stocks worldwide did not change markedly by 2100 on average, but showed enormous variation across stocks as 53% of stocks’ MSY decreased under RCP 4.5 and 91% under RCP 8.5 (Gaines et al., 2018).
Determining generalities of reference points’ response to climate change would be helpful for managers, as it would provide information required for anticipating future changes in their operational tool. From the relatively small amount of species modeled with OSMOSE it seems that cold-water species will undergo a decrease in both reference points, but for temperate species no pattern can be identified. Exploitation status might have a role as well, as overexploited species also undergo a decrease in both reference points. Even with a limited number of species considered this study shows that overexploited cold-water species are likely to have both their reference points declining with climate warming. This result concurs with conclusions from Free et al. (2019) concerning MSY only. Additional general patterns involving both reference points were not evidenced in this study, especially regarding temperate species. However, conversely to the diversity of MSY responses to climate change, FMSY projections considered alone show more consistent decreasing pattern in the EEC under RCP scenarios. The few cases (20%) in which FMSY was found to increase concern lesser spotted dogfish, mackerel and sardine, which are moderately exploited and temperate to warm species. Consistent decrease of FMSY with increasing temperature was also observed from time series analysis of five planktivorous fish in the adjacent North Sea (Clausen et al., 2018). When studying possible response of North Sea cod reference points to warming, Kell et al. (2005) illustrated that FMSY was expected to decrease as temperature increases. These studies combined to our results reinforced the main pattern obtained here, that fishing reference point FMSY is expected to decrease under global warming for a variety of stocks.
Climate-induced decrease of FMSY constitutes a big risk for managers and sustainability of stocks. Even if this fishing reference point is currently used as a management target in EU and supposedly reached by 2015 (European Union [EU], 2013), current fishing mortality rate remains higher than FMSY for 64% of the 397 stocks in EU therefore indicating their overexploitation (Froese et al., 2018). This percentage goes down to 44% when considering only the greater North Sea ecoregion (45 stocks) to which the EEC pertains, a value still illustrating that sustainable exploitation of this ecosystem is not reached yet. In this context, the risk for managers is that the fishing reference points they are targeting (and having difficulties to reach) when reducing fishing pressure will decrease under climate change, and therefore will prevent the sustainable exploitation of stocks. Positive expected consequences of fishing at FMSY such as highest average yield fishers can expect would not be observed as warming would have change the reference values, and might discourage effort to further reducing the fishing pressure. To ensure sustainable fisheries, managers need to be proactive regarding effects of climate change, and should start targeting fishing mortalities smaller than FMSY. Such recommendations have already been proposed, but for other objectives. Targeting only a “pretty good yield”, i.e., corresponding to 80% of MSY as proposed by Hilborn (2010), allows reasonably high yields for fishers and other beneficial outputs linked to the multiple objectives of most fisheries management. This is particularly true for mixed-fisheries, i.e., when several species are caught together and their respective MSY cannot be reach concomitantly (Rindorf et al., 2017; Ulrich et al., 2017). Using the FMSY reference points as a limit rather than a target, i.e., aiming at keeping the fishing mortality rate lower than FMSY, or targeting a reference point lower than FMSY would be precautionary both in case of technical interactions between stock (mixed fisheries) and in case of climate change anticipation.
Mechanistic multispecies model such as OSMOSE represent a useful framework to explore response of management tools such as FMSY to different modalities of ecosystem state usually considered constant in stock assessment models. The model provided good estimates of relative reference points when compared to stock assessment output. The occurrence of a plateau in the yield to fishing mortality curve for four species tempered the overall good representation of stocks dynamics, even though a plateau is also observed sometimes using stock assessment models. Typically, fishing selectivity curve affects the shape of the yield to fishing mortality curve (and the values of reference points), and asymptotic selectivity can result in the presence of a plateau (Scott and Sampson, 2011). In the present study, two main hypotheses can explain the occurrence of a plateau. First, growth depends on food availability, and under abundant food conditions, some individuals can reach maturity size long before reaching recruitment age. These individuals would have time to reproduce before being caught by fishing, preventing population collapse under high fishing mortality rates. Second, fishing pressure was modeled in a simple way, with a knife-edge selectivity and therefore a constant fishing mortality rate applied to all individuals older than the specified age at recruitment. Further developments implementing several fishing fleets and associated size selectivity curves would allow identifying if a plateau would persist under more realistic modeling choices, and would be useful for integrating technical interactions in the exploration of MSY behavior to climate change. Here we used a monospecific procedure to estimate MSY reference points, even if we used a multi-species model with predation interactions, because they correspond to the target of the CFP (European Union [EU], 2013). However, alternatives could be studied, such as the concomitant estimation of MSY for a set of interacting species (Nash equilibrium between FMSY reference points, Thorpe et al., 2017) and/or multispecies MSY (MMSY) or other system-wide reference points (Moffitt et al., 2016). Because they integrate part of the complexity of marine system, ecosystem models are useful to investigate how fishing and climate change combined themselves when impacting fish communities, and if one increases the sensitivity of marine ecosystems to the other (Perry et al., 2010). Moving toward more sustainable and ecosystem-based management of fisheries can rely on ecosystem models to better anticipate changes to come and ensure the pertinence and reliability of reference points used in management. Considering uncertainty attached to model results is the next step in this direction as it would increase transparence, credibility and therefore usefulness of ecosystem models for fisheries advice (Lehuta et al., 2016). Identifying which parameters are the most influential on model output allows prioritizing research toward reduction of model uncertainty (e.g., more accurate estimation of model parameters) and better understanding of model structure and error propagation (Bracis et al., 2020; Xing et al., 2020).
Data Availability Statement
The raw data supporting the conclusions of this article will be made available by the authors, without undue reservation to any qualified researcher.
Author Contributions
MT-T designed the study, ran the model, and analyzed and interpreted the results. PB, MG, LV, and YV contributed to the results analysis and interpretation. MG provided parameters related to climate change scenarios. LV helped to running the MSY estimation procedure. MT-T led the drafting of the manuscript with the contributions and revisions from all the authors. All authors contributed to the article and approved the submitted version.
Conflict of Interest
The authors declare that the research was conducted in the absence of any commercial or financial relationships that could be construed as a potential conflict of interest.
Funding
This work has been partially funded by the BiodivErsA and Belmont Forum project SOMBEE (BiodivScen programme, ANR contract n°ANR-18-EBI4-0003-01), and by the French Government and the region Hauts-de-France under the framework of the project CPER 2014-2020 MARCO. We acknowledged the “Pôle de Calcul et de Données Marines” (PCDM, http://www.ifremer.fr/pcdm) for providing DATARMOR storage and computational resources. The POLCOMS-ERSEM projections under RCP scenarios were produced with funding from the European Union Horizon 2020 Research and Innovation Programme under grant agreement no. 678193 (CERES, Climate Change and European Aquatic Resources).
Supplementary Material
The Supplementary Material for this article can be found online at: https://www.frontiersin.org/articles/10.3389/fmars.2020.568232/full#supplementary-material
Footnotes
References
Beaugrand, G., Brander, K. M., Lindley, J. A., Souissi, S., and Reid, P. C. (2003). Plankton effect on cod recruitment in the North Sea. Nature 426, 661–664. doi: 10.1038/nature02164
Bracis, C., Lehuta, S., Savina-Rolland, M., Travers-Trolet, M., and Girardin, R. (2020). Improving confidence in complex ecosystem models: the sensitivity analysis of an Atlantis ecosystem model. Ecol. Model. 431:109133. doi: 10.1016/j.ecolmodel.2020.109133
Briton, F., Shannon, L., Barrier, N., Verley, P., and Shin, Y.-J. (2019). Reference levels of ecosystem indicators at multispecies maximum sustainable yield. ICES J. Mar. Sci. 76, 2070–2081. doi: 10.1093/icesjms/fsz104
Brochier, T., Ecoutin, J. M., de Morais, L. T., Kaplan, D. M., and Lae, R. (2013). A multi-agent ecosystem model for studying changes in a tropical estuarine fish assemblage within a marine protected area. Aquat. Living Resour. 26, 147–158. doi: 10.1051/alr/2012028
Butenschön, M., Clark, J., Aldridge, J. N., Allen, J. I., Artioli, Y., Blackford, J., et al. (2016). ERSEM 15.06: a generic model for marine biogeochemistry and the ecosystem dynamics of the lower trophic levels. Geosci. Model Dev. 9, 1293–1339. doi: 10.5194/gmd-9-1293-2016
CERES (2018). Deliverable Report 1.3: Projections of Physical and Biogeochemical Parameters and Habitat Indicators for European Seas, Including Synthesis of Sea Level Rise and Storminess. Kay S (main author), Andersson H, Catalán IA, Drinkwater KF Eilola K, Jordà G, Ramirez-Romero E (main contributors). Boston, MA: CERES.
Cheung, W. W. L., Lam, V. W. Y., Sarmiento, J. L., Kearney, K., Watson, R., Zeller, D., et al. (2010). Large-scale redistribution of maximum fisheries catch potential in the global ocean under climate change. Glob. Change Biol. 16, 24–35. doi: 10.1111/j.1365-2486.2009.01995.x
Clausen, L. W., Rindorf, A., van Deurs, M., Dickey-Collas, M., and Hintzen, N. T. (2018). Shifts in North Sea forage fish productivity and potential fisheries yield. J. Appl. Ecol. 55, 1092–1101. doi: 10.1111/1365-2664.13038
Coppin, F., Giraldo, C., and Travers-Trolet, M. (1988). CGFS: Channel Ground Fish Survey. Available online at: https://doi.org/10.18142/11
European Commission (2017). Commission decision (EU) 2017/848 of 17 May 2017 laying down criteria and methodological standards on good environmental status of marine waters and specifications and standardised methods for monitoring and assessment, and repealing Decision 2010/477/EU. Off. J. Eur. Union 125, 43–74.
European Union [EU] (2013). Regulation (EU) No 1380/2013 of the European Parliament and of the Council of 11 December 2013 on the Common Fisheries Policy, amending Council Regulations (EC) No 1954/2003 and (EC) No 1224/2009 and repealing Council Regulations (EC) No 2371/2002 and (EC) No 639/2004 and Council Decision 2004/585/EC. Off. J. Eur. Union 354, 22–61.
Food and Agriculture Organization [FAO] (1995). Code of Conduct for Responsible Fisheries. Rome: FAO.
Free, C. M., Thorson, J. T., Pinsky, M. L., Oken, K. L., Wiedenmann, J., and Jensen, O. P. (2019). Impacts of historical warming on marine fisheries production. Science 363, 979–983. doi: 10.1126/science.aau1758
Froese, R., and Quaas, M. (2013). Rio+20 and the reform of the common fisheries policy in Europe. Mar. Policy 39, 53–55. doi: 10.1016/j.marpol.2012.10.007
Froese, R., Winker, H., Coro, G., Demirel, N., Tsikliras, A. C., Dimarchopoulou, D., et al. (2018). Status and rebuilding of European fisheries. Mar. Policy 93, 159–170. doi: 10.1016/j.marpol.2018.04.018
Fu, C., Shin, Y.-J., Perry, R. I., King, J., and Liu, H. (2012). “Exploring climate and fishing impacts in an ecosystem model of the Strait of Georgia, British Columbia,” in Global Progress in Ecosystem-based Fisheries Management, eds K. L. Cochrane and H. I. Browman (Fairbanks: University of Alaska Fairbanks), 65–85. doi: 10.4027/gpebfm.2012.04
Fu, C., Travers-Trolet, M., Velez, L., Grüss, A., Bundy, A., and Shannon, L. J. (2018). Risky business: the combined effects of fishing and changes in primary productivity on fish communities. Ecol. Model. 368, 265–276. doi: 10.1016/j.ecolmodel.2017.12.003
Gaines, S. D., Costello, C., Owashi, B., Mangin, T., Bone, J., and Molinos, J. G. (2018). Improved fisheries management could offset many negative effects of climate change. Sci. Adv. 4:eaao1378. doi: 10.1126/sciadv.aao1378
Genu, M. (2017). Relative Importance of Different Mecanisms Underlying Fish Response to Climate Change. Master’s thesis, The Higher Institute of Agronomic, Agri-food, Horticultural and Landscape Sciences, Lisboa.
Grüss, A., Harford, W. J., Schirripa, M. J., Velez, L., Sagarese, S. R., Shin, Y.-J., et al. (2016). Management strategy evaluation using the individual-based, multispecies modeling approach OSMOSE. Ecol. Model. 340, 86–105. doi: 10.1016/j.ecolmodel.2016.09.011
Grüss, A., Schirripa, M. J., Chagaris, D., Drexler, M., Simons, J., Verley, P., et al. (2015). Evaluation of the trophic structure of the West Florida Shelf in the 2000s using the ecosystem model OSMOSE. J. Mar. Syst. 144, 30–47. doi: 10.1016/j.jmarsys.2014.11.004
Guo, C., Fu, C., Forrest, R. E., Olsen, N., Liu, H., Verley, P., et al. (2019). Ecosystem-based reference points under varying plankton productivity states and fisheries management strategies. ICES J. Mar. Sci. 76, 2045–2059. doi: 10.1093/icesjms/fsz120
Halouani, G., Ben Rais Lasram, F., Shin, Y.-J., Velez, L., Verley, P., Hattab, T., et al. (2016). Modelling food web structure using an end-to-end approach in the coastal ecosystem of the Gulf of Gabes (Tunisia). Ecol. Model. 339, 45–57. doi: 10.1016/j.ecolmodel.2016.08.008
Heino, M., Baulier, L., Boukal, D. S., Ernande, B., Johnston, F. D., Mollet, F. M., et al. (2013). Can fisheries-induced evolution shift reference points for fisheries management? ICES J. Mar. Sci. 70, 707–721. doi: 10.1093/icesjms/fst077
Hilborn, R. (2010). Pretty Good Yield and exploited fishes. Mar. Policy 34, 193–196. doi: 10.1016/j.marpol.2009.04.013
ICES (2011a). Catches in FAO Area 27 by Country, Species, Area and Year. Source: Eurostat/ICES database on catch statistics - ICES 2011, Copenhagen. Format: Archived dataset in .xls and .csv format. Version 30-11-2011. Lowestoft: ICES.
ICES (2011b). Report of the Working Group on the Assessment of Demersal Stocks in the North Sea and Skagerrak (WGNSSK) (No. ICES CM 2011/ACOM:13). Lowestoft: ICES.
ICES (2012). Report of the Working Group on Widely Distributed Stocks (WGWIDE) (21 - 27 August 2012 No. ICES CM 2012/ACOM:1 5). Lowestoft: ICES.
ICES (2017). Report of the Working Group on Assessment of Demersal Stocks in the North Sea. Lowestoft: ICES.
IPCC (2014). Climate Change 2014: Synthesis Report. Contribution of Working Groups I, II and III to the Fifth Assessment Report of the Intergovernmental Panel on Climate Change [Core Writing Team, R.K. Pachauri and L.A. Meyer (eds.)]. Geneva: IPCC.
Kell, L. T., Pilling, G. M., and O’Brien, C. M. (2005). Implications of climate change for the management of North Sea cod (Gadus morhua). ICES J. Mar. Sci. 62, 1483–1491. doi: 10.1016/j.icesjms.2005.05.006
Kielbassa, J., Delignette-Muller, M. L., Pont, D., and Charles, S. (2010). Application of a temperature-dependent von Bertalanffy growth model to bullhead (Cottus gobio). Ecol. Model. 221, 2475–2481. doi: 10.1016/j.ecolmodel.2010.07.001
Le Goff, C., Lavaud, R., Cugier, P., Jean, F., Flye-Sainte-Marie, J., Foucher, E., et al. (2017). A coupled biophysical model for the distribution of the great scallop Pecten maximus in the English Channel. J. Mar. Syst. 167, 55–67. doi: 10.1016/j.jmarsys.2016.10.013
Lehuta, S., Girardin, R., Mahévas, S., Travers-Trolet, M., and Vermard, Y. (2016). Reconciling complex system models and fisheries advice: practical examples and leads. Aquat. Living Resour. 29:208. doi: 10.1051/alr/2016022
Marzloff, M., Shin, Y.-J., Tam, J., Travers, M., and Bertrand, A. (2009). Trophic structure of the Peruvian marine ecosystem in 2000–2006: insights on the effects of management scenarios for the hake fishery using the IBM trophic model Osmose. J. Mar. Syst. 75, 290–304. doi: 10.1016/j.jmarsys.2008.10.009
Mesnil, B. (2012). The hesitant emergence of maximum sustainable yield (MSY) in fisheries policies in Europe. Mar. Policy 36, 473–480. doi: 10.1016/j.marpol.2011.08.006
Moffitt, E. A., Punt, A. E., Holsman, K., Aydin, K. Y., Ianelli, J. N., and Ortiz, I. (2016). Moving towards ecosystem-based fisheries management: options for parameterizing multi-species biological reference points. Deep Sea Res. II Top. Stud. Oceanogr. Understand. Ecosyst. Process. Eastern Bering Sea IV 134, 350–359. doi: 10.1016/j.dsr2.2015.08.002
Oliveros-Ramos, R., Verley, P., Echevin, V., and Shin, Y.-J. (2017). A sequential approach to calibrate ecosystem models with multiple time series data. Prog. Oceanogr. 151, 227–244. doi: 10.1016/j.pocean.2017.01.002
Perry, R. I., Cury, P., Brander, K., Jennings, S., Möllmann, C., and Planque, B. (2010). Sensitivity of marine systems to climate and fishing: concepts, issues and management responses. J. Mar. Syst. Impact Clim. Variabil. Mar. Ecosyst. Comp. Approach 79, 427–435. doi: 10.1016/j.jmarsys.2008.12.017
Rindorf, A., Cardinale, M., Shephard, S., De Oliveira, J. A. A., Hjorleifsson, E., Kempf, A., et al. (2017). Fishing for MSY: using “pretty good yield” ranges without impairing recruitment. ICES J. Mar. Sci. 74, 525–534. doi: 10.1093/icesjms/fsw111
Salomon, M., Markus, T., and Dross, M. (2014). Masterstroke or paper tiger – The reform of the EU×s common fisheries policy. Mar. Policy 47, 76–84. doi: 10.1016/j.marpol.2014.02.001
Scheffers, B. R., Meester, L. D., Bridge, T. C. L., Hoffmann, A. A., Pandolfi, J. M., Corlett, R. T., et al. (2016). The broad footprint of climate change from genes to biomes to people. Science 354:aaf7671. doi: 10.1126/science.aaf7671
Scott, R. D., and Sampson, D. B. (2011). The sensitivity of long-term yield targets to changes in fishery age-selectivity. Mar. Policy 35, 79–84. doi: 10.1016/j.marpol.2010.08.005
Shin, Y.-J., and Cury, P. (2001). Exploring fish community dynamics through size-dependent trophic interactions using a spatialized individual-based model. Aqu. Living Resour. 14, 65–80. doi: 10.1016/S0990-7440(01)01106-8
Shin, Y.-J., and Cury, P. (2004). Using an individual-based model of fish assemblages to study the response of size spectra to changes in fishing. Can. J. Fish. Aquat. Sci. 61, 414–431. doi: 10.1139/f03-154
Shin, Y.-J., Houle, J. E., Akoglu, E., Blanchard, J. L., Bundy, A., Coll, M., et al. (2018). The specificity of marine ecological indicators to fishing in the face of environmental change: a multi-model evaluation. Ecol. Indic. 89, 317–326. doi: 10.1016/j.ecolind.2018.01.010
Thorpe, R. B., Jennings, S., and Dolder, P. J. (2017). Risks and benefits of catching pretty good yield in multispecies mixed fisheries. ICES J. Mar. Sci. 74, 2097–2106. doi: 10.1093/icesjms/fsx062
Travers, M., Shin, Y.-J., Jennings, S., Machu, E., Huggett, J. A., Field, J. G., et al. (2009). “Two-way coupling versus one-way forcing of plankton and fish models to predict ecosystem changes in the Benguela,” in Proceedings of the Ecological Modelling, Selected Papers from the Sixth European Conference on Ecological Modelling - ECEM ’07, on Challenges for ecological modelling in a changing world: Global Changes, Sustainability and Ecosystem Based Management, November 27-30, 2007, Trieste, 3089–3099. doi: 10.1016/j.ecolmodel.2009.08.016
Travers, M., Shin, Y.-J., Shannon, L., and Cury, P. (2006). Simulating and testing the sensitivity of ecosystem-based indicators to fishing in the southern Benguela ecosystem. Can. J. Fish. Aquat. Sci. 63, 943–956. doi: 10.1139/f06-003
Travers-Trolet, M., Coppin, F., Cresson, P., Cugier, P., Oliveros-Ramos, R., and Verley, P. (2019). Emergence of negative trophic level-size relationships from a size-based, individual-based multispecies fish model. Ecol. Model. 410:108800. doi: 10.1016/j.ecolmodel.2019.108800
Travers-Trolet, M., Shin, Y.-J., and Field, J. G. (2014a). An end-to-end coupled model ROMS-N2P2Z2D2-OSMOSE of the southern Benguela foodweb: parameterisation, calibration and pattern-oriented validation. Afr. J. Mar. Sci. 36, 11–29. doi: 10.2989/1814232X.2014.883326
Travers-Trolet, M., Shin, Y.-J., Shannon, L. J., Moloney, C. L., and Field, J. G. (2014b). Combined fishing and climate forcing in the southern benguela upwelling ecosystem: an end-to-end modelling approach reveals dampened effects. PLoS One 9:e94286. doi: 10.1371/journal.pone.0094286
Ulrich, C., Vermard, Y., Dolder, P. J., Brunel, T., Jardim, E., Holmes, S. J., et al. (2017). Achieving maximum sustainable yield in mixed fisheries: a management approach for the North Sea demersal fisheries. ICES J. Mar. Sci. 74, 566–575. doi: 10.1093/icesjms/fsw126
Vanhoutte-Brunier, A., Fernand, L., Ménesguen, A., Lyons, S., Gohin, F., and Cugier, P. (2008). Modelling the Karenia mikimotoi bloom that occurred in the western English Channel during summer 2003. Ecol. Model. 210, 351–376. doi: 10.1016/j.ecolmodel.2007.08.025
Keywords: maximum sustainable yield, climate change, biological reference points, ecosystem model, fishery management
Citation: Travers-Trolet M, Bourdaud P, Genu M, Velez L and Vermard Y (2020) The Risky Decrease of Fishing Reference Points Under Climate Change. Front. Mar. Sci. 7:568232. doi: 10.3389/fmars.2020.568232
Received: 31 May 2020; Accepted: 18 September 2020;
Published: 06 November 2020.
Edited by:
Morten Omholt Alver, Norwegian University of Science and Technology, NorwayReviewed by:
Caihong Fu, Fisheries and Oceans Canada, CanadaFabio Fiorentino, National Research Council (CNR), Italy
Copyright © 2020 Travers-Trolet, Bourdaud, Genu, Velez and Vermard. This is an open-access article distributed under the terms of the Creative Commons Attribution License (CC BY). The use, distribution or reproduction in other forums is permitted, provided the original author(s) and the copyright owner(s) are credited and that the original publication in this journal is cited, in accordance with accepted academic practice. No use, distribution or reproduction is permitted which does not comply with these terms.
*Correspondence: Morgane Travers-Trolet, TW9yZ2FuZS5UcmF2ZXJzQGlmcmVtZXIuZnI=