 Nicholas A. Kamenos
 Sebastian J. Hennige
- 1School of Geographical and Earth Sciences, University of Glasgow, Glasgow, United Kingdom
- 2School of Geosciences, University of Edinburgh, Edinburgh, United Kingdom
A Commentary on
Commentary: Reconstructing Four Centuries of Temperature-Induced Coral Bleaching on the Great Barrier Reef
by Hoegh-Guldberg, O. etc. (2019). Front. Mar. Sci. doi: 10.3389/fmars.2019.00086
by DeCarlo, T. M. (2020). Front. Mar. Sci. doi: 10.3389/fmars.2020.00030
Reconstructing Four Centuries of Temperature-Induced Coral Bleaching on the Great Barrier Reef
by Kamenos, N. A., and Hennige, S. J. (2018). Front. Mar. Sci. 5:283. doi: 10.3389/fmars.2018.00283
Mass coral bleaching events during the last 20 years have caused major concern over the future of coral reefs worldwide. Despite damage to these key ecological cornerstones, little is known about bleaching frequency prior to 1979 when regular modern systematic scientific observations began on the Great Barrier Reef (GBR). To understand the longer-term relevance of current bleaching trajectories, the likelihood of future coral acclimatization and adaptation, and thus persistence of corals, we reconstructed centennial length GBR bleaching records in Kamenos and Hennige (2018) (hereafter KH18). We thank Hoegh-Guldberg et al. (2019) and DeCarlo (2020) (hereafter HG19 and DeC20, respectively) for considering our paper. HG19 and DeC20 question our approach; however here we demonstrate: 1) our use of ERSST data is during their most accurate and precise time period, 2) that linear extension is recording bleaching and that within and between-coral colony variability exists, necessitating a decadally binned approach, 3) that HG19 make errors in their dataset comparisons (also detected by DeC20), and 4) that HG19 and DeC20 use the observational data record beyond its power as it is not resolved by effort or species. Overall, we demonstrate the value of sclerochronological-type approaches over longer time-scales and the existing evidence of historic coral mortality, in contrary to Commentary assertions.
The Key Message of KH18
We summarize the key message of KH18, where we state “…reconstructed increases in bleaching frequency and prevalence, may suggest coral populations are reaching an upper bleaching threshold, a “tipping point” beyond which coral survival is uncertain.” By providing a long timeseries of baseline data we robustly demonstrate recent increases in bleaching. In their Commentaries, HG19/DeC20 suggest we have a different narrative to the one we directly quote here.
The Value of Sclerochronological Approaches
Given the overall narrative in HG19 and DeC20, it is pertinent to clarify the strategy behind our approach. Between and within-individual variability is well-documented in coral colonies and other biological systems including trees. When studying tree rings, dendrochronologists have long appreciated such variability and rely on multiple tree ring records (e.g., Fritts, 1991). Similar approaches are now being used in marine organismal archives including bivalves (Reynolds et al., 2017)—these are often binned decadally (or similar) to account for acknowledged between and within individual variability. Indeed, comparable binning, filtering and memory approaches are becoming more widely used and recognized in biotic systems, including corals (D'olivo et al., 2013) and trees (Itter et al., 2019).
However, the field of coral biotic sclerochronology is in general at an earlier stage of development (Scopus search 17 Oct 2019: 4,612 papers on “dendrochronology,” 156 papers on “coral banding” and 61 papers on “coral sclerochronology”). Bleaching studies have generally focused on colony-level histories. This is an important step in understanding individual responses (Carilli et al., 2010), but a key paper (D'olivo et al., 2013) made advances using multiple cores and grouped data. KH18 builds on these and moves toward the application of dendrochronological-type approaches to coral bleaching sclerochronology. This approach enables us to integrate within and between individual variability, which is evident when large numbers of corals are assessed. Natural variability means it would be unlikely that all cores from individual or multiple colonies would give the same results. HG19 authors neglect this in their commentary (although some HG19 authors have experience in dendrochronology), stating that multiple cores from within a colony “should provide the same bleaching histories.” This statement is thus at odds with the authors of HG19's own observations (e.g., Carilli et al., 2009; Cantin and Lough, 2014), who have shown that single coral colonies can exhibit partial mortality or variable bleaching responses and recoveries. Our results demonstrate that in some cases cores from the same colony exhibit the same temporal patterns, but in other instances they do not (KH18 Table SM1). To reconcile this variability and to advance coral sclerochronology, it is necessary to use multiple cores and consider bleaching distributions (rather than single cores), as we and D'olivo et al. (2013) have done.
HG19's suggestion that our findings of bleaching occurring prior to the 1980s are misleading is unexpected, especially given HG19 authors have themselves reported evidence of reef-wide bleaching on the GBR at least as early as 1929 and 1876 in other locations (e.g., Oliver et al., 2009), and that 1877 has been confirmed as at least a high stress year (DeCarlo et al., 2019). Other studies acknowledged in KH18 (including Yu et al., 2006; Dishon et al., 2015) further demonstrate mass coral death events in the recent geologic record. Thus, the concept of bleaching, or bleaching leading to mortality, before the observational record is already well-established in the peer-reviewed literature.
These diverging approaches underline the silos separating biology/ecology-pointing and geology-pointing disciplines and are even evidenced in DeC20 who suggests the KH18 approach is at odds with “literature in coral reef ecology.” Given this large disparity, we suggest that to move forward as a unified discipline we need to bring the biological/ecological and geological communities together; we try to make those steps in KH18.
Linear Extension as a Bleaching Proxy
It has been previously demonstrated that bleaching is recorded within coral linear extension (Leder et al., 1991; Suzuki et al., 2003), including by authors of HG19 (Cantin and Lough, 2014). We agree with HG19 that a reduction in linear extension rates is not an unequivocal sign of bleaching; we too discuss this in KH18 (p. 1, 3, 9). Indeed, the multiple drivers of bleaching structured our methodological approach. As with dendrochronological approaches (which accept that extension rates may vary for a variety of reasons, e.g., drought, off axis coring), we used as many cores as were available to integrate those variable drivers (we discuss this in detail in KH18). Here we use further lines of evidence (Figure 1): it is known that coral band extension is positively related to temperature within physiological norms (e.g., Lough, 2008). Thus, if extension was recording only growth responding to temperature within physiological norms, we would expect a positive relationship between temperature and extension (and therefore a negative relationship between temperature and extension-derived bleaching prevalence) (Figure 1A). If growth was responding to both temperature (within physiological norms) and other drivers (e.g., runoff), we would expect no distinct trend as the other drivers would add inconsistent noise to the growth patterns (Figure 1B). A third trajectory also exists: if a reconstruction represented growth responding to thermal bleaching (low extension), we would expect a negative relationship between temperature and extension (and therefore a positive relationship between temperature and extension-derived bleaching prevalence, Figure 1C), as at higher temperatures there would be more corals exhibiting lower growth—this is the inverse of what would happen within physiological norms. In Figure 1 here, we add three hypothetical plots representing each of these trajectories. Given (1) there is evidence in the literature of bleaching-related reductions in linear extension from several author groups (Leder et al., 1991; Suzuki et al., 2003; Cantin and Lough, 2014) and (2) the reconstructed bleaching data from KH18 matches the third hypothetical plot (Figures 1C,D), this supports our assertion that our proxy is reconstructing widespread thermal bleaching rather than bleaching driven by other, more localized, variables, or thermal growth within physiological norms.
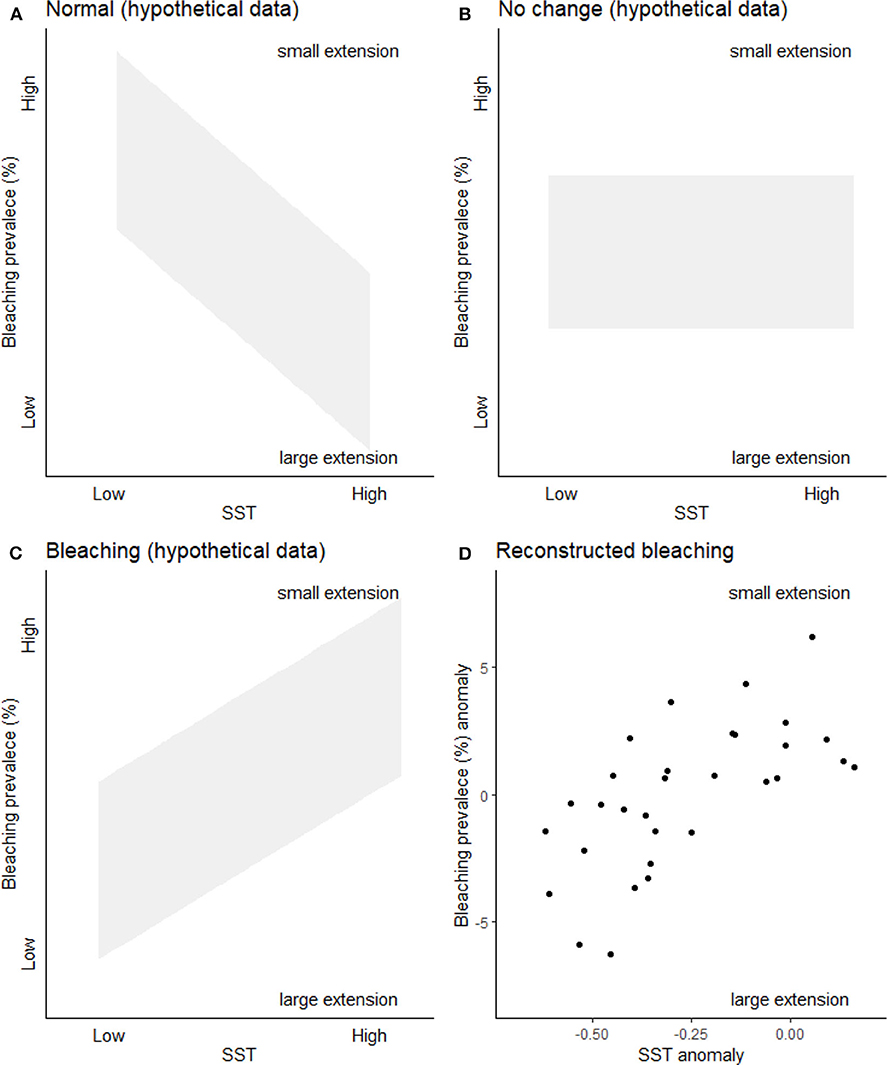
Figure 1. Bleaching prevalence for different drivers. (A) Expected pattern if KH18 was reconstructing coral growth within physiological norms (as there would be fewer small growth bands at higher temperatures). (B) Expected pattern if KH18 was reconstructing coral growth within physiological norms and extension was also affected by other drivers including localized runoff for example. (C) Expected pattern if KH18 was reconstructing extension driven by bleaching. (D) Great Barrier Reef reconstructed bleaching prevalence (decadally binned anomaly) relationship with reconstructed western Pacific (Tierney et al., 2015) sea surface temperature anomaly (SST) between 1700 and 1989. Text in all plots indicates how the reconstructed bleaching prevalence relates to coral linear extension.
Application of ERSST in KH18
HG19 are correct that the ERSST data are sparser earlier in the record. In KH18, we assessed the 1854-2001 period over which coral cores were available and all the DHM-growth calibration data points used for the coral colonies were from between 1970 and 2001 (Figure 2A)—when the ERSST data record has its lowest standard deviation (SD). Here, we plot our DHM-growth calibration points for coral colonies based on ERSST (KH18) over the ERSST SD presented in HG19 Figure 1B. We also plot DHM-growth calibration points based on NOAA buoy data and they fall in the same years as ERSST-based data (Figure 2A). The times we calculated as calibration points for DHM bleaching fall (1) on the recorded mass bleaching year (1998), during the data-rich part of the observational record occurring prior to 2001 (the start of the available coral core record at the time of writing), and (2) in the mid-1970s, which although before the start of intensive monitoring programmes, have been evidenced independently as GBR high-stress years (DeCarlo et al., 2019). We also note that when considering just the ERSST data (ending 2013 rather than 2001 where the coral core data end), DHM-ERSST calibration points would also fall in 2001 & 2002—another observed mass bleaching period for the GBR, giving 5 potential calibration points.
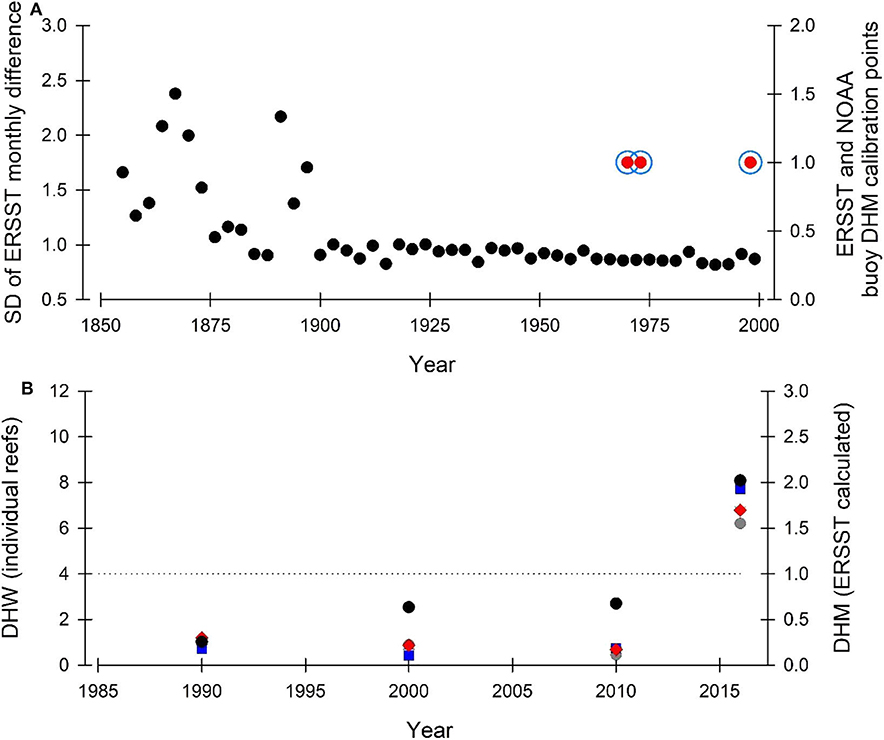
Figure 2. (A) ERSST standard deviation (black dots) of temperature difference in consecutive months for three-year intervals from the same ERSST pixel (data from HG19). Temperature-derived DHM growth threshold calibrations over the period 1854-2001 are indicated for both ERSST (blue circle) and NOAA buoy data (red dots). Location of calibration years is within the lowest SD portion of the ERSST database. (B) Ability of ERSST to accurately estimate thermal stress (black dots) in comparison to ground-truthed satellite temperature [Conical Rocks (dark gray dot), Agincourt Reef (Red diamonds), Snapper Reef (Blue square), and Low Isles (light gray triangle)]. Four 5 × 5 km2 segments within the ERSST pixel; data from HG19. Black dotted line indicates DHM (ERSST) and DHW (individual reefs) equivalence. Data presented as decadal bins (as per KH18) beginning in 1986, apart from 2016 and 2017 which occupy a single 2-year bin at the end of the time series. Both ERSST and ground-truthed satellite data predict the same bleaching responses in the context of the DHM-DHW equivalence line.
Further, due to our use of ERSST data, HG19 / DeC20 suggest KH18 makes incorrect reef-scale predictions. Neither HG19 or DeC20 use decadally binned data as in KH18; this is a key part of our approach and is required to integrate spatial, temporal and reconstruction variability (KH18 p. 5). To evidence this, we replot HG19 Figure 2C (here Figure 2B) using the approaches detailed in KH18 (decadally binned data) and demonstrate that the ground-truthed satellite derived DHW (from HG19) give the same outcome as ERSST-derived DHM from KH18 in the context of the DHM / W equivalence line (i.e., > or < 1 / 4 respectively). Even given the difference in spatiotemporal scales considered by the KH18 and HG19 approaches (Figure 2B), it is very notable that both approaches still provide the same outcome in the context of DWM/W zones.
Data Validation and Resolution
We do not use the hemispheric Mann et al. (2008) data in the capacity suggested by HG19; we use Tierney et al. (2015) data for quantitative proxy validation in KH18 (p. 5, Figure 3A). As the Mann et al. data are hemispheric we only compare visually in KH18, and thus HG19 Figure 1B is misleading as it compares a single ERSST pixel with the Southern Hemisphere averaged surface temperature. Importantly, highly significant cross correlation exists between averaged (order = 11, to match bins) Tierney et al. data with GBR-wide ERSST data (coefficient = 0.73, p < 0.001) and also Mann et al. data with GBR-wide ERSST data (coefficient = 0.85, p < 0.001), supported by highly significant wavelet analysis (Figure S1). Given HG19's statement regarding a lack of correlation, we can only conclude HG19 did not test the association statistically and thus their claim is erroneous. The presence of a good correlation (and thus incorrect assessment by HG19) is also confirmed by DeC20.
Calibration of the Proxy Against the Observational Record
In KH18 we are very open about the associations present in our data (KH18 Figure 3), where we present three options for comparison rather than picking only the best-fit option: the quantitative comparison with SST (KH18 Figure 3A), the visual comparison with observational data (KH18 Figure 3B) and the comparison with other published studies. For an unbiased appraisal of the proxy we considered all three pieces of evidence. This was not done in either HG19 or DeC20, whose arguments hinge mainly on KH18 Figure 3B—which are observational data. The key limitation with only using these specific annual observational data to assess validation is that they are only semi-quantitative, not fully weighted for observer effort, are not separated by taxon and contain no metric of species contribution (or contribution stability) though time. In particular, the key thrust of DeC20's analyses and arguments rely on using these observational records to validate the KH18 time series. DeC20 plots the 20% Porites-only threshold from KH18 against observational data for all species (DeC20 Figure 1), however it is clear that the aforementioned limitations of these data mean that such analyses have no power as a tool for testing bleaching proxies due to the unquantifiable variability of the source data. DeC20 even acknowledges these major limitations yet still uses these data as evidence that our approach is flawed. Given this, while we appreciate the principle of DeC20's approach, the data used are not able to resolve any quantitative pattern and suggest that DeC20 may have misunderstood our consideration of other data during validation. Importantly, these data limitations are why in KH18 we specify (KH18 p. 5) that we have not used the observational data for quantitative validation.
Conclusions
We are disappointed at the assertion that we ignored suggestions the HG19 authors made as reviewers on previous versions of KH18, as the published manuscript is quite different to initial versions they may have reviewed. Additionally, our paper was also previously reviewed by individuals other than the HG19 authors, during which a similar number of expert reviewers—several named—provided extremely positive reviews and suggestions which are reflected in KH18. In KH18 we produced a tool that can be used to reconstruct past bleaching events; to extend and improve its use we reiterate our previously communicated invitation to HG19 authors of the need to work together, bringing biological and geological disciplines closer. We welcome the opportunity here to confirm our approach in response to the points raised by HG19 and DeC20 and thank the reviewers of this Commentary response for their constructive appraisal.
Author Contributions
NK and SH conceived the study, conducted the research, analyzed the data and wrote the manuscript. All authors contributed to the article and approved the submitted version.
Conflict of Interest
The authors declare that the research was conducted in the absence of any commercial or financial relationships that could be construed as a potential conflict of interest.
Acknowledgments
SH was in receipt of NERC funding (NE/K009028/2) and NK in receipt of Royal Society of Edinburgh/Scottish Government funding (RSE 48701/1).
Supplementary Material
The Supplementary Material for this article can be found online at: https://www.frontiersin.org/articles/10.3389/fmars.2020.570620/full#supplementary-material
References
Cantin, N. E., and Lough, J. M. (2014). Surviving coral bleaching events: Porites growth anomalies on the Great Barrier Reef. PLoS ONE 9:e88720. doi: 10.1371/journal.pone.0088720
Carilli, J., Godfrey, J., Norris, R. D., Sandin, S. A., and Smith, J. E. (2010). Periodic endolithic algal blooms in Montastrea faveolata corals may represent periods of low-level stress. Bull. Mar. Sci. 86, 709–718.
Carilli, J. E., Norris, R. D., Black, B. A., Walsh, S. M., and Mcfield, M. (2009). Local stressors reduce coral resilience to bleaching. PLoS ONE 4:e6324. doi: 10.1371/journal.pone.0006324
DeCarlo, T. M. (2020). Commentary: reconstructing four centuries of temperature-induced coral bleaching on the Great Barrier Reef. Front. Mar. Sci. 7:30. doi: 10.3389/fmars.2020.00030
DeCarlo, T. M., Harrison, H. B., Gajdzik, L., Alaguarda, D., Rodolfo-Metalpa, R., D'olivo, J., et al. (2019). Acclimatization of massive reef-building corals to consecutive heatwaves. Proc. R. Soc. B Biol. Sci. 286:20190235. doi: 10.1098/rspb.2019.0235
Dishon, G., Fisch, J., Horn, I., Kaczmarek, K., Bijma, J., Gruber, D. F., et al. (2015). A novel paleo-bleaching proxy using boron isotopes and high-resolution laser ablation to reconstruct coral bleaching events. Biogeosciences 12, 5677–5687. doi: 10.5194/bg-12-5677-2015
D'olivo, J., Mcculloch, M., and Judd, K. (2013). Long-term records of coral calcification across the central Great Barrier Reef: assessing the impacts of river runoff and climate change. Coral Reefs 32, 999–1012. doi: 10.1007/s00338-013-1071-8
Fritts, H. C. (1991). Reconstructing large-scale climatic patterns from tree-ring analysis. Tuscon, AZ: The University of Arizona Press.
Hoegh-Guldberg, O., Skirving, W. J., Lough, J. M., Liu, C., Mann, M. E., Donner, S., et al. (2019). Commentary: reconstructing four centuries of temperature-induced coral bleaching on the Great Barrier Reef. Front. Mar. Sci. 6:86. doi: 10.3389/fmars.2019.00086
Itter, M. S., D'orangeville, L., Dawson, A., Kneeshaw, D., Duchesne, L., and Finley, A. O. (2019). Boreal tree growth exhibits decadal-scale ecological memory to drought and insect defoliation, but no negative response to their interaction. J. Ecol. 107, 1288–1301. doi: 10.1111/1365-2745.13087
Kamenos, N. A., and Hennige, S. J. (2018). Reconstructing four centuries of temperature-induced coral bleaching on the Great Barrier Reef. Front. Mar. Sci. 5:283. doi: 10.3389/fmars.2018.00283
Leder, J. J., Szmant, A. M., and Swart, P. K. (1991). The effect of prolonged “bleaching” on skeletal banding and stable isotopic composition in Montastrea annularis. Coral Reefs 10, 19–27. doi: 10.1007/BF00301902
Lough, J. M. (2008). Coral calcification from skeletal records revisited. Mar. Ecol. Prog. Ser. 373, 257–264. doi: 10.3354/meps07398
Mann, M. E., Zhang, Z., Hughes, M. K., Bradley, R. S., Miller, S. K., Rutherford, S., et al. (2008). Proxy-based reconstructions of hemispheric and global surface temperature variations over the past two millennia. Proc. Natl. Acad. Sci. U.S.A. 105, 13252–13257. doi: 10.1073/pnas.0805721105
Oliver, J. K., Berkelmans, R., and Eakin, C. M. (2009). “Coral bleaching in space and time” in Coral Bleaching Patterns, Processes, Causes and Consequences, eds J. Lough and M. J. H. Van Oppen (Berlin: Springer-Verlag), 21–37. doi: 10.1007/978-3-540-69775-6_3
Reynolds, D. J., Richardson, C. A., Scourse, J. D., Butler, P. G., Hollyman, P., Román-González, A., et al. (2017). Reconstructing North Atlantic marine climate variability using an absolutely-dated sclerochronological network. Palaeogeogr. Palaeoclimatol. Palaeoecol. 465, 333–346. doi: 10.1016/j.palaeo.2016.08.006
Suzuki, A., Gagan, M., Fabricius, K., Isdale, P., Yukino, I., and Kawahata, H. (2003). Skeletal isotope microprofiles of growth perturbations in Porites corals during the 1997–1998 mass bleaching event. Coral Reefs 22, 357–369. doi: 10.1007/s00338-003-0323-4
Tierney, J. E., Abram, N. J., Anchukaitis, K. J., Evans, M. N., Giry, C., Kilbourne, K. H., et al. (2015). Tropical sea surface temperatures for the past four centuries reconstructed from coral archives. Paleoceanography 30, 226–252. doi: 10.1002/2014PA002717
Keywords: coral, bleaching, adaptation, acclimatization, Symbiodinaceae, growth
Citation: Kamenos NA and Hennige SJ (2020) Commentary: Commentary on Reconstructing Four Centuries of Temperature-Induced Bleaching on the Great Barrier Reef by Hoegh-Guldberg et al. 2019 and DeCarlo 2020. Front. Mar. Sci. 7:570620. doi: 10.3389/fmars.2020.570620
Received: 08 June 2020; Accepted: 18 August 2020;
Published: 29 October 2020.
Edited by:
Michael Sweet, University of Derby, United KingdomReviewed by:
Eric Jeremy Hochberg, Bermuda Institute of Ocean Sciences, BermudaCopyright © 2020 Kamenos and Hennige. This is an open-access article distributed under the terms of the Creative Commons Attribution License (CC BY). The use, distribution or reproduction in other forums is permitted, provided the original author(s) and the copyright owner(s) are credited and that the original publication in this journal is cited, in accordance with accepted academic practice. No use, distribution or reproduction is permitted which does not comply with these terms.
*Correspondence: Nicholas A. Kamenos, bmljay5rYW1lbm9zQGdsYXNnb3cuYWMudWs=