 Josephine Dianne L. Deauna
 Kevin Matthew B. Yatco
 Cesar L. Villanoy
 Marie Antonette Juinio-Meñez
- Marine Science Institute, University of the Philippines Diliman, Quezon, Philippines
Stocks of commercially valuable sea cucumber species have declined in most tropical countries, which supply majority of the global demand. This work aimed to locate priority sites for the management of Holothuria scabra and Stichopus horrens in the western central Philippines. A passive larval dispersal model was run under four monsoonal regimes (Northeast monsoon, dry-transition, Southwest monsoon, and early Northeast monsoon), and the results subjected to the Infomap network detection algorithm. Three clusters of closely related geographical nodes were identified [southeastern Palawan (Group I), western Panay and eastern Mindoro (Group II), and northern and western Palawan with western Mindoro (Group III)]. Remotely sensed habitat data were used to parameterize the degree of connectivity observed among sites (H. scabra spawning and settlement requires the presence of seagrass and mangrove, while S. horrens requires corals and seagrass). Local retention, self-recruitment, settlement success and sink diversity were then calculated for each node with suitable habitat. The locations were ranked according to each metric and those with higher larval export rates, a higher diversity of larval sources and a high degree of successful larval contribution to other sites were deemed crucial for the management of wild populations. Sixteen high-priority sites were identified, distributed mainly along northern Palawan and western Panay. Six sites were common for both species at different seasons, and no single location fulfilled all stated criteria across the four seasons and both sea cucumber species considered. The priority sites for management could serve as broodstock selection and juvenile restocking areas for aquaculture production clusters, which when properly implemented, could lead to an increase in sea cucumber production and contribute to natural populations. On a broader scale, the designation of closely related clusters and incorporation of habitat requirements to dispersal data provided critical input for the delineation of ecologically meaningful management units for sea cucumbers within the region.
Introduction
Benthic species connectivity in the marine environment relies on the degree of exchange of pelagic larval stages from habitats where adult populations spawn and subsequent recruitment in areas where the juveniles can survive to sexual maturity. Larval exchange is considered ecologically relevant if the demography of local populations is impacted by the transport between two sites (Cowen and Sponaugle, 2009). Connectivity can be measured using direct methods which rely on first-hand observation or through indirect methods which resolve population connectivity by using genetic markers in increasingly sophisticated analysis methods (Kool et al., 2013; Baetscher et al., 2019). Alternatively, biophysical modeling has become an invaluable technique in determining high-resolution connectivity at greater spatio-temporal scales beyond the limits of traditional approaches (Botsford et al., 2009; Kool et al., 2013). Models are frequently used to inform management decisions with regards to enhancing benthic marine populations (Puckett et al., 2014; Weeks et al., 2014).
Sea cucumbers are highly exploited benthic species marketed as luxury seafood in its dried form as beche-de-mer or trepang. The highest demand comes from China and Hong Kong with most of the supply harvested from tropical countries (Toral-Granda et al., 2008; Purcell et al., 2018). Aside from their economic importance, sea cucumbers are a crucial part of coastal food chains as they are efficient nutrient recyclers, and are themselves prey of higher trophic level predators (Purcell et al., 2016). Unfortunately, majority of sea cucumber fisheries are categorized as either depleted, over or fully exploited, particularly in the Indo-Pacific region (Purcell et al., 2013), while ∼21% of commercially important species are considered threatened (Purcell et al., 2014). Proper management of sea cucumber stock within an ecological framework is a vital concern to maintain the health of coastal ecosystems, increase sea cucumber populations, and safeguard the socioeconomic well-being of fisher folk which rely heavily on the sea cucumber trade (Purcell et al., 2013).
Understanding sea cucumber population connectivity is essential in informing fisheries management but also in ensuring the success of aquaculture efforts. For either restocking initiatives or grow-out operations, hatchery-produced juveniles would ideally have to be released only in locations close to where their source broodstock were collected to avoid deleterious effects from changing the genetic makeup of local populations. The ability to select broodstock from a variety of suitable locations, along with prudent management of the spawning of individuals, are required to sustain and improve hatchery-based sea cucumber aquaculture efforts (Uthicke and Purcell, 2004; Purcell et al., 2012; Juinio-Meñez et al., 2017b). Identification of these suitable locations would be greatly aided by biophysical modeling, however there is currently a paucity of studies which utilize this technique to discern sea cucumber population connectivity in the wild. Shackell et al. (2013) used areas with high densities of Cucumaria frondosa in the Scotian Shelf, Canada as release sites for particle tracking simulations to differentiate between areas which were self-sustaining or had high larval contributions to other locations. Based on the model results, the protection of high-density habitats was recommended in order to sustainably manage the fishery. No counterpart studies have been conducted for any tropical species.
The Philippines is one of the top exporters of dried sea cucumber to Hong Kong (To et al., 2018), which also serves as the primary gateway to the highly lucrative Chinese market (Purcell et al., 2018). Sea cucumber fisheries nationwide are overexploited, with low enforcement capacity for regulatory measures. Integrated and adaptive culture production initiatives are ongoing for Holothuria scabra in various locations to help rebuild depleted populations and diversify sustainable mariculture options accessible to small fishers (Juinio-Meñez et al., 2017b). Stichopus horrens is another commercially valuable species widely distributed in Palawan (Jontila et al., 2014), whose potential for hatchery production is being explored (Palomar-Abesamis et al., 2018). Palawan (Figure 1A) is one of the major sources of dried sea cucumbers in the country. The high diversity of sea cucumbers in the region, overexploitation of stocks, and dependence of small-scale subsistence fisherfolk require concerted efforts to enhance management of these valuable fishery resources (Jontila et al., 2018a). In relation to this, biophysical modeling of these two high value species will be essential in characterizing ecologically meaningful management units (MU) and inform strategic management actions, together with information on genetic structure (Lizano, 2017), species distribution and relative abundance based on landed catch data, key informant interviews and limited field studies (Juinio-Meñez et al., 2017a).
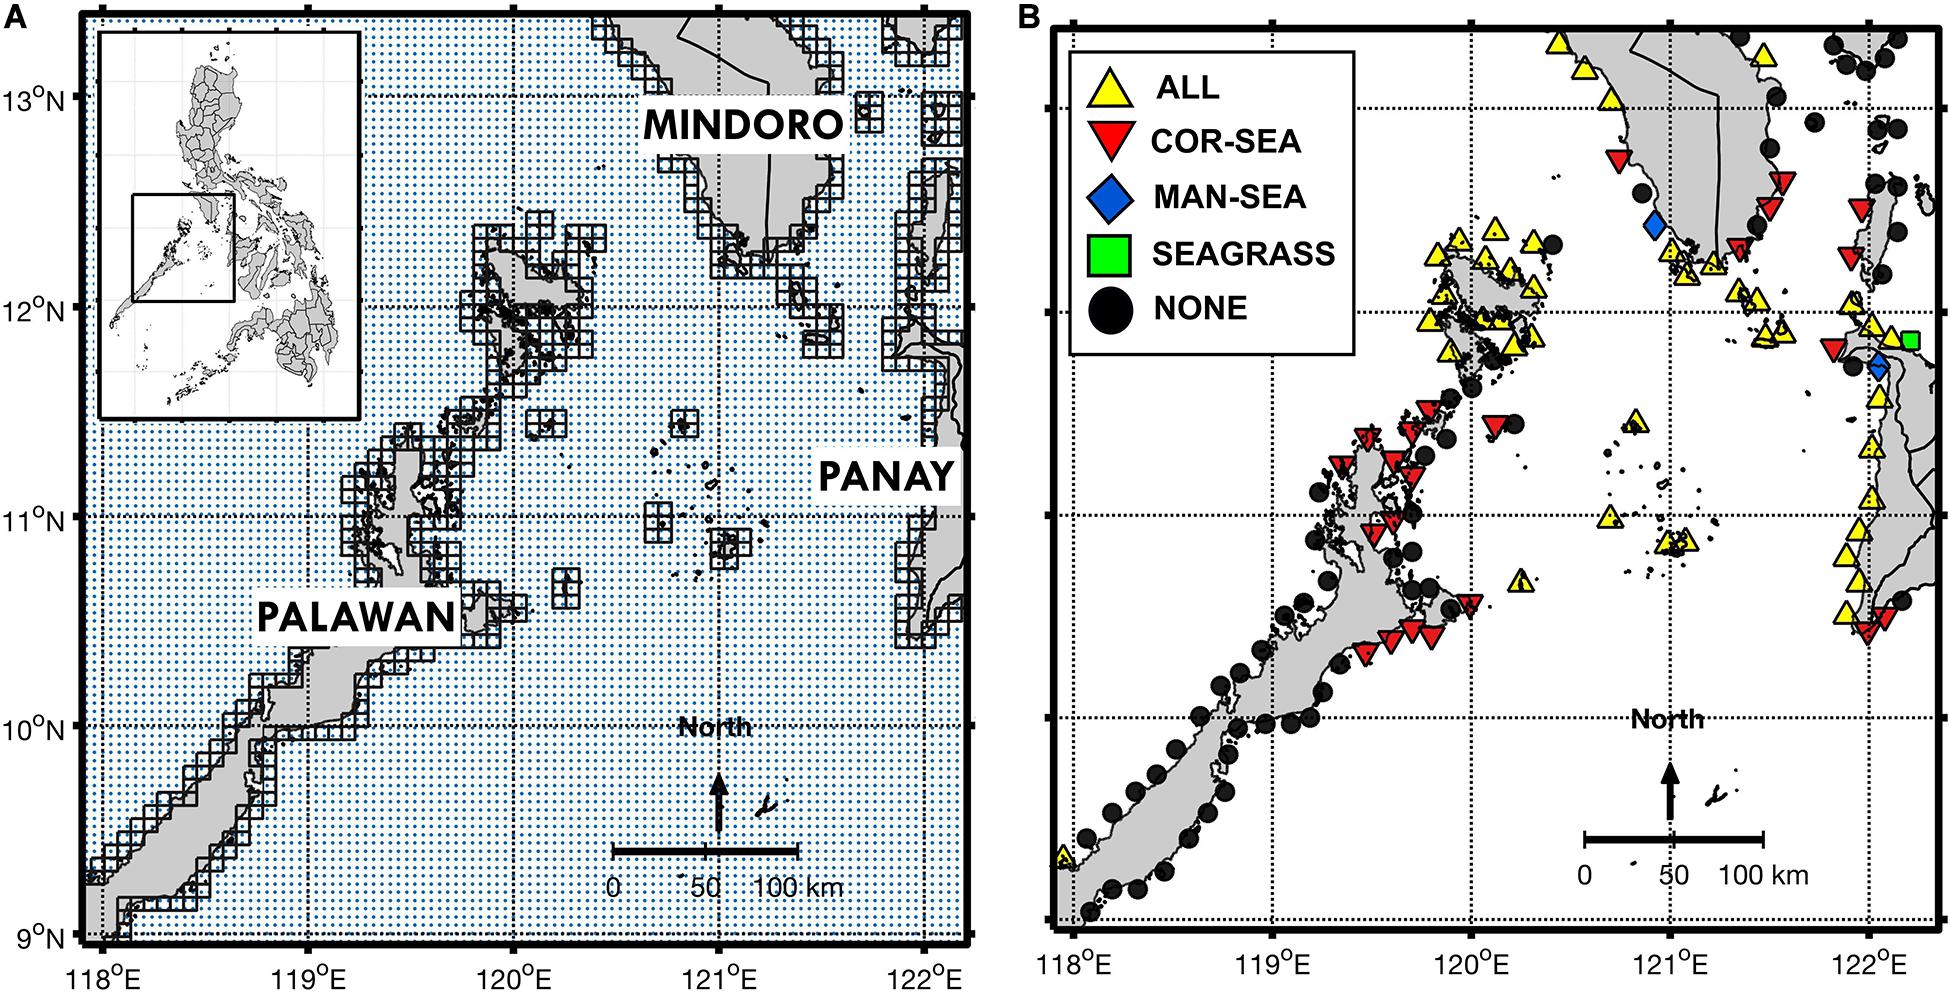
Figure 1. (A) The model domain with three major islands labeled. Romblon Island is north of Panay between 12°N and 13°N, while southern Marinduque is visible to the east of Mindoro (uppermost right of the domain). Coastal release and settlement sites are outlined in black while blue dots correspond to the regional SEAc HYCOM model grid. (B) Summary of habitat presence per node based on satellite data. Coastlines were plotted using the publicly available m_map and m_gshhs packages (Pawlowicz, 2020) through MATLAB R2016a software.
The biophysical model used in this study considered key processes in the life history of the model species including spawning location and timing, larval duration, and settlement in nursery areas. Spawning and settlement were accounted for by integrating the habitat requirements for each species into dispersal data, a method routinely performed for other benthic organisms modeled in the region (Abesamis et al., 2016; Pata and Yñiguez, 2019), but has not been implemented for sea cucumbers.
The Infomap network community detection algorithm was used to detect meaningful relationships and identify “coherent regions” within the domain based on passive larval dispersal data (Bohlin et al., 2014). It enables the grouping of source/settlement sites or nodes into coherent regions where particles moving within a region are relatively isolated from neighboring ones. This method presents several advantages: it only requires the number of particles which settle in a location from a certain source to compute for the weight and directionality of node connections, it doesn’t require an a priori assumption of the number of isolated regions that can be detected, and a region does not need to be composed of the exact same number of nodes, nor does the method impose a minimum nor maximum limit on node number. These advantages allow for the efficient partition of communities within a flow network, such as presented by the marine environment (Ser-Giacomi et al., 2015).
The use of larval dispersal models to address both conservation and fisheries management goals can become complicated, where the former seeks to preserve adult populations to ensure larval supply over longer time scales, while the latter aims to provide a source of income to fisherfolk in the short term. Narrowing down which sites are important to protect within a region for certain species that aligns with both objectives are vastly improved by taking into consideration a variety of metrics (Treml and Halpin, 2012), including local retention, larval import, larval export (Krueck et al., 2017), and source diversity (Dorman et al., 2016). The ecological impact of metapopulations can also be determined by measuring the distances over which it can supply larvae to other populations, or its dispersal kernel (Cowen and Sponaugle, 2009).
The primary objective of this study was to determine priority sites for the management of H. scabra and S. horrens populations in the western central Philippines. This was accomplished by running a passive dispersal model, delineating regions with high probabilities of internal larval exchange using Infomap, and using habitat filters to account for species-specific biological requirements. Larval dispersal metrics were calculated to enable ranking locations in terms of ecological importance in managing sea cucumber populations, and possible use as broodstock collection and restocking locations for aquaculture. Moreover, the results provide valuable information on the coupling of hydrodynamic factors and nearshore habitats that influence population dynamics of benthic marine invertebrates, improving ecosystem based management efforts in this vital biogeographic region.
Materials and Methods
Study Site
The study site is in the western central Philippines, covering the coastal regions of the islands of Palawan, Mindoro and Panay, along with Romblon and the southern portion of Marinduque Island (Figure 1A). This region is highly affected by monsoonal winds, with winds coming from the southwest starting May to October, and the northeast during November to April, with peak strength from January to February (May et al., 2011). Currents in the upper 150 m recorded from moorings showed relatively weak northward-flowing currents in Mindoro and Panay Straits for most of the year, with strong southerly flows during the Northeast monsoon (DJF) (Gordon et al., 2011). High (low) rainfall conditions occur from May to October (November to April) during the southwest monsoon (northeast monsoon). The eastern sides of the three major islands have a fairly dry period from November to April, but with the wet and dry seasons not as distinct (Tolentino et al., 2016). This strong seasonal variability led to model simulations being conducted separately per season (Table 1). Furthermore, previous studies have shown that seasonally varying oceanographic currents tend to have a profound effect on passive larval dispersal within the domain (Dorman et al., 2016; Pata and Yñiguez, 2019), while hatchery and rearing practices for cultured sea cucumber required adaptability to changing climate conditions (Juinio-Meñez et al., 2017b).
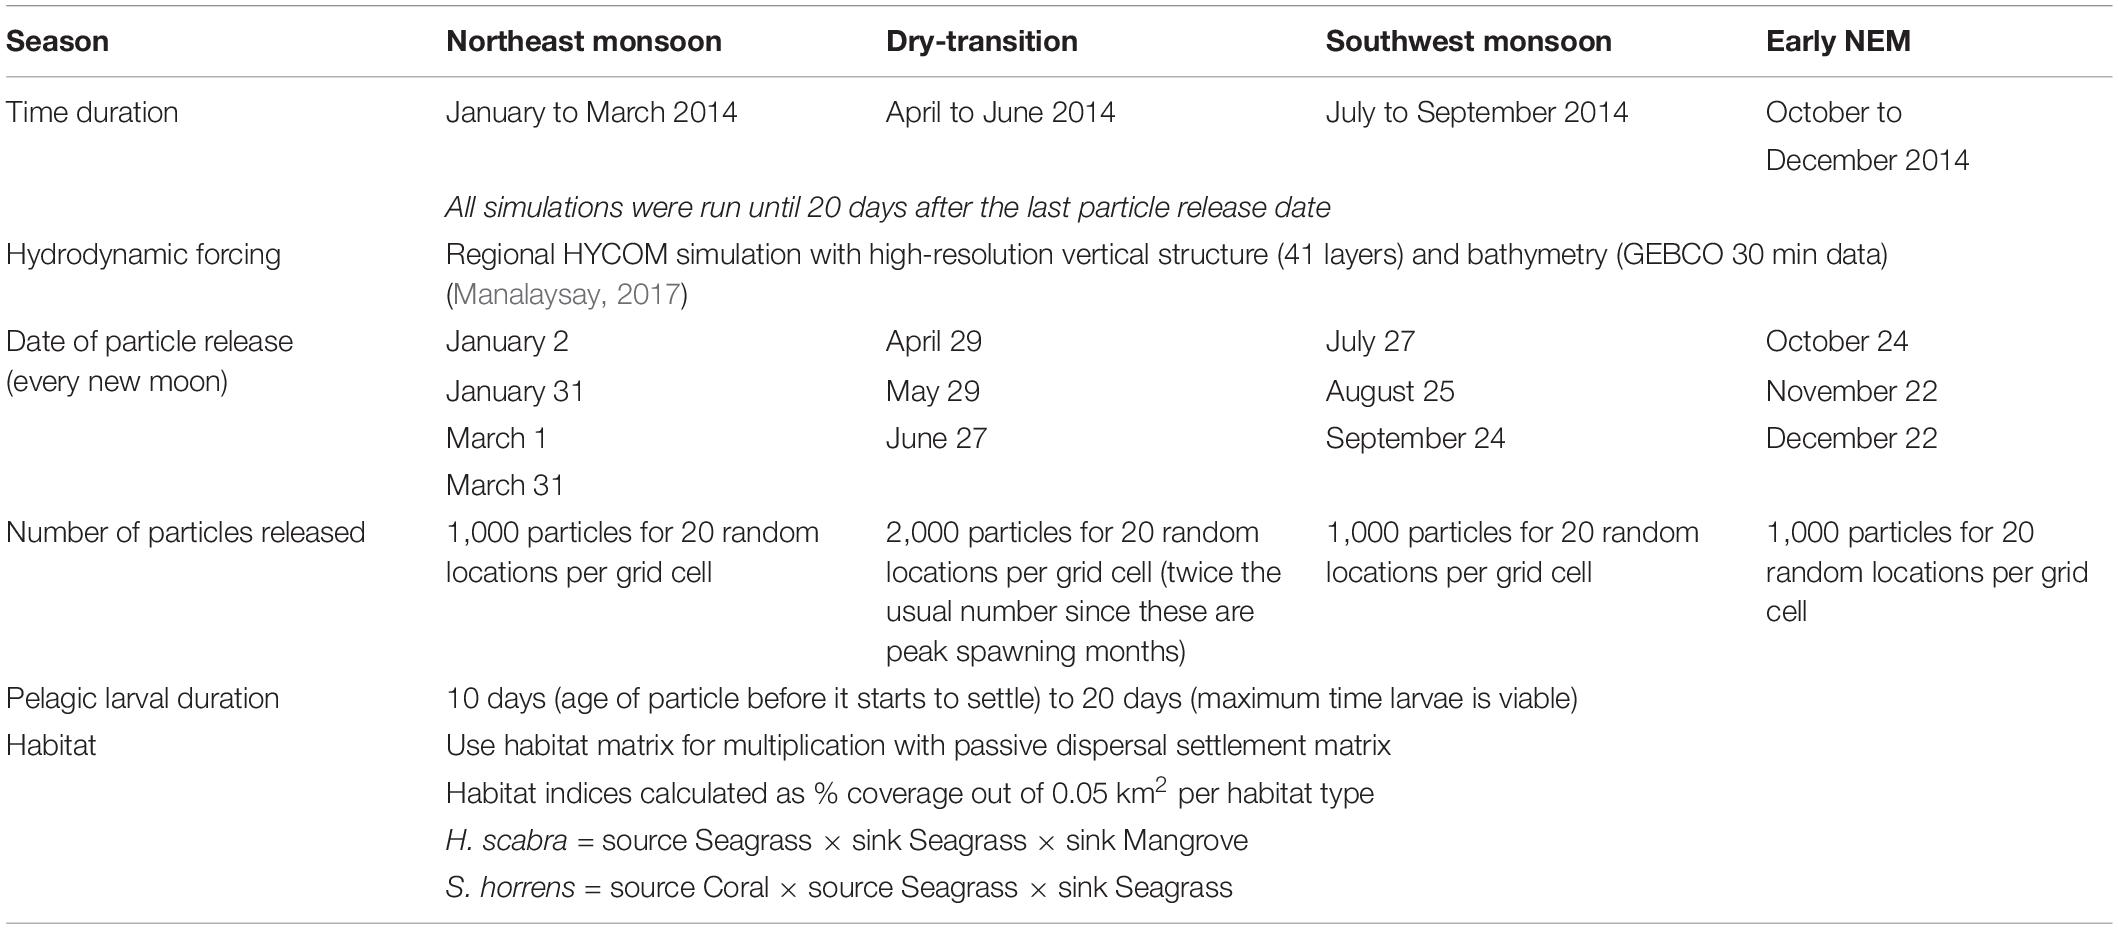
Table 1. Summary of parameters used for the biophysical model.
Biophysical Modeling
The Connectivity Modeling System (CMS) is an open-source stochastic particle-tracking model used to simulate the dispersal of particles in marine environments (Paris et al., 2013). CMS runs were set to run for 3 months per season [January, February, and March for the Northeast monsoon (NEM), April, May, and June for the dry-transition period, July, August, and September for the southwest monsoon (SWM) and October, November, and December for the early NEM, Table 1] over 1 year (2014) within the model domain (limits: 8.95°N 13.39°E, 117.89°N 122.1°E, Figure 1A). Daily surface currents from a regional Hybrid Coordinate Ocean Model (HYCOM) with a resolution of ∼4.4 km was used as hydrodynamic forcing for CMS model runs. This regional model is nested within the global HYCOM model, and was shown to simulate pertinent circulation features within the Philippine archipelago (Manalaysay, 2017).
Release and settlement sites were assigned as 7 km2 squares along the coastline throughout the model domain (Figure 1A). One thousand particles were released from 20 random points inside each square to account for patchy habitat locations along the coast. Particle transport was driven by surface currents (depth-averaged from 1 to 10 m), and programmed to avoid coastlines whereby velocities from neighboring cells were applied to a particle stuck on a “land” cell until it reached a “water” cell. Release of new cohorts was scheduled for new moon dates within each seasonal run to mimic sea cucumber spawning behavior (as detailed by Al-Rashdi et al., 2012; Hu et al., 2013). For the peak spawning months of April to June (Juinio-Meñez et al., 2013), the number of particles released per grid cell was doubled. Model particles were viable for settlement after 10 days, up to a maximum of 20 days. These limits were based on Pelagic Larval Duration values observed in situ for H. scabra (Agudo, 2006; Al-Rashdi et al., 2012) and S. horrens (Hu et al., 2010, 2013). Mortality within the biophysical model was accounted for by reducing the larval cohort by half every 90 days.
Delineating Marine Provinces Using Infomap
Grid cells which acted as release and settlement locations (total of 480 grid cells; Figure 1A) were grouped spatially to within a radius of 10 km, producing a total of 127 nodes (Figure 1B). Ten km is the lower limit of the range of recommended sizing and spacing between adjacent MPAs based on predicted larval dispersal distances (Weeks et al., 2010). Each node was assigned to a municipality based on proximity (Figure 2 and Supplementary Table S1, PhilGIS, 2020), and represented a possible functional unit of protected marine area.
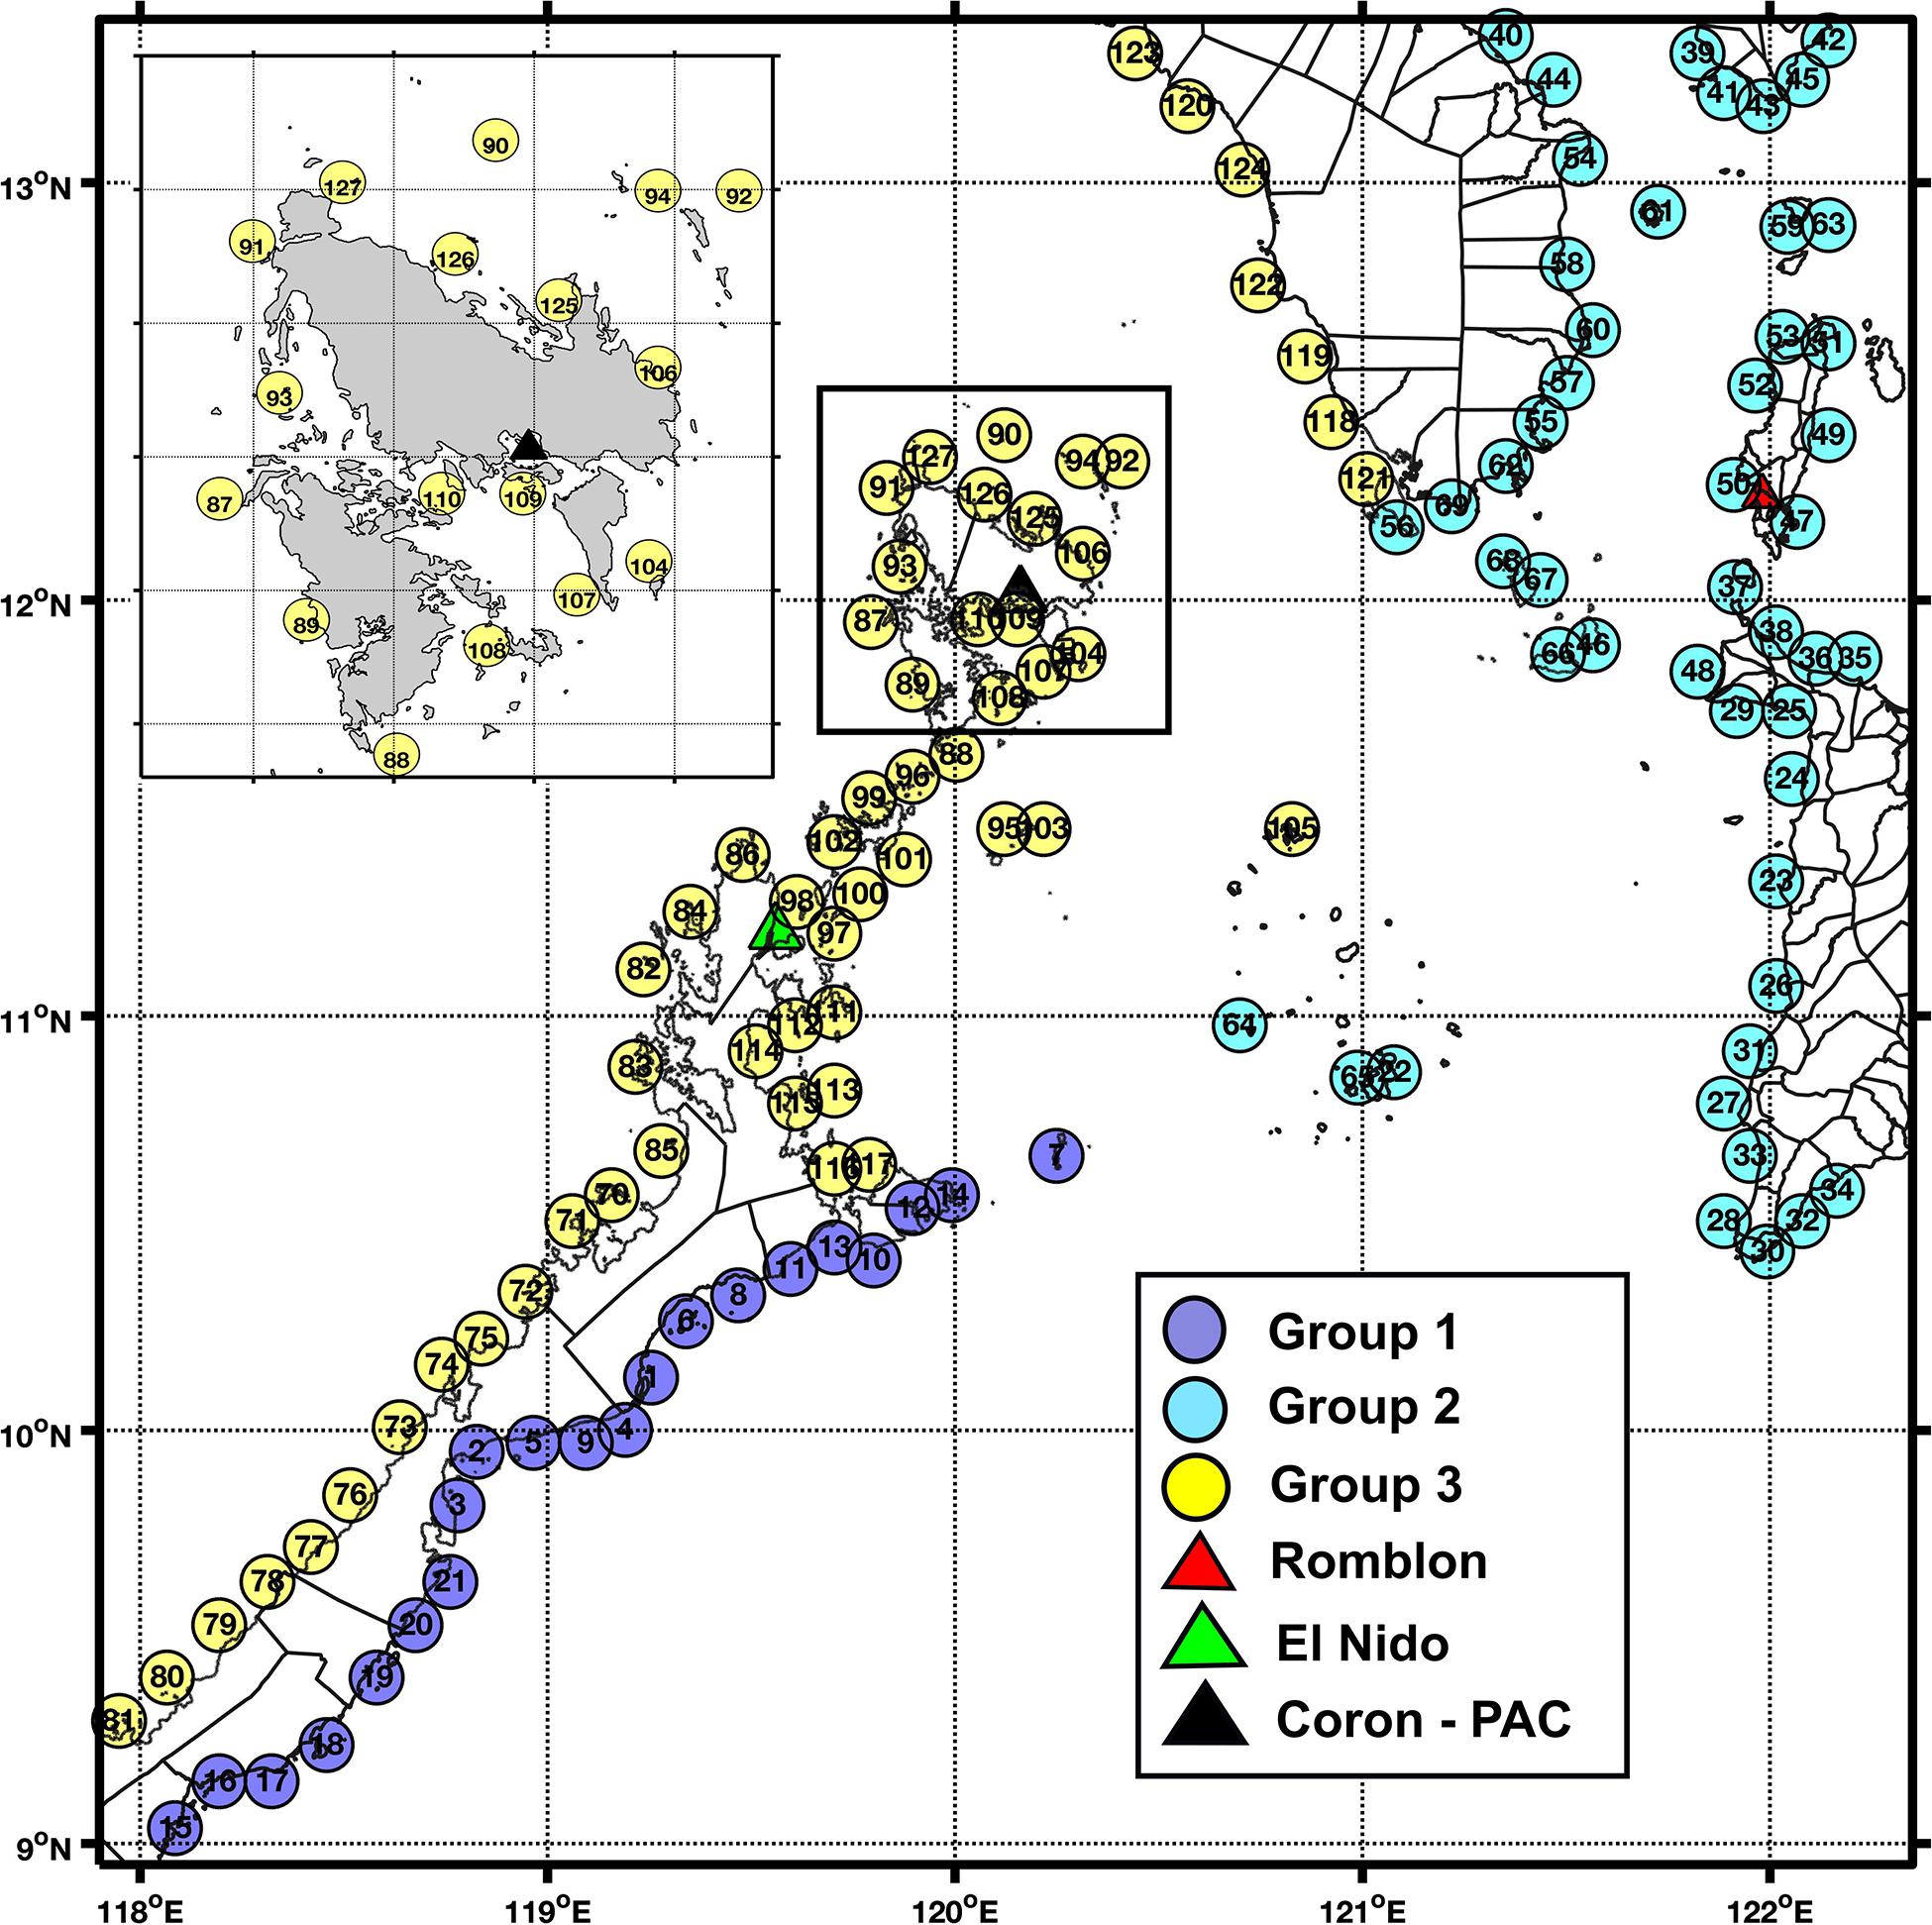
Figure 2. The three provinces delineated by Infomap based on particle dispersal data for the dry-transition period. Municipal boundaries are shown on landmasses, and names per node location are listed in Supplementary Table S1. Inset shows a close-up of locations around Coron Island. Triangles pertain to locations where samples were collected for H. scabra genetic analysis used in Ravago-Gotanco and Kim (2018), and the black triangle for their Coron sample also corresponds to the location of the Palawan Aquaculture Corporation site from Juinio-Meñez et al. (2017b).
All particles released from or which settled within a grid cell were then combined with those of other grid cells assigned to the same node. Seasonal data on the number of particles released and settled, as well as directionality between nodes, were subjected to the Infomap network community detection algorithm. The provinces represented spatial units with a high degree of exchange between nodes given the underlying seasonal hydrodynamic conditions. To determine the reliability of the calculated marine province boundaries, the coherence ratio was computed per province using the following formula (Ser-Giacomi et al., 2015):
where is the coherence ratio per province B within the domain (A), t0 is the initial release time step and τ is the settlement time step, m(Bi) is the total number of particles released within the whole province, regardless of whether or not they settled successfully, i and j refer to node locations, and P(t0,τ) is the total number of particles which were able to settle within the province. Essentially, higher coherence ratios signify a higher proportion of particles which were released in a province that stayed within its boundaries throughout the simulation, and reflects groupings with minimal particle leakage to other provinces (Rossi et al., 2014).
Dispersal matrices were constructed based on the node locations. These nodes were grouped according to the marine provinces from the seasonal run with the highest coherence ratios, and this framework applied to outputs from all other seasons. Settlement probabilities within dispersal matrices were computed as the total number of particles that settled in a node divided by the total number of particles released over each 3-month seasonal run.
Incorporating Habitat With Connectivity by Multiplying Passive Dispersal and Habitat-Based Matrices
The availability of certain habitat types is essential to the life cycles of H. scabra and S. horrens. Both species have similar nursery yet different adult life preferences. Stichopus juveniles require seagrass, while adults migrate to adjacent coral reef habitats (Eriksson et al., 2012, 2013; Palomar-Abesamis et al., 2016). Holothuria juveniles had higher survival rates in areas with mangrove-seagrass environments (Dance et al., 2003) or intermediate seagrass cover (Ceccarelli et al., 2018). Adults tend to aggregate in seagrass beds (Dissanayake and Stefansson, 2011), and prefer areas with nearby mangrove stands (Jontila et al., 2017). Thus in the model, for an area to be a viable “sink” or settlement location for H. scabra it should contain seagrass and mangroves and for S. horrens, seagrass adjacent to a coral reef. On the other hand, the “source” or spawning sites for adult H. scabra are locations with seagrass and mangrove cover and coral reefs for S. horrens.
Total coral, seagrass and mangrove areas in km2 were measured along the coastlines of the domain using satellite imagery (Blanco et al., 2014). The datasets used were mangrove, seagrass and coral maps from 2015 to 2018 downloaded from the Landsat 8 satellite of the US Geological Survey. The area per habitat type within a release/settlement grid cell from the CMS model was calculated using QGIS software (Supplementary Figure S1, QGIS, 2019). Similar to particle dispersal data, total habitat area was tallied for all grid cells grouped within a 10 km radius, then allocated to a representative node (Figure 1B). Habitat indices were calculated as the fraction of total habitat area out of 5 hectares (0.05 km2), a typical limit designated for sea cucumber ranching activities (Juinio-Meñez et al., 2013). Sites with habitat area greater than 0.05 km2 were assigned an index of 1. “Source” matrices contained the habitat index for a node location across rows and “sink” matrices had the index across columns (Supplementary Figure S2) to mirror the structure of passive dispersal connectivity matrices. Habitat-derived matrices were then multiplied with those from seasonal passive dispersal model runs to account for the source and sink requirements of H. scabra and S. horrens (Table 1). This technique assumes sites with a similar index will have an identical level of support for sea cucumbers despite differing habitat conditions, i.e., a site with 90% coral and 10% mangrove would have the same effect on settlement probability as a site with 10% coral and 90% mangrove. Since the presence and proximity of complementary habitat conditions act to support wild populations within a narrow spatial range (Dissanayake and Stefansson, 2011; Eriksson et al., 2012; Jontila et al., 2017, 2018a), this is deemed a reasonable assumption. Applying habitat matrices serve mainly to remove sites with no viable substrate for spawning and settlement, and to parameterize the settlement probabilities derived from passive dispersal.
Calculating Connectivity Metrics for Comparison of Node Performance
The larval dispersal kernel was estimated as the total number of particles that settled within 10 km increments from their source node until a maximum distance of 1,270 km (based on 127 total nodes roughly 10 km apart). Four indices were used to characterize the degree of connectivity for each node: local retention, self-recruitment, average settlement success, and sink diversity index. Each index was calculated per location for each season and species, then ranked to determine which sites maximize larval exchange from a higher diversity of sources while also minimizing local retention.
Local retention LRi refers to the ratio of particles released by a source node retained in the same location to the total number of particles released from that node (Dubois et al., 2016):
where Pi,j refers to the particles released by the node i and settled in the same node i. Nodes with high values of this parameter are likely self-persistent.
Self–recruitment (SRi) is the fraction of particles successfully settled in a node which originated from the same node (Dubois et al., 2016):
where Pi,i is the number of particles released by a node which settled in the same node and the denominator is the sum of all particles which settled successfully in the node regardless of source (N is the total number of nodes, and Px,i is the total number of particles released from all nodes which settled in node i). Self-recruitment measures the fraction of settlers within a location that was locally produced.
Average settlement success is a measure of the number of particles released from a node which settled successfully on other nodes (Dorman et al., 2016):
where C(so,si) is the connectivity between a source and sink node, S(so,si) is the total number of particles from a source which settled on separate node locations, and R(so) is the total number of particles released by a source. High settlement success establishes a site as an important source for other sites within the domain.
The source diversity index is based on the Simpson Index of Diversity (Dorman et al., 2016):
where D(si) is the diversity index, ni is the number of larvae from a specific source (so), and N is the total number of larvae which settled on a node. This index measures the number of sources (richness) and number of larvae from each source (evenness) which supply a given sink.
Results
Hydrodynamic Features of the Domain and Marine Provinces Calculated by Infomap
Surface current flow within the domain was highly seasonal, and dominated by the Mindoro Jet, a fast-flowing southward current that moves between Mindoro and northern Palawan islands (Figure 3). It was strongest during the early NEM, followed by the SWM, weak during the NEM and weakest during the dry-transition period. During the NEM and its early onset, the current moved past the Mindoro Strait and southeastward into eastern Palawan. It reached only up to Cuyo and Magsaysay Islands near 11°N 121°E during the SWM, and a similar pattern was observed during the dry-transition months, with much weaker flow. Eastern Mindoro had a similar strong southward-flowing current through the Tablas Strait (located 11–12°N 121.5–122°E). Along the coasts of western Palawan and Panay, weak flows were observed year-round.
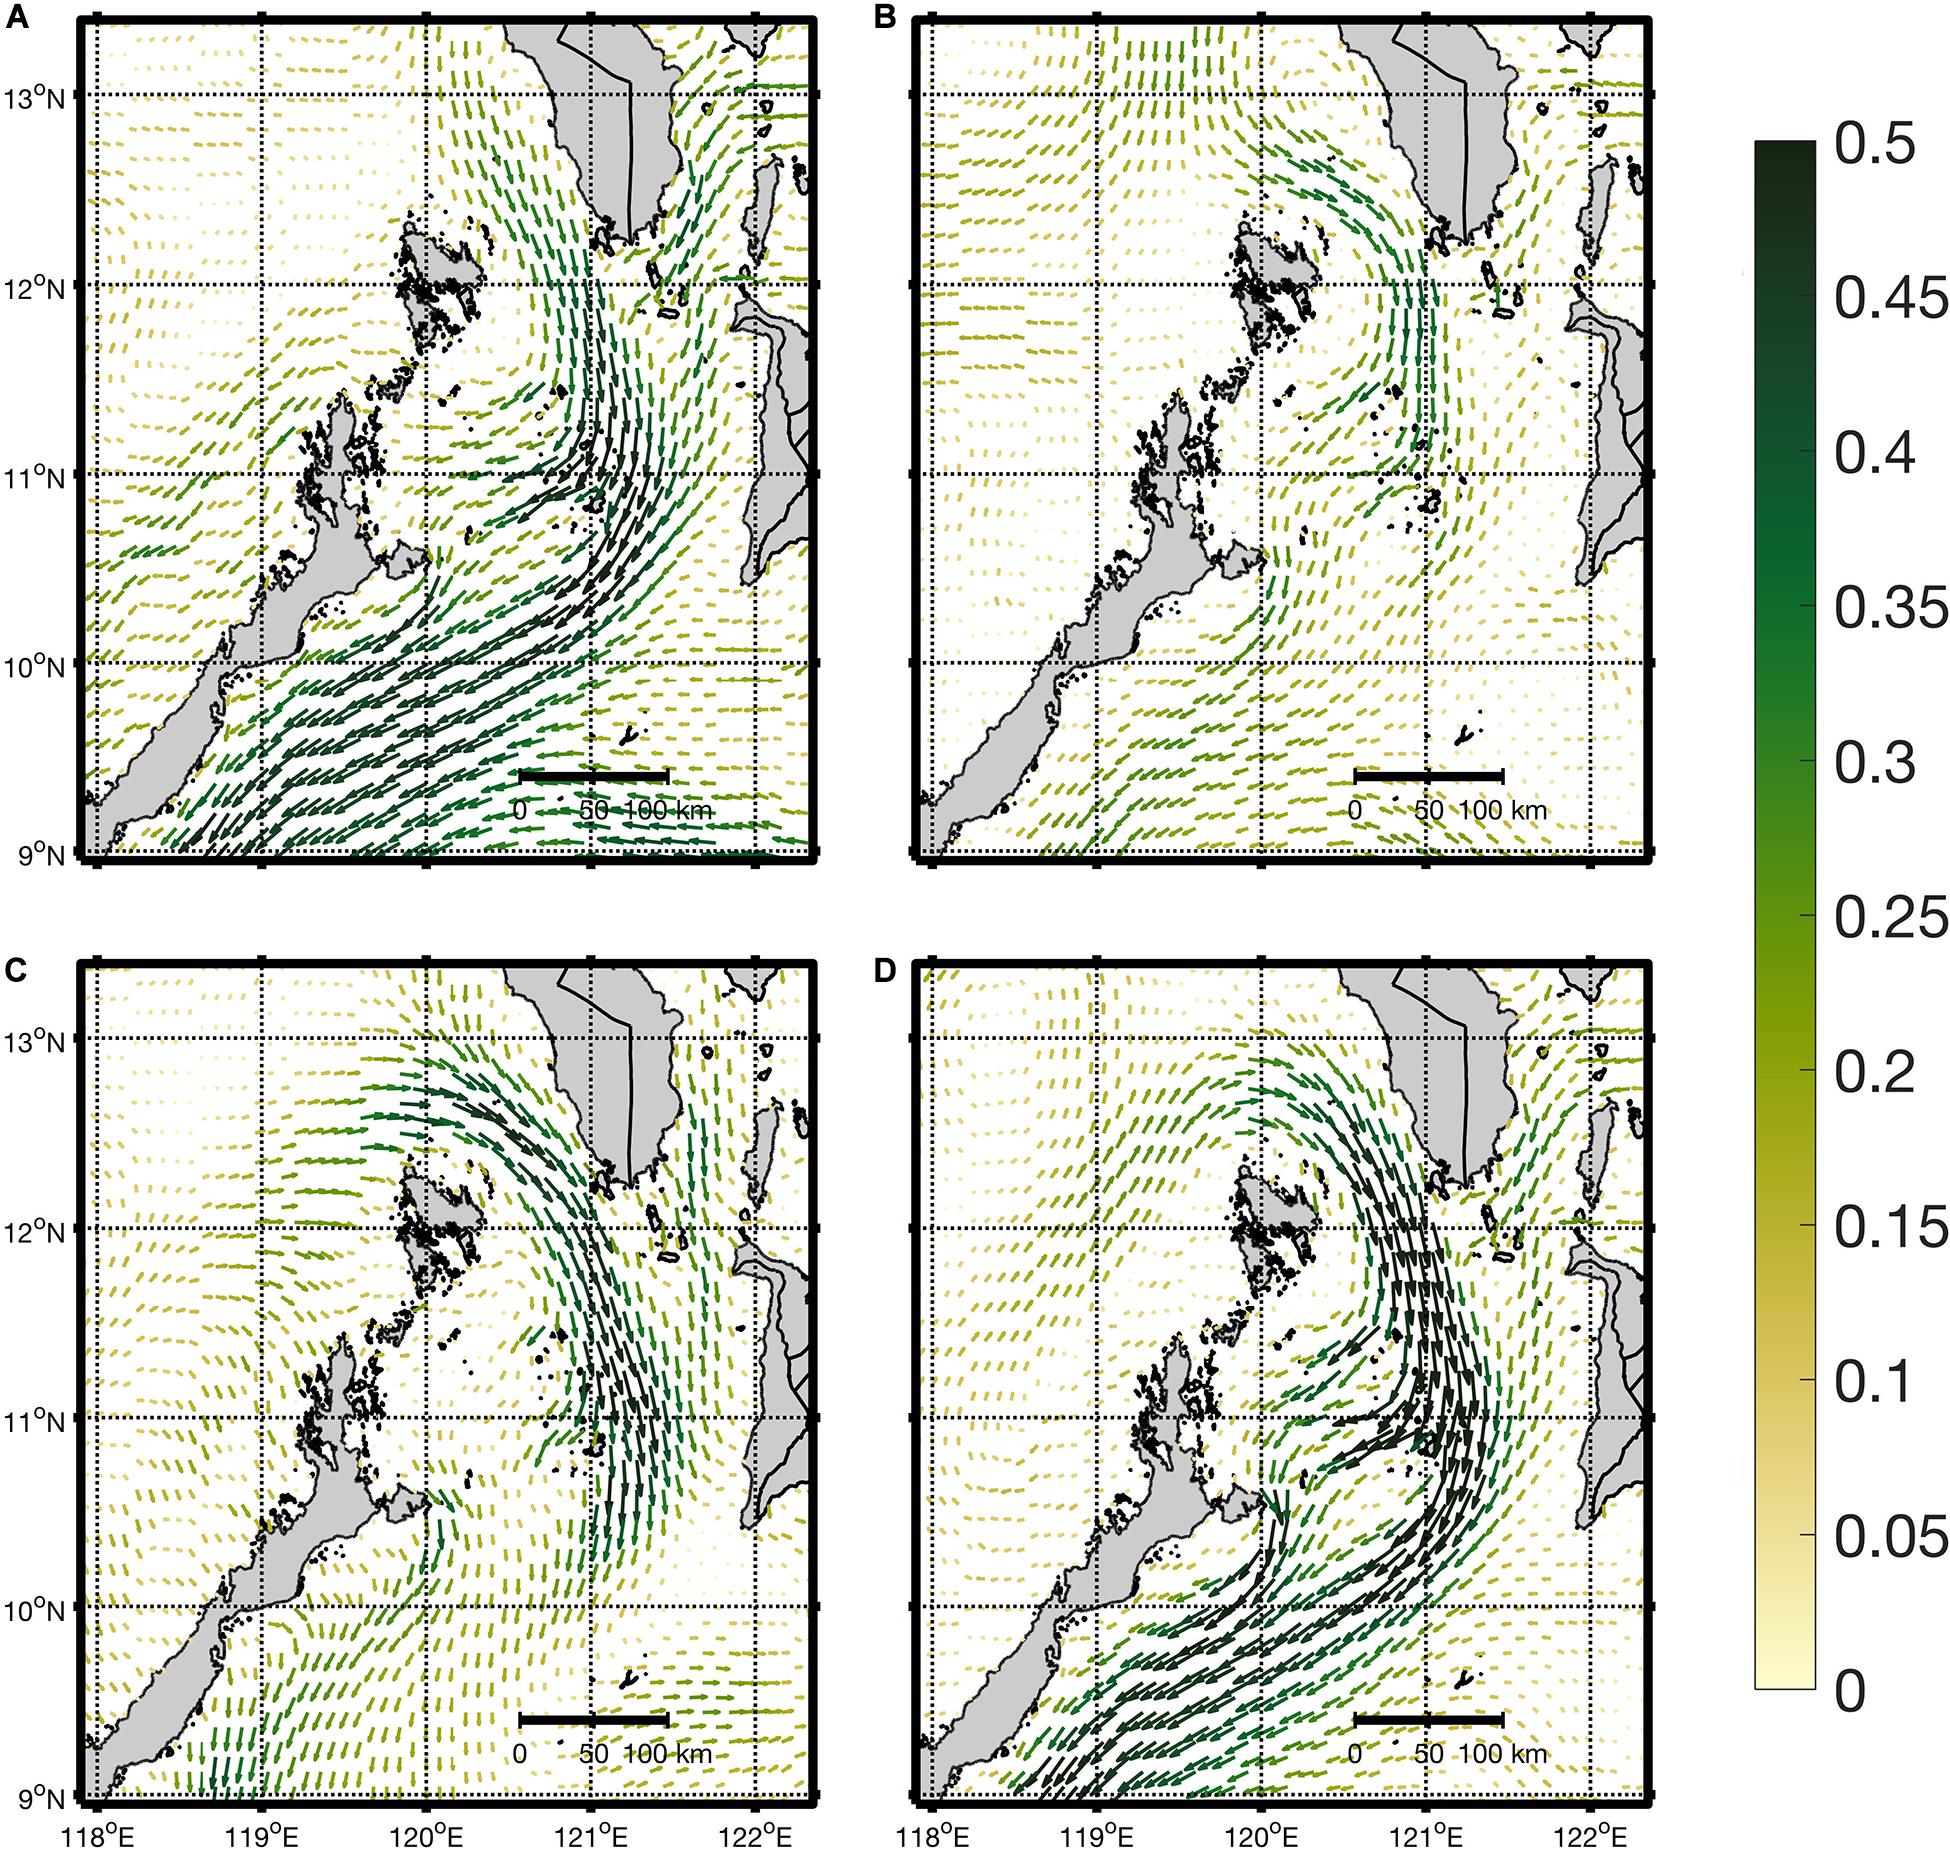
Figure 3. Average surface currents per season: (A) NEM, (B) dry-transition, (C) SWM and (D) early NEM from the regional SEAc HYCOM model used for forcing the larval dispersal model. Color overlay represents current magnitude in ms– 1 and uses the colormap speed from the cmocean toolbox (Thyng et al., 2016).
Each season had a different set of marine provinces based on Infomap (Supplementary Figure S3). Calculated coherence ratios per group across seasons had a significant difference based on one-way ANOVA (p < 0.05, Supplementary Table S2). The provinces determined using Infomap for the months of April, May, and June (dry-transition season) had the highest coherence ratios, likely due to having twice the number of particles released during this run (Table 1). These node groupings were subsequently used for the connectivity matrices across all seasons and sea cucumber species considered. The domain was effectively divided into three marine provinces namely: southeastern Palawan (Group I), eastern Mindoro and western Panay, with Romblon and southern Marinduque (Group II), and western and northern Palawan with western Mindoro (Group III). For smaller islands near 11°N 121°E, Magsaysay and Cuyo Islands were under Group II, while Agutayan was classified under Group III (Figure 2 and Supplementary Table S1).
Connectivity Matrices for Passive Dispersal and With Habitat Matrices Applied
For the passive dispersal runs, majority of settlement probabilities were below 0.5 with stronger connections concentrated on the diagonal of the connectivity matrix (self-seeding) and among nodes within each marine province (color-coded rectangles within connectivity matrices for Figure 4 correspond to color-coded locations in Figure 2). The dry-transition season had the highest number of connections (1,887), followed by the SWM (1,615), NEM (1,590), and early NEM (852). Group I sites were generally weak sources for Group II and III, having the most connections during SWM. Group II was a strong source for Groups I and III during the NEM and early NEM period, while being a weaker source during the dry-transition and SWM. Group III was a relatively good source for Group I throughout the year, and was a weak source for Group II only during the SWM. As a sink, Group I received a considerable amount of particles from both groups regardless of the season, but especially during the NEM. Throughout the year, Group II locations were not good sinks, with no larvae from Group I reaching Group II during the dry-transition period. They served as weak sinks for Groups I and III during the SWM. Group III was a good sink for Group I and II only during the NEM and early NEM (Figure 4).
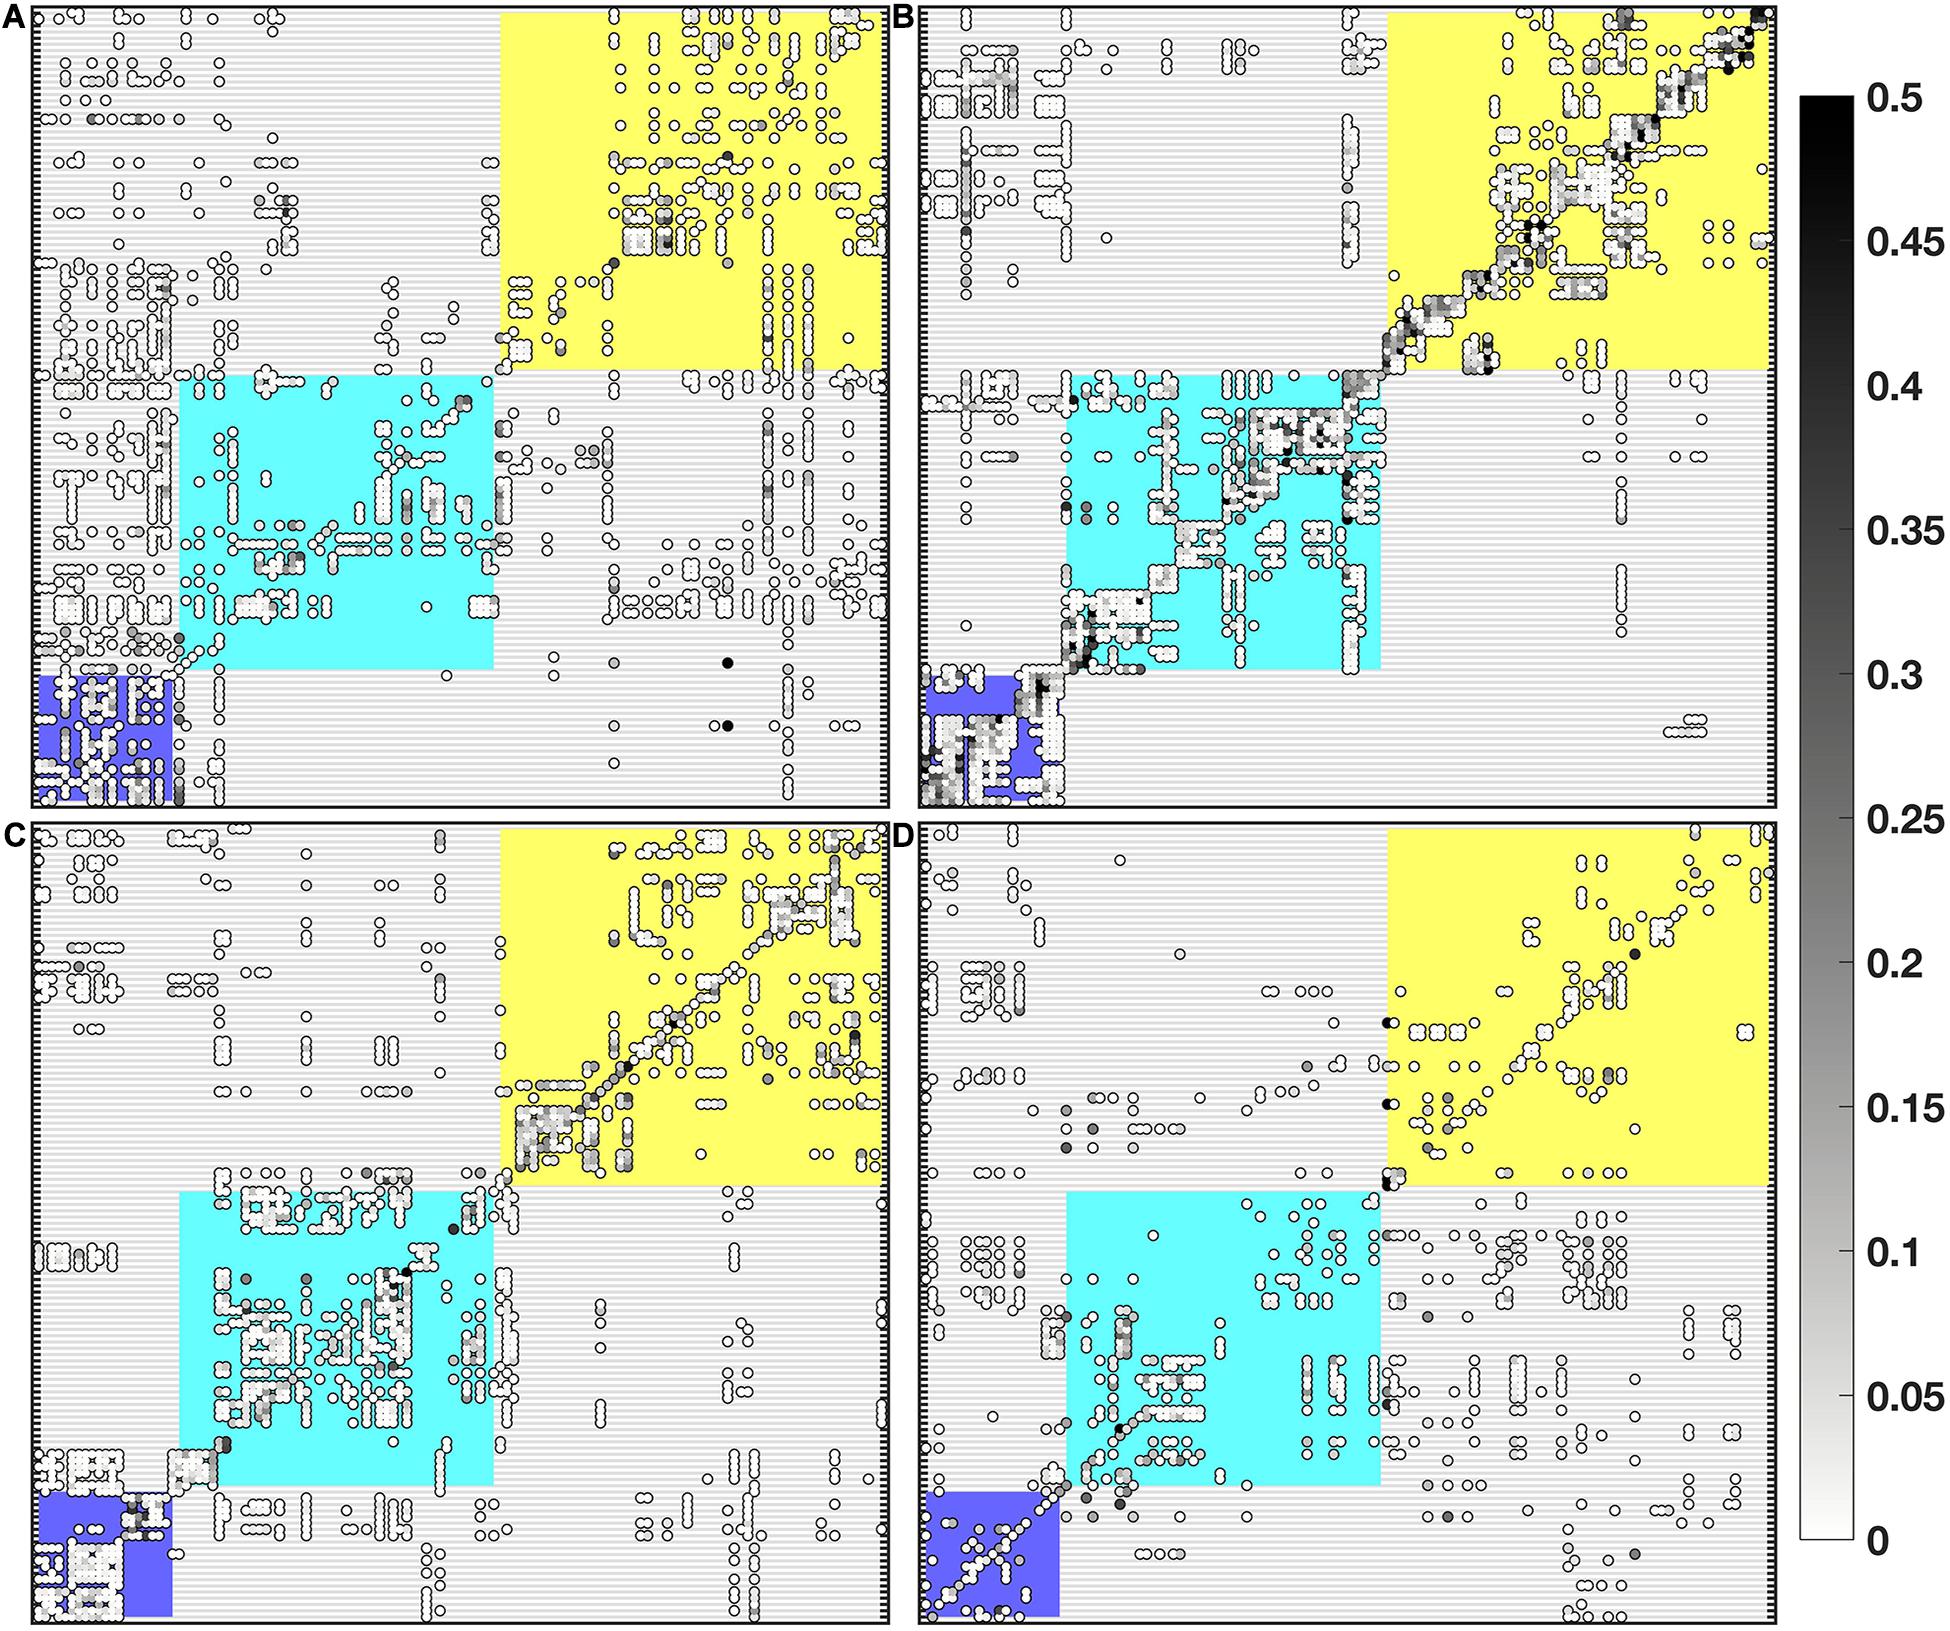
Figure 4. Settlement matrices for seasonal runs: (A) NEM, (B) dry-transition, (C) SWM, and (D) early NEM. Nodes are arranged according to the dry-transition coherent regions, with color-coded rectangles corresponding to the three marine provinces from Figure 2. The color overlay of markers within settlement matrices represents settlement probability values and uses the colormap gray from the cmocean toolbox (Thyng et al., 2016).
Out of 127 total nodes, 41 had all three habitat types, 23 had both seagrass and coral, 2 had seagrass and mangrove, 1 location had only seagrass present, and 60 nodes had no habitat coverage (Figure 1B). This translates to 43 suitable locations for H. scabra, and 64 for S. horrens (refer to Table 1). As such, the use of habitat area to scale settlement probabilities resulted in decreases in the total number of connections per season H. scabra (Supplementary Figure S4): NEM = 78%, dry-transition: 71%, SWM = 81% and early NEM = 85%; S. horrens (Supplementary Figure S5): NEM = 67%, dry-transition: 62%, SWM = 72%, and early NEM = 75%, and a reduction in the number of connections with relatively high settlement probabilities (Figure 5). Locations for H. scabra were concentrated in Groups II and III, as most of the southeastern Palawan sites (Group I) had no suitable habitat (Figure 1B). S. horrens had a wider distribution of appropriate locations among the three marine provinces.
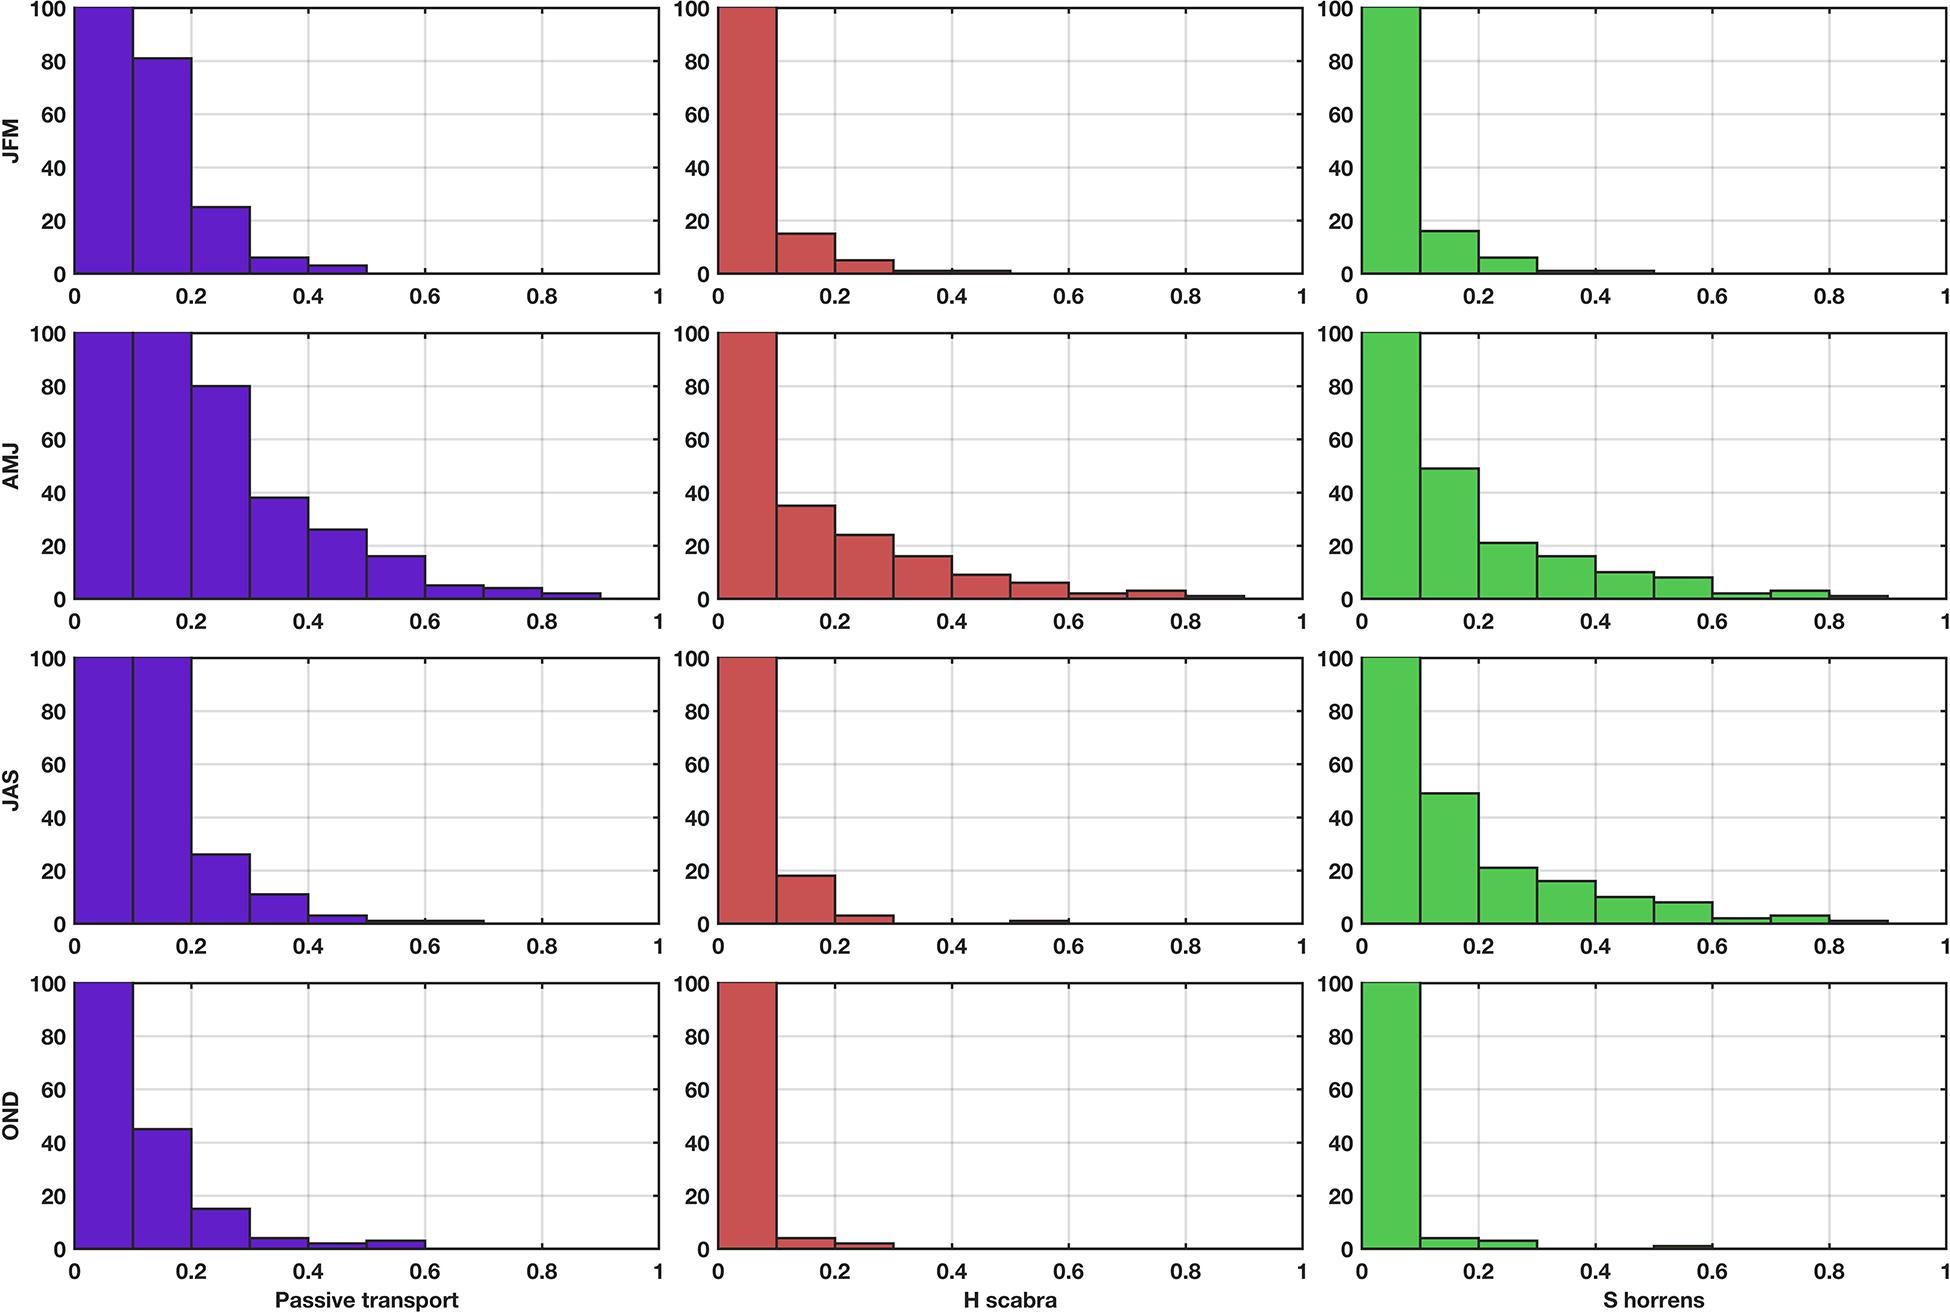
Figure 5. Histogram of settlement probabilities per season (rows from top to bottom: NEM, dry-transition, SWM and early NEM) under passive transport (column 1, purple-shaded bars), H. scabra (column 2, red-shaded bars), and S. horrens (column 3, green-shaded bars) habitat conditions. Most connections had a probability of less than 0.2, and for passive transport conditions approximately 1,000 connections had probabilities equal to or less than 0.1. The maximum number of connections plotted was capped at 100 to emphasize changes in the number of connections with probabilities greater than 0.2 for H. scabra and S. horrens.
Larval Dispersal Kernel and Ranking Locations Based on Connectivity Metrics
The estimated larval dispersal kernel for the passive dispersal model runs showed that on average, majority of particles (>50%) settle within 200 km of their source site, with a high concentration of particles settling within 50 km (Supplementary Figure S6). The highest number of successfully settled particles were observed during the dry-transition season, followed by the NEM, SWM, and early NEM. S. horrens had more suitable locations than H. scabra, and thus more particles were present in the S. horrens dispersal kernel.
The local retention, self-recruitment, average settlement success and sink diversity index values were calculated per location for H. scabra (Figure 6) and S. horrens (Figure 7). Locations were ranked according to these values, and Figure 8 summarizes the locations of sites in the bottom 10% (top 25%) in terms of local retention and self-recruitment (average settlement success and sink diversity index). Priority locations varied seasonally, and no site consistently met all criteria across seasons and both species. For local retention and self-recruitment, there were six sites in total that were bottom ranked, with four sites in common between both species and two sites that were for S. horrens only. For settlement success and source diversity index, 10 sites were top ranked with 2 in common for both species and 5 (3) for H. scabra (S. horrens) only (Table 2).
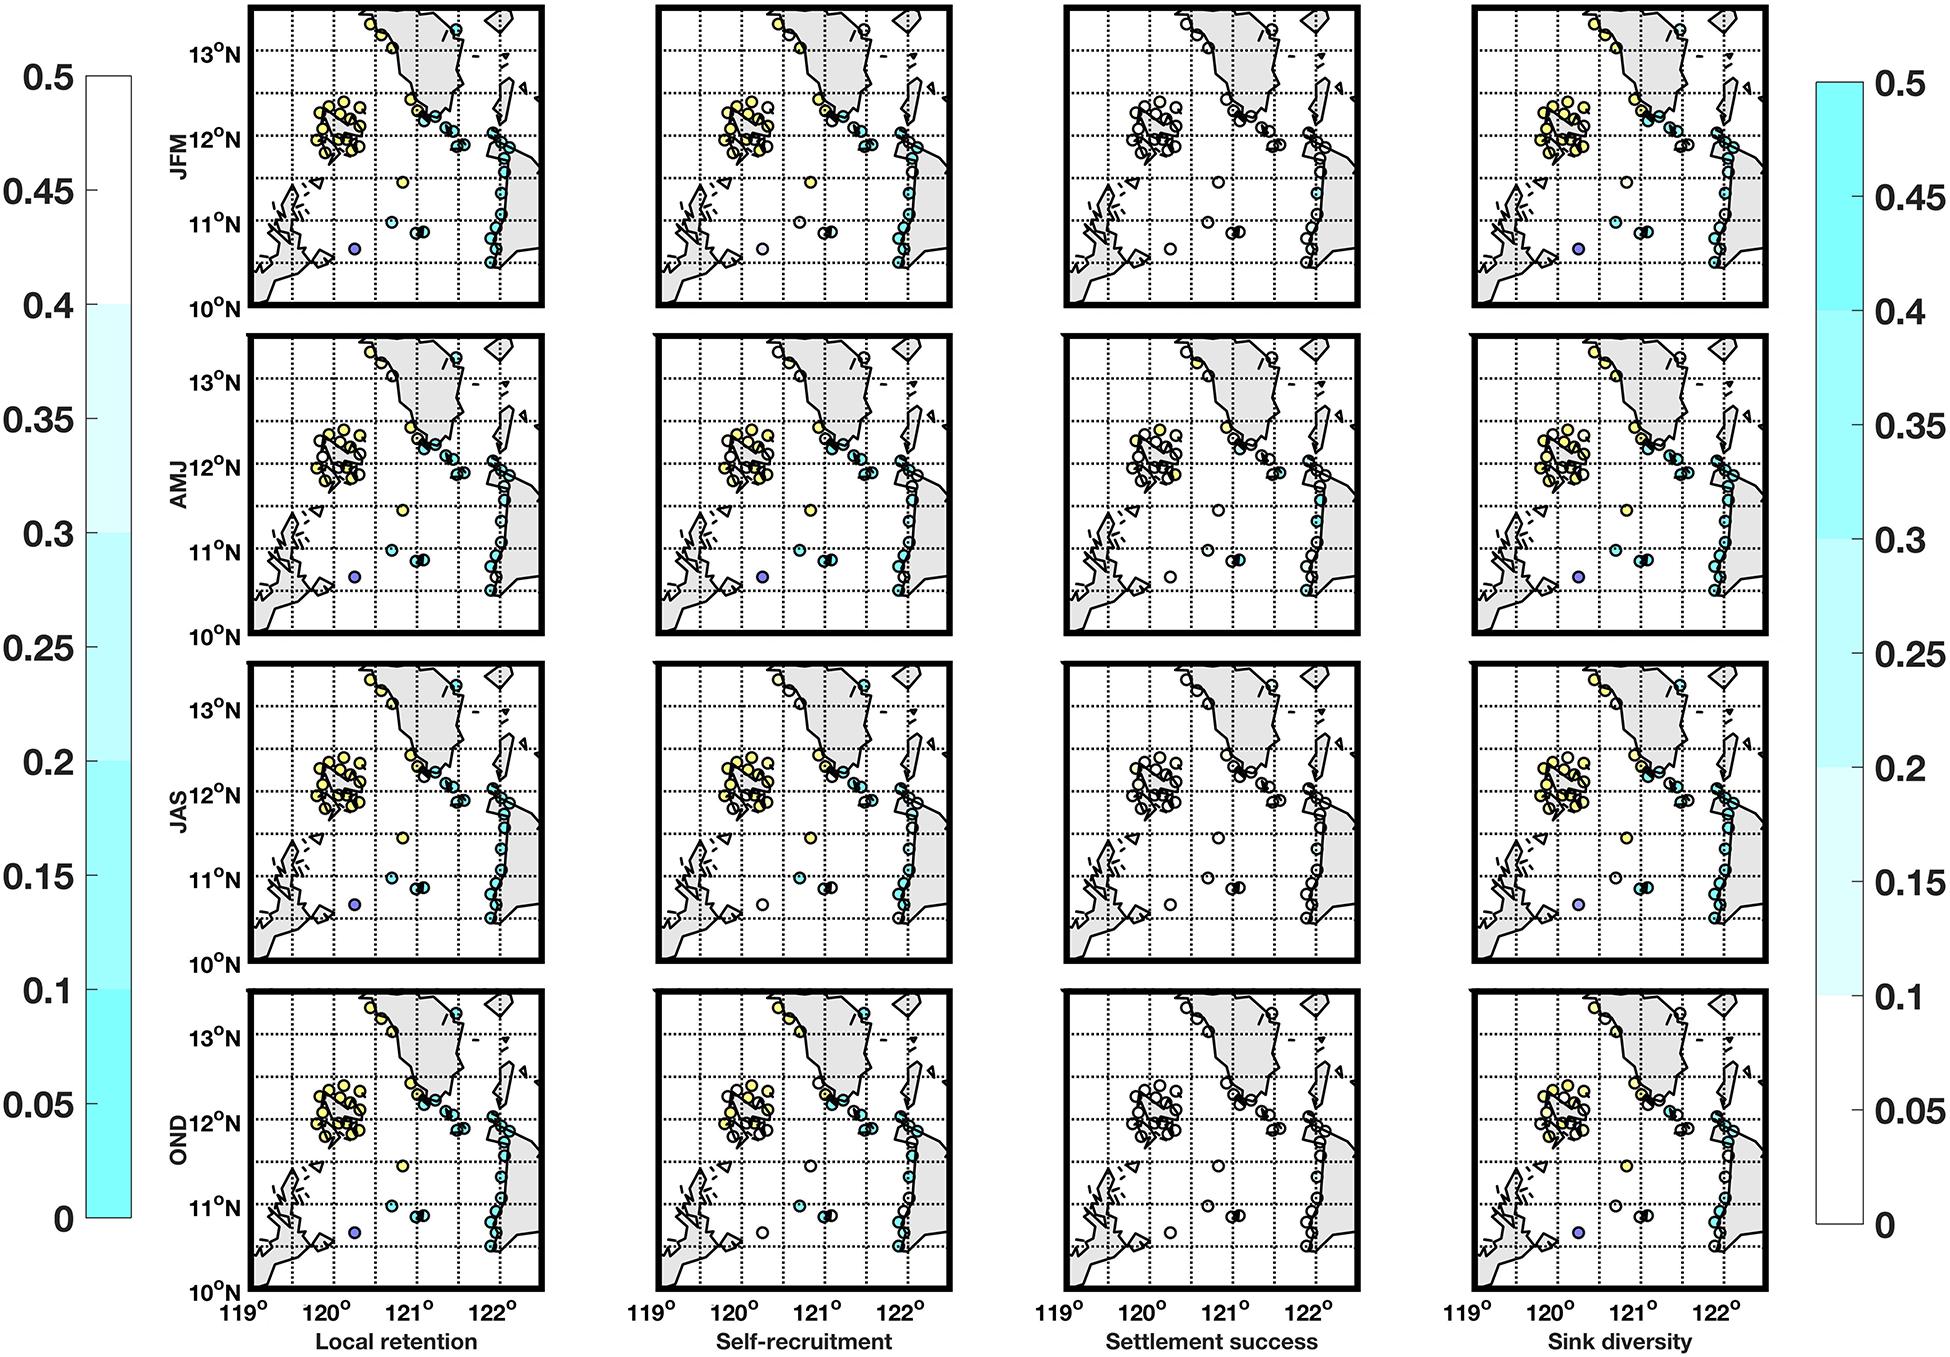
Figure 6. Local retention (column 1), self-recruitment (column 2), settlement success (column 3), and sink diversity (column 4) values for locations with suitable habitat for H. scabra species for the NEM (row 1), dry-transition (row 2), SWM (row 3), and early NEM (row 4). Locations are colored according to their marine province (Group 1 = purple, Group 2 = cyan, and Group 3 = yellow). Local retention and self-recruitment (settlement success and source diversity) values are shaded according to the representative colorbar on the left (right) and as such, possible priority locations are in darker shades for all maps.
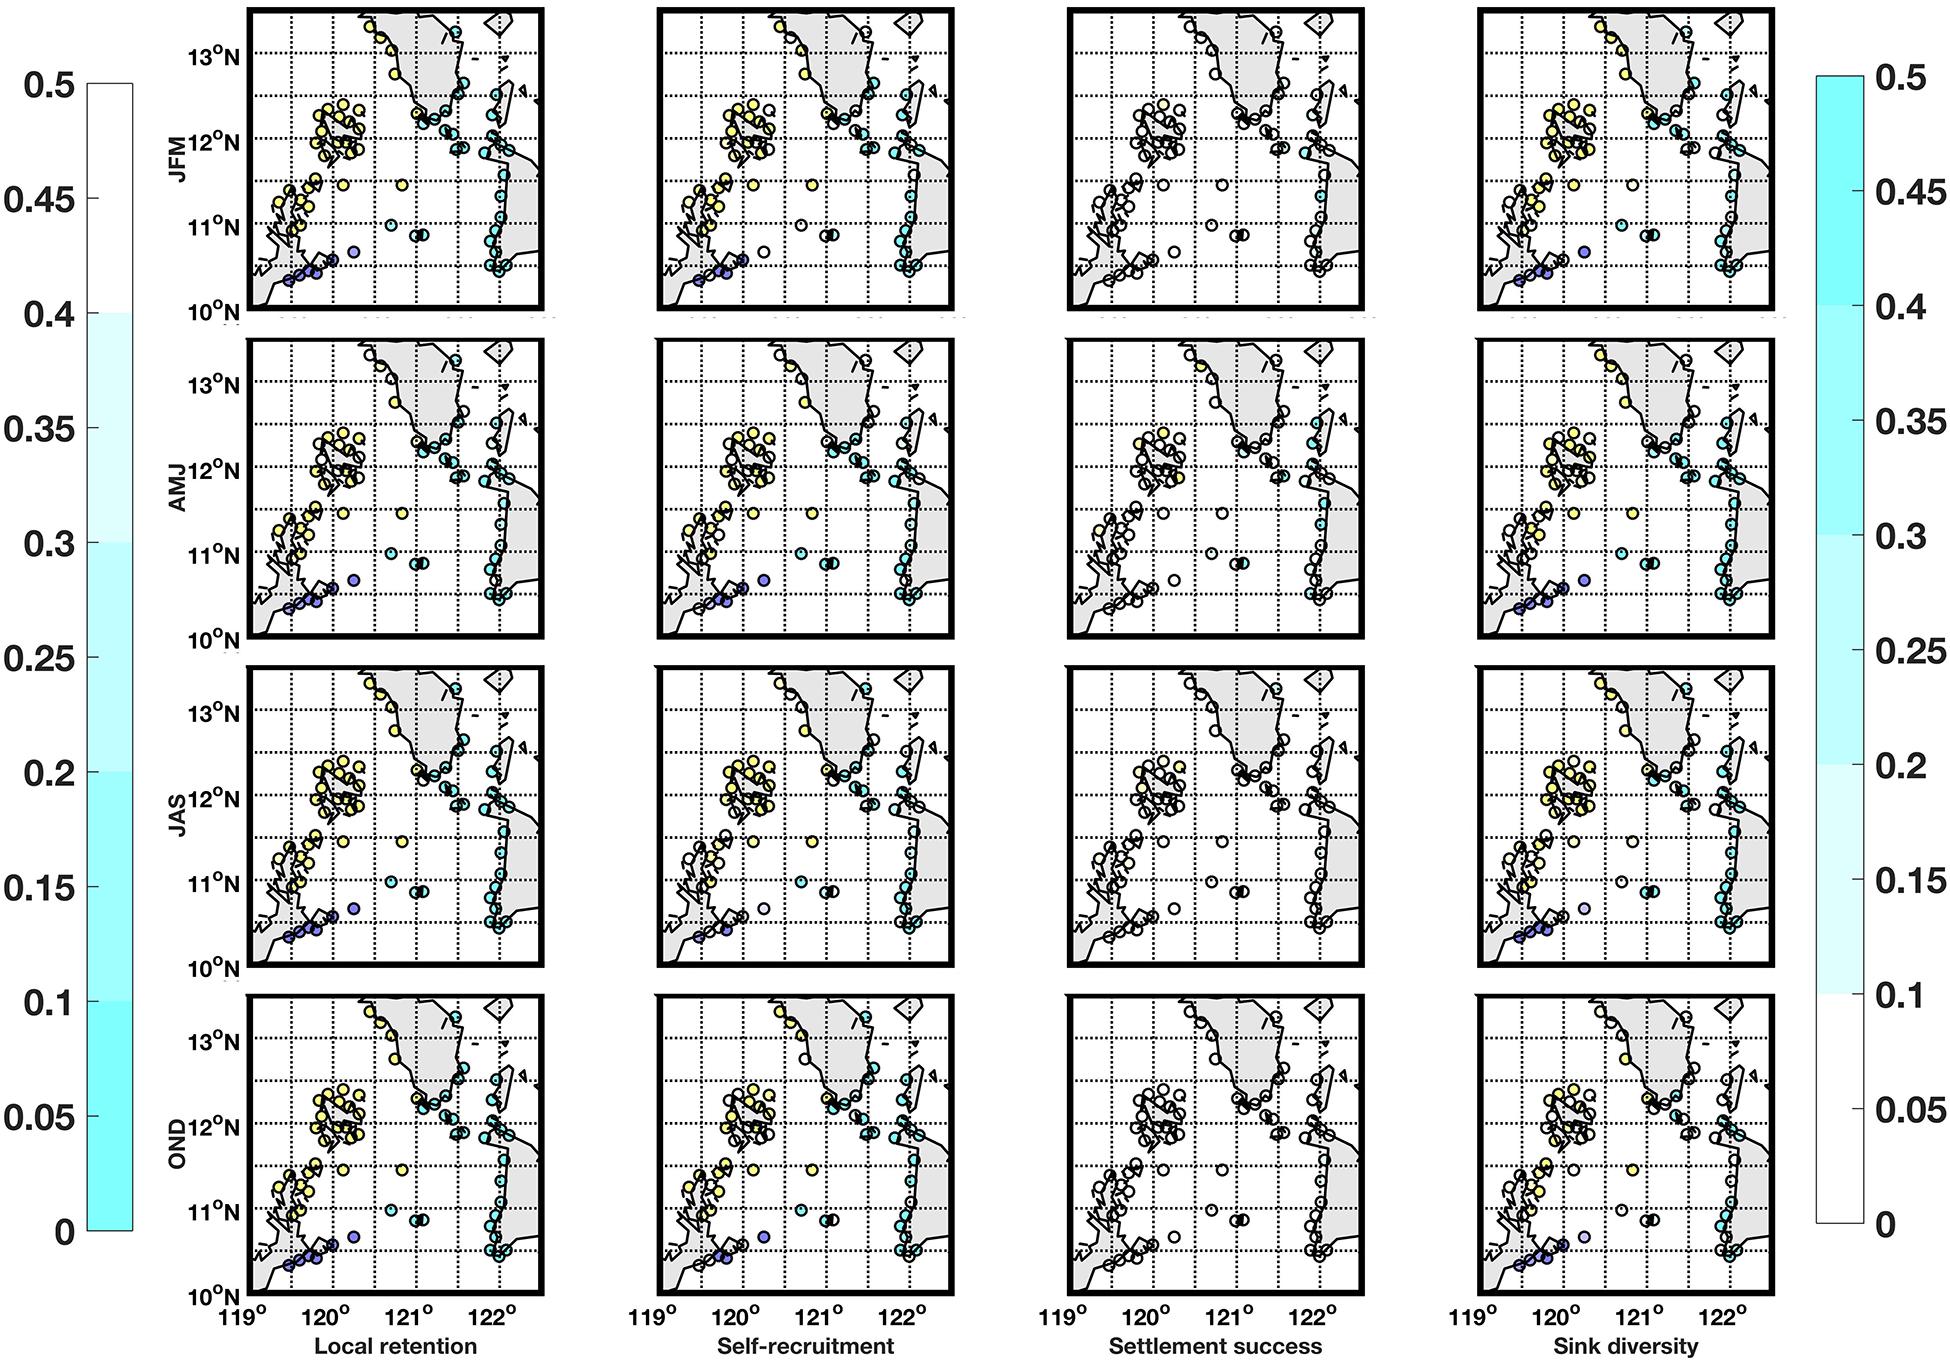
Figure 7. Local retention (column 1), self-recruitment (column 2), settlement success (column 3), and sink diversity (column 4) values for locations with suitable habitat for S. horrens species for the NEM (row 1), dry-transition (row 2), SWM (row 3), and early NEM (row 4). Locations are colored according to their marine province (Group 1 = purple, Group 2 = cyan, and Group 3 = yellow). Local retention and self-recruitment (settlement success and source diversity) values are shaded according to the representative colorbar on the left (right) and as such, possible priority locations are in darker shades for all maps.
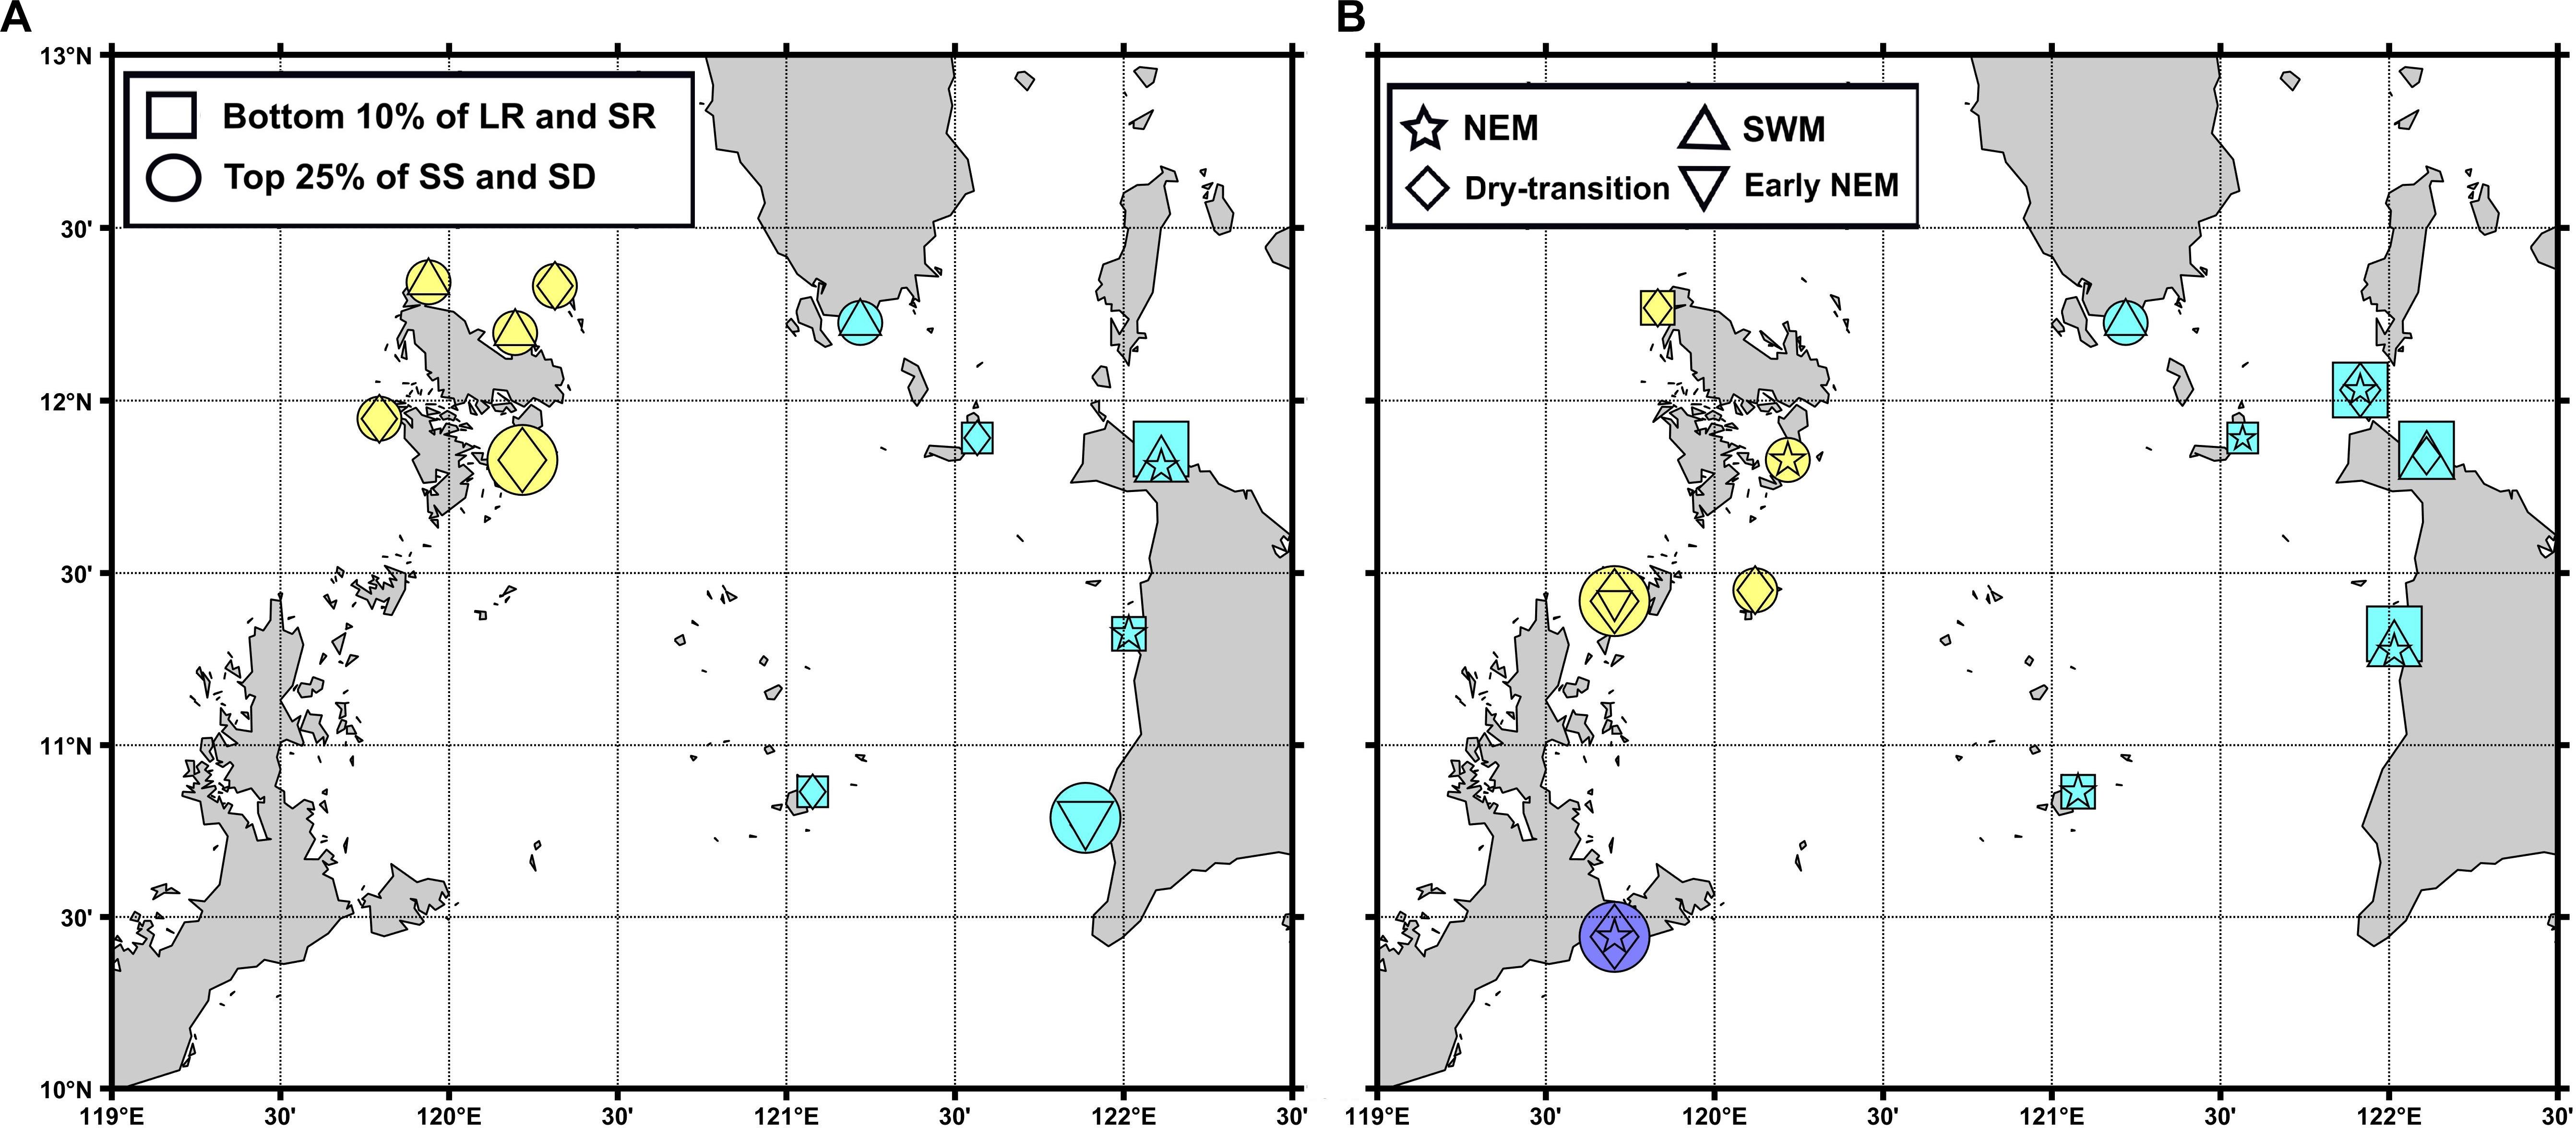
Figure 8. H. scabra (A) and S. horrens (B) locations which belong in the bottom 10% (top 25%) of local retention and self-recruitment (average settlement success and sink diversity index) represented as squares (circles) and colored according to their marine province (Group I purple, Group II cyan, and Group III yellow). Overlaid symbols correspond to the season wherein a location was ranked as such, with some locations top-ranked for 2 seasons.
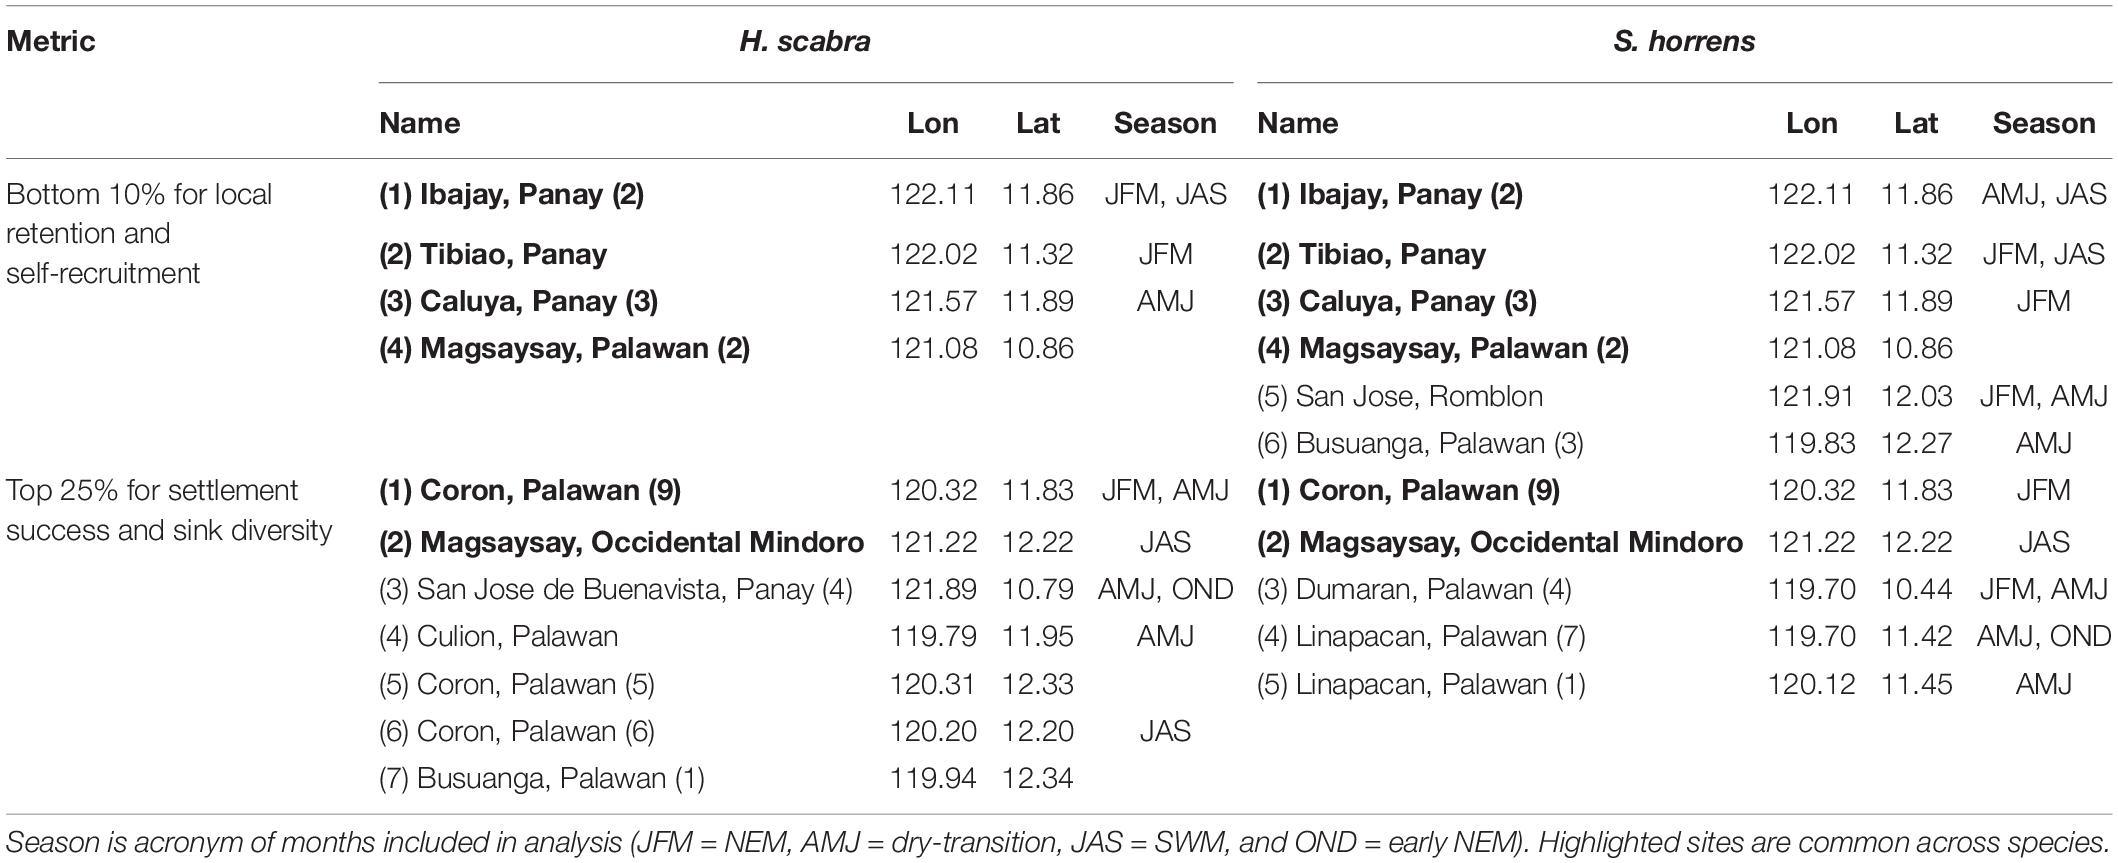
Table 2. Summary of identified priority sites for management of H. scabra and S. horrens populations in the western central Philippines.
Discussion
The use of a biophysical model enabled the simulation of seasonally variable passive dispersal transport for sea cucumber larvae in the western central Philippines. High-priority locations for management purposes were established by delineating groups of sites with high internal exchange, incorporating habitat preferences for spawning and settlement, and ranking locations in terms of their possible contribution to network persistence and high genetic diversity.
Hydrodynamic Features of the Domain and Marine Provinces Calculated by Infomap
The hydrodynamic model used (regional SEAc HYCOM) replicated important features of surface circulation within the domain, particularly near the Mindoro Strait (Figure 3), which has a strong southward current (Mindoro Jet) due to the influence of the West Philippine Sea (Gordon et al., 2011). The observed seasonal variability of surface currents for the regional SEAc HYCOM model were similar to those simulated by Han et al. (2009) which used a 3-year 5 km resolution Regional Ocean Modeling System (ROMS) model validated with cruise and satellite observations. The range of magnitudes, and patterns of maximum flow were also similar. Dorman et al. (2016), which used a 45-year 5 km ROMS model of the South China Sea, also showed similar seasonal patterns. In summary, the similarity of seasonal variability captured by the regional SEAc HYCOM model to others run over longer periods of time suggests that the hydrodynamic forcing is sufficiently robust to support the estimated connectivity from particle dispersal.
The coastal nodes assigned according to municipality (Figure 2 and Supplementary Table S1) were grouped into marine provinces using the network connectivity detection algorithm of Infomap. The groupings for the dry-transition period were used as the framework for all seasons: Group I covers southeastern Palawan, Group II includes eastern Mindoro and western Panay while Group III covers western and northern Palawan, with western Mindoro (Figure 2). These groupings corresponded with previously established national marine biogeographic regions wherein Group III locations fall under the South China Sea region, and Groups I and II are covered by the Sulu Sea region (Nañola et al., 2006). Similar geographic clusters with covarying connectivity patterns were identified using detailed analysis of a connectivity model of coral reef, fish and sea urchin species within a much larger domain (the North-Indo West Pacific). The recognized clusters included the northern Sulu Sea (Groups I and II) and northwestern Palawan (Group III) (Pata and Yñiguez, 2019). From a management perspective, the coherent provinces calculated by Infomap provides a baseline to identify prospective sea cucumber fishery management clusters in the area. Designating protected areas can lead to less exploitation, which encourages population recovery and growth. Over time, these can serve as possible larval sources for depleted sites (Dolorosa, 2015). These provinces could guide the design and formation of inter-municipal alliances, some of which are already present within the domain. However, there are still major roadblocks toward their implementation and the measurement of benefits produced by such collaborations (Horigue et al., 2012).
Passive Dispersal Connectivity and the Effect of Species-Specific Habitat Matrices
Generally speaking, Group I is a weak source and a good sink, Group II is a good source and a weak sink, and Group III is a good (weak) source for Group I (Group II) and a weak sink for both (Figure 4). The major forcing for these patterns was the changes in the strength and extent of the Mindoro Jet as it fluctuated seasonally. For example, as it strengthened during the NEM, the current was able to transport particles from the northern and western areas of the domain (Group III) into the southern and eastern regions (Groups I and II). The relative positions of the groups to each other also influence their connectivity (the downstream location of Group I compared to Groups II and III and the upstream position of Group III compared to Group II, Figure 2). Previous work by Melbourne-Thomas et al. (2011) in the South China Sea region found similar connections, with a high degree of larval exchange from western Panay (Group II) to eastern Palawan (Group I). Additionally, they found strong self–recruitment within eastern Palawan sites (Group I) and within western and northern Palawan and western Mindoro (Group III), supporting their delineation as separate populations.
To a certain extent, biophysical modeling data can be used to corroborate differentiation in marine populations detected through molecular genetic techniques (Truelove et al., 2017). Analysis of microsatellite marker data of S. horrens populations showed that samples derived from Romblon (Group II) and Puerto Princesa (Group III) were distinct (Lizano, 2017). Within the western central Philippines, H. scabra samples collected from Romblon and Panay Island (Group II) and northern Palawan (Group I) were characterized as separate groups (Figure 2, Ravago-Gotanco and Kim, 2018). Samples from El Nido and Coron in northern Palawan were radically genetically divergent from the rest, and the authors’ proposed mechanism of the strong Mindoro Jet acting as a barrier to transport to other regions was also evident in this biophysical model. El Nido and Coron were classified further as separate genetic populations, but in this study were categorized into Group I under Infomap. The area between El Nido and Coron houses a number of small islands which can induce highly localized flows and eddies not captured by this model. The 10 km resolution between nodes may not be able to distinguish between these populations, whose disparity is otherwise captured in genetic sampling. Nevertheless, the present model answers questions of connectivity at a broad-scale, and higher-resolution models will be required when focusing on more localized domains.
The application of habitat matrices representing sea cucumber life cycle requirements to the particle dispersal model resulted in a downscaling of the settlement probabilities (Figure 5) and assumed connectivity between nodes (Supplementary Figures S4, S5). This reflects the importance of considering benthic habitat for larval settlement and adjacent suitable adult habitats in evaluating the population connectivity of marine species with biphasic life histories such as sea cucumbers. Generally, the incorporation of the habitats constrained hydrographic connectivity indicating that connectivity among populations is highly dependent on the extent and distribution of critical nearshore habitats. Populations of benthic species with pelagic larvae may benefit from a network of marine reserves which take into consideration the habitats critical for survival of its different life stages (Baetscher et al., 2019).
Fishery data from previous studies (i.e., where species were collected or observed) can validate basic information on species habitat used for the habitat matrix method. For Palawan, the municipalities of Quezon (node 81), Roxas (node 8), El Nido (Taytay, nodes 82, 84, 86, and 98), and Araceli (node 14) contained populations of H. scabra and S. horrens (Jontila et al., 2014), although Quezon and Roxas had relatively low populations of commercially important species due to intense collection activities (Jontila et al., 2018b). For the islands of Mindoro, Panay, Romblon, and southern Marinduque, these types of sea cucumber survey data were not readily available.
However, the inclusion of habitat data in this study was highly reliant on the quality of satellite information, which may not wholly capture the nearshore marine environment at high-resolution scales. Rasa Island near Narra, Palawan had extensive mangrove, coral and seagrass environments with a relatively high density of H. scabra and S. horrens individuals (Dolorosa et al., 2017). This area had no suitable habitat according to satellite data (node 18 in Figure 2; see Figure 1B). This was also the case for Arreceffi Island in Honda Bay (Jontila et al., 2017, 2018a, node 2 in Figure 2; see Figure 1B). Surveys on both islands were conducted in 2015, which was within the temporal range of the satellite data used (2015–2018). Additionally, locations which were classified as having only coral and seagrass habitats (no mangroves) had observations of H. scabra for surveys conducted from 2012 to 2013 (Roxas, El Nido and Araceli, in Jontila et al., 2014). The outlined habitat matrix method presents a preliminary effort to incorporate habitat information with larval connectivity models in a data-poor setting. Fine-tuning the method would entail improving satellite estimates coupled with in situ validation through widespread, consistent surveys of sea cucumber populations in coastal environments. Building up the capacity to conduct populations surveys is of vital concern to protecting sea cucumber resources (Jontila et al., 2018a). Such future efforts might improve modeling outcomes, for example, a combination of habitat remote sensing and fisher folk survey methods were successfully used to guide future planning for MPA networks at the municipal level for Sogod Bay, Philippines (Kockel et al., 2020).
Larval Dispersal Kernel and Nodes Ranked Based on Connectivity Metrics
The dispersal kernel showed that most particles settled within 50 km of their source node, regardless of the season and species considered (Supplementary Figure S6). There was strong interconnectivity of larval flow within the coherent provinces determined using Infomap (Figure 4, refer to connectivity within shaded rectangles on the matrices). Previous biophysical modeling efforts within the Philippines exhibited similar trends for coral reef and reef-associated species (Melbourne-Thomas et al., 2011; Dorman et al., 2016; Abesamis et al., 2017; Pata and Yñiguez, 2019), which collectively point to the need for protected area networks to be relatively closely spaced to maximize conservation efforts.
Most sites with suitable habitats for both species had low local retention and self-recruitment values (<0.5, Figures 6, 7). This indicates that the domain would be considered relatively open, with a high degree of particle exchange among locations, as opposed to relying on self-recruitment to sustain populations (Dubois et al., 2016). Values for average settlement success, which quantifies the number of particles from one node which successfully settled in others, were relatively low for most nodes (<0.5, Figures 6, 7). Source diversity index values, which measure the variety and intensity of sources for each node, were high (>0.5) for most locations (Figures 6, 7). Ranking the nodes in terms of these four criteria (Figure 8) gives 16 nodes with possibly high genetic diversity (as they receive more larvae from other nodes and have low retention of locally produced larvae), and those who would contribute more larvae for successful settlement elsewhere, along with reduced self-recruitment (Dubois et al., 2016; Krueck et al., 2017). Unfortunately, no single site was able to match all four criteria for both species across all seasons (Table 2).
High-priority locations belonged mainly to Groups II and III, with only 1 location for Group I. The distribution of these locations and their seasonal variability (Table 2) offers adaptable options for aquaculture requirements. Sites within northern Palawan (Coron, Busuanga, and Linapacan) could support existing aquaculture efforts as these are nearest to the Palawan Aquaculture Corporation hatchery (Figures 2, 8, Juinio-Meñez et al., 2017b). Mindoro Island had one priority location in Magsaysay, Panay had Tibiao, Ibajay, and San Jose de Buenavista while Palawan had Dumaran. Each of these sites are on larger islands which could possibly develop the infrastructure required for aquaculture. For more remote locations [Magsaysay (11°N 121°E), Caluya (12°N 121.5°E) and San Jose (12°N 122°E) Islands] which might have difficulties developing similar infrastructure, wild stock management and protection could be feasible initial steps.
Limitations of the Study and Recommendations
The study had several limitations, which could be addressed in subsequent research efforts. It does not account for interannual variability, although seasonal patterns of connectivity are typically dominant in the region (Dorman et al., 2016; Abesamis et al., 2017; Pata and Yñiguez, 2019). It is acknowledged that sea cucumbers would have a more complex finer scale relationship with habitat than suggested by the method used (e.g., response to settlement cues, changes in growth rates, etc.). Incorporating other variables into the biophysical model such as reproductive output, larval settlement and survival rates would also be beneficial (White et al., 2019). Expanding the collection and validation of habitat data by a combination of remote sensing and in situ means would refine model outcomes.
Overall, this work represents a significant effort to define ecologically meaningful MUs for tropical sea cucumbers using biophysical modeling. The results were an important component of a multi-criteria decision support process developed to determine the boundaries and initiate the development of MUs within the region (Juinio-Meñez et al., 2017a). Fisheries enhancement for sea cucumbers is particularly reliant on improved governance and local fisher involvement (Jontila et al., 2018a), which were also taken into consideration in the decision-making tool. The priority sites provide a starting point by which future management plans may build on by strengthening local efforts to manage the wild sea cucumber fishery or creating new management areas where breeding populations can be established and maintained through restocking hatchery produced juveniles. Consistent with responsible restocking practices, these juveniles should be produced from broodstock from the same genetic stock to conserve genetic variability and ensure resilience of local populations to changing environmental conditions (Juinio-Meñez et al., 2017b). Additionally, this approach approximated the biphasic life cycle of the species along with a consideration of their habitat requirements and may potentially be used as a template for other commercially and ecologically important nearshore benthic organisms in seagrass beds, coral reefs and mangrove areas.
Data Availability Statement
The raw data supporting the conclusions of this article can be made available by the authors upon request.
Author Contributions
MJ-M and CV designed the overall research study. KY compiled and implemented the in-house CMS and Infomap software and coded the initial data processing scripts. JD developed the habitat matrix method, modified the data processing scripts, ran all model simulations, parameterizations, and data analyses. JD wrote the initial draft of the manuscript with additional writing and editing from MJ-M, CV, and KY. All the authors contributed to the article and approved the submitted version.
Conflict of Interest
The authors declare that the research was conducted in the absence of any commercial or financial relationships that could be construed as a potential conflict of interest.
Funding
This work was conducted under the research project “Identifying Management Units for High-Value Sea Cucumber species, Holothuria scabra and Stichopus cf. horrens” (Grant #: QSR-MRCUC.02.02) funded by the Philippine Council for Agriculture, Aquatic and Natural Resources Research and Development under the Department of Science and Technology.
Acknowledgments
The authors would like to thank Ms. Mia Estabillo for providing the habitat data based on satellite imagery and the reviewers whose insightful comments and suggestions greatly improved the paper. JD would like to thank Dr. Irene Crisologo and Ryan Waldman for their constructive criticism of the manuscript.
Supplementary Material
The Supplementary Material for this article can be found online at: https://www.frontiersin.org/articles/10.3389/fmars.2020.571712/full#supplementary-material
References
Abesamis, R., Saenz-Agudelo, P., Berumen, M., Bode, M., Jadloc, C., and Solera, L., et al. (2017). Reef-fish larval dispersal patterns validate no-take marine reserve network connectivity that links human communities. Coral Reefs 36, 791–801. doi: 10.1007/s00338-017-1570-0
Abesamis, R. A., Stockwell, B. L., Bernardo, L. P., Villanoy, C. L., and Russ, G. (2016). Predicting reef fish connectivity from biogeographic patterns and larval dispersal modelling inform the development of marine reserve networks. Ecol. Indic. 66, 534–544. doi: 10.1016/j.ecolind.2016.02.032
Agudo, N. (2006). Sandfish Hatchery Techniques. New Caledonia: Australian Center for International Agricultural Research.
Al-Rashdi, K., Eeckhaut, I., and Claereboudt, M. (2012). A Manual on Hatchery of Sea Cucumber Holothuria scabra in the Sultanate of Oman. Muscat: Ministry of Agriculture and Fisheries Wealth.
Baetscher, D., Anderson, E., Gilbert-Horvath, E., Malone, D., Saarman, E., Carr, M., et al. (2019). Dispersal of a nearshore marine fish connects marine reserves and adjacent fished areas along an open coast. Mol. Ecol. 28, 1611–1623. doi: 10.1111/mec.15044
Blanco, A., Tamondong, A., Tagle, E., Fortes, M., and Nadaoka, K. (2014). “Change in seagrass fractional cover in Bolinao and Anda, Philippines derived from Landsat images,” in Proceedings of the 35th Asian Conference on Remote Sensing, ACRS 2014: Sensing for Reintegration of Societies, Myanmar.
Bohlin, L., Edler, D., Lancichinetti, A., and Rosvall, M. (2014). “Community detection and visualization of networks with the map equation framework,” in Measuring Scholarly Impact, eds Y. Ding, R. Rousseau, and D. Wolfram (Cham: Springer).
Botsford, L., White, J., Coffroth, M.-A., Paris, C., Planes, S., Shearer, T., et al. (2009). Connectivity and resilience of coral reef metapopulations in marine protected areas: matching empirical efforts to predictive needs. Coral Reefs 28, 327–337. doi: 10.1007/s00338-009-0466-z
Ceccarelli, D., Logan, M., and Purcell, S. (2018). Analysis of optimal habitat for captive release of the sea cucumber Holothuria scabra. Mar. Ecol. Prog. Ser. 588, 85–100. doi: 10.3354/meps12444
Cowen, R., and Sponaugle, S. (2009). Larval dispersal and marine population connectivity. Annu. Rev. Mar. Sci. 1, 443–466. doi: 10.1146/annurev.marine.010908.163757
Dance, S., Lane, I., and Bell, J. (2003). Variation in short-term survival of cultured sandfish (Holothuria scabra) released in mangrove-seagrass and coral reef flat habitats in Solomon Islands. Aquaculture 220, 495–505. doi: 10.1016/S0044-8486(02)00623-3
Dissanayake, D., and Stefansson, G. (2011). Habitat preference of sea cucumbers: Holothuria atra and Holothuria edulis in the coastal waters of Sri Lanka. J. Mar. Biol. Assoc. U. K. 92, 581–590. doi: 10.1017/S0025315411000051
Dolorosa, R. (2015). The sea cucumbers (Echinodermata: Holothuroidea) of Tubbataha reefs National Park, Philippines. SPC Beche De Mer. Inf. Bull. 35, 10–18.
Dolorosa, R. G., Salazar, C., Delfin, M., Paduga, J., and Balisco, R. (2017). Sea cucumber fisheries in Rasa Island Wildlife Sanctuary, Narra, Palawan, Philippines. SPC Beche De Mer. Inf. Bull. 37, 9–20.
Dorman, J., Castruccio, F., Curchister, E., Kleypas, J., and Powell, T. (2016). Modeled connectivity of Acropora millepora populations from reefs of the Spratly Islands and the greater South China Sea. Coral Reefs 35, 169–179. doi: 10.1007/s00338-015-1354-3
Dubois, M., Rossi, V., Ser-Giacomi, E., Arnaud-Haond, S., Lopez, C., and Hernandez-Garcia, E. (2016). Linking basin-scale connectivity, oceanography and population dynamics for the conservation and management of marine ecosystems. Glob. Ecol. Biogeogr. 25, 503–515. doi: 10.1111/geb.12431
Eriksson, H., Jamon, A., and Wickel, J. (2012). Observations on habitat utilization by the sea cucumber Stichopus chloronotus. SPC Beche De Mer. Inf. Bull. 32, 39–42.
Eriksson, H., Thorne, B., and Byrne, M. (2013). Population metrics in protected commercial sea cucumber populations (curryfish: Stichopus herrmanni) on One Tree Reef, Great Barrier Reef. Mar. Ecol. Prog. Ser. 473, 225–234. doi: 10.3354/meps10054
Gordon, A., Sprintall, J., and Ffield, A. (2011). Regional oceanography of the Philippine Archipelago. Oceanography 24, 14–27. doi: 10.5670/oceanog.2011.01
Han, W., Moore, A., Levin, J., Zhang, B., Arango, H., Curchister, E., et al. (2009). Seasonal surface ocean circulation and dynamics in the Philippine Archipelago region during 2004-2008. Dyn. Atmos. Oceans 47, 114–137. doi: 10.1016/j.dynatmoce.2008.10.007
Horigue, V., Aliño, P., White, A., and Pressey, R. (2012). Marine protected area networks in the Philippines: trends and challenges for establishment and governance. Ocean Coast. Manag. 64, 15–26. doi: 10.1016/j.ocecoaman.2012.04.012
Hu, C., Li, H., Xia, J., Zhang, L., Luo, P., Fan, S., et al. (2013). Spawning, larval development and juvenile growth of the sea cucumber Stichopus horrens. Aquaculture 404–405. doi: 10.1016/j.aquaculture.2013.04.007
Hu, C., Xu, Y., Wen, J., Zhang, L., Fan, S., and Ting, S. (2010). Larval development and juvenile growth of the sea cucumber Stichopus sp. (Curry fish). Aquaculture 300, 73–79. doi: 10.1016/j.aquaculture.2009.09.033
Jontila, J., Balisco, R., and Batin, G. (2017). Species composition, density and distribution of sea cucumbers (Holothuroidea) at Arreceffi Island, Honda Bay, Palawan, Philippines. SPC Beche De Mer. Inf. Bull. 37, 21–29.
Jontila, J., Balisco, R., and Matillano, J. (2014). The sea cucumbers (Holothuroidea) of Palawan, Philippines. AACL Bioflux 7, 194–205.
Jontila, J., Monteclaro, H., Quinitio, G., Santander-de Leon, S., and Altamirano, J. (2018a). Status of sea cucumber fishery and populations across sites with different levels of management in Palawan, Philippines. Ocean Coast. Manag. 165, 225–234. doi: 10.1016/j.ocecoaman.2018.08.025
Jontila, J., Monteclaro, H., Quinitio, G., Santander-de Leon, S., and Altamirano, J. (2018b). The sea cucumber fishery in Palawan Philippines. Kuroshio Sci. 12, 84–88.
Juinio-Meñez, M. A., Evangelio, J., Olavides, R., Paña, M. A., De Peralta, G., Edullantes, C., et al. (2013). Population dynamics of cultured Holothura scabra in a sea ranch: implications for stock restoration. Rev. Fish. Sci. 21, 424–432. doi: 10.1080/10641262.2013.837282
Juinio-Meñez, M. A., Dumalan, R., Lizano, A., Rioja, R., Gallmann, M., and Yatco, K. (2017a). “An integrated approach in identifying ecologically meaningful management units for high-value sea cucumbers,” in Proceeding of the 10th IOC WestPAC Conference, Qingdao.
Juinio-Meñez, M. A., Tech, E., Ticao, I., Gorospe, J., Edullantes, C., and Rioja, R. (2017b). Adaptive and integrated culture production systems for the tropical sea cucumber Holothuria scabra. Fish. Res. 186, 502–513. doi: 10.1016/j.fishres.2016.07.017
Kockel, A., Ban, N., Costa, M., and Dearden, P. (2020). Addressing distribution equity in spatial conservation prioritization for small-scale fisheries. PLoS One 15:e0233339. doi: 10.1371/journal.pone.0233339
Kool, J., Moilanen, A., and Treml, E. (2013). Population connectivity: recent advances and new perspectives. Landsc. Ecol. 28, 165–186. doi: 10.1007/s10980-012-9819-z
Krueck, N., Ahmadia, G., Green, A., Jones, G., Possingham, H., Riginos, C., et al. (2017). Incorporating larval dispersal into MPA design for both conservation and fisheries. Ecol. Appl. 27, 925–941. doi: 10.1002/eap.1495
Lizano, A. (2017). Genetic Diversity and Population Genetic Structure Among Philippine Populations of Stichopus cf. horrens. Manila, PH: University of the Philippines. [Master’s thesis].
Manalaysay, D. (2017). National Scale Hydrodynamic Model. In Project 4, Watershed and Ocean Parameters for Assessment of Coral Reef Health. National Assessment of Coral Reef Environments Program. Terminal Report. Department of Science and Technology. Philippine Council for Agriculture, Aquatic and Natural Resources Research and Development.
May, P., Doyle, J., Pullen, J., and David, L. (2011). Two-way coupled atmosphere-ocean modeling of the PhilEx Intensive Observational Periods. Oceanography 24, 48–57. doi: 10.5670/oceanog.2011.03
Melbourne-Thomas, J., Johnson, C., Aliño, P., Geronimo, R., Villanoy, C., and Gurney, G. (2011). A multi-scale biophysical model to inform regional management of coral reefs in the western Philippines and South China Sea. Environ. Model. Softw. 26, 66–82. doi: 10.1016/j.envsoft.2010.03.033
Nañola, C., Aliño, P., Arceo, H., Licuanan, W., Uychiaoco, A., Quibilan, M., et al. (2006). “Status report on coral reefs of the Philippines - 2004,” in Proceedings of the 10th International Coral Reef Symposium, Okinawa.
Palomar-Abesamis, N., Abesamis, R., and Juiñio-Meñez, M. (2016). Distribution and microhabitat associations of the juveniles of a high-value sea cucumber, Stichopus cf. horrens, in northern Philippines. Aquat. Ecol. 51, 17–31. doi: 10.1007/s10452-016-9591-2
Palomar-Abesamis, N., Juinio-Meñez, M., and Slater, M. (2018). Macrophyte detritus as nursery diets for juvenile sea cucumber Stichopus cf. horrens. Aquac. Res. 49, 3614–3623. doi: 10.1111/are.13829
Paris, C., Helgers, J., van Sebille, E., and Srinavasan, A. (2013). Connectivity Modeling System: a probabilistic modeling tool for the multi-scale tracking of biotic and abiotic variability in the ocean. Environ. Model. Softw. 42, 47–54. doi: 10.1016/j.envsoft.2012.12.006
Pata, P., and Yñiguez, A. (2019). Larval connectivity patterns of the North Indo-West Pacific coral reefs. PLoS One 14:e0219913. doi: 10.1371/journal.pone.021991
Pawlowicz, R. (2020). “M_Map: A Mapping Package for MATLAB”, Version 1.4 m, [MATLAB R2016a]. Available online at: www.eoas.ubc.ca/∼rich/map.html
PhilGIS (2020). Philippine GIS Data Clearinghouse. Available online at: http://philgis.org/ (accessed April 28, 2020).
Puckett, B., Eggleston, D., Kerr, P., and Luettich, R. (2014). Larval dispersal and population connectivity among a network of marine reserves. Fish. Oceanogr. 23, 342–361. doi: 10.1111/fog.12067
Purcell, S., Conand, C., Uthicke, S., and Byrne, M. (2016). “Ecological roles of exploited sea cucumbers,” in Oceanography and Marine Biology: An Annual Review, Vol. 54, eds R. N. Hughes, D. J. Hughes, I. P. Smith, and A. C. Dale (Milton Park: Taylor & Francis), 367–386. doi: 10.1201/9781315368597-8
Purcell, S., Hair, C., and Mills, D. (2012). Sea cucumber culture, farming and sea ranching in the tropics: progress, problems and opportunities. Aquaculture 368-369, 68–81. doi: 10.1016/j.aquaculture.2012.08.053
Purcell, S., Mercier, A., Conand, C., Hamel, J., Toral-Granda, M., Lovatelli, A., et al. (2013). Sea cucumber fisheries: global analysis of stocks, management measures and drivers of overfishing. Fish Fish. 14, 34–59. doi: 10.1111/j.1467-2979.2011.00443.x
Purcell, S., Polidoro, B., Hamel, J.-F., Gamboa, R., and Mercier, A. (2014). The cost of being valuable: predictors of extinction risk in marine invertebrates exploited as luxury seafood. Proc. R. Soc. 281:20133296. doi: 10.1098/rspb.2013.3296
Purcell, S., Williamson, D., and Ngaluafe, P. (2018). Chinese market prices of beche-de-mer: implications for fisheries and aquaculture. Mar. Policy 91, 58–65. doi: 10.1016/j.marpol.2018.02.005
QGIS (2019). QGIS: A Free and Open Source Geographic Information System. Available at; https://www.qgis.org/en/site/index.html (accessed April 28, 2020).
Ravago-Gotanco, R., and Kim, K. (2018). Regional genetic structure of sandfish Holothuria (Metriatyla) scabra populations across the Philippine archipelago. Fish. Res. 209, 143–155. doi: 10.1016/j.fishres.2018.09.021
Rossi, V., Ser-Giacomi, E., Lopez, C., and Hernandez-Garcia, E. (2014). Hydrodynamic provinces and oceanic connectivity from a transport network help designing marine reserves. Geophys. Res. Lett. 4, 12883–12891. doi: 10.1002/2014GL059540
Ser-Giacomi, E., Rossi, V., Lopez, C., and Hernandez-Garcia, E. (2015). Flow networks: A characterization of geophysical fluid transport. Chaos 25:036404. doi: 10.1063/1.4908231
Shackell, N., Brickman, D., and Frank, K. (2013). Reserve site selection for data-poor invetebrate fisheries using patch scale and dispersal dynamics: a case study of sea cucumber (Cucumaria frondosa). Aquat. Conserv. 23, 723–731. doi: 10.1002/aqc.2369
Thyng, K. M., Greene, C. A., Hetland, R. D., Zimmerle, H. M., and DiMarco, S. F. (2016). True colors of oceanography: guidelines for effective and accurate colormap selection. Oceanography 29, 9–13. doi: 10.5670/oceanog.2016.66
To, A. W. L., Shea, S., and Conand, C. (2018). Trade patterns of beche-de-mer at the global hub for trade and consumption – an update for Hong Kong. SPC Beche De Mer. Inf. Bull. 38, 64–67.
Tolentino, P., Poortinga, A., Kanamaru, H., Keesstra, S., Maroulis, J., David, C., et al. (2016). Projected impact of climate change on hydrological regimes in the Philippines. PLoS One 11:e0163941. doi: 10.1371/journal.pone.0163941
Toral-Granda, V., Lovatelli, A., and Vasconcellos, M. (eds) (2008). Sea Cucumbers: A Global Review of Fisheries and Trade. FAO Fisheries and Aquaculture Technical Paper No. 516, Rome: Fisheries and Agriculture Organization of the United Nations.
Treml, E., and Halpin, P. (2012). Marine population connectivity identifies ecological neighbors for conservation planning in the Coral Triangle. Conserv. Lett. 5, 441–449. doi: 10.1111/j.1755-263X.2012.00260.x
Truelove, N., Kough, A., Behringer, D., Paris, C., Box, S., Preziosi, R., et al. (2017). Biophysical connectivity explains population genetic structure in a highly dispersive marine species. Coral Reefs 36, 233–244. doi: 10.1007/s00338-016-1516-y
Uthicke, S., and Purcell, S. (2004). Preservation of genetic diversity in restocking of the sea cucumber Holothuria scabra investigated by allozyme electrophoresis. Can. J. Fish. Aquat. Sci. 61, 519–528. doi: 10.1139/F04-013
Weeks, R., Aliño, P., Atkinson, S., Beldia, P. II, Binson, A., Campos, W., et al. (2014). Developing marine protected area networks in the coral triangle: good practices for expanding the coral triangle marine protected area system. Coast. Manag. 42, 183–205. doi: 10.1080/08920753.2014.877768
Weeks, R., Russ, G., Alcala, A., and White, A. (2010). Effectiveness of Marine Protected Areas in the Philippines for biodiversity conservation. Conserv. Biol. 24, 531–540. doi: 10.1111/j.1523-1739.2009.01340.x
Keywords: Stichopus horrens, Holothuria scabra, sea cucumber aquaculture, biophysical modeling, Infomap, habitat-based connectivity, ecosystem-based management
Citation: Deauna JDL, Yatco KMB, Villanoy CL and Juinio-Meñez MA (2021) Identification of Priority Sites to Support Management of Commercially Important Sea Cucumber Species by Applying Infomap and Habitat Filters to Larval Dispersal Data. Front. Mar. Sci. 7:571712. doi: 10.3389/fmars.2020.571712
Received: 11 June 2020; Accepted: 07 December 2020;
Published: 15 January 2021.
Edited by:
Libin Zhang, Institute of Oceanology (CAS), ChinaReviewed by:
Xiutang Yuan, Yantai Institute of Coastal Zone Research (CAS), ChinaJun Ding, Dalian Ocean University, China
Copyright © 2021 Deauna, Yatco, Villanoy and Juinio-Meñez. This is an open-access article distributed under the terms of the Creative Commons Attribution License (CC BY). The use, distribution or reproduction in other forums is permitted, provided the original author(s) and the copyright owner(s) are credited and that the original publication in this journal is cited, in accordance with accepted academic practice. No use, distribution or reproduction is permitted which does not comply with these terms.
*Correspondence: Josephine Dianne L. Deauna, amRsZGVhdW5hQG1zaS51cGQuZWR1LnBo