 Benjamin K. Sullender
 Kelly Kapsar
 Aaron Poe4
- 1Audubon Alaska, Anchorage, AK, United States
- 2Kickstep Approaches, Anchorage, AK, United States
- 3Center for Systems Integration and Sustainability, Michigan State University, East Lansing, MI, United States
- 4Alaska Conservation Foundation, Anchorage, AK, United States
- 5Wildlife Conservation Society, Fairbanks, AK, United States
The Aleutian Archipelago and surrounding waters have enormous ecological, cultural, and commercial significance. As one of the shortest routes between North American and Asian ports, the North Pacific Great Circle Route, which crosses through the Aleutian Archipelago, is traveled by thousands of large cargo ships and tanker vessels every year. To reduce maritime risks and enhance navigational safety, the International Maritime Organization built upon earlier offshore routing efforts by designating five Areas To Be Avoided (ATBAs) in the Aleutian Islands in 2016. The ATBAs are designed to keep large vessels at least 50 nautical miles (93 km) from shore unless calling at a local port or transiting an authorized pass between islands. However, very few studies have examined the effectiveness of ATBAs as a mechanism for changing vessel behavior and thereby reducing the ecological impacts of maritime commerce. In this study, we use 4 years of satellite-based vessel tracking data to assess the effectiveness of the Aleutian ATBAs since their implementation in 2016. We determined whether vessels transiting the North Pacific Great Circle Route changed behavior after ATBA implementation, both in terms of overall route selection and in terms of compliance with each ATBA boundary. We found a total of 2,252 unique tankers and cargo vessels >400 gross tons transited the study region, completing a total of 8,794 voyages. To quantify routing changes of individual vessels, we analyzed the 767 vessels that transited the study region both before and after implementation. The percentage of voyages transiting through the boundaries of what would become ATBAs decreased from 76.3% in 2014–2015 (prior to ATBA designation) to 11.8% in 2016–2017 (after implementation). All five Aleutian ATBAs had significant increases in compliance, with the West ATBA showing the most dramatic increase, from 32.1% to 95.0%. We discuss the framework for ATBA enforcement and highlight the value of local institutional capacity for real-time monitoring. Overall, our results indicate that ATBAs represent a viable strategy for risk mitigation in sensitive ecological areas and that through monitoring, spatial protections influence vessel route decisions on multiple spatial scales.
Introduction
Area-based conservation measures are a key tool in managing anthropogenic threats to marine ecosystems. Of these, marine protected areas (MPAs) have received a great deal of attention with respect to international sustainable development goals and the Convention on Biological Diversity’s Aichi Biodiversity Targets (Game et al., 2009; Lubchenco and Grorud-Colvert, 2015; Diz et al., 2018). Other marine spatial management mechanisms, such as Areas To Be Avoided (ATBAs) for vessels complying with International Maritime Organization (IMO) guidance, can address location-specific threats, complementing MPAs and contributing toward achieving broader conservation or maritime safety goals (Diz et al., 2018; Huntington et al., 2019).
Areas To Be Avoided are specific vessel routing measures developed and implemented by the IMO on the basis of navigational hazards, risks of unacceptable environmental damage, or other safety factors (Huntington et al., 2019). In 2016, the IMO established a network of five ATBAs in Alaska, United States to provide for safe navigation of the Aleutian Island Archipelago during trans-continental voyages (International Maritime Organization [IMO], 2014). Since implementation, the effectiveness of these measures has not yet been systematically quantified.
These ATBAs were established around the central portion of the globally important shipping corridor known as the North Pacific Great Circle Route (Arctic Council, 2009; International Maritime Organization [IMO], 2014) (Figure 1). The North Pacific Great Circle Route is one of the shortest voyages between North American and Asian ports (Arctic Council, 2009), and consistently sees more vessel traffic than nearby waters (Smith et al., 2017). Voyages linking these two regions account for about 41% of global container ship trade by volume (World Shipping Council, 2020), and bulk carriers transiting this route log more operation hours than any other type of non-fishing vessel in the circumpolar Arctic (Silber and Adams, 2019).
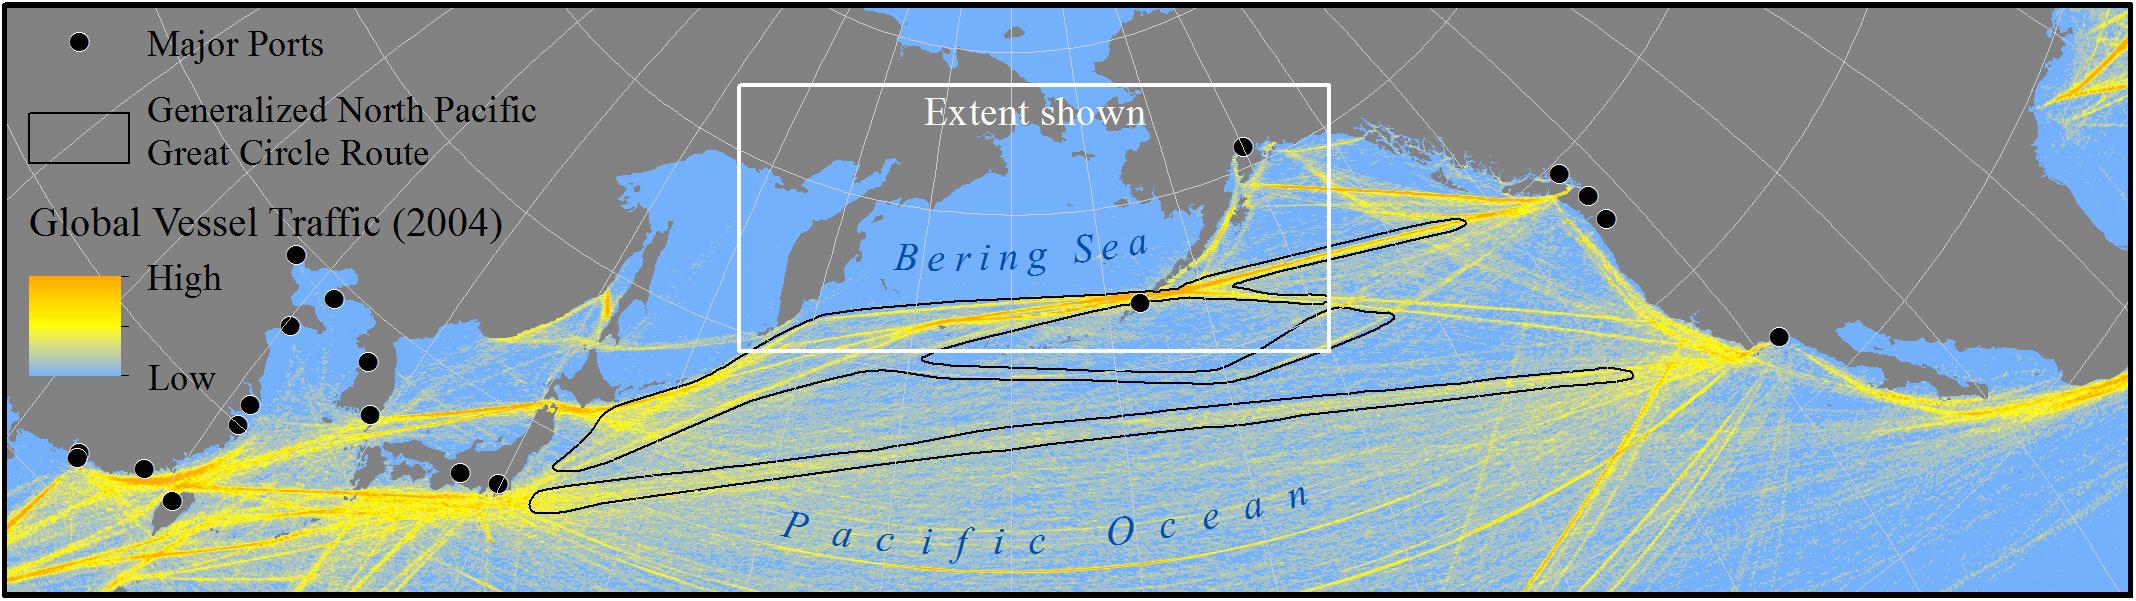
Figure 1. Global vessel commerce in the North Pacific Ocean. Major ports are shown as black points and 1 year of global vessel traffic is shown as a color gradient to represent commonly used routes. Areas of concentrated vessel traffic along the North Pacific Great Circle Route are outlined by generalized black polygons. Global vessel traffic data is for 2004 and is provided by Halpern et al. (2015).
In summer, mostly calm weather allows vessels to travel along a more direct trajectory just south of the Aleutian Archipelago (Chen et al., 2014). In the winter, a semi-permanent low-pressure system called the Aleutian Low creates extreme conditions throughout the region, with stronger winds, larger waves, and east-moving storms common south of the Aleutian Islands. During these stormy months, vessels typically navigate north into the somewhat calmer Bering Sea (Chen et al., 2014) (Figure 1). The IMO recognizes both northern and southern routes as distinct components of the North Pacific Great Circle Route (International Maritime Organization [IMO], 2014), although only the northern route transits between Aleutian Islands.
The Aleutian Archipelago hosts a wide diversity of marine mammals and birds to which vessel traffic poses numerous risks. These risks may be largely unavoidable impacts associated with vessel travel, such as acoustic disturbance, or may be stochastic events such as an oil spill, ship strike, or introduction of an invasive species (Huntington et al., 2015; Hauser et al., 2018). In the Bering Sea, anthropogenic noise from vessels and other sources can interfere with baleen whales (Hildebrand, 2009; Moore et al., 2012), including the critically endangered North Pacific Right Whale (Eubalaena japonica; Zerbini et al., 2015); vessel oil spills have resulted in significant yet likely under-reported seabird mortality events (Byrd et al., 2009); and large cetaceans suffer injury and mortality as a result of ship strikes (George et al., 2017).
While the shipping industry has become safer over time (Allianz Global Corporate and Specialty, 2019), burgeoning maritime trade and the increased size of many cargo vessels raises the level of risk associated with individual transits. Tankers holding millions of tons of petroleum products and large cargo vessels with substantial fuel reserves transit the same narrow Aleutian passes that drive regional marine productivity. The groundings of the F/V Kuroshima in 1997 and M/V Selendang Ayu in 2004 resulted in the loss of life of crewmembers and released 133 tons and 1,190 tons of oil, respectively (National Oceanic, and Atmospheric Administration [NOAA], 2002; Kurtz, 2008).
These incidents, as well as a growing awareness of maritime safety in the southern Bering Sea and North Pacific, contributed to launching the Aleutian Islands Risk Assessment (AIRA), a 5-year effort to provide for safer vessel transit in the region. AIRA integrated expert knowledge from stakeholders with technical analysis, culminating in a series of practical recommendations (Nuka Research, and Planning Group, 2015). To reduce the risk of marine casualty, AIRA proposed five ATBAs surrounding the Aleutian Islands and designated specific routes through passes. Each ATBA consists of a 50 nautical mile (93 km) buffer around the islands where maritime travel by vessels greater than 400 gross tons is prohibited in most instances (Nuka Research and Planning Group, 2016) (Figure 2). At the heart of these recommendations was the goal of separating vessels from land in order to give time for response when vessels suffered mechanical issues.
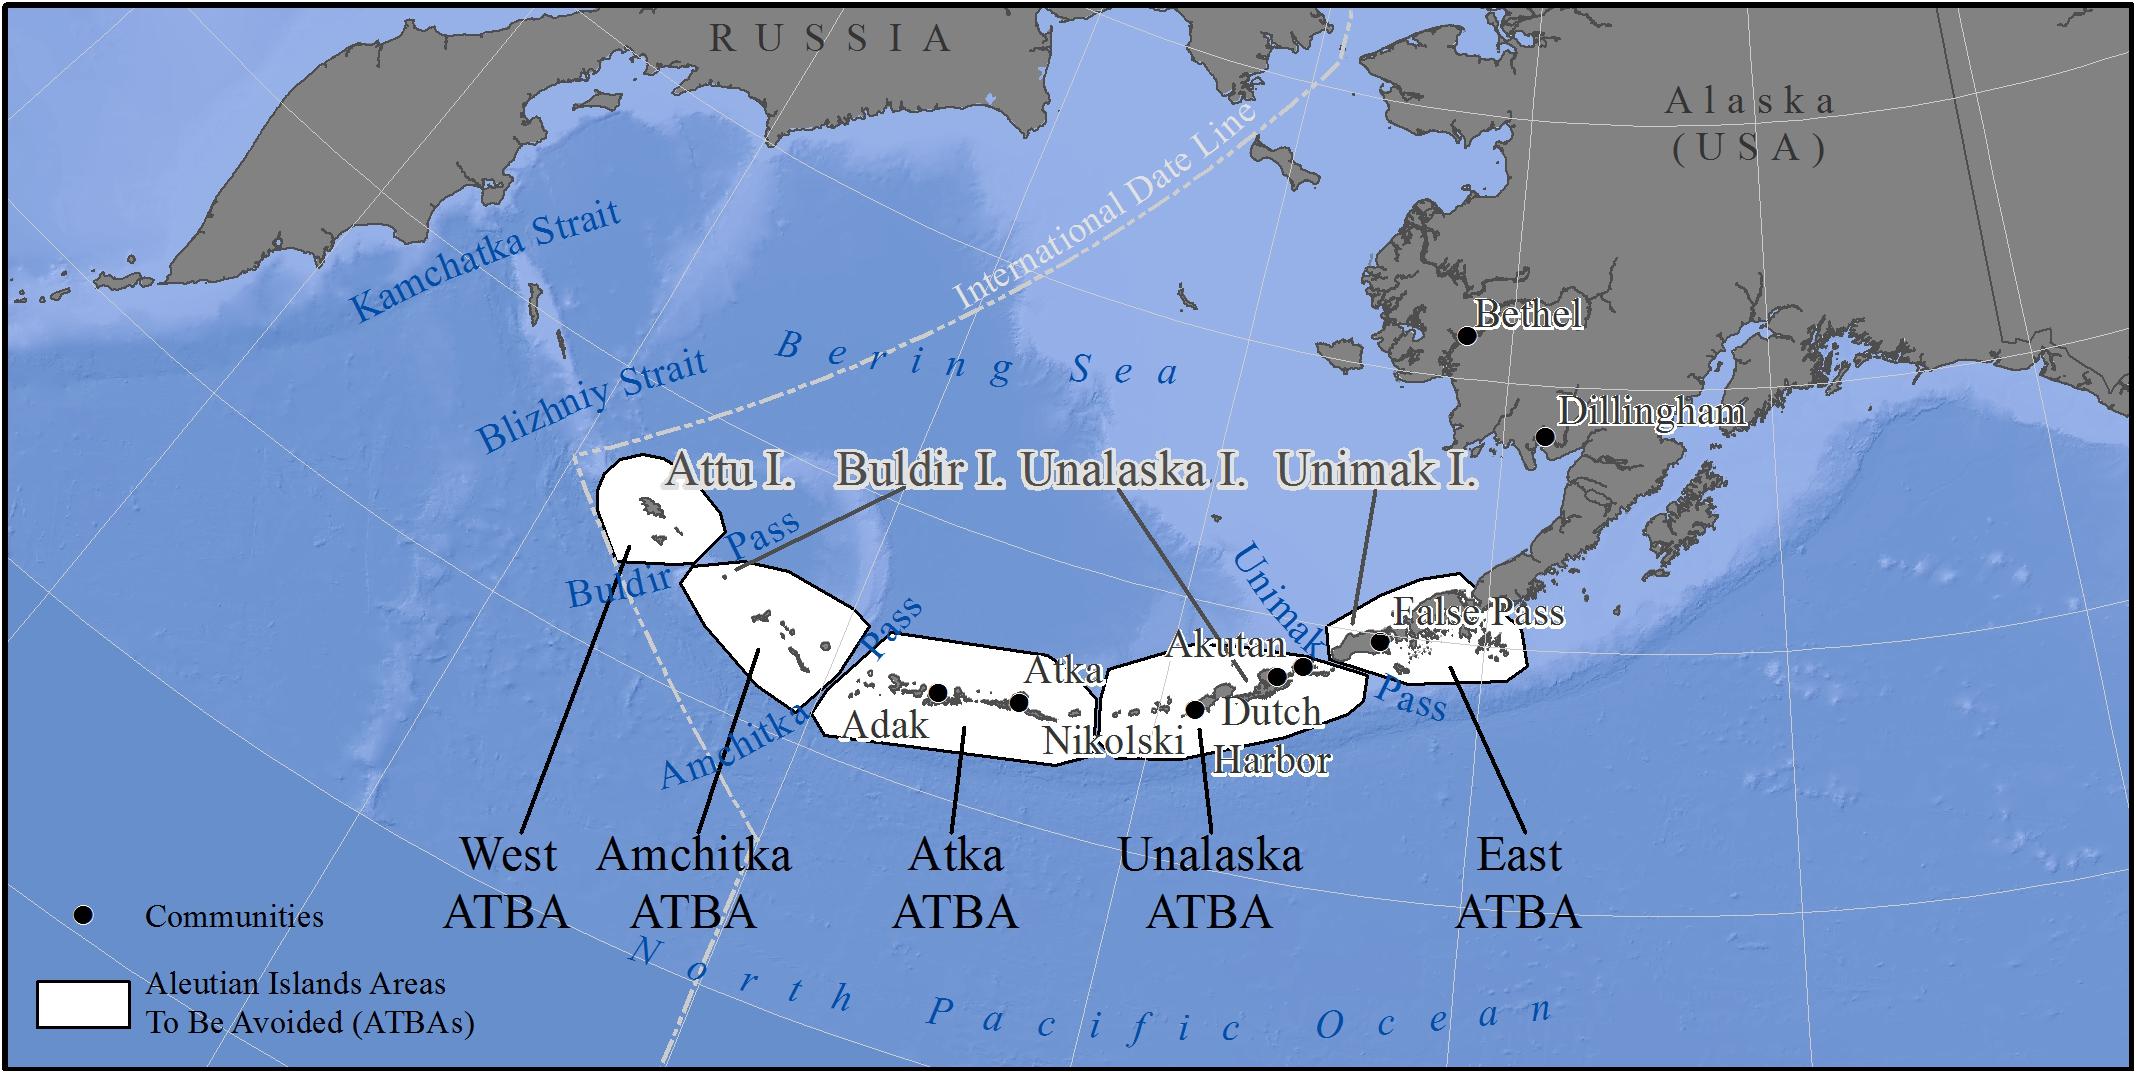
Figure 2. Aleutian Islands Areas To Be Avoided (ATBAs), as implemented by the International Maritime Organization in 2016. These five ATBAs (white polygons) were designated to reduce the risk of marine casualty and designate routes through approved passes in the Aleutian Archipelago.
However, the actual effectiveness of these ATBAs is uncertain, given the challenges associated with real-time monitoring and enforcement in such a remote environment (Huntington et al., 2019). A complex regulatory framework adds further challenges for effective implementation. For example, vessels engaged in United States trade are subject to oil spill response planning, which may include mandatory ATBA compliance (United States Coast Guard, 2017b). In contrast, vessels in innocent passage (not engaged in United States trade) are outside the jurisdiction of the same spill response requirements, and for these vessels, ATBAs are recommendatory rather than mandatory (United States Coast Guard, 2017b), although their own insurance or operating requirements may mandate certain routings. Given the regulatory complexities and management challenges, a quantitative assessment of overall fleet compliance is essential to understand ATBA effectiveness and relevance toward broader conservation goals (Whitney et al., 2016; Diz et al., 2018).
Only a limited number of studies have empirically analyzed the outcomes associated with the establishment of ATBAs. For example, Vanderlaan and Taggart (2009) demonstrated a 71% compliance with an ATBA boundary 5 months after implementation, and Silber et al. (2012) tracked compliance with vessel speed limits in the context of ship strikes. Given that international shipping transports approximately 80% of global trade by volume and over 70% of global trade by value (United Nations Conference on Trade and Negotiation [UNCTAD], 2018), the value of understanding the effectiveness of navigational measures focused on this fleet cannot be underestimated.
In this paper, we use data from the Automatic Identification System (AIS), a vessel-based global positioning service introduced through international agreement in 2002 (McCauley et al., 2016; Robards et al., 2016), to assess changes in vessel behavior and compliance following the implementation of ATBAs in the Aleutian Islands. AIS data are being increasingly used for real-time vessel monitoring and for post hoc spatial analysis of global vessel behavior (Watson et al., 2018; Silber and Adams, 2019). We analyze 4 years of AIS data to compare unique vessels with paired voyages both before (2014–2015) and after (2016–2017) implementation of the Aleutian Islands ATBAs. We use these data to answer two main questions: (1) have patterns of vessel traffic in the North Pacific Great Circle Route changed after ATBA implementation? and (2) have individual vessels changed routing decisions near each of the five Aleutian Island ATBAs with respect to ATBA implementation?
Materials and Methods
Study Area
This study analyzes vessel traffic throughout the entire Aleutian Archipelago, which includes southern portions of the Bering Sea and northern portions of the Pacific Ocean (Figure 2). The 1,800-km Aleutian Islands Archipelago separates the North Pacific Ocean from the Bering Sea and defines the southern boundary of the Arctic domain (Moore et al., 2018). The productive marine environment has sustained the (Aleut) peoples inhabiting the islands for millennia (Erlandson et al., 1992; Veltre and Smith, 2010), and current communities in the Aleutian Islands include the largest commercial fishing port in Alaska (National Marine Fisheries Service [NMFS], 2020).
Narrow passes and abrupt changes in bathymetry around the Aleutian Islands combine with strong tidal currents to mix water masses and bring nutrients into the euphotic zone (Ladd et al., 2005). Prevailing currents carry these masses north of the islands where fronts form as waters stratify, allowing phytoplankton to concentrate in more nutrient-rich zones (Hunt and Stabeno, 2005; Ladd et al., 2005). Similar admixture and upwelling events in the southeastern Bering Sea support significant levels of primary productivity (Springer et al., 1996; Piatt et al., 2006).
Both north of Aleutian passes and on the Bering Sea shelf, high productivity supports abundant zooplankton, which in turn creates favorable foraging conditions for fish, birds, marine mammals, and other predators (Springer et al., 1996; Benoit-Bird et al., 2013b; Hui et al., 2015; Zerbini et al., 2016). Sea cliffs provide nesting habitat for marine bird colonies, with an estimated 10 million seabirds of 26 species breeding at colonies throughout the Aleutians (Byrd et al., 2005). These colonial nesting birds include four million storm petrels (Oceanodroma spp.), 3.5 million auklets (Aethia spp.), and 1.5 million puffins (Fratercula spp.; Seabird Information Network, 2017). Seventeen Aleutian seabird colonies have been identified as Important Bird Areas, representing globally significant populations of nesting birds (Audubon Alaska, 2014). In addition to breeding colonies, surrounding nearshore waters – especially in the narrow passes between islands – provide foraging habitat for marine birds such as the endangered Short-tailed Albatross (Phoebastria albatrus; Ladd et al., 2005; Piatt et al., 2006). An additional 13 Important Bird Areas host globally significant aggregations of marine foraging birds from Ancient Murrelets (Synthliboramphus antiquus) to Whiskered Auklets (Aethia pygmaea; Smith et al., 2014). A number of migratory bird species overwinter in the eastern Aleutians, including Red-throated Loons (Gavia stellata), Yellow-billed Loons (Gavia adamsii), and threatened Steller’s Eiders (Polysticta stelleri; Smith et al., 2017).
A number of fish and marine mammal species converge on the same marine foraging areas (Hui et al., 2015; Zerbini et al., 2016). At least five baleen whales utilize nearshore areas, including the endangered North Pacific Right Whale (Eubalaena japonica; Zerbini et al., 2015) and the endangered distinct population segment of the humpback whale (Megaptera novaeangliae; Barlow et al., 2011). Northern fur seals (Callorhinus ursinus) forage in the eastern Aleutians (Benoit-Bird et al., 2013b), and haulouts and rookeries for endangered Steller sea lions (Eumetopias jubatus) are found throughout the archipelago (Hui et al., 2015; Smith et al., 2017). Sea otters (Enhydra lutris) have a well-documented central role in community structure in the Aleutian Islands (Anthony et al., 2008), with impacts from changes in otter density cascading through nearshore food webs (Estes and Palmisano, 1974).
The abundant fish in the area serve as a key component of food webs and of thriving fisheries in the Bering Sea region (Haynie and Huntington, 2016). The port of Dutch Harbor in the community of Unalaska has led the United States in seafood landings for the past 22 years, landing 350,000 tons (763 million pounds) of seafood in 2018 worth $182 million (National Marine Fisheries Service [NMFS], 2020). The fishery for Alaska (walleye) pollock (Gadus chalcogrammus), which spawn in the waters north of Unimak Pass and southeast Bering Sea (Bacheler et al., 2012), is the world’s single largest fishery with 3.5 million tons harvested in 2016 – about 4% by weight of all fish caught globally (Food and Agriculture Organization [FAO], 2018). Other economically important fish species harvested along the Aleutian Archipelago include Atka mackerel (Pleurogrammus monopterygius), Pacific cod (Gadus macrocephalus), King crab (Lithodes aequispinus), and Pacific halibut (Hippoglossus stenolepis; National Marine Fisheries Service [NMFS], 2020).
AIS Data Acquisition and Analysis
We acquired vessel traffic data from exactEarth (2019) as an archive of AIS data received by exactEarth’s network of satellites. AIS data spanned January 1, 2014 to December 31, 2017 and fully covered the study region (Figure 2). We developed a series of scripts in R (R Core Team, 2019) to clean and filter the data, remove spurious records, and build lines representing individual voyages. Because the ATBAs are applicable only to vessels larger than 400 gross tons (International Maritime Organization [IMO], 2014), we limited our analysis to records including ship type and tonnage. Based on detailed attributes provided by exactEarth (2019), we analyzed all tankers and cargo vessels >400 gross tons, including bulk carriers, container ships, roll-on/roll-off ships, and refrigerated cargo ships.
Due to the large volume of data (∼500,000,000 AIS records in total; >150 GB), we first parsed data into readable sequences of 1,000,000 points based on date and vessel ID using the 9-digit code known as Maritime Mobile Service Identity (MMSI). We detected individual spurious records due to errors in global positioning system (GPS) using geometry: if a point was >100 km from neighboring points, we removed the aberrant point, assuming that a vessel would not travel 100 km in 2 min (approximately the frequency interval of two consecutive AIS data records). All remaining points were used to draw daily tracks by sequentially connecting all known locations of a given vessel on a given day, then merging all tracks for every unique vessel. From these aggregated lines, we split any tracks with segments more than 7 days apart into discrete voyages, assuming that the gap represented a port call, anchoring, or a completed voyage followed by a return trip. We used voyages, defined as a single unique trip undertaken by a single unique vessel, as our unit of analysis.
In order to limit our analysis to vessels on the North Pacific Great Circle Route, we spatially filtered voyages using a “box-and-gate” method, only considering voyages occurring within the box (Figure 3). We created two gates – geographic lines parallel to meridians – on the western (168°E) and eastern (161°W) termini of the Aleutian portion of the North Pacific Great Circle Route (Figure 3). We excluded voyages that did not pass through both gates, as these voyages did not complete a full transit.
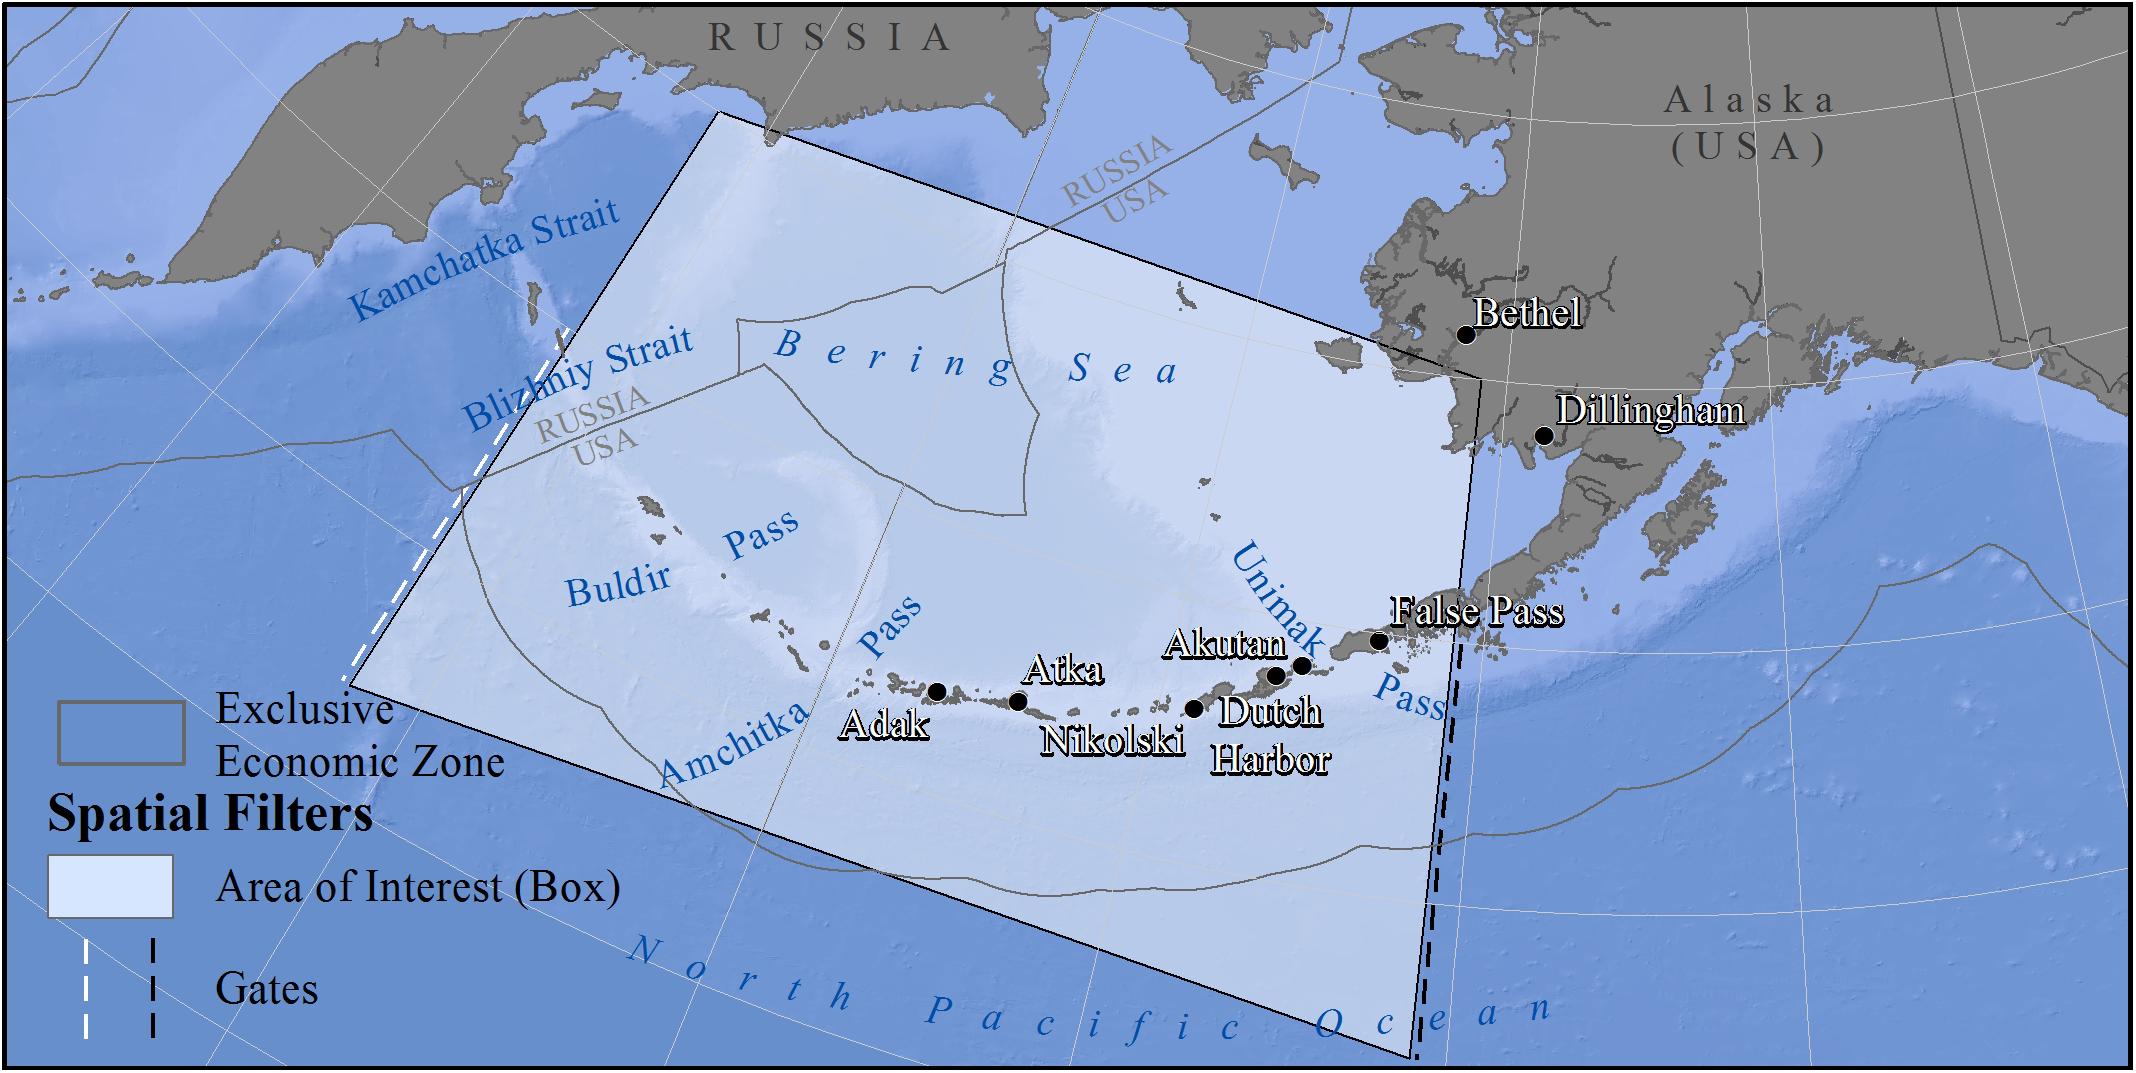
Figure 3. Spatial methods for selecting vessels transiting the North Pacific Great Circle Route. All voyages outside the gray box were excluded from analysis. Gates were drawn along 168°E (western gate; white hashed line) and 161°W (eastern gate; black hashed line) to represent the termini of the Aleutian portion of the North Pacific Great Circle Route. All voyages that did not pass through both gates were excluded.
ATBA Compliance Assessment
We tested compliance for each ATBA individually, using pooled voyage data for 2014–2015 (prior to ATBA implementation) and 2016–2017 (after ATBA implementation). From our records of unique voyages through the study area, we selected only voyages that traveled near an ATBA (within 100 km of the ATBA boundary). We designated a voyage as non-compliant if any portion of the voyage intersected or passed through the ATBA at any point. All other voyages that did not intersect the ATBA were designated as compliant. We then calculated compliance C for location a at time t following Eq. 1:
where Vin represents the total number of voyages that intersected with an ATBA and Vnear represents the total number of voyages passing within 100 km of an ATBA boundary.
To assess changes in compliance, we first calculated compliance for all vessels in 2014–2015 and in 2016–2017 and used an unpaired Wilcoxon rank-sum test (Murakami, 2015) to examine whether compliance rates differed between time periods. This test gave a simple indication of general compliance changes using all vessels, regardless of whether an individual vessel had an opportunity to change behavior after ATBA implementation.
Second, we further refined our sample to test whether the implementation of ATBAs changed routing decisions on an individual vessel level. For each of the five Aleutian ATBAs, we selected only vessels that transited near the ATBA at least one time in both the pre- (2014–2015) and post- (2016–2017) implementation periods. We used a one-sided Wilcoxon-Pratt signed rank test (Pratt, 1959; Woolson, 2007) on these paired data to examine whether the post-implementation compliance rates for individual vessels increased significantly from the pre-implementation rates for those same vessels. This approach builds upon previous methods for ATBA compliance analysis (e.g., Vanderlaan and Taggart, 2009) by allowing us to examine changes in individual vessel behavior before and after policy implementation.
Results
AIS Summary
Based on exactEarth AIS data, 2,252 unique tankers and cargo vessels >400 gross tons completed a total of 8,794 voyages through the North Pacific Great Circle Route from 2014 to 2017. Cargo ships comprised the vast majority of these vessels (2,125) and voyages (8,455). Overall, vessel traffic within the study area decreased over the 4 years, from 2,844 voyages in 2014 to 1,680 in 2017 (Figure 4). Most vessels transited Unimak Pass (7,803 voyages), the easternmost pass from the Pacific Ocean to the Bering Sea. Blizhniy Strait, between Alaska’s Near Islands and Russia’s Commander Islands, hosted 6,040 voyages, and most other vessels transited at Buldir Pass (1,725 voyages).
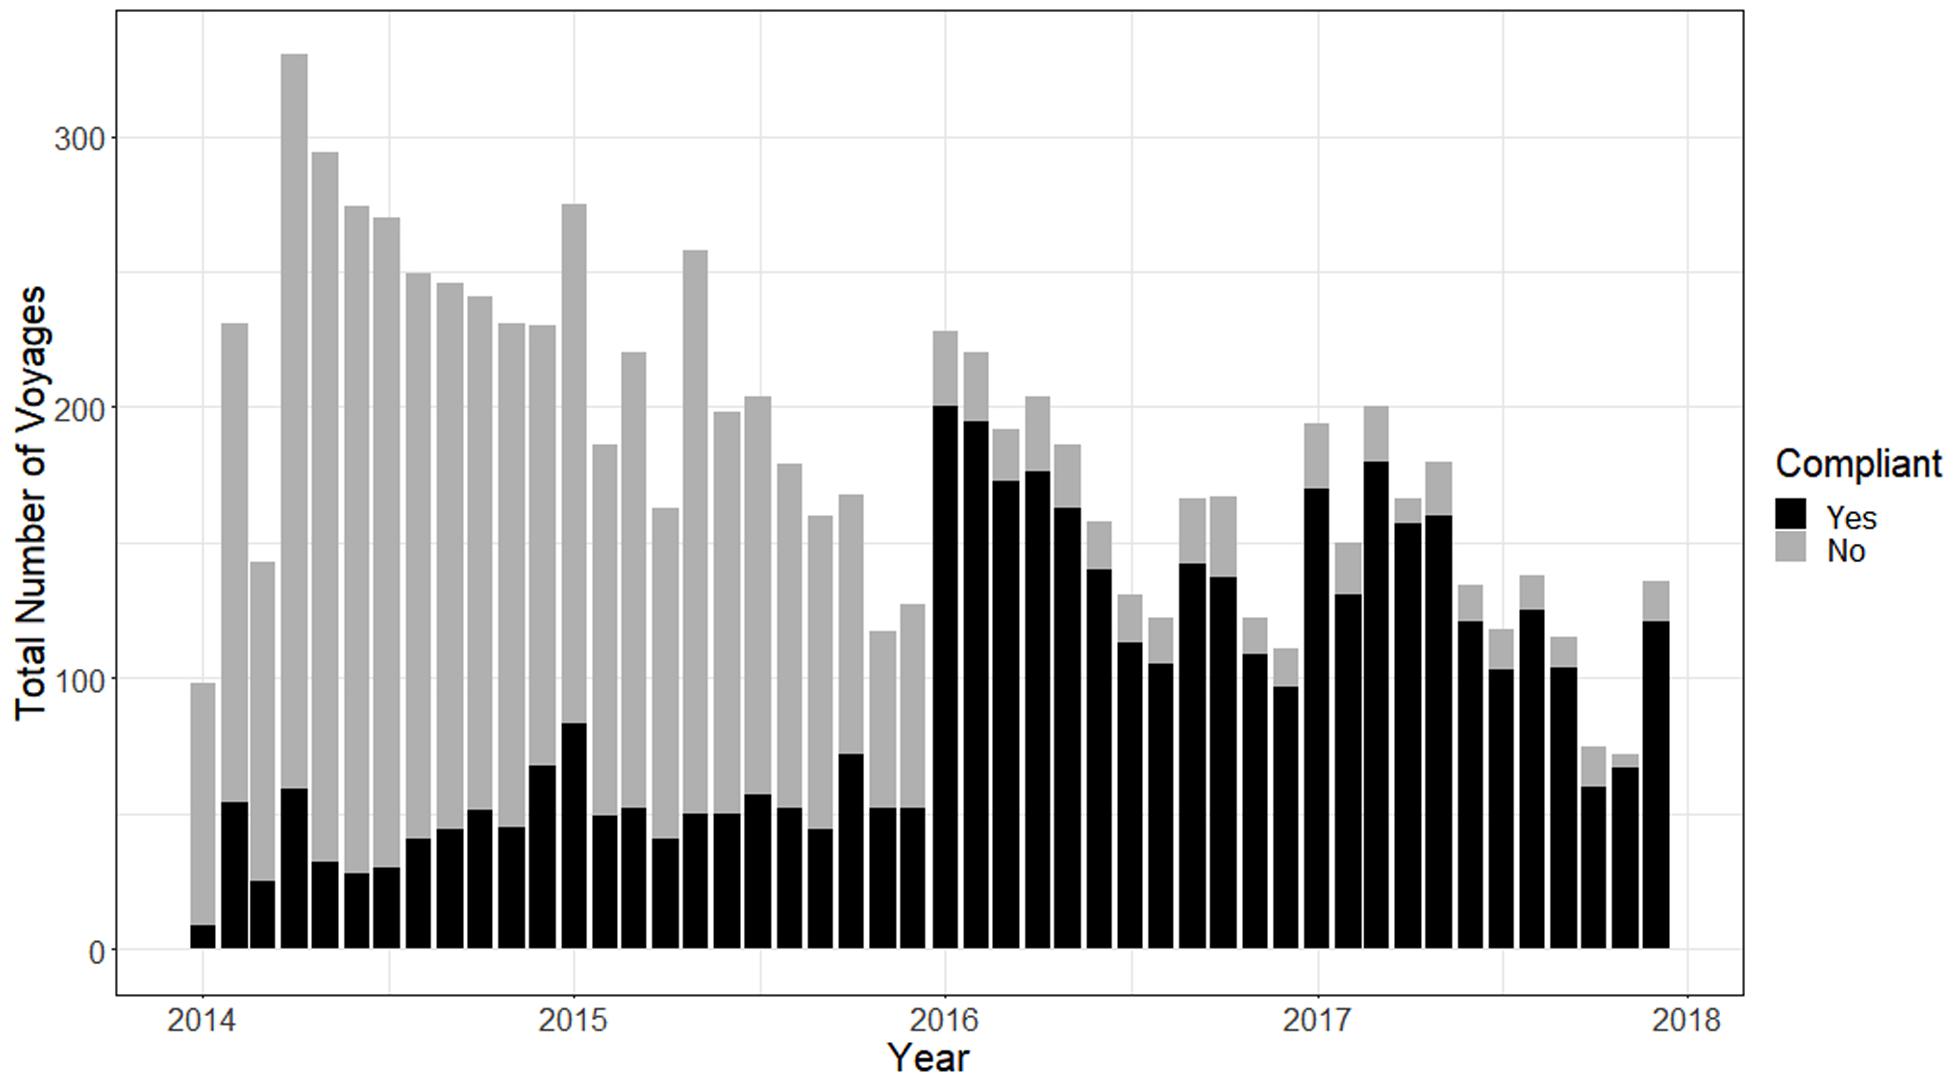
Figure 4. North Pacific Great Circle Route voyages completed by tankers and cargo vessels >400 gross tons during 2014–2017. Compliance was defined as whether a voyage intersected (non-compliant) or avoided (compliant) Areas To Be Avoided.
Spatial Shifts
The most dramatic shifts in vessel traffic occurred in nearshore waters south of the Aleutians and north of Attu Island (Figure 5A). Within 50 nautical miles (93 km) south of the Aleutians, vessel traffic decreased by 94% between 2014–2015 and 2016–2017. Similar shifts occurred directly north of Attu Island (Figure 5B). Most vessels transiting the northern portion of the North Pacific Great Circle Route transit northwest of Attu through Blizhniy Strait, the widest pass between the Pacific Ocean and Bering Strait. 68.7% (6,040 of 8,794) of all voyages in 2014–2017 transited Blizhniy Strait. Many of these routes were modified after designation of the West ATBA, which bounds Attu and the other Near Islands. Vessels shifted their routes north to avoid the ATBA, decreasing traffic within the West ATBA and nearly tripling vessel traffic just north and west of the ATBA boundaries (Figure 5B).
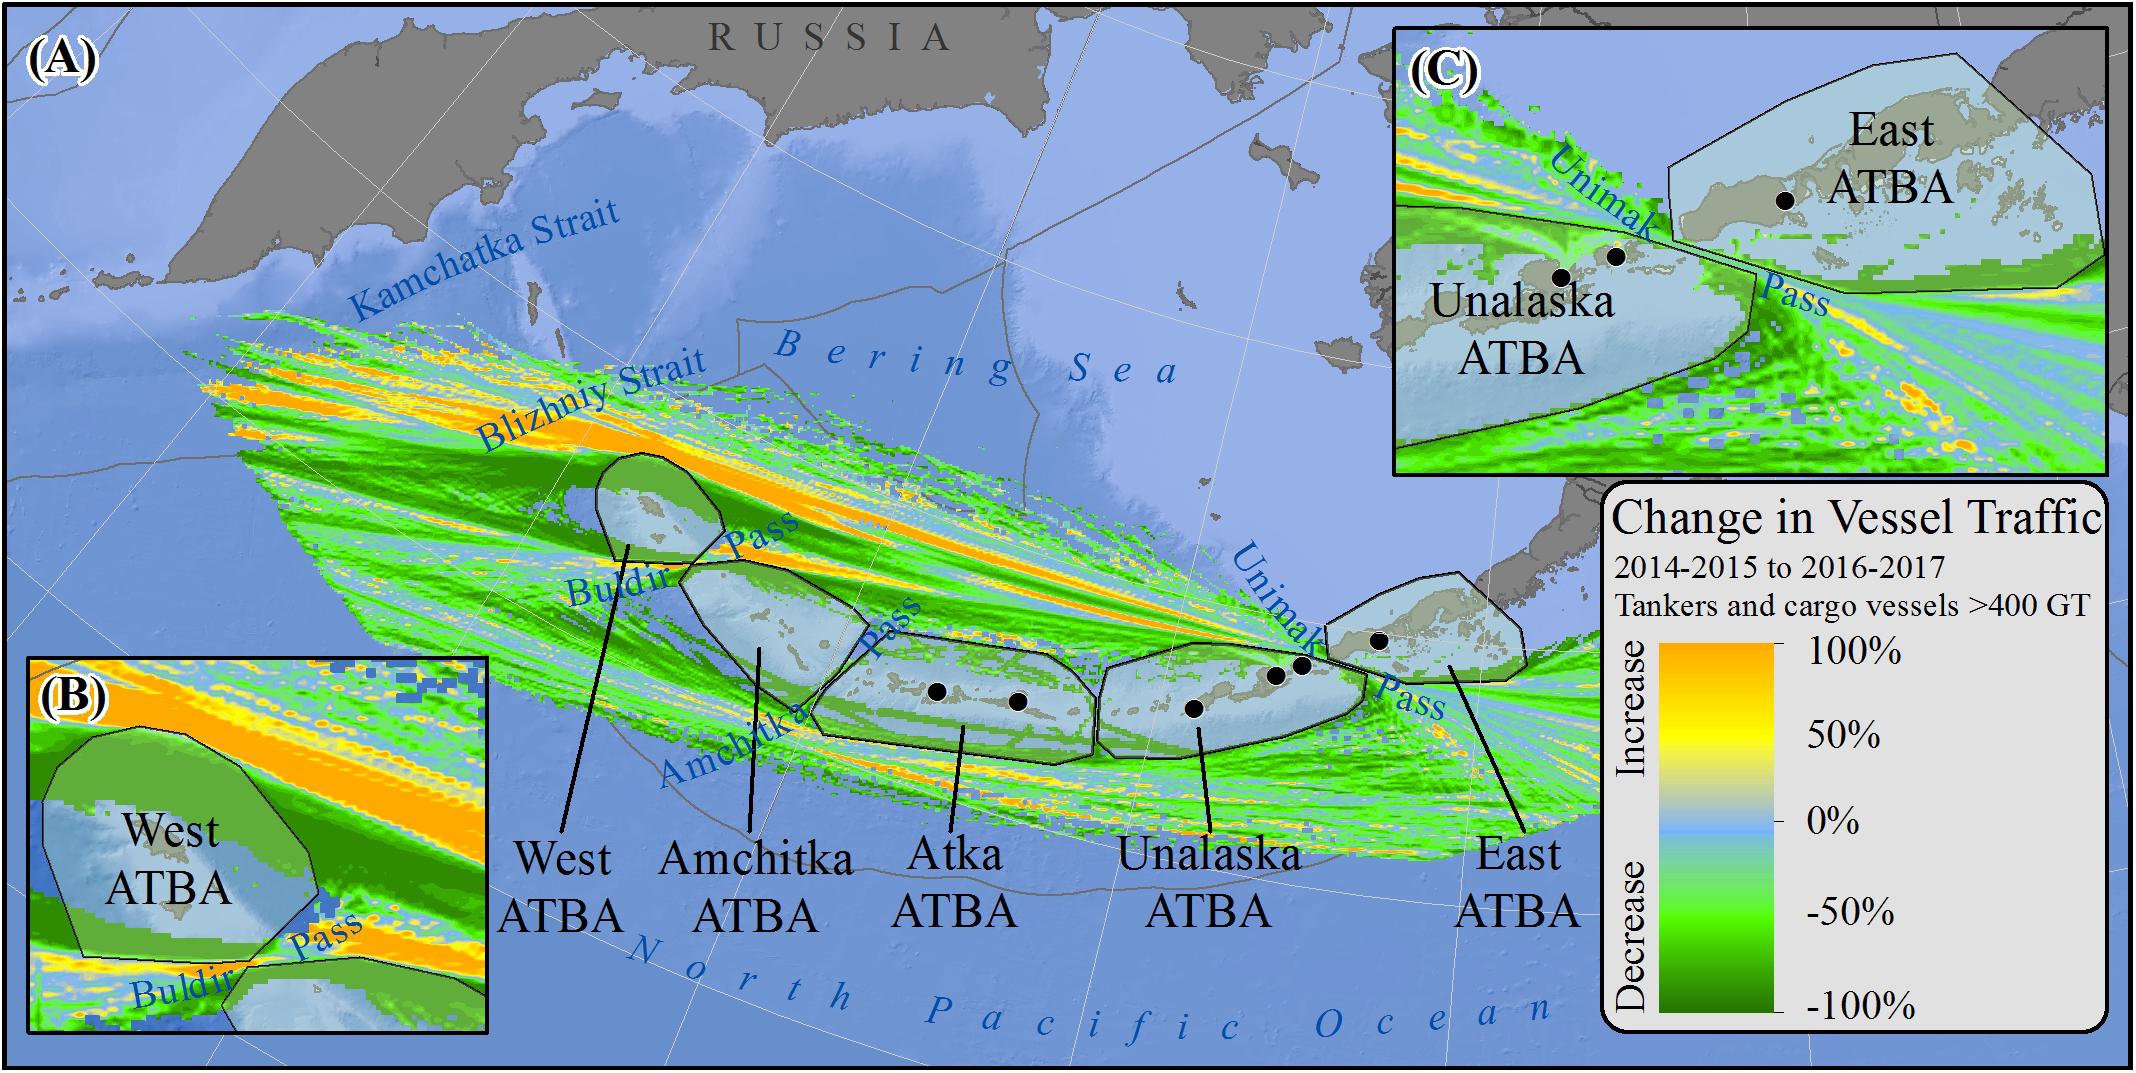
Figure 5. (A) Changes in vessel traffic along the North Pacific Great Circle Route before (2014–2015) and after (2016–2017) implementation of Areas To Be Avoided (ATBAs). Only vessels subject to ATBA regulations (tankers and cargo vessels >400 gross tons) included. Increases in vessel traffic are represented on a blue-orange gradient, and decreases in vessel traffic are represented on a blue–green gradient. (B) Detail of changes in vessel traffic near Buldir Pass, Attu Island, and the West ATBA. (C) Detail of changes in vessel traffic near Unimak Pass, Unalaska and Unimak Islands, and Unalaska and East ATBAs.
These patterns concentrate vessels in specific portions of heavily trafficked routes. Within Blizhniy Strait, 88.7% of voyages (2,409 of 2,715) are in a 35-km-wide lane, although the entire strait is over 330 km wide. Prior to ATBA implementation, the most concentrated 35-km lane in Blizhniy Strait hosted only 56.6% (1,881 of 3,325) voyages. Similarly, the ATBAs designated on either side of Buldir Pass funneled vessels into a narrow corridor between boundaries: vessel traffic more than doubled in the narrowest 7-km section (231 voyages in 2014–2015 to 581 voyages in 2016–2017; Figure 5B). Prior to ATBA implementation, vessels were more evenly distributed throughout the 130-km pass. However, vessel routing through Unimak Pass stayed consistent: nearly 100% (7,800 of 7,803) of voyages used a 7-km corridor within the 18-km pass (Figure 5C).
Overall Compliance Assessment
In addition to spatial traffic shifts, we analyzed specific vessel routing changes. Of the 8,794 voyages through the North Pacific Great Circle Route, 17 voyages did not pass within 100 km of an ATBA and were removed from compliance analyses. 4,388 of the remaining 8,777 total voyages intersected an ATBA, most of which (90.1%) occurred before ATBA implementation. The overall percentage of compliant voyages increased from 22.4% in 2014–2015 to 88.2% in 2016–2017 (Table 1). Results of an unpaired Wilcoxon rank-sum test, indicated that overall compliance rates increased significantly (p < 0.00001) from 2014–2015 to 2016–2017. Furthermore, compliance rates after ATBA implementation did not vary substantially by season, indicating consistently high compliance.
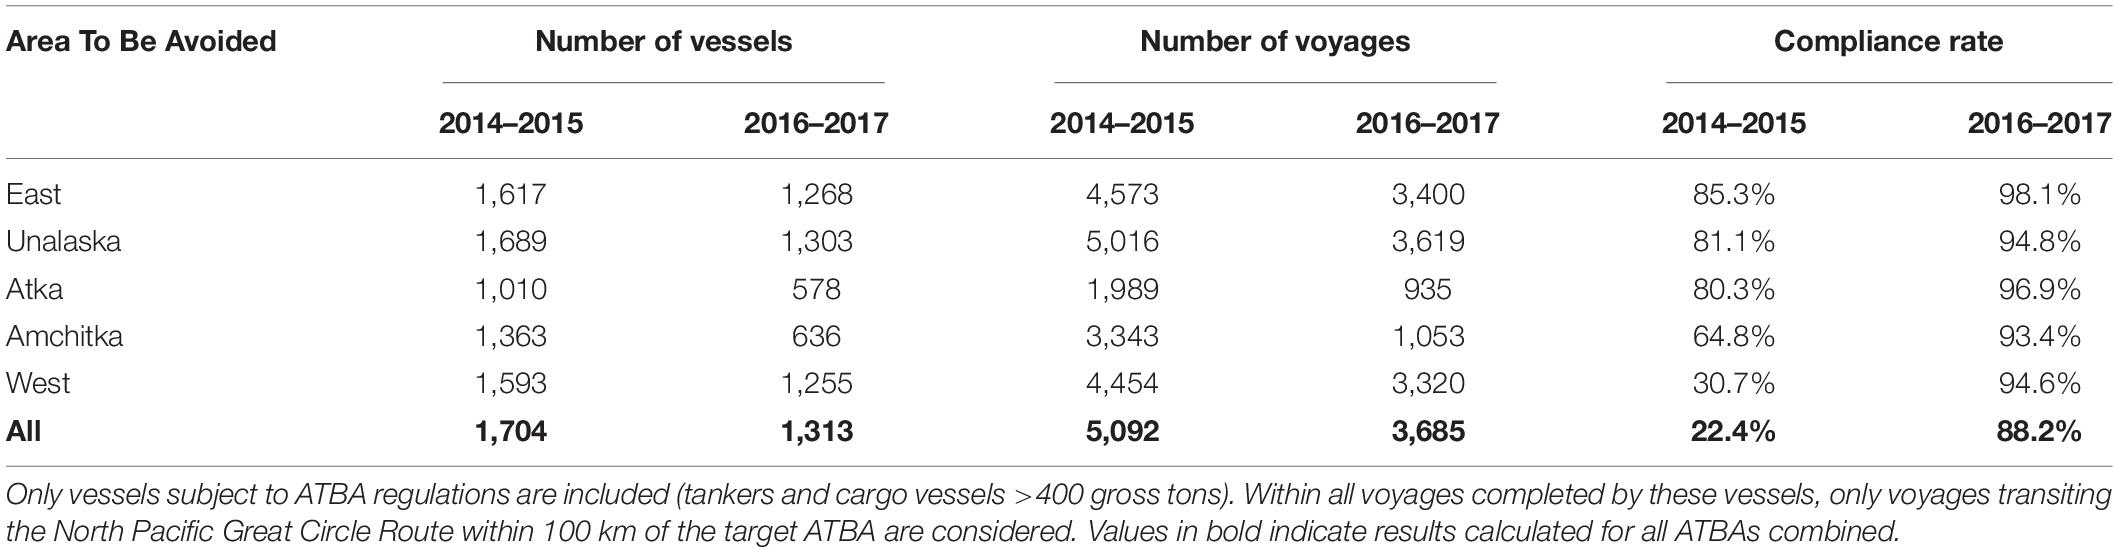
Table 1. Overall vessel traffic changes, pre- and post-implementation of Aleutian Areas To Be Avoided (ATBAs).
Individual ATBA Compliance Rates
In order to better understand changes in individual vessel behavior before and after policy implementation, we limited our dataset to vessels that transited the North Pacific Great Circle Route at least once in 2014–2015 and at least once in 2016–2017. This ensured that at least one voyage was completed before and after ATBA implementation on Jan 1, 2016. Of the 2,250 unique vessels that transited the North Pacific Great Circle Route and passed within 100 km of an ATBA, 767 vessels had at least one voyage both before and after ATBA implementation (Table 2).
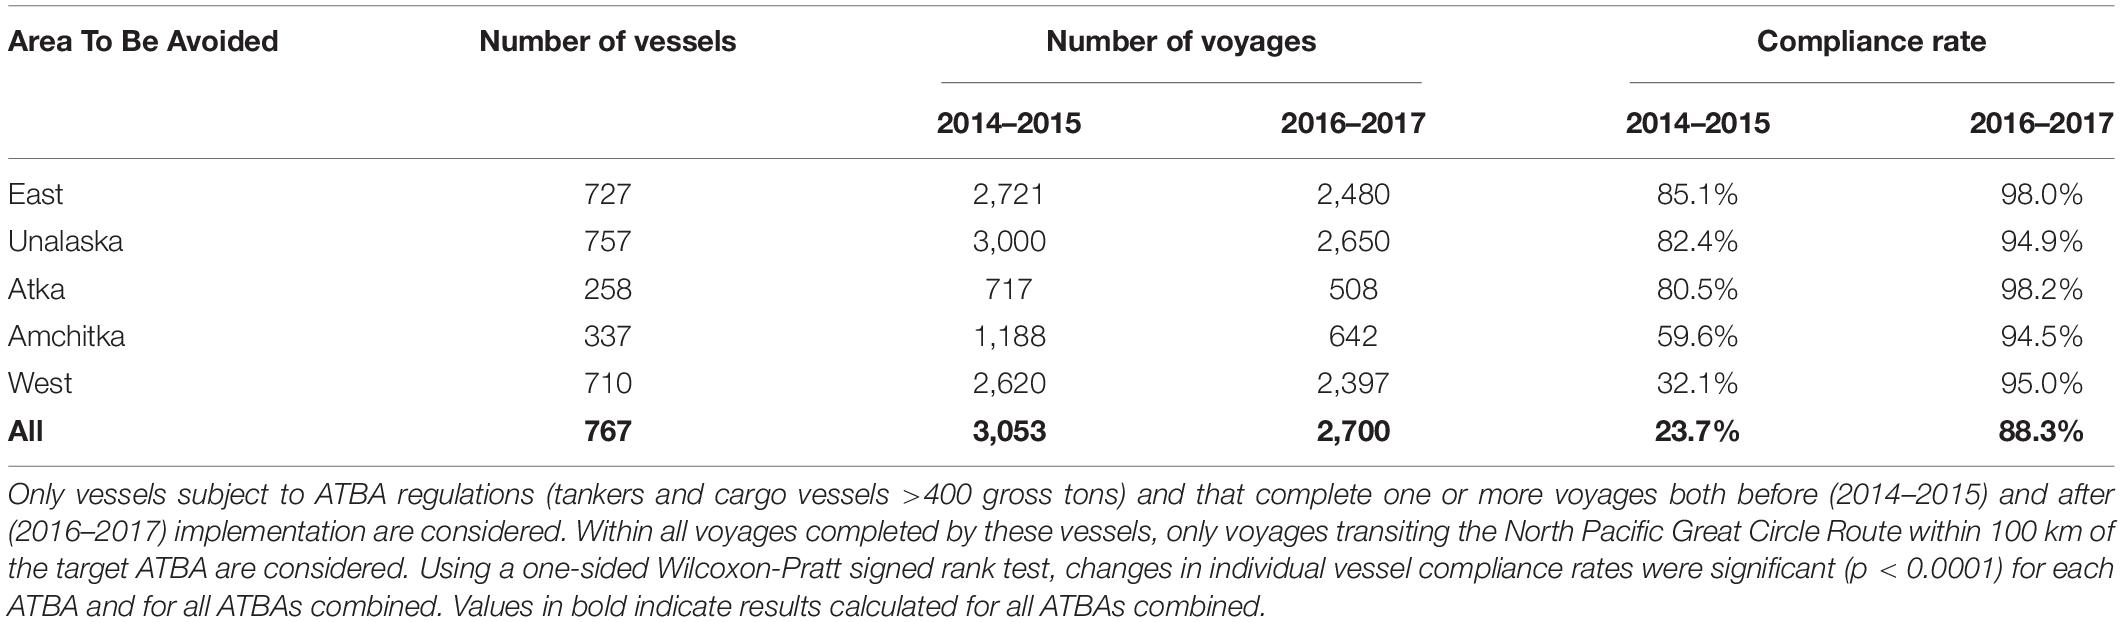
Table 2. Individual vessel behavior changes, pre- and post-implementation of Aleutian Areas To Be Avoided (ATBAs).
The West ATBA had the lowest compliance rate before implementation (30.7%), and Amchitka ATBA had the lowest compliance rate after implementation (93.4%; Table 2). Because many voyages crossed one ATBA boundary at some point but avoided all others during the remainder of the transit, the overall compliance rates were lower than compliance for any individual ATBA.
Results for the paired, one-sided Wilcoxon signed rank test for all ATBAs were significant (p < 0.0001 for each ATBA and for all ATBAs combined; Table 2), indicating that individual vessel-level compliance significantly increased after implementation of ATBAs. Compliance increased most in the West ATBA, increasing from 32.1% to 95.0% (Table 2), representing vessels that previously traveled just north of Attu Island before turning south toward East Asia (Figure 5B). Notably, compliance increased from 59.6% to 94.5% in the Amchitka ATBA, with the majority of changes resulting from vessels that no longer traveled adjacent to the southern coastline (Figure 5C).
Discussion
ATBA Compliance
Based on the shifts in vessel traffic after implementation, ATBAs are an effective spatial measure and an effective management strategy for long-distance routing. This result is supported by changes in both aggregate vessel traffic and individual vessel routing. Most of the vessels that transited the North Pacific Great Circle Route in 2014–2015 crossed waters that were designated as ATBAs on January 1, 2016. In particular, vessels transiting south of the Aleutians commonly used waters within 20–40 km of land. After the implementation of ATBAs, those same vessels largely used different routes to avoid ATBAs in 2016–2017, shifting further offshore to both the north and the south.
Although the volume of global tanker and cargo vessel traffic continues to increase over 3% annually (United Nations Conference on Trade and Negotiation [UNCTAD], 2019), we noted an overall decrease in transits from 2014 to 2017. The decline was especially notable in the summer and early fall, when calmer conditions allow vessels to transit south of the Aleutians. However, because our study focuses on the Aleutian Islands, we did not analyze vessels that transit the Pacific on mid-latitude routes such as those between 40° to 50° North. These southern routes are the most efficient way to connect more southerly ports such as Long Beach, CA or the Panama Canal directly to ports in East Asia (Chen et al., 2014). We expect that the decrease in transits that we observed over the study period may be explained by a higher proportion of vessels routing entirely south of the Aleutians.
Regulatory Framework and Monitoring Networks
Routing decisions and compliance with ATBAs are driven by a complex array of factors including maritime conditions, weather patterns, navigational efficiency, and myriad regulations (Melia et al., 2016). Aside from IMO regulations when ATBAs and other routing measures are adopted, insurance practices and Alternative Planning Criteria (APC) can affect compliance. Although global shipping losses have declined in frequency by 65% over the past decade, the financial consequences of individual incidents continue to grow, with a single worst-case shipwreck costing as much as $4 billion (Allianz Global Corporate and Specialty, 2019). Such significant financial repercussions elevate the importance of insurance in Arctic shipping. As part of North Pacific transit policies, maritime insurance companies may stipulate approved passes through the Aleutian Archipelago or may be contingent on compliance with IMO guidance on use of ATBAs (Arctic Council, 2009). Such operating requirements can help ensure compliance by vessels in innocent passage. However, insurance practices vary widely across providers and across national and sub-national levels (Arctic Council, 2009), making it difficult to assess whether insurance independently drives compliance on a broad scale.
In addition to stipulations from insurance policies, vessels are also subject to risk mitigation practices including routing measures associated with APCs. APCs are specific vessel planning resources used in remote areas such as the Aleutian Islands with limited capacity to respond to oil spills (United States Coast Guard, 2017b). Tankers or vessels greater than 400 gross tons within the United States Exclusive Economic Zone that are bound to or from a United States port must have specific vessel response plans to address the risk of an oil spill, including recommended response and mitigation resources (United States Coast Guard, 2017a). Although specific requirements differ between APC providers, more robust APCs typically involve adherence to known safe navigational corridors including passes between ATBAs (United States Coast Guard, 2017b).
The importance of APC routing provisions can be observed in the West ATBA, centered on Attu Island (Figure 2). The West ATBA and surrounding waters demonstrated the largest shift in vessel traffic after implementation (Figure 5B), likely due to alignment differences between APC and IMO routing measures. Previously, the Alaska Maritime Prevention & Response Network, the predominant APC provider in the area, had stipulated a navigational corridor at least 12 nautical miles (22 km) offshore of Attu Island starting in 2012 for tankers and 2014 for cargo vessels (Alaska Maritime Prevention and Response Network, 2018). APC-compliant vessels navigated the North Pacific Great Circle Route in accordance with this 12-nautical mile zone prior to ATBA implementation. The final West ATBA boundary adopted by the IMO, however, extended this distance to 50 nautical miles (93 km), creating an even larger margin for safe navigation of Blizhniy Strait and demonstrating adherence to both APC and IMO routing measures. The shift from 12 to 50 nautical miles offshore increases the amount of time for response to a potential marine casualty before grounding occurs. In the event of engine failure or loss of steerage, vessels further offshore provide responders such as the United States Coast Guard or commissioned vessels of opportunity more time to reach and assist a stranded vessel before a collision with coastal hazards.
While insurance and APC stipulations define overarching recommendations, the expansion of AIS technology has enabled intervention in real-time routing decisions (Robards et al., 2016). For example, the Marine Exchange of Alaska’s monitoring network throughout the Aleutian Archipelago offers an opportunity to actively monitor vessels in sensitive nearshore waters, tracking navigational anomalies and elevated risk events such as reduced speed, erratic maneuvers, or routes that would enter ATBAs. When coupled with direct communication, real-time monitoring efforts have intervened and directly changed vessel behavior hundreds of times per year in Alaskan waters (Ed Page, personal communication). Although largely successful, these interventions are not formally associated with the United States Coast Guard, the IMO, or other regulatory entities and are instead based on voluntary action from mariners. Within the Aleutian context, the significant increase in voyage compliance suggests that ATBA establishment, insurance practices, APC stipulations, and monitoring networks together have been effective, both from a fleet and individual vessel perspective.
Marine Ecology Risk Mitigation
Vessels are a significant anthropogenic risk factor for Arctic marine life (Huntington et al., 2015), especially in the western Aleutians, an area with minimal industrial activity other than that of the maritime industry. Vessels introduce the potential for ship strikes (Vanderlaan and Taggart, 2007), emissions of pollutants (Huntington et al., 2015), acoustic disturbance (Moore et al., 2012), invasive species (Bax et al., 2003), and accidental oil discharge due to a grounding or other incident (Arctic Council, 2009). Future research is needed to better understand these risk factors in the context of the Pacific Arctic sector, including the Aleutian Islands, and to better quantify the spatiotemporal distribution of environmental impacts. A handful of studies have been used to assess species-specific vulnerability (Hauser et al., 2018; Greig et al., 2020), and integrating these novel approaches with AIS data holds great promise.
Areas To Be Avoided limit vessel-related risk within nearshore waters by serving as an effective deterrent for vessels. Critically, the Aleutian Island ATBAs generally encompass ecologically important areas in the southern Bering Sea for species including zooplankton, fish, birds, and marine mammals, especially coastal haulouts, rookeries, and nesting colonies (Byrd et al., 2005; Benoit-Bird et al., 2013a; Smith et al., 2017). By diverting vessels from riskier, nearshore routes to safer, offshore routes, these ATBAs reduce nearshore underwater noise levels, emitted pollutants, and the risk of ship strikes and groundings in the Aleutian Islands. Because ATBAs both contain high biological values and reduce wildlife exposure to risk, ATBAs serve as proxies for MPAs, thereby helping contribute toward international biodiversity and conservation goals (Diz et al., 2018). Although designated primarily to improve navigational safety (International Maritime Organization [IMO], 2014), ATBAs bring considerable subsidiary benefits to the Aleutian marine ecosystem. Yet particularly for newly established ATBAs, follow-up assessment and monitoring of new vessel patterns is prudent to ensure that other sensitive species or habitats are not being exposed to new risks.
Similarly, considering the dynamism in species use of habitats is important. This may be particularly of concern in northern marine environments where the distribution of ecological values is likely to change as species respond to the shifting environmental conditions already being observed (Duffy-Anderson, et al., 2019; Piatt et al., 2020). New aggregations of species in novel areas may result in mismatched ATBA and ecological boundaries. As the abundance of certain prey species decreases due to climate change (Smith et al., 2019), marine birds have been observed to extend the distance and duration of foraging bouts (Paredes et al., 2014). Accordingly, marine foraging core areas may shift further offshore, potentially outside the boundaries of current ATBAs. For example, the 3.5 million seabirds that nest on Buldir Island currently forage close to the island, mostly within the boundaries of the Amchitka ATBA (Audubon Alaska, 2014). However, an expansion of foraging distance could bring an increasing number of birds into Buldir Pass where the creation of the Amchitka and West ATBAs has concentrated vessel traffic. Ecological monitoring and ongoing surveys are essential to determine how, when, and where these shifts will occur, and the extent to which these shifts will overlap with vessel traffic. In some cases, dynamic routing measures may be better suited to better track this dynamic environment than static measures such as ATBAs (Huntington et al., 2019).
AIS Limitations
Limitations associated with current AIS technology could reduce our sample size and impact the accuracy of our statistical tests. Our study assumes that AIS attributes are accurately and completely filled out, although some vessels do not provide data for every field. The more specific fields – such as gross tonnage, which we used to filter for relevant vessels – generally have lower completion rates. As a result, our analysis almost certainly omits vessels that are subject to IMO regulations but that are excluded due to poor AIS attribution. Provided that these vessels could be systematically identified, including these vessels in our analysis would expand our sample size. However, given the large number of vessels already included, adding the relatively few vessels with incomplete AIS records would be unlikely to change the overall significant shifts observed.
We calculated compliance using a spatial intersect function, which assumes perfect accuracy in input datasets. Although the ATBA boundaries are precisely defined, satellite AIS data often suffers accuracy issues due to periods of time when no satellite receivers are in range (latency). As a result, a vessel may in reality comply with ATBA boundaries, but due to AIS latency, the drawn track appears to pass through a corner of an ATBA. As more AIS satellite receivers have been added to exactEarth’s constellation, latency decreases, enabling more precise tracks to be drawn. Regardless, latency-related errors would result in an underestimation of compliance rather than an overestimation. Thus, our results represent conservative estimates of vessel compliance.
Potential extensions of our study could mitigate the impacts of latency and ground-truth AIS data by combining terrestrial and satellite networks for individual voyages. Terrestrial AIS receivers generally have higher positional accuracy but cover a more limited spatial extent. In areas where terrestrial coverage is available (predominantly nearshore waters), segments of individual voyages could be derived from terrestrial networks, reducing the effects of satellite latency. Further offshore where terrestrial receivers are out of range, satellite AIS data could be used to complete the remaining segments of a voyage. By integrating these two types of networks, researchers can leverage both the positional accuracy of terrestrial AIS and the spatial scope of satellite AIS. Other data streams, such as onboard GPS and port-based vessel logs, could further enhance the precision of vessel tracking, improve the accuracy of AIS-populated attributes, and identify vessels subject to IMO regulations otherwise omitted due to poor AIS attribution.
Summary
This study represents the first quantitative evaluation of compliance with the Aleutian Islands ATBAs. Furthermore, we have expanded upon previous studies on ATBA compliance to confirm changes in individual vessel behavior before and after ATBA implementation. Our results demonstrate a high degree of compliance with ATBAs and a corresponding shift in the spatial distribution of vessels. Overall, this study substantiates the use of ATBAs as a marine spatial planning tool that, alongside effective monitoring and communication with vessels, can be used to improve both maritime and environmental safety.
Data Availability Statement
The data analyzed in this study is subject to the following licenses/restrictions: The dataset used in this article is proprietary and available commercially. Requests to access these datasets should be directed to exactearth.com.
Author Contributions
BS, AP, and MR conceptualized the project. BS and KK developed and conducted the analysis. BS, KK, AP, and MR wrote and edited the manuscript. All authors contributed to the article and approved the submitted version.
Funding
BS acknowledges financial support from the Gordon and Betty Moore Foundation (GBMF4444 and GBMF4444.01). KK acknowledges financial support from the William W. and Evelyn M. Taylor Endowed Fellowship for International Engagement in Coupled Human and Natural Systems, the Vera M. Wallach Fellowship, and the Michigan State University Distinguished Fellowship. AP acknowledges financial support from the Volgenau Foundation. MR acknowledges financial support from the Aleutian and Bering Sea Island Landscape Conservation Cooperative and the Flora Family Foundation.
Conflict of Interest
BS was employed by the company Kickstep Approaches.
The remaining authors declare that the research was conducted in the absence of any commercial or financial relationships that could be construed as a potential conflict of interest.
Acknowledgments
We recognize the (Aleut) people for their long-standing stewardship of the Aleutian Archipelago that has been their home for millennia. We hope that our work contributes to a better understanding of how communities in this region can thrive given major anthropogenic changes in the marine environment. We acknowledge the several years of work by the Aleutian Islands Risk Assessment team as well as key data analysis supported by the United States Fish and Wildlife through the Aleutian and Bering Sea Island Landscape Conservation Cooperative that resulted in the establishment of the Aleutian ATBAs. We thank Natalie Dawson, Max Goldman, Melanie Smith, and Erika Knight from Audubon Alaska for their contributions toward understanding and mapping the ecological impacts of vessel traffic, and John Marc Dunaway and Rob Bochenek at Axiom Data Science for analytical guidance. We thank Jianguo (Jack) Liu at Michigan State University for his support and guidance in examining the impacts of globalization on shipping in the Arctic. We recognize Zach Bogdon at exactEarth for assistance with AIS data. An earlier draft was improved by reviews from Douglas Burn of the United States Fish and Wildlife Service, Captain Ed Page of the Marine Exchange of Alaska, Sierra Fletcher and Tim Robertson from Nuka Research, and Buddy Custard and Steven Gabelein from the Alaska Maritime Prevention & Response Network.
References
Alaska Maritime Prevention and Response Network (2018). Alternative Planning Criteria for Tank Vessels Operating in Western Alaska. Anchorage: Alaska Maritime Prevention & Response Network.
Allianz Global Corporate and Specialty (2019). Safety and Shipping Review 2019. Munich: Allianz Global Corporate & Specialty.
Anthony, R. G., Estes, J. A., Ricca, M. A., Miles, A. K., and Forsman, E. D. (2008). Bald eagles and sea otters in the Aleutian archipelago: indirect effects of trophic cascades. Ecology 89, 2725–2735. doi: 10.1890/07-1818.1
Arctic Council (2009). Arctic Marine Shipping Assessment 2009 Report. Publication of the Arctic Council’s Protection of the Marine Environment Committee, April 2009. Tromsø: Arctic Council.
Bacheler, N. M., Ciannelli, L., Bailey, K. M., and Bartolino, V. (2012). Do walleye pollock exhibit flexibility in where or when they spawn based on variability in water temperature? Deep Sea Res. Part II Top. Stud. Oceanogr. 65, 208–216. doi: 10.1016/j.dsr2.2012.02.001
Barlow, J., Calambokidis, J., Falcone, E. A., Baker, C. S., Burdin, A. M., Clapham, P. J., et al. (2011). Humpback whale abundance in the North Pacific estimated by photographic capture-recapture with bias correction from simulation studies. Mar. Mamm. Sci. 27, 793–818. doi: 10.1111/j.1748-7692.2010.00444.x
Bax, N., Williamson, A., Aguero, M., Gonzalez, E., and Geeves, W. (2003). Marine invasive alien species: a threat to global biodiversity. Mar. Pol. 27, 313–323. doi: 10.1016/s0308-597x(03)00041-1
Benoit-Bird, K. J., Battaile, B. C., Heppell, S. A., Hoover, B., Irons, D., Jones, N., et al. (2013a). Prey patch patterns predict habitat use by top marine predators with diverse foraging strategies. PLoS One 8:e53348. doi: 10.1371/journal.pone.0053348
Benoit-Bird, K. J., Battaile, B. C., Nordstrom, C. A., and Trites, A. W. (2013b). Foraging behavior of northern fur seals closely matches the hierarchical patch scales of prey. Mar. Ecol. Prog. Ser. 479, 283–302. doi: 10.3354/meps10209
Byrd, G. V., Renner, H. M., and Renner, M. (2005). Distribution patterns and population trends of breeding seabirds in the Aleutian Islands. Fish. Oceanogr. 14, 139–159. doi: 10.1111/j.1365-2419.2005.00368.x
Byrd, G. V., Reynolds, J. H., and Flint, P. L. (2009). Persistence rates and detection probabilities of bird carcasses on beaches of Unalaska Island, Alaska, following the wreck of the M/V Selendang Ayu. Mar. Orni. 37, 197–204.
Chen, J. M., Tan, P. H., Hsieh, C. M., Liu, J. S., Chen, H. S., Hsu, L. H., et al. (2014). Seasonal climate associated with major shipping routes. Terr. Atmos. Ocean. Sci. 25, 381–400. doi: 10.3319/tao.2013.12.31.01(a)
Diz, D., Johnson, D., Riddell, M., Rees, S., Battle, J., Gjerde, K., et al. (2018). Mainstreaming marine biodiversity into the SDGs: the role of other effective area-based conservation measures. Mar. Pol. 93, 251–261. doi: 10.1016/j.marpol.2017.08.019
Duffy-Anderson, J. T., Stabeno, P., Andrews, A. G. III, Cieciel, K., Deary, A., Farley, E., et al. (2019). Responses of the northern Bering Sea and southeastern Bering Sea pelagic ecosystems following record-breaking low winter sea ice. Geophys. Res. Let. 46, 9833–9842. doi: 10.1029/2019gl083396
Erlandson, J., Crowell, A., Wooley, C., and Haggarty, J. (1992). Spatial and temporal patterns in Alutiiq paleodemography. Arc. Anthr. 29, 42–62.
Estes, J. A., and Palmisano, J. F. (1974). Sea otters: their role in structuring nearshore communities. Science 185, 1058–1060. doi: 10.1126/science.185.4156.1058
Food and Agriculture Organization [FAO] (2018). The State of World Fisheries and Aquaculture 2018 - Meeting the sustainable development goals. Rome: Food and Agriculture Organization.
Game, E. T., Grantham, H. S., Hobday, A. J., Pressey, R. L., Lombard, A. T., Beckley, L. E., et al. (2009). Pelagic protected areas: the missing dimension in ocean conservation. Trends Ecol. Evol. 24, 360–369. doi: 10.1016/j.tree.2009.01.011
George, J. C., Sheffield, G., Reed, D. J., Tudor, B., Stimmelmayr, R., Person, B. T., et al. (2017). Frequency of injuries from line entanglements, killer whales, and ship strikes on Bering-Chukchi-Beaufort Seas bowhead whales. Arctic 70, 37–46. doi: 10.14430/arctic4631
Greig, N. C., Hines, E. M., Cope, S., and Liu, X. (2020). Using satellite ais to analyze vessel speeds off the coast of Washington State, US, as a risk analysis for cetacean-vessel collisions. Front. Mar. Sci. 7:109. doi: 10.3389/fmars.2020.00109
Halpern, B. S., Frazier, M., Potapenko, J., Casey, K. S., Koenig, K., Longo, C., et al. (2015). Spatial and temporal changes in cumulative human impacts on the world’s ocean. Nat. Comm. 6:7615. doi: 10.1038/ncomms8615
Hauser, D. D., Laidre, K. L., and Stern, H. L. (2018). Vulnerability of Arctic marine mammals to vessel traffic in the increasingly ice-free Northwest Passage and Northern Sea Route. Proc. Natl. Acad. of Sci. U S A. 115, 7617–7622. doi: 10.1073/pnas.1803543115
Haynie, A. C., and Huntington, H. P. (2016). Strong connections, loose coupling: the influence of the Bering Sea ecosystem on commercial fisheries and subsistence harvests in Alaska. Ecol. and Soc. 21:6. doi: 10.5751/ES-08729-210406
Hildebrand, J. A. (2009). Anthropogenic and natural sources of ambient noise in the ocean. Mar. Ecol. Prog. Ser. 395, 5–20. doi: 10.3354/meps08353
Hui, T. C. Y., Gryba, R., Gregr, E. J., and Trites, A. W. (2015). Assessment of competition between fisheries and Steller sea lions in Alaska based on estimated prey biomass, fisheries removals and predator foraging behaviour. PLoS One 10:e0123786. doi: 10.1371/journal.pone.0123786
Hunt, G. L. Jr., and Stabeno, P. J. (2005). Oceanography and ecology of the Aleutian Archipelago: spatial and temporal variation. Fish. Oceanogr. 14, 292–306. doi: 10.1111/j.1365-2419.2005.00378.x
Huntington, H. P., Bobbe, S., Hartsig, A., Knight, E. J., Knizhnikov, A., Moiseev, A., et al. (2019). The role of areas to be avoided in the governance of shipping in the greater Bering Strait region. Mar. Pol. 110:103564. doi: 10.1016/j.marpol.2019.103564
Huntington, H. P., Daniel, R., Hartsig, A., Harun, K., Heiman, M., Meehan, R., et al. (2015). Vessels, risks, and rules: planning for safe shipping in Bering Strait. Mar. Pol. 51, 119–127. doi: 10.1016/j.marpol.2014.07.027
International Maritime Organization [IMO] (2014). Routing Measures and Mandatory Ship Reporting Systems: Establishment of Five Areas to be Avoided in the Region of the Aleutian Islands. Sub-Committee on Navigation, Communications and Search and Rescue. London: International Maritime Organization.
Kurtz, R. S. (2008). The M/V selendang ayu disaster: linkages between policy change, gaps, and crises. Soc. Sci. J. 45, 633–645. doi: 10.1016/j.soscij.2008.09.009
Ladd, C., Hunt, G. L. Jr., Mordy, C. W., Salo, S. A., and Stabeno, P. J. (2005). Marine environment of the eastern and central Aleutian Islands. Fish. Oceanogr. 14, 22–38. doi: 10.1111/j.1365-2419.2005.00373.x
Lubchenco, J., and Grorud-Colvert, K. (2015). Making waves: the science and politics of ocean protection. Science 350, 382–383. doi: 10.1126/science.aad5443
McCauley, D. J., Woods, P., Sullivan, B., Bergman, B., Jablonicky, C., Roan, A., et al. (2016). Ending hide and seek at sea. Science 351, 1148–1150. doi: 10.1126/science.aad5686
Melia, N., Haines, K., and Hawkins, E. (2016). Sea ice decline and 21st century trans-Arctic shipping routes. Geophys. Res. Let. 43, 9720–9728. doi: 10.1002/2016gl069315
Moore, S. E., Reeves, R. R., Southall, B. L., Ragen, T. J., Suydam, R. S., and Clark, C. W. (2012). A new framework for assessing the effects of anthropogenic sound on marine mammals in a rapidly changing Arctic. BioScience 62, 289–295. doi: 10.1525/bio.2012.62.3.10
Moore, S. E., Stabeno, P. J., Grebmeier, J. M., and Okkonen, S. R. (2018). The arctic marine pulses model: linking annual oceanographic processes to contiguous ecological domains in the Pacific Arctic. Deep Sea Res. Part II Top. Stud. Oceanogr. 152, 8–21. doi: 10.1016/j.dsr2.2016.10.011
Murakami, H. (2015). The power of the modified Wilcoxon rank-sum test for the one-sided alternative. Statistics 49, 781–794. doi: 10.1080/02331888.2014.913049
National Marine Fisheries Service [NMFS] (2020). Fisheries of the United States, 2018. Silver Spring, MD: U.S. Department of Commerce & National Oceanic and Atmospheric Administration.
National Oceanic, and Atmospheric Administration [NOAA] (2002). Final Restoration Plan and Environmental Assessment for the M/V Kuroshima Oil Spill. Seattle: National Oceanic and Atmospheric Administration Damage Assessment Center.
Nuka Research, and Planning Group (2015). Aleutian Islands Risk Assessment: Summary Report. Recommending an Optimal System for the Aleutian Islands. Seldovia, AK: Nuka Research and Planning Group, LLC.
Nuka Research and Planning Group (2016). Bering Sea Vessel Traffic Risk Analysis. Seldovia, AK: Nuka Research and Planning Group, LLC.
Paredes, R., Orben, R. A., Suryan, R. M., Irons, D. B., Roby, D. D., Harding, A. M., et al. (2014). Foraging responses of black-legged kittiwakes to prolonged food-shortages around colonies on the Bering Sea shelf. PLoS One 9:e92520. doi: 10.1371/journal.pone.0092520
Piatt, J. F., Parrish, J. K., Renner, H. M., Schoen, S. K., Jones, T. T., Arimitsu, M. L., et al. (2020). Extreme mortality and reproductive failure of common murres resulting from the northeast Pacific marine heatwave of 2014-2016. PLoS One 15:e0226087. doi: 10.1371/journal.pone.0226087
Piatt, J. F., Wetzel, J., Bell, K., DeGange, A. R., Balogh, G. R., Drew, G. S., et al. (2006). Predictable hotspots and foraging habitat of the endangered short-tailed albatross (Phoebastria albatrus) in the North Pacific: implications for conservation. Deep Sea Res. Part II Top. Stud. Oceanogr. 53, 387–398. doi: 10.1016/j.dsr2.2006.01.008
Pratt, J. W. (1959). Remarks on zeros and ties in the Wilcoxon signed rank procedures. J. Am. Stat. Assoc. 54, 655–667. doi: 10.1080/01621459.1959.10501526
R Core Team (2019). R: A Language and Environment for Statistical Computing. Vienna: R Foundation for Statistical Computing.
Robards, M. D., Silber, G. K., Adams, J. D., Arroyo, J., Lorenzini, D., Schwehr, K., et al. (2016). Conservation science and policy applications of the marine vessel Automatic Identification System (AIS)—a review. Bull. Mar. Sci. 92, 75–103. doi: 10.5343/bms.2015.1034
Seabird Information Network (2017). Data from: North Pacific Seabird Data Portal. Available online at: http://axiom.seabirds.net/maps/north-pacific-seabirds/ (accessed June 11, 2020).
Silber, G. K., and Adams, J. D. (2019). Vessel Operations in the Arctic, 2015-2017. Front. Mar. Sci. 6:573. doi: 10.3389/fmars.2019.00573
Silber, G. K., Vanderlaan, A. S., Arceredillo, A. T., Johnson, L., Taggart, C. T., Brown, M. W., et al. (2012). The role of the international maritime organization in reducing vessel threat to whales: process, options, action and effectiveness. Mar. Pol. 36, 1221–1233. doi: 10.1016/j.marpol.2012.03.008
Smith, M. A., Goldman, M. S., Knight, E. J., and Warrenchuk, J. J. (2017). Ecological Atlas of the Bering, Chukchi, and Beaufort Seas, 2nd Edn. Anchorage: Audubon Alaska.
Smith, M. A., Sullender, B. K., Koeppen, W. C., Kuletz, K. J., Renner, H. M., and Poe, A. J. (2019). An assessment of climate change vulnerability for important bird areas in the Bering Sea and Aleutian Arc. PLoS One 14:e0214573. doi: 10.1371/journal.pone.0214573
Smith, M. A., Walker, N. J., Free, C. M., Kirchhoff, M. J., Drew, G. S., Warnock, N., et al. (2014). Identifying marine Important Bird Areas using at-sea survey data. Biol. Cons. 172, 180–189. doi: 10.1016/j.biocon.2014.02.039
Springer, A. M., Peter, McRoy, C., and Flint, M. V. (1996). The bering Sea Green Belt: shelf-edge processes and ecosystem production. Fish. Oceanogr. 5, 205–223. doi: 10.1111/j.1365-2419.1996.tb00118.x
U.S. Coast Guard (2017a). Navigation and navigable waters, and shipping; technical, organizational, and conforming amendments. Fed. Regist. 82, 35073–35093.
U.S. Coast Guard (2017b). Update to alternative planning criteria national guidelines. Fed. Regist. 82, 47975–47981.
United Nations Conference on Trade and Negotiation [UNCTAD] (2018). Review of Maritime Transport 2018. Geneva: United Nations Conference on Trade and Negotiation.
United Nations Conference on Trade and Negotiation [UNCTAD] (2019). Review of Maritime Transport 2019. Geneva: United Nations Conference on Trade and Negotiation.
Vanderlaan, A. S., and Taggart, C. T. (2007). Vessel collisions with whales: the probability of lethal injury based on vessel speed. Mar. Mamm. Sci. 23, 144–156. doi: 10.1111/j.1748-7692.2006.00098.x
Vanderlaan, A. S., and Taggart, C. T. (2009). Efficacy of a voluntary area to be avoided to reduce risk of lethal vessel strikes to endangered whales. Cons. Biol. 23, 1467–1474. doi: 10.1111/j.1523-1739.2009.01329.x
Veltre, D. W., and Smith, M. A. (2010). Historical overview of archaeological research in the Aleut region of Alaska. Hum. Biol. 82, 487–506. doi: 10.3378/027.082.0502
Watson, J. T., Haynie, A. C., Sullivan, P. J., Perruso, L., O’Farrell, S., Sanchirico, J. N., et al. (2018). Vessel monitoring systems (VMS) reveal an increase in fishing efficiency following regulatory changes in a demersal longline fishery. Fish. Res. 207, 85–94. doi: 10.1016/j.fishres.2018.06.006
Whitney, C. K., Gardner, J., Ban, N. C., Vis, C., Quon, S., and Dionne, S. (2016). Imprecise and weakly assessed: evaluating voluntary measures for management of marine protected areas. Mar. Pol. 69, 92–101. doi: 10.1016/j.marpol.2016.04.011
Woolson, R. F. (2007). Wilcoxon Signed-Rank Test. Hoboken, NJ: Wiley Encyclopedia of Clinical Trials. doi: 10.1002/9780471462422.eoct979
Zerbini, A. N., Baumgartner, M. F., Kennedy, A. S., Rone, B. K., Wade, P. R., and Clapham, P. J. (2015). Space use patterns of the endangered North Pacific right whale Eubalaena japonica in the Bering Sea. Mar. Ecol. Prog. Ser. 532, 269–281. doi: 10.3354/meps11366
Zerbini, A. N., Friday, N. A., Palacios, D. M., Waite, J. M., Ressler, P. H., Rone, B. K., et al. (2016). Baleen whale abundance and distribution in relation to environmental variables and prey density in the Eastern Bering Sea. Deep Sea Res. Part II Top. Stud. Oceanogr. 134, 312–330. doi: 10.1016/j.dsr2.2015.11.002
Keywords: vessel traffic, Automatic Identification System, spatial management, marine conservation, Aleutian Islands, Bering Sea, North Pacific Great Circle Route, Areas To Be Avoided
Citation: Sullender BK, Kapsar K, Poe A and Robards M (2021) Spatial Management Measures Alter Vessel Behavior in the Aleutian Archipelago. Front. Mar. Sci. 7:579905. doi: 10.3389/fmars.2020.579905
Received: 03 July 2020; Accepted: 10 December 2020;
Published: 08 January 2021.
Edited by:
Lyne Morissette, M – Expertise Marine, CanadaReviewed by:
Marija Sciberras, Heriot-Watt University, United KingdomXinping Yan, Wuhan University of Technology, China
Copyright © 2021 Sullender, Kapsar, Poe and Robards. This is an open-access article distributed under the terms of the Creative Commons Attribution License (CC BY). The use, distribution or reproduction in other forums is permitted, provided the original author(s) and the copyright owner(s) are credited and that the original publication in this journal is cited, in accordance with accepted academic practice. No use, distribution or reproduction is permitted which does not comply with these terms.
*Correspondence: Benjamin K. Sullender, a2lja3N0ZXAuYXBwcm9hY2hlc0BnbWFpbC5jb20=