 Lara S. Garcia-Corral
 Carlos M. Duarte
 Susana Agusti
- 1UWA Oceans Institute and School of Plant Biology, The University of Western Australia, Crawley, WA, Australia
- 2Biodiversity and Conservation Unit, Department of Biology, Geology, Physics and Inorganic Chemistry, King Juan Carlos University, Madrid, Spain
- 3Red Sea Research Center (RSRC), King Abdullah University of Science and Technology (KAUST), Thuwal, Saudi Arabia
Net community production (NCP) is a community level process informing on the balance between production and consumption, determining the role of plankton communities in carbon and nutrient balances fueling the marine food web. An assessment of net and gross community production (NCP, GPP) and community respiration (CR) in 86 surface plankton communities sampled between 15° and 36° South along coastal Western Australia (WA) revealed a prevalence of net autotrophic metabolism (GPP/CR > 1), comprising 81% of the communities sampled. NCP, GPP, and CR decreased with decreasing nutrient and chlorophyll-a concentrations, from estuarine, to coastal and oceanic waters. CR, standardized per unit chlorophyll-a, increased with temperature, with higher activation energies (Ea) than GPP per unit chlorophyll-a (Ea 1.07 ± 0.18 eV and 0.65 ± 0.15 eV, respectively) either across ecosystem types and for coastal and estuary communities alone, indicating plankton CR to increase much faster with warming than GPP. These results characterize surface plankton communities across Western Australia as CO2 sinks, the stronger thermal-dependence of respiration that gross primary production rates suggests that their role may weaken with future warming.
Introduction
Plankton communities play an important role in the carbon cycle affecting the air-sea water exchange of O2–CO2 and fueling marine food webs through their metabolic processes (i.e., gross primary production, respiration, and net production) (Gazeau et al., 2005; Duarte, 2011; Calleja et al., 2013). Net community production (NCP) is a community level process that integrates all of the processes affecting the balance between production and consumption (NCP = Gross Primary Production, GPP – Community Respiration, CR). However, there is a paucity of reports of plankton metabolism in the Indian Ocean and, specifically, in the Australia-Indonesia Coastal Province (AUSW) of the Longhurst Biogeochemical Provinces classification (Longhurst et al., 1995; Longhurst, 2007), including the Western Australian (WA) region (Duarte et al., 2013; Regaudie-de-Gioux and Duarte, 2013). The few published plankton metabolism estimates available refer to the North and North-eastern Australian coastal waters, showing important temporal and spatial variability of the metabolic balance of these coastal subtropical areas (Furnas and Carpenter, 2016; McKinnon et al., 2017). Estimates along WA, are limited to near-shore and estuarine surface waters (Agusti et al., 2018).
The AUSW province is divided into three subregions: (i) the tropical southern coasts of Sumatra and Java, (ii) the subtropical Western coast of Australia from Cape Bougainville (14°N) to Cape Leeuwin (34°S); and iii) from Cape Leeuwin to the Bass Strait along the temperate coast of the Great Australian Bight. These three subregions are ecologically diverse as different atmospheric and oceanic forcing characterize the northern and southern parts of the large province (Longhurst, 2007).
The WA coast has unique oceanographic conditions, with a combination of downwelling processes on a large-scale perspective and, a small-scale seasonal coastal upwelling (Smith et al., 1991). From the tropics, the southward-flowing Leeuwin Current (LC) dominates the coastal area, transporting warm and low salinity waters southward (Smith et al., 1991), with maximum flow during the austral autumn and winter (Koslow et al., 2008; Lourey et al., 2013; Pearce and Feng, 2013) when the equatorward winds are weak (Godfrey and Ridgway, 1985). Although, other currents characterize this region such as the Ningaloo Current (NC) that flows northward near-shore (Taylor and Pearce, 1999) and the inshore Capes Current (CC) in the southwest which flows seasonally northward during the summer months. South of about 32°S, the equatorward flow of cool, high-salinity water of the subtropical gyre is the West Australian Current (Pearce and Pattiaratchi, 1999).
Coastal areas have been described as the most productive zones of the global ocean, responsible for about 14–33% of total oceanic production (Gattuso et al., 1998). However, the ordinary upwelling processes of cold, nutrient-rich waters in the eastern boundary currents of the South Pacific and South Atlantic with high primary production rates (Longhurst et al., 1995), do not occur off the WA coast, where the warm, nutrient-poor Leeuwin Current suppresses upwelling processes. Therefore, WA oligotrophic waters are expected to support lower pelagic productivity compare to the major eastern boundaries currents (Koslow et al., 2008), but higher production compared to more oligotrophic areas, such as the Mediterranean Sea or the Subtropical Gyres of the ocean (Duarte et al., 2013).
Here we assess plankton metabolic rates from estuarine, inshore and offshore surface waters in the WA coast, and assess the relationship with temperature and nutrient concentrations, and plankton community structure and biomass to elucidate patterns in plankton metabolic rates and metabolic balance.
Materials and Methods
Study Site and Sampling
A total of 86 surface (0.5–3 m) stations were sampled in six areas along the Western Australian Coast in the southeaster Indian Ocean (Figure 1), including coastal, estuarine and open ocean waters. These waters were sampled between 15° and 36° South and 107° and 122° East, all within the Australia–Indonesia Coastal Province (AUSW) (Longhurst et al., 1995; Longhurst, 2007).
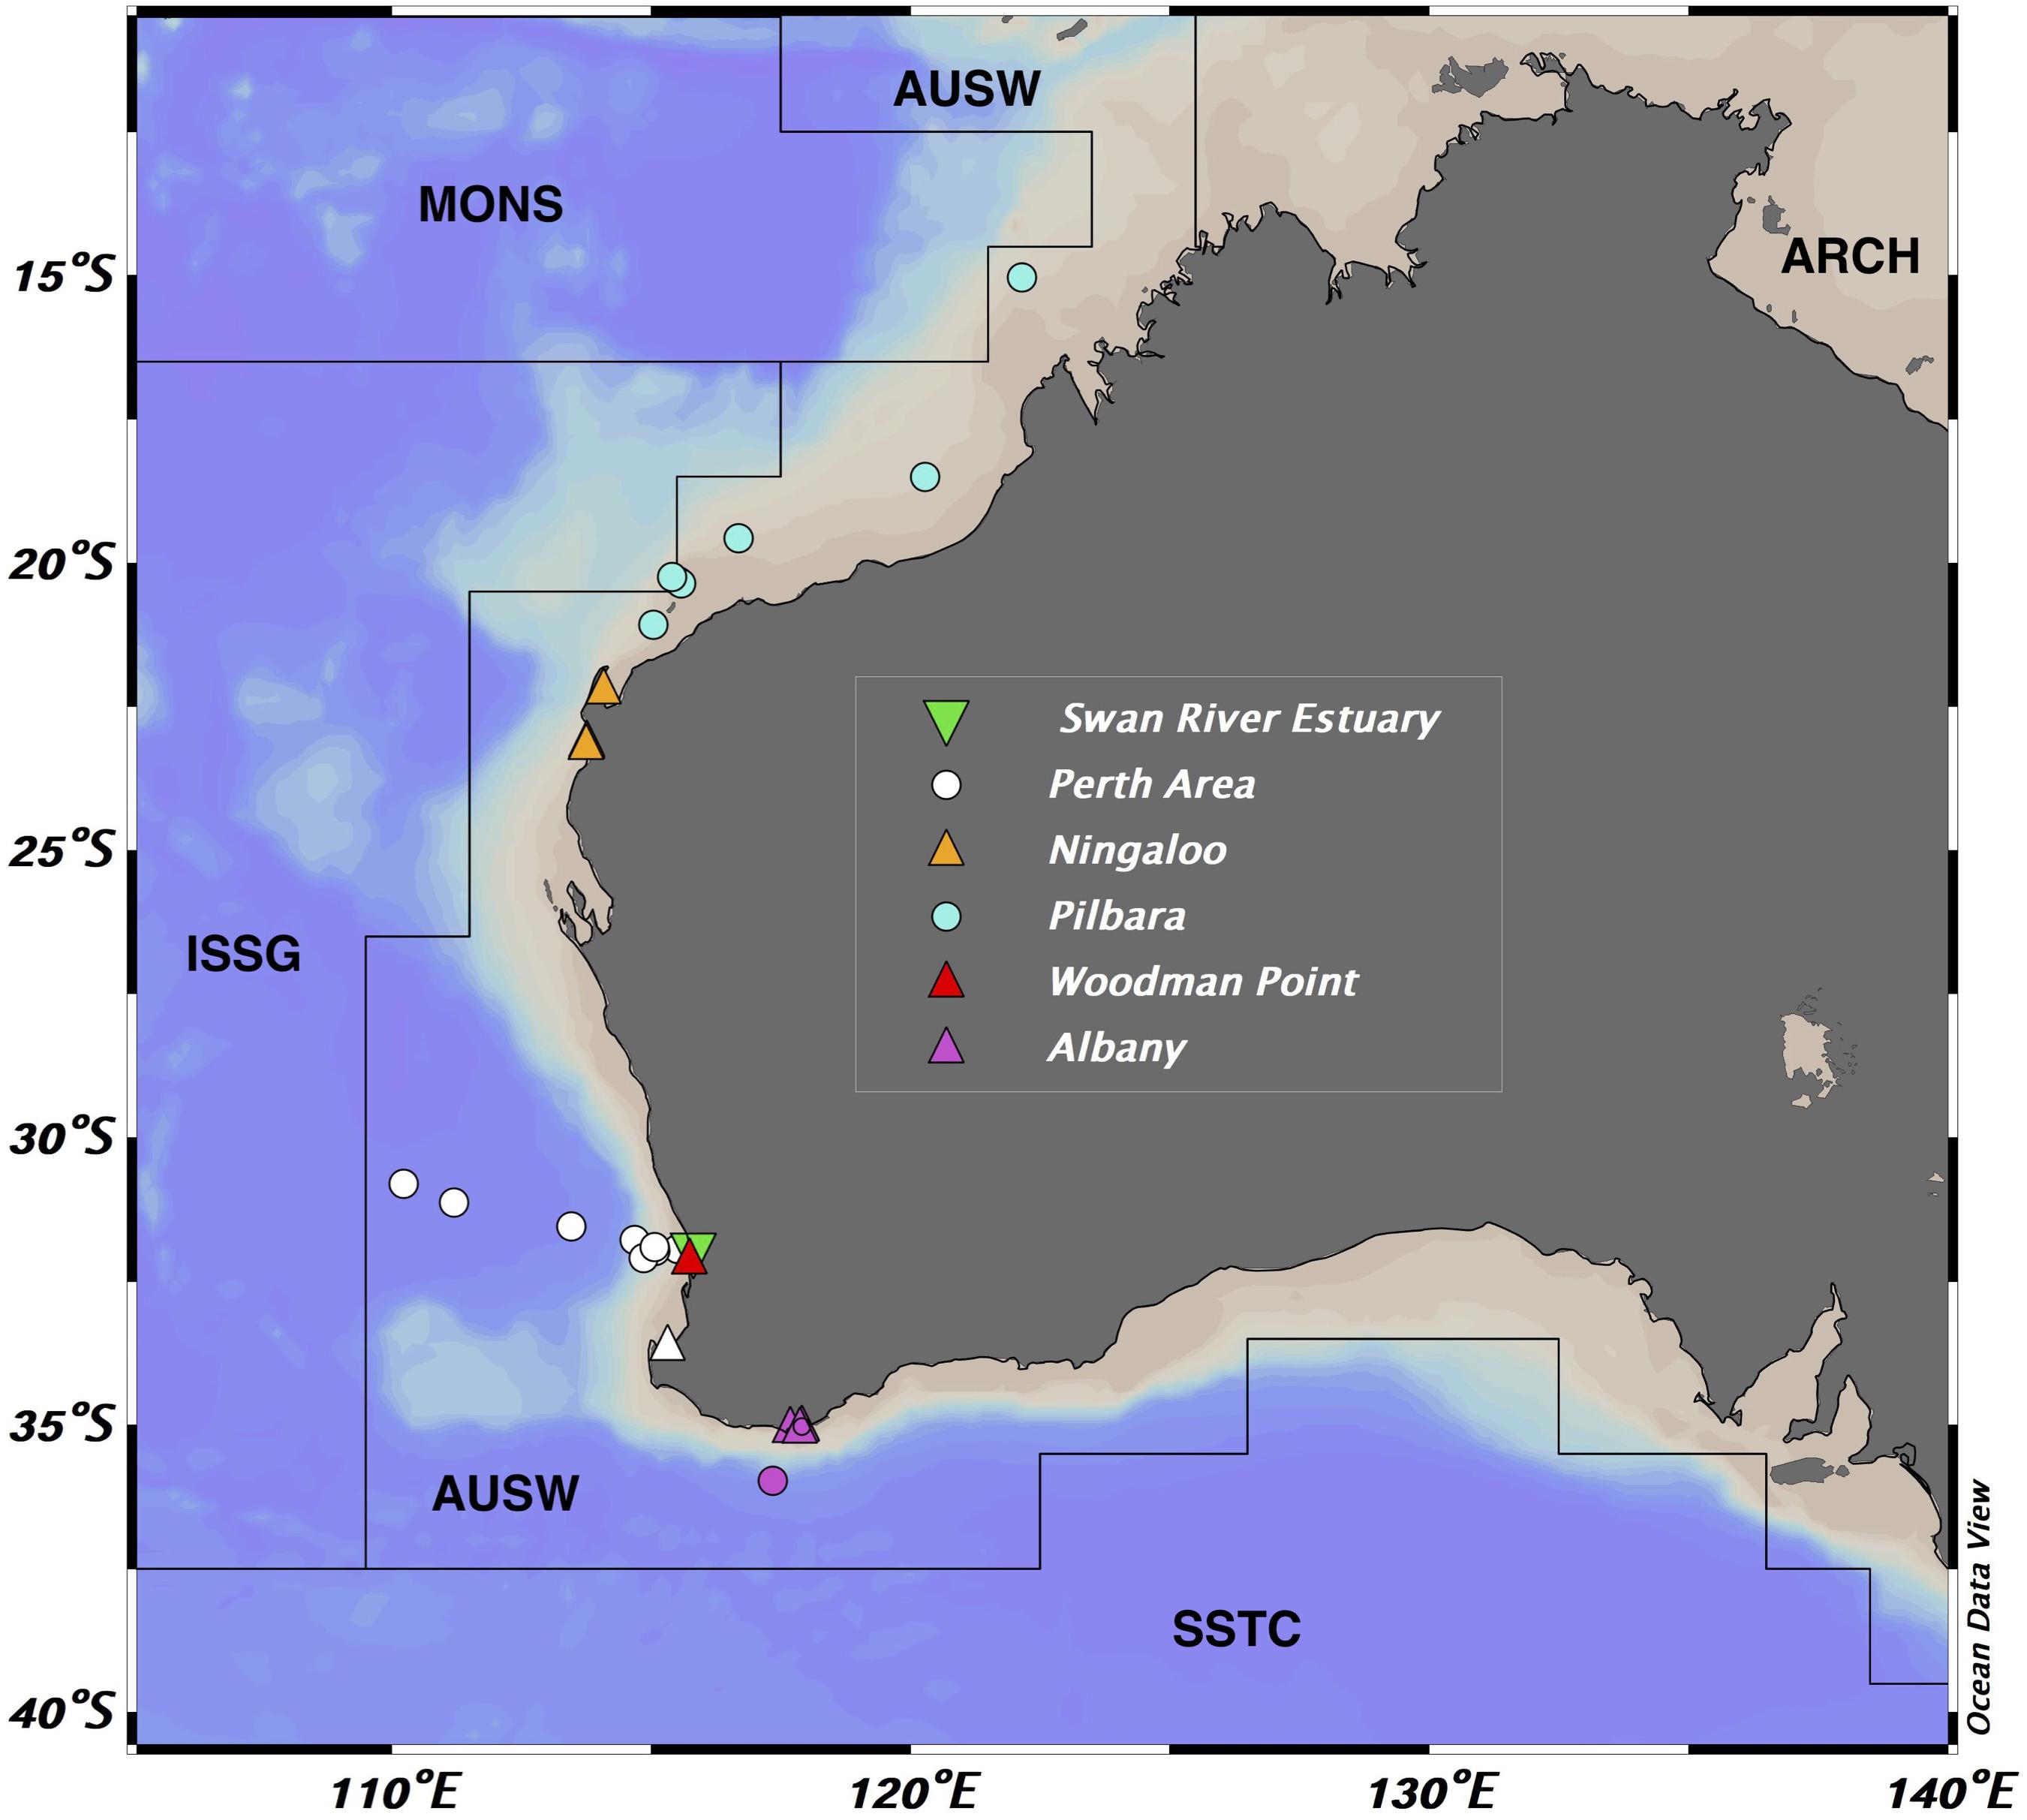
Figure 1. Location of the sampled areas within the Australia-Indonesia Coastal Province (AUSW) of the Indian Ocean. Symbols represent: circles, open ocean stations; triangles, the coastal locations and the inverted triangles, the estuary waters. Longhurst Biogeochemical Provinces: SSTC (South subtropical convergence), AUSW (Western Australian and Indonesian coast), ISSG (Indian South subtropical gyre), MONS (Indian monsoon gyre), and ARCH (Archipelagic deep basins).
Most of the coastal stations (70) were near-shore areas and were reached from land sampling 10 L of surface waters (0.5–3 m) at Ningaloo Reef (five stations), Woodman Point (27 stations), Albany (four stations), Rottnest Island (1), and Busselton (1). The same sampling methodology was used in the Swan River Estuary (32 stations). The temperature (°C), dissolved oxygen (% sat), conductivity (μS/cm), and pH were measured through the water column with a YSI EXO1 Multi-parameter Water Quality Sonde for all the samples collected from land. The remaining 16 stations were sampled in research cruises conducted on board three research vessels: the Pilbara region (seven stations) sampled on board the RV/Solander (AIMS), the Perth region (three stations), and Albany (one station) on board RV/Hespérides during the Malaspina Expedition Circumnavigation (Duarte, 2015), and an additional five stations along the Perth Canyon area on board the RV/Falkor (Schmidt Ocean Institute). These stations were sampled also at the surface (0.5–3 m) with a rosette sampler (equipped with 24 or 18 12 L-Niskin bottles), fitted with a Conductivity–Temperature–Depth (CTD) instrument (SeabirdSBE9).
Plankton Community Metabolism
Surface water samples were collected and carefully siphoned into a total of 19 bottles including: a set of seven borosilicate glass Winkler bottles that were fixed immediately to determine the initial oxygen concentration; seven black borosilicate glass Winkler bottles for the measurement of respiration in the dark, and five transparent quartz bottles for the measurement of net community production in the light. Quartz bottles were used for light incubations because it allows the full solar radiation spectra to penetrate through, while borosilicate glass Winkler bottles remove much of the solar UV spectra, which can bias surface net community production estimates (Regaudie-de-Gioux et al., 2014; García-Corral et al., 2017a, 2020). Light quartz and dark glass bottles were incubated during 24 h in tanks equipped with a cooling and heating systems to mimic the in situ water temperature and natural solar light radiation conditions or at the in situ sampled place. After the 24 h incubation period, plankton metabolic rates were evaluated from changes in dissolved oxygen concentrations (Carpenter, 1965), determined by automated high-precision Winkler titration with a potentiometric end-point titrando (Oudot et al., 1988). NCP rates were determined from the oxygen change in the clear bottles ([O2] final light bottles – [O2] initial bottles), CR rates were determined from the oxygen change in the dark bottles ([O2] initial bottles – [O2] final dark bottles) and GPP rates were calculated as the sum of CR and NCP. All rates are expressed as mmol O2 m3 d–1.
Heterotrophic Prokaryotes and Picophytoplankton Abundances
Heterotrophic prokaryotes abundance (i.e., cell density) was measured through flow cytometry technique (Gasol and del Giorgio, 2000). Water samples were fixed with 1% of paraformaldehyde and 0.05% glutaraldehyde (final concentration); frozen in liquid nitrogen for 10 s and store at −80°C until analysis. All samples except the ones from the open ocean stations, were stained with a solution of SYTO 13 (50 μM final concentration) and analyzed with a BD FACSCanto II flow cytometer at the Centre for Microscopy, Characterisation and Analysis (Queen Elizabeth II Medical Centre) at The University of Western Australia (UWA, Perth). The open ocean samples from the Malaspina Expedition were stained with SYBR Green I and analyzed using a FACSCalibur Becton Dickinson cytometer on board the RV/Hespérides. Picophytoplankton abundance of Prochlorococcus, Synechococcus and eukaryotic picoautotrophs were also determined by flow cytometry as described in Agusti et al. (2019). Counting of cells per ml–1 was done with the FlowJo 9.7.6 software.
Chlorophyll-a and Inorganic Nutrient Determinations
Surface water collected in each station (between 1 L and 100 mL) was filtered through Whatman grade GF/F glass microfiber filters of 25 mm diameter (nominal pore size of 0.7 μm). Filters were frozen at −20°C and introduced in acetone 90% and left for 24 h in a refrigerator, in the dark. After that period, chlorophyll-a (Chl-a) fluorescence was measured by the use of a fluorimeter calibrated with a Chl-a standard (Sigma-Aldrich) and equipped with a module of Chlorophyll-a Non-Acidification Fluorescent Module (CHL-A NA).
Dissolved inorganic nutrients samples (nitrate and phosphate) were frozen upon sampling until laboratory analyses. All samples were analyzed in a segmented-flow Skalar autoanalyzer following standard procedures (Grasshoff et al., 2009).
Data Analysis and Statistics
All data were recorded in Microsoft Excel and analyzed by the statistical package program JMP version 9.0.1. A Shapiro–Wilk test was conducted to assess the normal distribution in each set of data; in all cases, the p-value was found to be less than 0.05. Non-parametric test Kruskal–Wallis was performed to test significant differences between ecosystems. A linear regression model type II and second order polynomial (quadratic) regression was fitted to evaluate the relationships between dependent and independent variables. We used a forward stepwise multiple-regression analysis with the minimum Akaike information criterion (Hastie and Tibshirani, 1993) to assess the relative influence of environmental factors on the metabolic rates (GPP, CR, and GPP/CR). The software Ocean Data View version 4.6.3 (Schlitzer, 2013) was used to create the map of the sampled areas (Figure 1) and GraphPad Prism software for Figures 2–8.
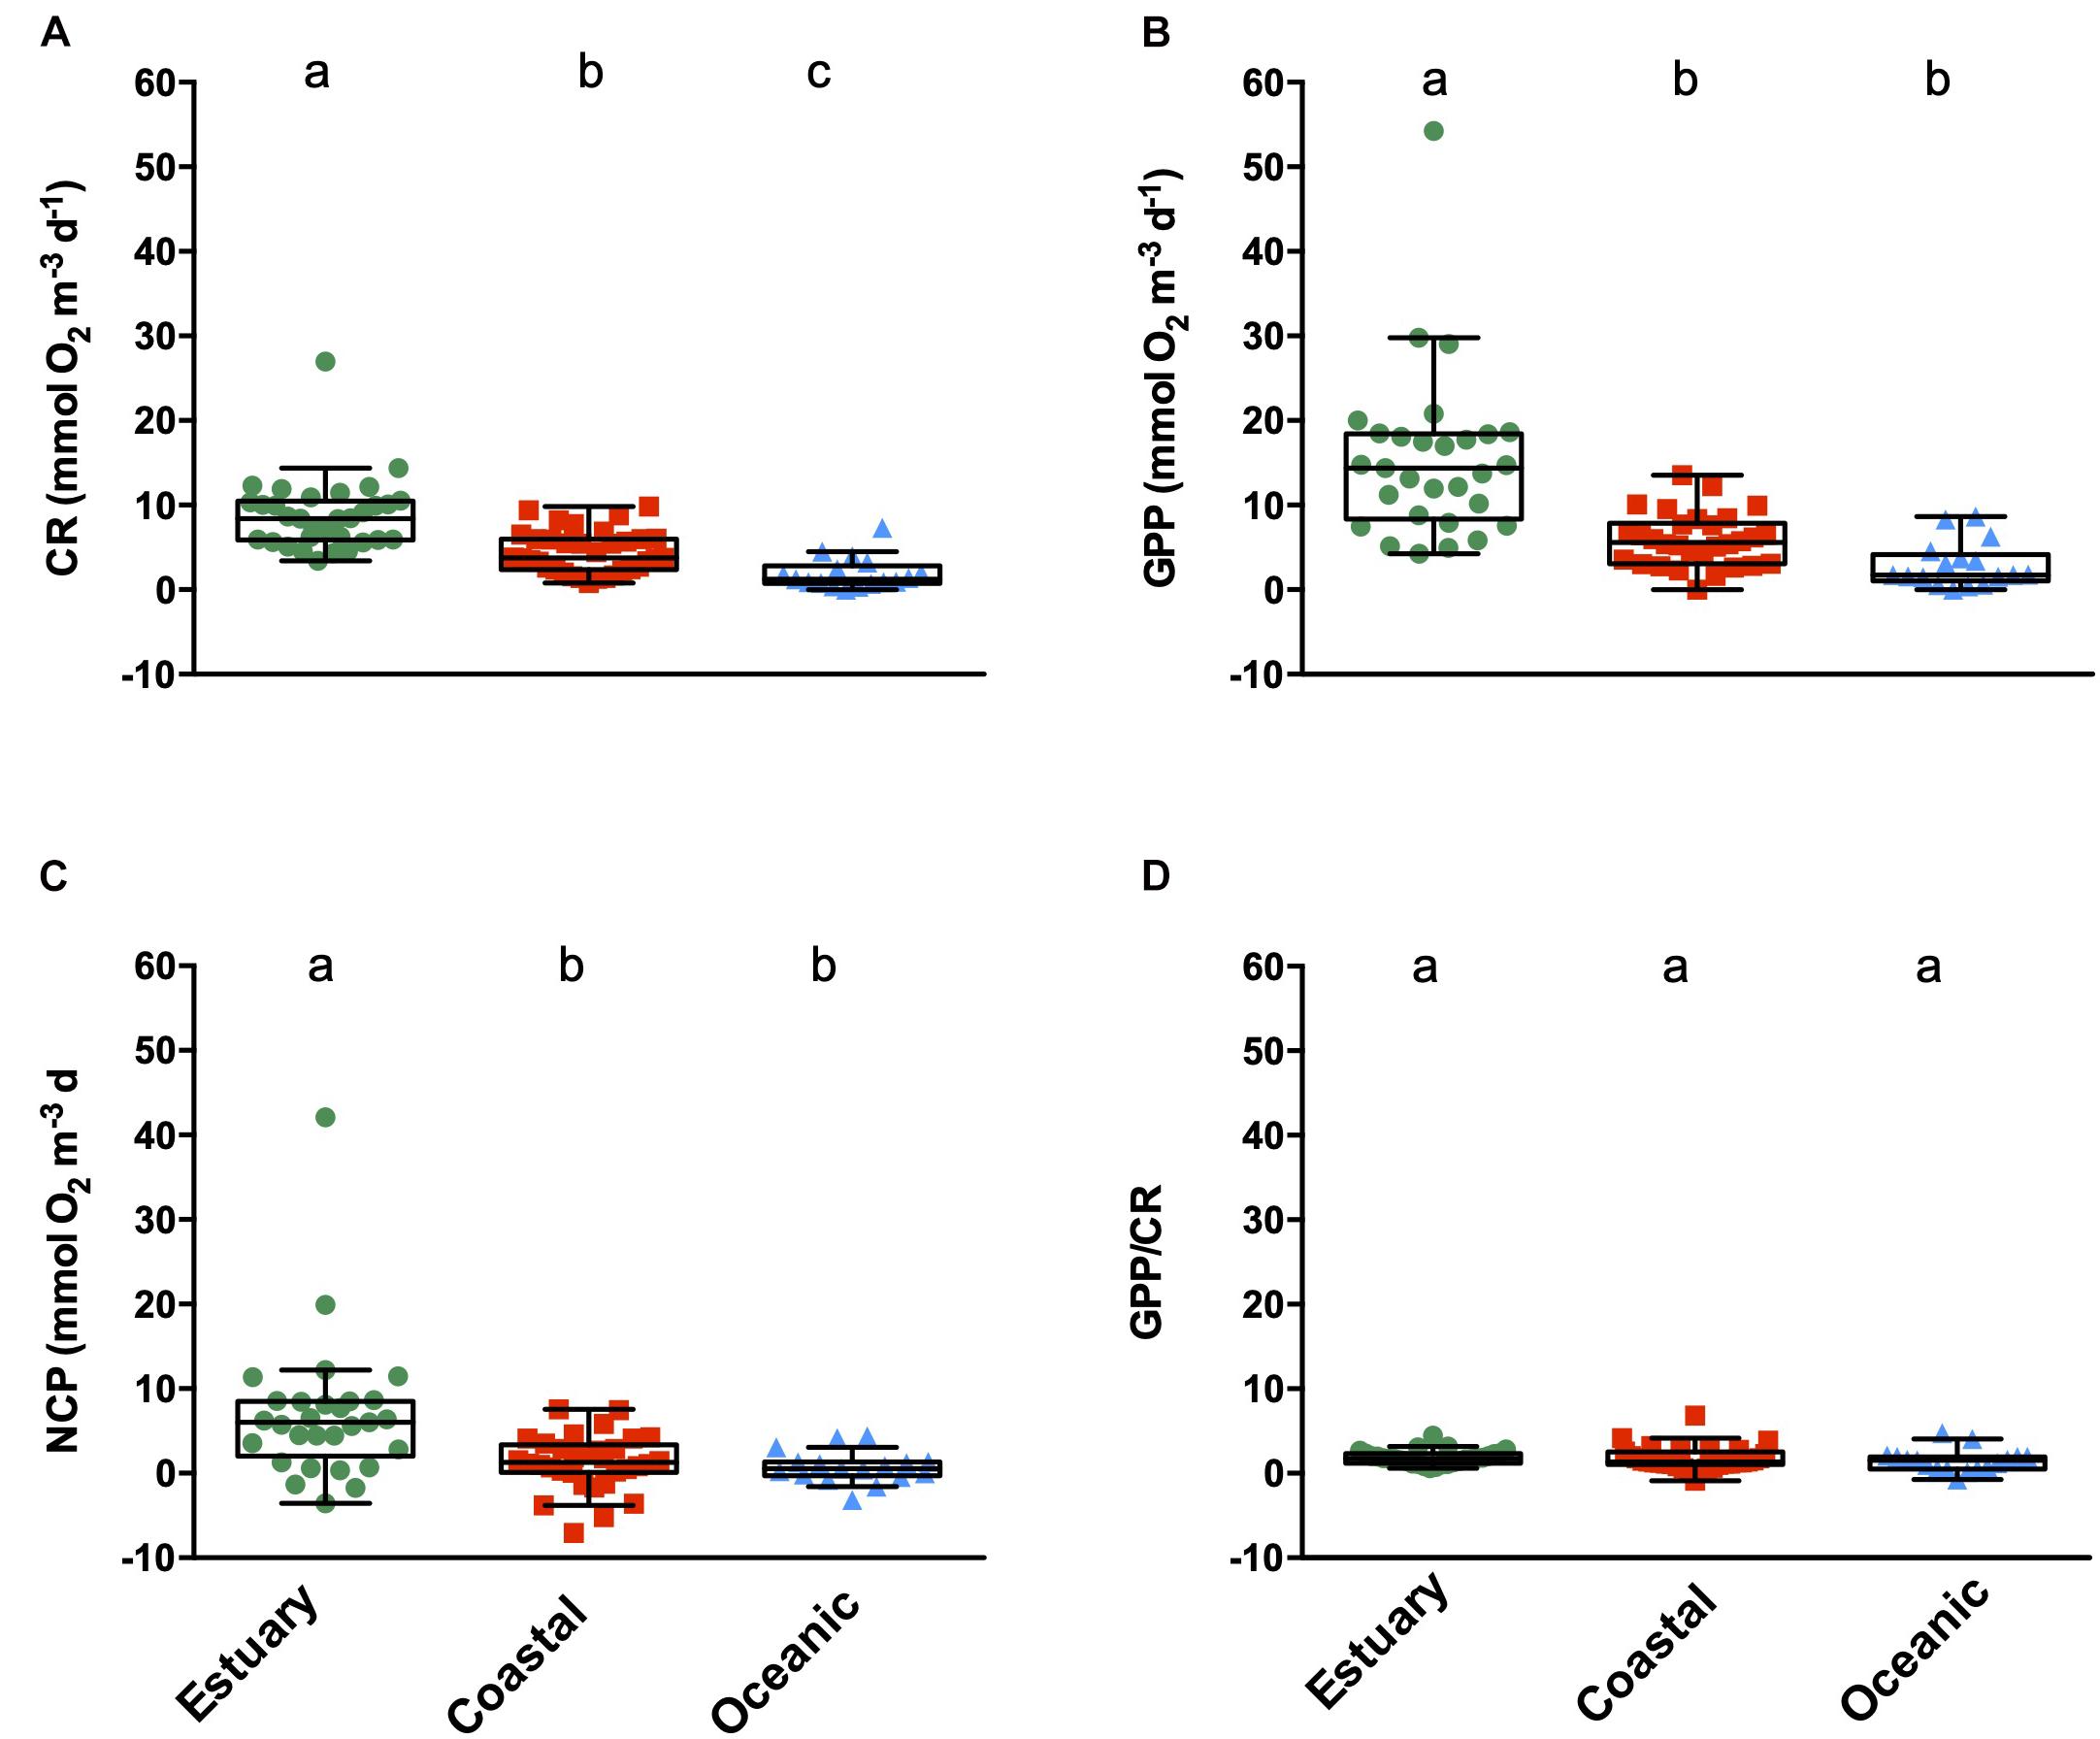
Figure 2. Metabolic rates [CR (A), GPP (B), NCP (C), and GPP/CR ratio (D), mmol O2 m–3 d–1] from the surface plankton communities of the sampled ecosystems in the Western Australia waters. The boxes show a central line that represents the median and the lower and upper edges represent the 25th and 75th percentiles, respectively. Whiskers indicate 1.5 times the Interquartile Range (IQR). Lower case letters indicate the Tukey HSD test, where ecosystems not connected by the same letter are significantly different.
Results
Temperature showed a range of variation between 12 and 29°C, with the warmest temperatures in open-ocean waters of the Northern area of the Pilbara, and the lowest at the Swan Estuary (Table 1 and Figure 1). Salinity varied differently between marine sites, from 31.6 to 37.1 in coastal samples and from 34.5 to 36.5 in open ocean waters. Indeed, the Swan Estuary salinity varied widely (22–37), with minimum salinity reached at the time of maximum river discharge in late winter and spring. The estuarine waters also showed the highest nutrient (nitrate-NO3 and phosphate-PO4) concentrations followed by coastal and open ocean waters (Table 1). Chlorophyll-a concentrations followed the same pattern as nutrient concentrations, decreasing from estuarine waters to coastal areas and open ocean waters (Table 1).
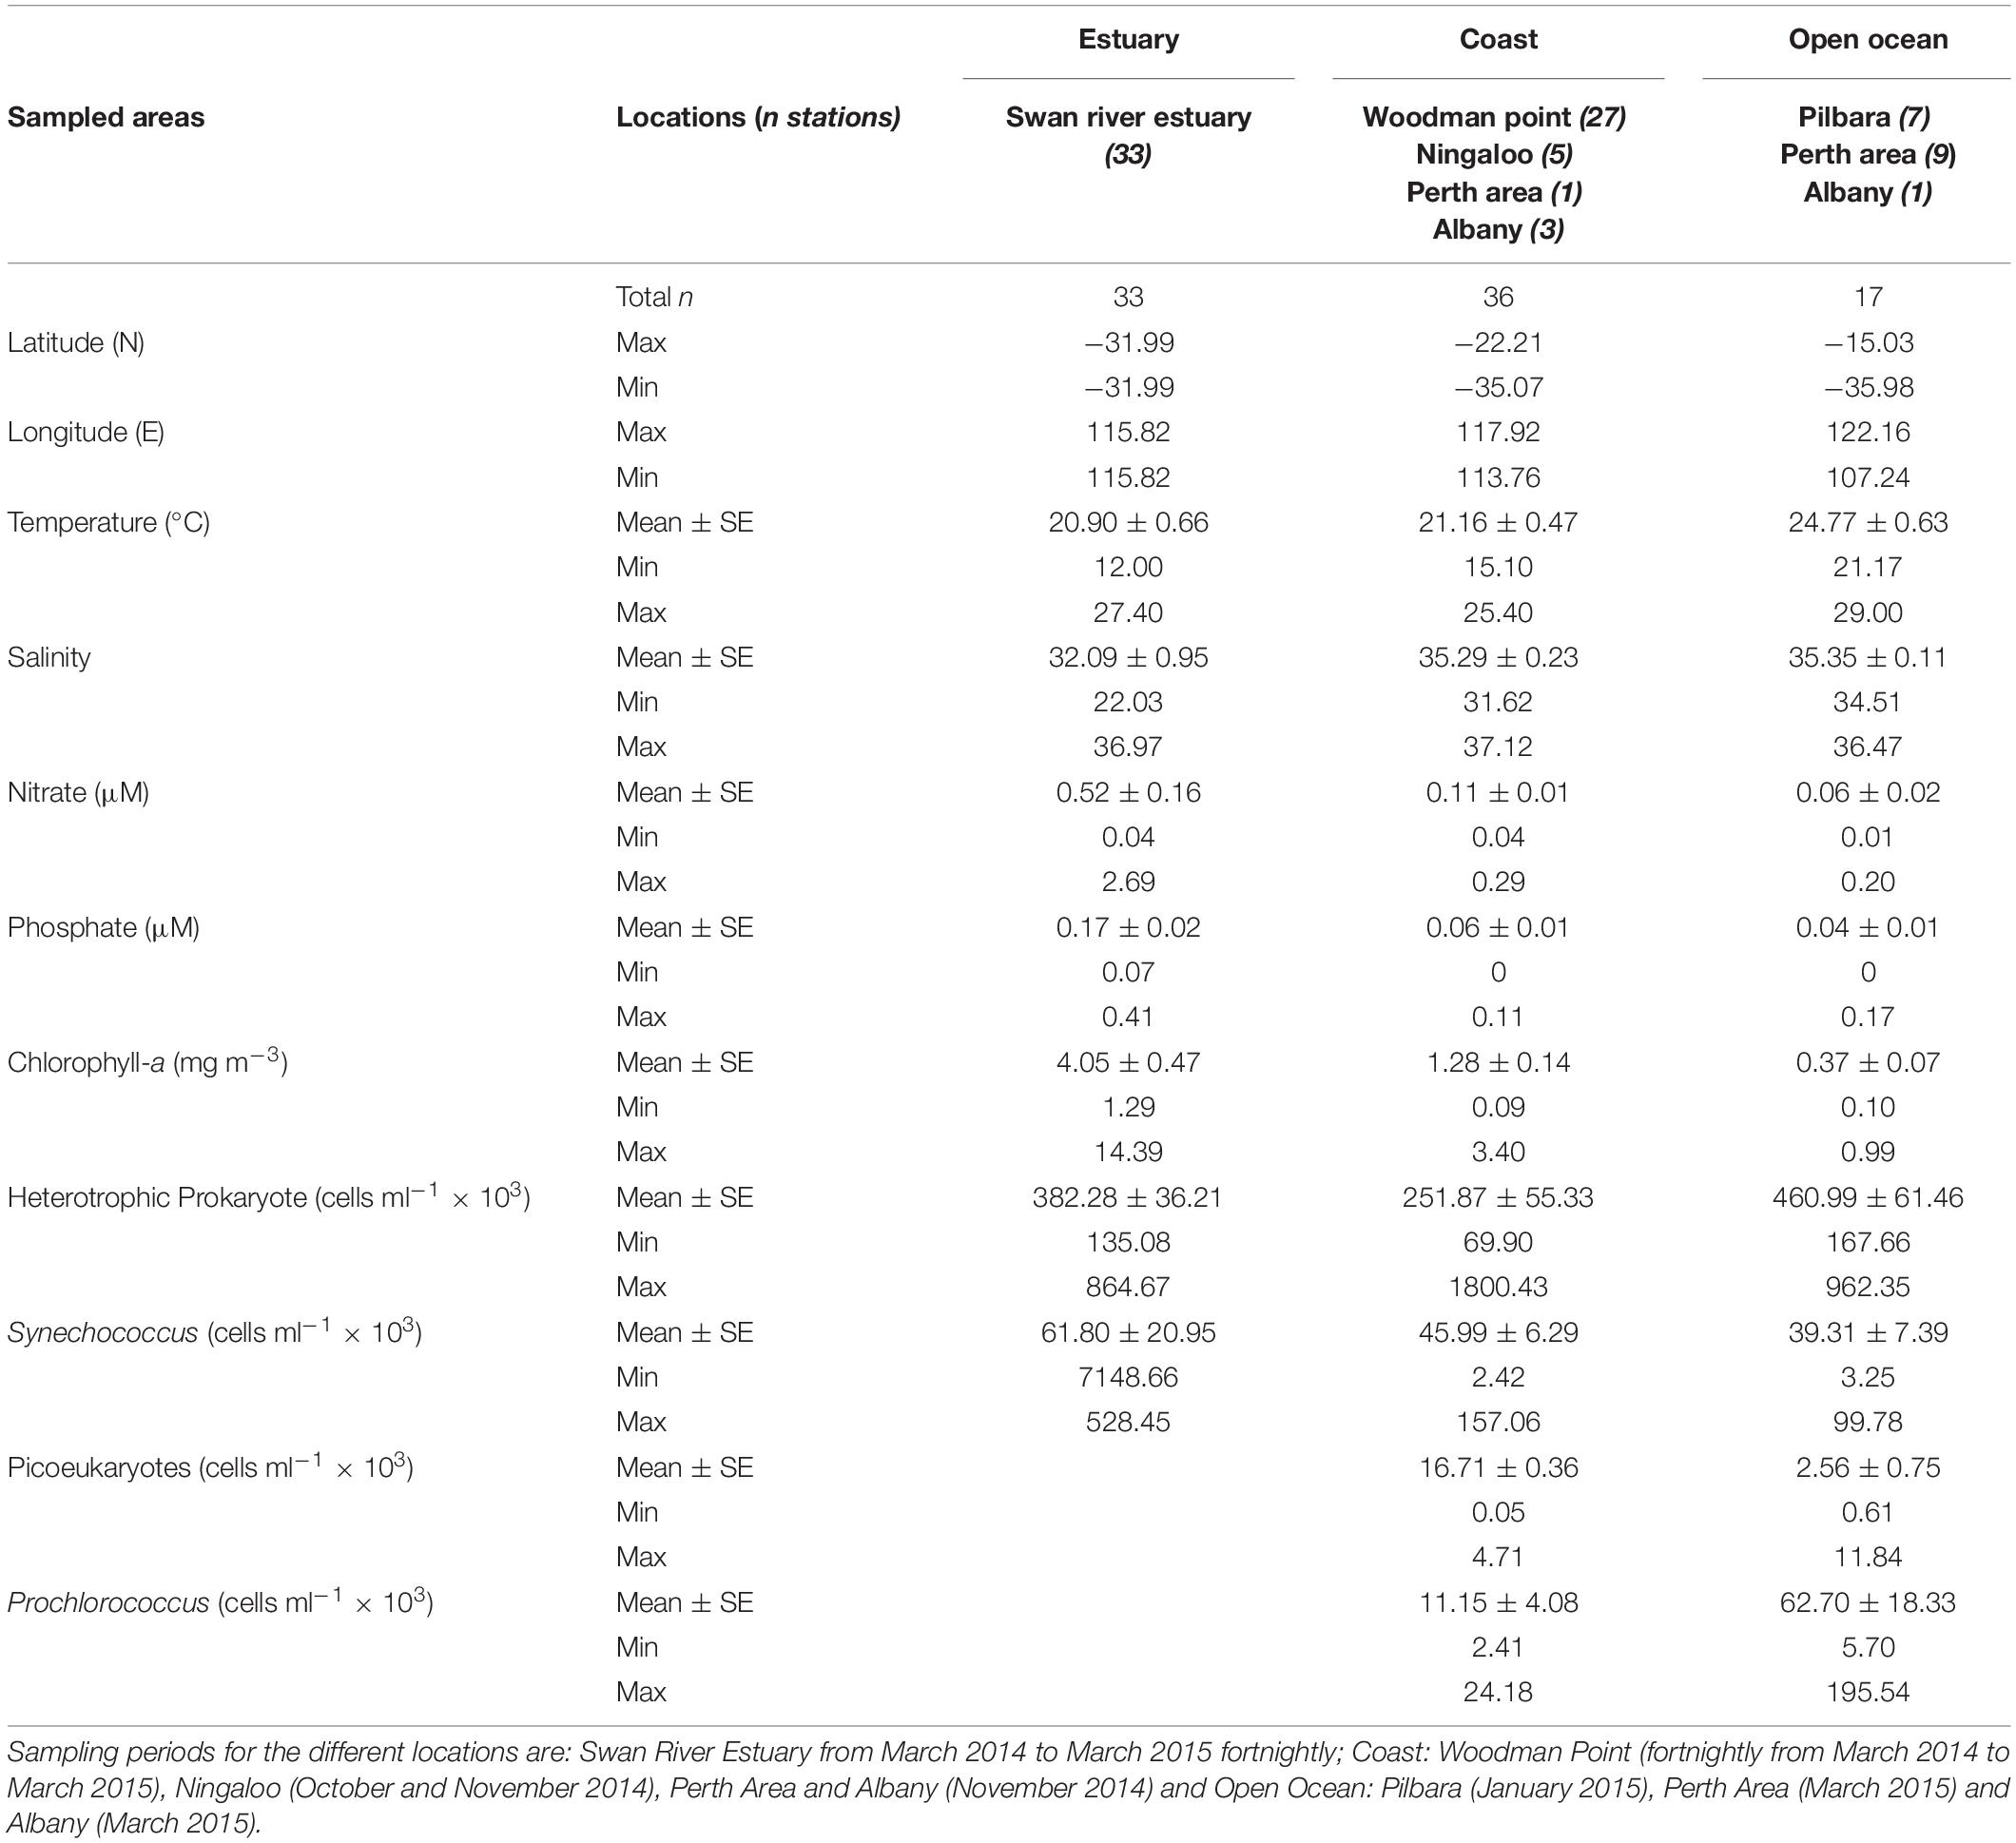
Table 1. Biotic and abiotic environmental variables for the sampled Western Australian waters.
The picophytoplankton community composition also varied between areas, with a lack of Prochlorococcus and picoeukaryotes populations at the Swan Estuary. Indeed, Synechococcus was the dominant picophytoplankton population across all regions (mean range from 39.31 × 10³ to 61.80 × 10³ cells ml–1). Heterotrophic prokaryote abundance varied widely, with mean values ranging from 252 × 103 ml–1 at the coastal waters to 461 × 103 ml–1 at the open ocean (Table 1).
Plankton metabolic rates at the surface waters of WA also varied across ecosystem types. Overall, surface plankton communities in estuarine waters showed significantly higher metabolic rates compared to those of coastal and open ocean areas (Figures 2A–C). CR ranged from 0.36 to 26.97 mmol O2 m–3 d–1, following a significant decrease from estuarine (mean ± SE 8.81 ± 0.76 mmol O2 m–3 d–1), to the coastal (mean ± SE 4.44 ± 0.42 mmol O2 m–3 d–1), and the open ocean waters (mean ± SE 1.93 ± 0.46 mmol O2 m–3 d–1) (Figure 2A). GPP followed the same pattern as CR, with the highest GPP registered in the estuarine waters (mean ± SE 15.44 ± 1.83 mmol O2 m–3 d–1), followed by coastal waters (5.77 ± 0.55 mmol O2 m–3 d–1), and the lowest GPP measured in the open ocean (2.68 ± 0.66 mmol O2 m–3 d–1) (Figure 2B). Net community production ranged between −7.06 ± 1.77 and 42.10 ± 0.27 mmol O2 m–3 d–1, showing mean autotrophic values (NCP > 0) across ecosystem types (mean ± SE: 6.88 ± 1.55 mmol O2 m–3 d–1 estuary > 1.27 ± 0.58 coastal > 0.73 ± 0.46 open ocean). Negative NCP rates were uncommon and represented 10% of estuarine, 22% of coastal, and 29% of open ocean communities. GPP/CR ratios showed no significant differences among ecosystems, all of which had mean GPP/CR ratios > 1 (mean ± SE: 1.85 ± 0.15 estuarine; 1.75 ± 0.25 coastal; 1.50 ± 0.32 open ocean communities) (Figure 2D). When standardizing metabolic rates by Chlorophyll-a concentration, these trends changes as different carbon efficiencies can be found for the diverse taxonomic groups and nutrient bioavailability (Marañón et al., 2001, 2007, 2013). The experimental standard errors (SE) of O2 determinations among replicate bottles varied between 0.06 and 1.37 mmol O2 m–3 d–1, with a mean of 0.25 mmol O2 m–3 d–1. These errors represent a mean of 0.11% of the total value of the measurements. The estuarine replicates showed higher mean error (0.46 mmol O2 m–3 d–1), than coastal (0.37 mmol O2 m–3 d–1), and open ocean replicates (0.16 mmol O2 m–3 d–1).
The multiple-regression analysis (Table 2) shows that Chlorophyll-a (Chl-a) was the main factor explaining the metabolic rates (GPP, CR, and the GPP/CR ratio) in the WA studied region. Thus, GPP was positively correlated with Chl-a and temperature (the correlation is negative but it is the inverse of temperature) (Table 2). Accordingly, CR followed the same trend as GPP with Chl-a and temperature, but also was positively correlated with phosphate concentration and heterotrophic prokaryote abundance (Table 2). In addition, Chl-a, phosphate concentration and heterotrophic prokaryote abundance were the explanatory variables that appeared to control the GPP/CR ratio (Table 2).
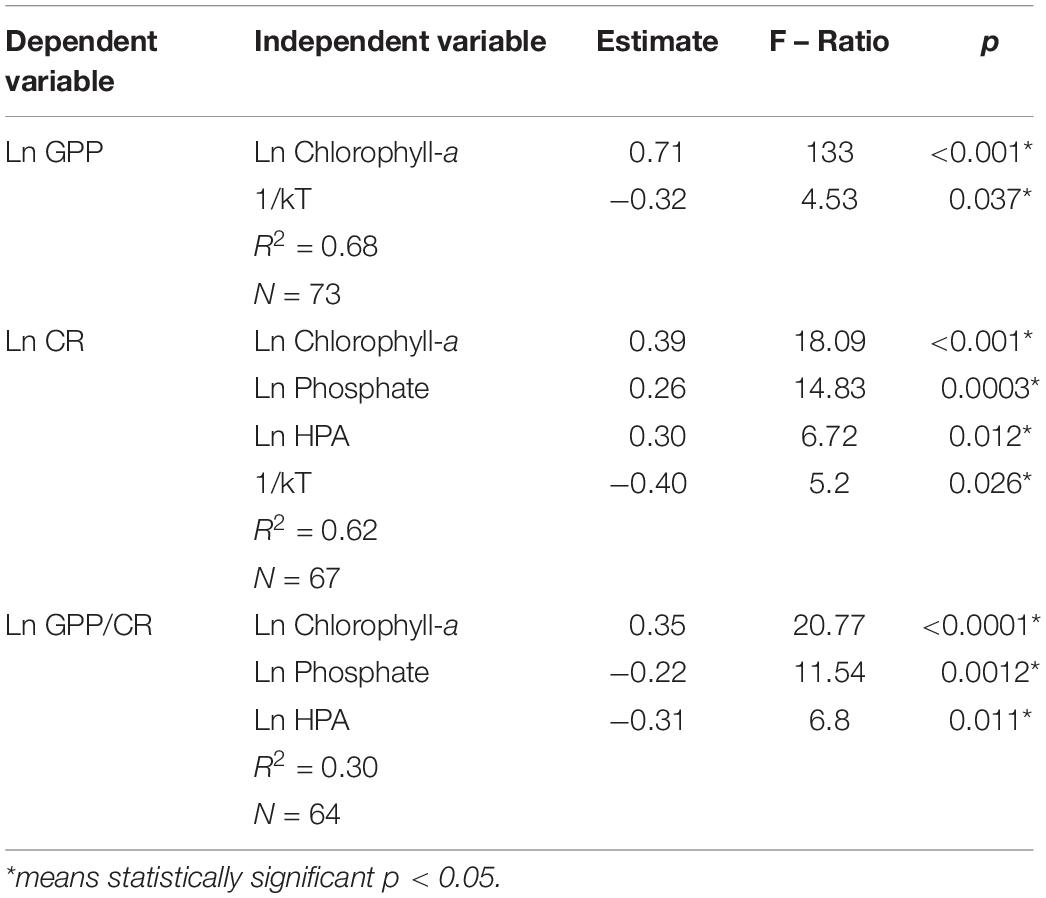
Table 2. Forward stepwise multiple-regression analyses with the minimum Akaike information criterion (Hastie and Tibshirani, 1993) to assess the relative influence of environmental factors on the metabolic rates (GPP, CR, and GPP/CR).
There was an overall strong positive linear relationship between CR and GPP (R2 = 0.61, p < 0.0001, n = 75), with a ln-ln slope of 0.73 ± 0.07, significantly lower than 1 (Figure 3). Communities in each ecosystem type showed positive ln-ln relationship between CR and GPP, with no significant difference (Kruskal–Wallis test, p > 0.05), in slope for open ocean (0.66 ± 0.18), coastal (0.49 ± 0.22), and estuarine communities (0.47 ± 0.11, Figure 3). However, despite the significant regression in coastal ecosystems, the predictive capacity of the relationship was lower (R2 = 0.14) than that for open ocean (R2 = 0.41) and estuarine communities (R2 = 0.50; Figure 3).
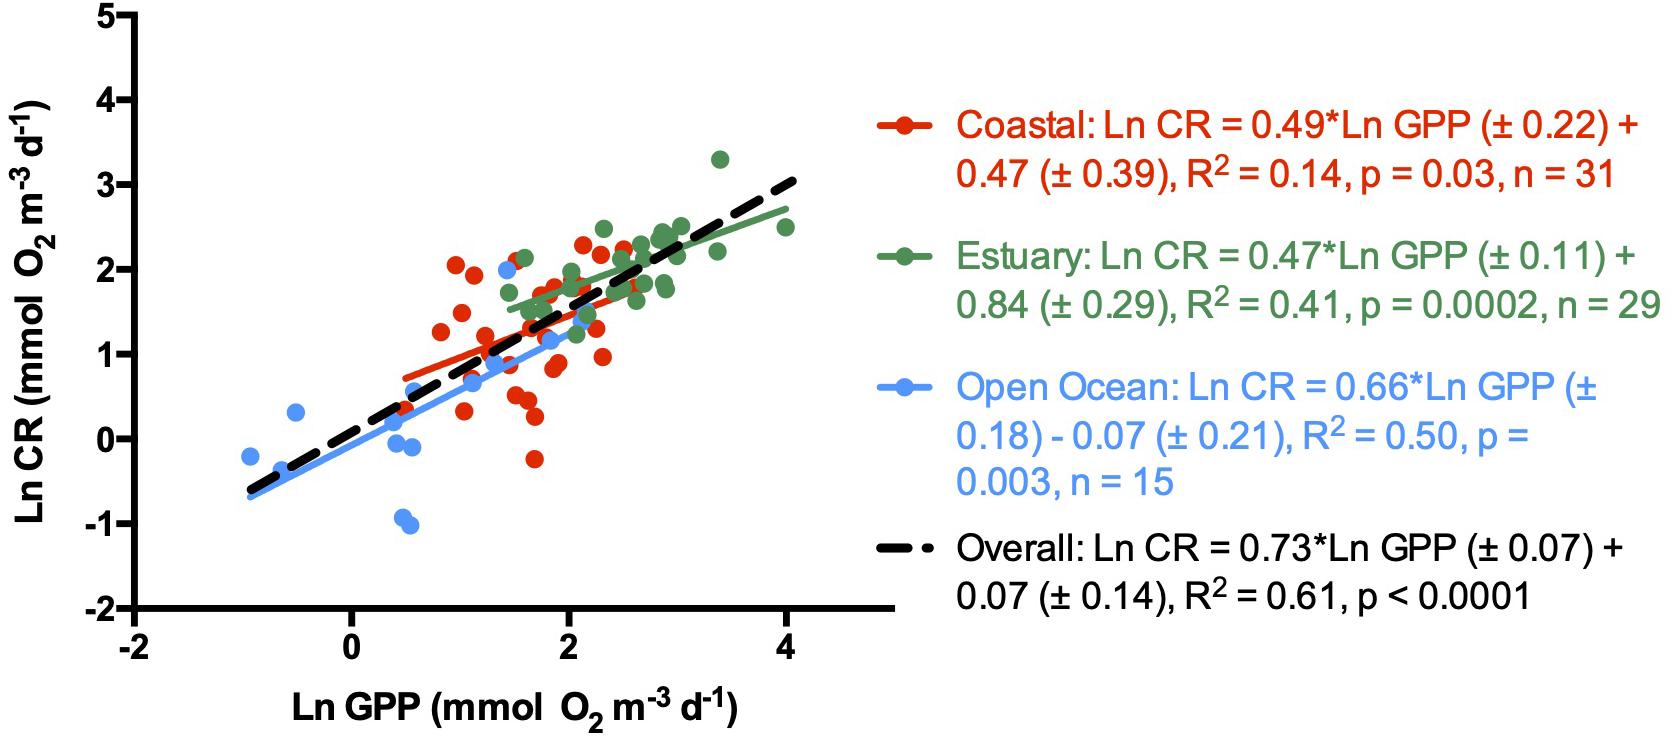
Figure 3. Natural logarithm of CR vs. natural logarithm of GPP for all sampled regions and for each ecosystem. Symbols colors are: Green dots and line (estuary waters), red dots and line (coastal waters), blue dots and line (open ocean waters), black dashed line (entire dataset). The lines shows the linear regression Type I in all cases.
Chlorophyll-a showed an increasing gradient from low concentrations at the open ocean communities, trough medium values at the coastal areas and the highest concentrations measured in the estuary waters (Figures 4A,B,D).
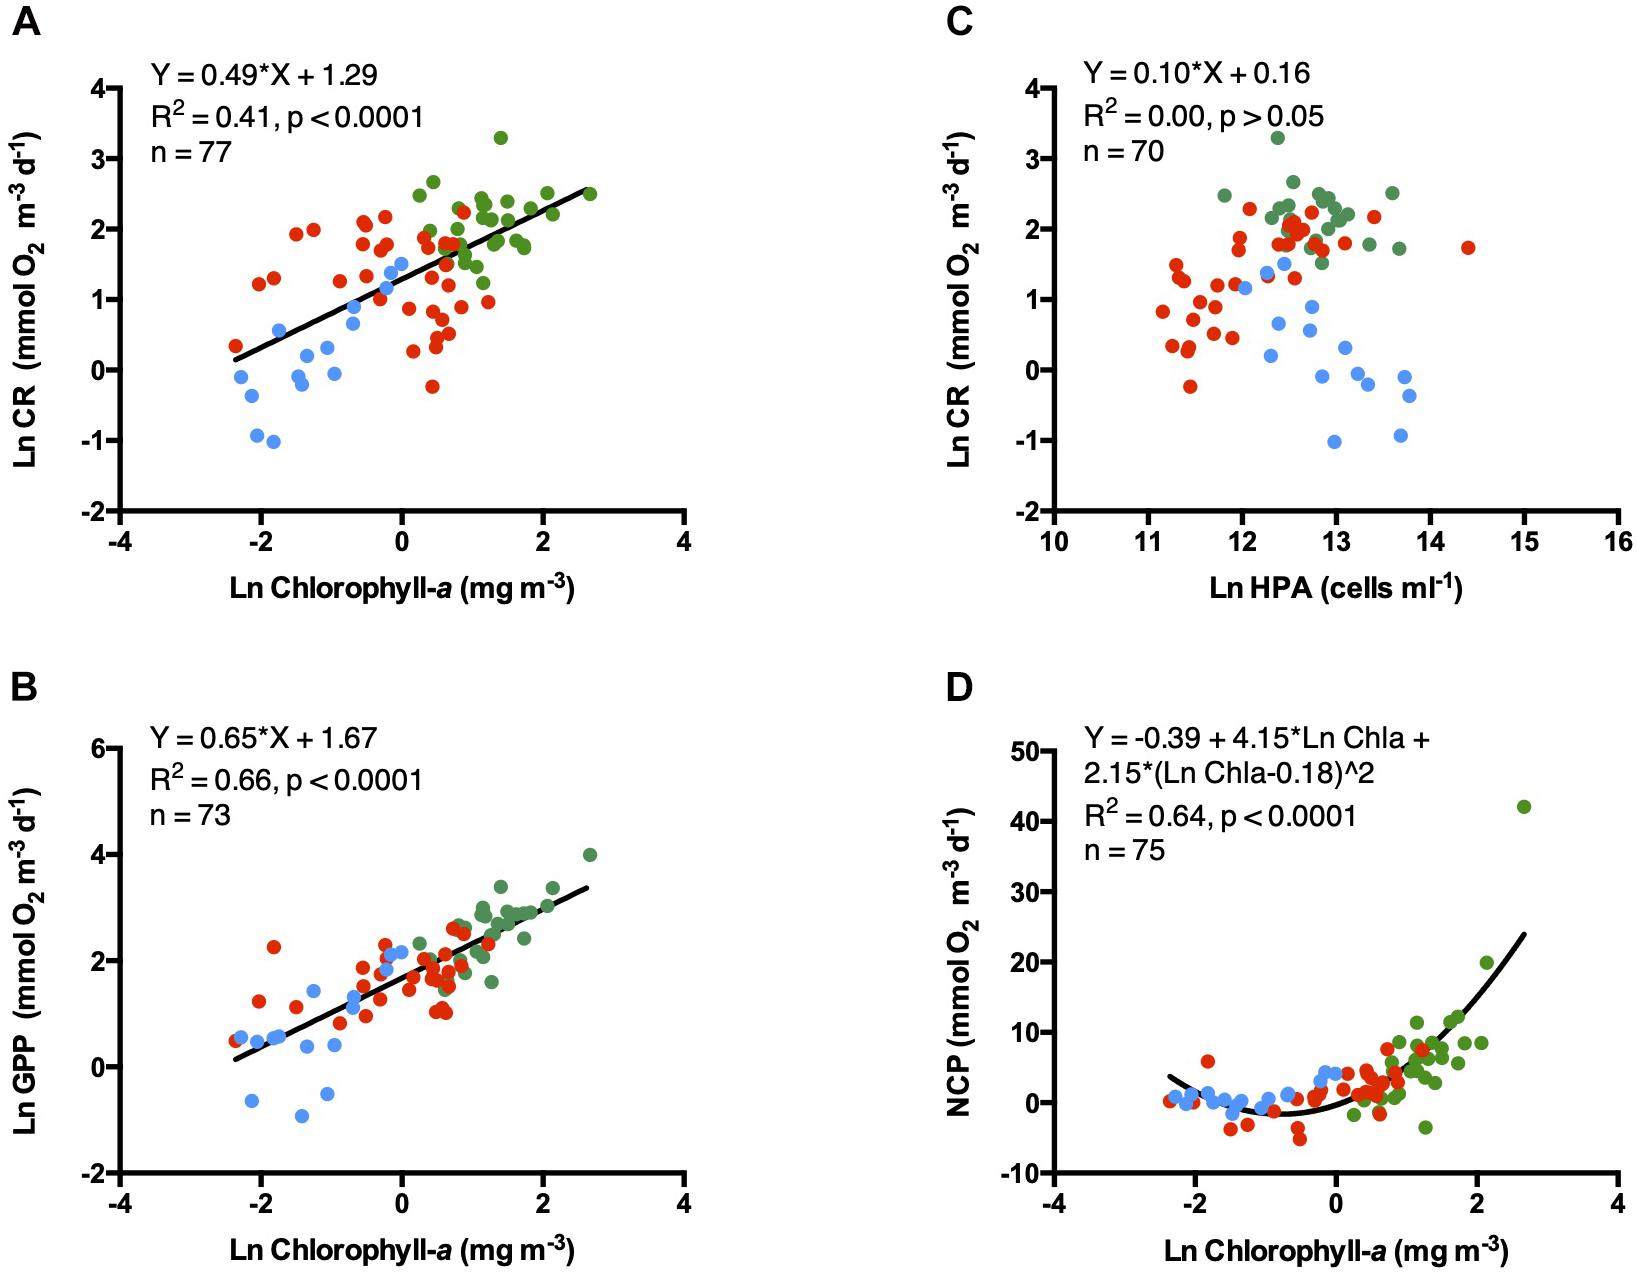
Figure 4. Linear relationships between the transformed natural logarithm of (A) CR and (B) GPP vs. natural logarithm of Chlorophyll-a concentrations; (C) Natural logarithm of CR vs. natural logarithm of heterotrophic prokaryote abundances and (D) NCP vs. natural logarithm of Chlorophyll-a concentrations. Symbols colors are: Green dots (estuary waters), red dots (coastal waters), and blue dots (open ocean waters). The solid line shows the fitted linear regression Type I.
Metabolic rates increased linearly with Chl-a concentrations, explaining ∼ 41% of the variance in CR and ∼ 66% of that in GPP (Figures 4A,B). NCP increase exponentially with Chl-a and explain about ∼ 64% of NCP variability (Figure 5D). However, no relationship was found between CR and heterotrophic prokaryote abundances (HPA, Figure 4C).
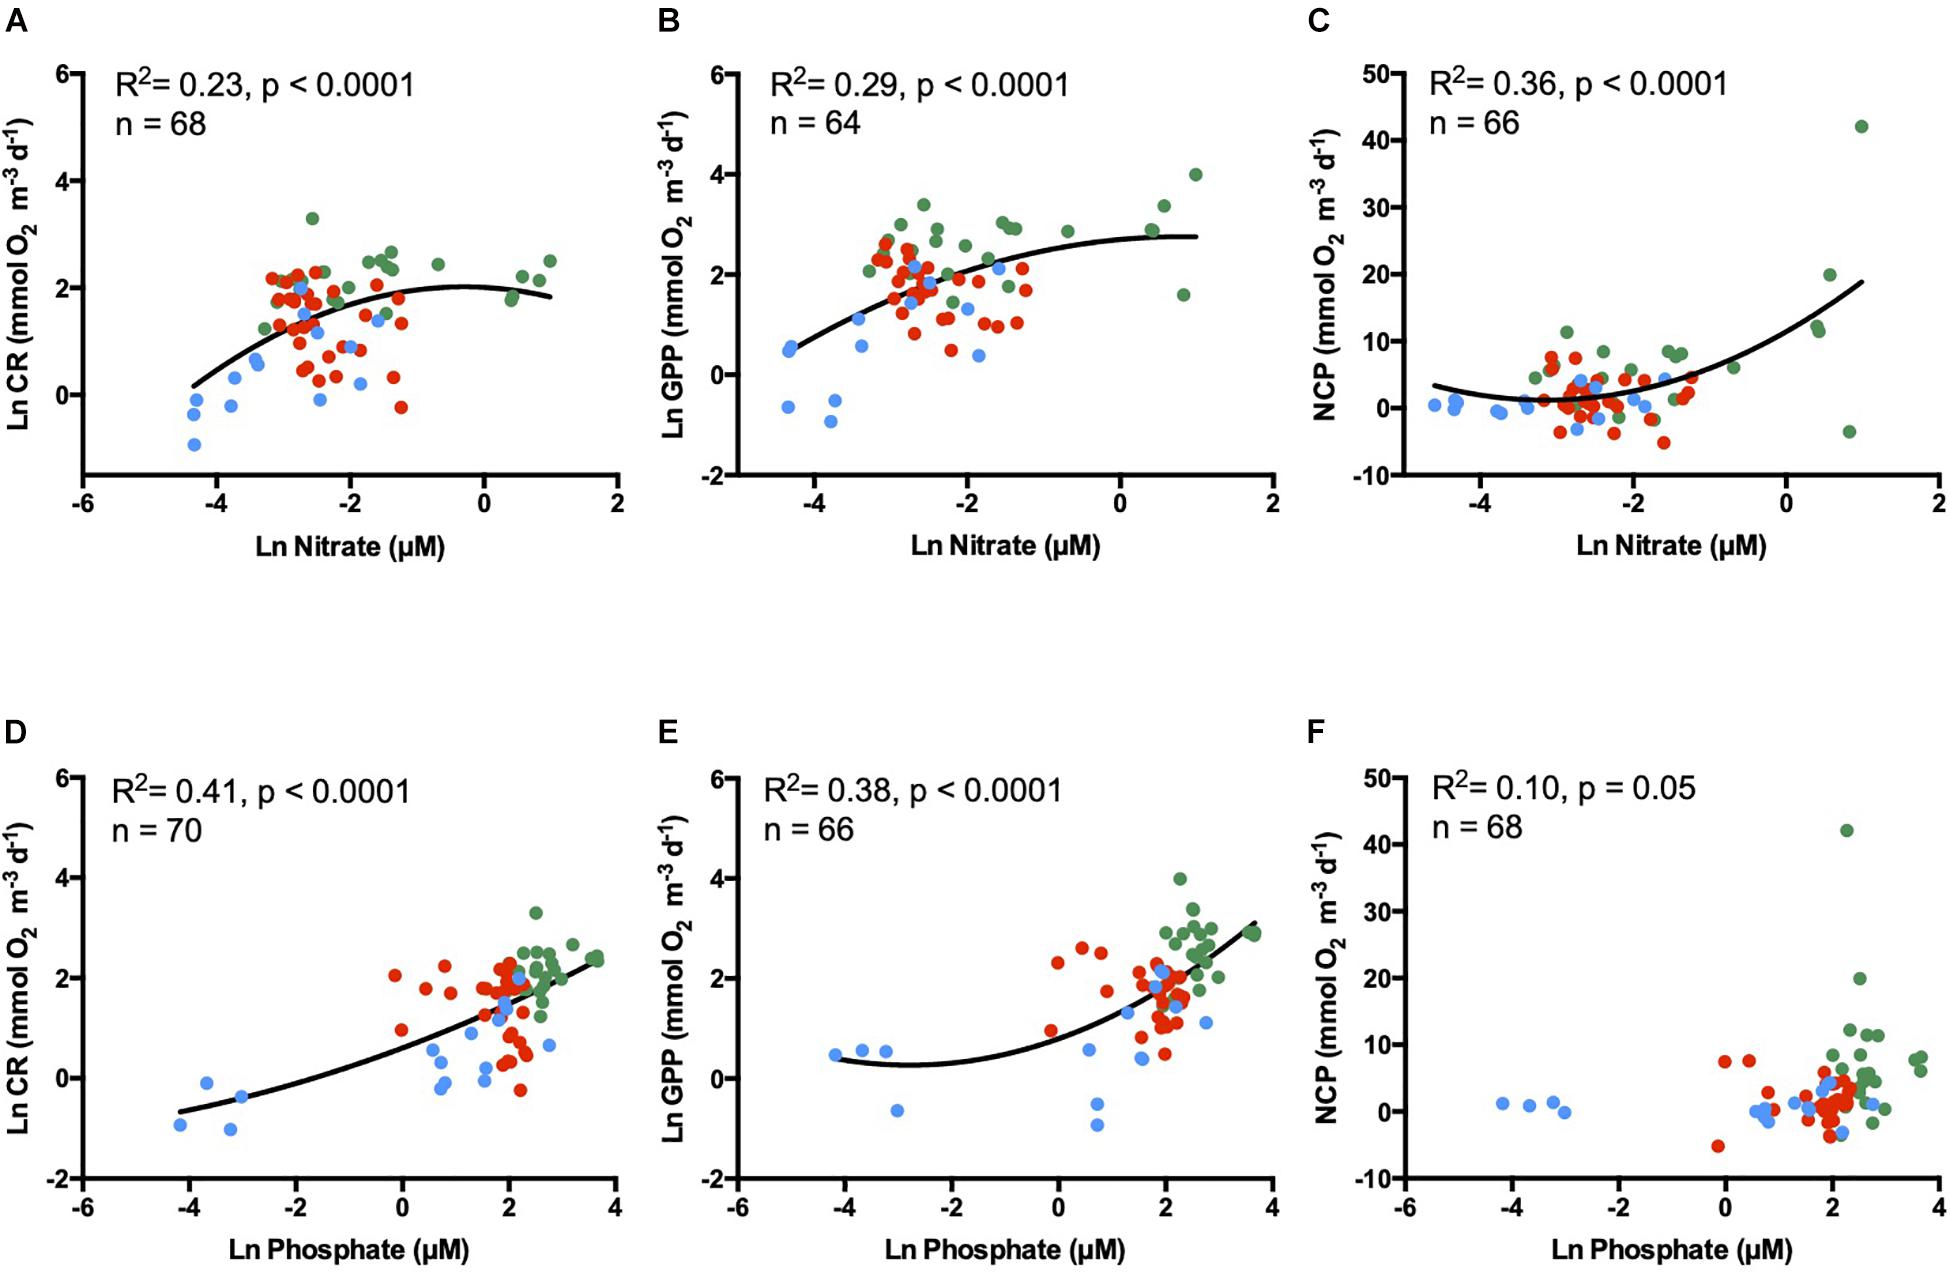
Figure 5. Natural log of (A,D) community respiration (CR), (B,E) gross primary production (GPP), and (C,F) net community production (NCP) relatioships with natural logarithm of nutrient concentrations. Nitrate in the upper panel and phosphate in the lower panel. Green dots represent estuary waters, red dots the coastal waters, and blue dots the open ocean waters. The solid line denotes the fitted second-degree polynomial regression.
The exponential relationship between nitrate concentrations and metabolic rates explained ∼ 23% of the CR variability, ∼ 29% of GPP, and ∼ 36% of NCP (Figures 5A–C). Phosphate concentration was also exponentially correlated with surface metabolic rates explaining ∼ 41% of the CR, ∼ 38% of GPP, and ∼ 10% of NCP variability (Figures 5D–F).
For the entire data set, both CR and GPP metabolic rates increased with temperature (Figures 6A,B, 7A,B,D,E), but this relationship was not observed when examining open-ocean communities alone (Figures 7G–I). The increased in CR/Chl-a with temperature was characterized by higher activation energies (Ea) compared to GPP/Chl-a (Ea CR/Chl-a = - slope; 1.07 ± 0.18 eV vs. Ea GPP/Chl-a = 0.65 ± 0.15 eV, Figures 6A,B) either across ecosystem types for coastal and estuary communities alone (Figures 7A–F). Although weak, a significant temperature-dependence was observed for the GPP/CR ratio, decreasing with water temperature increase (Figure 6D). No temperature-dependence was observed when CR was standardized by HPA (Figure 6C).
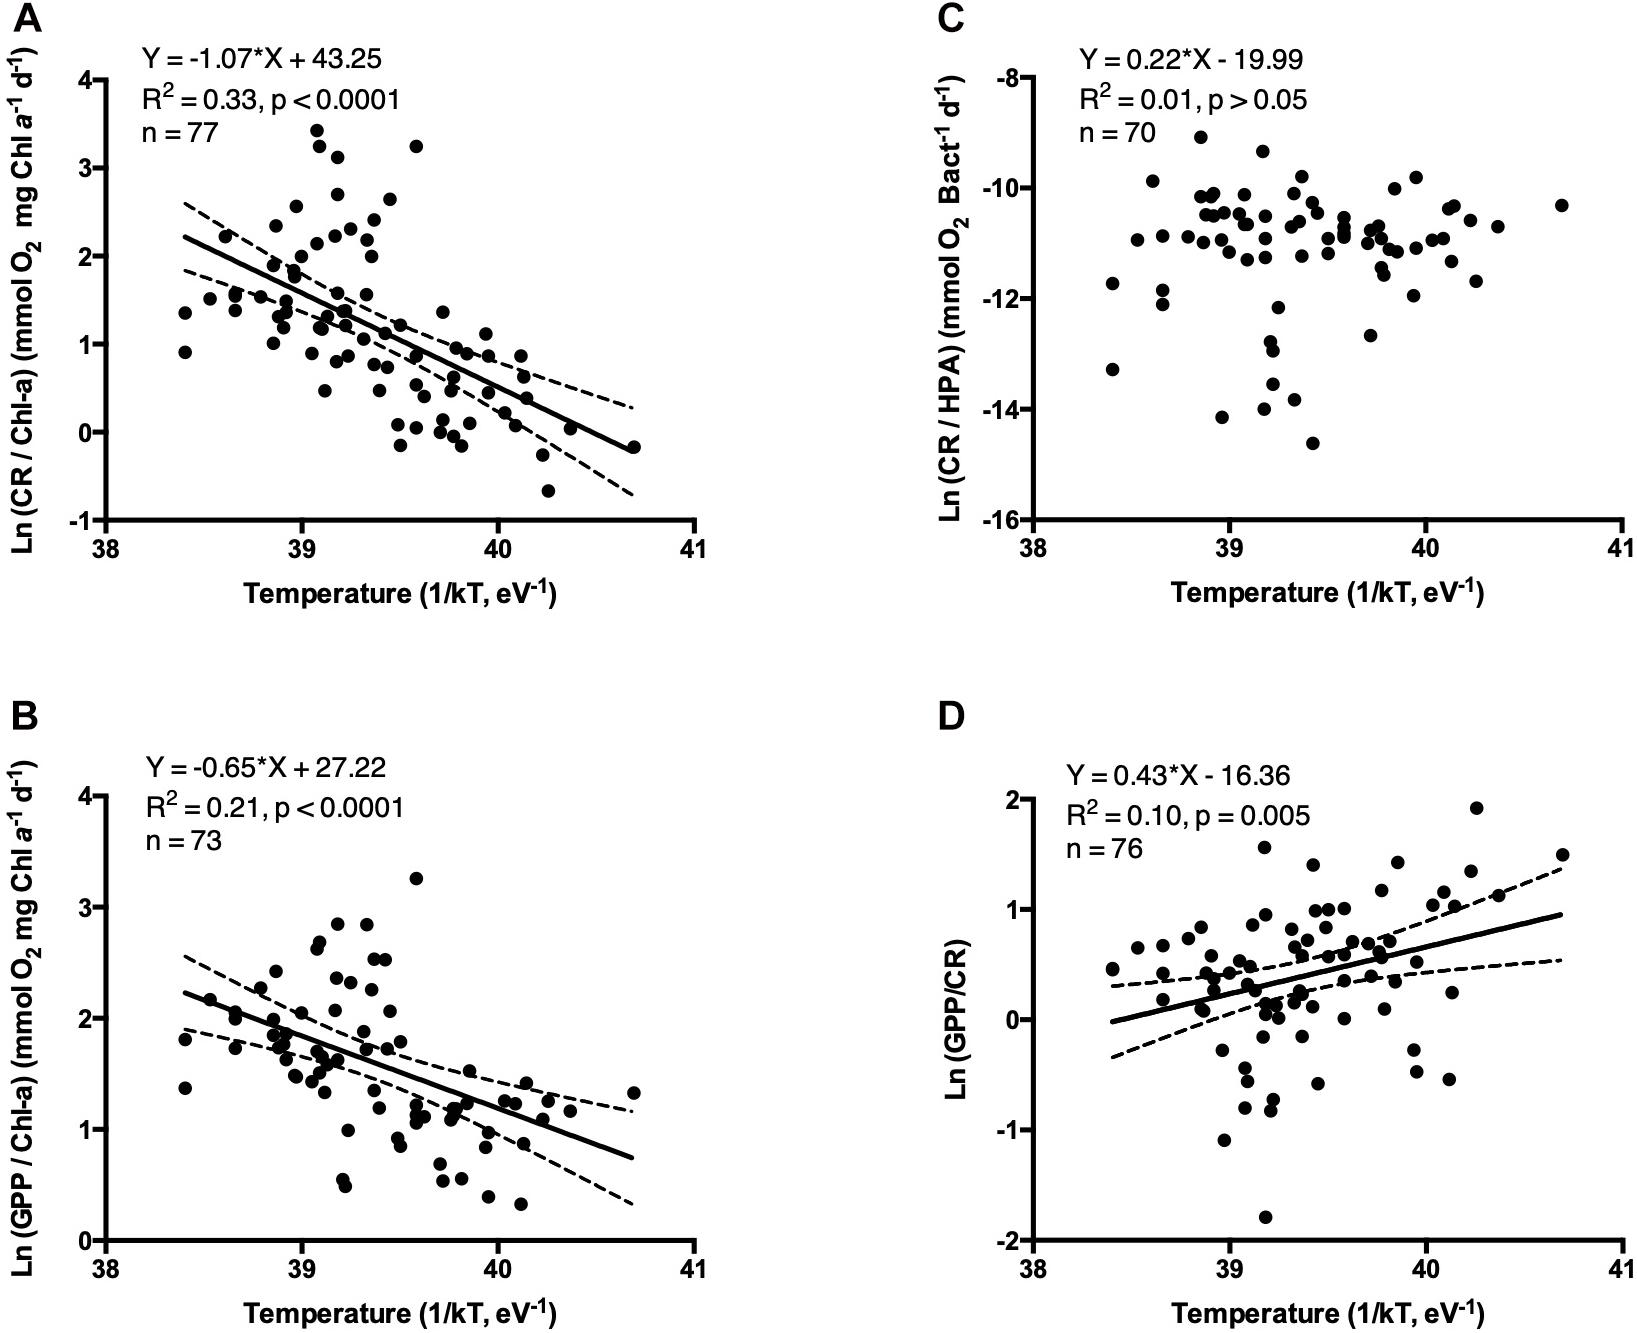
Figure 6. The relationship between the natural logarithm of the volumetric specific metabolic rates (A) CR/Chl-a, (B) GPP/Chl-a, (C) CR/HPA, and (D) GPP/CR ratio vs. the inverted water temperature [1/kT with k, the Boltzmann’s constant (8.617734 10–5 eV K–1) and with T, the water temperature (°K)]. The solid line shows the linear regression Type I and the dotted lines indicate the 95% intervals of confidence.
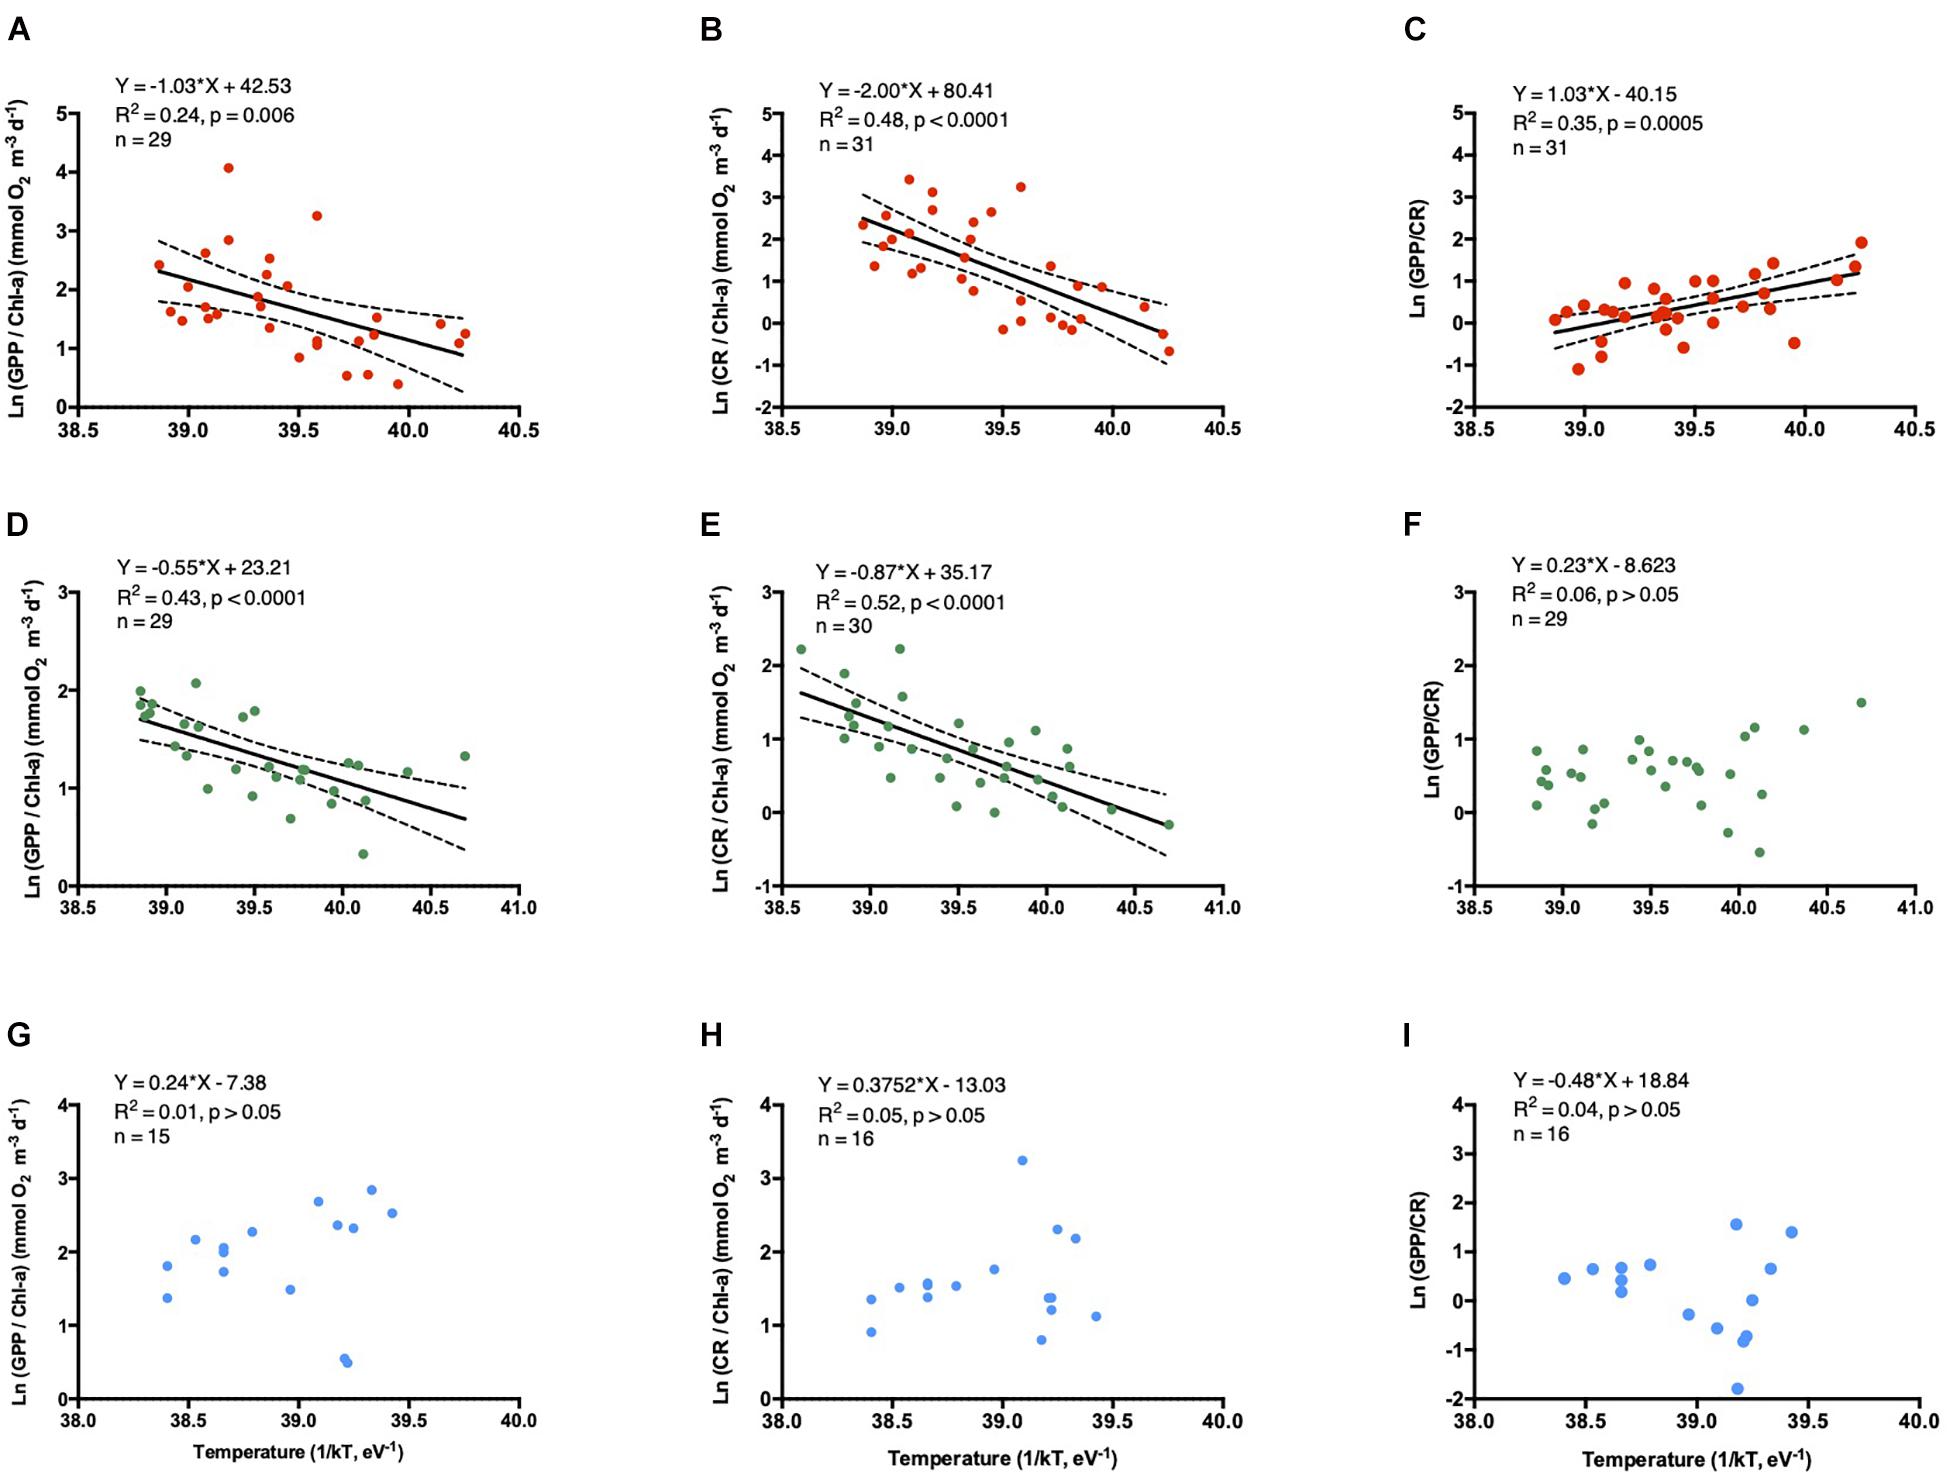
Figure 7. The relationship between the natural logarithm of the volumetric specific metabolic rates: GPP/Chl-a, (A,D,G), CR/Chl-a (B,E,H), and GPP/CR ratio (C,F,I) vs. the inverted water temperature [1/kT with k, the Boltzmann’s constant (8.617734 10–5 eV K–1) and with T, the water temperature (°K)]. The solid line shows the linear regression Type I, and the dotted lines indicate the 95% intervals of confidence. The color dots represent: Red as the coastal communities, green the estuarine communities, and blue dots the oceanic communities.
Gross primary production was related to the abundance of the three picophytoplankton populations, however, it showed a weaker linear positive relationship with Synechococcus and picoeukaryotes abundances and a stronger negative relationship with Prochlorococcus concentrations (Figures 8A–C). CR followed the same pattern as GPP with picophytoplankton communities, except for the picoeukaryotes population, which was not significant (Figures 8D–F). Prochlorococcus explained a larger fraction of the variance of CR and GPP, than Synechococcus and picoeukaryotes (Figures 8A,B,D,E). No relationship was observed between plankton metabolic rates and heterotrophic prokaryote abundances.
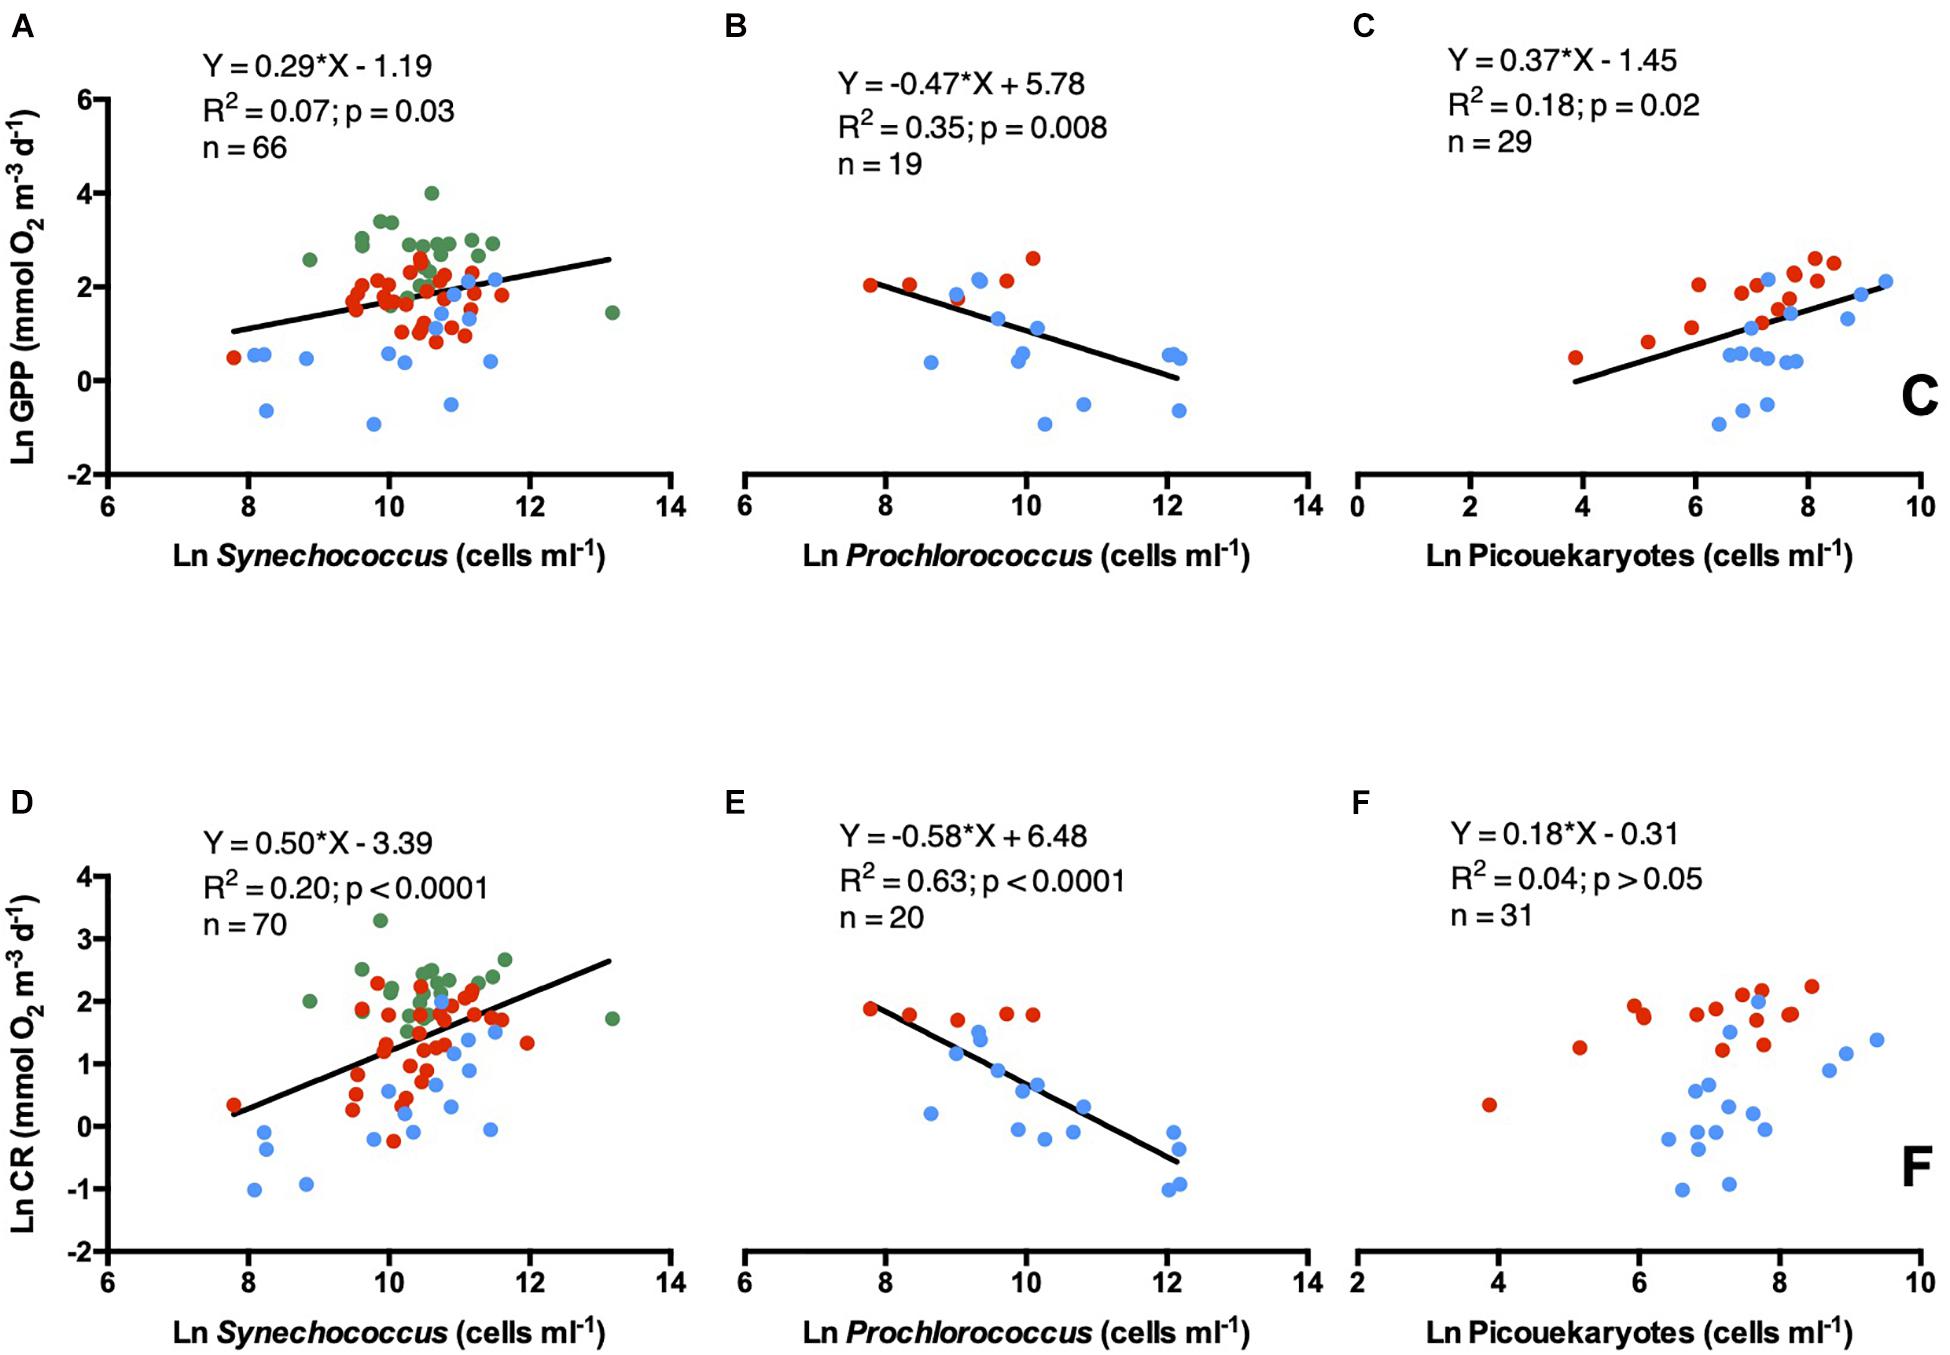
Figure 8. Natural logarithm of GPP vs. natural logarithm of (A) Synechococcus, (B) Prochlorococcus, and (C) picoeukaryotes. Natural logarithm of CR vs. natural logarithm of (D) Synechococcus, (E) Prochlorococcus, and (F) picoeukaryotes. Symbols colors are: Green dots (estuary waters), red dots (coastal waters), and blue dots (open ocean waters). The solid line shows the linear regression Type I.
Discussion
Western Australia surface plankton communities showed an increasing productivity from oceanic to coastal and estuarine waters, parallel to increasing nutrient and chlorophyll-a concentrations. Indeed, the use of quartz bottles to measured metabolic rates, showed the most accurate measurements for surface plankton communities, as it has been proved that borosilicate glass bottles, which excluded UV ration bias primary production (gross and net) rates (Regaudie-de-Gioux et al., 2014; García-Corral et al., 2017a, b, 2020).
All Western Australian ecosystem types showed a prevalence of autotrophic (GPP/CR > 1) plankton metabolic balance. Metabolic rates were remarkably high for the Swan River estuary, which has been reported to be one of the most productive estuaries among 130 estuarine systems of the world (Cloern et al., 2014), supporting high GPP and NCP rates and with autotrophic metabolism prevailing throughout the year (Agusti et al., 2018). Accordingly, our data suggest that the surface estuarine, oceanic and coastal plankton communities of WA act as CO2 sinks (Bauer et al., 2013). The near-shore waters, as those sampled here, have been traditionally considered net sources of CO2 (Smith and Mackenzie, 1987; Ram et al., 2003; Chen and Borges, 2009; Cai, 2011; Shen et al., 2019, 2020), although, some recent studies pointed to a change in this trend over the last century, with near-shore continental shelves waters acting as CO2 sinks (Laruelle et al., 2018). Nevertheless, our data only allows the carbon balance assessment of the surface layer, without the possibility of extrapolating these data to the entire water column, as we only showed volumetric and not integrated data.
The mean metabolic rates observed for WA open-ocean communities (GPP 2.68 ± 0.66 mmol O2 m–3 d–1, CR 1.93 ± 0.46 mmol O2 m–3 d–1, and NCP 0.73 ± 0.46 mmol O2 m–3 d–1), are in the range of those mean values reported by McKinnon et al. (2017) for the NE Australian open water communities (GPP 2.49 ± 0.20, CR 1.84 ± 0.06, and NCP 0.65 ± 0.17 mmol O2 m–3 d–1). Western Australia coastal metabolic rates were lower than those described for the NE Australian coast McKinnon et al. (2017), but, closer to the metabolic rates measured in the coral reef areas of NE Australia McKinnon et al. (2017). Moreover, metabolic rates for the estuarine communities found in this study, were within a similar range of those registered for the coastal waters of the North and North-eastern of the continent (estuary vs. coastal metabolic rates, respectively, CR = 8.81 ± 0.76 vs. 4.85 ± 0.21; GPP = 15.44 ± 1.83 vs. 11.78 ± 0.60, and NCP = 6.88 ± 1.55 vs. 6.61 ± 0.53) (McKinnon et al., 2017).
Plankton metabolism is regulated by a number of abiotic and biotic characteristics of the ecosystems, including temperature, nutrient and organic matter supply, light and community composition (McKinnon et al., 2013; Regaudie-de-Gioux and Duarte, 2013; Lønborg et al., 2016). Open-ocean communities showed oligotrophic characteristics, such as low chlorophyll-a (from 0.1 to 1 mg m–3, mean 0.37) and nutrient concentrations (nitrate and phosphate between 0 and 0.2 μM, mean = 0.06 and 0.04 μM, respectively), which is reflected in the lower metabolic rates found. However, although Chl-a concentrations at open-ocean communities are lower than those for the estuarine and coastal waters, they are still higher than those observed at the ultraoligotrophic surface waters of the Subtropical Indian Ocean Gyre [0.03–0.65 mg m–3, mean 0.15 ± 0.02 mg m–3 (García-Corral et al., 2017a, b)].
The role of trophic status in determining the metabolic rates in WA waters was supported by the significant relationship found between water nutrients (PO4 and NO3) concentrations and plankton metabolism. These relationships have been demonstrated in experimental nutrient additions (Olsen et al., 2006) but not in comparative analyses of in situ field data yet, as rapid nutrient turnover in planktonic ecosystems prevent the identification of relationships between nutrient concentration and community metabolism (Regaudie-de-Gioux et al., 2015). As reported here for WA waters, chlorophyll-a and nutrient concentrations show a characteristic relationship in marine ecosystems (Smith, 2006; Carstensen et al., 2011) including the Swan Estuary (Thompson and Hosja, 1996). We observed a clear increase of nitrate and phosphate concentrations from open ocean to coastal areas and estuarine waters, where highest nutrient concentrations were found in the Swan River Estuary, receiving large agricultural and urban inputs (Thompson, 1998; Chan et al., 2002). Coastal plankton communities in the nutrient-poor Leeuwin Current, which dominates the WA oceanic waters, have been characterized by strong nitrogen limitation (Lourey et al., 2006), as reflected in a relative excess of phosphate and silicate concentrations relative to nitrogen for phytoplankton growth (Thompson et al., 2011). The N/P ratios in the communities sampled were consistently below the Redfield ratio (N/P = 16), pointing at a deficit of nitrogen, declining from open-ocean communities (N/P = 11.7), to coastal (N/P = 7.2) and estuarine (N/P = 4.4) waters. Phosphate and nitrate concentrations explained part of metabolic rates variability. However, CR and GPP increased exponentially with increasing phosphate concentration, while appeared to saturate at high nitrate concentrations. Therefore, plankton metabolism could be limited by other factors such as the bioavailability of nitrate, greater flushing because rainfall and river runoff, decreased solar irradiance, lower temperatures, increased cloud cover and greater turbidity of the water column that counteract plankton metabolism (Thompson, 1998). NCP only showed an exponential and positive regression with nitrate concentrations while a weak and close to significant relationship appeared with phosphate concentrations.
Overall CR in WA plankton communities scaled as the 3/4 power of GPP (ln-ln slope 0.73), similar to the global scaling of 0.79 (Regaudie-de-Gioux and Duarte, 2013), although higher than the 0.66 described for the Northern Australian waters (McKinnon et al., 2017). The fact that CR increases as the 3/4 power of GPP shows that GPP increases more rapidly than CR, and thus, the GPP/CR ratio tend to be higher in more productive communities. When assessed across WA ecosystem type, we found the scaling factors between CR and GPP to be highest in open-ocean communities (0.66). Differences in the scaling of GPP to CR may depend on the allochthonous inputs of dissolved organic carbon (DOC) (Duarte et al., 2013) and the different relationship between heterotrophic communities with DOC (González-Benítez et al., 2019). Rainfall and upwelling fluxes are important sources of DOC and nutrients in the coastal and estuarine regions of WA (Thompson and Hosja, 1996; Thompson, 1998). This extra DOC could stimulate the heterotrophic activities (increase in CR not associated with an increase in GPP), while in the more oligotrophic open ocean stations, the heterotrophic community might depend on the photosynthetic derived DOC or dissolved primary production (DPP). Therefore, oceanic communities showed stronger coupling (0.66) between metabolic processes (Morán et al., 2002; Rochelle-Newall et al., 2008) than coastal and estuarine communities (0.49 and 0.47, respectively), and an increase in GPP might be associated with an increase in CR. However, our results showed an opposite pattern of that found in the North-eastern Australian ecosystems, were lower slopes of CR vs. GPP appeared in open-ocean communities (0.56) compared to the coral reef (0.77) and coastal (0.98) plankton communities (McKinnon et al., 2017).
In this study, Chl-a explained 66% of GPP variability and 41% of CR, greater percentage than that for GPP (50%), and similar to CR (40%) registered in the Northern Australian waters McKinnon et al. (2017). The exponential relationship found between NCP and Chl-a, explaining 64% of its variability, close to the 73% reported for WA coastal areas (Agusti et al., 2018). The important role of Chl-a in explaining variability in GPP in WA communities in contrast to the more modest role for the global open ocean (30% of variance explained, Regaudie-de-Gioux and Duarte, 2013), may partly reflect the broad range of Chl-a in WA coastal waters compared to the open ocean.
Picophytoplankton abundance was also related to GPP and CR metabolic rates. However, the relationships varied among picophytoplankton community components. Strong negative linear relationship appeared between Prochlorococcus abundance and GPP and CR (p < 0.05, R2 = 0.35 and 0.63, respectively). However, although significant (p < 0.05), weaker and positive relationships appeared with Synechococcus abundances (R2 = 0.07 and 0.2 for GPP and CR, respectively). Prochlorococcus was located mainly in the open ocean stations and in a few coastal stations at Woodman Point. Likely Prochlorococcus dominates the picophytoplankton community in the oligotrophic, less productive offshore regions, or coastal areas influenced by the nutrient-poor Leeuwin Current eddy (Paterson et al., 2013; Mena et al., 2019). In contrast, Synechococcus was present in the three ecosystem types sampled (coastal, estuary, and open ocean), being particularly abundant in the autotrophic nutrient-rich estuarine waters. However, the picophytoplankton communities explained a general low percentage of GPP and CR variability, likely because higher productive ecosystems are more biodiverse including other photosynthetic groups such as diatoms, pelagophytes, prasinophytes, cryptophytes, and chlorophytes (Thompson et al., 2011; Lourey et al., 2013). We found no significant relationship between CR and heterotrophic prokaryote abundance, consistent with earlier reports for the global ocean (Regaudie-de-Gioux and Duarte, 2013).
The Metabolic Theory of the Ecology (MTE, Brown et al., 2004) provides a potentially useful framework to build a predictive understanding of the feedbacks between temperature and biogeochemical carbon cycling in ecosystems (Brown et al., 2004; Allen et al., 2005; López-Urrutia et al., 2006; Yvon-Durocher et al., 2010a, b). In this study, metabolic rates, standardized to chlorophyll-a concentration, showed strong temperature dependence, both for CR/Chl-a and GPP/Chl-a (Figures 6A,B). The activation energy (Ea) for CR/Chl-a of 1.07 eV ± 0.18 was higher than the Ea for GPP/Chl-a of 0.65 ± 0.15 eV, consistent with predictions from MTE (Brown et al., 2004). However, our Ea values were lower than those reported for the Subtropical Indian Ocean (Ea CR/Chl-a = 1.48 ± 0.35, Ea GPP/Chl-a = 1.70 ± 0.37 eV; García-Corral et al., 2017b). The different temperature dependence between ecosystems, with coastal GPP and CR Ea’s higher than the estuarine about a factor of 2 and the lack of temperature-dependence within the oceanic stations, may be influence by the different temperature ranges registered and likely to other relevant processes other than the direct physiological effect of temperature on metabolism that co-vary with temperature, such as seasonal changes in light, nutrients distribution and plankton community temperature sensitivity (Regaudie-de-Gioux and Duarte, 2012; García-Corral et al., 2017b). We did not find, however, any relationship between temperature and CR scaled to heterotrophic prokaryote abundance for WA plankton communities, in contrast to reports of a Ea of 0.57 ± 0.35 eV in Subtropical Indian Ocean (García-Corral et al., 2017b). The different environmental characteristic of the oligotrophic Indian Subtropical Gyre compared to the more coastal and productive waters sampled here may help explain, together with the fact that our results refers only to surface waters, the differences with the results of García-Corral et al. (2017b). In the Northeastern Australian waters, only CR in coral reef communities (Ea = 1.32 ± 0.47 eV) and GPP in the open sea (Ea = 2.76 ± 0.58 eV), showed a temperature-dependence McKinnon et al. (2017), with activation energies well above those obtained here for WA waters. Extremely high Ea values were also find by Regaudie-de-Gioux and Duarte (2012) for the Indian Ocean, (CR/Chl-a of 3.19 ± 0.60 eV and 10.83 ± 3.32 eV for GPP/Chl-a). However, their assessment was limited due to a paucity of metabolic estimates for the Indian Ocean (n = 5) in their global data set.
Overall, Western Australia plankton communities studied here were characterized by a prevalence of autotrophic metabolism (GPP/CR > 1), which represented 81% of the communities sampled here. The GPP/CR ratio for coastal (1.75 ± 0.25) and estuary waters (1.85 ± 0.15) are consistent with the average values of ∼1.5 reported earlier for Ningaloo Reef and Exmouth Gulf (North Western Australia coast) McKinnon et al. (2017). The overall median GPP/CR found in the open ocean communities sampled here (1.50 ± 0.32) was, however, lower than that described for the Subtropical Indian Ocean Gyre of (2.12 ± 0.41, Duarte et al., 2013).
In summary, the results presented here contribute to address a paucity of studies of plankton community metabolism in the Indian Ocean (Regaudie-de-Gioux and Duarte, 2013), by reporting metabolic rates, characterized by a prevalence of autotrophic communities, along Western Australian coastal, estuarine and open ocean waters. Plankton metabolism increased strongly with chlorophyll-a, nutrient concentrations and temperature. Overall, our results characterize plankton communities across Western Australia to act as a CO2 sinks, but the stronger thermal-dependence of respiration than gross primary production rates suggests that their role may weaken with future warming. Further studies are necessary in order to better characterize planktonic Western Australian ecosystems.
Data Availability Statement
The raw data supporting the conclusions of this article will be made available by the authors, without undue reservation.
Author Contributions
LSG-C performed the experiments, analyzed the data, contributed to designed the experiments, prepared figures and tables, authored drafts of the manuscript, and approved the final draft. SA and CD conceived and designed the experiments, analyzed the data, contributed to reagents, materials, and analysis tools, reviewed drafts of the manuscript, and approved the final draft. All authors contributed to the article and approved the submitted version.
Funding
This research was funded by the Australian Research Council’s Discovery Project (project number DP140100825) and King Abdullah University of Science and Technology (KAUST) baseline funding BAS/1/1072-01-01 to SA. The Malaspina Expedition 2010 was funded by the INGENIO 2010 CONSOLIDER program (ref.CDS2008-00077) of the Spanish Ministry of Economy and Competitiveness. LSG-C was supported by a Juan de la Cierva Fellowship funded by the Spanish Ministry of Science, Innovation and Universities developed at the King Juan Carlos University of Madrid, Spain.
Conflict of Interest
The authors declare that the research was conducted in the absence of any commercial or financial relationships that could be construed as a potential conflict of interest.
Acknowledgments
We thank María Comesaña and Lorena Vigoya for their assistance with sampling. We also thank the helpful Schmidt Ocean Institute crew on board the RV/Falkor and the patient crew from the RV/Solander from the Australian Institute of Marine Science, as well as the RV/Hespérides crew and all participants of the Malaspina Expedition 2010.
References
Agusti, S., Lubián, L. M., Moreno-Ostos, E., Estrada, M., and Duarte, C. M. (2019). Projected changes in photosynthetic picoplankton in a warmer subtropical ocean. Front. Mar. Sci. 5:506. doi: 10.3389/fmars.2018.00506
Agusti, S., Vigoya, L., and Duarte, C. M. (2018). Annual plankton community metabolism in estuarine and coastal waters in Perth (Western Australia). PeerJ 6:e5081. doi: 10.7717/peerj.5081
Allen, A. P., Gillooly, J. F., and Brown, J. H. (2005). Linking the global carbon cycle to individual metabolism. Funct. Ecol. 19, 202–213. doi: 10.1111/j.1365-2435.2005.00952.x
Bauer, J. E., Cai, W.-J., Raymond, P. A., Bianchi, T. S., Hopkinson, C. S., and Regnier, P. A. G. (2013). The changing carbon cycle of the coastal ocean. Nature 504, 61–70. doi: 10.1038/nature12857
Brown, J. H., Gillooly, J. F., Allen, A. P., Savage, V. M., and West, G. B. (2004). Toward a metabolic theory of ecology. Ecology 85, 1771–1789.
Cai, W.-J. (2011). Estuarine and coastal ocean carbon paradox: CO2 sinks or sites of terrestrial carbon incineration? Annu. Rev. Mar. Sci. 3, 123–145. doi: 10.1146/annurev-marine-120709-142723
Calleja, M. L., Duarte, C. M., Álvarez, M., Vaquer-Sunyer, R., Agustí, S., and Herndl, G. J. (2013). Prevalence of strong vertical CO2 and O2 variability in the top meters of the ocean: PCO2 variability within the top meters. Glob. Biogeochem. Cycles 27, 941–949. doi: 10.1002/gbc.20081
Carpenter, J. H. (1965). The accuracy of the Winkler method for dissolved oxygen analysis. Limnol. Oceanogr. 10, 135–140.
Carstensen, J., Sánchez-Camacho, M., Duarte, C. M., Krause-Jensen, D., and Marbà, N. (2011). Connecting the dots: responses of coastal ecosystems to changing nutrient concentrations. Environ. Sci. Technol. 45, 9122–9132. doi: 10.1021/es202351y
Chan, T. U., Hamilton, D. P., Robson, B. J., Hodges, B. R., and Dallimore, C. (2002). Impacts of hydrological changes on phytoplankton succession in the Swan River, Western Australia. Estuaries 25, 1406–1415. doi: 10.1007/BF02692234
Chen, C.-T. A., and Borges, A. V. (2009). Reconciling opposing views on carbon cycling in the coastal ocean: continental shelves as sinks and near-shore ecosystems as sources of atmospheric CO2. Deep Sea Res. Part II Top. Stud. Oceanogr. 56, 578–590. doi: 10.1016/j.dsr2.2009.01.001
Cloern, J. E., Foster, S. Q., and Kleckner, A. E. (2014). Phytoplankton primary production in the world’s estuarine-coastal ecosystems. Biogeosciences 11, 2477–2501. doi: 10.5194/bg-11-2477-2014
Duarte, C. M. (2011). The Role of Marine Biota in the Functioning of the Biosphere. Bilbao: Fundacion BBVA.
Duarte, C. M. (2015). Seafaring in the 21St century: the malaspina 2010 circumnavigation expedition. Limnol. Oceanogr. Bull. 24, 11–14. doi: 10.1002/lob.10008
Duarte, C. M., Regaudie-de-Gioux, A., Arrieta, J. M., Delgado-Huertas, A., and Agustí, S. (2013). The oligotrophic ocean is heterotrophic. Annu. Rev. Mar. Sci. 5, 551–569. doi: 10.1146/annurev-marine-121211-172337
Furnas, M. J., and Carpenter, E. J. (2016). Primary production in the tropical continental shelf seas bordering northern Australia. Cont. Shelf Res. 129, 33–48. doi: 10.1016/j.csr.2016.06.006
García-Corral, L., Duarte, C., and Agusti, S. (2020). Impact of UV radiation on plankton net community production: responses in Western Australian estuarine and coastal waters. Mar. Ecol. Prog. Ser. 651, 45–56. doi: 10.3354/meps13456
García-Corral, L. S., Holding, J. M., Carrillo-de-Albornoz, P., Steckbauer, A., Pérez-Lorenzo, M., Navarro, N., et al. (2017a). Effects of UVB radiation on net community production in the upper global ocean. Glob. Ecol. Biogeogr. 26, 54–64. doi: 10.1111/geb.12513
García-Corral, L. S., Holding, J. M., Carrillo-de-Albornoz, P., Steckbauer, A., Pérez-Lorenzo, M., Navarro, N., et al. (2017b). Temperature dependence of plankton community metabolism in the subtropical and tropical oceans. Glob. Biogeochem. Cycles 31, 1141–1154. doi: 10.1002/2017GB005629
Gasol, J. M., and del Giorgio, P. A. (2000). Using flow cytometry for counting natural planktonic bacyeria and understanding the structure of planktonic bacterial communities. Sci. Mar. 64, 197–224.
Gattuso, J.-P., Frankignoulle, M., and Wollast, R. (1998). Carbon and carbonate metabolism in coastal aquatic ecosystems. Annu. Rev. Ecol. Syst. 29, 405–434. doi: 10.1146/annurev.ecolsys.29.1.405
Gazeau, F., Duarte, C. M., Gattuso, J.-P., Barrón, C., Navarro, N., Ruiz, S., et al. (2005). Whole-system metabolism and CO2 fluxes in a Mediterranean Bay dominated by seagrass beds (Palma Bay, NW Mediterranean). Biogeosciences 2, 43–60.
Godfrey, J. S., and Ridgway, K. R. (1985). The large-scale environment of the poleward-flowing leeuwin current, Western Australia: longshore steric height gradients, wind stresses and geostrophic flow. J. Phys. Oceanogr. 15, 481–495. doi: 10.1175/1520-04851985015<0481:TLSEOT<2.0.CO;2
González-Benítez, N., García-Corral, L. S., Morán, X. A. G., Middelburg, J. J., Pizay, M. D., and Gattuso, J.-P. (2019). Drivers of microbial carbon fluxes variability in two oligotrophic mediterranean coastal systems. Sci. Rep. 9:17669. doi: 10.1038/s41598-019-53650-z
Grasshoff, K., Kremling, K., and Ehrhardt, M. (2009). Methods of Seawater Analysis. Hoboken, NJ: John Wiley & Sons.
Hastie, T., and Tibshirani, R. (1993). Varying-coefficient models. J. R. Stat. Soc. Ser. B Methodol. 55, 757–779. doi: 10.1111/j.2517-6161.1993.tb01939.x
Koslow, J. A., Pesant, S., Feng, M., Pearce, A., Fearns, P., Moore, T., et al. (2008). The effect of the Leeuwin current on phytoplankton biomass and production off Southwestern Australia. J. Geophys. Res. Oceans 113:C07050. doi: 10.1029/2007JC004102
Laruelle, G. G., Cai, W.-J., Hu, X., Gruber, N., Mackenzie, F. T., and Regnier, P. (2018). Continental shelves as a variable but increasing global sink for atmospheric carbon dioxide. Nat. Commun. 9:454. doi: 10.1038/s41467-017-02738-z
Lønborg, C., Cuevas, L. A., Reinthaler, T., Herndl, G. J., Gasol, J. M., Morán, X. A. G., et al. (2016). Depth dependent relationships between temperature and ocean heterotrophic prokaryotic production. Front. Mar. Sci. 3:90. doi: 10.3389/fmars.2016.00090
Longhurst, A., Sathyendranath, S., Platt, T., and Caverhill, C. (1995). An estimate of global primary production in the ocean from satellite radiometer data. J. Plankton Res. 17, 1245–1271. doi: 10.1093/plankt/17.6.1245
López-Urrutia, Á, San Martin, E., Harris, R. P., and Irigoien, X. (2006). Scaling the metabolic balance of the oceans. Proc. Natl. Acad. Sci. U.S.A. 103, 8739–8744.
Lourey, M. J., Dunn, J. R., and Waring, J. (2006). A mixed-layer nutrient climatology of Leeuwin current and Western Australian shelf waters: seasonal nutrient dynamics and biomass. J. Mar. Syst. 59, 25–51. doi: 10.1016/j.jmarsys.2005.10.001
Lourey, M. J., Thompson, P. A., McLaughlin, M. J., Bonham, P., and Feng, M. (2013). Primary production and phytoplankton community structure during a winter shelf-scale phytoplankton bloom off Western Australia. Mar. Biol. 160, 355–369. doi: 10.1007/s00227-012-2093-4
Marañón, E., Cermeño, P., López-Sandoval, D. C., Rodríguez-Ramos, T., Sobrino, C., Huete-Ortega, M., et al. (2013). Unimodal size scaling of phytoplankton growth and the size dependence of nutrient uptake and use. Ecol. Lett. 16, 371–379. doi: 10.1111/ele.12052
Marañón, E., Cermeño, P., Rodríguez, J., Zubkov, M. V., and Harris, R. P. (2007). Scaling of phytoplankton photosynthesis and cell size in the ocean. Limnol. Oceanogr. 52, 2190–2198. doi: 10.4319/lo.2007.52.5.2190
Marañón, E., Holligan, P. M., Barciela, R., González, N., Mouriño, B., Pazó, M. J., et al. (2001). Patterns of phytoplankton size structure and productivity in contrasting open-ocean environments. Mar. Ecol. Prog. Ser. 216, 43–56.
McKinnon, A. D., Duggan, S., Böttger-Schnack, R., Gusmão, L. F. M., and O’Leary, R. A. (2013). Depth structuring of pelagic copepod biodiversity in waters adjacent to an Eastern Indian Ocean coral reef. J. Nat. Hist. 47, 639–665. doi: 10.1080/00222933.2012.673645
McKinnon, A. D., Duggan, S., Logan, M., and Lønborg, C. (2017). Plankton respiration, production, and trophic state in tropical coastal and shelf waters adjacent to Northern Australia. Front. Mar. Sci. 4:346. doi: 10.3389/fmars.2017.00346
Mena, C., Reglero, P., Hidalgo, M., Sintes, E., Santiago, R., Martín, M., et al. (2019). Phytoplankton community structure is driven by stratification in the oligotrophic mediterranean sea. Front. Microbiol. 10:1698. doi: 10.3389/fmicb.2019.01698
Morán, X. A. G., Estrada, M., Gasol, J. M., and Pedrós-Alió, C. (2002). Dissolved primary production and the strength of phytoplankton– bacterioplankton coupling in contrasting marine regions. Microb. Ecol. 44, 217–223. doi: 10.1007/s00248-002-1026-z
Olsen, Y., Agustí, S., Andersen, T., Duarte, C. M., Gasol, J. M., Gismervik, I., et al. (2006). A comparative study of responses in plankton food web structure and function in contrasting European coastal waters exposed to experimental nutrient addition. Limnol. Oceanogr. 51, 488–503. doi: 10.4319/lo.2006.51.1_part_2.0488
Oudot, C., Gerard, R., Morin, P., and Gningue, I. (1988). Precise shipboard determination of dissolved oxygen (Winkler Procedure) for productivity studies with a commercial system. Limnol. Oceanogr. 33, 146–150.
Paterson, H., Heel, K., and Waite, A. (2013). A warm-core eddy linking shelf, Leeuwin current and oceanic waters demonstrated by near-shelf distribution patterns of Synechococcus spp. and Prochlorococcus spp. in the eastern Indian Ocean. Mar. Freshw. Res. 64:1011. doi: 10.1071/MF12271
Pearce, A., and Pattiaratchi, C. (1999). The capes current: a summer countercurrent flowing past cape Leeuwin and cape Naturaliste, Western Australia. Cont. Shelf Res. 19, 401–420. doi: 10.1016/S0278-4343(98)00089-2
Pearce, A. F., and Feng, M. (2013). The rise and fall of the “marine heat wave” off Western Australia during the summer of 2010/2011. J. Mar. Syst. 111–112, 139–156. doi: 10.1016/j.jmarsys.2012.10.009
Ram, A. S. P., Nair, S., and Chandramohan, D. (2003). Seasonal shift in net ecosystem production in a tropical estuary. Limnol. Oceanogr. 48, 1601–1607. doi: 10.4319/lo.2003.48.4.1601
Regaudie-de-Gioux, A., Agustí, S., and Duarte, C. M. (2014). UV sensitivity of planktonic net community production in ocean surface waters. J. Geophys. Res. Biogeosci. 119, 929–936. doi: 10.1002/2013JG002566
Regaudie-de-Gioux, A., and Duarte, C. M. (2012). Temperature dependence of planktonic metabolism in the ocean. Glob. Biogeochem. Cycles 26:GB1015. doi: 10.1029/2010GB003907
Regaudie-de-Gioux, A., and Duarte, C. M. (2013). Global patterns in oceanic planktonic metabolism. Limnol. Oceanogr. 58, 977–986. doi: 10.4319/lo.2013.58.3.0977
Regaudie-de-Gioux, A., Sal, S., and López-Urrutia, Á (2015). Poor correlation between phytoplankton community growth rates and nutrient concentration in the sea. Biogeosciences 12, 1915–1923. doi: 10.5194/bg-12-1915-2015
Rochelle-Newall, E. J., Torréton, J.-P., Mari, X., and Pringault, O. (2008). Phytoplankton-bacterioplankton coupling in a subtropical South Pacific coral reef lagoon. Aquat. Microb. Ecol. 50, 221–229. doi: 10.3354/ame01158
Shen, C., Testa, J. M., Ni, W., Cai, W.-J., Li, M., and Kemp, W. M. (2019). Ecosystem metabolism and carbon balance in chesapeake bay: a 30-year analysis using a coupled hydrodynamic-biogeochemical model. J. Geophys. Res. Oceans 124, 6141–6153. doi: 10.1029/2019JC015296
Shen, X., Su, M., Sun, T., Lv, S., Dang, Z., and Yang, Z. (2020). Net heterotrophy and low carbon dioxide emissions from biological processes in the Yellow River Estuary, China. Water Res. 171:115457. doi: 10.1016/j.watres.2019.115457
Smith, R. L., Huyer, A., Godfrey, J. S., and Church, J. A. (1991). The leeuwin current off Western Australia, 1986–1987. J. Phys. Oceanogr. 21, 323–345.
Smith, S. V., and Mackenzie, F. T. (1987). The ocean as a net heterotrophic system: implications from the carbon biogeochemical cycle. Glob. Biogeochem. Cycles 1, 187–198. doi: 10.1029/GB001i003p00187
Smith, V. H. (2006). Responses of estuarine and coastal marine phytoplankton to nitrogen and phosphorus enrichment. Limnol. Oceanogr. 51, 377–384. doi: 10.4319/lo.2006.51.1_part_2.0377
Taylor, J. G., and Pearce, A. F. (1999). Ningaloo reef currents: implications for coral spawn dispersal, zooplankton and whale shark abundance. J. R. Soc. West. Aust. 82, 57–65.
Thompson, P. A. (1998). Spatial and temporal patterns of factors influencing phytoplankton in a salt wedge estuary, the Swan River, Western Australia. Estuaries 21:801. doi: 10.2307/1353282
Thompson, P. A., Bonham, P., Waite, A. M., Clementson, L. A., Cherukuru, N., Hassler, C., et al. (2011). Contrasting oceanographic conditions and phytoplankton communities on the east and west coasts of Australia. Deep Sea Res. Part II Top. Stud. Oceanogr. 58, 645–663. doi: 10.1016/j.dsr2.2010.10.003
Thompson, P. A., and Hosja, W. (1996). Nutrient limitation of phytoplankton in the upper Swan River estuary, Western Australia. Mar. Freshw. Res. 47, 659–667. doi: 10.1071/mf9960659
Yvon-Durocher, G., Allen, A. P., Montoya, J. M., Trimmer, M., and Woodward, G. (2010a). “The temperature dependence of the carbon cycle in aquatic ecosystems,” in Advances in Ecological Research Integrative Ecology: From Molecules to Ecosystems, ed. G. Woodward (Cambridge, MA: Academic Press), 267–313. doi: 10.1016/B978-0-12-385005-8.00007-1
Keywords: Western Australia, surface plankton metabolism, primary production, respiration, drivers, estuary, coastal and open ocean waters
Citation: Garcia-Corral LS, Duarte CM and Agusti S (2021) Plankton Community Metabolism in Western Australia: Estuarine, Coastal and Oceanic Surface Waters. Front. Mar. Sci. 7:582136. doi: 10.3389/fmars.2020.582136
Received: 10 July 2020; Accepted: 01 December 2020;
Published: 08 January 2021.
Edited by:
Tilmann Harder, University of Bremen, GermanyReviewed by:
E. Elena Garcia-Martin, Ocean Biogeochemistry and Ecosystems, National Oceanography Centre, United KingdomKai G. Schulz, Southern Cross University, Australia
Copyright © 2021 Garcia-Corral, Duarte and Agusti. This is an open-access article distributed under the terms of the Creative Commons Attribution License (CC BY). The use, distribution or reproduction in other forums is permitted, provided the original author(s) and the copyright owner(s) are credited and that the original publication in this journal is cited, in accordance with accepted academic practice. No use, distribution or reproduction is permitted which does not comply with these terms.
*Correspondence: Lara S. Garcia-Corral, bGFyYS5zaWx2aWEuZ0BnbWFpbC5jb20=