 Nicole Barbour1,2*
 George L. Shillinger3
 Aimee L. Hoover1,3
 Sean A. Williamson3,4
 Victoria J. Coles5
 Dong Liang1
 William F. Fagan2
 Helen Bailey1
- 1Chesapeake Biological Laboratory, University of Maryland Center for Environmental Science, Solomons, MD, United States
- 2Department of Biology, University of Maryland, College Park, College Park, MD, United States
- 3Upwell Turtles, Monterey, CA, United States
- 4School of Biological Sciences, Monash University, Clayton, VIC, Australia
- 5Horn Point Laboratory, University of Maryland Center for Environmental Science (UMCES), Cambridge, MD, United States
Quantifying early life movements is essential to understanding migratory pathways and habitat use that can impact individuals’ success later in life. To gauge how neonatal movements set the stage for later habitat use, we tracked neonate leatherback turtles (n = 94) with acoustic tags from Pacuare, Costa Rica, in 2016 and 2018. We analyzed movements using a first passage time analysis and random walk models, the results of which indicated neonates followed a fixed compass direction as they traveled away from shore and that strong currents in these areas resulted in advection. We combined the tracking data with concurrent environmental variables in a generalized additive mixed model framework. Our results showed the south-east current flow in this area has spatial and temporal structure consistent with large-scale geostrophic currents and not tidal current or local wind speed influences. After accounting for advection by currents, true neonate swimming speed was significantly related to current speed, first passage time, and the year. Neonates had three main response strategies to currents above 0.5 m s–1, with most increasing their swimming speed and the rest maintaining either a constant or decreased swimming speed. Neonates were significantly larger in 2018 than in 2016 but their average swimming speed was not significantly related to body size, indicating that environmental factors were more important contributors to their dispersal. We conclude that abiotic factors, including the strength and direction of the currents, significantly affect the swimming and dispersal strategy of neonate leatherback turtles and these results can help to inform strategies for releases of neonate turtles from hatcheries, future tracking studies, and conservation efforts.
Introduction
Advancements in biotelemetry have helped bridge the gap between animals’ fine and broad-scale movement patterns, opening up new opportunities for the movement ecology of different life stages to be quantified and understood (Nathan et al., 2008). Biotelemetric monitoring is especially important for understanding individuals’ movements in settings where direct observations are complicated or obscured, such as the marine environment. However, the need to attach biotelemetric instruments either directly to, or in, an organism has created limitations for studying the movements of young life stages, which may experience larger tag-to-body size ratios and higher natural mortality rates (Hazen et al., 2012a; Shillinger et al., 2012a). Although satellite tags have become progressively smaller in size and capable of attachment to the larger juvenile life stages for animals such as birds, sharks, sea turtles, and marine mammals (Kjellén et al., 2001; Vincent et al., 2002; Hsu et al., 2007; Weng et al., 2007; Mansfield et al., 2014), their application on the much smaller, dispersing neonate phase is limited. Tagging of this vulnerable life stage has most often been applied to the fledgling stage in birds (Hake et al., 2001; Hake et al., 2003; Kooyman and Ponganis, 2007; Cadahía et al., 2010; Péron and Grémillet, 2013; Vega et al., 2016). This leaves a knowledge gap for many other migratory species, wherein the links between neonate fine-scale distribution and adult long-term movement paths remain unknown (Hays et al., 2010). Characterizing this early life stage is important, as the movement and behavioral responses of neonates to different environmental conditions could potentially have carryover effects on the distribution, energetics, or survival of later life stages (O’Connor et al., 2014).
The habitat uses of adult marine animals has been characterized using biotelemetry in combination with advanced statistical models (Block et al., 2011; Hazen et al., 2012a) but there is a need for the application of these methods to other life stages. Statistical tools such as first passage time analyses can allow for the detection of changes in speed in response to environmental conditions at different spatial scales (Fauchald and Tveraa, 2003) and mechanistic movement models such as random walk models (Turchin, 1998), can provide further insight into behavioral processes and states. The application of such approaches to the movement trajectories of marine species has allowed for migratory and foraging behavior (Bailey and Thompson, 2006; Hurme et al., 2019) and navigational abilities (Girard et al., 2006) to be inferred for adult life stages.
Sea turtles are highly migratory species and research on their dispersal has been biased toward adult breeding females, since they can be satellite tagged on the beach and tracked globally for relatively long periods of time (Hays et al., 2006; Shillinger et al., 2008; Shillinger et al., 2011; Fossette et al., 2014). The behavior and habitat associations of neonate turtles during their early dispersal has been characterized for some species using tracking technology (Okuyama et al., 2009; Gearheart et al., 2011; Thums et al., 2013; Scott et al., 2014; Thums et al., 2016), field observations (Frick, 1976; Lohmann and Lohmann, 1992), and laboratory studies (Lohmann et al., 1990; Wyneken et al., 1990; Goff et al., 1998; Smith and Salmon, 2009). Sea turtles have been shown to disperse from the nesting beach in a non-random fashion (Pilcher et al., 2000), using a mixture of geomagnetic information (Light et al., 1993; Lohmann and Lohmann, 1993; Lohmann and Lohmann, 1994), and environmental cues, such as the direction of surface waves, to set a fixed compass direction into deeper waters (Frick, 1976; Lohmann et al., 1990; Wyneken et al., 1990; Lohmann and Lohmann, 1996; Pilcher et al., 2000). Neonate sea turtles undergo a “frenzy” period of continuous and highly energetic swimming lasting around 24 h during their dispersal from the nesting beach that serves to quickly transpose them into deeper waters (Wyneken and Salmon, 1992). In the small number of studies conducted on neonate leatherbacks, they have been shown to be efficient dispersers during their frenzy stage, with a smaller aerobic scope than other species (Jones et al., 2007), steady swimming speeds, and moderate metabolic rates (Wyneken and Salmon, 1992; Jones et al., 2007; Hoover et al., in press).
Consequently, variability in ocean currents that result in displacement of neonates from their intended path may require different behavioral strategies in response, potentially having long-term carry over effects on their movement and distribution in older life stages (Mansfield et al., 2009; Benson et al., 2011; Shillinger et al., 2012b; O’Connor et al., 2014). Two main hypotheses on long-term carry over effects with respect to neonate and juvenile turtle dispersal have been considered previously: (1) successful dispersal of neonates/juveniles by ocean currents determines where they will forage as adults (Hays et al., 2010; Gaspar et al., 2012; Scott et al., 2014; Lalire and Gaspar, 2019), and (2) successful dispersal of neonates/juveniles into ocean currents determines population abundance at the natal beaches, as seen with regional variation in nesting densities on beaches close to favorable ocean currents (Okuyama et al., 2010; Putman et al., 2010a, 2011; Shillinger et al., 2012b; Putman, 2018; DuBois et al., 2020). The impact of local temporally and/or spatially heterogeneous current structures on the behavioral swimming response of dispersing neonates has not been empirically researched for leatherback sea turtles.
In this study, we collected and analyzed empirical data on Caribbean leatherback neonate dispersal during two years in relation to environmental conditions to address the following hypotheses: (1) there are inter-annual differences in current speeds and thus, neonate swimming speeds, (2) there is spatiotemporal variability in environmental drivers of current speeds and neonate swimming speeds, and (3) that neonate body sizes impact their current-corrected or “true” swimming speeds. Specifically, we acoustically tracked and quantitatively analyzed Caribbean leatherback neonate movement tracks using first passage time and random walk models. We then modeled the effect of the tidal and lunar cycle and changes in current speeds over different times and years in relation to neonate true speeds and tested for significant relationships between neonate true swimming speeds and their body size. These results provide important information for designing future neonate tracking studies, distribution modeling, and informing coastal conservation efforts.
Materials and Methods
Neonate Collection and Study Site
Fieldwork was conducted in waters directly off the shore from Pacuare Nature Reserve in the Limón Province, Costa Rica (Figure 1A). Data from Hoover et al. (in press) collected in 2016 was combined with new data collected in 2018. Atlantic leatherback neonates (n = 94) were obtained from eggs that had been collected from multiple in situ nests in 2016 (n = 42) and 2018 (n = 52). These eggs were then either reburied in a hatchery (n = 60) in Pacuare Nature Reserve or hatched in incubators near the hatchery (n = 34), following the protocol outlined in Williamson (2018). Before trials began, neonates were weighed and standard morphometric measurements (standard carapace length and width, flipper length, and head width) were taken. Neonates were chosen based upon availability and body condition, with only individuals showing healthy body conditions and activity used. Neonates were then tagged an hour prior to release, using Vemco V5-180 kHz transmitter tags that were attached to a 2 m line-float tether set-up and temporarily fixed to the neonates’ carapaces with Vetbond adhesive, following the methods outlined in Hoover et al. (2017) (Supplementary Figure S1).
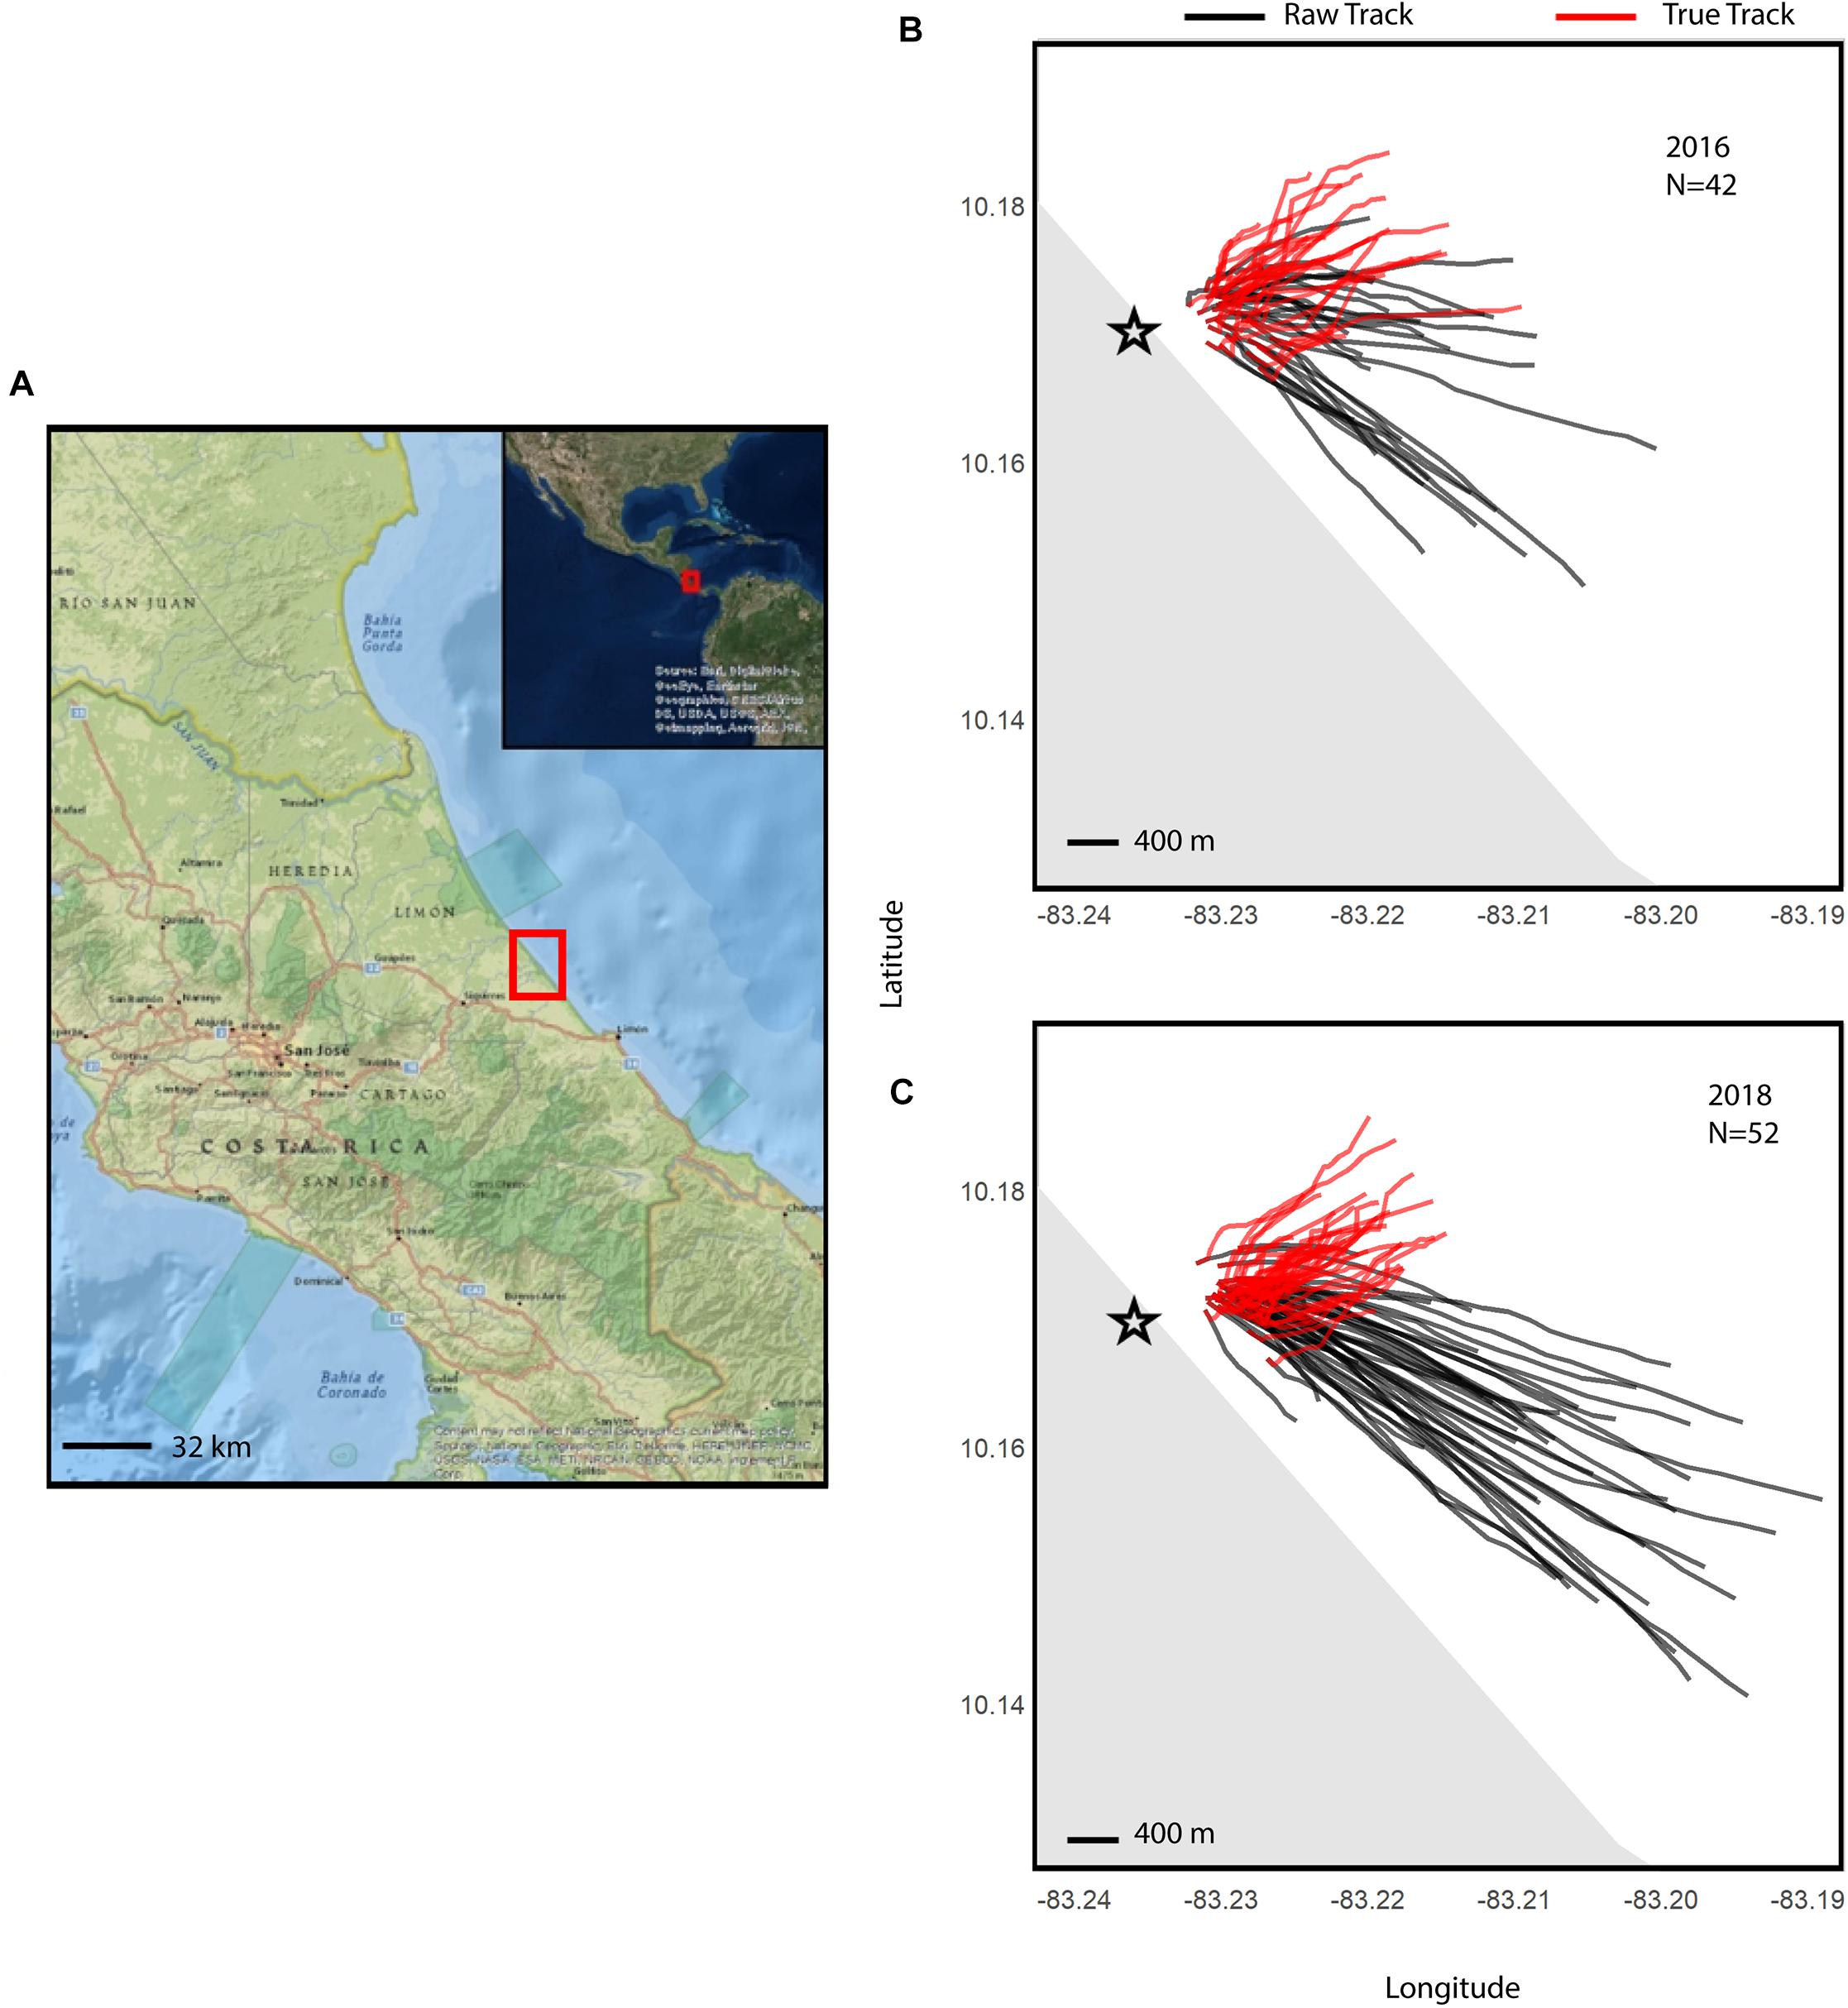
Figure 1. Maps of neonate tracks off the shore of Pacuare Nature Reserve, Costa Rica (A) for 2016 (B) and 2018 (C), with the reserve location indicated with a red box. Maps of true neonate tracks (red), were plotted using their heading and true swimming speeds, and raw neonate tracks (black). The black star shows the hatchery where turtles would emerge naturally from. The basemaps for this figure were created using ArcGIS® software by Esri. ArcGIS® and ArcMAPTM are the intellectual property of Esri and used under license, copyright © Esri, all rights reserved.
Acoustic Tracking
Acoustic tracking was conducted from a small (6 m) powerboat from August to September in 2016 and from July to August in 2018, time periods which reflected peak emergence for neonates and were chosen based on accessibility to the field site. Tracking began around 400 m from the shore to be outside of the surf zone, where neonates could not be tracked with the boat and where high predation occurs (Gyuris, 1994; Pilcher et al., 2000; Wyneken et al., 2000; Wilson et al., 2019). Tracking took place in front of the hatchery to mimic as realistically as possible the path the neonates would have taken if dispersing naturally from the hatchery. Tracking was conducted during daylight hours (0600–1600 h), beginning at different times and tidal states. Although neonates often emerge at night, they are also known to depart during the daytime and previous neonate tracking and observational studies have been performed successfully during the day (Frick, 1976; Lohmann and Lohmann, 1992; Okuyama et al., 2009; Scott et al., 2014). Additionally, due to neonates being in their continuous swimming “frenzy” stage during the entire period of our study, we did not anticipate any difference in swimming behavior during the day versus at night. After tagging, each neonate was brought onto the boat and released from the same location (∼400 m offshore, outside of the surf zone, and directly in front of the hatchery, with some variation depending on where the hatchlings were placed in the water relative to the boat) and tracked individually with a Vemco VR100 acoustic receiver and a VH180-D-10M directional hydrophone for as long as weather conditions and neonate availability permitted, generally 30–120 min. Releasing the neonates past the surf zone ensured that the swimming trajectories of the neonates were not directly influenced by nearshore waves and the bottom topography, but instead by surface currents. The boat remained behind neonate turtles at a distance of approximately 20 m, and all positions were recorded with the receiver. At 15-minute intervals along each track, a Holdpeak 866B hand-held digital anemometer was used to collect wind speed. A Barska 7 × 42 WP range-finder monocular and Plastimo Iris 50 hand-held compass were used to determine the distance and bearing of the neonates from the boat to ensure accuracy of recorded neonate positions. At the end of the tracking period for each neonate, the turtle was recovered, the acoustic transmitter and tether removed, and the turtle was released. All procedures were approved by the University of Maryland Center for Environmental Science’s Institutional Animal Care and Use Committee (IACUC) (Research Protocol No. S-CBL-16-11 for 2016, Research Protocol No. S-CBL-18-02 for 2018) and the Costa Rica Ministerio de Ambiente y Energia, Sistema Nacional de Áreas de Conservación (SINAC), and Área de Conservación La Amistad Caribe (ACLAC) (R-SINAC-ACLAC-PIME-VS-R-022-2016, R-SINAC-ACLAC-PIME-VS-R-025-2016, R-SINAC-PNI-ACLAC-045-2018).
Surface Drifters
Surface drifters were constructed following a similar method to Hoover et al. (in press). These drifters had over two meters of line connected to a metal drogue and a bright orange flag on the top that increased visibility but was also heavy enough to lay horizontally on the surface; the drifters were tracked using a GPS-enabled phone (Supplementary Figure S2). To minimize the wind-induced movement of the drifters (slippage), the drifters had a large submerged to unsubmerged ratio (Niiler and Paduan, 1995; Lumpkin and Pazos, 2007). These surface drifters were deployed every 20–30 min along the tracks, when the weather permitted, to determine surface current speeds.
Processing of Acoustic Tracking Data
All data processing and analysis was conducted using R statistical software (R Core Team, 2018). Each neonate turtle and drifter track were divided into regular 5-minute position intervals. Neonate and drifter data were then merged on their matching time stamps for each position. Neonate positions were corrected using bearing and distance of the neonates from the boat for each 5-minute time point of the tracks. Raw track speed of both the neonates and drifters was found by taking the distance traveled between each point divided by the time duration between points. The “geosphere” R package (Hijmans et al., 2019) was used to find the bearing of each neonate and drifter point.
True neonate swimming speed (termed “in-water swimming speed” by Hoover et al., in press), which accounts for the effect of the currents on the neonate swimming speed, was found by using the raw track speed of the neonates (SN) and the heading in radians (Θ) to determine the neonate east-west (uN) and north-south (vN) speed components (1–2) (Bailey and Thompson, 2010; Hoover et al., in press). The drifter east-west (uD) and north-south (vD) speed components were found using similar equations, but using the raw track speed and direction of the drifters instead of the raw track speed and direction of the neonates. The final true speed (VN) for each neonate position point was found using equation (3). Neonate true headings (ΘT) were derived from taking the arc tangent of the absolute difference in neonate east-west and north-south speed components with drifter north-south and east-west components (4).
Time of day for each data point was classified as either morning (0600–0900 h), late morning (0900–1200 h), afternoon (1200–1400 h), or late afternoon (1400–1600 h).
It is worth noting that in computing the true headings of the neonates, wave, wind, and inertial influences could differentially impact the neonates and the drifters. However, inertial influences are unlikely to be important, as the mean size of the neonates gives them an effective radius that minimizes inertial effects to less than 5° of the deflection angle (Beron-Vera et al., 2015; Brooks et al., 2019) and at the modest wind speeds measured (1–5 m s–1), assuming a 0.27% windage effect calculated from a similar drifter (Meyerjürgens et al., 2019), the error associated with the windage would be (0.0027–0.0135 m s–1), which is orders of magnitude smaller than the neonate swimming speeds. Wave influences, or Stokes drift, would be aligned onshore in these nearshore waters and perpendicular to the isobaths and would potentially hinder the neonate’s offshore trajectory and slow their swimming speed. However, recent work in the Gulf of Mexico suggests that the summertime Stokes drift has a sharp maximum in probability distribution in inshore waters of depths less than 100 m at 0.01 m s–1 (Clark, 2015), and even in hurricane conditions the median drift was only 0.03 m s–1. Thus, over the short time scales of these experiments, the drifter and neonate motions are only very weakly influenced by these effects and this influence is within measurement error.
First Passage Time Analysis
To determine where neonates were spending more time along their track within a given spatial radius, a first passage time (FPT) analysis was conducted. The R package “adehabitat” (Calenge, 2006) was used to calculate the FPT in hours for each neonate position. After accounting for a 5-minute acclimation period at the beginning of each track, the minimum and maximum step length for each of the tracks was used to develop a range of radii. For each neonate track, the log-transformed variance in FPT was then calculated and used to identify the peak in variance and associated radius of interest. The mean radius was calculated by averaging the radii of interest across tracks, and this overall spatial radius was then used to determine the FPT for every position within each individual track.
Random Walk Models
Random walk models can be used as a null hypothesis of movement, as they assume an individual is moving through its environment randomly with independent distributions of move lengths and angles and no correlation between current and previous positions. The net squared displacement (NSD), or the squared distance between each position along a track and the first position of the same track, can be used to determine whether an individual is following a correlated random walk (each position is correlated with the previous position), or biased random walk (each position has a directional bias). To test whether each of our individual neonates were moving randomly in their dispersal phase or following a fixed compass direction (biased random walk) as they left the shore, the net squared displacement (NSD) was calculated for each current-corrected position for each neonate (see section “Processing of Acoustic Tracking Data”). The NSD’s were found for each of these true neonate tracks by taking the distance between each position along a track and the first location and squaring it. NSD for true tracks was then compared to the NSD expected for a correlated random walk (CRW) and a biased random walk (BRW). The expected CRW and BRW NSD’s were calculated using the following equations (Turchin, 1998):
Where n is the number of moves from the first location, m1 is the mean step length, m2 is the mean squared step length, θ is the mean cosine of absolute move direction, and c is the mean cosine of the turning angles (the angle between sequential moves).
Environmental Drivers of Current Speed Variability
To determine environmental drivers of current speed, and therefore any inter-annual or spatial differences that could impact neonate dispersal, a generalized additive mixed model (GAMM) was fit to the 2016 and 2018 data. This model predicted the speed of the local currents (derived from the raw track speed of the drifters) as a function of local wind speed and the categorical variables of lunar cycle phase (classified as spring tide conditions or full and new moon phases; neap tide conditions or quarter moon phases; and mid-tidal conditions or 3 days before/after full, new, and quarter moon phases), time of day, year, and tidal current direction (classified as ebb, flood, or slack, with slack being within 15 min of high/low water). Tidal data were obtained for the surrounding region of Limón, Costa Rica (10.00°N, 83.03°W), which experiences a mixed semi-diurnal tidal cycle (from Mobile Geographics) LLC©1. A smoothed interaction function of latitude and longitude was included to account for spatial autocorrelation present in current speed. Exploratory analysis using backward model selection and F-tests to remove non-significant terms and compare terms with and without the non-linear smooth of latitude and longitude indicated the presence of non-linear relationships, indicating a GAMM approach was appropriate. Individual drifter tracks were included as random effects to account for correlation in current speed within each track.
All GAMMs were fit in R using the “mgcv” package (Wood, 2011). The error distribution for the current speed model was Gaussian with an identity link function, and the smoother terms for the interaction of latitude and longitude were fit using penalized regression splines. Backward stepwise model selection was used to select the final model, using Akaike information criterion values (AIC) and only retaining variables with significant p-values (p < 0.05). Model assumptions were checked using a plot of the standardized residuals versus fitted values and auto-correlation function (ACF) and partial auto-correlation function (PACF) plots of the standardized residuals.
To determine the environmental drivers of nearshore current flows measured by the drifters and if they were impacted by large-scale geostrophic current flows, geostrophic current velocity was calculated using extracted mean values for 2016 and 2018 to explore variations in external forcing in each year. For geostrophic current velocity, the delayed time, global altimetry dataset from the AVISO + Live Access Server (LAS2) was used to create plots for the weeks of the 8th August 2016 and the 6th August 2018 for absolute geostrophic vector velocity for the grid area 88° to 75° W and 7° to 19° N. These dates were chosen based on availability from the LAS dataset and that the second week of August was a shared week of neonate tracking for both 2016 and 2018; as these plots reflect large-scale geostrophic currents, the week chosen for the dataset did not change the velocity patterns observed.
Generalized Additive Mixed Model for Neonate True Speed
We fit a GAMM to examine how neonate true speed was influenced by FPT (derived from the neonate raw tracks), local current speed and direction (derived from the drifters raw track speed and direction), tidal current direction, lunar phase, wind speed, year, latitude and longitude, and time along the track. The GAMM was fit after using a backward model selection exploratory analysis to compare term significance with and without non-linear smooths to determine that non-linear relationships were present. Current speed, FPT, and the interaction of latitude and longitude each had non-linear smoother terms. Individual neonates were included as random effects to account for correlation in true neonate speed within each track. The error distribution was Gaussian with an identity link function, and the smoother terms for the interaction of latitude and longitude were fit using penalized regression splines. The smoother terms for current speed were estimated by building departures for each individual neonate from a common smooth, using a factor smooth interaction and five basis functions (k = 5) to avoid over-fitting. This allowed for random curves to be built for each neonate, using splines that share the same smoothing parameters and an un-penalized null space. Model selection was performed in the same manner as for the current speed GAMM.
To rule out whether neonates were responding to changes in the environmental conditions they encountered or simply to natural variation in behavior from the time spent swimming, we ran an additional linear mixed effects model predicting the variance in swimming speed for the neonates as a function of time along their track, with individual neonates included as random effects and controlling for the speed of the currents. The variance in swimming speed was extracted as residuals from the final chosen GAMM model fit for the neonates and the time along their track was represented by move number, as each track was broken into regularized 5-minute time steps.
Body Morphometrics and Neonate True Speed Analysis
A principal component analysis (PCA) was used to derive an index of neonate body size, using the body morphometric variables which demonstrated covariance (carapace length, body mass, carapace width). The first principle component was extracted and used as a neonate size index (Burgess et al., 2006). This index was used to compare variability in body size between years and nest treatments (incubator versus hatchery nests), using independent t-tests.
A linear mixed effects model was fit in R using the “nlme” package (Pinheiro et al., 2020) to determine if there was a relationship between neonate body size, represented by the PCA-derived size index, and their average true swimming speed. The year and treatment of origin (incubator versus hatchery nest) were used as random effects in the model after a stepwise model comparison. Neonate swimming speed was standardized for the body length of the neonates by dividing their average true swimming speed by their carapace length. Model assumptions of normality and independence were checked using residual plots.
Results
Acoustic Tracking
A total of 27 neonates tracked from hatchery nests and 15 from incubator-hatched eggs in 2016, and 33 neonates tracked from hatchery nests and 19 from incubator-hatched eggs in 2018. Drifters were deployed for the majority of neonate tracks (n = 76) to determine current speed and direction. Average values for track distance and duration, current speed, raw track and true neonate speed, current direction, and raw track and true heading of all neonates in each year are reported in Table 1, demonstrating any inter-annual differences in current speeds or neonate trajectories. Current speeds in 2018 were higher on average than in 2016, but neonate true speed was similar during the 2 years. The mean current directions and raw track headings of the neonates had a strong south-east direction both years, but neonate true headings were in a more north-east direction and similar between years (Table 1 and Figures 1B,C).
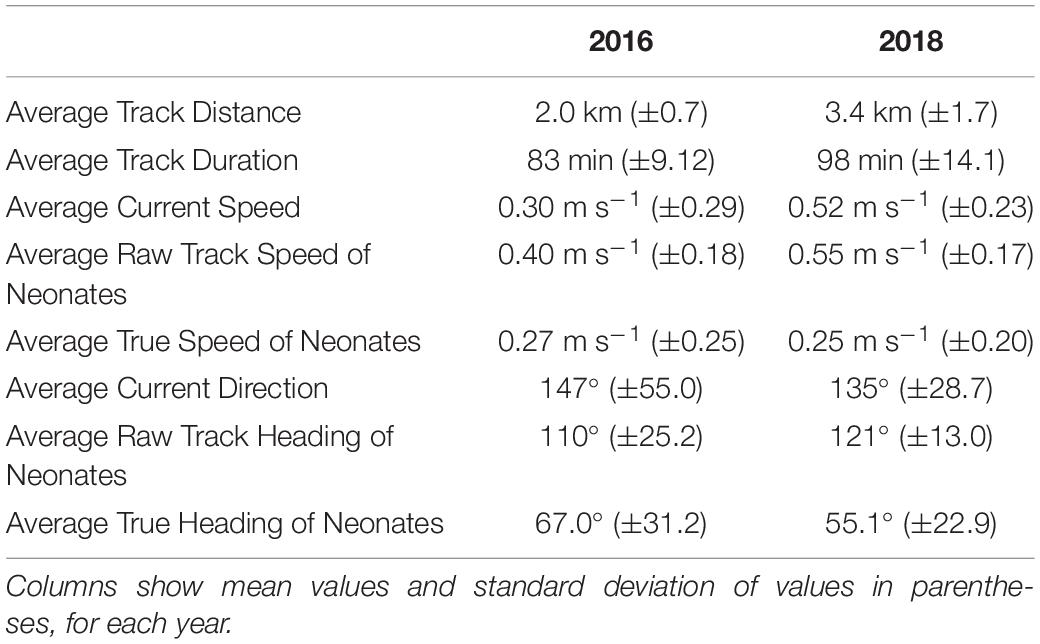
Table 1. Summary statistics for 2016 (see Hoover et al., in press) and 2018 neonate tracking trials.
First Passage Time
A radius of 59 m (±57 SD, range 5–228 m) was the mean spatial scale of interest for the neonate tracks (n = 94). Plots of the FPT over time for each track at this scale indicated that the majority of tracks had a higher FPT in the first third of the track (Figure 2A and Supplementary Figure S3), even when a 5-minute acclimation period was accounted for. Lower FPT values coincided with higher values for true speed of the neonates (Supplementary Figure S4). The higher values for FPT observed in the first third of each track reflected some spatial variability in FPT, with areas nearshore having higher FPT values and areas farther from shore having lower FPT values (Supplementary Figure S3).
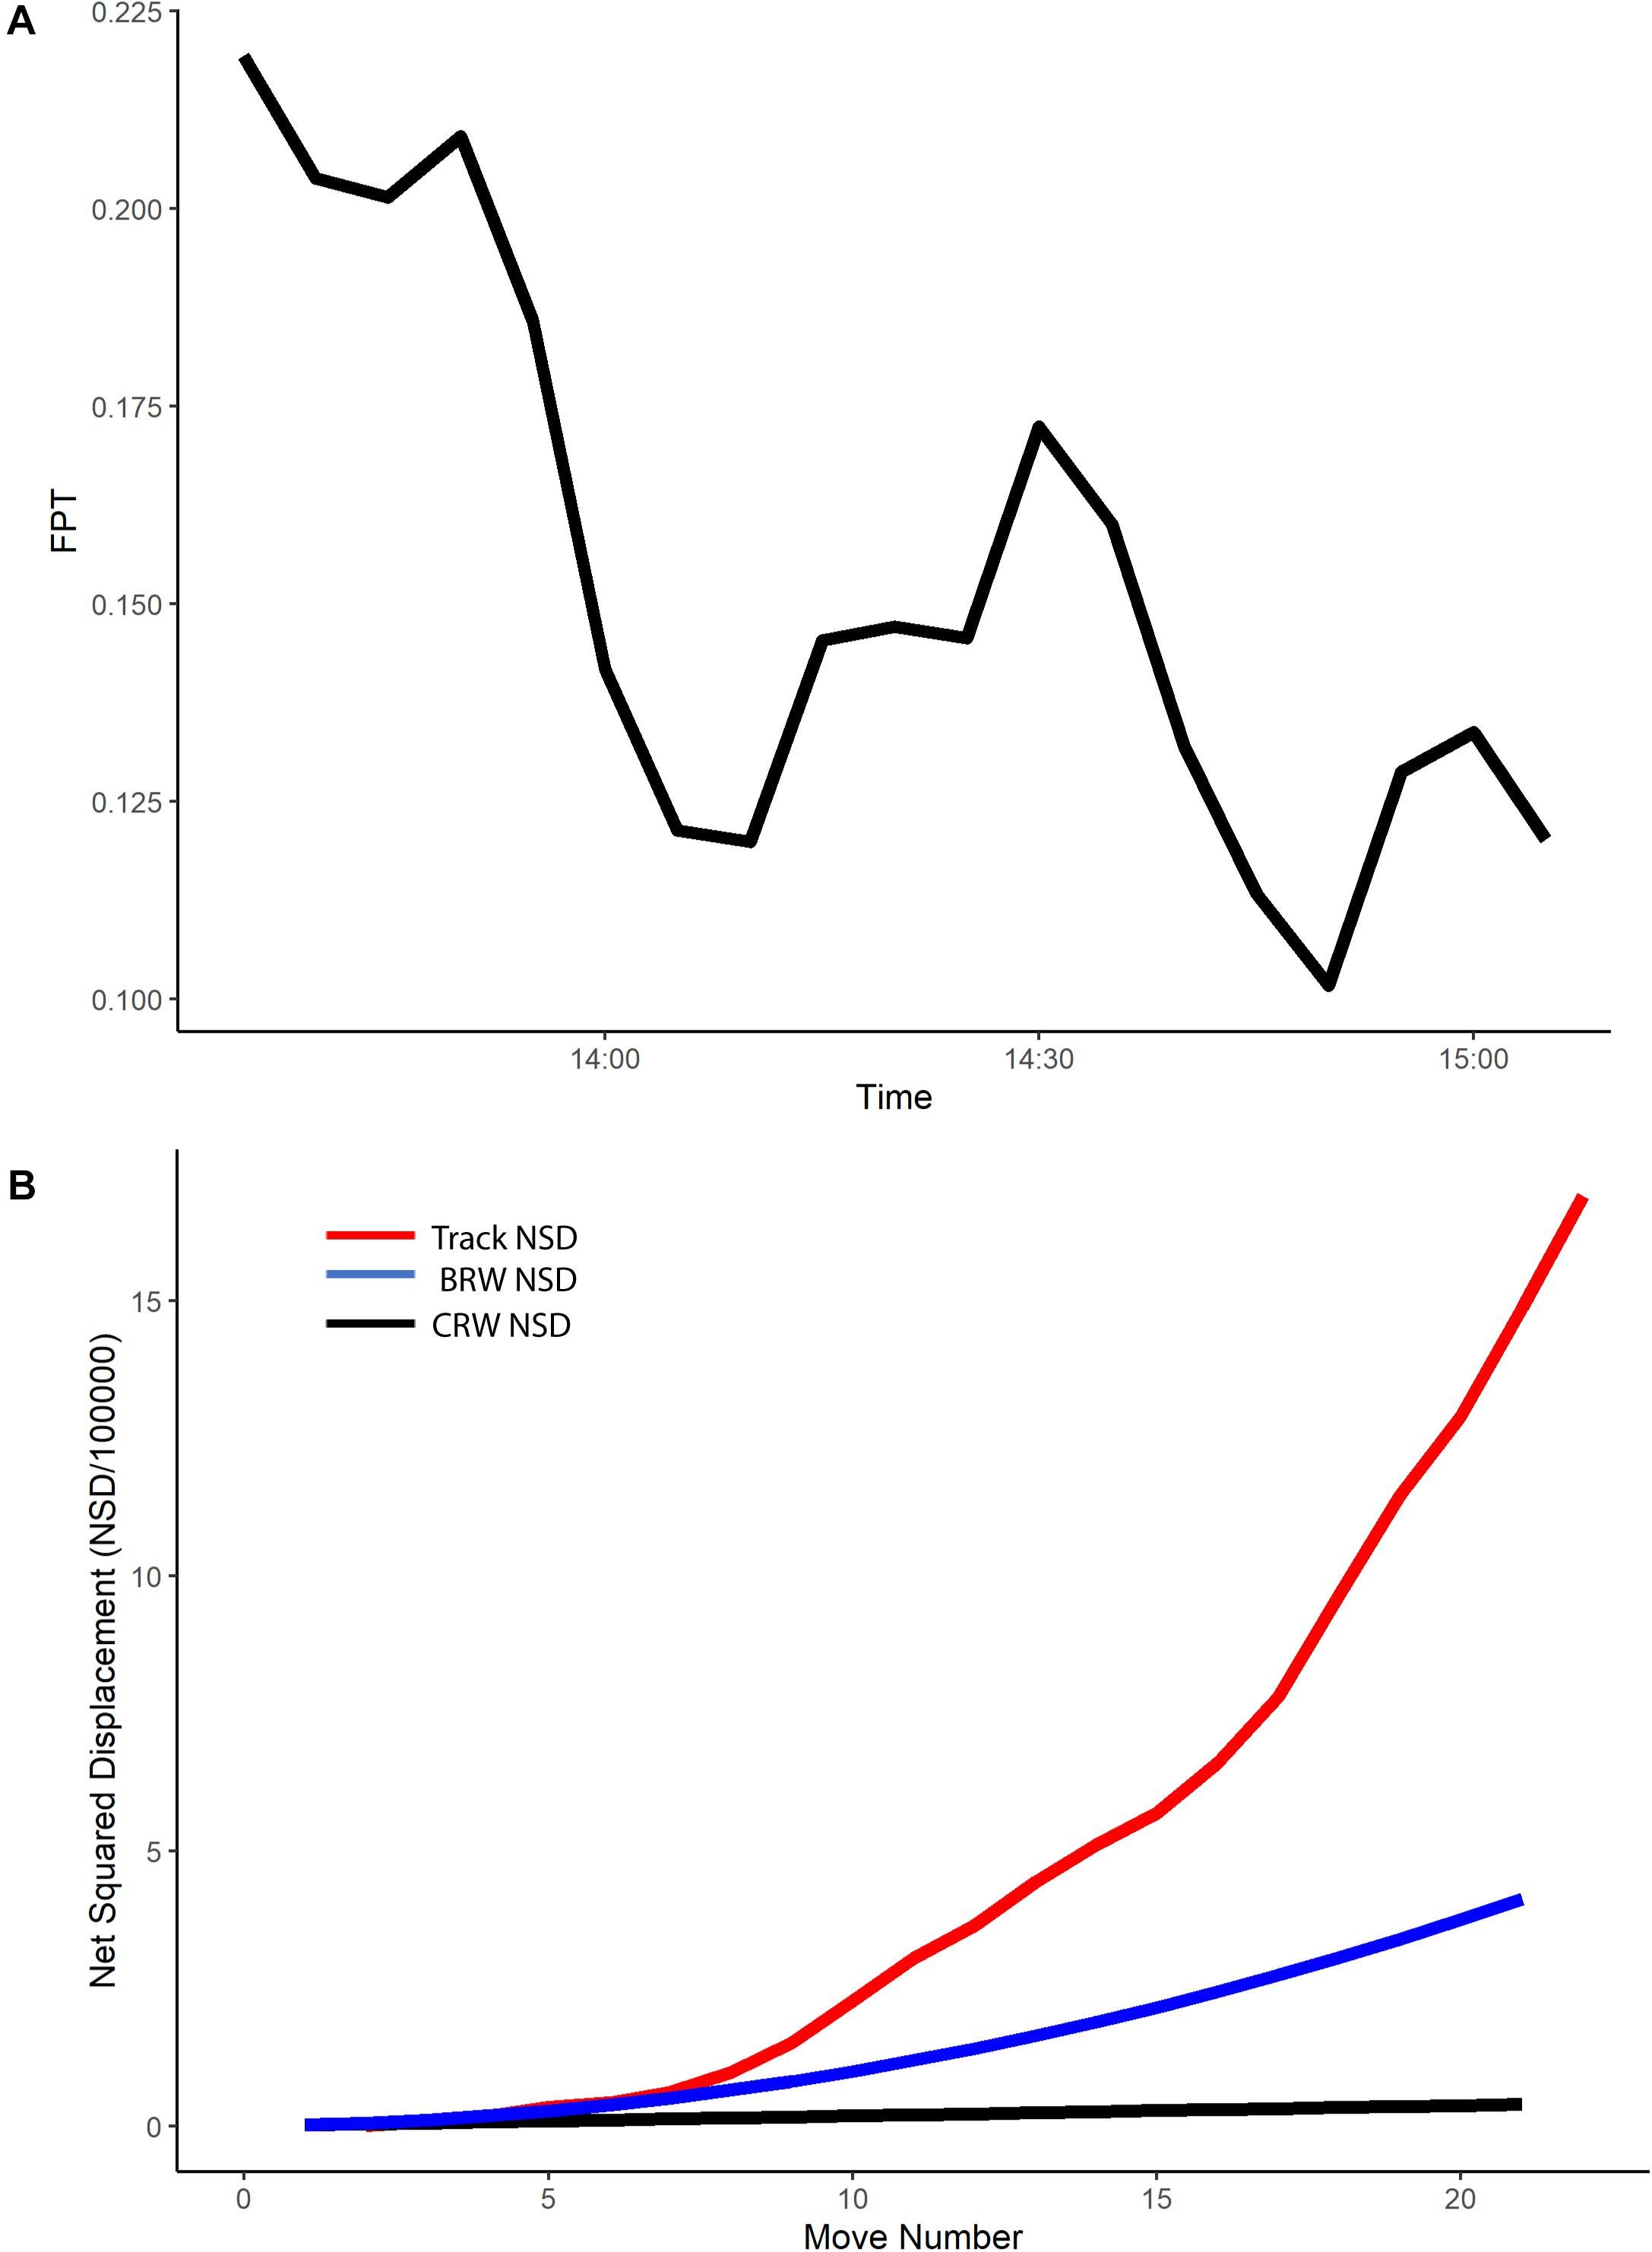
Figure 2. For example neonate track (ID no. E5): (A) First passage time (FPT, hours) versus time, and (B) Net squared displacement (NSD, m2) versus move number for example neonate track. The red line represents the NSD for the true neonate track, the blue line the expected NSD for a biased random walk (BRW), and the black line the expected NSD for a correlated random walk (CRW).
Random Walk Models
All neonate true tracks during 2016 and 2018 followed a BRW during the first five move numbers, with an NSD following that expected with a BRW (example track shown in Figure 2B), indicating that the neonate current-corrected positions had a directional bias consistent with the movements of an animal with a fixed compass direction. However, plots of NSD for true tracks showed they had a greater NSD than predicted for a BRW with move numbers higher than five (Figure 2B), indicating that they were moving quicker than expected away from their release point with directed movement.
Inter-Annual Variability and Environmental Drivers of Current Speeds
Drifter-derived current speed (41 drifter tracks in 2016 and 93 drifter tracks in 2018) had a south-east orientation and significant inter-annual and spatial variability (Table 2). Current speeds in the 2018 study period were significantly higher than 2016 (p-value < 0.0001, Supplementary Figure S5). The significant interaction smoother for latitude and longitude in the GAMM showed currents had significant spatial variation in both years (p-value < 0.0001, Table 2), with lower current speeds nearshore (∼300–1,000 m from shore) and higher current speeds farther from shore (∼1,800–3,800 m from shore) (Figure 3B). Nearshore drifter-derived current speed and direction was broadly consistent with large-scale geostrophic current flow, suggesting that the inter-annual variations in large-scale current flow are relevant to nearshore current processes in our tracking area. For the geostrophic current velocity, there were stronger currents in 2018 than in 2016 within the spatial area of the obtained data within the south Colombia Basin (Figure 3A), with a higher mean absolute vector velocity of 0.646 m s–1 in 2018 compared to 0.578 m s–1 in 2016.
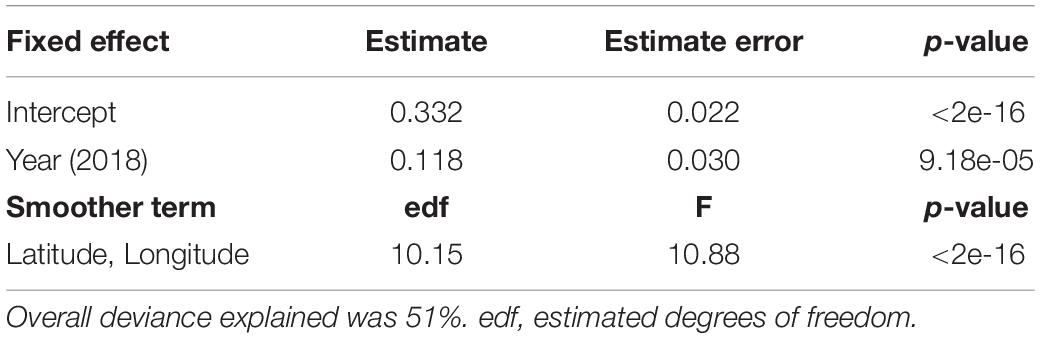
Table 2. Results of a generalized additive mixed model (GAMM) for current speeds (m s–1, Gaussian error, identity link function) in relation to year (2016 as the reference level to 2018) and the interaction of latitude and longitude, with each track included as a random effect.
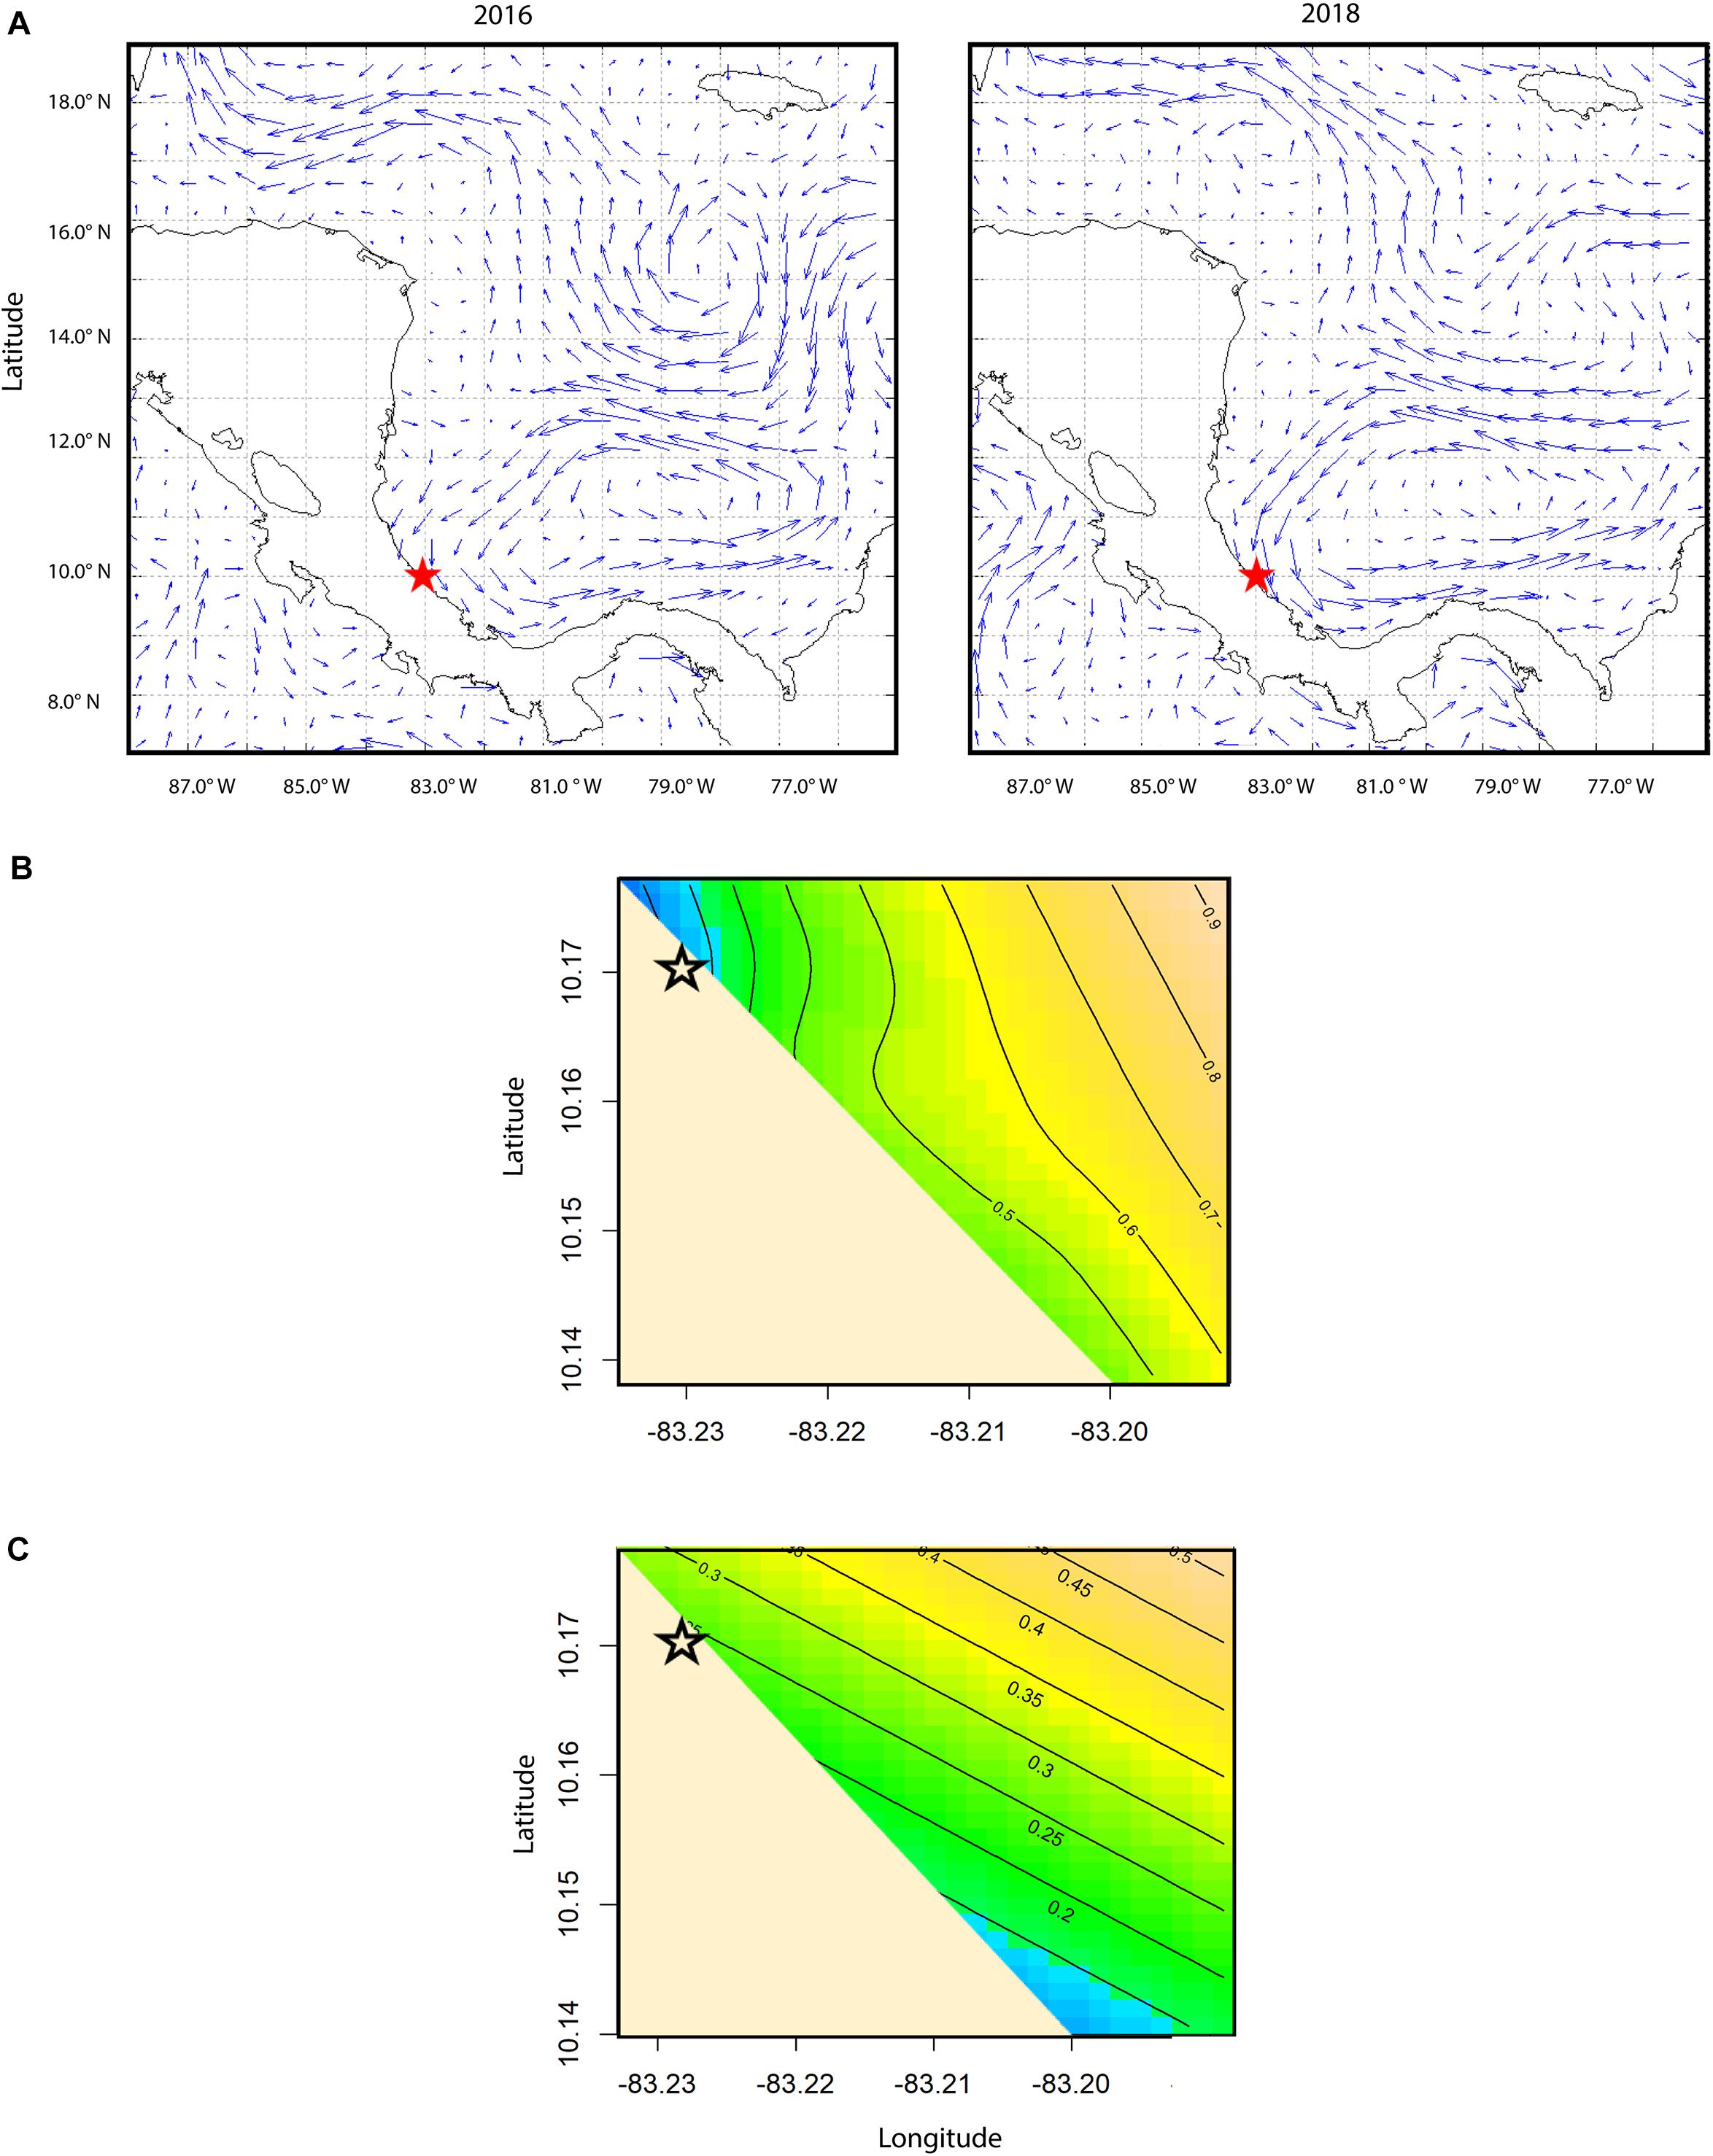
Figure 3. (A) Plot of delayed mode absolute geostrophic current velocity vectors with the study site in Pacuare, Costa Rica (red star). Plot on the left is for the week of August 8th, 2016, and plot on the right is for the week of August 6th, 2018. Mean velocity was 0.665 m s− 1 for this time period in 2018 and 0.552 m s− 1 for this time period in 2016. Plots were created using the AVISO + satellite altimetry data Live Access Server (LAS). (B) Spatial contour plot of the raw track speed of the current, with higher values shown in yellow and lower values shown in blue. Black lines show contours of current speed as output from a generalized additive mixed model predicting current speed as a function of year and smoothed interaction of latitude and longitude. (C) Spatial contour plot of neonate true speed (m s− 1), with higher values shown in yellow and lower values shown in blue. Black lines show contours of true neonate swimming speed as output from a generalized additive mixed model predicting neonate true swimming speed as a function of year, current speed (m s− 1), first passage time, and the smoothed interaction of latitude and longitude.
Environmental Variables and Neonate True Speed
Significant spatial autocorrelation for neonate true speed was seen in plots of the residuals, indicating the need for an autoregressive correlation structure. A model selection process using AIC values revealed that the best model was neonate true speed as a function of year and non-linear, smoothed variables of current speed and FPT (Table 3), with an autoregressive-moving-average (ARMA) lag 1 correlation structure.
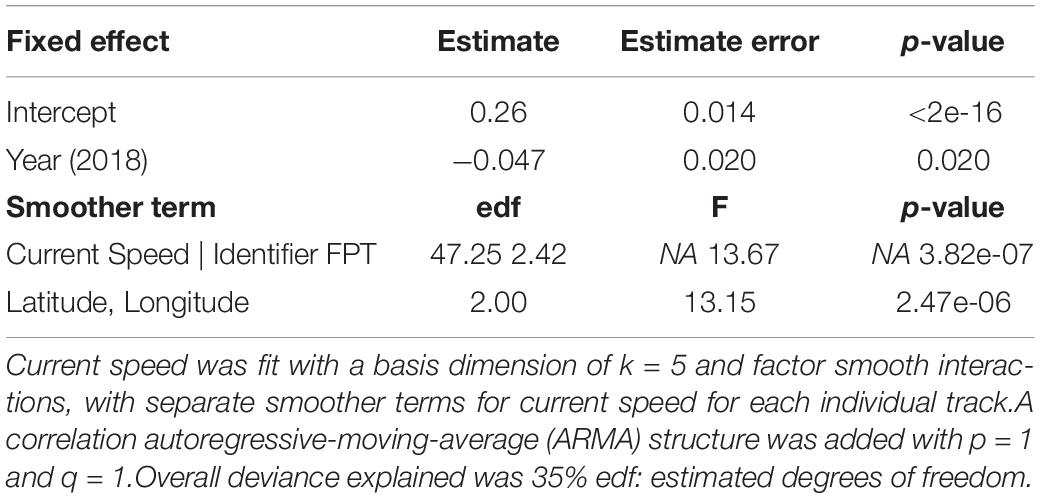
Table 3. Results of a generalized additive mixed model (GAMM) for neonate true speeds (m s–1, Gaussian error, identity link function) in relation to year (2016 as the reference level to 2018), first passage time (FPT), and the current speed (m s–1), with each individual track included as a random effect (“Identifier”).
Neonates swam at a steady speed until current speeds reached 0.5 m s–1. A plot of the smoother for neonate true speed versus the current speeds showed three different response strategies to high current speed conditions (>0.5 m s–1). Most individuals had speeds that increased rapidly in positive association with the currents (n = 41), while others maintained either a constant swimming speed (n = 14) or had a negative association (n = 21) between their swimming speed and the currents (Figure 4A). Neonates that increased their swimming speed in response to high current speed conditions had tracks with directions that deviated in a northerly direction from the currents, while those with a decrease or constant response strategy had tracks that were more closely matched with the direction of the currents (Figure 4B). This was further evidenced with an increase in current speed resulting in a greater difference in neonate north-south and east-west vector components compared to current vectors (“Mean Difference in East-West/North-South Vectors,” Table 4). The neonates’ north-south vector components were stronger when currents were faster, indicating that they were swimming in a more northerly compass direction in faster current speeds (Table 4). Individual variation in neonate swimming response to the currents for both years resulted in the standard deviation of the neonates’ true compass headings (24°) being greater than the standard deviation of their raw track compass headings (20°), despite a consistent mean north-east trajectory (mean true heading of 56°).
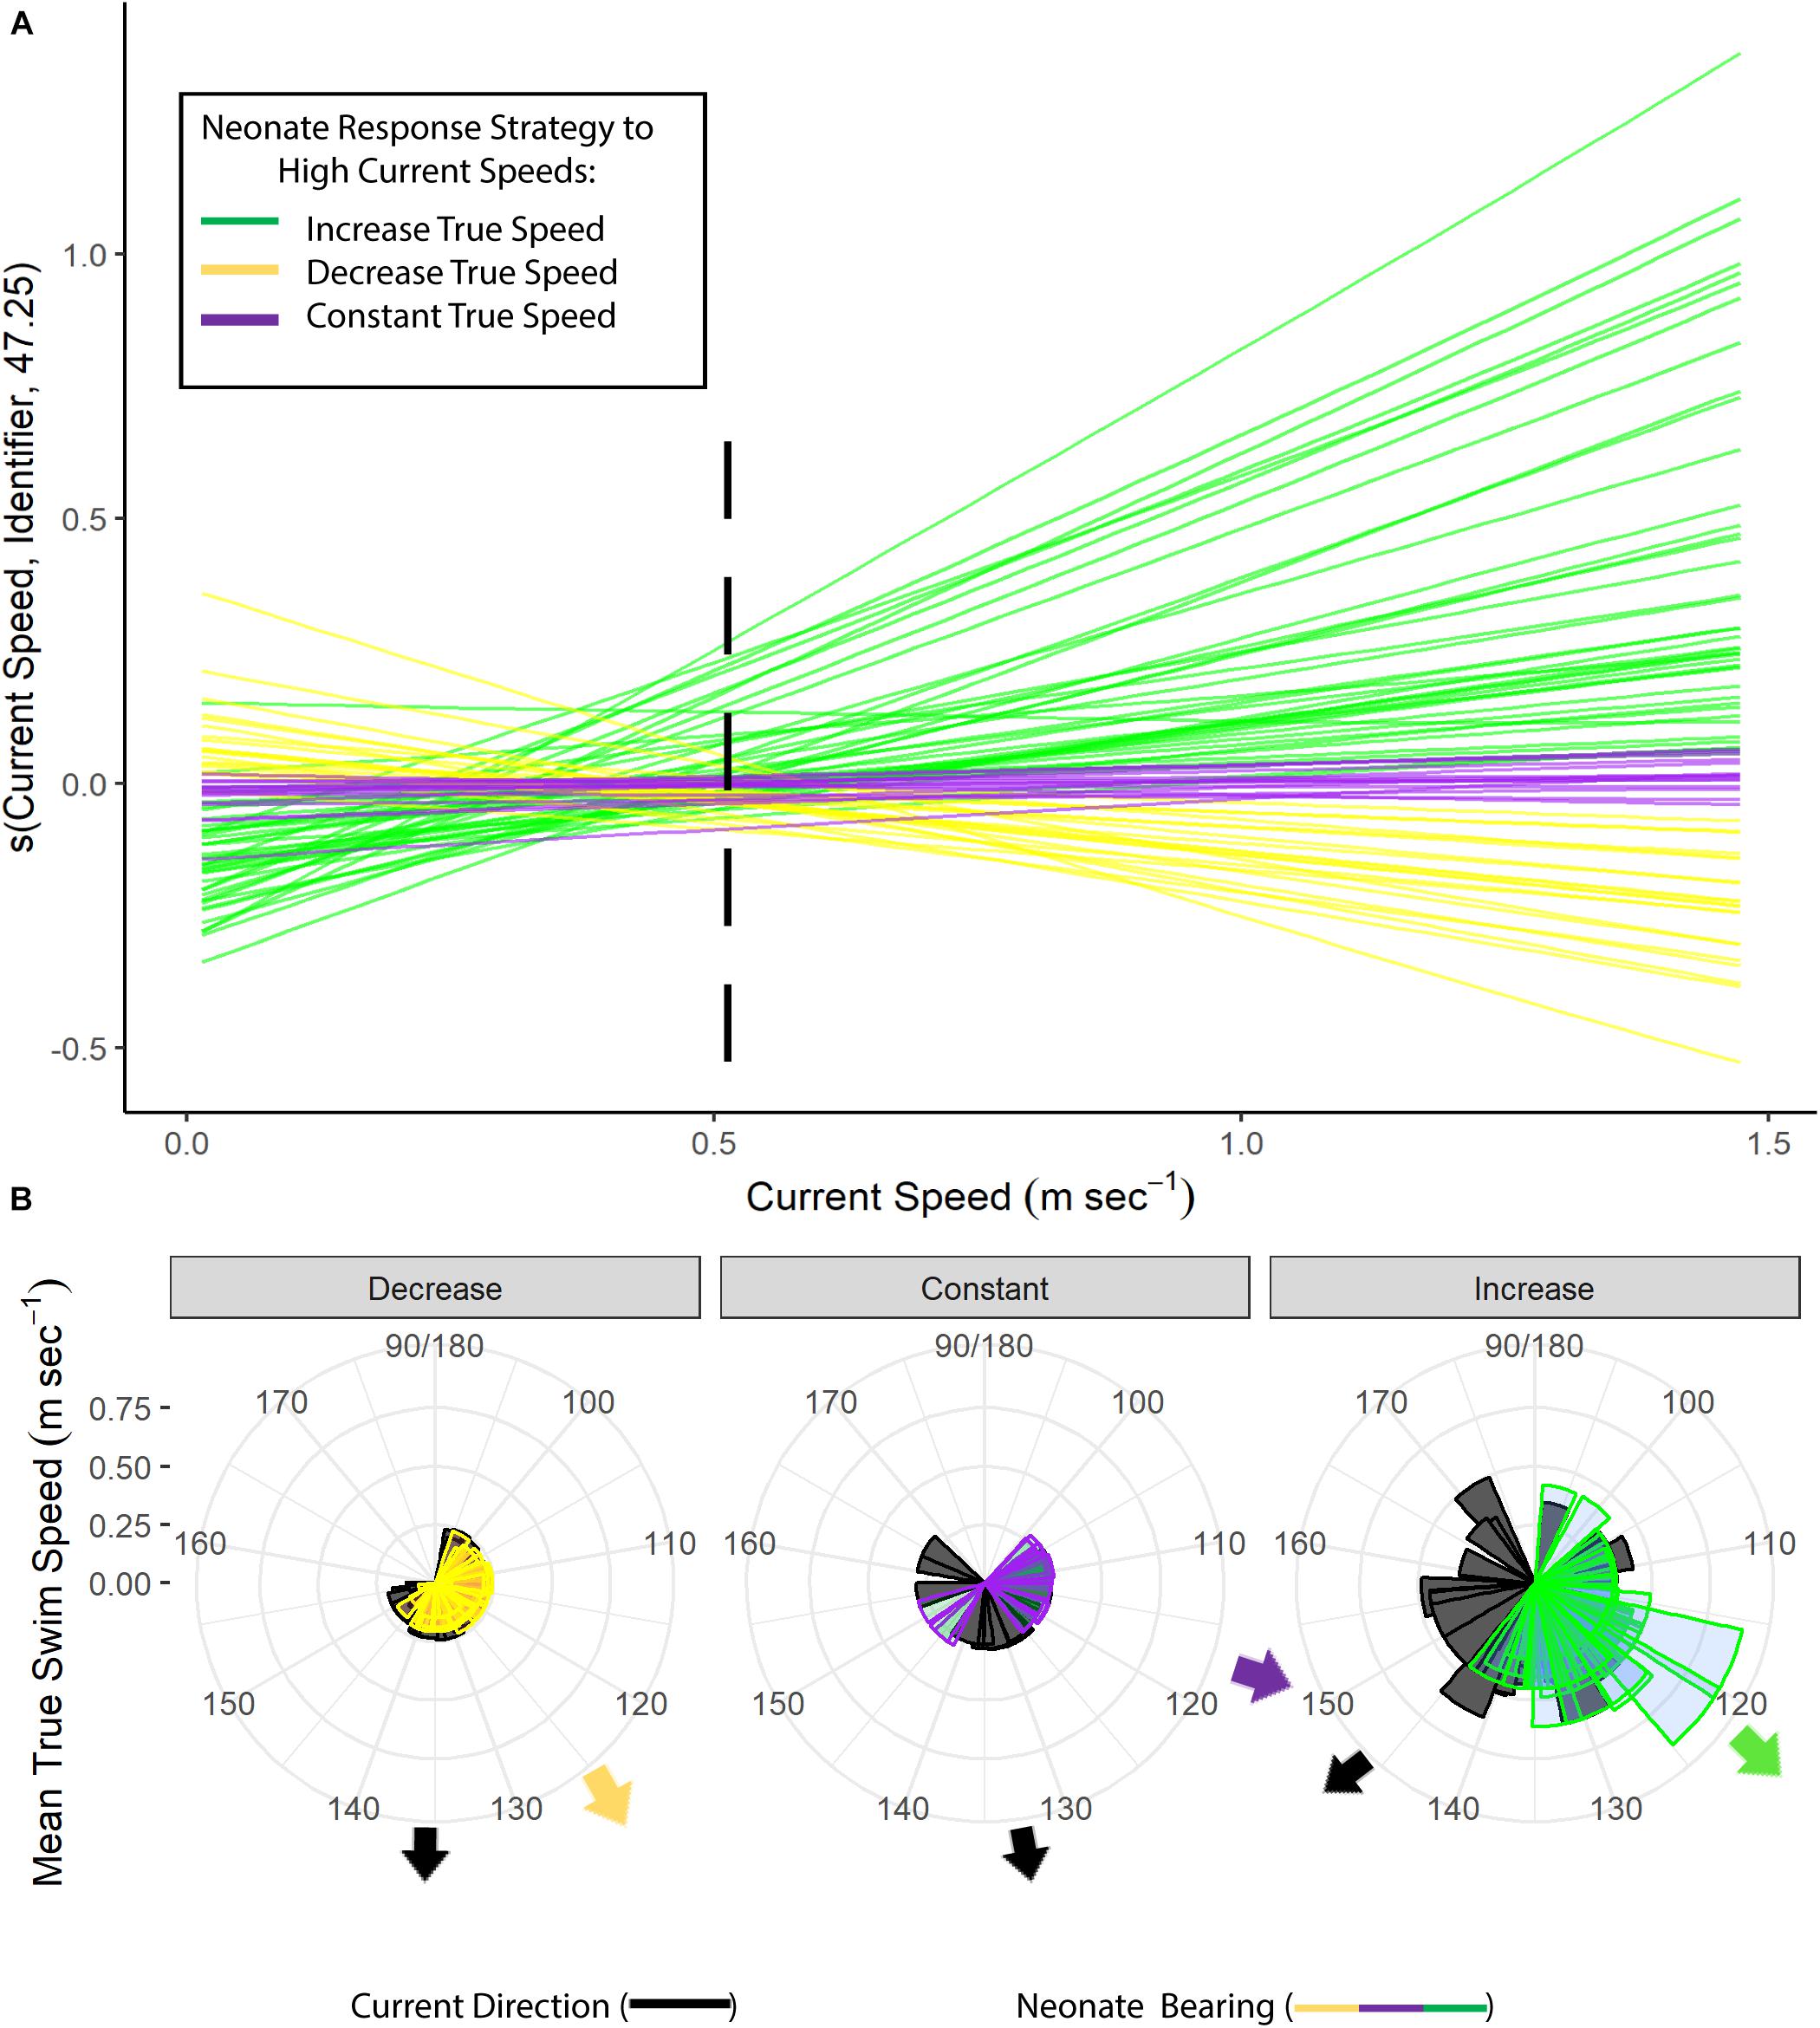
Figure 4. (A) Generalized additive mixed model (GAMM) smoothing curve for current speed (m s− 1) as a function of neonate true swimming speeds for 2016 and 2018, with an estimated random departure from the mean true speed trajectory for each neonate represented by colored lines and k = 5 basis functions. Each color represents the response strategy of each neonate to high current speed conditions (>0.5 m s− 1): mean increase in true speed (green), mean decrease in true speed (yellow), or no change in mean true speed (purple). The threshold for high current speed conditions is shown with a black dashed line. (B) Rose plots for the frequency of mean neonate true swimming speed plotted by neonate raw track bearing or current direction. Colors represent neonate raw track bearing for each swimming speed response strategy in currents greater than 0.5 m s− 1 (decrease/yellow, constant/purple, increase/green), and black represents current direction for current speeds greater than 0.5 m s− 1.
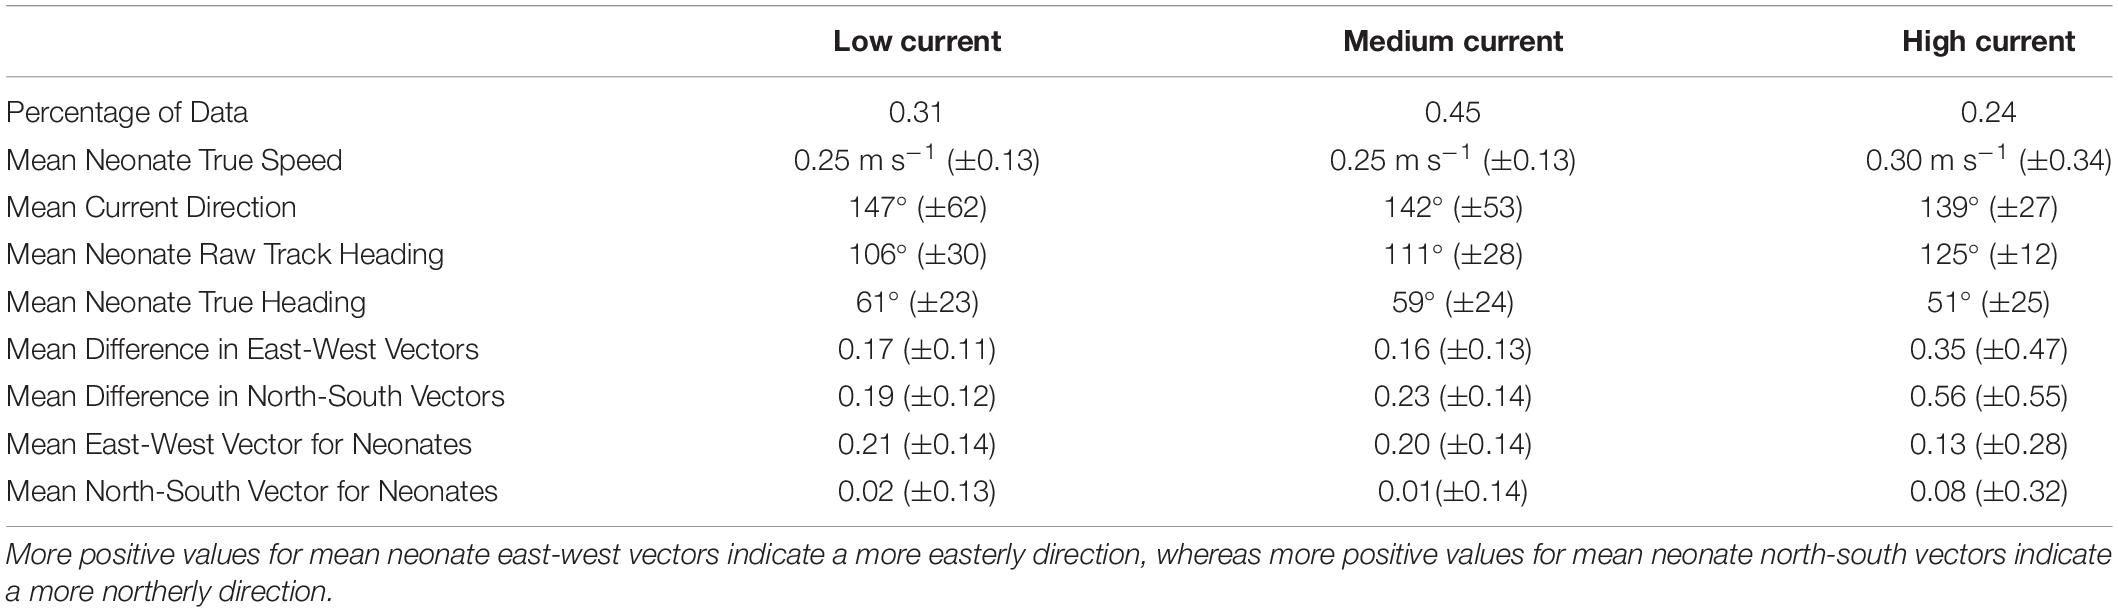
Table 4. Mean and standard deviation values (in parentheses) for true neonate swim speed, current speed, current direction, neonate raw track and true heading, mean difference in north-south and east-west vector components for neonates and the current, and mean north-south and east-west vector components for neonates for different current speed categories (low < 0.3 m s–1, medium 0.3–0.5 m s–1, high > 0.5 m s–1).
Further supporting these results in individual responses to high current speed conditions, the linear mixed effects model for the variance in swimming speed as a function of time spent swimming for the neonates showed no significant positive linear relationship (Supplementary Table S2 and Supplementary Figure S7).
Even though individual variability was present in responses to high current speed conditions, neonates at the population level maintained a consistent mean swimming speed between years, with a mean speed of 0.27 m s–1 in 2016 and 0.25 m s–1 in 2018 (Table 1). The significant interaction smoother for latitude and longitude in the GAMM indicates neonates had spatial structure to their swimming speed (Table 3). This reflected the spatial structure seen in the current speeds, with neonates swimming faster in areas farther from shore (Figure 3C). This was further confirmed with the smoothed relationship of their true speed as a function of FPT (Supplementary Figure S6), with neonates having higher swimming speeds with lower FPT values, which correlated with areas farther from shore with faster current speeds (Supplementary Figures S5, S3B).
Body Size and Neonate Swimming Speeds
The PCA results showed that mass and carapace length had the largest correlations and loadings with the first principal component, which explained 56% of total variance and was loaded with carapace length, width, and body mass (Supplementary Figure S8). Scores from the first principal component were extracted for each turtle and used as a size index (Burgess et al., 2006). Body size measurements for neonates appear in Supplementary Table S1. An independent t-test showed a significant difference in the size index for neonates between years, with 2018 having a larger mean size index than 2016 (2018: 0.501; 2016: −0.453, p-value = 7.95e-04) (Figure 5A). Independent t-test results showed that neonates from hatcheries had significantly larger body size indices on average than incubator neonates in 2018 (hatchery: 0.815, incubator: 0.068, p-value = 0.036) but not in 2016 (hatchery: −0.412, incubator: −0.527 p-value = 0.802) (Figure 5B).
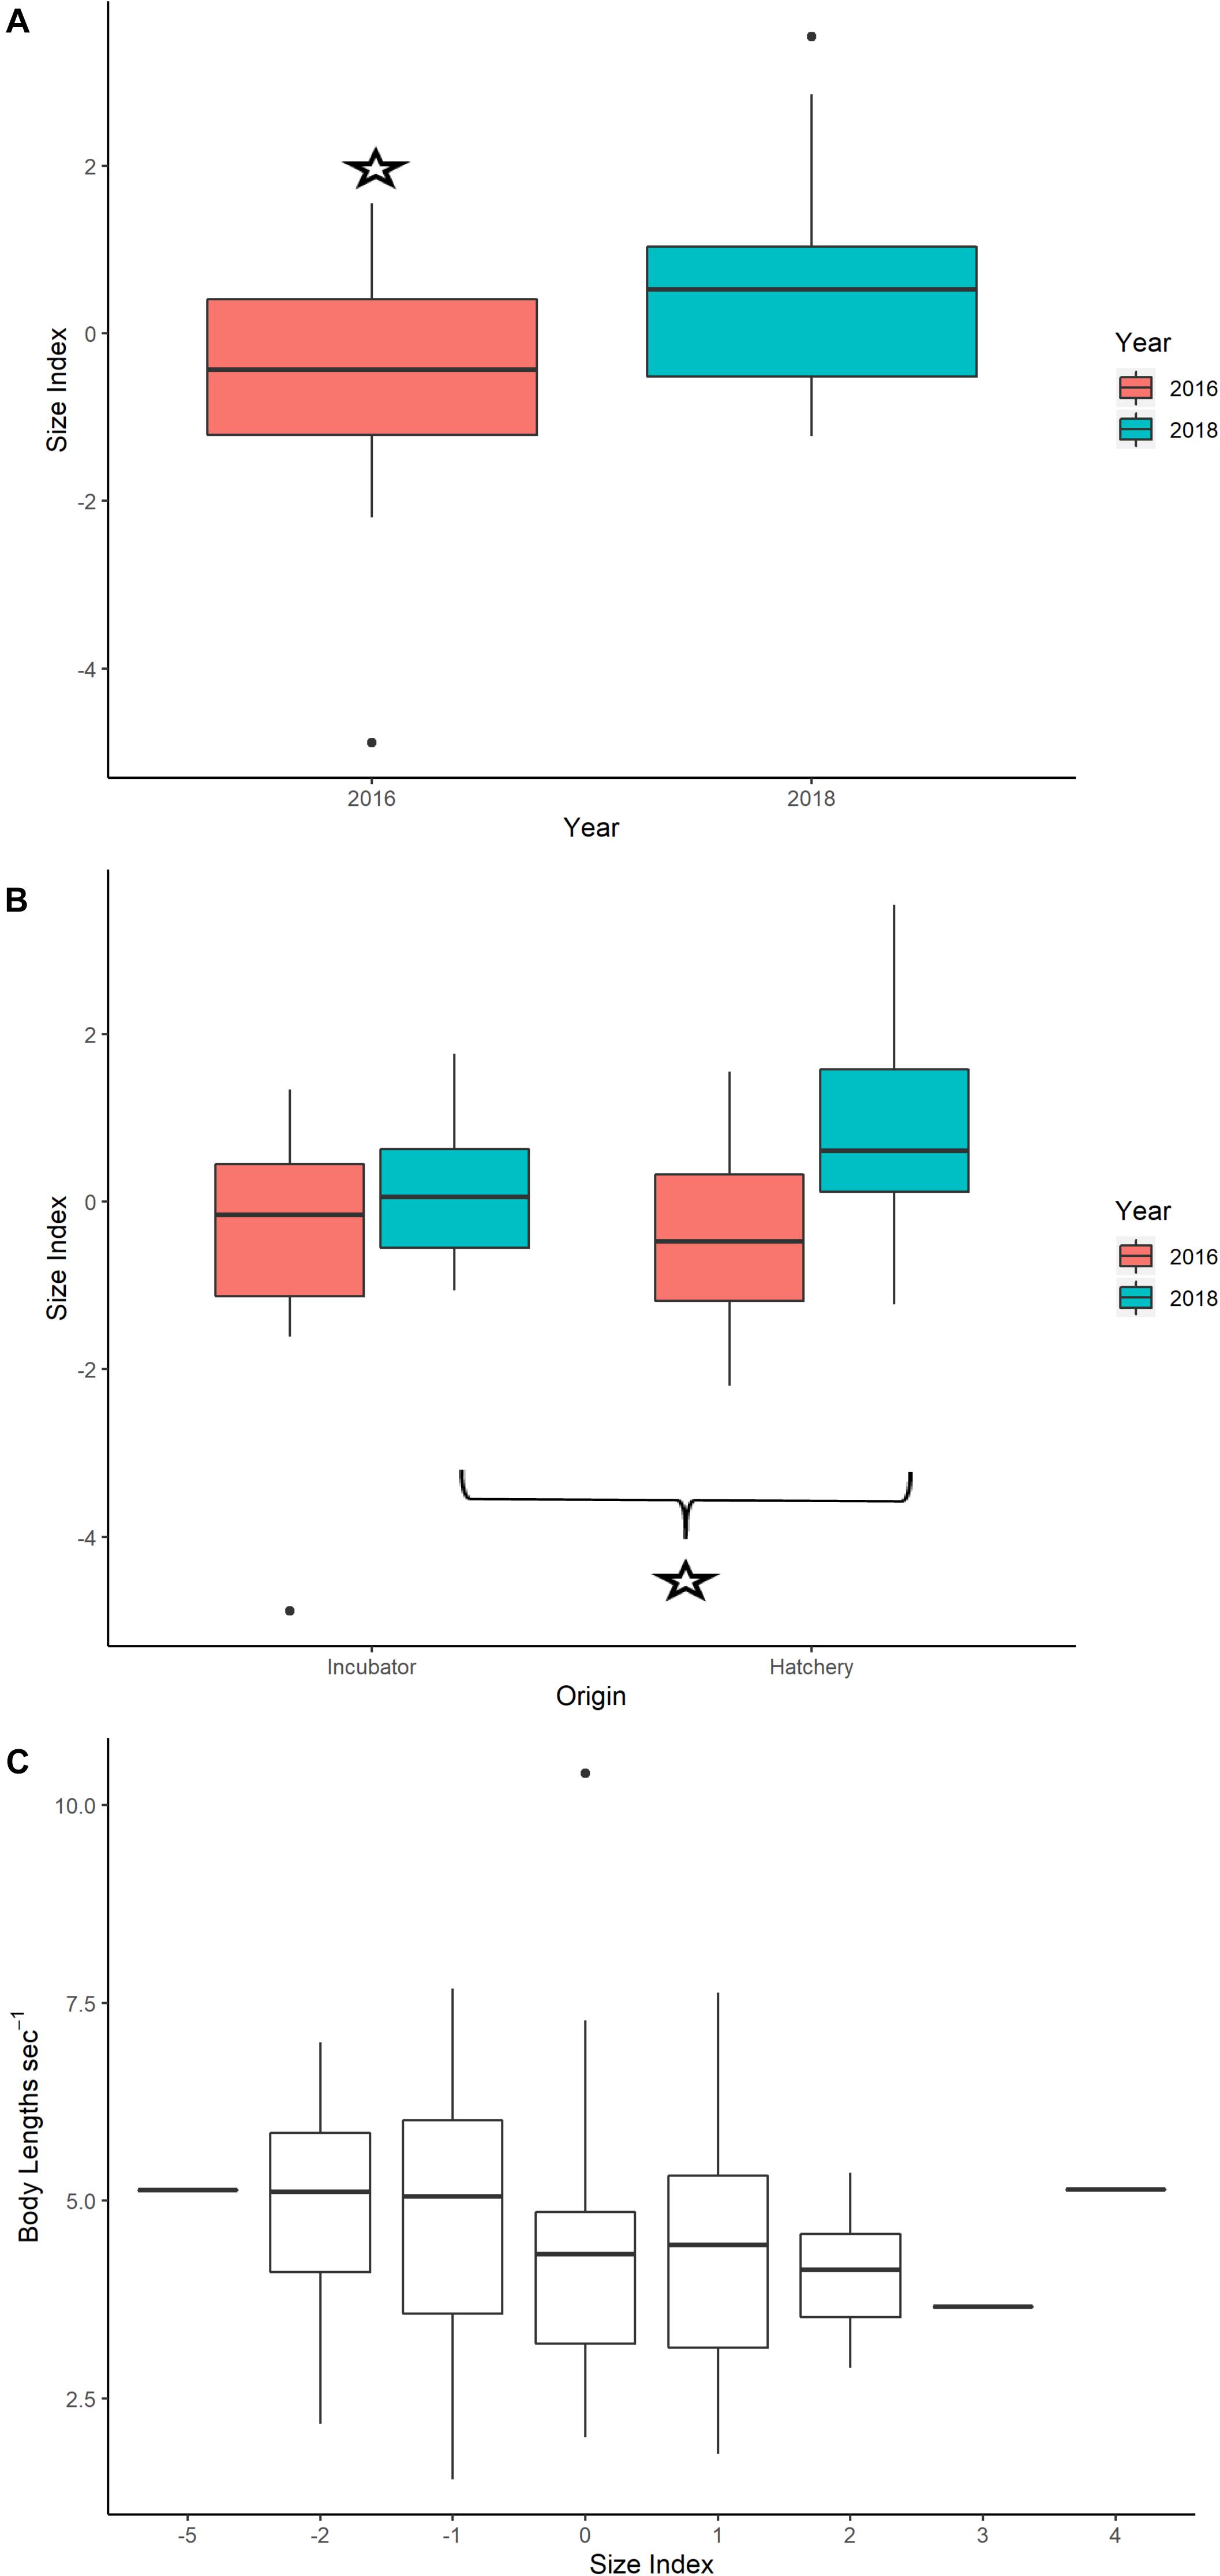
Figure 5. (A) Boxplots of the size index for neonates in 2016 versus 2018, with a star indicating a significant difference between years using an independent t-test (p-value < 0.05). (B) Boxplots of the size index for 2016 and 2018, with the star showing significant differences between incubator and hatchery individuals using an independent t-test (p-value < 0.05). (C) Boxplots comparing body size index values versus average true swimming speed for neonates, standardized by body lengths per time (m s− 1). Results from a linear mixed effects model did not indicate significance for this relationship, even when controlling for variability in body size index with treatment (hatchery or incubator) and year.
The linear mixed effects model did not show a significant relationship between average neonate swimming speed and neonate body size (Table 5 and Figure 5C).
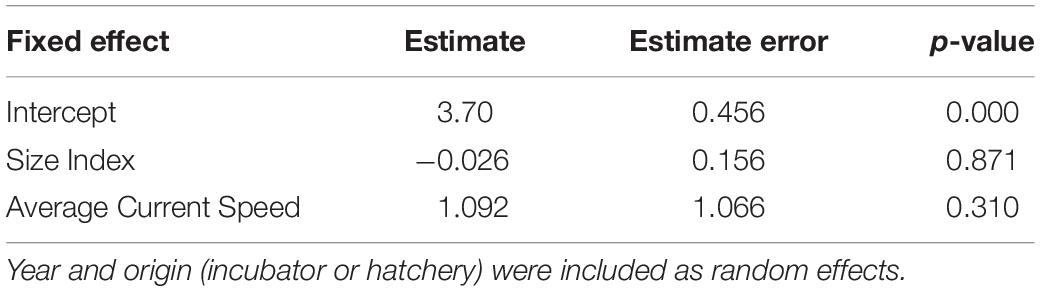
Table 5. Results of a linear mixed effects model predicting neonate average true swimming speed (body lengths in m s–1) as a function of average current speed (m s–1) and a PCA-derived body size index.
Discussion
Dispersal of leatherback neonates from Pacuare, Costa Rica is significantly affected by current speed, with spatial and temporal variability in the currents resulting in three different behavioral response strategies in neonate swimming speed and orientation. This could have implications for individual neonate fitness and survival, as changes in strength and direction of the currents could impact the energy use of neonates (Jones et al., 2007; Shillinger et al., 2012b), the amount of time spent in predator-rich waters (Gyuris, 1994; Pilcher et al., 2000; Bolten, 2003; Stewart and Wyneken, 2004; Santidrián Tomillo et al., 2007), and potentially have carry-over effects into their long-term migratory pathway and ability to find resource patches offshore in older life stages (Gaspar et al., 2012; Shillinger et al., 2012b; Putman and Mansfield, 2015; Briscoe et al., 2016; Cardona and Hays, 2018). Although we identified significant inter-annual differences in current speed and neonate body size, the larger sizes of neonates in 2018 did not significantly impact their swimming speed, showing that variability in average neonate swimming speed was due to environmental, not biological, conditions. These findings are especially important for the future conservation and management of this endangered and declining subpopulation of Caribbean leatherback turtles (Troëng et al., 2007; Stewart et al., 2016; The Northwest Atlantic Leatherback Working Group, 2019), as the faster currents experienced during anomalous years may either enhance neonate dispersal or require them to have higher energy expenditures to maintain their heading away from shore.
Our findings substantiate that leatherback neonates swim at a mean constant speed in their frenzy stage to efficiently move offshore and out of high-risk, nearshore zones (Wyneken and Salmon, 1992; Wyneken et al., 1998; Jones et al., 2007; Okuyama et al., 2009), areas where we observed higher FPT’s and slower current speeds. Neonates had similar mean true speeds between years and in different current speed conditions (low, medium, high speeds) (Table 4), despite significantly faster current speeds in 2018 versus 2016. On average, as current speeds increased, neonates increased the difference in their directional components with the currents, indicating they were swimming increasingly in the opposite direction of the currents. An increase in current speed also resulted in most of the neonates swimming more strongly, on average, into a given compass heading opposite of, and in a more northerly direction to, the currents. This reinforces the theory that neonate sea turtles are following a fixed compass direction as they disperse from shore (Lohmann, 1991; Lohmann and Lohmann, 1996; Goff et al., 1998).
Despite relatively constant mean true swimming speeds between years (Table 1) and in different current conditions at the population level (Table 4), there was individual variability in neonate swimming speed in response to faster current conditions, with three main response strategies observed and no indication that these behaviors were simply due to time spent swimming (Supplementary Figure S7 and Supplementary Table S2). When currents surpassed speeds of 0.5 m s–1, more than half of the individuals (54 percent) increased their true speed in positive association with the current velocity and in an oriented, more northerly direction from the currents (Figure 4). Increased velocity in high current speed conditions (>0.5 m s–1, see Figure 4A) may have negative implications for the neonates’ energy storage, as leatherback neonates have a metabolic scope and morphometrics optimized for continuous, slow swimming and a limited yolk storage that is needed to sustain them in their long journey offshore to find foraging areas (Davenport, 1987; Wyneken et al., 1998; Jones et al., 2007). The other two response strategies observed were: (1) neonates maintaining a constant mean, oriented true swimming speed around 0.25 m s–1, or (2) decreasing their true speed in high current speed conditions (>0.5 m s–1) but having raw track bearings more closely matching the direction of currents (Figure 4B). Neonates that utilize either a constant or decreased swimming speed strategy in faster currents father from shore could conserve yolk storage and have higher chances of survival as currents transport them to larger current systems offshore in a shorter amount of time (Shillinger et al., 2012b) and decrease the amount of time spent in predator-rich areas (Wyneken and Salmon, 1992; Wyneken et al., 1998; Okuyama et al., 2010; Santidrián Tomillo et al., 2010). This was further suggested by the lower first passage times and raw track speeds for neonates in areas farther from shore (>1,800 m from shore), where the currents were faster (Supplementary Figure S5 and Figure 3B), and their ability to more efficiently displace themselves than predicted by a biased random walk further into their track (Figure 2B).
Overall, the variability in individual swimming behavior in high current speeds seen in our results may either boost dispersal and/or incur metabolic costs for this decreasing subpopulation of Caribbean leatherbacks (The Northwest Atlantic Leatherback Working Group, 2019). The optimization of leatherback neonates for continuous, slow swimming (Jones et al., 2007) raises concerns that 53 percent of our neonates appeared to increase their swimming speed under high current speed conditions (Figure 4A), despite a population-level response of relatively constant swimming effort in different current speed categories (Table 4). These individual-level responses to extreme current speed conditions could possibly prematurely exhaust valuable yolk reserves that would otherwise be used to reach offshore foraging habitats. However, in the absence of these potential metabolic costs, the diversity in neonate swimming responses to high current speeds may increase their survival and aid their dispersal offshore. These fast currents could transport neonates away from dangerous nearshore waters where predation is high (Gyuris, 1994; Pilcher et al., 2000; Wyneken et al., 2000; Wilson et al., 2019) and potentially result in neonates having a wider distribution as they encounter variable current systems offshore, increasing their population resiliency to environmental change (Mansfield et al., 2017).
The combination of statistical models and inter-annual data collected on current speeds with environmental predictors show currents impacting neonate movements in this area are not driven by tidal current direction, time of day, lunar cycle phase, or local wind speed. Nearshore current flow spatial and temporal structure in this region is instead likely driven by changes in large-scale geostrophic currents within a cyclonic gyre in the southern Colombia Basin (Centurioni and Niiler, 2003). The inter-annual differences in nearshore local currents measured by our drifters reflected inter-annual differences in geostrophic currents in this region, with faster mean geostrophic current speeds during our 2018 tracking period than in 2016 (Figure 3A). The impact of large-scale geostrophic current flow in the Colombia Basin on local nearshore current flow and thus neonate dispersal supports that future variability in juvenile and adult dispersal behavior in oceanic gyres may depend on their swimming behavior responses as neonates to these environmental conditions (Shillinger et al., 2012b; O’Connor et al., 2014).
Higher precipitation in 2018 may have affected the incubation duration and body morphometrics of neonates in this study (11.96 mm day–1 for 2016 and 15.57 mm day–1 for 2018, see Supplementary Figure S6). Higher precipitation may result in decreased nest temperatures and longer incubation durations (Lolavar and Wyneken, 2015), which subsequently produce larger body sizes but decreased locomotor abilities and overall fitness (Booth et al., 2004; Fisher et al., 2014; Booth, 2017). This is likely due to a decreased fatigue resistance and inability to power stroke for long periods (Burgess et al., 2006). Although we were unable to retrieve precise data on the incubation duration for individual neonates from hatchery nests, the reported average for all neonates from the hatchery nests in 2018 was 70 days (Williamson, 2018, personal communication), which is longer than the known average of 60 days for leatherbacks (Bilinski et al., 2001). Additionally, neonates in 2018 were significantly larger than in 2016 (Figure 5A), and of these, eggs hatched in the hatchery, where nest temperature was not controlled and vulnerable to precipitation effects, were significantly larger than those hatched in incubators (Figure 5B). Body mass for neonate leatherback neonates is usually 30–47 g (Mickelson and Downie, 2010), a range which was greatly exceeded by more than 75% of the neonates in 2018 (range: 42–56 g). However, we did not find a significant relationship between neonate body size and average true swimming speed (Figure 5C). These results show that environmental variables, such as current speed and direction, may have a greater impact on neonate swimming behavior for this Costa Rican rookery than biological factors, such as neonate size, incubation duration, or incubation treatment. However, to fully test the impact of each of these biological variables on their true or current-correct swimming speed, fitness tests would need to be performed on individuals.
Future research efforts that can inform conservation for this population should incorporate longer tracking durations through the deployment of fixed acoustic telemetry arrays in nearshore neonate dispersal corridors highlighted in this study. Use of miniature satellite tags on larger juveniles or other age classes would extend our understanding of the potential carryover effects of environmental conditions on Caribbean leatherback turtle distribution, their ability to successfully find foraging areas, and the risk of interaction with fisheries (Shillinger et al., 2012a; Putman and Mansfield, 2015; Christiansen et al., 2016; Mansfield et al., 2017). The long-term probability of neonate survival and dispersal success leaving the nesting beach during different climatic and oceanographic conditions could be assessed using model simulations with particle tracking techniques, ocean current models, and empirically-informed parameters on neonate movement, growth, and metabolism (Putman et al., 2011; Scott et al., 2012; Shillinger et al., 2012b; Briscoe et al., 2016; Christiansen et al., 2016; Gaspar and Lalire, 2017; Lalire and Gaspar, 2019; DuBois et al., 2020).
The methodological approach used in this study allowed us to successfully track a large number of sea turtles during a vulnerable life stage that has previously had its movement ecology characterized mainly by observational or laboratory studies (Frick, 1976; Lohmann et al., 1990; Wyneken et al., 1990; Lohmann and Lohmann, 1992; Goff et al., 1998; Smith and Salmon, 2009). The methods used allowed us to identify three different neonate behavioral response strategies in high current speed conditions and these results may have long-term implications for neonate energetics, survival, distribution, and overall population success in the face of varied environmental conditions at sea. This methodological approach could be applied to the neonate stage in other marine species, which is understudied in movement ecology due to the difficulty of tag attachments (small body size relative to equipment) and often high mortality rates (Shillinger et al., 2012a). Juvenile movements are generally better understood, such as for sturgeon, where studies have used biotelemetry with acoustic tags to look at home-ranges, seasonal and ontogenetic habitat associations, first passage times, and movements predicted by environmental covariates (Geist et al., 2005; Smith and King, 2005; Thomas et al., 2019). These and other highly migratory marine taxa, such as sharks, billfish, and swordfish, may take advantage of either the affordable miniature acoustic tag and drifter design used in this study and/or the combined analytical approach utilizing statistical models to provide an integrated interpretation of the relationship between an individual’s movement and its environment during dispersal. The characterization of these movements of younger life stages can then be used to inform management, conservation efforts, and responses to climate change scenarios, as has been performed for older life stages (e.g., Hazen et al., 2012b).
Data Availability Statement
The raw data supporting the conclusions of this article will be made available by the authors, without undue reservation.
Ethics Statement
The animal study was reviewed and approved by University of Maryland Center for Environmental Science Institutional Animal Care and Use Committee.
Author Contributions
GS and HB conceived the study. NB and AH designed the study and collected field data. NB composed permits, conducted statistical analyses, and drafted the manuscript. GS coordinated the study, helped with field collection, provided input, and reviewed the manuscript. SW provided expertise, data collection assistance, study coordination, and reared hatchlings during this fieldwork. VC assisted in construction of precipitation and geostrophic current plots and data retrieval, as well as feedback for all oceanography related statements in the manuscript. DL provided statistical guidance and assisted in model interpretation and decision making. WF provided feedback on methodology and study design and assisted with editing the manuscript. All co-authors provided critical revisions to the manuscript. All authors contributed to the article and approved the submitted version.
Funding
Funding for this project was provided by Upwell Turtles (www.upwell.org) as part of their larger research initiative, “The Lost Years.”
Conflict of Interest
The authors declare that the research was conducted in the absence of any commercial or financial relationships that could be construed as a potential conflict of interest.
Acknowledgments
Ecology Project International provided access to the nesting beach, and the Pacuare Nature Reserve field staff assisted us with egg collection, incubation protocol, and onshore data collection. All fieldwork would not be possible without the skill and commitment of our boat captains, Eugenio Sinclair and Elden Sinclair. Further, we had multiple volunteers that assisted in fieldwork, data collection, and data processing, including Max Gotts, Noah Ashley, and the students of the Nueva School. This study has been conducted using E.U. Copernicus Marine Service Information.
Supplementary Material
The Supplementary Material for this article can be found online at: https://www.frontiersin.org/articles/10.3389/fmars.2020.582933/full#supplementary-material
Footnotes
- ^ https://tides.mobilegeographics.com/locations/4273.html
- ^ https://www.aviso.altimetry.fr/en/data/data-access/las-live-access-server.html
References
Bailey, H., and Thompson, P. (2006). Quantitative analysis of bottlenose dolphin movement patterns and their relationship with foraging. J. Anim. Ecol. 75, 456–465. doi: 10.1111/j.1365-2656.2006.01066.x
Bailey, H., and Thompson, P. (2010). Effect of oceanographic features on fine-scale foraging movements of bottlenose dolphins. Mar. Ecol. Prog. Ser. 418, 223–233. doi: 10.3354/meps08789
Benson, S. R., Eguchi, T., Foley, D. G., Forney, K. A., Bailey, H., Hitipeuw, C., et al. (2011). Large-scale movements and high-use areas of western Pacific leatherback turtles, Dermochelys coriacea. Ecosphere 2, 1–27.
Beron-Vera, F. J., Olascoaga, M. J., Haller, G., Farazmand, M., Triñanes, J., and Wang, Y. (2015). Dissipative inertial transport patterns near coherent Lagrangian eddies in the ocean. Interdiscipl. J. Non. Sci. 25:087412. doi: 10.1063/1.4928693
Bilinski, J. J., Reina, R. D., Spotila, J. R., and Paladino, F. V. (2001). The effects of nest environment on calcium mobilization by leatherback turtle embryos (Dermochelys coriacea) during development. Comp. Biochem. Physiol. A 130, 151–162. doi: 10.1016/s1095-6433(01)00374-9
Block, B. A., Jonsen, I. D., Jorgensen, S. J., Winship, A. J., Shaffer, S. A., Bograd, S. J., et al. (2011). Tracking apex marine predator movements in a dynamic ocean. Nature 475, 86–90. doi: 10.1038/nature10082
Bolten, A. B. (2003). Variation in sea turtle life history patterns: neritic vs. oceanic developmental stages. Biol Sea Turtles 2, 243–257. doi: 10.1201/9781420040807.ch9
Booth, D. T. (2017). Influence of incubation temperature on sea turtle neonate quality. Integr. Zool. 12, 352–360. doi: 10.1111/1749-4877.12255
Booth, D. T., Burgess, E., McCosker, J., and Lanyon, J. M. (2004). The influence of incubation temperature on post-hatching fitness characteristics of turtles. Int. Cong. Ser. Else. 1275, 226–233. doi: 10.1016/j.ics.2004.08.057
Briscoe, D. K., Parker, D. M., Balazs, G. H., Kurita, M., Saito, T., Okamoto, H., et al. (2016). Active dispersal in loggerhead sea turtles (Caretta caretta) during the ‘lost years’. Proc. Royal Soc. B Biol. Sci. 283:20160690. doi: 10.1098/rspb.2016.0690
Brooks, M. T., Coles, V. J., and Coles, W. C. (2019). Inertia influences pelagic sargassum advection and distribution. Geophys. Res. Lett. 46, 2610–2618. doi: 10.1029/2018gl081489
Burgess, E. A., Booth, D. T., and Lanyon, J. M. (2006). Swimming performance of neonate green turtles is affected by incubation temperature. Coral Reefs 25, 341–349. doi: 10.1007/s00338-006-0116-7
Cadahía, L., López-López, P., Urios, V., and Negro, J. J. (2010). Satellite telemetry reveals individual variation in juvenile Bonelli’s eagle dispersal areas. Eur. J. Wildlife Res. 56, 923–930. doi: 10.1007/s10344-010-0391-z
Calenge, C. (2006). The package adehabitat for the R software: tool for the analysis of space and habitat use by animals. Ecol. Model. 197:1035.
Cardona, L., and Hays, G. C. (2018). Ocean currents, individual movements and genetic structuring of populations. Mar. Biol. 165:10.
Centurioni, L. R., and Niiler, P. P. (2003). On the surface currents of the Caribbean Sea. Geophys. Res. Lett. 30:1279.
Christiansen, F., Putman, N. F., Farman, R., Parker, D. M., Rice, M. R., Polovina, J. J., et al. (2016). Spatial variation in directional swimming enables juvenile sea turtles to reach and remain in productive waters. Mar. Ecol. Prog. Ser. 557, 247–259. doi: 10.3354/meps11874
Clark, M. (2015). Quantification of Stokes Drift as a Mechanism for Surface Oil Advection in the Gulf of Mexico during the Deepwater Horizon Oil Spill. Electronic Theses, Florida State University Libraries, Tallahassee, FL.
Core Team, R. (2018). R: A Language and Environment for Statistical Computing. Vienna: R Foundation for Statistical Computing.
Davenport, J. (1987). Locomotion in neonate leatherback turtles Dermochelys coriacea. J. Zool. 212, 85–101.
DuBois, M. J., Putman, N. F., and Piacenza, S. E. (2020). Hurricane frequency and intensity may decrease dispersal of Kemp’s ridley sea turtle hatchlings in the Gulf of Mexico. Front. Mar. Sci. 7:301. doi: 10.3389/fmars.2020.00301
Fauchald, P., and Tveraa, T. (2003). Using first-passage time in the analysis of area-restricted search and habitat selection. Ecology 84, 282–288. doi: 10.1890/0012-9658(2003)084[0282:ufptit]2.0.co;2
Fisher, L. R., Godfrey, M. H., and Owens, D. W. (2014). Incubation temperature effects on neonate performance in the loggerhead sea turtle (Caretta caretta). PLoS One 9:e0114880. doi: 10.1371/journal.pone.0114880
Fossette, S., Witt, M. J., Miller, P., Nalovic, M. A., Albareda, D., Almeida, A. P., et al. (2014). Pan-Atlantic analysis of the overlap of a highly migratory species, the leatherback turtle, with pelagic longline fisheries. Proc. Royal Soc. B Biol. Sci. 281:20133065. doi: 10.1098/rspb.2013.3065
Frick, J. (1976). Orientation and behaviour of hatchling green turtles (Chelonia mydas) in the sea. Anim. Behav. 24, 849–857. doi: 10.1016/s0003-3472(76)80015-2
Gaspar, P., Benson, S. R., Dutton, P. H., Réveillère, A., Jacob, G., Meetoo, C., et al. (2012). Oceanic dispersal of juvenile leatherback turtles: going beyond passive drift modeling. Mar. Ecol. Prog. Ser. 457, 265–284. doi: 10.3354/meps09689
Gaspar, P., and Lalire, M. (2017). A model for simulating the active dispersal of juvenile sea turtles with a case study on western Pacific leatherback turtles. PLoS One 12:e0181595. doi: 10.1371/journal.pone.0181595
Gearheart, G., Maturbongs, A., Dutton, P. H., Sprintall, J., Kooyman, G. L., Tapilatu, R. F., et al. (2011). Tracking leatherback (Dermochelys coriacea) neonates at sea using radio and acoustic tags. Mar. Turtle Newsl. 130, 2–6.
Geist, D. R., Brown, R. S., Cullinan, V., Brink, S. R., Lepla, K., Bates, P., et al. (2005). Movement, swimming speed, and oxygen consumption of juvenile white sturgeon in response to changing flow, water temperature, and light level in the Snake River, Idaho. Trans. Am. Fish. Soc. 134, 803–816. doi: 10.1577/t04-108.1
Girard, C., Sudre, J., Benhamou, S., Roos, D., and Luschi, P. (2006). Homing in green turtles Chelonia mydas: oceanic currents act as a constraint rather than as an information source. Mar. Ecol. Prog. Ser. 322, 281–289. doi: 10.3354/meps322281
Goff, M., Salmon, M., and Lohmann, K. J. (1998). Hatchling sea turtles use surface waves to establish a magnetic compass direction. Anim. Behav. 55, 69–77. doi: 10.1006/anbe.1997.0577
Gyuris, E. (1994). The rate of predation by fishes on neonates of the green turtle (Chelonia mydas). Coral Reefs 13, 137–144. doi: 10.1007/bf00301189
Hake, M., Kjellén, N., and Alerstam, T. (2003). Age-dependent migration strategy in honey buzzards Pernis apivorus tracked by satellite. Oikos 103, 385–396. doi: 10.1034/j.1600-0706.2003.12145.x
Hake, M., Kjelle’n, N., and Alerstam, T. (2001). Satellite tracking of Swedish ospreys Pandion haliaetus: autumn migration routes and orientation. J. Avian Biol. 32, 47–56. doi: 10.1034/j.1600-048x.2001.320107.x
Hays, G. C., Fossette, S., Katselidis, K. A., Schofield, G., and Gravenor, M. B. (2010). Breeding periodicity for male sea turtles, operational sex ratios, and implications in the face of climate change. Conserv. Biol. 24, 1636–1643. doi: 10.1111/j.1523-1739.2010.01531.x
Hays, G. C., Hobson, V. J., Metcalfe, J. D., Righton, D., and Sims, D. W. (2006). Flexible foraging movements of leatherback turtles across the North Atlantic Ocean. Ecology 87, 2647–2656. doi: 10.1890/0012-9658(2006)87[2647:ffmolt]2.0.co;2
Hazen, E. L., Jorgensen, S., Rykaczewski, R. R., Bograd, S. J., Foley, D. G., Jonsen, I. D., et al. (2012a). Predicted habitat shifts of Pacific top predators in a changing climate. Nat. Clim. Change 3, 234–238. doi: 10.1038/nclimate1686
Hazen, E. L., Maxwell, S. M., Bailey, H., Bograd, S. J., Hamann, M., Gaspar, P., et al. (2012b). Ontogeny in marine tagging and tracking science: technologies and data gaps. Mar. Ecol. Prog. Ser. 457, 221–240. doi: 10.3354/meps09857
Hijmans, R. J., Williams, E., and Vennes, C. (2019). Geosphere: Spherical Trigonometry. Vienna: R Foundation for Statistical Computing.
Hoover, A. L., Shillinger, G. L., Swiggs, J., and Bailey, H. (2017). Comparing acoustic tag attachments designed for mobile tracking of neonate sea turtles. Front. Mar. Sci. 4:225. doi: 10.3389/fmars.2017.00225
Hoover, A. L., Shillinger, G. L., Williamson, S. A., Reina, R. D., and Bailey, H. (2020). Nearshore neonate dispersal of Atlantic leatherback turtles (Dermochelys coriacea) from a non-recovering subpopulation. Sci. Rep. (in press). doi: 10.1038/s41598-020-75769-0
Hsu, H. H., Joung, S. J., Liao, Y. Y., and Liu, K. M. (2007). Satellite tracking of juvenile whale sharks, Rhincodon typus, in the Northwestern Pacific. Fish. Res. 84, 25–31. doi: 10.1016/j.fishres.2006.11.030
Hurme, E., Gurarie, E., Greif, S., Flores-Martínez, J. J., Wilkinson, G. S., and Yovel, Y. (2019). Acoustic evaluation of behavioral states predicted from GPS tracking: a case study of a marine fishing bat. Mov. Ecol. 7:21.
Jones, T. T., Reina, R. D., Darveau, C. A., and Lutz, P. L. (2007). Ontogeny of energetics in leatherback (Dermochelys coriacea) and olive ridley (Lepidochelys olivacea) sea turtle neonates. Comp. Biochem. Physiol. 147, 313–322. doi: 10.1016/j.cbpa.2006.09.013
Kjellén, N., Hake, M., and Alerstam, T. (2001). Timing and speed of migration in male, female and juvenile Ospreys Pandion haliaetus between Sweden and Africa as revealed by field observations, radar and satellite tracking. J. Avian Biol. 32, 57–67. doi: 10.1034/j.1600-048x.2001.320108.x
Kooyman, G. L., and Ponganis, P. J. (2007). The initial journey of juvenile emperor penguins. Mar. Freshwater Ecosyst. 17, S37–S43.
Lalire, M., and Gaspar, P. (2019). Modeling the active dispersal of juvenile leatherback turtles in the North Atlantic Ocean. Mov. Ecol. 7, 1–17. doi: 10.1007/978-94-017-2276-6_1
Light, P., Salmon, M., and Lohmann, K. J. (1993). Geomagnetic orientation of loggerhead sea turtles: evidence for an inclination compass. J. Exp. Biol. 182, 1–10.
Lohmann, K., and Lohmann, C. (1996). Orientation and open-sea navigation in sea turtles. J. Exp. Biol. 199, 73–81.
Lohmann, K. J. (1991). Magnetic orientation by hatchling loggerhead sea turtles (Caretta caretta). J. Exp. Biol. 155, 37–49.
Lohmann, K. J., and Lohmann, C. M. F. (1992). Orientation to oceanic waves by green turtle hatchlings. J. Exp. Biol. 171, 1–13.
Lohmann, K. J., and Lohmann, C. M. F. (1993). A light-independent magnetic compass in the leatherback sea turtle. Biol. Bull. 185, 149–151. doi: 10.2307/1542138
Lohmann, K. J., and Lohmann, C. M. F. (1994). Acquisition of magnetic directional preference in hatchling loggerhead sea turtles. J. Exp. Biol. 190, 1–8.
Lohmann, K. J., Putman, N. F., and Lohmann, C. M. (2012). The magnetic map of hatchling loggerhead sea turtles. Curr. Opin. Neurobiol. 22, 336–342. doi: 10.1016/j.conb.2011.11.005
Lohmann, K. J., Salmon, M., and Wyneken, J. (1990). Functional autonomy of land and sea orientation systems in sea turtle hatchlings. Biol. Bull. 179, 214–218. doi: 10.2307/1541772
Lolavar, A., and Wyneken, J. (2015). Effect of rainfall on loggerhead turtle nest temperatures, sand temperatures and neonate sex. Endang. Spec. Res. 28, 235–247. doi: 10.3354/esr00684
Lumpkin, R., and Pazos, M. (2007). Measuring surface currents with Surface Velocity Program drifters: the instrument, its data, and some recent results. Lagran. Anal. Predict. Coast. Ocean Dyn. 2:39. doi: 10.1017/cbo9780511535901.003
Mansfield, K. L., Mendilaharsu, M. L., Putman, N. F., dei Marcovaldi, M. A., Sacco, A. E., Lopez, G., et al. (2017). First satellite tracks of South Atlantic sea turtle ‘lost years’: seasonal variation in trans-equatorial movement. Proc. Royal Soc. B Biol. Sci. 284:20171730. doi: 10.1098/rspb.2017.1730
Mansfield, K. L., Saba, V. S., Keinath, J. A., and Musick, J. A. (2009). Satellite tracking reveals a dichotomy in migration strategies among juvenile loggerhead turtles in the Northwest Atlantic. Mar. Biol. 156, 2555–2570. doi: 10.1007/s00227-009-1279-x
Mansfield, K. L., Wyneken, J., Porter, W. P., and Luo, J. (2014). First satellite tracks of neonate sea turtles redefine the ‘lost years’ oceanic niche. Proc. Royal Soc. B Biol. Sci. 281:1781.
Meyerjürgens, J., Badewien, T. H., Garaba, S. P., Wolff, J. O., and Zielinski, O. (2019). A state-of-the-art compact surface drifter reveals pathways of floating marine litter in the German bight. Front. Mar. Sci. 6:58. doi: 10.3389/fmars.2019.00058
Mickelson, L. E., and Downie, J. R. (2010). Influence of incubation temperature on morphology and locomotion performance of leatherback (Dermochelys coriacea) neonates. Can. J. Zool. 88, 359–368. doi: 10.1139/z10-007
Nathan, R., Getz, W. M., Revilla, E., Holyoak, M., Kadmon, R., Saltz, D., et al. (2008). A movement ecology paradigm for unifying organismal movement research. Proc. Natl. Acad. Sci. U.S.A. 105, 19052–19059. doi: 10.1073/pnas.0800375105
Niiler, P. P., and Paduan, J. D. (1995). Wind-driven motions in the northeast Pacific as measured by Lagrangian drifters. J. Phys. Oceanogr. 25, 2819–2830. doi: 10.1175/1520-0485(1995)025<2819:wdmitn>2.0.co;2
O’Connor, C. M., Norris, D. R., Crossin, G. T., and Cooke, S. J. (2014). Biological carryover effects: linking common concepts and mechanisms in ecology and evolution. Ecosphere 5, 1–11.
Okuyama, J., Abe, O., Nishizawa, H., Kobayashi, M., Yoseda, K., and Arai, N. (2009). Ontogeny of the dispersal migration of green turtle (Chelonia mydas) neonates. J. Exp. Mar. Biol. Ecol. 379, 43–50. doi: 10.1016/j.jembe.2009.08.008
Okuyama, J., Shimizu, T., Abe, O., Yoseda, K., and Arai, N. (2010). Wild versus head-started hawksbill turtles Eretmochelys imbricata: post-release behavior and feeding adaptions. Endang. Spec. Res. 10, 181–190. doi: 10.3354/esr00250
Péron, C., and Grémillet, D. (2013). Tracking through life stages: adult, immature and juvenile autumn migration in a long-lived seabird. PLoS One 8:e0072713. doi: 10.1371/journal.pone.0072713
Pilcher, N. J., Enderby, S., Stringell, T., and Bateman, L. (2000). Nearshore Turtle Neonate Distribution And Predation. Sea turtles of the Indo-Pacific. London: ASEAN Academic Press, 151–166.
Pinheiro, J., Bates, D., DebRoy, S., Sarkar, D., and R Core Team. (2020). nlme: Linear and nonlinear mixed effects models. R Pack. Vers. 3, 1–147.
Putman, N. F., Bane, J. M., and Lohmann, K. J. (2010a). Sea turtle nesting distributions and oceanographic constraints on hatchling migration. Proc. Royal Soc. B Biol. Sci. 277, 3631–3637. doi: 10.1098/rspb.2010.1088
Putman, N. F., Endres, C. S., Lohmann, C. M., and Lohmann, K. J. (2011). Longitude perception and bicoordinate magnetic maps in sea turtles. Curr. Biol. 21, 463–466. doi: 10.1016/j.cub.2011.01.057
Putman, N. F., and Mansfield, K. L. (2015). Direct evidence of swimming demonstrates active dispersal in the sea turtle “lost years”. Curr. Biol. 25, 1221–1227. doi: 10.1016/j.cub.2015.03.014
Putman, N. F., Scott, R., Verley, P., Marsh, R., and Hays, G. C. (2012). Natal site and offshore swimming influence fitness and long-distance ocean transport in young sea turtles. Mar. Biol. 159, 2117–2126. doi: 10.1007/s00227-012-1995-5
Putman, N. F., Shay, T. J., and Lohmann, K. J. (2010b). Is the geographic distribution of nesting in the Kemp’s ridley turtle shaped by the migratory needs of offspring? Integr. Comp. Biol. 50, 305–314. doi: 10.1093/icb/icq041
Santidrián Tomillo, P., Vélez, E., Reina, R. D., Piedra, R., Paladino, F. V., and Spotila, J. R. (2007). Reassessment of the leatherback turtle (Dermochelys coriacea) nesting population at Parque Nacional Marino Las Baulas, Costa Rica: effects of conservation efforts. Chelonian Conserv. Biol. 6, 54–62. doi: 10.2744/1071-8443(2007)6[54:rotltd]2.0.co;2
Scott, R., Biastoch, A., Roder, C., Stiebens, V. A., and Eizaguirre, C. (2014). Nano-tags for neonates and ocean-mediated swimming behaviors linked to rapid dispersal of neonate sea turtles. Proc. Royal Soc. B Biol. Sci. 281:20141209. doi: 10.1098/rspb.2014.1209
Scott, R., Hodgson, D. J., Witt, M. J., Coyne, M. S., Adnyana, W., Blumenthal, J. M., et al. (2012). Global analysis of satellite tracking data shows that adult green turtles are significantly aggregated in Marine Protected Areas. Glob. Ecol. Biogeogr. 21, 1053–1061. doi: 10.1111/j.1466-8238.2011.00757.x
Shillinger, G. L., Bailey, H., Bograd, S. J., Hazen, E. L., Hamann, M., Gaspar, P., et al. (2012a). Tagging through the stages: technical and ecological challenges in observing life histories through biologging. Mar. Ecol. Prog. Ser. 457, 165–170. doi: 10.3354/meps09816
Shillinger, G. L., Di Lorenzo, E., Luo, H., Bograd, S. J., Hazen, E. L., Bailey, H., et al. (2012b). On the dispersal of leatherback turtle neonates from Mesoamerican nesting beaches. Proc. Royal Soc. B Biol. Sci. 279, 2391–2395. doi: 10.1098/rspb.2011.2348
Shillinger, G. L., Palacios, D. M., Bailey, H., Bograd, S. J., Swithenbank, A. M., Gaspar, P., et al. (2008). Persistent leatherback turtle migrations present opportunities for conservation. PLoS Biol. 6:e171. doi: 10.1371/journal.pbio.0060171
Shillinger, G. L., Swithenbank, A. M., Bailey, H., Bograd, S. J., Castelton, M. R., Wallace, B. P., et al. (2011). Vertical and horizontal habitat preferences of post-nesting leatherback turtles in the South Pacific Ocean. Mar. Ecol. Prog. Ser. 422, 275–289. doi: 10.3354/meps08884
Smith, K. M., and King, D. K. (2005). Movement and habitat use of yearling and juvenile lake sturgeon in Black Lake, Michigan. Trans. Am. Fish. Soc. 134, 1159–1172. doi: 10.1577/t04-149.1
Smith, M. M., and Salmon, M. (2009). A comparison between the habitat choices made by hatchling and juvenile green turtles (Chelonia mydas) and loggerheads (Caretta caretta). Mar. Turtle Newsl. 126, 9–13.
Stewart, K. R., LaCasella, E. L., Roden, S. E., Jensen, M. P., Stokes, L. W., Epperly, S. P., et al. (2016). Nesting population origins of leatherback turtles caught as bycatch in the US pelagic longline fishery. Ecosphere 7:e01272.
Stewart, K. R., and Wyneken, J. (2004). Predation risk to loggerhead neonates at a high-density nesting beach in southeast Florida. Bull. Mar. Sci. 74, 325–335.
The Northwest Atlantic Leatherback Working Group. (2019). Dermochelys coriacea (Northwest Atlantic Ocean subpopulation). IUCN Red List Threat. Spec. 2019:e.T46967827A83327767.
Thomas, M. J., Peterson, M. L., Chapman, E. D., Fangue, N. A., and Klimley, A. P. (2019). Individual habitat use and behavior of acoustically-tagged juvenile green sturgeon in the Sacramento-San Joaquin Delta. Environ. Biol. Fish. 102, 1025–1037. doi: 10.1007/s10641-019-00888-1
Thums, M., Whiting, S. D., Reisser, J., Pendoley, K. L., Pattiaratchi, C. B., Proietti, M., et al. (2016). Artificial light on water attracts turtle neonates during their near shore transit. R. Soc. Open Sci. 3:160142. doi: 10.1098/rsos.160142
Thums, M., Whiting, S. D., Reisser, J. W., Pendoley, K. L., Pattiaratchi, C. B., Harcourt, R. G., et al. (2013). Tracking sea turtle neonates—a pilot study using acoustic telemetry. J. Exp. Mar. Biol. Ecol. 440, 156–163. doi: 10.1016/j.jembe.2012.12.006
Tomillo, P. S., Paladino, F. V., Suss, J. S., and Spotila, J. R. (2010). Predation of leatherback turtle neonates during the crawl to the water. Chelon. Conserv. Biol. 9, 18–25. doi: 10.2744/ccb-0789.1
Troëng, S., Harrison, E., Evans, D., Haro, A. D., and Vargas, E. (2007). Leatherback turtle nesting trends and threats at Tortuguero. Costa Rica. Chelonian Conserv. Biol. 6, 117–122. doi: 10.2744/1071-8443(2007)6[117:ltntat]2.0.co;2
Turchin, P. (1998). Quantitative Analysis Of Movement: Measuring And Modeling Population Redistribution In Animals And Plants. Sunderland, MA: Sinauer Associates, Inc, 396.
Vega, M. L., Willemoes, M., Thomson, R. L., Tolvanen, J., Rutila, J., Samaš, P., et al. (2016). First-time migration in juvenile common cuckoos documented by satellite tracking. PLoS One 11:e0168940. doi: 10.1371/journal.pone.0168940
Vincent, C., Ridoux, V., Fedak, M. A., and Hassani, S. (2002). Mark-recapture and satellite tracking in rehabilitated juvenile grey scals (Halichoerus grypus): dispersal and potential effects on wild populations. Aquat. Mamm. 28, 121–130.
Weng, K. C., O’Sullivan, J. B., Lowe, C. G., Winkler, C. E., Dewar, H., and Block, B. A. (2007). Movements, behavior and habitat preferences of juvenile white sharks Carcharodon carcharias in the eastern Pacific. Mar. Ecol. Prog. Ser. 338, 211–224. doi: 10.3354/meps338211
Williamson, S. A. (2018). Control and Ecological Significance of Embryonic Development in Turtles and Crocodiles. Thesis, Monash University, Clayton VIC.
Wilson, P., Thums, M., Pattiaratchi, C., Whiting, S., Pendoley, K., Ferreira, L. C., et al. (2019). High predation of marine turtle hatchlings near a coastal jetty. Biol. Conserv. 236, 571–579. doi: 10.1016/j.biocon.2019.04.015
Wood, S. N. (2011). Fast stable restricted maximum likelihood and marginal likelihood estimation of semiparametric generalized linear models. J. Royal Statist. Soc. 73, 3–36. doi: 10.1111/j.1467-9868.2010.00749.x
Wyneken, J., De Carlo, L., Glenn, L., Salmon, M., Davidson, D., Weege, S., et al. (1998). “On the consequences of timing, location and fish for neonates leaving open beach hatcheries,” in Proceedings of the Sixteenth Annual Symposium on Sea Turtle Biology and Conservation (Silver Spring, ML: National Oceanic and Atmospheric Administration Tech Memo NMFS), 155–156.
Wyneken, J., and Salmon, M. (1992). Frenzy and postfrenzy swimming activity in loggerhead, green, and leatherback neonate sea turtles. Copeia 1992, 478–484. doi: 10.2307/1446208
Wyneken, J., Salmon, M., Fisher, L., and Weege, S. (2000). “Managing relocated sea turtle nests in open-beach hatcheries. Lessons in hatchery design and implementation in Hillsboro Beach, Broward County, Florida,” in Proceedings of 19th Annual Sea Turtle Symposium, eds H. Kalb and T. Wibbels (Silver Spring, ML: US Department of Commerce, NOAA Technical Memorandum NMFS-SEFSC-443).
Keywords: dispersal, movement, leatherback turtle, acoustic telemetry, generalized additive mixed model, first passage time, biased random walk model, neonate
Citation: Barbour N, Shillinger GL, Hoover AL, Williamson SA, Coles VJ, Liang D, Fagan WF and Bailey H (2020) Environmental and Biological Factors Influencing Dispersal of Neonate Leatherback Turtles (Dermochelys coriacea) From an Endangered Costa Rican Nesting Population. Front. Mar. Sci. 7:582933. doi: 10.3389/fmars.2020.582933
Received: 13 July 2020; Accepted: 14 October 2020;
Published: 06 November 2020.
Edited by:
Michele Thums, Australian Institute of Marine Science (AIMS), AustraliaReviewed by:
Phillipa Jayne Wilson, The University of Western Australia, AustraliaNathan Freeman Putman, LGL (United States), United States
Copyright © 2020 Barbour, Shillinger, Hoover, Williamson, Coles, Liang, Fagan and Bailey. This is an open-access article distributed under the terms of the Creative Commons Attribution License (CC BY). The use, distribution or reproduction in other forums is permitted, provided the original author(s) and the copyright owner(s) are credited and that the original publication in this journal is cited, in accordance with accepted academic practice. No use, distribution or reproduction is permitted which does not comply with these terms.
*Correspondence: Nicole Barbour, bmJhcmJvdXJAdW1jZXMuZWR1