 Michael Fuhr
 Georgi Laukert
 Yang Yu
 Dirk Nürnberg
 Martin Frank
- GEOMAR Helmholtz Centre for Ocean Research Kiel, Kiel, Germany
The sluggish water mass transport in the deeper North Pacific Ocean complicates the assessment of formation, spreading and mixing of surface, intermediate and deep-water masses based on standard hydrographic parameters alone. Geochemical tracers sensitive to water mass provenance and mixing allow to better characterize the origin and fate of the prevailing water masses. Here, we present dissolved neodymium (Nd) isotope compositions (εNd) and concentrations ([Nd]) obtained along a longitudinal transect at ∼180°E from ∼7°S to ∼50°N. The strongest contrast in Nd isotope signatures is observed in equatorial regions between surface waters (εNd ∼0 at 4.5°N) and Lower Circumpolar Deep Water (LCDW) prevailing at 4500 m depth (εNd = −6.7 at 7.2°N). The Nd isotope compositions of equatorial surface and subsurface waters are strongly influenced by regional inputs from the volcanic rocks surrounding the Pacific, which facilitates the identification of the source regions of these waters and seasonal changes in their advection along the equator. Highly radiogenic weathering inputs from Papua-New-Guinea control the εNd signature of the equatorial surface waters and strongly alter the εNd signal of Antarctic Intermediate Water (AAIW) by sea water-particle interactions leading to an εNd shift from −5.3 to −1.7 and an increase in [Nd] from 8.5 to 11.0 pmol/kg between 7°S and 15°N. Further north in the open North Pacific, mixing calculations based on εNd, [Nd] and salinity suggest that this modification of the AAIW composition has a strong impact on intermediate water εNd signatures of the entire region allowing for improved identification of the formation regions and pathways of North Pacific Intermediate Water (NPIW). The deep-water Nd isotope signatures indicate a southern Pacific origin and subsequent changes along its trajectory resulting from a combination of water mass mixing, vertical processes and Nd release from seafloor sediments, which precludes Nd isotopes as quantitative tracers of deep-water mass mixing. Moreover, comparison with previously reported data indicates that the Nd isotope signatures and concentrations below 100 m depth essentially remained stable over the past decades, which suggests constant impacts of water mass advection and mixing as well as of non-conservative vertical exchange and bottom release.
Introduction
The northern Pacific is the largest ocean basin on Earth, but its exact circulation and water mass mixing patterns, in particular at greater depth, are not well constrained. Due to the lack of deep-water formation, strong stratification and low horizontal density gradients prevail resulting in very slow flow velocities and the absence of large differences in physical water properties with depth. This complicates the investigation of water mass advection and mixing applying standard hydrographic parameters such as salinity, temperature, and oxygen concentrations. As a geochemical provenance tracer, radiogenic neodymium (Nd) isotopes add valuable independent information on the origin of water masses and present and past oceanic circulation (Frank, 2002; Goldstein and Hemming, 2003; van de Flierdt et al., 2012; Tachikawa et al., 2017). In the West and North Pacific, dissolved Nd isotope compositions and concentrations have previously been applied to help constrain water mass distribution and mixing (Piepgras and Jacobsen, 1988; Amakawa et al., 2004a, b, 2009; Zimmermann et al., 2009; Grenier et al., 2013; Haley et al., 2017; Behrens et al., 2018; Du et al., 2020). There are, however, still considerable gaps in data coverage and in our knowledge of North Pacific Ocean circulation and Nd isotope behavior in this region. The radiogenic Nd isotope compositions (143Nd/144Nd) are expressed in the εNd notation defined as:
where CHUR represents the Chondritic Uniform Reservoir (Jacobsen and Wasserburg, 1980). According to Tachikawa (2003), the εNd signature of continental Nd supply to the northern Pacific is +1.1 ± 2, originating from weathering of the surrounding volcanic landmasses. Other Nd sources are the partial dissolution of shelf sediments and boundary exchange (Lacan and Jeandel, 2001, 2005). Due to its particle reactivity, Nd is also adsorbed to biogenic particles and/or dust particles originating from the Asian deserts at the surface of the ocean and partly released again in the deeper water column. This process has been termed reversible scavenging (Bacon and Anderson, 1982) and promotes the accumulation of Nd in the deep-waters as reflected by higher deep-water Nd concentrations ([Nd]) (cf. Siddall et al., 2008). In the central North Pacific, primary production and lithogenic particle abundances are low and scavenging is reduced compared to the northernmost Pacific, where productivity is higher (Honda et al., 2002; Buesseler et al., 2008, 2009; Siddall et al., 2008). In addition, volcanic ash and remobilized sediments from the volcanic islands can scavenge Nd and contribute to the vertical transport in the water column (Amakawa et al., 2009; Behrens et al., 2018). While this vertical transport is clearly reflected in [Nd], it does not appear to affect the εNd signatures of the water masses to the same extent in many areas of the ocean. This decoupling of [Nd] and εNd has been referred to as the neodymium paradox and has been explained by reversible scavenging (Goldstein and Hemming, 2003; Siddall et al., 2008) and boundary exchange processes (Lacan and Jeandel, 2001, 2005; Arsouze et al., 2009; Rempfer et al., 2011; Jeandel, 2016) involving benthic Nd release from particles and pore fluids (Abbott et al., 2015a, b; Haley et al., 2017; Du et al., 2020) balanced by Nd removal resulting in changes in εNd that are not accompanied by changes in [Nd].
This study attempts to identify the processes mainly controlling the Nd isotopic compositions and concentrations along a transect from the Equatorial to the North Pacific. We assess the suitability of Nd isotope compositions to trace water mass advection and mixing based on our new longitudinal dissolved εNd and [Nd] section between 7°S and 50°N at 170°E to 180°E.
Hydrography of the Study Area
The hydrography of the north-eastern Pacific is characterized by large scale surface water mass transport strongly influenced by the interaction of the wind system with the surface waters forming the North Pacific Gyre, which also affects the intermediate waters (Table 1 and Figure 1). Particularly the seasonally variable equatorial surface current system exerts a strong control on North Pacific water mass distribution and advection (Wang et al., 2016). The trade wind-driven North and South Equatorial Currents (NEC/SEC) transport surface waters westwards, thereby establishing a pressure gradient that accumulates warm waters in the West Pacific (Tomczak and Godfrey, 2013b). This pressure is balanced by several eastwards flowing near surface currents: The North and South Equatorial Counter Current (NECC/SECC) at the surface and the Equatorial Undercurrent as well as the South and North Subsurface Counter Current (SSCC/NSCC) in water depths > 100 m. The friction between these currents establishes a steady state, within which the eastward and westward flow is balanced. This friction is related to turbulence that makes the equatorial Pacific a region of intense water mass mixing resulting in weakened thermocline gradients (Schmitz, 1996; Tomczak and Godfrey, 2013b). At the same time, this current system acts as a barrier between saltier southern and fresher northern derived water masses, which is approximately located at the southern boundary of the NEC (Tomczak and Godfrey, 2013b). The surface current system further north is dominated by the Subtropical Gyre (STG) and the Subpolar Gyre (SPG), which are driven by the mean annual wind patterns in the region (Huang, 2015). The STG consists of the west-bound NEC, the Philippines Current and the Kuroshio Current representing the western boundary currents, the Kuroshio Extension (KE), which becomes the North Pacific Current (NPC) in the north, and the southwards flowing California Current in the east. The SPG consists of the southwards flowing eastern boundary current Oyashio that joins the KE in the west, the KE and the NPC in the south, the Alaskan Current in the east, and the Alaskan Stream in the north eventually joining the Oyashio Current southwards again (Schmitz, 1996; Tomczak and Godfrey, 2013b). The three major surface water masses in the study area are South and North Pacific Equatorial Water (SPEW/NPEW) as well as the Western North Pacific Central Water (WNPCW). The WNPCW represents the main water mass in the STG. It is formed and subducted in the northern Subtropical Front (STF), where salinity is significantly lower than in southern central waters (Tomczak and Godfrey, 2013b). The NPEW is formed at the boundary of both subtropical gyres by mixing of ECC and EUC without air-sea interaction. Marked by salinity values slightly lower than found in SPEW, it represents a mixture of WNPCW and SPEW (Tomczak and Godfrey, 2013b). SPEW (also referred to as South Pacific Tropical Water, e.g., Behrens et al., 2018) is formed by convective sinking in the Polynesian region, where evaporation increases salinity to values above 36. Even though maximum temperatures and salinities decrease during sinking processes by mixing and spreading in the thermocline, this higher salinity water mass can be found much further west than in subsurface waters (Tomczak and Godfrey, 2013b).
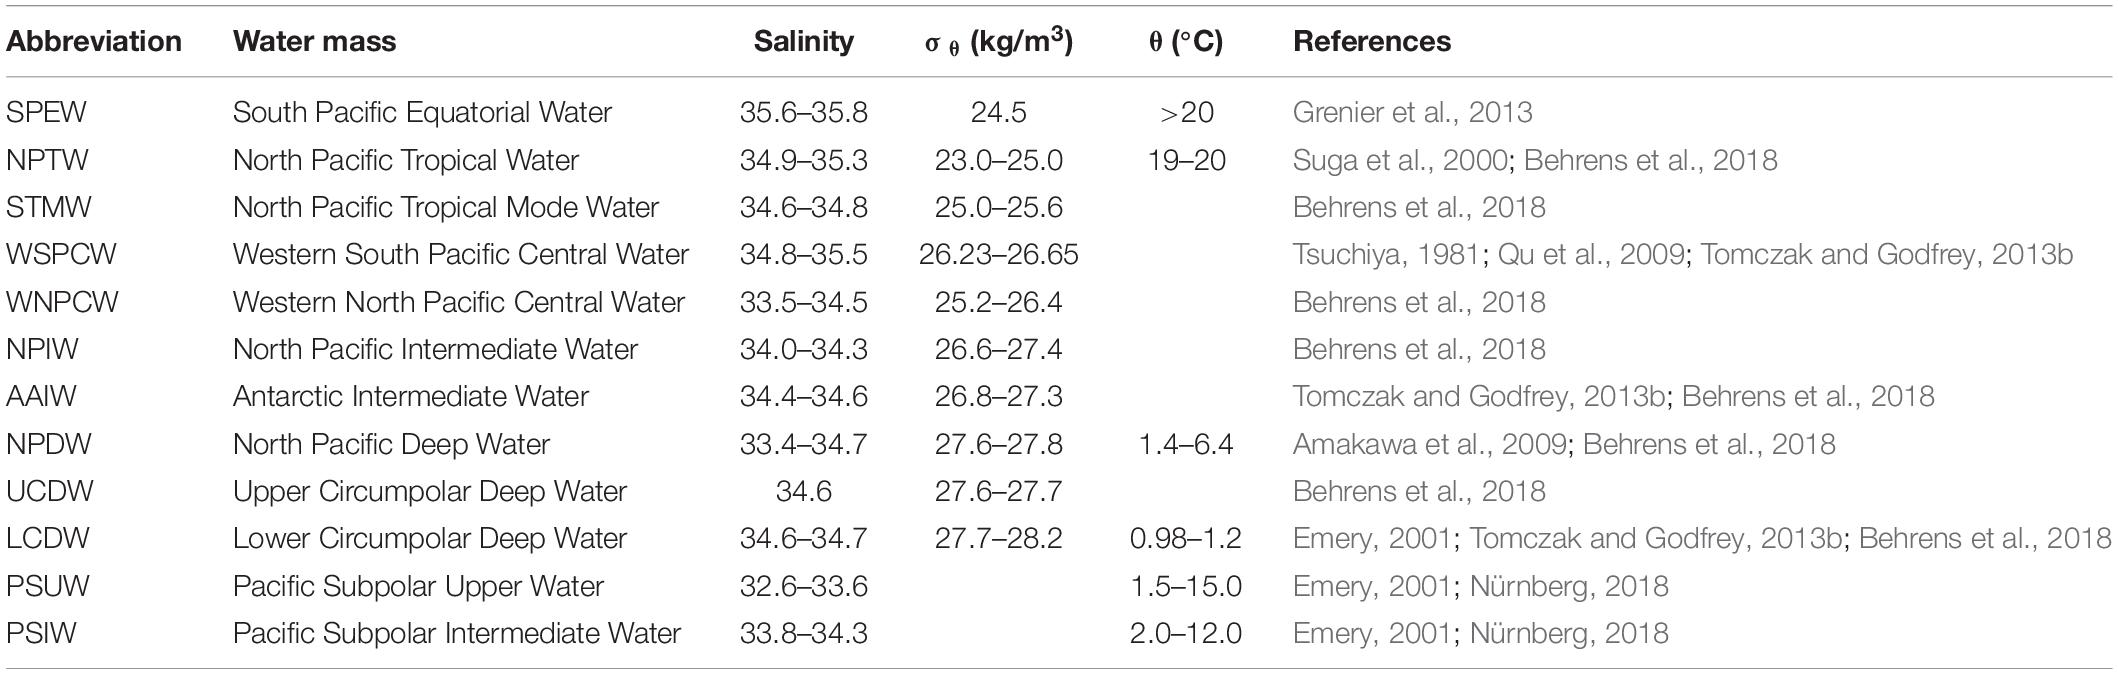
Table 1. Water masses discussed in this study and their hydrographic properties.
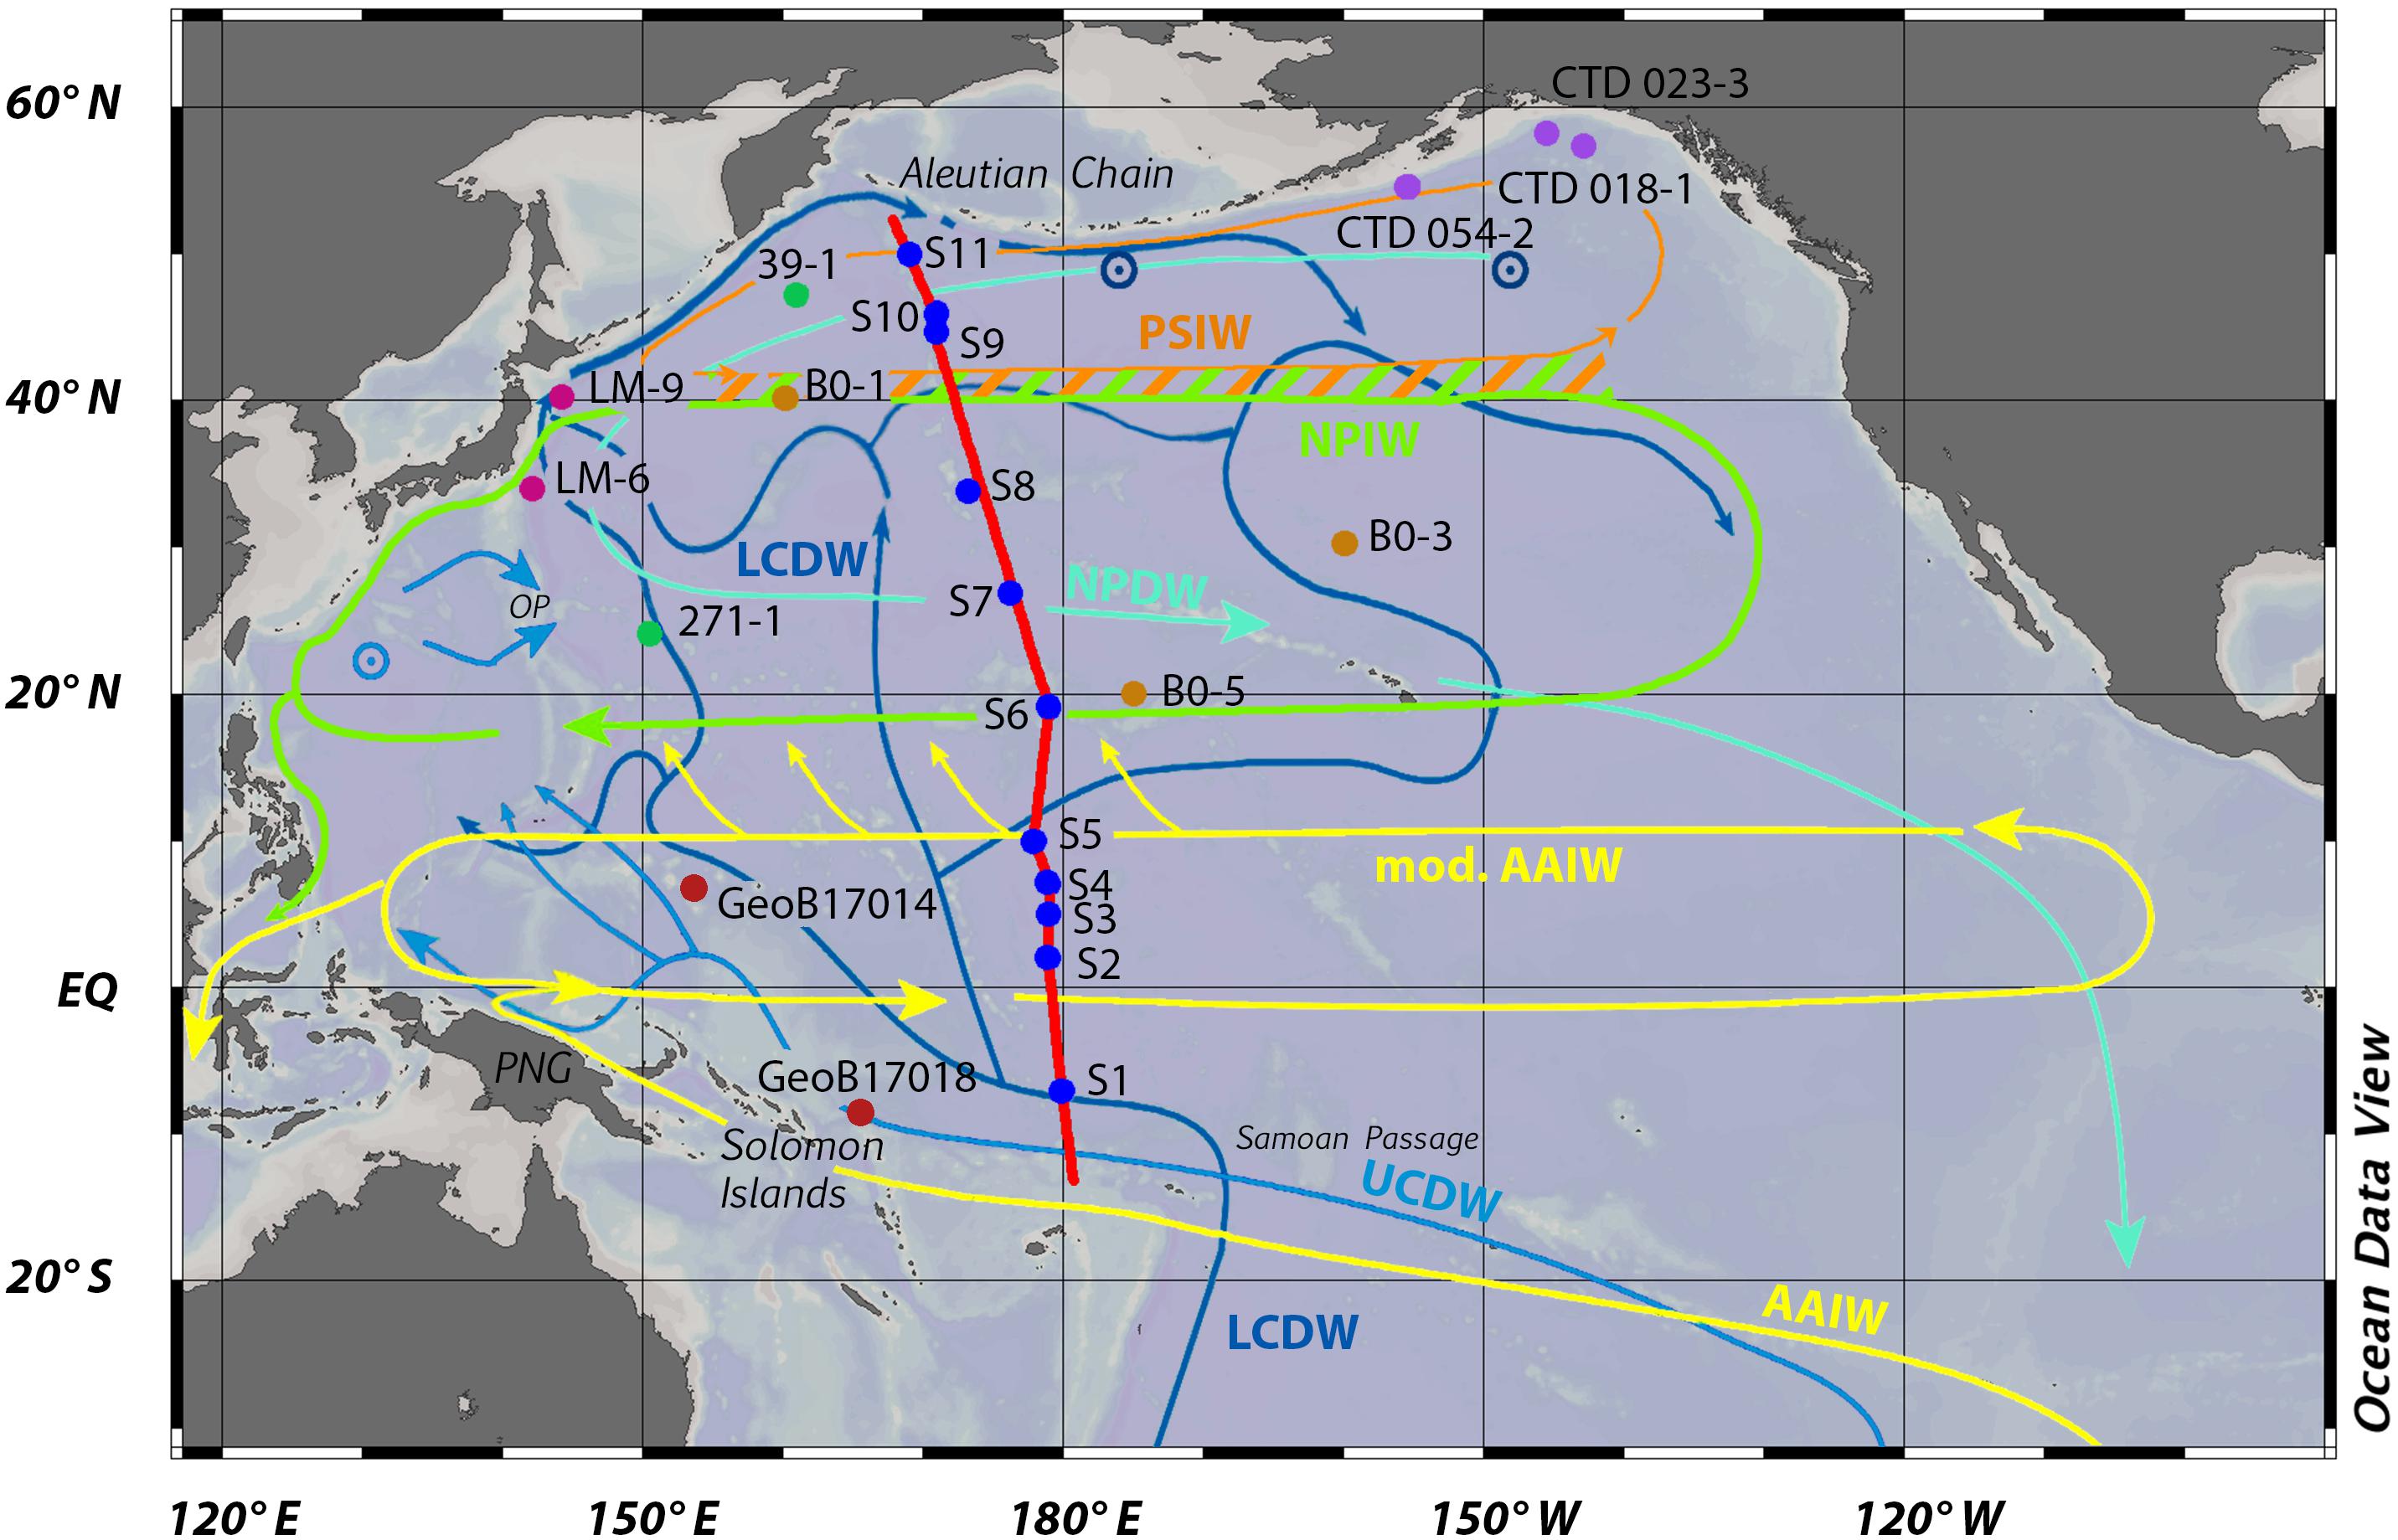
Figure 1. Schematic circulation of intermediate and deep-water masses in the Equatorial and North Pacific (Schmitz, 1996; Kawabe and Fujio, 2010; Tomczak and Godfrey, 2013b; Behrens et al., 2018). The SO264 longitudinal transect (red bold line) and sampling locations (blue dots) of this study are shown along with those selected from Piepgras and Jacobsen (1988) (green dots), Amakawa et al. (2004b) (pink dots), Amakawa et al. (2009) (brown dots), Haley et al. (2014) (purple dots), and Behrens et al. (2018) (red dots). The hatched (green/orange) area depicts mixing of NPIW and PSIW (this study). The light blue circle with a center point marks the approximate location of upwelling of UCDW into the intermediate layer. The dark blue circles with center points mark upwelling of LCDW and its transformation into NPDW (Kawabe and Fujio, 2010). OP, Ogasawara Plateau; PNG, Papua-New-Guinea. Abbreviations used for water masses and currents are listed in Table 1. The map was created using Ocean Data View (Schlitzer, 2020) and further modified.
The intermediate depths in the northern Pacific are mainly occupied by Antarctic Intermediate Water (AAIW) and North Pacific Intermediate Water (NPIW) (Figure 2). The AAIW is formed by cooling and subduction in the Antarctic Circumpolar Current System (ACC) (Schmitz, 1996) and is characterized by low temperatures and low salinity (Table 1). In the Pacific sector of the ACC it is subducted near 60°S (Schmitz, 1996) and first flows north and then west toward Papua-New-Guinea (PNG). From there it is advected to the eastern equatorial Pacific at about 1°–2°S, from where it returns to the South East Asian continental slope at about 10°N (Kawabe and Fujio, 2010). The NPIW is formed in the northern North Pacific by three sources: The Gulf of Alaska supplying Gulf of Alaska Intermediate Water (GAIW), the northwestern SPG, and the Okhotsk Sea between Japan and Kamchatka from where Okhotsk Intermediate Water (OIW) is supplied to the northwest Pacific (You et al., 2000). In this study, the term Pacific Subpolar Intermediate Water (PSIW) (Emery, 2001) is used to refer to an intermediate water mass found underneath the SPG, which is a mix of altered GAIW and NPIW. Its lack of an oxygen maximum indicates that it forms by mixing without direct contact to the surface (Tomczak and Godfrey, 2013b). Yasuda (2004) suggested that the admixture of cold and fresh Oyashio water, partly consisting of OIW, to warm and saline intermediate waters transported along the Kuroshio Current distinguishes between new, upper layer NPIW and an old, lower layer NPIW. The NPIW forms a salinity minimum in a density range between 26.2 kg/m3 and 26.8 kg/m3 throughout the entire SPG (Amakawa et al., 2004b; Tomczak and Godfrey, 2013b).
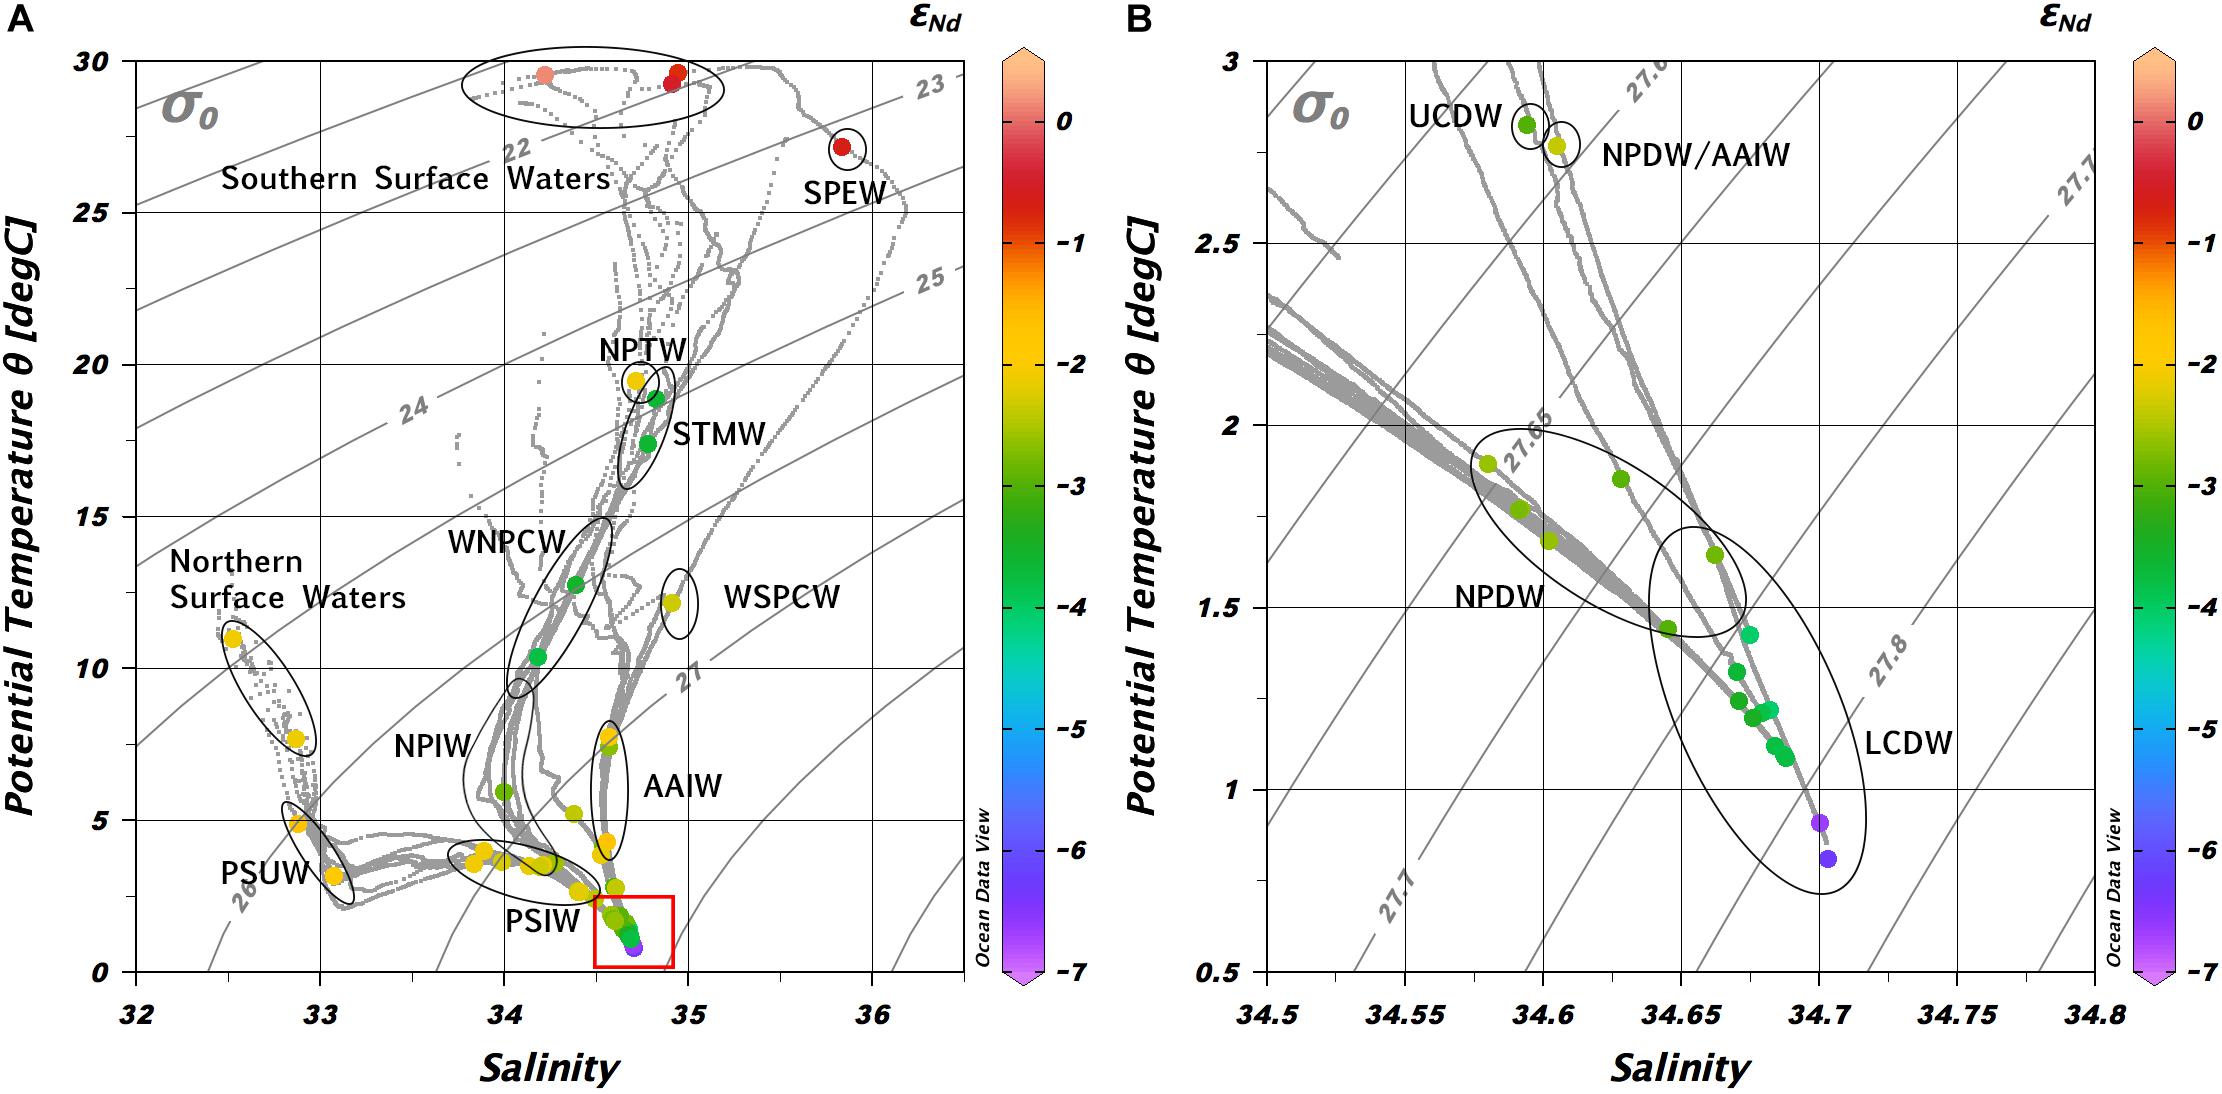
Figure 2. (A) Salinity vs. potential temperature plots for all stations including color-coded εNd signatures from each sample. (B) Close-up of the red square in (A). The water mass classification is based on hydrographic properties defined in Table 1. Created by using Ocean Data View (Schlitzer, 2020) and further modified.
The deep-water circulation in the northern Pacific is mainly driven by density gradients (Schmitz, 1996) and characterized by the advection and mixing of Lower and Upper Circumpolar Deep Water (LCDW/UCDW) and North Pacific Deep Water (NPDW) (Figure 2). CDW enters the northern Pacific basins along a route east of the New Zealand Plateau and spreads northward through the Samoan Passage marked by a weak salinity maximum (Tomczak and Godfrey, 2013b). From there, LCDW flows northward in different branches following bottom topography (Kawabe and Fujio, 2010) and forms a western boundary current west of the Mariana Ridges below 3500 m depth (Tomczak and Godfrey, 2013b). North of 40°N, the eastern and western branch flow along the Aleutian Trench where LCDW upwells sluggishly as reflected by the uniformity of water properties below 2000 m depth and transforms into NPDW (Kawabe and Fujio, 2010). The latter flows westwards toward Japan at depths between 2000 and 3000 m before it turns southwards and joins upwelled UCDW from the Philippine Sea south-eastwards to leave the northern Pacific between 120°W and 90°W (Kawabe and Fujio, 2010). The UCDW initially follows the AAIW at greater depths but takes a more north-westerly path into the Caroline Basin and further into the Philippine Sea where it eventually upwells. It partly mixes with AAIW flowing south-westwards before leaving the Pacific via the Indonesian Throughflow. The remainder exits the Philippine Sea eastwards to mix with NPDW and to leave the Pacific to the southeast (Kawabe and Fujio, 2010).
Materials and Methods
All water samples studied here were collected during RV Sonne cruise SO264 in July and August 2018 (Nürnberg, 2018) using 24 non-metallic 10 l Niskin bottles mounted on a frame equipped with a SBE 9plus CTD profiler (Sea-Bird Electronics Inc.) and two oxygen sensors (SBE 43 oxygen self-regenerative Clark-sensors with Teflon membrane). Sampling was conducted along a transect from 7°S, 179°W to 52°N, 168°E. Sampling locations are shown in Figure 1. After instantaneous gravitational filtration on board with AcroPakTM500 Capsules with Supor Membrane filters (final pore size: 0.2 μm) and acidification to pH ∼2 with ultra-pure concentrated HCl, the seawater samples were stored in acid-cleaned 20 L cubitainers. In the home laboratory at GEOMAR, chemical treatment of the samples to extract and isolate Nd for isotope composition and concentration measurements followed the procedures outlined by Laukert et al. (2017). In brief, purified FeCl3 was added and after sufficient time for equilibration the samples were brought to pH ∼8 leading to co-precipitation of the rare earth elements (REEs) with FeOOH. After sample pre-concentration and treatment with aqua regia to destroy organic compounds, the Fe was eluted again from the samples using clean diethyl ether. The REEs were separated from matrix elements using cation exchange chromatography based on methods proposed by Barrat et al. (1996). For isotope composition measurements, the Nd was further separated from other REEs following the chromatographic schemes established by Pin and Zalduegui (1997) and Le Fèvre and Pin (2005). The Nd concentrations were determined applying an isotope dilution (ID) method following Rickli et al. (2009). The 0.5 L ID samples were aliquoted from the acidified large-volume samples in acid-cleaned LDPE-bottles and a pre-weighed 150Nd spike was added to 0.5 L of each sample and sufficient time was given for equilibration. After addition of the purified FeCl3 solution, co-precipitation was achieved at pH ∼8. Pre-concentration and REE separation were then performed identically to that of the large volume samples (see above), except that only the cation exchange chromatography step (BIORAD AG50W-X8 resin, 200–400 μm mesh-size, 1.4 mL resin bed) following Barrat et al. (1996) was applied.
The 143Nd/144Nd ratios of the samples were measured on a Thermo Scientific Neptune Plus MC-ICPMS at GEOMAR Kiel. Isobaric interferences of 144Sm on 144Nd were corrected by measuring the abundance of the interference-free isotope 147Sm and by calculating the potential 144Sm contribution on mass 144 from the natural abundance of Sm. The measured 143Nd/144Nd ratios were double-corrected for instrumental mass bias with 146Nd/144Nd = 0.7219 and 142Nd/144Nd = 1.141876 following the approach of Vance and Thirlwall (2002). Samples were bracketed by concentration matched JNdi−1 standard solutions and double corrected 143Nd/144Nd ratios were normalized to the accepted JNdi-1-standard value of 0.512115 (Tanaka et al., 2000). The external reproducibility of the Nd isotope measurements was estimated by repeated analyses of JNdi-1 and in-house Nd standard solutions and ranged between 0.15 and 0.35 εNd units (2 SD). The total procedural blanks (n = 2) were negligible at <15 pg compared to more than 10 ng of Nd used for the isotope measurements. Only four samples had lower concentrations (between 0.8 and 1.7 ng) resulting in significantly higher uncertainties as compared to those reported above (see Table 2). For Nd concentration determined via the ID technique, the external reproducibility is estimated to be better than 2% based on previous assessments from our group applying the same method (e.g., Stichel et al., 2012; Laukert et al., 2017; Rahlf et al., 2020). All sampling and sample preparation as well as measurement techniques reported here strictly followed recommended GEOTRACES protocols (van de Flierdt et al., 2012).
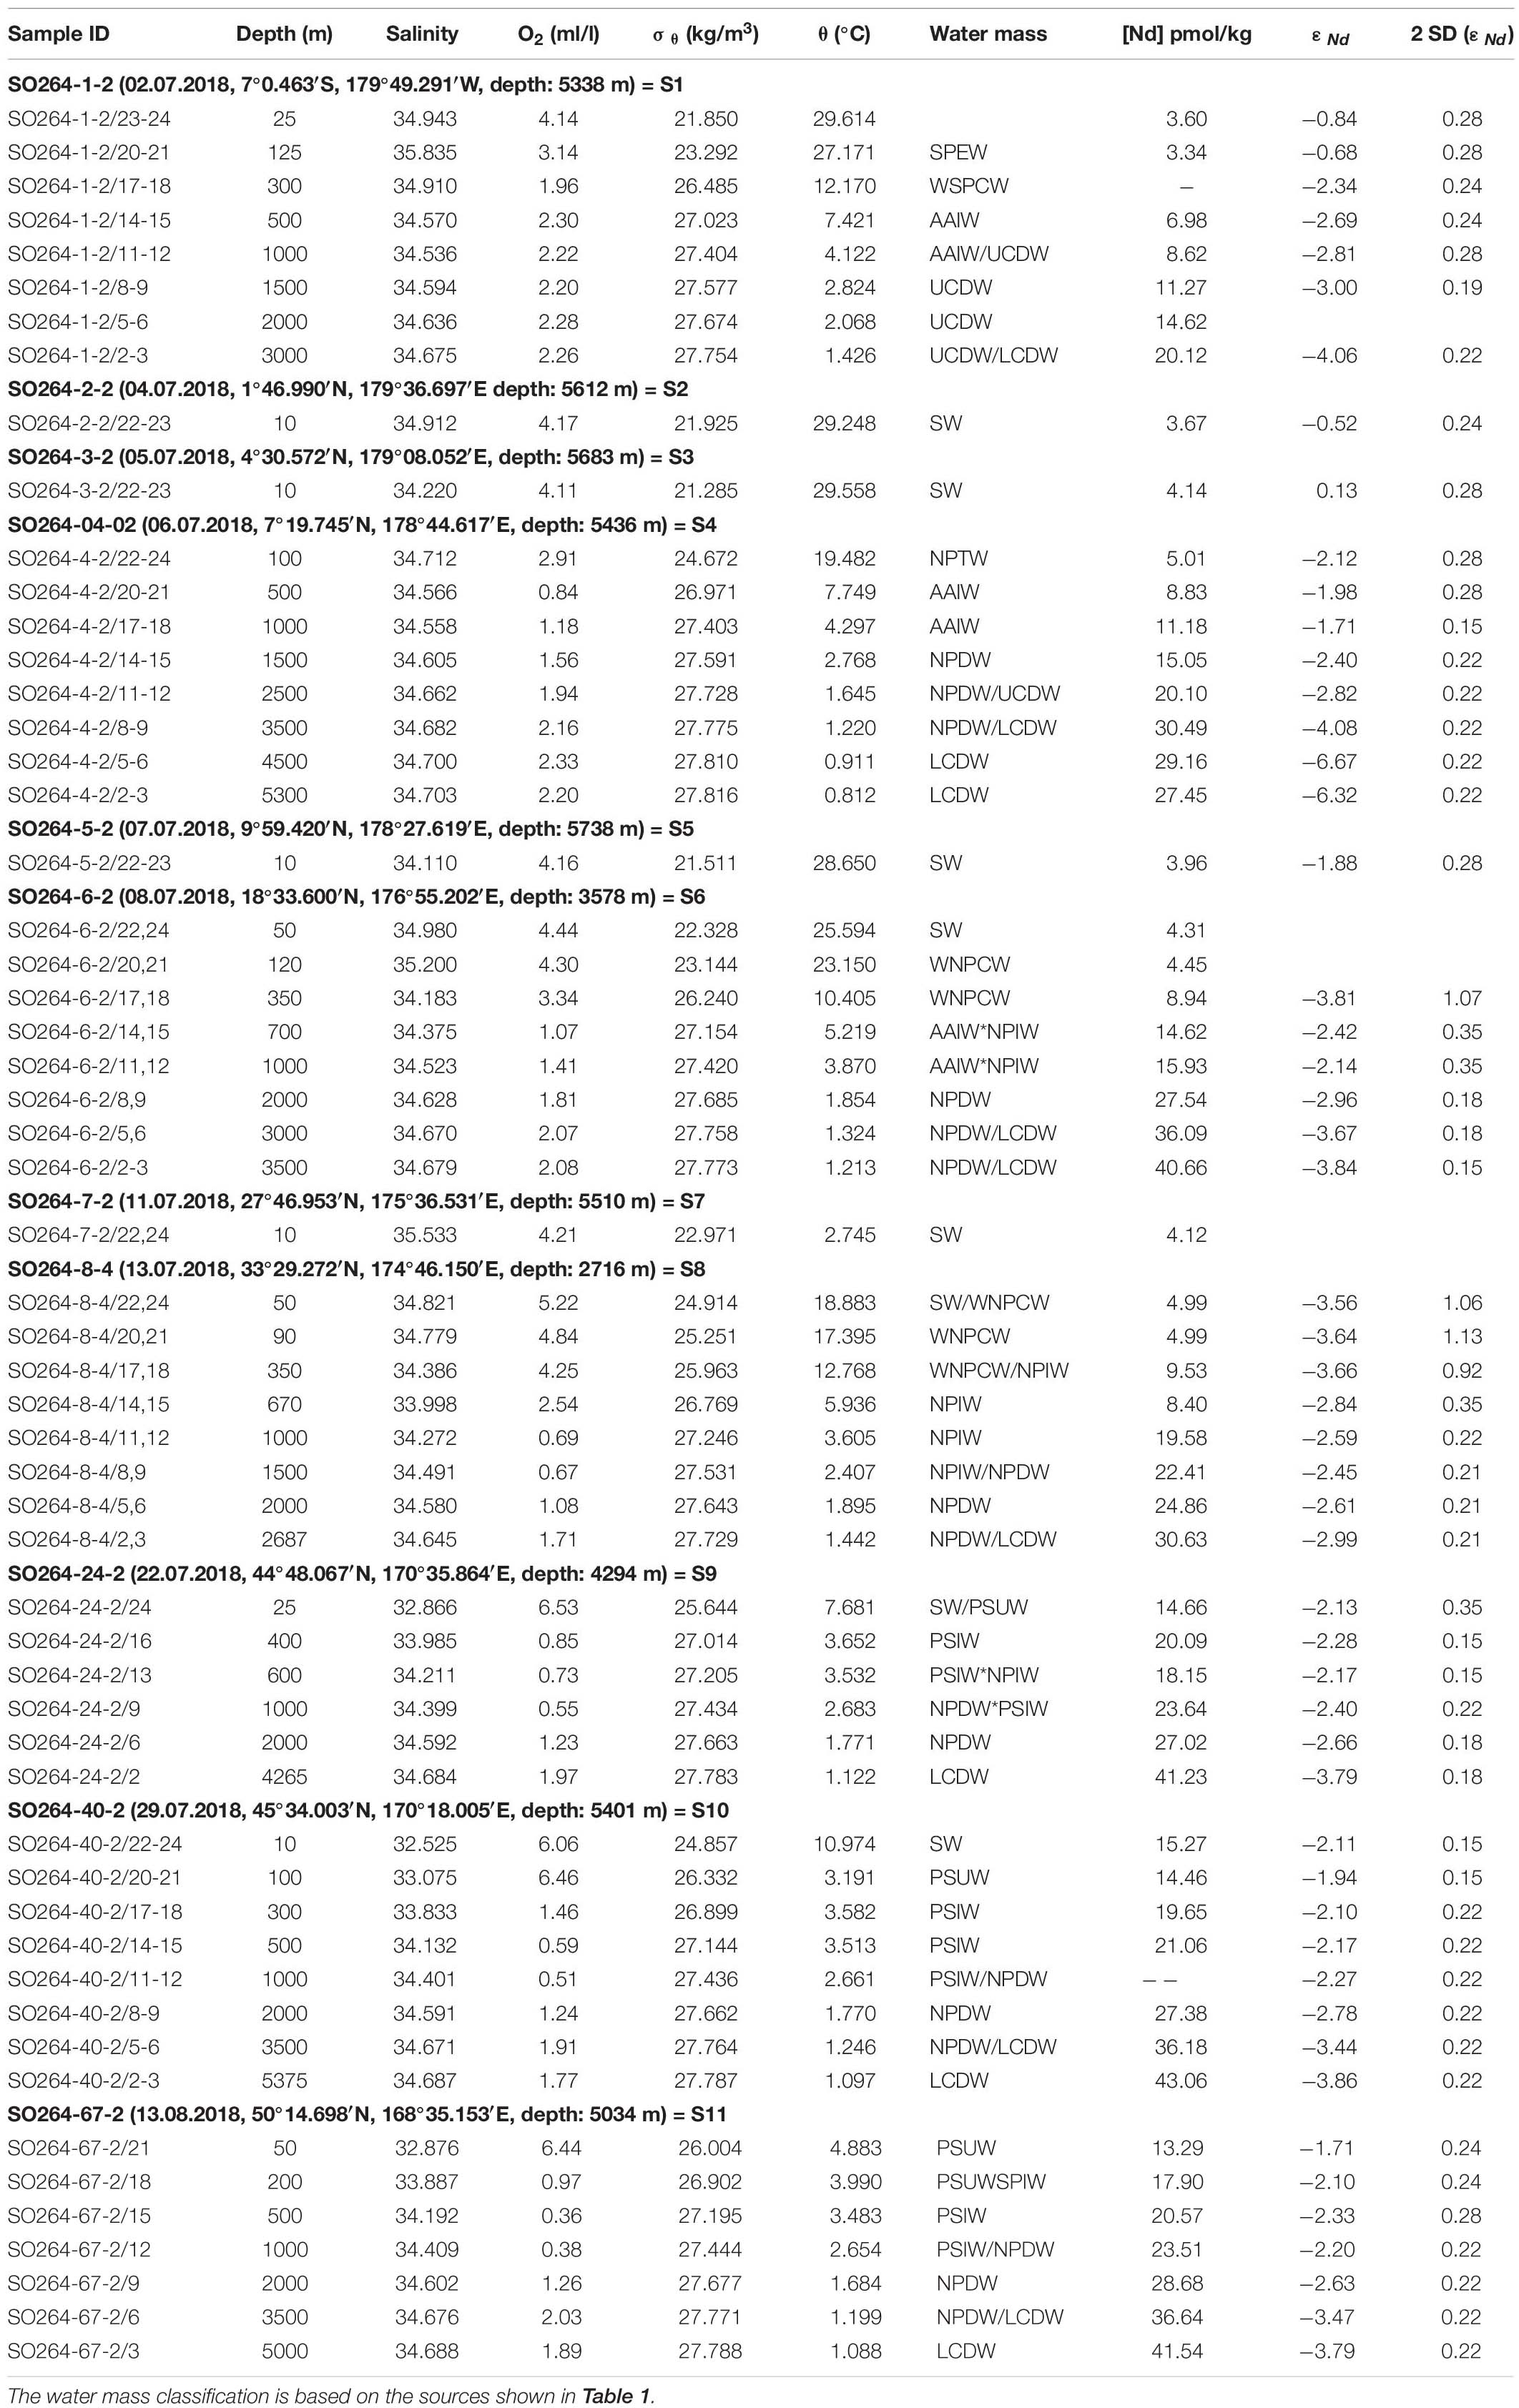
Table 2. Results of seawater Nd isotope composition and concentration from this study along with hydrographic parameters.
Results
All Nd isotope and concentration data are reported in Table 2 along with the hydrographic properties of the samples, and are available through the PANGAEA database (Fuhr et al., 2021). The T-S relationships of the profiles of this study are presented in Figure 2 along with the assignment of water masses based on standard hydrographic properties. Additionally, the Nd isotopic signatures of the samples are displayed. Individual profiles of εNd and [Nd] are shown in Figure 3 and reveal general basin-scale trends, including a shift to less radiogenic εNd signatures and increasing [Nd] with depth. Overall Nd concentrations range between 3.6 pmol/kg and 15.3 pmol/kg at the surface and 27.5 pmol/kg and 43.1 pmol/kg in bottom waters, while εNd values vary between 0.1 ± 0.3 and −2.1 ± 0.3 and between −6.7 ± 0.2 and −3.8 ± 0.2 at the surface and in deeper layers, respectively. Apart from general trends observed in the entire dataset, changes in both parameters linked to water mass distribution are observed along the longitudinal section as shown in Figure 4 and described hereafter.
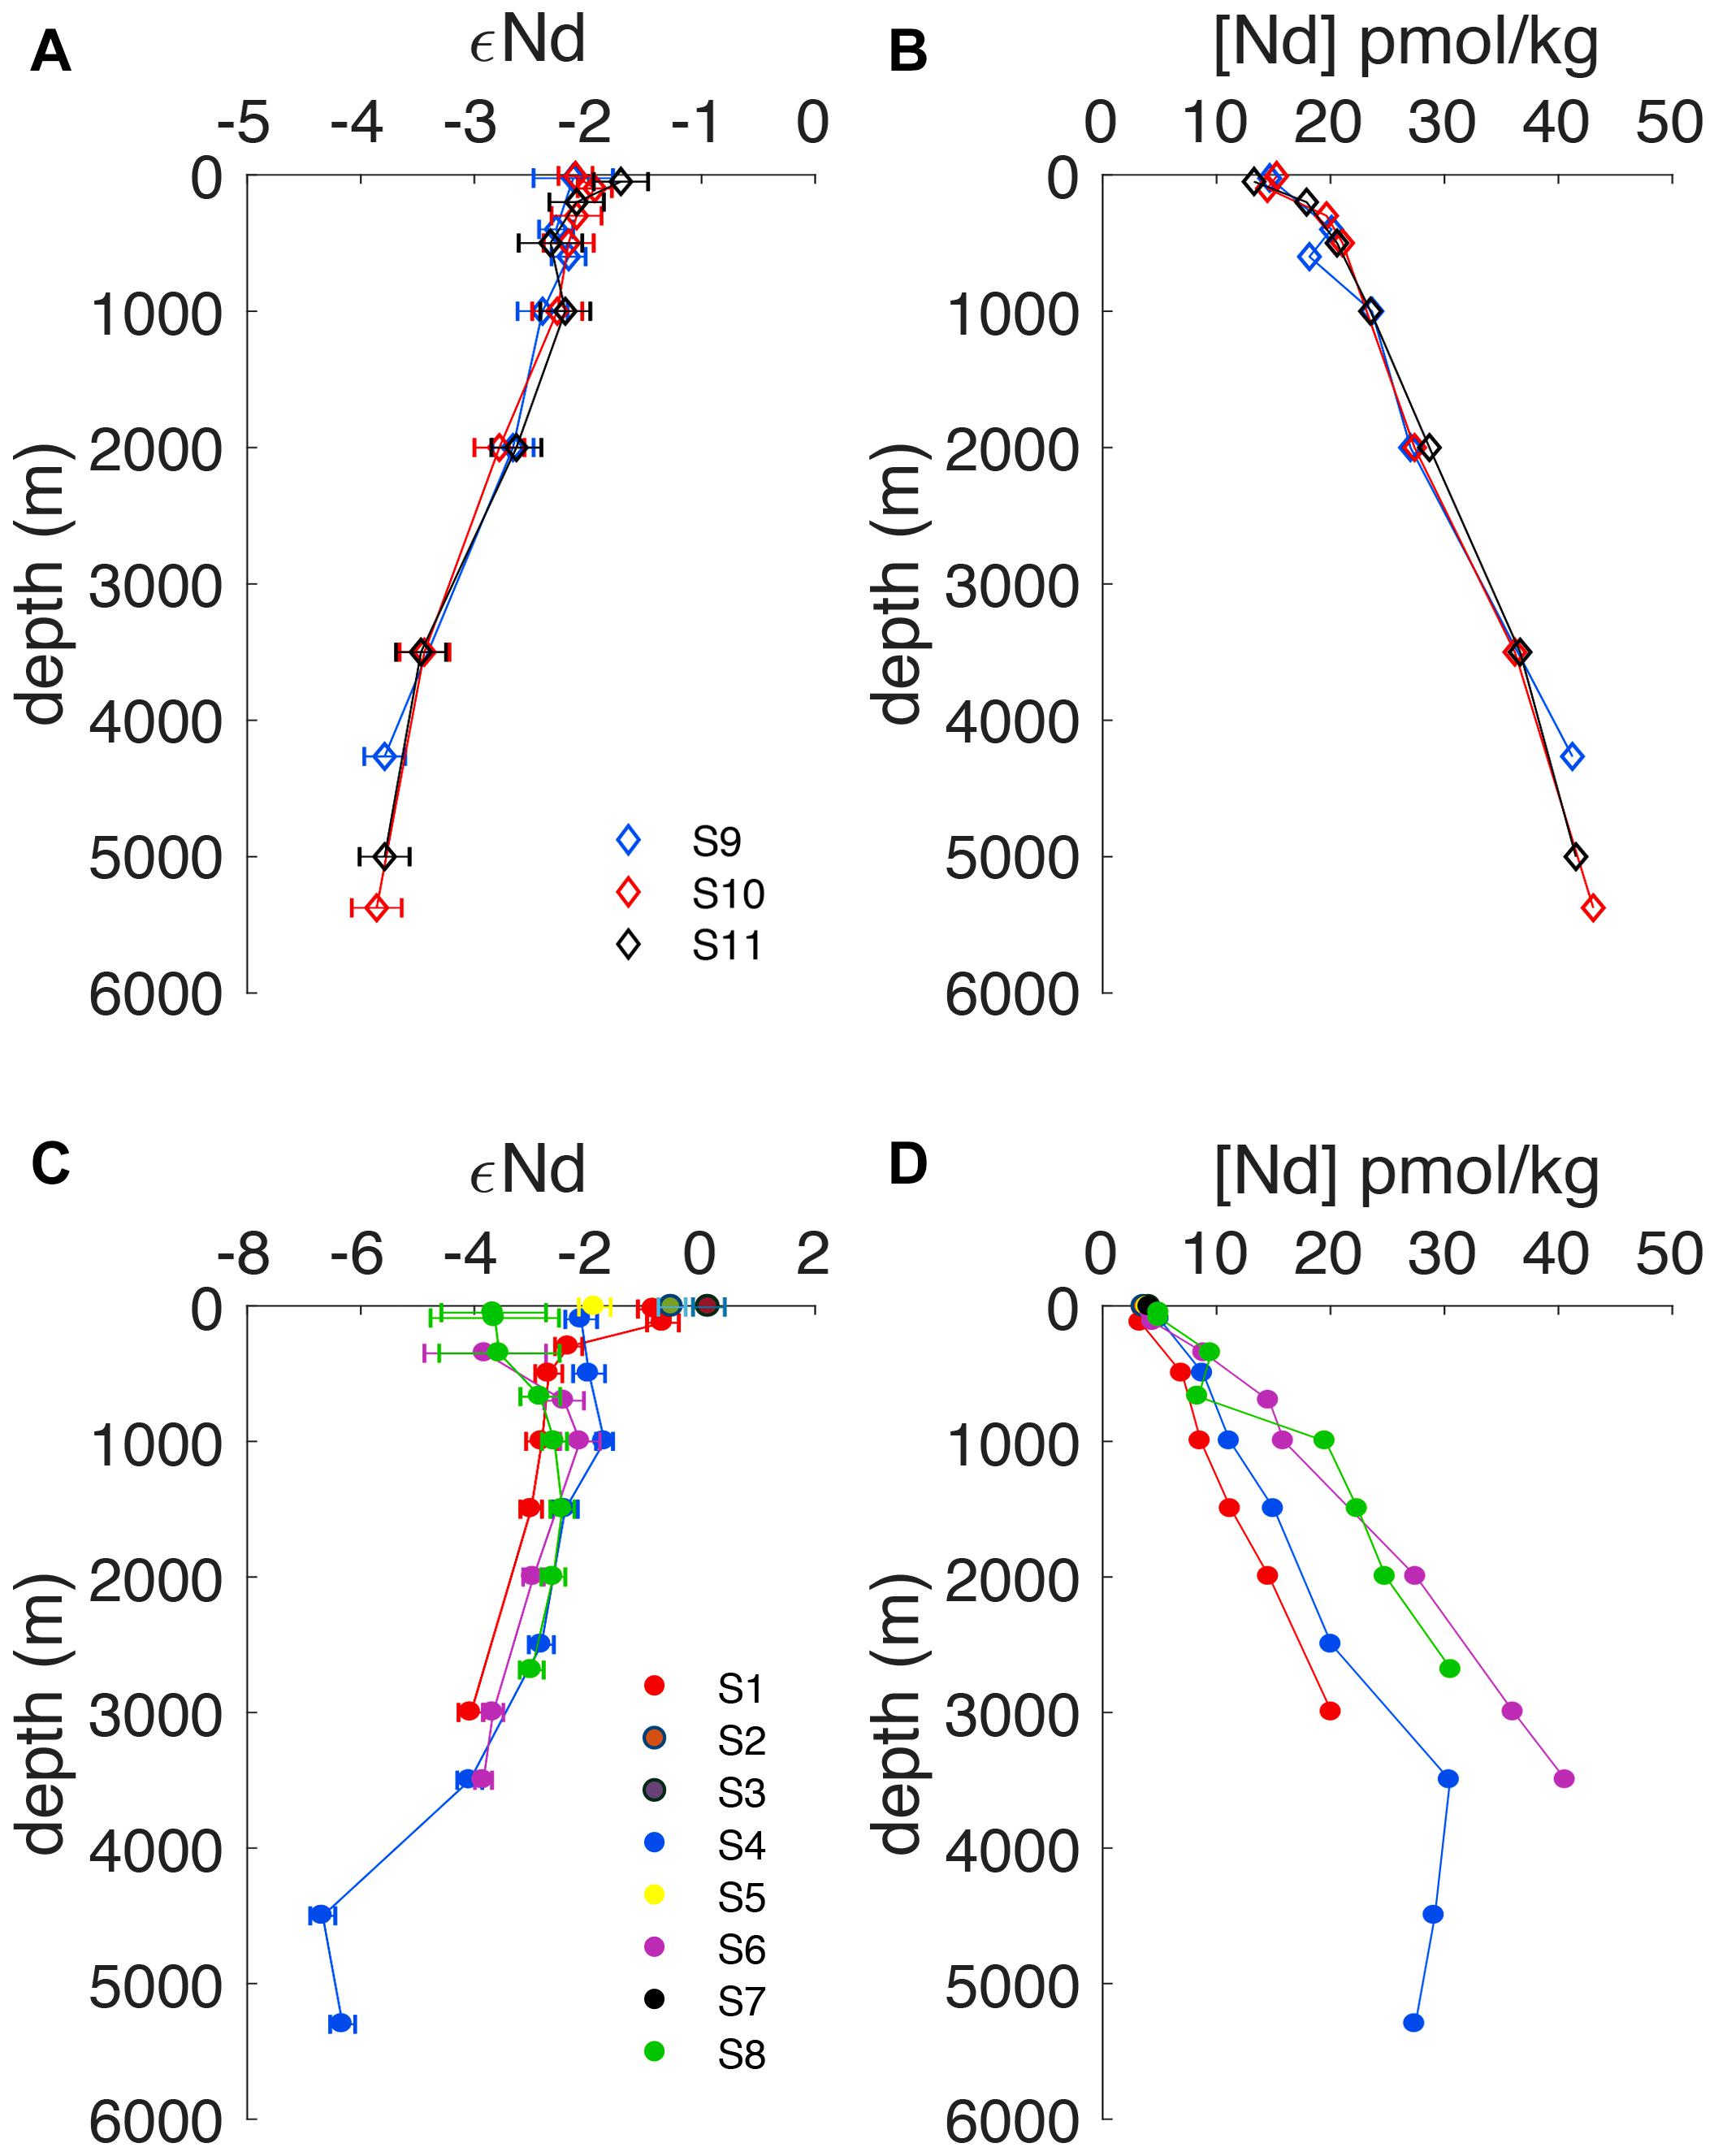
Figure 3. εNd (A,C) and [Nd] (B,D) profiles for all stations. Upper graphs (A,B) display the stations north of 40°N, whereas bottom graphs (B,C) show stations south of 40°N. The error bars for εNd are reported as 2SD.
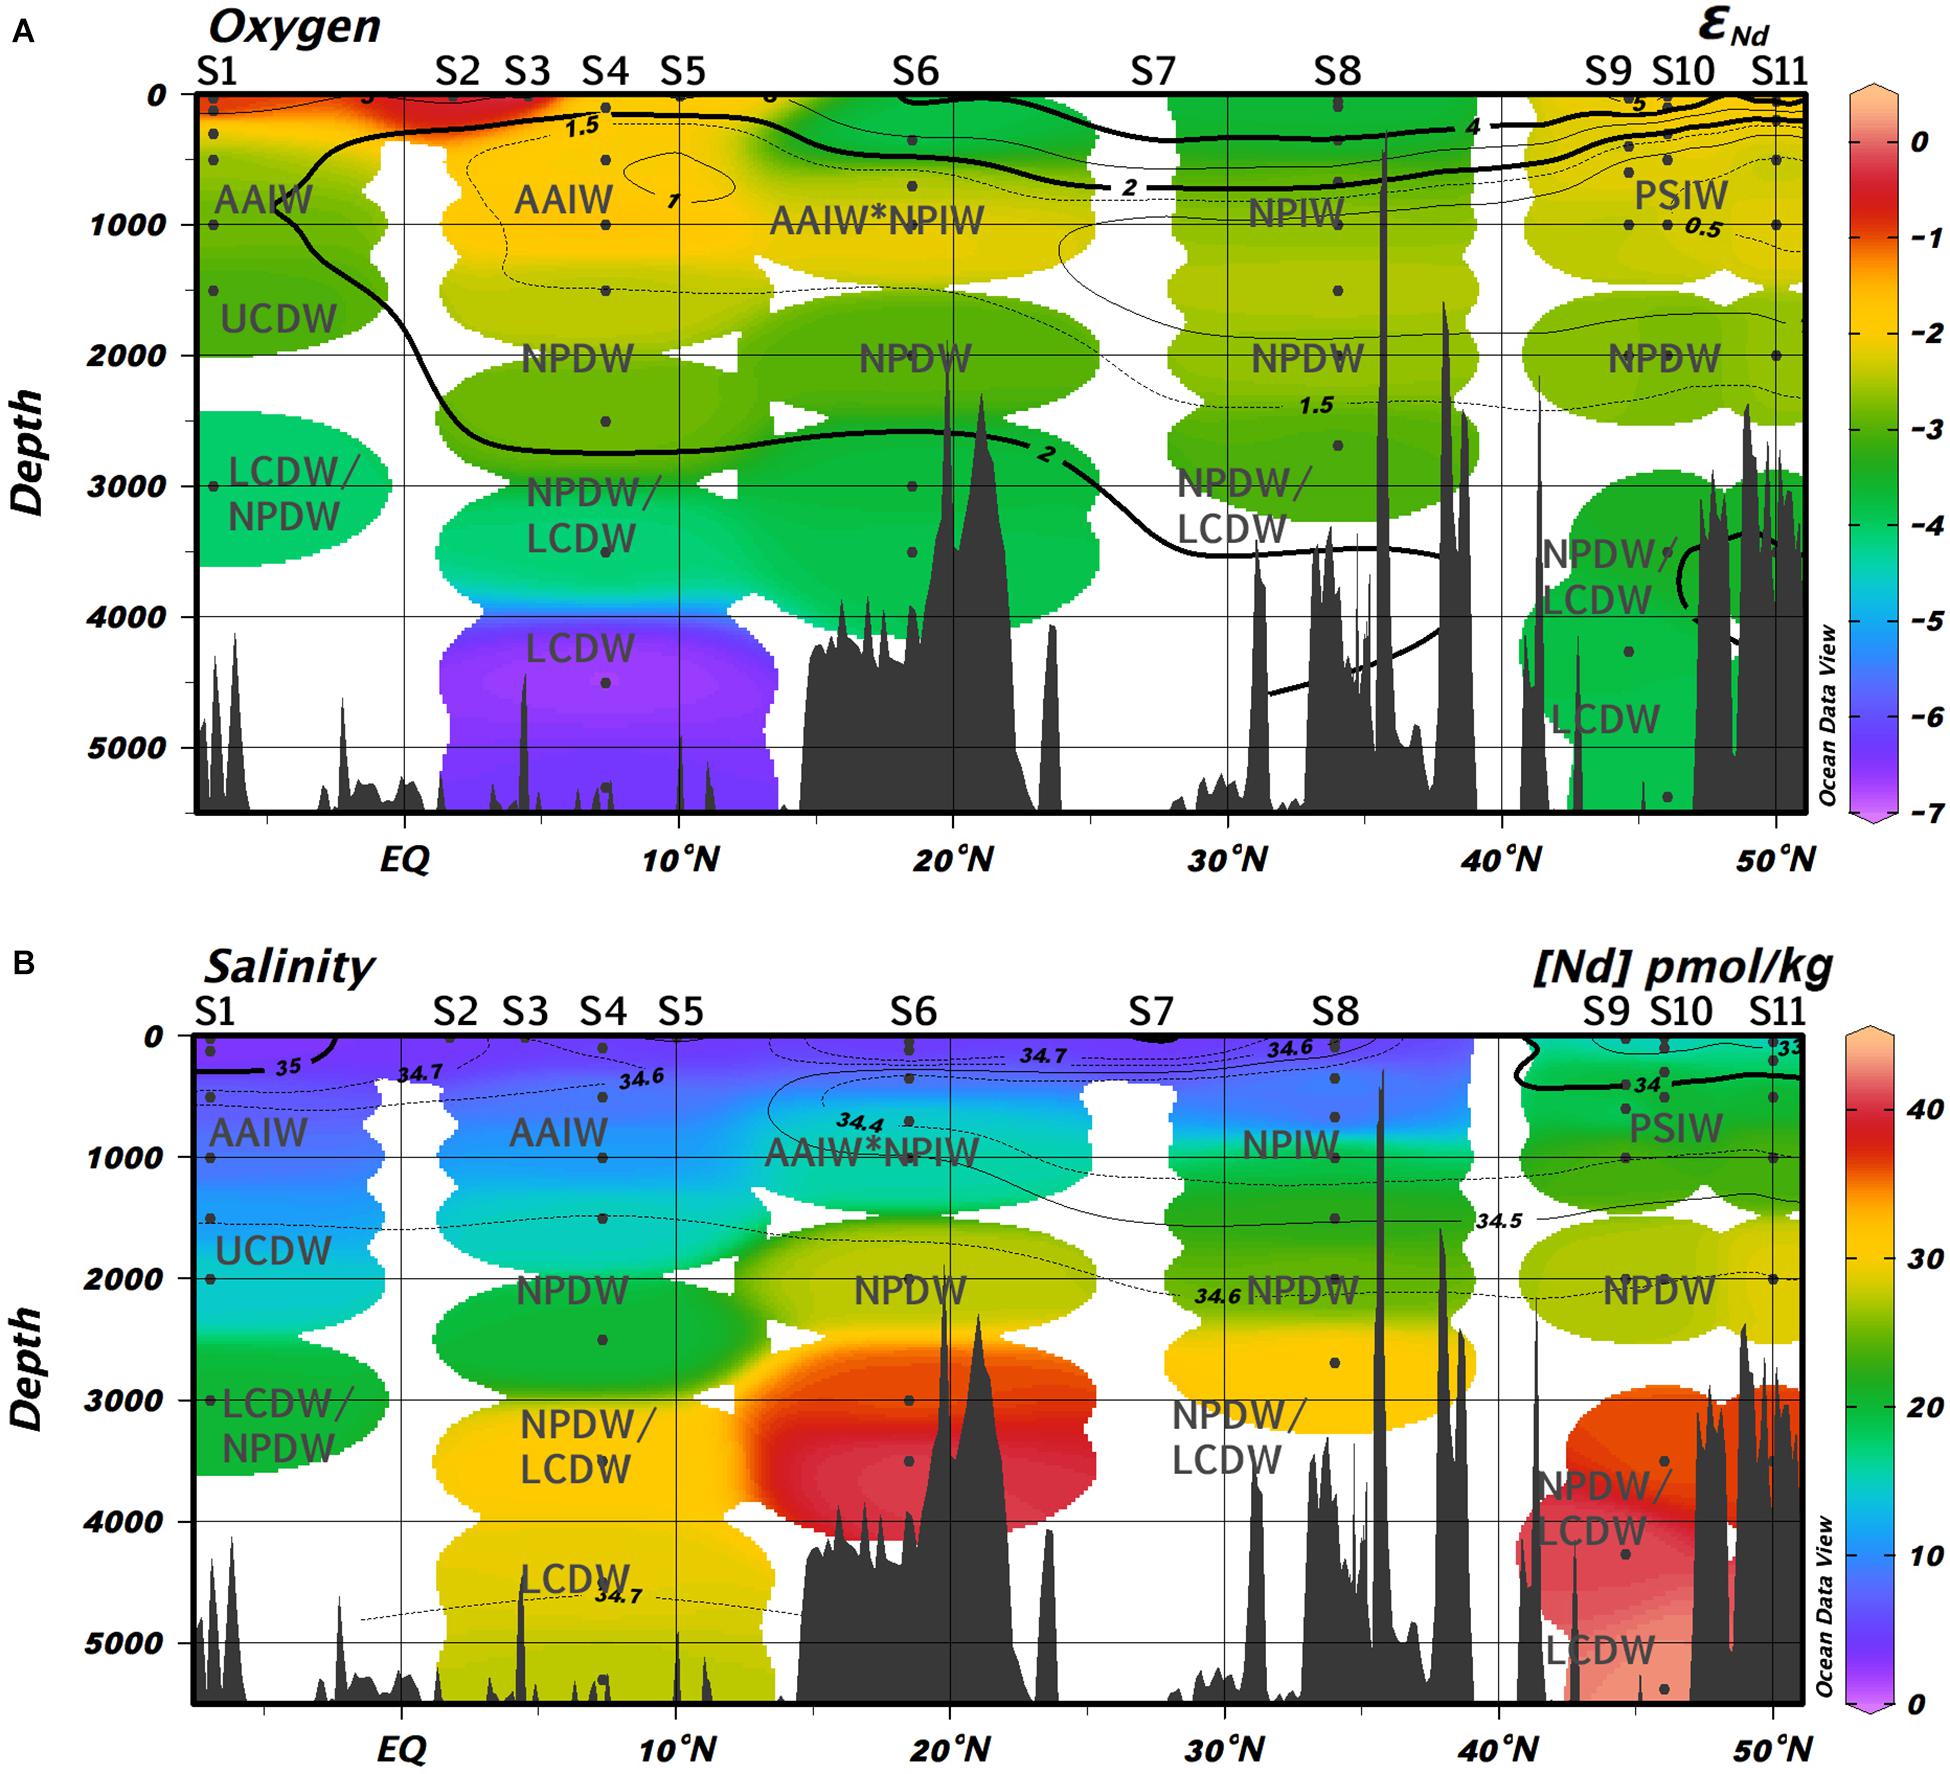
Figure 4. Color-coded εNd and [Nd] along a longitudinal section (168.5°E to 179.8°W) from ∼7°S to ∼51°N. The proxy distribution patterns are underlain by oxygen (A) and salinity (B) isolines which outline the various water masses discussed in the text. Created by using Ocean Data View (Schlitzer, 2020) and further modified.
Southern-sourced surface waters can be identified by a large range of temperatures (19.5°C – 29.6°C) and salinities exceeding 34, while northern-sourced surface waters are confined to a narrow T-S range with salinities below 33. The salinity distribution at surface and intermediate depths thus is inherently linked to latitude. The surface and subsurface water masses can be divided into three zones based on their Nd isotope compositions (Figures 2, 4). The most radiogenic southern zone, representing the Equatorial Current System (ECS) stretches from 7°S to 4.5°N with the most radiogenic εNd signatures ranging between −0.8 ± 0.3 at S1 and 0.1 ± 0.3 at S3. A clear salinity maximum (36.18, S1, 157 m) indicates the presence of SPEW (Tomczak and Godfrey, 2013b; Behrens et al., 2018). Between 7°N and 10°N, cooler (T = 19.5°C, S4, 100 m) and fresher (salinity 34.71, S4, 100 m) NPTW follows the NEC in a westerly direction, and is marked by an εNd value of −2.1 ± 0.3 and a [Nd] of 5.0 pmol/kg. Further north, between 30°N and 40°N, changes in εNd and [Nd] values mirror the oxygen concentrations. There, the WNPCW has an Nd isotope composition of −3.7 ± 0.9 (S8, 350 m) and is marked by [Nd] values of 9.5 pmol/kg, while the oxygen-rich less saline northern surface waters carry a more radiogenic signal between −1.7 ± 0.2 and −2.1 ± 0.2, with [Nd] values ranging between 13.3 pmol/kg and 15.3 pmol/kg.
In the intermediate water layer between 500 and 1000 m depth, the water mass distribution is more complex (Figures 2, 4). At the southernmost station an oxygen minimum (1.85 ml/l) at 930 m depth marks the lower boundary of an intermediate water, which has T-S properties indicative of AAIW and εNd signatures ranging around −2.7 (S1, 500 and 1000 m and S1, 1000 m). At 7°N (S4), this water is clearly identifiable as AAIW based on T-S properties, εNd ranging between −2.0 ± 0.3 (500 m) and −1.7 ± 0.2 (1000 m), and [Nd] ranging between 8.8 pmol/kg and 11.2 pmol/kg. Between 33°N and 50°N (S8–S11), the εNd and [Nd] values follow the oxygen distribution. A clear oxygen minimum shallows from a core depth of 1300 m and 0.57 ml/l at S8 at mid latitudes to concentrations of 0.30 ml/l at a core depth of 770 m at the northernmost station (S11). This minimum zone is overlain by a salinity maximum referred to as NPIW (Tomczak and Godfrey, 2013b), which can be subdivided into two layers: A lower old layer with low oxygen content and higher salinity and an upper new layer characterized by higher oxygen content and lower salinity (Yasuda, 2004; Amakawa et al., 2009). This layering is also reflected by [Nd] and εNd signatures. Within the O2 minimum zone εNd and [Nd] values range between −2.6 ± 0.2 (S8, 1000 m) and 23.6 pmol/kg (S9, 1000 m) and −2.2 ± 0.2 (S10, 500 m) and 19.6 pmol/kg (S8, 1000 m), respectively. In the more oxygenated waters, εNd ranges between −3.8 ± 1.1 and −3.6 ± 1.1 with Nd concentrations between 8.9 pmol/kg and 9.5 pmol/kg.
Deep-waters of all stations have clear T-S characteristics of LCDW (Figure 2). At salinities between 34.67 and 34.69, this water flows northwards along bottom topography. At the southernmost stations the least radiogenic deep-water εNd signatures are found (εNd = −6.7 ± 0.2, S4 at 4500 m) (Figure 4). The Nd isotope composition continuously becomes more radiogenic with latitude peaking at S10 (εNd = −3.4 ± 0.2 at 3500 m). Oxygen concentrations slightly decrease northwards from 2.32 ml/l (S4) to 1.98 ml/l (S10). UCDW (salinity 34.59, θpot 2.92°C) has characteristically higher O2 values (2.2 ml/l) than all other waters at the corresponding depth and is only observed at station S1 at a depth of 1500 m. After upwelling in the northern basins LCDW is transformed into NPDW, which is encountered at S11 at 2000 m depth. After becoming less saline (34.6) and warmer (θpot = 1.68°C), NPDW flows west- and further southwards with εNd values around −2.6 ± 0.2. Along the entire section the waters at this depth have very similar hydrographic characteristics with θpot between 1.68°C and 2.06°C (at S11 and S1, respectively) and salinities between 34.58 and 34.64 (at S8 and S4, respectively). An excursion to slightly less radiogenic signatures is found at S6 (εNd = −4.0, 2000 m). The lower deep-water masses have very similar O2 values, whereas the upper deep layer reveals northwards decreasing oxygen levels, which are accompanied by increasing [Nd]. An exception to that trend occurs at S6, where the concentrations are higher than at the neighboring stations.
Discussion
Origin, Circulation and Mixing of Equatorial Surface Waters Based on εNd Distributions
Previous investigations have shown that radiogenic inputs from Papua-New-Guinea (PNG) and advection of less radiogenic waters from the open Pacific control the εNd and [Nd] signal in the Equatorial Current System (Lacan and Jeandel, 2001; Grenier et al., 2013; Behrens et al., 2018, 2020). The impact of weathering inputs is expected to be visible in surface waters as reflected in our and Behrens et al.’s (2020) data. Behrens et al. (2020) suggested that surface waters flowing eastward from the PNG region toward the open Pacific have distinctly higher Nd concentrations than waters flowing in the opposite direction. In our data, this contribution is reflected in the [Nd] distribution and even more clearly indicated by the εNd signatures (Table 2 and Figure 5). Figure 5 shows a close-up of the upper water column properties between 7°S and 15°N with εNd and salinity values measured in this study and the positions of the near-surface currents. Station S1 is located in the core of the eastbound SECC, which transports radiogenic Nd from PNG into the open Pacific (Behrens et al., 2020). Salinities, εNd and [Nd] values of the surface sample (25 m) of this station are consistent with shallow samples (21 and 41 m) recovered only 1° south and 14° west of S1 (station GeoB17018, Behrens et al., 2018), indicating that near-surface transport of the PNG-derived Nd signal via the SECC is a robust feature that persists along its flow-path. Behrens et al. (2018) identified SPEW at 150 m depth indicated by a clear salinity maximum of 36.19 that carries an εNd value of −1.7 ± 0.3, suggesting that this Nd signal is picked up from the Solomon Islands. At S1 water sampled at 125 m depth with a salinity of 35.84 is marked by a more radiogenic εNd value of 0.7 ± 0.3. Despite the fact that this sample was taken above the salinity maximum and therefore above the core depth of SPEW, a shift by one epsilon unit compared to Behrens et al. (2018) is significant. Hence, the transport of surface waters from which Nd may be supplied via reversible scavenging, as described by Amakawa et al. (2009), must have changed since a more radiogenic surface signature than that obtained at S1 would be required to supply radiogenic Nd to subsurface waters. A reason for this change may be the strong seasonal variability of the NEC and the SECC suggested by Eldin (1983) and Wang et al. (2016) as both currents weaken during boreal winter and strengthen during boreal summer. During southern hemisphere summer, there is an enhanced eastward transport of surface waters from PNG via a strong SECC. Since this transport mainly affects the upper 100 m (Kessler and Taft, 1987), these waters could provide their radiogenic εNd to the underlying SPEW via reversible scavenging. In July, when our samples were collected, this water mass may have been overlain by slightly less radiogenic waters from the western equatorial Pacific (Grenier et al., 2013; Molina-Kescher et al., 2018) due to a collapsed SECC (Wang et al., 2016). Behrens et al. (2018) collected their samples in boreal autumn after a persistent period of westward flow along 7–8°S, which may explain the less radiogenic values in SPEW as well as in the overlying waters. The more radiogenic Nd isotope signatures of the NECC compared to those of the SECC including the surface εNd at S2 (−0.5 ± 0.2) are consistent with the data of Grenier et al. (2013) at 2°N (εNd = −0.8 ± 0.1, station EUC-Fe 13, Figure 1) obtained from samples collected in September. This again supports the long-range transport of the PNG-derived Nd signal via a strongly developed NECC during northern hemisphere summer (Wang et al., 2016). At S4 (7.2°N), within the NEC that carries water from the open Pacific westwards, the signal becomes significantly less radiogenic (εNd = −2.1 ± 0.3). Waters sampled by Behrens et al. (2018) at station GeoB17014 (−1.7, 121 m, θpot = 23.48) are more radiogenic and significantly warmer, which suggests a stronger influence of the NECC. The border of the NECC during northern summer was thus located between these two stations at ∼7°N. Overall, the above observations indicate that radiogenic Nd inputs from PNG and the seasonal variability of the equatorial counter currents exert the main control on the εNd signatures of both the NECC and the SECC.
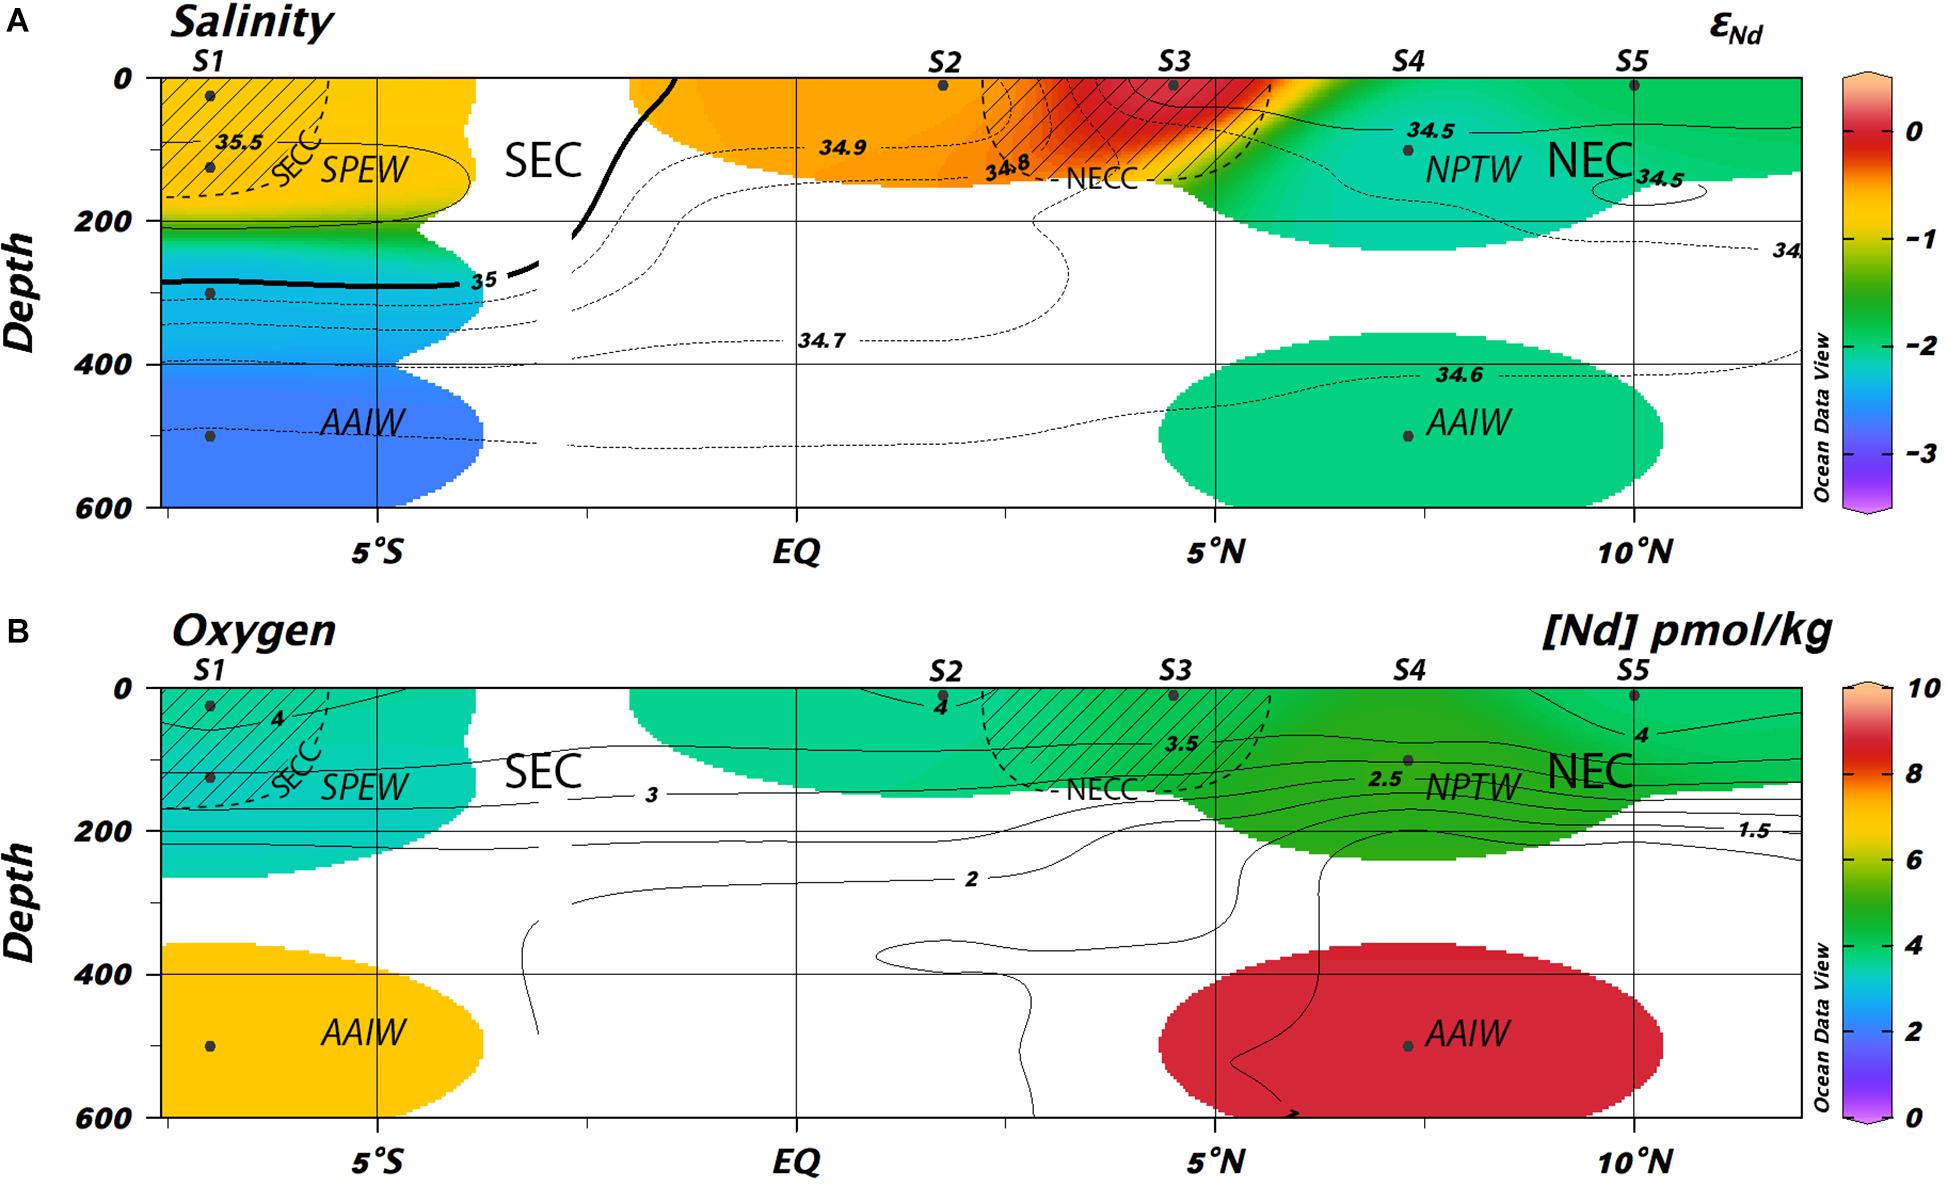
Figure 5. Close-up of the εNd and [Nd] section between 7.5°S and 15°N and 0–600 m water depth with color-coded εNd and [Nd] values and salinity (A) and oxygen contours (B). Approximate positions of water masses (italics) and major surface currents (bold) are marked. Shaded areas indicate eastward flow. Created using Ocean Data View (Schlitzer, 2020) and further modified.
Nd Transformation Processes at Intermediate Depths and Implications for the Quantification of Intermediate Water Mass Circulation
Antarctic Intermediate Water (AAIW)
In the southern Pacific at a depth of 500–1000 m and in a density range between 26.8 kg/m3 and 27.5 km/m3 (Schmitz, 1996), AAIW carries a less radiogenic εNd signal of −5.3 ± 0.1 before passing PNG (Behrens et al., 2018). Lacan and Jeandel (2001, 2005) suggested that during this passage the εNd signal shifts to a more radiogenic value of −2.8 as a consequence of boundary exchange with highly radiogenic sediments of the volcanic PNG region (Grenier et al., 2013; Behrens et al., 2018). This shift is also reflected in our data and is accompanied by constant [Nd] values. The hydrographic properties of waters encountered between 500 and 1000 m depth at S1 and S4 clearly identify AAIW (Figure 4 and Table 1). Thus, in combination with the lowest oxygen concentrations, we assume the intermediate waters at S4 to reflect the return flow of AAIW (Kawabe and Fujio, 2010) advected within the equatorial subsurface counter currents (Lacan and Jeandel, 2001) (also referred to as Equatorial Pacific Intermediate Water, EqPIW; Bostock et al., 2010). The εNd signature of −2.8 ± 0.3 at S1 (500 and 1000 m) can either be explained through modification by boundary exchange processes near the PNG region (Lacan and Jeandel, 2001, 2005) as also suggested by Behrens et al. (2018), or by radiogenic Nd inputs from the Society Islands, Tuamoto and Tubai Islands (Molina-Kescher et al., 2018). Furthermore, the εNd signals at station S4 at 500 and 1000 m depth (−2.0 ± 0.3 and −1.7 ± 0.2, respectively) are very similar to the values reported by Behrens et al. (2018) for the same latitude (−1.6 ± 0.3 and −1.8 ± 0.4, respectively, GeoB17019) but differ markedly from those obtained at S1 (−2.7 ± 0.2 and −2.8 ± 0.3, respectively). We suggest that the initial shift toward more radiogenic signatures is closely linked to AAIW interaction with PNG and consistent with boundary exchange near the ocean margins (Lacan and Jeandel, 2001). This assumption is based on the fact that the Nd concentrations at GeoB17019, GeoB17018 (Behrens et al., 2018) and S1 are essentially invariant. In contrast, Nd addition via benthic fluxes (Abbott et al., 2015a) or vertical processes (e.g., reverse scavenging, Amakawa et al., 2009) would lead to elevated Nd concentrations. Slightly higher [Nd] at S4 (8.8 pmol/kg) compared to S1 (7.0 pmol/kg) along with more radiogenic εNd values point toward exchange with or contributions from the South American shelf areas (εNd = 1.6 ± 0.4 at 1.66°N, Grasse et al., 2012) via boundary exchange presumably including benthic fluxes (Abbott et al., 2015a). Benthic fluxes describe the supply of elements from the pore waters to the water column (Abbott et al., 2015a,b) and hence a source term that results in elevated [Nd] values. The term boundary exchange encompasses a number of source and sink processes, for which the total source term equals the total sink term for [Nd] and which thus does not alter the [Nd] values of a water mass (Jeandel, 2016). Irrespective of the exact modification processes we find a modified AAIW/EqPIW near 7° N with stable S-T and Nd isotope composition and concentration properties (S4, this study and GeoB17011/14, Behrens et al., 2018), which we apply as the modified AAIW endmember in mixing calculations for offshore intermediate waters further north in the open North Pacific.
After its return to the western equatorial Pacific, modified AAIW partly exits the North Pacific via the Indonesian Throughflow, while another part is entrained in NPIW (Kawabe and Fujio, 2010) thereby affecting its Nd isotope composition toward more radiogenic signatures.
North Pacific Intermediate Water (NPIW)
To further investigate the influence of modified AAIW on NPIW and other northern Pacific intermediate waters, mixing calculations were carried out as follows:
and
where f1 and f2 are the mass fractions of two endmembers in the sample, respectively, S is the salinity and εNdmix is the εNd value of the mixture of the two end-members in each sample (e.g., Laukert et al., 2017). Three end-members (Figure 6 and Table 3) for the mixing calculation were chosen in accordance with the formation areas and pathways of NPIW identified in previous studies (You et al., 2000; You, 2003; Amakawa et al., 2004a, b; Yasuda, 2004; Tomczak and Godfrey, 2013a) and were complemented by a fourth end-member representing the intermediate water initially supplied from the southern Pacific (i.e., modified AAIW/EqPIW at S4). The mixing of each combination of end-members was calculated resulting in a mixing envelope that indicates the fractions of the end-members for each sample.
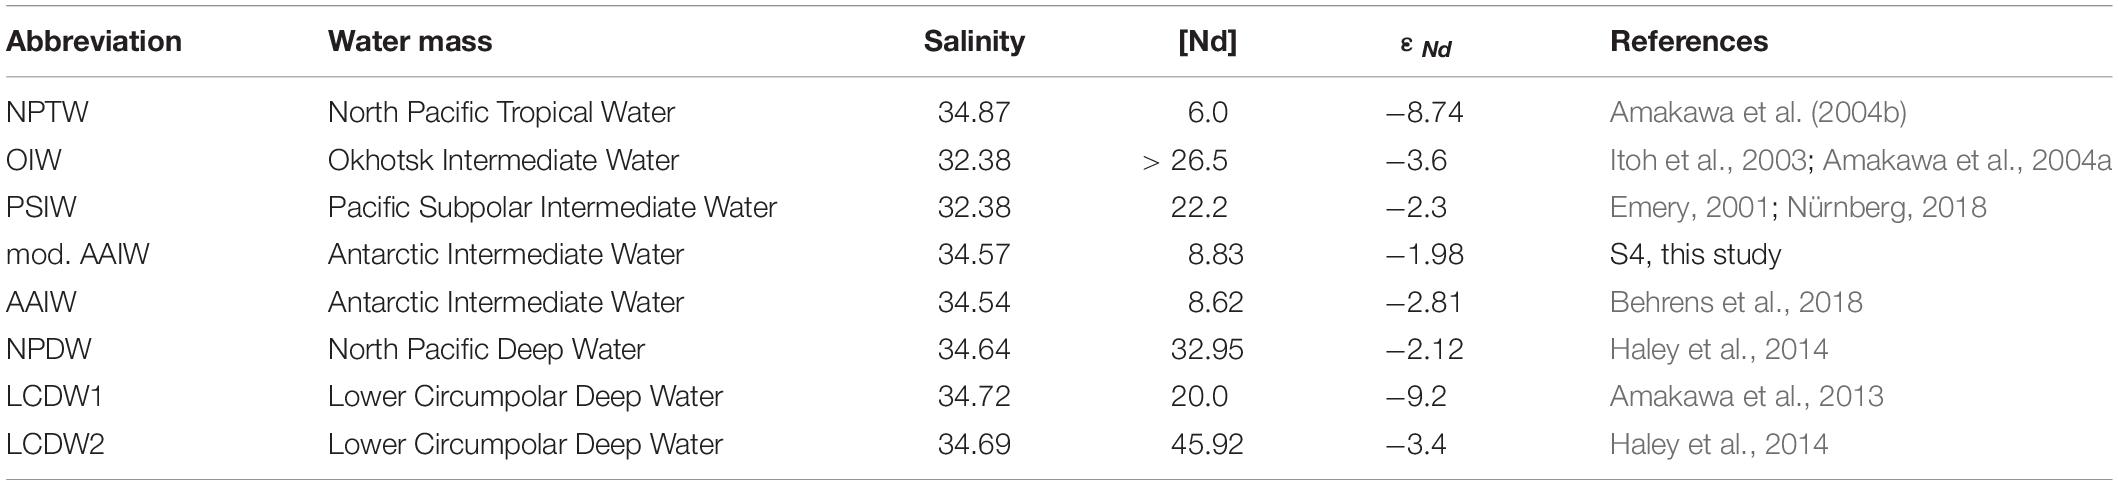
Table 3. End-member compositions used for mixing calculations.
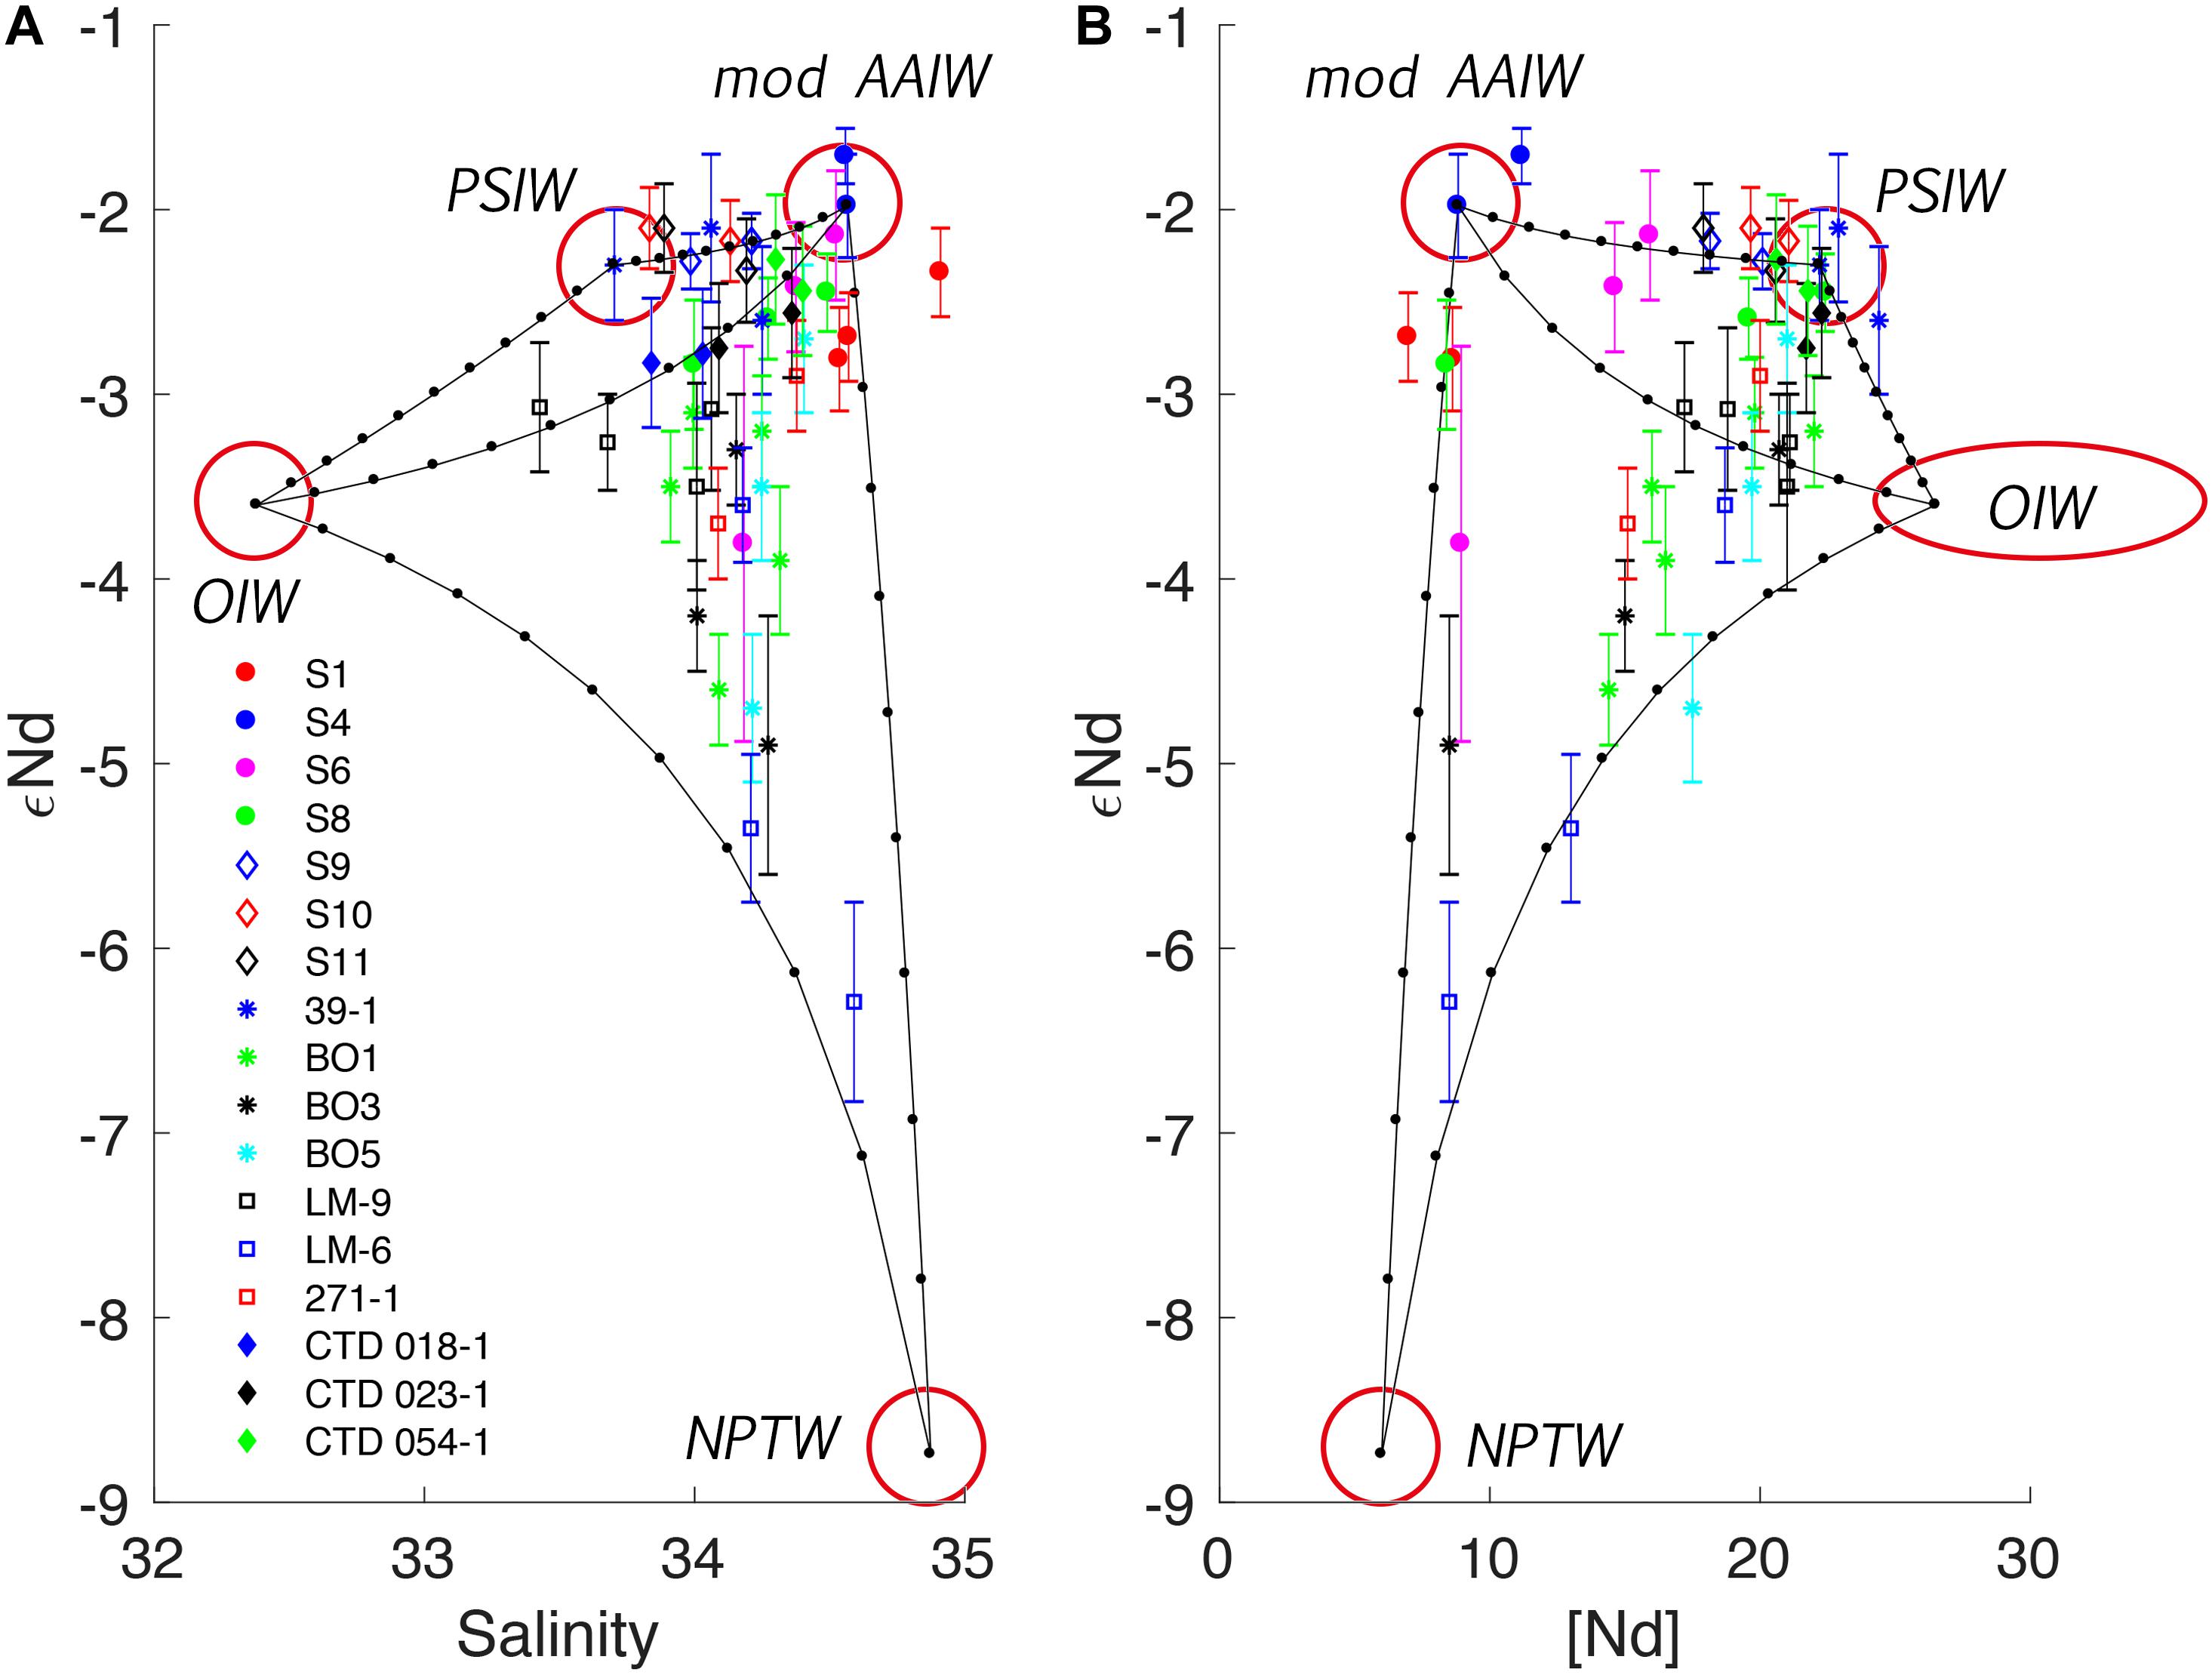
Figure 6. Mixing relationships of major intermediate water masses (25.8 < σθ < 27.4) in the North Pacific based on εNd and salinity (A) and εNd and [Nd] (B). NPTW and OIW represent waters of the Kuroshio and the Oyashio respectively. PSIW reflects values at station 39-1 whereas mod AAIW is intermediate water found at station S4. Calculated mixing lines between the four end-members (Table 3) with 10% increments (black dots) are displayed.
Figure 6 shows mixing relationships for all intermediate waters based on data from this study as well as previously reported data (Piepgras and Jacobsen, 1988; Amakawa et al., 2004b, 2009; Haley et al., 2014; Behrens et al., 2018). Despite a small shift of some samples toward higher concentrations in intermediate water samples obtained from the entire northern Pacific, their signatures are consistent with the mixing envelope defined by the four end-members, thus indicating the dominating influence of lateral transport, since vertical input (reverse scavenging or benthic flux) would be reflected in a constant off-set in [Nd] toward higher values. Most intermediate waters found at stations north of the Kuroshio Extension (KE) plot on a mixing line between PSIW encountered at TPS47 39-1 (Piepgras and Jacobsen, 1988) (σ = 26.877 kg/m3) and modified AAIW at station S4. This clearly indicates a strong influence of southern Pacific derived intermediate waters on the northernmost Pacific intermediate waters. Hence, the contribution of modified AAIW from equatorial regions to the intermediate layer of the North Pacific may be higher than previously assumed (You et al., 2000; Yasuda, 2004; Amakawa et al., 2009). The Nd isotopic signatures of intermediate waters located south of station S9 suggest admixture of Okhotsk waters mixed in the Oyashio Current (Amakawa et al., 2004a, b) and NPTW entrained in the Kuroshio currents. Amakawa et al. (2004b) proposed that highly radiogenic inputs from the Aleutian Chain and the Kamchatka Peninsula transported by the Oyashio current are traceable at the isopycnal surface of 26.8 kg/m3 for NPIW in the North Pacific STG. At station S8, which is located just south of the trajectory of the waters of the KE, the Nd isotope signature at this surface (depth = 670 m) is more radiogenic (εNd = −2,8) than that at station LM-9 (Amakawa et al., 2004b), which represents undiluted Oyashio waters immediately before their advection to the open Pacific. The reduced [Nd] values at S8 (8.4 pmol/kg) compared to LM-9 (21.1 pmol/kg) (σθ = 26.8 kg/m3) support the contribution of an additional water mass to the intermediate layer at station S8. OIW has an εNd signature around −3.6 (Amakawa et al., 2004b) and can therefore not account for this radiogenic excursion (Figure 6). Salt fingering (You et al., 2000) and eddy activity (Tomczak and Godfrey, 2013b) may explain the homogenous εNd values observed above densities of 26.8 kg/m3, but the strong stratification of the water column inhibits vertical mixing with deeper waters in this region (You et al., 2000). Vertical transport can also be excluded, as the εNd values at shallower depths are not radiogenic enough to explain the value at 670 m. The corresponding sample SO264-8-4/14,15 plots in the mixing field of modified AAIW and NPTW (Figure 6), which supports a large contribution of modified AAIW as far north as station S8. At station 271-1 (Piepgras and Jacobsen, 1988) which is located further west (Figure 1), the intermediate waters carry a less radiogenic εNd signal (−3.7, 640 m), which is closer to the values reported by Behrens et al. (2018) for their northern stations. Hence, these waters appear to be a mixture of modified AAIW and waters from the Chinese Sea that contribute to a less radiogenic upper layer of the NPIW. This is also consistent with the results of Amakawa et al. (2004b, 2009), who determined relatively unradiogenic values (εNd = −5.4) for NPIW off the Japanese coast.
Interestingly, signatures determined for the GAIW in the Gulf of Alaska (Haley et al., 2014) plot within a mixing field defined by OIW (Amakawa et al., 2004a), modified AAIW and PSIW from station TPS47 39-1 (Piepgras and Jacobsen, 1988; Figure 1), suggesting that the waters of the Gulf of Alaska are strongly influenced by intermediate waters from the western and southern North Pacific. This is also consistent with findings of Abbott et al. (2015b), who reported Nd values off the Oregon margin that would plot between AAIW, OIW and PSIW, suggesting that the Nd isotopic composition of these intermediate waters is controlled by conservative mixing rather than by benthic Nd release. Several studies suggested that the Gulf of Alaska is a formation region of the NPIW (You et al., 2000; Amakawa et al., 2004b; Yasuda, 2004; Zenk et al., 2005; Bostock et al., 2010; Kawabe and Fujio, 2010), which is, however, not supported by Nd isotope signatures obtained in this study. Only slightly increasing Nd concentrations, but more radiogenic εNd values, were observed at stations S9, S10, and S11, where PSIW has passed the Aleutian Chain (Figure 1), leading to the assumption that the Nd budget in this area is controlled and balanced by radiogenic weathering inputs (Amakawa et al., 2004b) and removal driven by scavenging (Siddall et al., 2008) in a high productivity area (Talley et al., 2011).
The data overall clearly show that the isotopic composition and concentration of dissolved Nd in intermediate waters of the entire North Pacific can be explained by conservative mixing processes, if an initial alteration of end-members near the continental sources of PNG is accounted for. Thus, we conclude that Nd isotopes are a suitable tracer of intermediate water mass mixing in this region. The case of deep-waters is more complex and will be discussed below.
Processes Controlling [Nd] and εNd Distributions of Deep-Waters
Three processes within the water column control the distribution of dissolved Nd concentrations: external inputs, lateral transport, and vertical transfer. The latter includes reversible scavenging that leads to elevated Nd concentrations in deep water (Siddall et al., 2008). This process is particularly important in the northern Pacific due to the sluggish water mass movement and is also reflected by our data (Figures 3, 4). In addition, interaction with bottom sediments must be considered (Lacan and Jeandel, 2005; Abbott et al., 2015a, b; Jeandel, 2016; Haley et al., 2017; Du et al., 2020).
To differentiate between the impact of each process, mixing calculations were carried out for the deep-waters (>1500 m depth) based on the equations provided in section “North Pacific Intermediate Water (NPIW)”. As shown in Figure 7, two end-members were chosen for LCDW, which are pristine LCDW entering the North Pacific (Amakawa et al., 2013) and an altered LCDW reflecting deep-water found in the Gulf of Alaska (Haley et al., 2014). The NPDW end-member represents waters formed in the north-east Pacific through transformation of altered LCDW via upwelling (Kawabe and Fujio, 2010). As a fourth end-member, intermediate water at station S1 (one sample at 1000 m depth) was chosen representing a mixture of modified and pristine AAIW (see “Antarctic Intermediate Water (AAIW)”). This water mass circulates directly above the UCDW and is hence likely to mix with the latter on its way into the northern Pacific. To quantify non-conservative contributions, the difference in εNd and [Nd] between measured values and those expected from water mass mixing was calculated. Deviations from conservative mixing exceeding ± 0.6 εNd units and ± 0.9 pmol/kg [Nd] were defined as indicating non-conservative behavior. This is based on the max. 2SD uncertainties of the Nd isotope measurements (Table 2) and on a 2% uncertainty of the [Nd] measurements. The excess calculations were carried out following
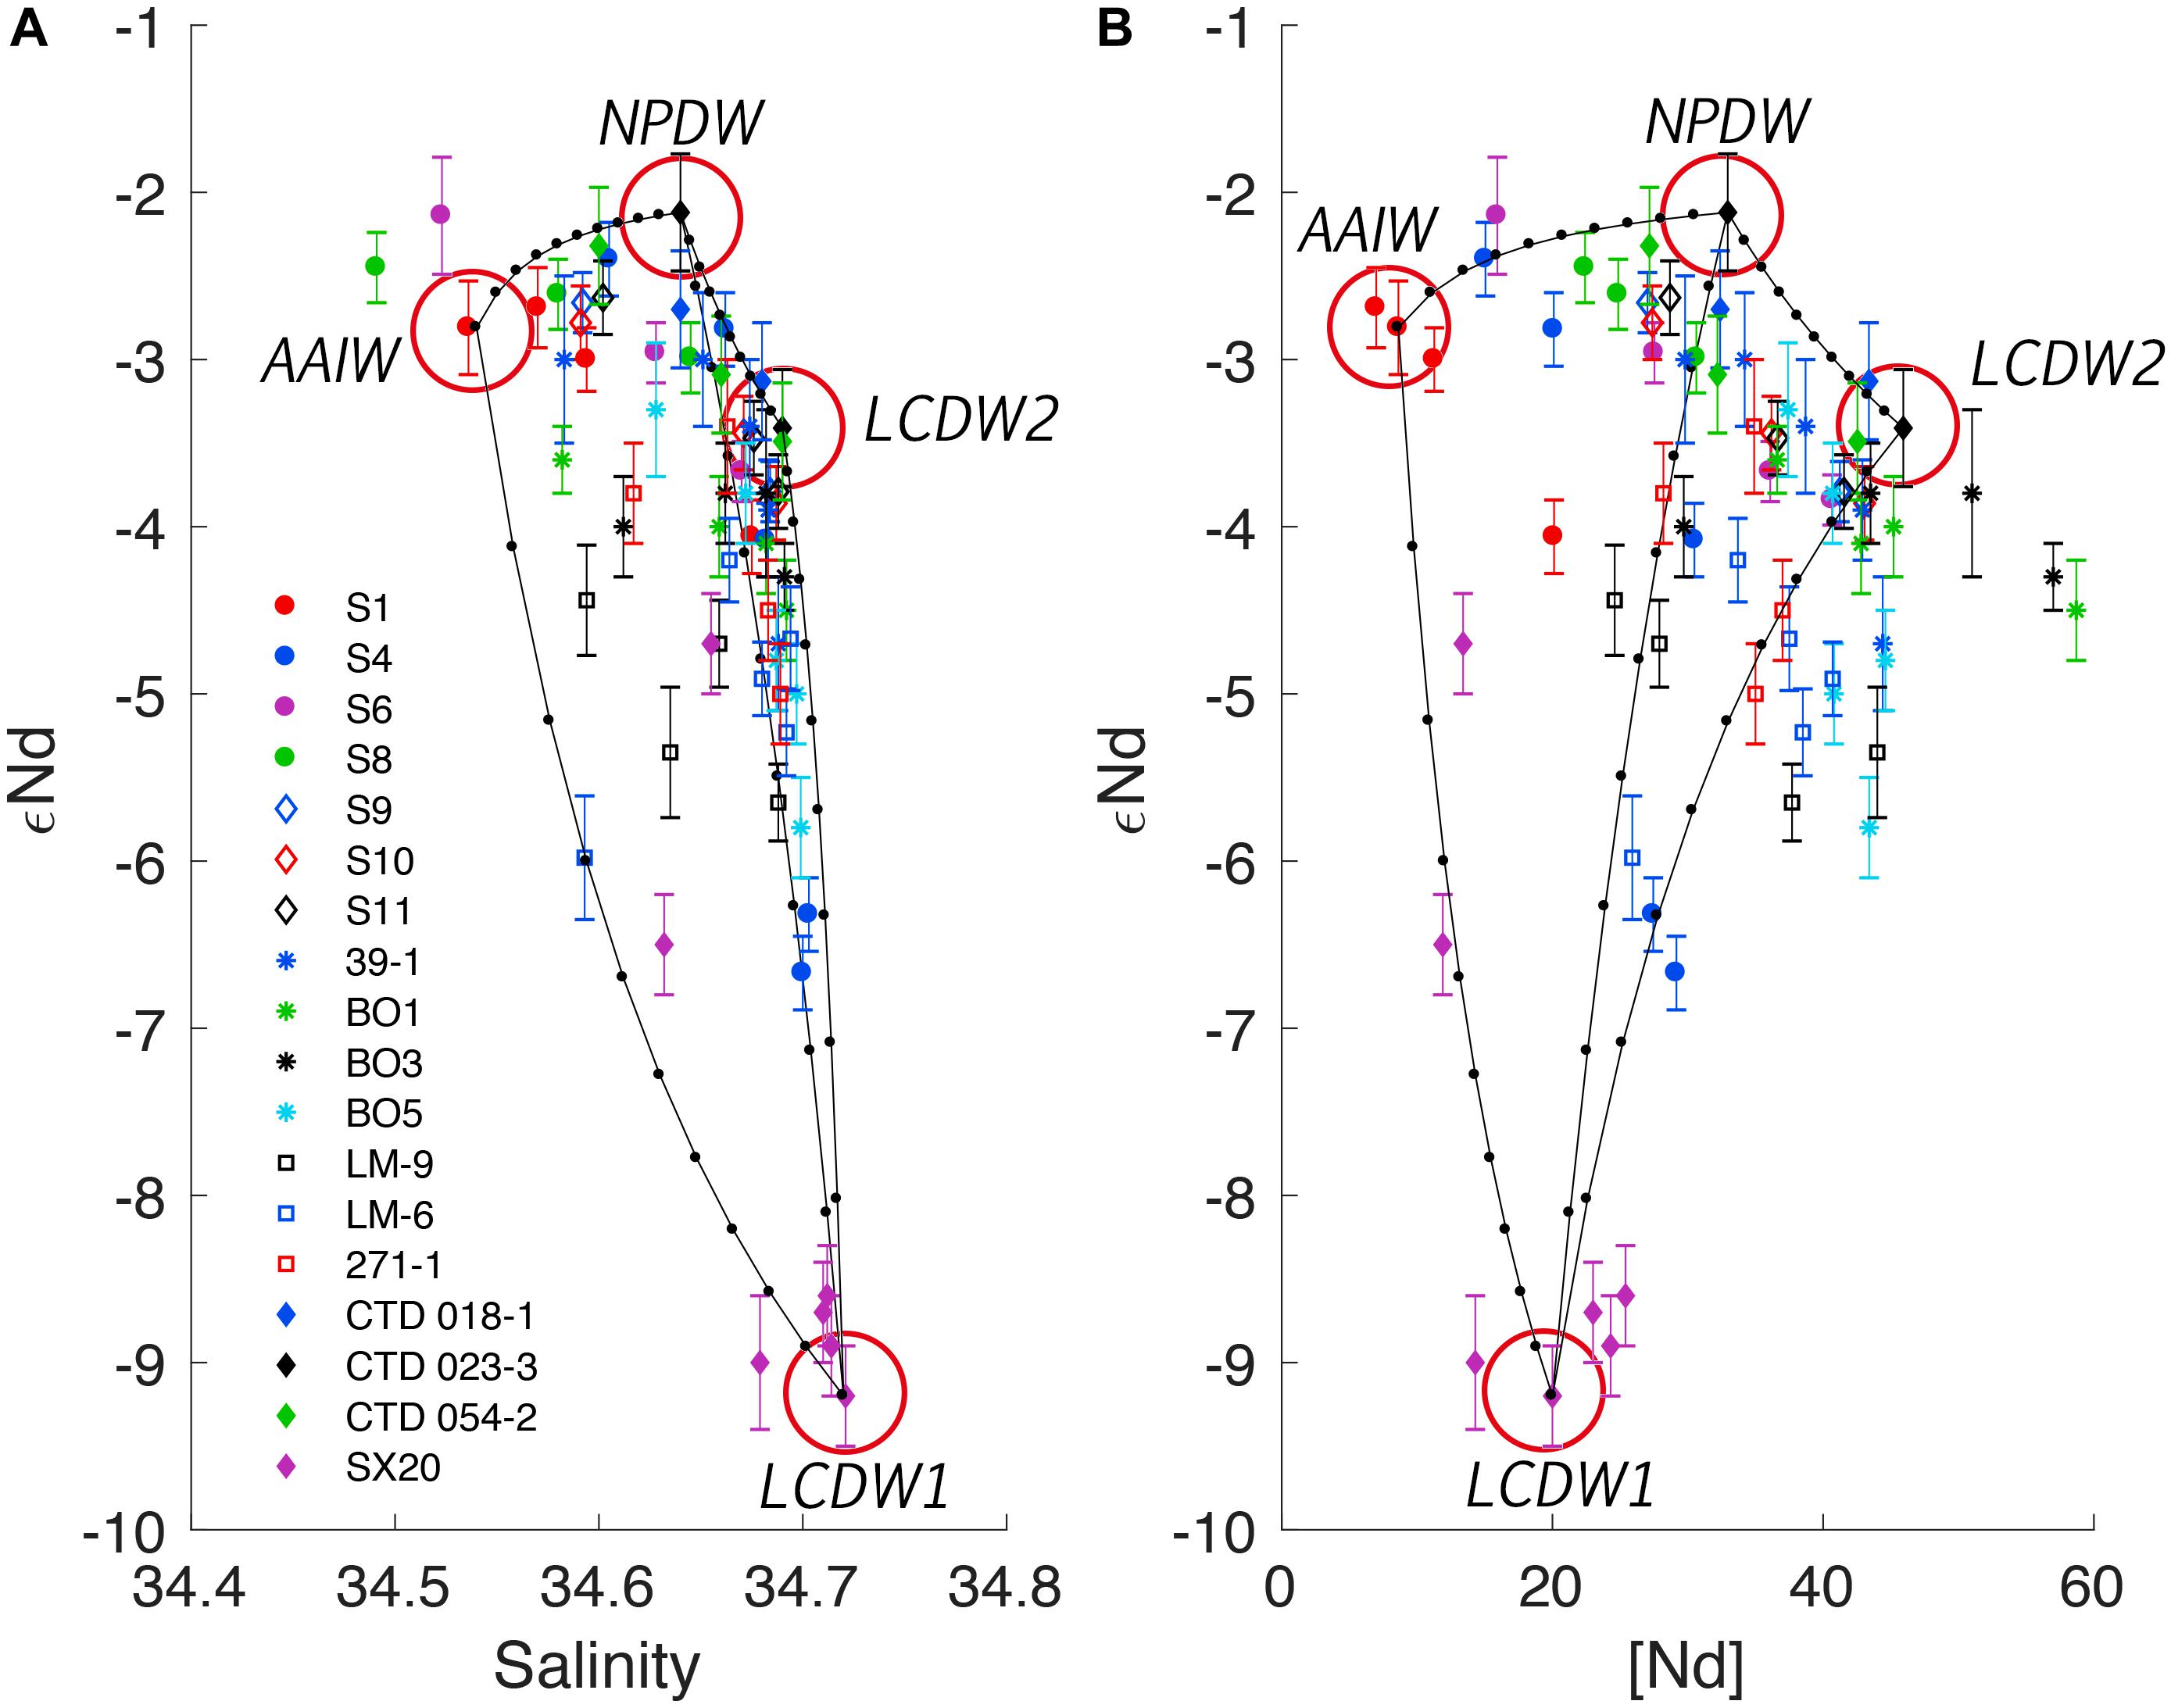
Figure 7. Mixing relationships of major deep-water masses in the northern Pacific based on Nd isotope compositions, salinity (A) and [Nd] (B). LCDW1 represents pristine LCDW1 from the South Pacific (Amakawa et al., 2013), LCDW2 represents LCDW as found in the Bay of Alaska (Haley et al., 2014). The NPDW end-member was chosen just after its transformation from LCDW in the Bay of Alaska, and AAIW represents pre-modified AAIW found at station S1. Calculated mixing lines between the four end-members with (Table 3) 10% increments (black dots) are displayed. As discussed in the text, these mixing relationships cannot be considered quantitative due to the effects of non-conservative inputs along the flow path of the deep-water masses.
with 1 and 2 representing two stations along the flow path of a water mass.
At depths below 3000–3500 m, slightly altered LCDW is advected into the north-western Pacific at a neutral density of 28.0–28.27 with salinity values ranging between 34.62 and 34.73 (Emery, 2001; Tomczak and Godfrey, 2013b; Behrens et al., 2018), and [Nd] ranging between 27.5 and 29.2 pmol/kg (station S4, 4500 and 5300 m). Compared to the southern Pacific end-member, LCDW and UCDW have significantly more radiogenic εNd signals of −6.3 ± 0.2 (LCDW, S1) and −3.0 ± 0.2 (UCDW, S4). Exchange with hydrothermal particles in the Tonga-Lao Basin or boundary exchange with sediments along the Samoan Passage (Behrens et al., 2018) have been invoked previously to explain the shifts in the LCDW composition. However, the Nd isotopic values of LCDW found at station S4 can also be fully explained by mixing between the LCDW originating from station SX-20 (Amakawa et al., 2013) and NPDW/LCDW originating from the Bay of Alaska (Haley et al., 2014; Figure 7). Considering the general pathways of LCDW and NPDW (Figure 1), their T-S characteristics at all stations above 3500 m (Figure 2 and Tables 1, 2), and the sluggish movement of these water masses, this is a possible explanation for the shift toward more radiogenic values in the upper layer of LCDW north of the equator. Considering the close-to stable salinity of the deeper samples, though, non-conservative external inputs (e.g., vertical transport via scavenging and contributions from benthic fluxes) must be responsible for the alteration of bottom waters.
Along the pathway of LCDW further north a clear trend toward more radiogenic εNd values and higher [Nd] is persistent which might indicate admixture of both northern end-members (NPDW and LCDW). Still, all samples at station S1 as well as at station S4 above 3500 m have a deficit in [Nd] compared to what is expected from water mass mixing only. The deeper samples at station S4 as well as most samples further north indicate increasing [Nd] excess with depth. Hence, the alteration of LCDW most likely results from a combination of water mass mixing at depths between 2000 and 3500 m and non-conservative processes affecting the entire deep-water range. Nd excess calculations reveal that addition of Nd with εNd values around +1.0 would lead to an initial alteration of pristine LCDW toward the values determined at station S4. This addition could be explained by benthic Nd release (Abbott et al., 2015a, b) along the Samoan Passage (Figure 1, εNd = +2.3 ± 2.2, Behrens et al., 2018). The verification of these alteration processes is, however, not possible due the lack of available data, such as pore water Nd isotopic compositions and concentrations as well as the precise area of the interacting sediment surfaces. Along the western branch of the trajectory of LCDW (Figure 4), in the tropical Pacific (stations S1–S4, Behrens et al., 2018) and the northernmost Pacific (stations S10, S11, including the Bay of Alaska, Haley et al., 2014) overlaying water masses may provide Nd with sufficiently high concentrations and radiogenic εNd signatures to explain the εNd and [Nd] values of the deep-waters by vertical inputs, and thus the alteration of LCDW (Siddall et al., 2008). Abbott et al. (2015a, b) suggested a strong influence of benthic fluxes on the water column along the Oregon Margin. In the TWP though, Deng et al. (2017) suggested that based only on REE concentrations, apparently no large amounts of REEs are supplied from the sediments. This would support the importance of vertical processes such as particle sinking and dissolution releasing Nd originating from the surface waters combined with water mass mixing to be mainly responsible for the deep-water alteration in the TWP. Yet, this needs further investigation including Nd isotope compositions of the pore waters.
In the central North Pacific, the εNd signature required to reach the measured values would have to be between 2.0 to 3.0 εNd units more radiogenic (−2.0 < εNd < −1.0) than the average εNd of the overlying water masses. Therefore, vertical processes cannot account for this alteration. Furthermore, the particle flux in this region is very low, which reduces the potential importance of vertical transport. Hence, a different external input process must operate there. Possible more radiogenic sources may be sediments originating from Kamchatka or rocks of seamounts or island chains such as Hawaii (Amakawa et al., 2009) or the Emperor Seamount Chain. Du et al. (2020) as well as Abbott et al. (2015a, b) suggested that the bottom sediments are a major source of REEs altering the Nd signal of the water column. Radiogenic Nd may thus be supplied directly from the sediment changing εNd and [Nd] values, as described by Molina-Kescher et al. (2014) and supported by Abbott et al. (2015a, b). Alternatively, rather unradiogenic Nd may be entrained by reversible scavenging and the resulting εNd signal may subsequently be altered by various processes contributing to boundary exchange. Benthic Nd release can be the most important source term in regions described to be affected by boundary exchange, but this release will have to be compensated by a sink mechanism removing the exact same amount of Nd. In summary, for the open North Pacific, a conclusive determination of the exact alteration processes is not possible due to the lack of available εNd and [Nd] values of the pore waters. Still, Amakawa et al. (2009) reported εNd values around −9.7 near the sediment/water interface. These authors, however, argued that this value must be a result of resuspension of sediments due to contact of the sampling bottles with the seafloor. Considering that the samples were filtered one may assume that the deviation toward less radiogenic values reflects the possible impact of porewater contribution in this area. According to Amakawa et al. (2009), these values are in good agreement with the values for detrital material determined by Jones et al. (1994), and the bulk sedimentary εNd reported by Abbott et al. (2015a) for the Oregon Margin are identical with the pore water εNd at their only deep-sea location. It is therefore plausible to assume that the detrital εNd values measured by Jones et al. (1994) are representative for the isotopic composition of the pore water. In the light of this assumption, a benthic contribution would lead to a continuously less radiogenic imprint in bottom waters. Taking into account the findings of Abbott et al. (2015a, b) and Deng et al. (2017), the exact processes altering the bottom waters in the North Pacific remain to be identified and quantified via dedicated benthic flux studies.
Between 40°N and 50°N and thus in the transformation region of LCDW to NPDW (Kawabe and Fujio, 2010), particulate organic carbon (POC) and CaCO3 dominate the particle flux at the surface and at 2000 m depth (Honda et al., 2002; Buesseler et al., 2008, 2009) and are therefore mainly responsible for scavenging. These particles are remineralized to a high degree and thus promote transfer of radiogenic Nd from the surface waters (−2.1 ± 0.2 at S10, −1.7 ± 0.2 at S11) to deeper layers (cf. Siddall et al., 2008). In combination with benthic contributions (e.g., Haley et al., 2017) in certain areas, this explains why the [Nd] of LCDW increases continuously along its flow path across the northern Pacific with an increasingly radiogenic imprint (Figure 4, Piepgras and Wasserburg, 1980; Amakawa et al., 2004b, 2009), as previously suggested by Du et al. (2016).
In accordance with Kawabe and Fujio (2010) and Tomczak and Godfrey (2013b), NPDW slowly flows westwards with an εNd of −2.6 ± 0.2 at station S11 at a neutral density range between 27.7 and 28.0 (Behrens et al., 2018). During its southward flow its isotopic compositions become less radiogenic [−3.0 ± 0.5 at 39-1 (Piepgras and Jacobsen, 1988) to −6 ± 0.4 at LM-6 (Amakawa et al., 2004b)]. The reason for this shift may be sedimentary interaction of the bottom waters along the Japanese coast, admixture of cold shelf waters advected from the Chinese Sea (Amakawa et al., 2004b) or mixing with unradiogenic deep-waters (Figure 7). Further south, NPDW mixes with upwelled UCDW (Kawabe and Fujio, 2010; Figure 7). The latter carries an εNd signal of −2.8 ± 0.3 at 2000 m depth (Behrens et al., 2018). This water likely adopts a more radiogenic signal by sedimentary contact when flowing over the igneous Ogasawara Plateau (OP). Combined with the admixture of radiogenic deep-water from station S4 this would explain the observed εNd values at station S6 (−3.0 ± 0.2 at 2000 m).
Long-Term Nd Isotope Signal Stability
The comparison of our data with others obtained a year before south of the equator (Behrens et al., 2018), 18 years before in the central northern Pacific (Amakawa et al., 2009) and 33 years ago in the northern North Pacific (Piepgras and Jacobsen, 1988; Figure 8) allows to evaluate the stability and applicability of Nd isotope compositions and concentrations over time in the North Pacific.
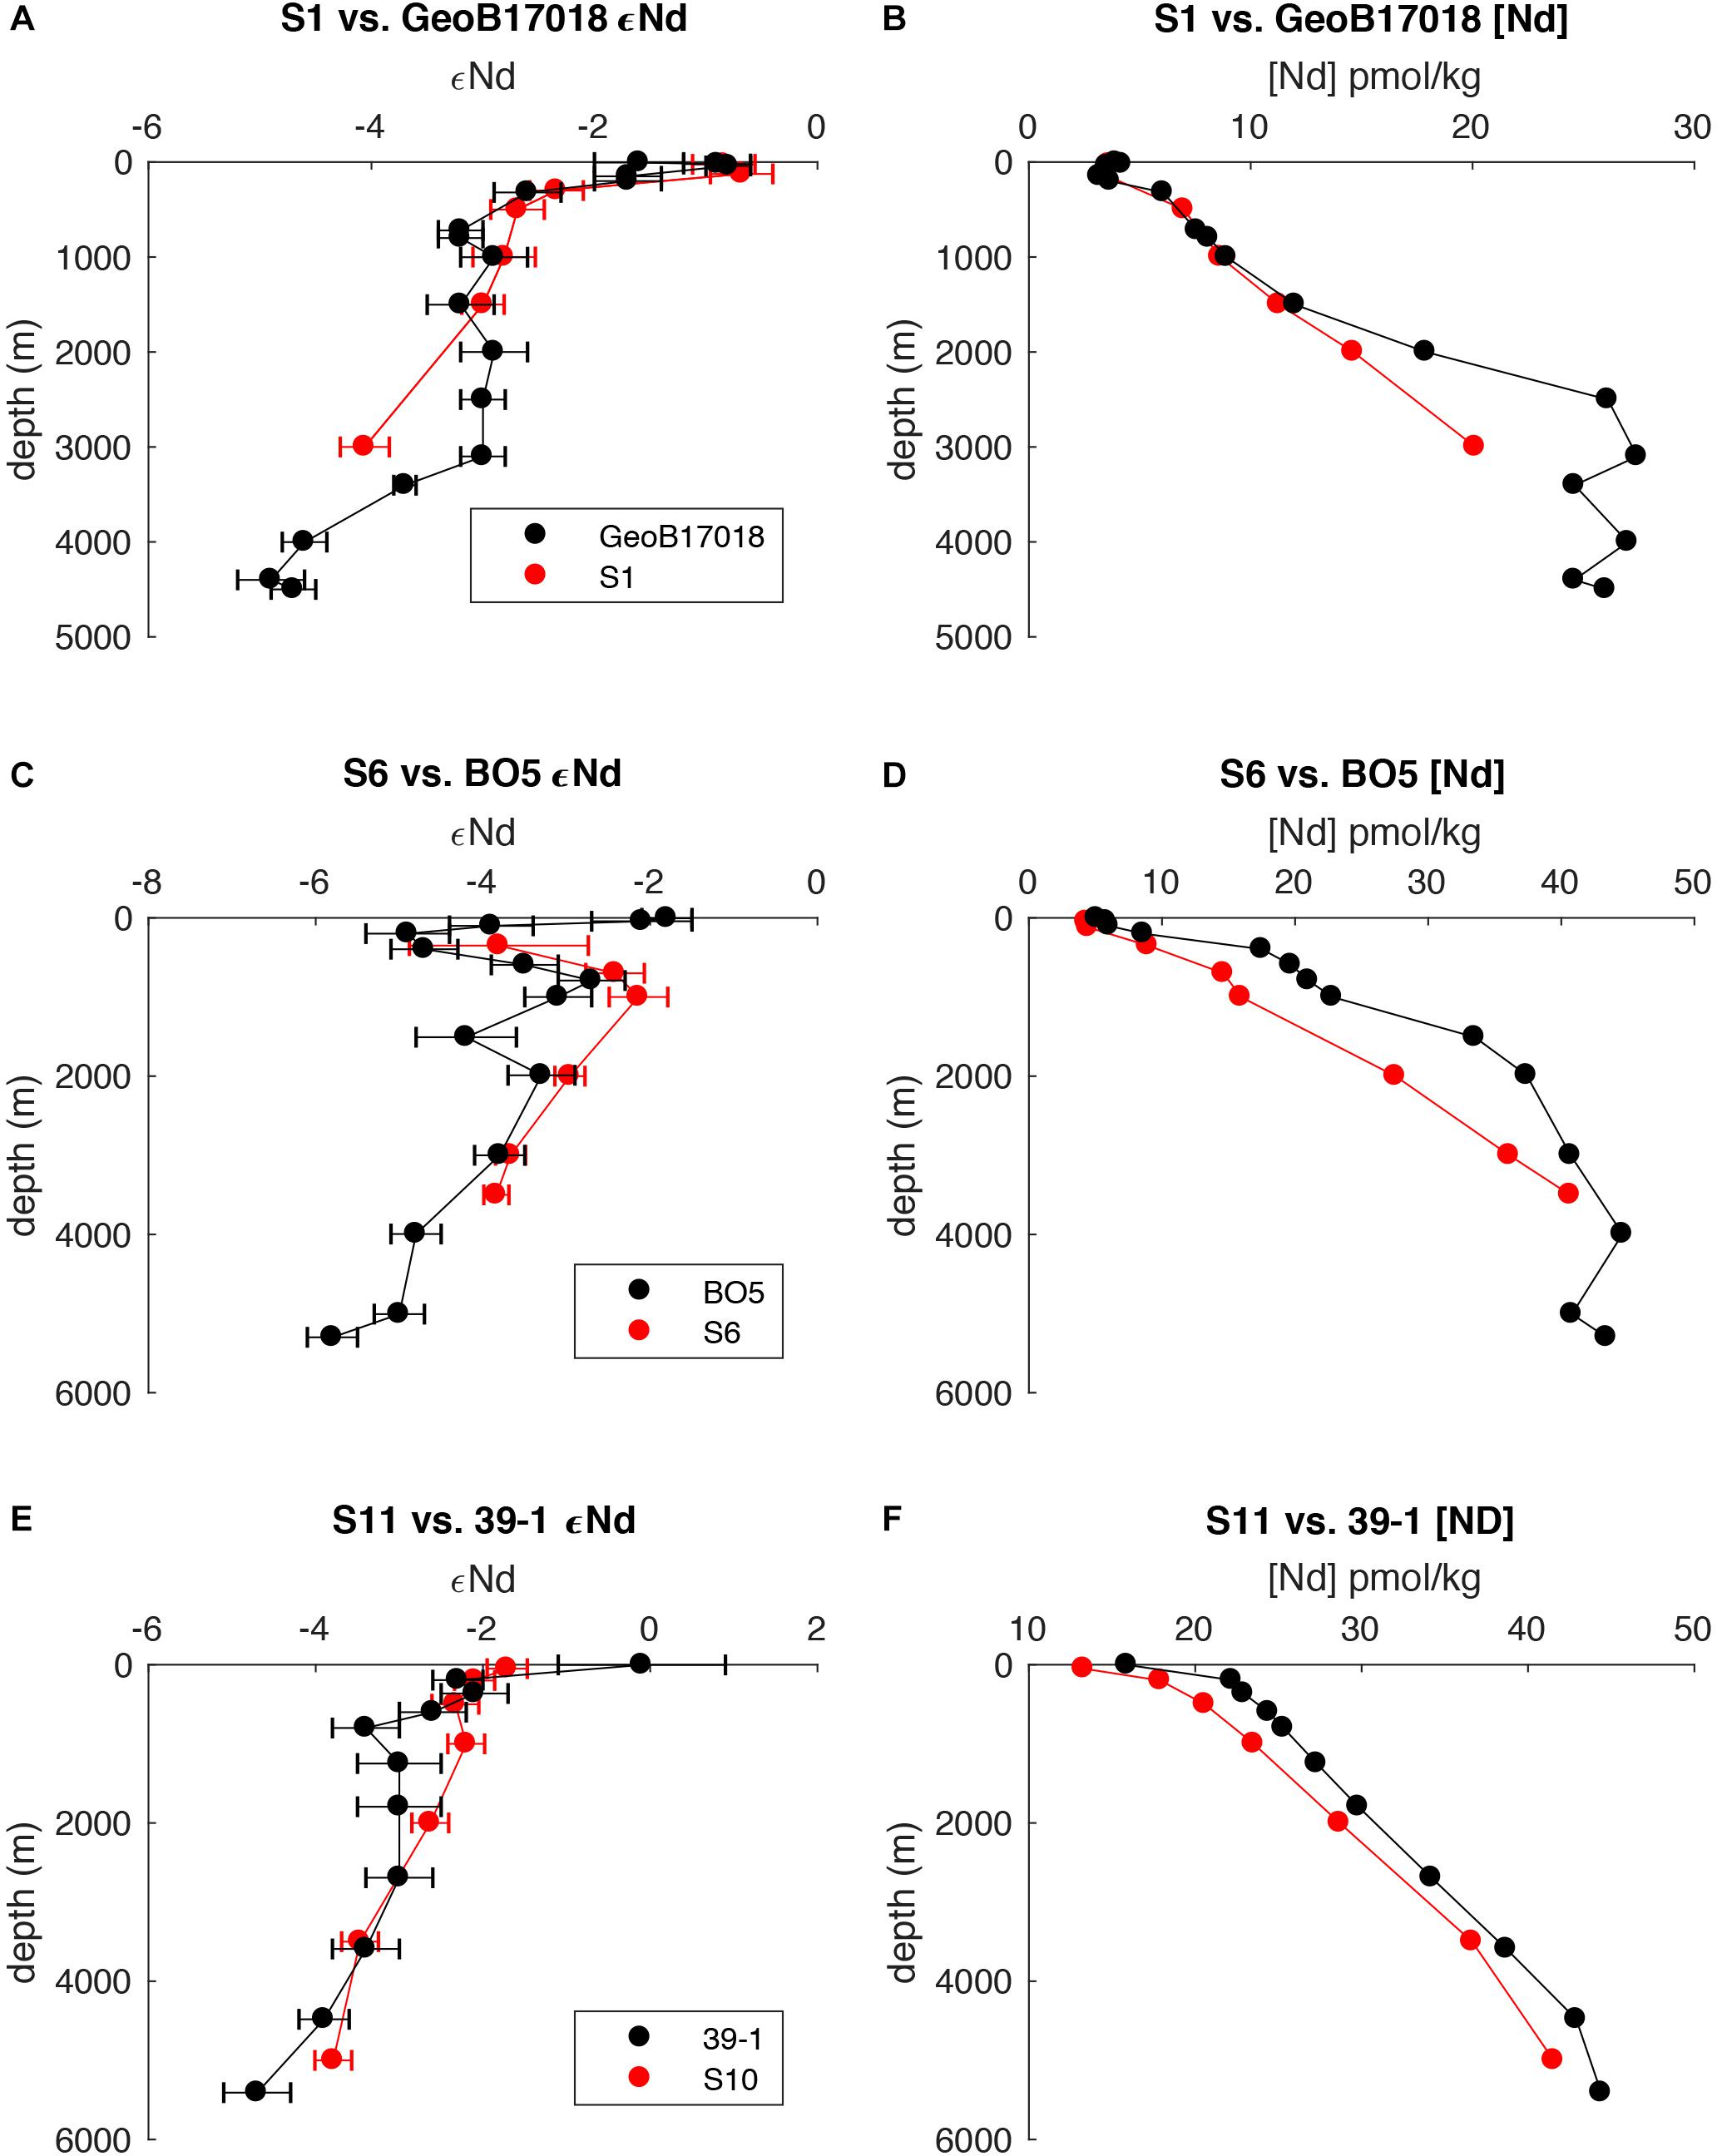
Figure 8. Comparison between stations of this study and previously reported data from adjacent sites [Behrens et al., 2018 (A,B); Amakawa et al., 2009 (C,D); Piepgras and Jacobsen, 1988 (E,F)].
Station S1 and station GeoB17018 reported by Behrens et al. (2018) are both located south of the equator within the SECC (7 and 8°S, respectively). Both stations represent very similar hydrographic conditions in terms of the distribution of water masses with depth, based on T-S values, and hence are suitable for evaluating the Nd signal stability in the TWP over time. As shown in Figure 8, the data sets agree well with one another but differ in [Nd] and εNd for NPDW/LCDW (Table 2) located at 3000 m. At station S1, which is located ca. 1500 km east of station GeoB17018, NPDW/LCDW carries a less diluted and hence less radiogenic εNd signal alongside higher [Nd] values. This difference probably results from stronger influence of radiogenic contributions to the deeper water column from the Tonga and Lau Ridges (Behrens et al., 2018).
Located 2°N and 7°E of station S6, the Nd isotope profile at station BO-5 (Amakawa et al., 2009) is essentially indistinguishable within analytical uncertainties of the measurements for most of the water column compared to station S6. Higher concentrations (up to 7–10 pmol/kg) at intermediate depth at station BO-5 suggest stronger contributions of NPIW and NPDW. At 1000 m depth less radiogenic εNd values at station BO-5 appear to be less influenced by NPDW than by upwelled UCDW. Since both stations were sampled in early July potential seasonal variability is unlikely the reason for these differences.
The variability of water mass mixing and Nd characteristics in the subpolar gyre is assessed through comparison of the northernmost stations (station S11, this study and station TPS 47 39-1, Piepgras and Jacobsen, 1988). In this region, radiogenic inputs from the Aleutian Chain control the Nd isotope signatures of surface and subsurface waters, which is evident from surface εNd signals reaching −2.0 at station TPS 47 39-1 (Piepgras and Jacobsen, 1988). While the subsurface waters have nearly identical εNd values, the intermediate waters of TPS 47 39-1 carried a less radiogenic signal than those at station S11. Given that station STP 47 39-1 is located further west and closer to the Sea of Okhotsk, the shift toward less radiogenic signatures may reflect admixture of less radiogenic OIW. Below the intermediate layer, NPDW and LCDW have Nd isotope values identical within error. Slightly higher Nd concentrations at TPS 47 39-1 determined for the entire water column may result from the fact that Piepgras and Jacobsen (1988) did not filter their samples.
The comparison reveals that the Nd isotope signal in the water column has essentially remained stable over the past ∼30 years. This contrasts with observations made by Grasse et al. (2017), who observe changes in εNd and [Nd] by up to 20 pmol/kg and 2.0 εNd units at depths of up to 2000 m during a time period of 4 years at locations much closer to variable weathering inputs from land in the Panama basin. This observation demonstrates that the processes that have controlled the dissolved Nd concentrations and isotopic compositions of the North Pacific have been constant over time. We hence assume that Nd isotope and concentration signatures of these waters have not been affected by variable terrestrial inputs (Grasse et al., 2017) or changing biological productivity but instead have been controlled by long-term processes such as water mass mixing or constant exchange with bottom sediments. Despite the fact that the exact processes that control the deep-water range of Nd concentrations and isotope compositions still remain unclear based on our data, this consistency allows for the incorporation of old data sets into modeling studies and into calculations such as those presented in this study.
Summary and Conclusions
This study presents dissolved radiogenic Nd isotope and Nd concentration data of 57 seawater samples along an equatorial to North Pacific transect between 7°S and 50°N and between 179°W and 168.5°E obtained during RV Sonne cruise 264 in boreal summer 2018. These data, which cover a range from 0 to 5000 m water depth, are used to differentiate between major water masses and to constrain their mixing as well as non-conservative processes that control the Nd distribution in the North Pacific.
The surface waters near the equator are dominated by seasonally shifting surface currents, which is reflected by their εNd signals that are variably affected by radiogenic inputs from Papua New Guinea and are characterized by low [Nd] values due to large distances from source regions and removal by scavenging. The Nd budget of the northern Pacific surface waters is controlled by radiogenic inputs from the Aleutian Chain, admixture of central surface waters in the mixed water region of the Kuroshio Extension and by recirculation along the Subpolar Gyre. Intermediate waters in the study area are dominated by AAIW that circulates anticlockwise near the equator and is clearly modified by a radiogenic Nd isotope imprint from Papua-New-Guinea before it is entrained in the North Pacific. Further north, the advection and mixing of North Pacific Intermediate Water (NPIW) and Pacific Subpolar Intermediate Water (PSIW) can be followed applying a mixing model based on εNd and [Nd]. These calculations support a strong influence of modified AAIW on intermediate waters of the entire North Pacific.
The main deep-water input to the North Pacific occurs via the Samoan Passage, where Circumpolar Deep Water and AAIW above enter the basin. Deep-water εNd values become continuously more radiogenic during advection northwards along the complex bottom topography of the northern Pacific due to reversible scavenging, boundary exchange along volcanic seamount chains, bottom release and water mass mixing. Most of these processes also lead to an increase in Nd concentrations and together document that the deep-water Nd isotope composition and concentration cannot be reliably used to trace deep water mass mixing. In the northern Pacific Basins, bottom waters are transformed into North Pacific Deep Water (NPDW) that carries an εNd signal of ca. −2.6 to the western margin of the basin where it becomes less radiogenic by exchange with the Japanese coast before mixing with modified, more radiogenic UCDW from the Philippine Sea to form an eastward current leaving the North Pacific in the eastern equatorial region.
Comparison with previous studies in the North Pacific indicates that the distribution of Nd isotopes and concentrations has been remarkably stable over decades, which demonstrates that changes in surface water inputs such as dust or biological particles did not significantly alter the water column signatures but this observation may also reflect constant non-conservative Nd supply from the bottom sediments, which cannot be distinguished based on our data.
Data Availability Statement
All data generated for this study are available in Table 2 and through the PANGAEA database (Fuhr et al., 2021, https://doi.org/10.1594/PANGAEA.926650). Further inquiries can be directed to the corresponding author.
Author Contributions
MFu processed the samples in the laboratory and wrote the manuscript. GL helped with sample preparation, analyzed the data, and contributed with discussions. DN and YY collected the samples at sea and contributed with discussions. MFr designed the study and contributed with discussions. All the authors contributed to the article and approved the submitted version.
Funding
The RV SONNE cruise SO264 to the North Pacific was funded by the German Federal Ministry of Education and Research (BMBF) [Project SO264 SONNE-EMPEROR (03G0264A), granted to DN].
Conflict of Interest
The authors declare that the research was conducted in the absence of any commercial or financial relationships that could be construed as a potential conflict of interest.
Acknowledgments
We would like to thank the captain, crew, and participants of RV SONNE cruise SO264 for their support during sampling. We particularly thank Gaston Kreps, who ran the CTDs on SO264 and did the data processing. We also acknowledge Marcus Gutjahr (GEOMAR) and Jutta Heinze (GEOMAR) for help with the mass spectrometry and in the clean laboratory, respectively. This manuscript significantly benefited from handling by the editor Johan Schijf and the constructive comments given by the three reviewers.
References
Abbott, A. N., Haley, B. A., and McManus, J. (2015a). Bottoms up: sedimentary control of the deep North Pacific Ocean’s εNd signature. Geology 43, 1035–1038. doi: 10.1130/G37114.1
Abbott, A. N., Haley, B. A., McManus, J., and Reimers, C. E. (2015b). The sedimentary flux of dissolved rare earth elements to the ocean. Geochim. Cosmochim. Acta 154, 186–200. doi: 10.1016/j.gca.2015.01.010
Amakawa, H., Alibo, D. S., and Nozaki, Y. (2004a). Nd concentration and isotopic composition distributions in surface waters of Northwest Pacific and its adjacent seas. Geochem. J. 38, 493–504. doi: 10.2343/geochemj.38.493
Amakawa, H., Nozaki, Y., Alibo, D. S., Zhang, J., Fukugawa, K., and Nagai, H. (2004b). Neodymium isotopic variations in Northwest Pacific waters. Geochim. Cosmochim. Acta 68, 715–727. doi: 10.1016/S0016-7037(03)00501-5
Amakawa, H., Sasaki, K., and Ebihara, M. (2009). Nd isotopic composition in the Central North Pacific. Geochim. Cosmochim. Acta 73, 4705–4719. doi: 10.1016/j.gca.2009.05.058
Amakawa, H., Tazoe, H., Obata, H., Gamo, T., Sano, Y., and Shen, C. C. (2013). Neodymium isotopic composition and concentration in the Southwest Pacific Ocean. Geochem. J. 47, 409–422. doi: 10.2343/geochemj.2.0260
Arsouze, T., Dutay, J. C., Lacan, F., and Jeandel, C. (2009). Reconstructing the Nd oceanic cycle using a coupled dynamical- biogeochemical model. Biogeosciences 6, 2829–2846. doi: 10.5194/bg-6-2829-2009
Bacon, M. P., and Anderson, R. F. (1982). Distribution of thorium isotopes between dissolved and particulate forms in the deep sea. J. Geophys. Res. 87, 2045–2056. doi: 10.1029/jc087ic03p02045
Barrat, J. A., Keller, F., Amossé, J., Taylor, R. N., Nesbitt, R. W., and Hirata, T. (1996). Determination of rare earth elements in sixteen silicate reference samples by ICP-MS after TM addition and ion exchange separation. Geostandards Newsletter 20, 133–139. doi: 10.1111/j.1751-908X.1996.tb00177.x
Behrens, M. K., Pahnke, K., Cravatte, S., Marin, F., and Jeandel, C. (2020). Rare earth element input and transport in the near-surface zonal current system of the Tropical Western Pacific. Earth Planet. Sci. Lett. 549:116496. doi: 10.1016/j.epsl.2020.116496
Behrens, M. K., Pahnke, K., Schnetger, B., and Brumsack, H. J. (2018). Sources and processes affecting the distribution of dissolved Nd isotopes and concentrations in the West Pacific. Geochim. Cosmochim. Acta 222, 508–534. doi: 10.1016/j.gca.2017.11.008
Bostock, H. C., Opdyke, B. N., and Williams, M. J. M. (2010). Characterising the intermediate depth waters of the Pacific Ocean using δ13C and other geochemical tracers. Deep Sea Res. Part I Oceanogr. Res. Pap. 57, 847–859. doi: 10.1016/j.dsr.2010.04.005
Buesseler, K. O., Pike, S., Maiti, K., Lamborg, C. H., Siegel, D. A., and Trull, T. W. (2009). Thorium-234 as a tracer of spatial, temporal and vertical variability in particle flux in the North Pacific. Deep Sea Res. Part I Oceanogr. Res. Pap. 56, 1143–1167. doi: 10.1016/j.dsr.2009.04.001
Buesseler, K. O., Trull, T. W., Steinberg, D. K., Silver, M. W., Siegel, D. A., Saitoh, S.-I., et al. (2008). VERTIGO (VERtical transport in the global ocean): a study of particle sources and flux attenuation in the North Pacific. Deep Sea Res. Part II Top. Stud. Oceanogr. 55, 1522–1539. doi: 10.1016/j.dsr2.2008.04.024
Deng, Y., Ren, J., Guo, Q., Cao, J., Wang, H., and Liu, C. (2017). Rare earth element geochemistry characteristics of seawater and porewater from deep sea in western Pacific. Sci. Rep. 7:16539. doi: 10.1038/s41598-017-16379-1
Du, J., Haley, B. A., and Mix, A. C. (2016). Neodymium isotopes in authigenic phases, bottom waters and detrital sediments in the Gulf of Alaska and their implications for paleo-circulation reconstruction. Geochim. Cosmochim. Acta 193, 14–35. doi: 10.1016/j.gca.2016.08.005
Du, J., Haley, B. A., and Mix, A. C. (2020). Evolution of the global overturning circulation since the last glacial maximum based on marine authigenic neodymium isotopes. Quat. Sci. Rev. 241:106396. doi: 10.1016/j.quascirev.2020.106396
Eldin, G. (1983). Eastward Flows of the South Equatorial Central Pacific. J. Phys. Oceanogr. 13, 1461–1467. doi: 10.1175/1520-04851983013<1461:EFOTSE<2.0.CO;2
Emery, W. J. (2001). “Water types and water masses,” in Encyclopedia of Ocean Sciences, 2nd Edn, Steele, J. H. (Oxford: Academic Press) 291–299. doi: 10.1016/B978-012374473-9.00108-9
Frank, M. (2002). Radiogenic isotopes: tracers of past ocean circulation and erosional input. Rev. Geophys. 40:1001. doi: 10.1029/2000RG000094
Fuhr, M., Laukert, G., Yu, Y., Nürnberg, D., and Frank, M. (2021). Neodymium Isotopes and Concentrations from Water Bottle Samples Measured During SONNE Cruise SO264 Along a Transect from 7°S, 179°W to 52°N, 168°E (Equatorial and North Pacific), PANGAEA. Available at: https://doi.org/10.1594/PANGAEA.926650.
Goldstein, S. L., and Hemming, S. R. (2003). “Long-lived isotopic tracers in oceanography, paleoceanography, and ice-sheet dynamics,” in Treatise on Geochemistry, eds H. Elderfield and K. K. Turekian (Amsterdam: Elsevier), 453–489. doi: 10.1016/B0-08-043751-6/06179-X
Grasse, P., Bosse, L., Hathorne, E. C., Böning, P., Pahnke, K., and Frank, M. (2017). Short-term variability of dissolved rare earth elements and neodymium isotopes in the entire water column of the Panama Basin. Earth Planet. Sci. Lett. 475, 242–253. doi: 10.1016/j.epsl.2017.07.022
Grasse, P., Stichel, T., Stumpf, R., Stramma, L., and Frank, M. (2012). The distribution of neodymium isotopes and concentrations in the Eastern Equatorial Pacific: water mass advection versus particle exchange. Earth Planet. Sci. Lett. 353-354, 198–207. doi: 10.1016/j.epsl.2012.07.044
Grenier, M., Jeandel, C., Lacan, F., Vance, D., Venchiarutti, C., Cros, A., et al. (2013). From the subtropics to the central equatorial Pacific Ocean: neodymium isotopic composition and rare earth element concentration variations. J. Geophys. Res. Oceans 118, 592–618. doi: 10.1029/2012JC008239
Haley, B. A., Du, J. H., Abbott, A. N., and Mc Manus, J. (2017). The impact of benthic processes on rare earth element and neodymium isotope distributions in the oceans. Front. Mar. Sci. 4:426. doi: 10.3389/fmars.2017.00426
Haley, B. A., Frank, M., Hathorne, E., and Pisias, N. (2014). Biogeochemical implications from dissolved rare earth element and Nd isotope distributions in the Gulf of Alaska. Geochim. Cosmochim. Acta 126, 455–474. doi: 10.1016/j.gca.2013.11.012
Honda, M. C., Imai, K., Nojiri, Y., Hoshi, F., Sugawara, T., and Kusakabe, M. (2002). The biological pump in the northwestern North Pacific based on fluxes and major components of particulate matter obtained by sediment-trap experiments (1997–2000). Deep Sea Res. Part II Top. Stud. Oceanogr. 49, 5595–5625. doi: 10.1016/S0967-0645(02)00201-1
Huang, R. X. (2015). Oceanographic topics | surface/wind driven circulation. Encycl. Atmos. Sci. 4, 301–314. doi: 10.1016/B978-0-12-382225-3.00280-2
Itoh, M., Ohshima, K. I., and Wakatsuchi, M. (2003). Distribution and formation of Okhotsk Sea Intermediate water: an analysis of isopycnal climatological data. J. Geophys. Res. Ocean. 108:3258. doi: 10.1029/2002jc001590
Jacobsen, S. B., and Wasserburg, G. J. (1980). Sm-Nd isotopic evolution of chondrites. Earth Planet. Sci. Lett. 50, 139–155. doi: 10.1016/0012-821X(80)901259
Jeandel, C. (2016). Overview of the mechanisms that could explain the ‘Boundary Exchange’ at the land–ocean contact. Phil. Trans. R. Soc. A 374:20150287. doi: 10.1098/rsta.2015.0287
Jones, C. E., Halliday, A. N., Rea, D. K., and Owen, R. M. (1994). Neodymium isotopic variations in North Pacific modern silicate sediment and the insignificance of detrital REE contributions to seawater. Earth Planet. Sci. Lett. 127, 55–66. doi: 10.1016/0012-821X(94)90197-X
Kawabe, M., and Fujio, S. (2010). Pacific ocean circulation based on observation. J. Oceanogr. 66, 389–403. doi: 10.1007/s10872-010-0034-8
Kessler, W. S., and Taft, B. A. (1987). Dynamic heights and zonal geostrophic transports in the central tropical pacific during 1979–84. J. Phys. Oceanogr. 17, 97–122. doi: 10.1175/1520-04851987017<0097:dhazgt<2.0.co;2
Lacan, F., and Jeandel, C. (2001). Tracing Papua New Guinea imprint on the central Equatorial Pacific Ocean using neodymium isotopic compositions and rare earth element patterns. Earth Planet. Sci. Lett. 186, 497–512. doi: 10.1016/S0012-821X(01)00263-1
Lacan, F., and Jeandel, C. (2005). Neodymium isotopes as a new tool for quantifying exchange fluxes at the continent–ocean interface. Earth Planet. Sci. Lett. 232, 245–257. doi: 10.1016/j.epsl.2005.01.004
Laukert, G., Frank, M., Bauch, D., Hathorne, E. C., Rabe, B., von Appen, W. J., et al. (2017). Ocean circulation and freshwater pathways in the Arctic Mediterranean based on a combined Nd isotope, REE and oxygen isotope section across Fram Strait. Geochim. Cosmochim. Acta 202, 285–309. doi: 10.1016/j.gca.2016.12.028
Le Fèvre, B., and Pin, C. (2005). A straightforward separation scheme for concomitant Lu-Hf and Sm-Nd isotope ratio and isotope dilution analysis. Anal. Chim. Acta 543, 209–221. doi: 10.1016/j.aca.2005.04.044
Molina-Kescher, M., Frank, M., and Hathorne, E. (2014). South Pacific dissolved Nd isotope compositions and rare earth element distributions: water mass mixing versus biogeochemical cycling. Geochim. Cosmochim. Acta 127, 171–189. doi: 10.1016/j.gca.2013.11.038
Molina-Kescher, M., Hathorne, E. C., Osborne, A. H., Behrens, M. K., Kölling, M., Pahnke, K., et al. (2018). The influence of basaltic islands on the Ooceanic REE distribution: a case study from the tropical South Pacific. Front. Mar. Sci. 5:50. doi: 10.3389/fmars.2018.00050
Nürnberg, D. (ed.) (2018). RV SONNE Fahrtbericht/Cruise Report SO264 - SONNE-EMPEROR: The Plio/Pleistocene to Holocene Development of the Pelagic North Pacific from Surface to Depth – Assessing its Role for the Global Carbon Budget and Earth’s Climate, Suva (Fiji) – Yokohama (Japan), 30.6. – 24.8.2018. GEOMAR Report, N. Ser. 046. Kiel: GEOMAR Helmholtz-Zentrum für Ozeanforschung. 284. doi: 10.3289/GEOMAR_REP_NS_46_2018
Piepgras, D. J., and Jacobsen, S. B. (1988). The isotopic composition of neodymium in the North Pacific. Geochim. Cosmochim. Acta 52869, 1373–1381. doi: 10.1016/0016-7037(88)90208-6
Piepgras, D. J., and Wasserburg, G. J. (1980). Neodymium isotopic variations in seawater. Earth Planet. Sci. Lett. 50, 128–138. doi: 10.1016/0012-821X(80)90124-7
Pin, C., and Zalduegui, J. F. (1997). Sequential separation of light rare-earth elements, thorium and uranium by miniaturized extraction chromatography: application to isotopic analyses of silicate rocks. Anal. Chim. Acta 339, 79–89. doi: 10.1016/S0003-2670(96)00499-0
Qu, T., Gao, S., Fukumori, I., Fine, R. A., and Lindstrom, E. J. (2009). Origin and pathway of Equatorial 13°C water in the pacific identified by a simulated passive tracer and its adjoint. J. Phys. Oceanogr. 39, 1836–1853. doi: 10.1175/2009JPO4045.1
Rahlf, P., Hathorne, E., Laukert, G., Gutjahr, M., Weldeab, S., and Frank, M. (2020). Tracing water mass mixing and continental inputs in the southeastern Atlantic Ocean with dissolved neodymium isotopes. Earth Planet. Sci. Lett. 530:115944. doi: 10.1016/j.epsl.2019.115944
Rempfer, J., Stocker, T. F., Joos, F., Dutay, J. C., and Siddall, M. (2011). Modelling Nd-isotopes with a coarse resolution ocean circulation model: sensitivities to model parameters and source/sink distributions. Geochim. Cosmochim. Acta 75, 5927–5950. doi: 10.1016/j.gca.2011.07.044
Rickli, J., Frank, M., and Halliday, A. N. (2009). The hafnium-neodymium isotopic composition of Atlantic seawater. Earth Planet. Sci. Lett. 280, 118–127.
Schlitzer, R. (2020). Ocean Data View. Available online at: http://odv.awi.de (accessed October 29, 2020).
Schmitz, W. J. (1996). On the World Ocean Circulation. Volume II, the Pacific and Indian Oceans/a Global Update. Woods Hole Oceanographic Institution Technical Report WHOI-96-08. Woods Hole, MA: Woods Hole Oceanographic Institution, 237. doi: 10.1575/1912/356
Siddall, M., Khatiwala, S., van de Flierdt, T., Jones, K., Goldstein, S. L., Hemming, S., et al. (2008). Towards explaining the Nd paradox using reversible scavenging in an ocean general circulation model. Earth Planet. Sci. Lett. 274, 448–461. doi: 10.1016/j.epsl.2008.07.044
Stichel, T., Frank, M., Rickli, J., Hathorne, E. C., Haley, B. A., Jeandel, C., et al. (2012). Sources and input mechanisms of hafnium and neodymium in surface waters of the Atlantic sector of the Southern Ocean. Geochim. Cosmochim. Acta 94, 22–37. doi: 10.1016/j.gca.2012.07.005
Suga, T., Kato, A., and Hanawa, K. (2000). North pacific tropical water: its climatology and temporal changes associated with the climate regime shift in the 1970s. Prog. Oceanogr. 47, 223–256. doi: 10.1016/S0079-6611(00)00037-9
Tachikawa, K. (2003). Neodymium budget in the modern ocean and paleo-oceanographic implications. J. Geophys. Res. 108, 1–13. doi: 10.1029/1999jc000285
Tachikawa, K., Arsouze, T., Bayon, G., Bory, A., Colin, C., Dutay, J. C., et al. (2017). The large-scale evolution of neodymium isotopic composition in the global modern and Holocene ocean revealed from seawater and archive data. Chem. Geol. 457, 131–148. doi: 10.1016/j.chemgeo.2017.03.018
Talley, L. D., Pickard, G. L., Emery, W. J., and Swift, J. H. (eds) (2011). “Pacific Ocean,” in: Descriptive Physical Oceanography, 6th Edn. Boston: Academic Press, 303–362. doi: 10.1016/B978-0-7506-4552-2.10010-1
Tanaka, T., Togashi, S., Kamioka, H., Amakawa, H., Kagami, H., Hamamoto, T., et al. (2000). JNdi-1: a neodymium isotopic reference in consistency with LaJolla neodymium. Chem. Geol. 168, 279–281. doi: 10.1016/S0009-2541(00)00198-4
Tomczak, M., and Godfrey, J. S. (2013a). Chapter 10: Adjacent seas of the Pacific Ocean. Reg. Oceanogr. 173–191. doi: 10.1016/b978-0-08-041021-0.50014-x
Tomczak, M., and Godfrey, J. S. (2013b). Chapter 9: Hydrology of the Pacific Ocean. Reg. Oceanogr. 149–171. doi: 10.1016/b978-0-08-041021-0.50013-8
Tsuchiya, M. (1981). The origin of the pacific equatorial 13°C water. J. Phys. Oceanogr. 11, 794–812. doi: 10.1175/1520-04851981011<0794:TOOTPE<2.0.CO;2
van de Flierdt, T., Pahnke, K., Amakawa, H., Andersson, P., Basak, C., Coles, B., et al. (2012). GEOTRACES intercalibration of neodymium isotopes and rare earth element concentrations in seawater and suspended particles. Part 1: reproducibility of results for the international intercomparison. Limnol. Oceanogr. Methods 10, 234–251. doi: 10.4319/lom.2012.10.234
Vance, D., and Thirlwall, M. (2002). An assessment of mass discrimination in MC-ICPMS using Nd isotopes. Chem. Geol. 185, 227–240. doi: 10.1016/S0009-2541(01)00402-8
Wang, F., Li, Y., and Wang, J. (2016). Intraseasonal variability of the surface zonal currents in the western tropical Pacific Ocean: characteristics and mechanisms. J. Phys. Oceanogr. 46, 3639–3660. doi: 10.1175/JPO-D-16-0033.1
Yasuda, I. (2004). North pacific intermediate water: progress in SAGE (subarctic gyre experiment) and related projects. J. Oceanogr. 60, 385–395. doi: 10.1023/B:JOCE.0000038344.25081.42
You, Y. (2003). The pathway and circulation of North Pacific Intermediate Water. Geophys. Res. Lett. 30, 24–27. doi: 10.1029/2003GL018561
You, Y., Suginohara, N., Fukasawa, M., Yasuda, I., Kaneko, I., Yoritaka, H., et al. (2000). Roles of the okhotsk sea and gulf of alaska in forming the north pacific intermediate water. J. Geophys. Res. Oceans 105, 3253–3280. doi: 10.1029/1999jc900304
Zenk, W., Siedler, G., Ishida, A., Holfort, J., Kashino, Y., Kuroda, Y., et al. (2005). Pathways and variability of the Antarctic Intermediate Water in the western equatorial Pacific Ocean. Prog. Oceanogr. 67, 245–281. doi: 10.1016/j.pocean.2005.05.003
Keywords: North Pacific Gyre, neodymium isotopes, water mass mixing, North Pacific Intermediate Water, water mass tracing
Citation: Fuhr M, Laukert G, Yu Y, Nürnberg D and Frank M (2021) Tracing Water Mass Mixing From the Equatorial to the North Pacific Ocean With Dissolved Neodymium Isotopes and Concentrations. Front. Mar. Sci. 7:603761. doi: 10.3389/fmars.2020.603761
Received: 07 September 2020; Accepted: 31 December 2020;
Published: 09 February 2021.
Edited by:
Johan Schijf, University of Maryland Center for Environmental Science (UMCES), United StatesReviewed by:
Brian A. Haley, Oregon State University, United StatesYingzhe Wu, Lamont-Doherty Earth Observatory (LDEO), United States
April N. Abbott, Macquarie University, Australia
Copyright © 2021 Fuhr, Laukert, Yu, Nürnberg and Frank. This is an open-access article distributed under the terms of the Creative Commons Attribution License (CC BY). The use, distribution or reproduction in other forums is permitted, provided the original author(s) and the copyright owner(s) are credited and that the original publication in this journal is cited, in accordance with accepted academic practice. No use, distribution or reproduction is permitted which does not comply with these terms.
*Correspondence: Michael Fuhr, bS5kcm92ZUBnbWFpbC5jb20=