 Owen M. Exeter1,2*
 Thaung Htut3
 Christopher R. Kerry1
 Maung Maung Kyi4
 Me'ira Mizrahi3Rachel A. Turner1
 Matthew J. Witt1,2
 Anthony W. J. Bicknell2
- 1Environment and Sustainability Institute, College for Life and Environmental Sciences, University of Exeter, Penryn, United Kingdom
- 2Environmental Biology, College for Life and Environmental Sciences, University of Exeter, Exeter, United Kingdom
- 3Wildlife Conservation Society, Yangon, Myanmar
- 4Rakhine Coastal Region Conservation Association, Kyeintali, Myanmar
Coastal fisheries provide livelihoods and sustenance for millions of people globally but are often poorly documented. Data scarcity, particularly relating to spatio-temporal trends in catch and effort, compounds wider issues of governance capacity. This can hinder the implementation and effectiveness of spatial tools for fisheries management or conservation. This issue is acute in developing and low-income regions with many small-scale inshore fisheries and high marine biodiversity, such as Southeast Asia. As a result, fleets often operate unmonitored with implications for target and non-target species populations and the wider marine ecosystem. Novel and cost-effective approaches to obtain fisheries data are required to monitor these activities and help inform sustainable fishery and marine ecosystem management. One such example is the detection and numeration of fishing vessels that use artificial light to attract catch with nighttime satellite imagery. Here we test the efficiency and application value of nighttime satellite imagery, in combination with landings data and GPS tracked vessels, to estimate the footprint and biomass removal of an inshore purse seine fishery operating within a region of high biodiversity in Myanmar. By quantifying the number of remotely sensed vessel detections per month, adjusted for error by the GPS tracked vessels, we can extrapolate data from fisher logbooks to provide fine-scale spatiotemporal estimates of the fishery's effort, value and biomass removal. Estimates reveal local landings of nearly 9,000 mt worth close to $4 million USD annually. This approach details how remote sensed and in situ collected data can be applied to other fleets using artificial light to attract catch, notably inshore fisheries of Southeast Asia, whilst also providing a much-needed baseline understanding of a data-poor fishery's spatiotemporal activity, biomass removal, catch composition and landing of vulnerable species.
Introduction
Small-scale coastal fishing fleets are known to exert pressure on marine ecosystems. Without effective management even small-scale operations can deplete fish stocks (Wilson et al., 2010), contribute to species declines through bycatch and intentional targeting (Mangel et al., 2010; Alfaro-Shigueto et al., 2011; Aylesworth et al., 2018) and cause the degradation of coastal habitats through high impact fisheries methods (Blaber et al., 2000; Thrush et al., 2002; Fox and Caldwell, 2006; Shester and Micheli, 2011; Chan and Hodgson, 2017). Small-scale fisheries are also intrinsically linked to food security and livelihoods. Twenty-two of an estimated 50 million fishers globally are involved in small-scale operations (Teh and Sumaila, 2013). With annual yields close to 22 million tons (Pauly and Zeller, 2016), these fisheries are estimated to contribute more than half of reported landings in developing regions (World Bank, 2012) yet are often considered poorly documented and neglected by management authorities (Food and Agriculture Organisation, 2015).
To monitor fisheries, larger vessels are often instrumented with global positioning systems (GPS) including vessel monitoring systems (VMS) and automatic identification systems (AIS) (Witt and Godley, 2007; Jennings and Lee, 2012; Kroodsma et al., 2018). This has allowed fisheries scientists to quantify their spatial footprint (Natale et al., 2015; Kroodsma et al., 2018) and assess the effectiveness of spatial management efforts (White et al., 2017; Ferrà et al., 2018). Small-scale coastal fisheries, notably in developing regions, often lack the capacity to equip such systems or are not currently required to carry them (Dunn et al., 2010; Breen et al., 2015; Kroodsma et al., 2018). Despite being globally distributed, spanning a variety of gear types, vessel sizes, target species, spatial profiles and socioeconomic characteristics (Smith and Basurto, 2019), these fleets largely lack data on spatial and temporal trends in activity (Johnson et al., 2017; Selgrath et al., 2018). As small-scale fleets primarily operate in inshore zones (Stewart et al., 2010), the paucity of spatial data on vessel behavior can seriously hinder effective coastal management, impacting both people and wildlife (Ban et al., 2009; Metcalfe et al., 2017; Cardiec et al., 2020).
In the absence of traditional tracking technologies, a variety of alternate methods have been used to quantify small-scale fisheries in time and space. These include self-reporting logbooks (Vincent et al., 2007), sightings (Breen et al., 2015), participant mapping and interviews (Léopold et al., 2014; Selgrath et al., 2018; Gill et al., 2019), mapping known behaviors (Witt et al., 2012) or combinations of these (Turner et al., 2015). These methods are often only a snapshot in time and can host inaccuracies as a result of observer bias (Brown, 2012, 2017). The novel application of remote sensing systems offers a potential source of long-term monitoring data (Chassot et al., 2011). Remote sensing systems provide high resolution data over large spatial scales and long temporal periods (Chassot et al., 2011; Klemas, 2013). One example is the detection of vessels using sensors on weather satellites at night (Croft, 1978) i.e., the Defense Meteorological Satellite Program Operational Linescan System (DMSP OLS). This has been demonstrated to be useful in detecting vessels that use artificial light to lure fish or squid to the surface before netting or hooking (Liu et al., 2015; Cozzolino and Lasta, 2016; Paulino et al., 2017). More recently, the National Oceanic and Atmospheric Administration's (NOAA) Suomi National Polar Partnership satellite primary imager, the Visible Infrared Imaging Radiometer Suite (VIIRS) Day/Night Band, has captured a variety of artificial light sources at the Earth's surface (Elvidge et al., 2015). The subsequent development of algorithms by the Earth Observation Group (EOG) for the automatic detection of fishing vessels from VIIRS imagery provides an open-source repository of global nighttime fishing effort (Elvidge et al., 2015). These data have proven highly effective for the monitoring of fisheries closures (Elvidge et al., 2018), identifying fishing grounds (Geronimo et al., 2018; Hsu et al., 2019), estimating capacity of illegal, unreported and unregulated fisheries (Oozeki et al., 2018) or combining with government landing statistics to predict stock migration routes (Choi et al., 2008). However, VIIRS imagery has yet to be combined with landings data collected in situ to quantify fine-scale spatiotemporal trends of effort, catch and value in data-poor scenarios. Combination in this manner could enable real-time estimation of biomass removal across large spatial scales and inform targeted fisheries and conservation management.
Fishing fleets using artificial light operate throughout the world's oceans and are prominent across Southeast Asia where these practices are known as “light-boat fishing.” Squid species are generally targeted by these fleets, but small forage fish, such as clupeids, are also targeted in coastal waters (Gorospe et al., 2016). Light-boat fisheries, as with other fish aggregation methods, are often considered high impact, associated with landings of immature fish and have high bycatch rates of vulnerable megafauna due to low-selectivity and small net mesh sizes (Solomon and Ahmed, 2016). Myanmar is one of the top ten fish producing countries of the world, with more than three million metric tons of fish providing 43% of the country's consumed protein per year Food and Agriculture Organisation, 2014; Tezzo et al., 2018). Marine fisheries also provide direct livelihoods to ~1.4 million fishers (Department of Fisheries, 2017). Myanmar's small-scale marine fisheries are characterized as multi-gear, multi-species fisheries, with limited access to external markets (Schneider and Thiha, 2014).
Myanmar is also an example of a country lacking capacity to implement effective management and conduct long-term monitoring. This has led to data on marine fisheries being scarce, especially for the inshore fleet (Tezzo et al., 2018). Government statistics reveal decadal (2003–2012) increases of 121% in landings (Pauly and Zeller, 2016) with small pelagic fish stocks estimated to be at 10% of 1979 levels (Krakstad et al., 2014). Few spatial management areas exist to aid stock recovery (Boon et al., 2016) or protect Myanmar's rich biodiversity and species of conservation concern (Birch et al., 2016). Some gear restrictions exist, including the ban of certain trawl gears in inshore waters, however without enforcement illegal fishing continues unabated (Wildlife Conservation Society, 2018). Whilst the Government of Myanmar has taken steps toward monitoring its marine fisheries through the installation of VMS, this is limited to offshore fishing vessels, with no current monitoring of small-scale vessels. As Myanmar enters a new phase of rapid globalization (Orlov, 2012; Prescott et al., 2017), its marine environment is likely to experience increased pressures in the future. Strengthening governance, improving enforcement capacity and designing community-led initiatives will all be required to resolve wider issues of management capacity. Baseline data on fisheries landings and effort is therefore an important first step to improved marine management for the country.
To test the utility of VIIRS remotely sensed imagery in quantifying the extent of a fishery, we focus on the inshore purse seine fleet of Myanmar's western seascape. In the study, GPS tracking data and landings data are harmonized with VIIRS to provide estimates of the spatial footprint of fishing effort and the extent of biomass extraction within a key marine conservation corridor (Wildlife Conservation Society, 2013). The application of species-specific landings data ensures results have applied management value. Without this baseline understanding the management of key stocks, impact on vulnerable species and wider ecosystem integrity remains difficult. To our knowledge, this study represents the first example of applying VIIRS boat detections (VBD) in this manner, providing an approach to combine remote sensing and focused in situ data for light-boat fisheries in data-poor, low capacity coastal regions.
Materials and Methods
Study Area
The focal study area was Kyeintali sub-township, a unitary authority in the state of Rakhine, northern Myanmar, which contains 12 village wards (Figure 1). Kyeintali and adjacent waters encompass the entire Maw She Key Biological Area (KBA), designated due to the presence of several species of conservation interest [e.g., hawksbill turtles (Eretmochelys imbricata), Irrawaddy Dolphin (Orcaella brevirostris), dugong (Dugong dugon) and whale shark (Rhincodon typus)] and whole-site vulnerability (Wildlife Conservation Society, 2013). The waters of Kyeintali also overlap the Rakhine Marine Conservation Corridor, one of just two in Myanmar (Wildlife Conservation Society, 2013). Purse seining is the dominant fishery locally (Table 1), with 35% of known vessels in the sub-township involved. Purse seine activity predominantly occurs at night, with up to two light-boats used to attract fish and one fishing vessel using a net to circle and extract catch. Fishing vessels anchor near a light-boat for ~4 h, allowing shoaling fish to aggregate, before hauling in nets. If a second light boat is used the fishing vessel repeats this process enabling a second haul from a single trip. Target species include sardine (Sardinella spp.) and anchovy (Stolephorus spp. and Dussumieria spp.), but fine mesh sizes (<3 cm) ensure everything attracted to the light is landed. The fishery operates almost exclusively between the months of October to May, which coincides with Myanmar's dry season. The fleet is licensed to operate in the inshore zone (<10 nautical miles) under the Department of Fisheries zoning. Inshore zones delineate areas for smaller vessel classes, typically not longer than 9 m (30 ft) and powered by 25 HP engines or less (Department of Fisheries, 2016). Importantly, zonal licensing excludes larger commercial or foreign light-boats from the study area, however vessels may fish inshore grounds illegally due to a lack of enforcement.
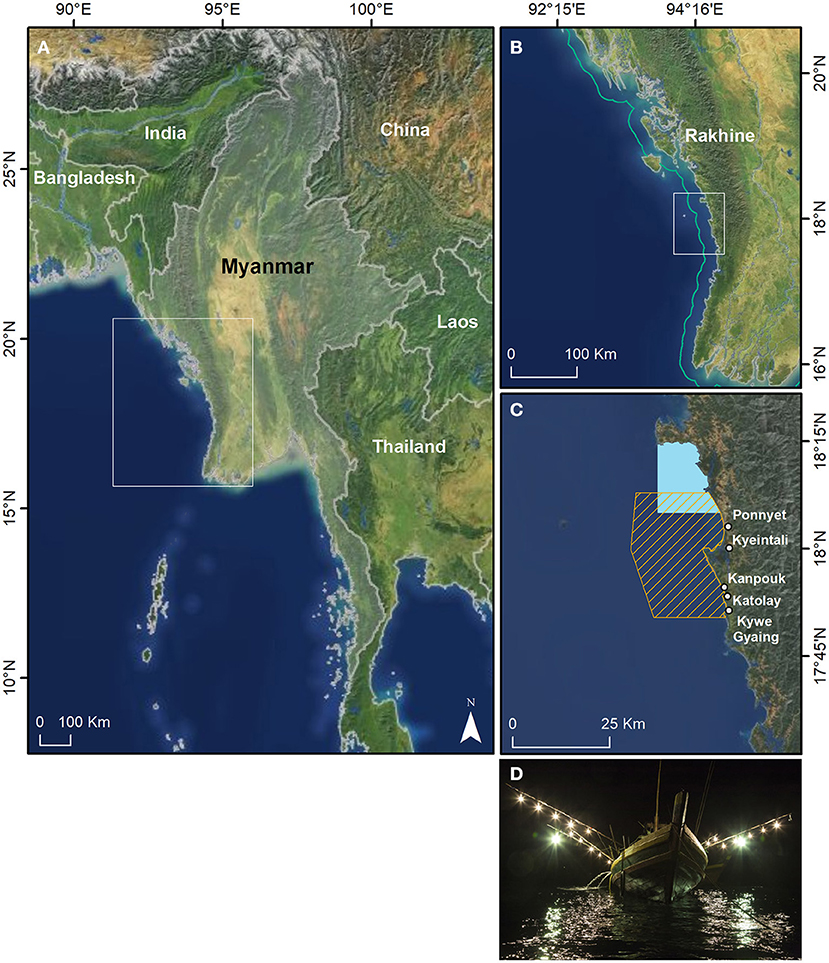
Figure 1. Study region. (A) Myanmar, (B) Northern states of Rakhine and Ayeyarwady with the Inshore Fishery Zone highlighted (green line) and (C) Kyeintali region including key landing sites, the Kyeintali Inshore Fisheries Co-Management Association zone (orange has) and the Maw She Key Biodiversity area (blue box). (D) Image of light boat used by the local purse seine fleet.
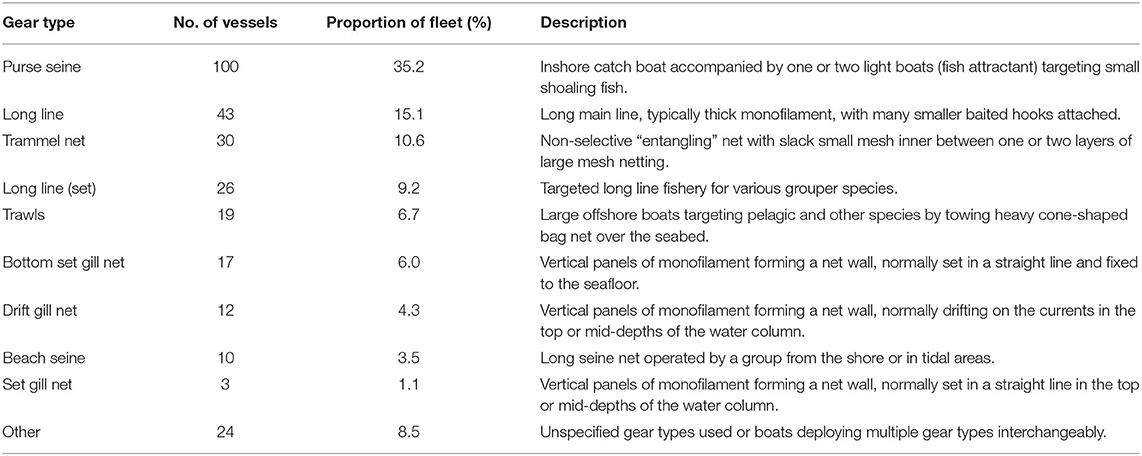
Table 1. Fleet composition of Kyeintali sub-township landing sites surveyed in 2016 (Bicknell, 2019).
Data Collection
GPS Tracked Fishing Trips
Spatial tracking data were collected from GPS instrumented purse seine vessels (n = 13) between October 2016 and May 2019, using Pelagic Data Systems' (PDS) solar powered Vessel Tracking System. Operating out of five key landing sites (Figure 1) located in the Kyeintali sub-township, these vessels represent 13% of the known local purse seine fleet (Bicknell, 2019). As multiple net hauls often occur at separate light boats during a single fishing trip, GPS loggers were attached to the fishing vessel, as opposed to the light boats, to allow entire fishing trips to be tracked. Kyeintali village was the home port for the largest number of vessels (n = 4), with the remaining vessels (n = 9) split amongst the other landing sites of Kywe Gyaing (n = 2), Kadolay (n = 3), Kanpouk (n = 1) and Ponenyat (n = 3). Vessel lengths ranged between 13 and 22 meters (mean: 18.3 m) with a mean purse seine mesh size of 1.6 cm (range: 0.64–2.54, ±sd 0.83 cm). Vessel owners were not mandated to carry GPS and all did so on a voluntary basis, we therefore believe participation in this study unlikely altered vessel behavior.
Nighttime Light Imagery
VIIRS boat detections (VBD) occurring within the Exclusive Economic Zone (EEZ) of Myanmar were sourced from NOAA's EOG repository (https://www.ngdc.noaa.gov/eog/viirs/download_boat.html). VBD data were extracted from VIIRS images taken each night [~2 a.m. local time (Elvidge et al., 2015)], by a single polar orbiting satellite with swath of 3,000 km (Hsu et al., 2019). The satellite achieves a minimal global coverage of one nightly image at the equator, increasing closer to the poles, with Southeast Asia normally receiving two coverages per night (Hsu et al., 2019). The algorithms used to extract VBD from VIIRS imagery are described by Elvidge et al. (2015). Daily data were downloaded for the periods October to May, 2016 to 2019, representing three fishing seasons. Each light detection includes a unique identifier, geographic coordinates for the center of each detection (pixel footprint 742 m), a time stamp in hours and minutes and seconds (UTC and MMT) and quality flag. Quality flags indicate the sharpness of the VBD detection (Elvidge et al., 2015). VBD records with quality flags of 1, 2, 3, and 10 (see Table 2 for descriptors) are regarded as possible fishing activities and were considered equal for analysis in this study (Hsu et al., 2019).
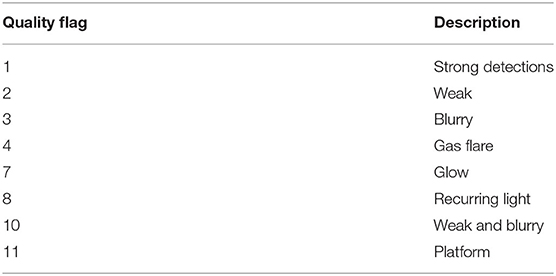
Table 2. VBD quality flags.
Purse Seine Landings Data
Purse seine landings data were collated from 36 vessel owner logbooks (including tracked vessels) between October 2016 and May 2019 from eight villages within the Kyeintali sub-township. Mean vessel length was 14.7 meters (range: 9.45–29.4 m). All vessel owners volunteered their landings data. Collected on a monthly frequency, these self-reporting logbooks represent 36% of the known local purse seine fleet and contained data on the number of hauls, species catch composition, weight, and value for each trip.
Data Processing and Analyses
GPS Tracked Fishing Trips
GPS data were prepared for analysis by removing potential spatial errors in the tracks. Spatial errors where determined by vessel speeds which exceeded 20 knots (derived from the distance traveled and time elapsed between two consecutive points). The 20 knot threshold was used (99.9th data percentile) to remove extreme outliers. Data were further filtered to eliminate trips occurring outside night time hours (18.00–08.00 MMT). Tracks lasting at least four consecutive hours were subsequently retained. Trips where vessels intermittently relocated to landing sites outside the Kyeintali area (n = 271) were not considered for comparison against the VBD data. The high temporal resolution of the PDS loggers often resulted in sub-minute sampling during periods of high activity, or conversely, there were intervals without spatial data for consecutive minutes during more static periods. To apportion data evenly between trips and vessel behaviors (i.e., transit, anchoring), sampling frequency was standardized to 1 min intervals. Sub-minute records were filtered to retain the first record per minute and missing records were interpolated using the adehabitatLT package in R (Calenge, 2006). For analysis against the VBD data, behavioral fishing states were characterized for the GPS tracks. Vessel speeds of below three knots were considered to represent behaviors of anchoring, drifting, setting or hauling, and vessel speeds >3 knots were characterized as in transit. The three knot threshold was determined by known vessel behaviors and confirmed using the modpartltraj function in the adehabitatLT R package using Markov models (Calenge, 2006). Any trips where the GPS tracked fishing vessels were deemed to be in transit at the time of VIIRS satellite overpass were removed from analysis as they would not be identifiable in the VIIRS imagery due to the GPS tracked fishing vessel traveling to or from a light boat location.
GPS to VBD Cross Matching
The precision of VIIRS imagery is known to be influenced by variation in lunar brightness, cloud cover and between fleets using light to attract catch (Cozzolino and Lasta, 2016; Hsu et al., 2019). Error in detection rates can result in underestimates of fishing effort if vessels are obscured by cloud or lunar reflection, or overestimation if false positives occur due to lunar glare. To determine the local accuracy of the remote sensing imagery, the sample of GPS tracked purse seine vessels were matched against VBD records using a cross matching algorithm based on the methods described in Hsu et al. (2019). If a VBD record of a fishing vessel had an identical timestamp (to the nearest minute) to a GPS record (within an 800 m buffer), the fishing trip was recorded as being matched to the VBD (Figure 2). Distance thresholds were set to 800 m to account for the footprint of the VBD pixel (742 m) and for the potential for the GPS instrumented fishing vessel to be close, but not in identical proximity to the spatial locations of the light boat whilst attracting catch or setting nets. The sensitivity of the algorithm was limited to ±1 min as, whilst VBD data is recorded to the nearest second, the GPS data were gathered at a resolution of one location per minute. If multiple VBDs records fulfilled the time and distance matching threshold for a single GPS point, or multiple GPS tracks matched to a single VBD, then only the closest (m) match was retained. This ensured VBD detections were not matched multiple times resulting. Tracked vessels can sometimes visit multiple light boats each night, as such a GPS track could be matched to more than one VBD light signature due to multiple satellite overpasses. To prevent potential overestimation from this issue, matching results were screened for trips with duplicate matches and only the best match (m) retained.
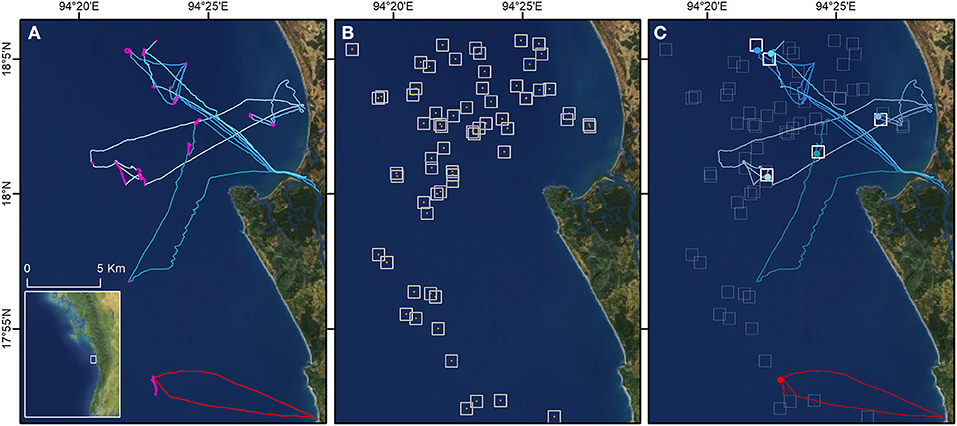
Figure 2. Visual example of one nights GPS to VBD matching. (A) Five successfully matched GPS tracked fishing trips (blue lines) and one unmatched trip (red line) with predicted behavioral fishing states highlighted (pink lines). (B) VBD records (yellow points) with the pixel footprint (742 m) overlaid (white square). (C) The GPS location (points) of each vessel at the time of closest satellite overpass.
In addition to the cross-matching algorithm, core fishing areas from both the GPS and VBD data were identified using kernel density estimation (KDE) analysis, performed in ESRI ArcGIS version 10.6.0. VBD records were spatially filtered to a local study area shapefile informed by the spatial coverage (Minimum Bounding Geometry function ArcGIS) of the GPS tracked vessels operating from the Kyeintali sub-township landing sites and smoothed by approximate boundaries of neighboring townships of Gwa (South) and Gyeiktaw (North). KDE output cell size was set to 250 × 250 m, with a search radius (bandwidth) of 5,000 m [considered to produce an output neither overly fragmented nor overly smoothed (Gitzen et al., 2006)]. Core fishing areas (50th percentile) were then extracted from the maximum KDE value.
Predicted Fishing Effort
To estimate the monthly and annual purse seine fishing effort (number of light boats), the VBD-GPS match rates were used to predict the number of light boats unidentified by the VBD data. This prediction was used to determine the overall fisheries effort, recognizing that raw VBD data does not provide a total synoptic overview due to the impact of environmental variables (cloud cover and lunar illumination) on detection accuracy. The monthly mean detections were corrected (divided) by the monthly match rates to calculate the total predicted fishing effort. Predicted fishing effort is therefore calculated as follows (Equation 1):
where total predicted fishing effort (PE) is the sum of the mean monthly VBD records divided by the monthly mean match rate ().
Predicted Biomass and Value
To estimate the total biomass caught by the local purse seine fleet, and its value, the logbook data were extrapolated by the predicted fishing effort values (Supplementary Figure 1). For analysis, value and weight per trip were averaged by the number of hauls, to describe a mean catch at a single light boat. These values were subsequently trimmed to remove extreme outliers and possible reporting errors. Trimming removed the upper 5% of the data by weight per haul. Monthly grand means were then calculated, and for each month, the mean weight (kg) and value ($) per haul were multiplied by the predicted number of light boats. Predicted fish biomass catch is therefore calculated as follows (Equation 2):
where total predicted biomass (mt yr−1) (PY) is the sum of the mean monthly VBD , divided by the monthly mean match rate () and multiplied by the mean weight () (kg). Predicted value is calculated as follows (Equation 3):
where total predicted value ($ yr−1) (PV) is the sum of the mean monthly VBD , divided by the monthly match rate () and multiplied by the mean value () ($). To provide a comparison with the above estimates, biomass and value calculations were repeated using the raw (uncorrected) VBD data. To provide an indication of potential uncertainty in the total biomass estimate, a bootstrapping method was applied using the boot package in R (Canty and Ripley, 2020). Bootstrapping is often used to analyse fisheries data to account for the highly dynamic and often variable distribution of landings data (Stewart and Hamel, 2014; Schwamborn et al., 2019). The bootstrap used a random sample (with replacement) replicated 10,000 times for each month. Respective minimum and maximum bootstrap mean weight (kg) per haul were then applied to the predicted mean number of light boats. Monthly values were then summed to provide an upper and lower estimate of biomass removal (mt yr-1).
Spatial and Temporal Distribution of Catch
In addition to understanding the temporal trends in the landings, it is also important to determine spatial “hotspots” of biomass removal to inform management. To predict areas of acute biomass extraction, we partitioned our study area into 5 × 5 km grid cells. Using the spatial coordinates assigned to each VBD record, a mean cumulative count of fishing effort was calculated for each cell by month. These values were subsequently corrected using the monthly VBD-GPS match rates to account for undetected light boats. Finally, corrected fishing intensity scores were combined with mean monthly landings data to spatially estimate biomass removal. To contextualize spatial estimates, monthly trends in species composition were calculated from the logbook data. The proportion of total biomass per haul for the five most landed species were calculated, with all other species grouped together.
To expand the spatial analysis to a regional scale, the coastal waters of Rakhine and Ayeyarwaddy states (Figure 1) were partitioned at a 20 × 20 km grid cell resolution and the relevant VBD records spatially apportioned and corrected as above. The average monthly landings data from Kyeintali landing sites were extrapolated to estimate biomass removal regionally. Monthly estimates for each grid cell were finally aggregated to estimate the cumulative annual biomass extraction spatially.
Results
GPS Tracked Fishing Trips
Processed GPS data resulted in 2,457 distinct fishing trips for comparison. Ninety seven percent (n = 2,383) remained within 10 nm of the coastline and predominantly operated in waters between 20 and 40 m deep. Hardware failures resulted in only 321 trips being tracked during the 2017/18 season. These failures may have occurred due to accidental damage from removal and storage after the first wet season. The number of trips occurring in the 2016/17 and 2018/19 season were more evenly distributed with 959 and 1,177 tracks respectively. Across the three fishing seasons the most trips occurred in February (n = 491) with the fewest for a month (n = 18) occurring in October (Table 3).
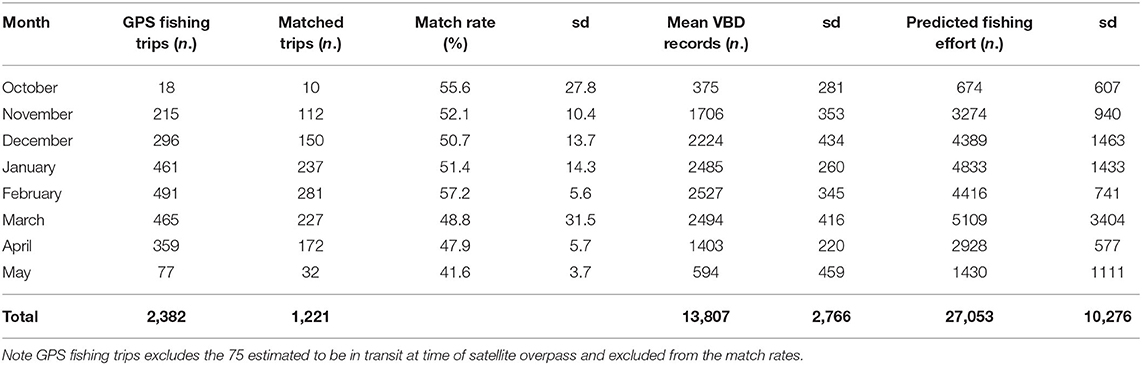
Table 3. Cross matching GPS and VBD data to predict total fishing effort.
Nighttime Light Imagery
The remote sensing imagery resulted in 569,436 VIIRS Boat Detections recorded in the EEZ of Myanmar for the three fishing seasons (October to May, 2016 to 2019). Locally, 41,422 detections were within the Kyeintali study area (2016/17: n = 12,185, 2017/18: n = 14,681 and 2018/19: n = 14,556). Of these detections, 73.5% (n = 30,444) were assigned the highest quality flag of 1, 26% (n = 10,800) flag 2 with quality flags 3 and 10 representing 0.1 and 0.3% of the data respectively. Local detection rates peak in February with mean cumulative detections of 2,527 per month (Table 3). October and May record low detection rates and a high deviation from mean monthly values, reflecting the dynamic nature of a seasonal fishery dictated by the onset of the wet or dry season (Table 3). Detections within the Kyeintali study area were widely distributed, however, ~90% (n = 27,220) occurred within the 10 nm inshore zone.
Purse Seine Landings Data
Fishing trips (n = 5,819) and 10,979 hauls (n = 10,979) were recorded in logbooks, landing ~1,900 mt, with a gross value of $497,820 (Table 4). Fishing vessels recorded 1.9 (mean ± sd 0.1) hauls per trip. The mean weight per haul remained relatively consistent across months (range: 330–371 kg), except for January and May (Supplementary Figure 2). January (185 kg) and May (519 kg) showed markedly high variation from the overall mean weight per haul (332 kg ± sd 366). Mean value per haul peaked in March at $207 (USD), down to $124 in January, and showed no clear trend across months.
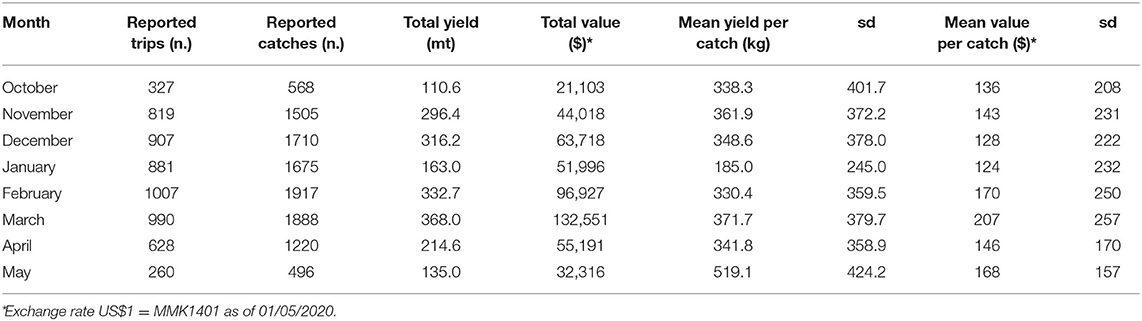
Table 4. Monthly mean weight and value per haul for the purse seine fishery calculated from logbook data of 36 vessels.
The landings data (Supplementary Table 1) revealed 102 distinct species were caught and landed. Cumulative frequency distribution revealed just five species accounted for 65% of the total landings by weight. These were: Goldstripe sardinella (Sardinella gibbosa), Indian anchovy (Stolephorus indicus), Indian mackerel (Rastrelliger kanagurta), White-spotted spinefoot (Siganus canaliculatus) and Indian squid (Uroteuthis duvaucelii). Landings (11%) were attributed to “non-consumptive catch” (locally: “Trash-fish”), where fisheries consolidate any small, unidentified and juvenile fish to be sold as animal feed or fertilizer. The remaining 24% of landings were comprised of less common target species and retained bycatch. Fin fish species represented 95% of total catch. Indian squid were the only cephalopod species of note and six species of shrimps and prawns represented <1% of total landed weight. Species of conservation concern were rarely reported as landed, except for reef manta rays (Mobula alfredi) with 29 separate instances. A landing ban on sharks in Myanmar may explain these reporting rates, with species either discarded at sea or intentionally omitted from logbooks. Goldstripe sardinella dominated landings in the early season, typically accounted for 50% of daily landings by weight (Figure 3). In contrast, Indian anchovy revealed an opposite trend, and were proportionally the most landed species in the final months of the season. January saw a lower proportion of catch attributed to these five species. Total weight composition was more evenly distributed between these, and other species [i.e., kawakawa (Euthynnus affinis)], with no one species responsible for more than 15% of total landings. The absence of large landings of shoaling fish in January may be the driver of the relatively low total weight (163 mt) and mean catch per haul.
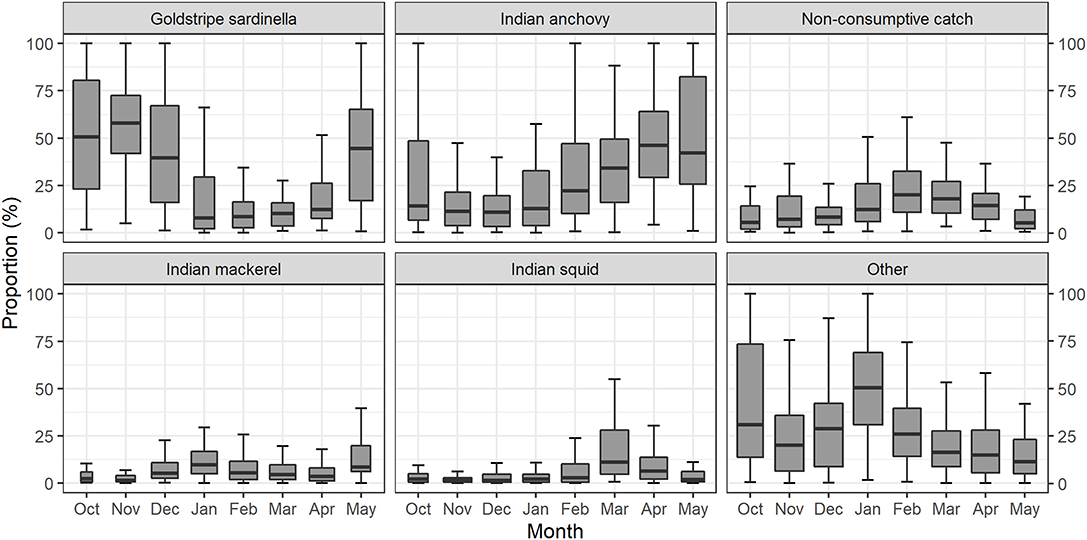
Figure 3. Kyeintali purse seine fishing fleet landings data. Monthly mean proportion of yield (kg) per haul from the logbook landings data grouped by the top four most landed species, non-consumptive catch grouping and all additional landed species grouped as “Other” (see Supplementary Table 1 for full list).
GPS to VBD Cross Matching
Of the 2,457 GPS tracked fishing trips considered for comparison against the VBD data, 1,221 (50%) were matched to unique VBD records. Of the unmatched trips, 75 were deemed to be in transit at the time of satellite overpass, so were subsequently removed, resulting in 1,221 trips matched from a possible 2,382 (51%). Duplicate matches (caused by multiple satellite overpasses) that may cause overestimation in match rates were not encountered when data screening. To explore temporal variation in VIIRS imagery efficiency, mean match rates were calculated for each month of the fishing season (Table 3). Monthly match rates revealed limited inter-monthly variation except for May, where the match rate declined and only 42% of fishing trips registered a match. Inter-annual variation was apparent, with a 57% match rate during the 2016/17 fishing season, 52% in 2017/18 and a 43% match rate in 2018/19. Months with higher match rates typically had a greater proportion of matches from higher accuracy VBDs (Supplementary Table 2).
KDE analysis of the VBD records reveal two distinct core (50th percentile) fishing areas, together covering 647 km2 (Figure 4). GPS tracks were spatially clustered, with results of the KDE analysis revealing two distinct core fishing areas, cumulatively representing 177 km2. Of this, 170 km2 (96%) spatially intersected the core area identified in the VBD data.
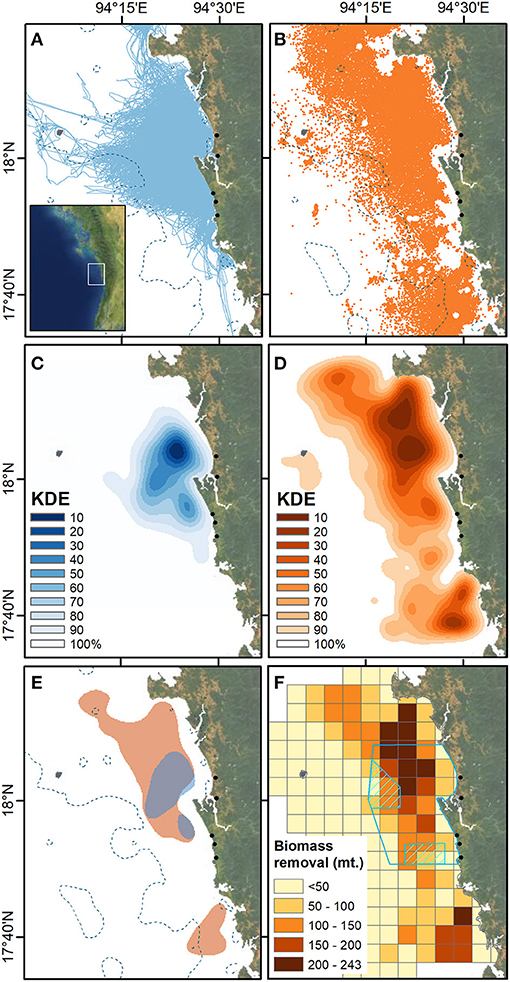
Figure 4. Kernel density estimation (KDE) analysis and spatial biomass removal. (A) The unprocessed GPS vessel tracks. (B) The raw VBD data (October to May 2016–2019). (C) KDE of processed GPS tracks using a 250 × 250 m grid cell and a 5 km search radius. (D) KDE of processed VBD data using a 250 × 250 m grid cell and a 5 km search radius. (E) Core activity areas of each dataset using the 50th percentile of the data. (F) Annual biomass removal estimate using a cumulative sum of monthly estimates at a 5 × 5 km grid cell resolution, with KIFCA boundaries and zonal gear restrictions (mesh size >1.5 cm) (blue hash). Key landing sites identified in Figure 1 shown (black points).
Predicted Fishing Effort
Predicted mean fishing effort achieved by adjusting raw VBD detections and the VBD-GPS matching rates suggest 27,053 fishing events at light boats per annum (Table 3) within the Kyeintali study area. December through March experience relatively high levels of predicted effort, with the season estimated to peak in March, with 5,109 fishing events on average. October (n = 674) and May (n = 1,430) experience relatively low and high deviation from estimated effort means, reflecting the variation in the start and end of the season.
Predicted Biomass and Value
Through extrapolation of the landings data with the predicted fishing effort values, we estimate the total biomass extracted by the Kyeintali sub-township purse seine fishery to be 8,938 mt yr−1, worth in excess of $4 million (Table 5). This compares to 4,529 mt yr−1 when using the raw, uncorrected VBD data. Results of the bootstrapping exercise indicated a minimum estimated biomass removal of 7,674 mt yr−1 and a maximum of 10,315 mt yr−1 (Supplementary Table 3). March is estimated to experience the highest mean landings, with an estimated 1,899 mt at a value of ~$1 million. Despite having a relatively high level of predicted fishing effort, January is estimated to experience modest landings (894 mt) compared to other peak months.
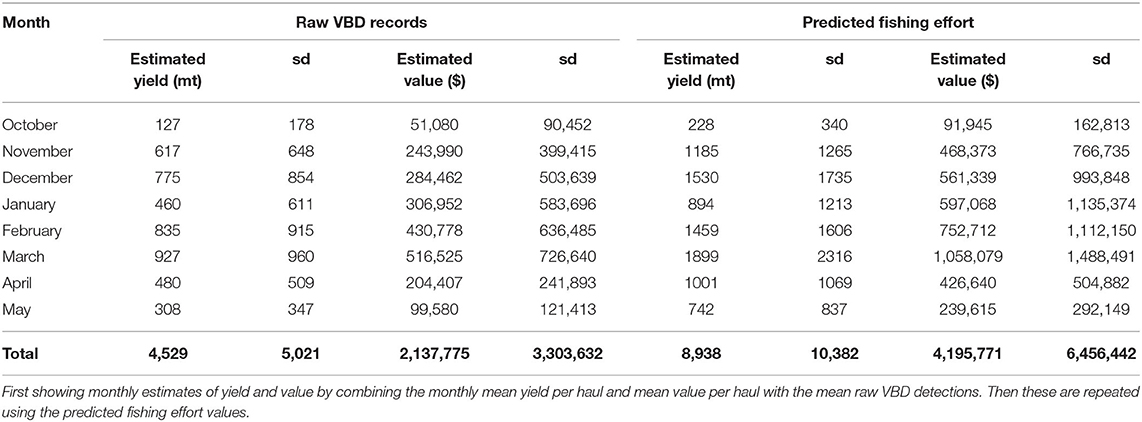
Table 5. Estimates of the purse seine fishery total yield and value.
Spatial and Temporal Distribution of Catch
Fishing effort was dispersed across much of the study area (147 of 202 cells experienced fishing activity; Figure 5). Most biomass removal was predicted to occur in the north of the study area, near Ponnyet (see Figure 1 for site names) and overlapped the Maw She KBA boundaries. Only one grid cell south of Kywe Gyaing was found to be in the top ten cumulatively most fished. Extraction was concentrated in several clusters, with over 50% of landings occurring in 24 grid cells (representing 12% of total cells). The majority (88%) of biomass was landed within the 10 nm inshore zone (attributed by the centroid of the grid cell) and predominantly in shallow water of <50 m depth. Spatial patterns of biomass extraction for the Kyeintali purse seine fleet revealed relatively small variations between months (Figure 5), but core areas were evident with six distinct cells found to occur in the top ten most fished for all but 2 months. Regional results reveal spatially distinct hotspots of biomass removal along the coast (Figure 6). The wider Kyeintali region was estimated to experience the highest levels of biomass removal by purse seine vessels. Significant hotspots were also evident close to the Rakhine state capital of Sittwe and adjacent to Ramree Island. Most fishing occurred within the inshore zone (10 nmi) and results indicated an effort of 53,243 light boat trips yr−1 (±sd 4,654) landing 33,988 mt yr−1 (±sd 38,998), although extrapolation of landings at this scale must be treated with additional caution.
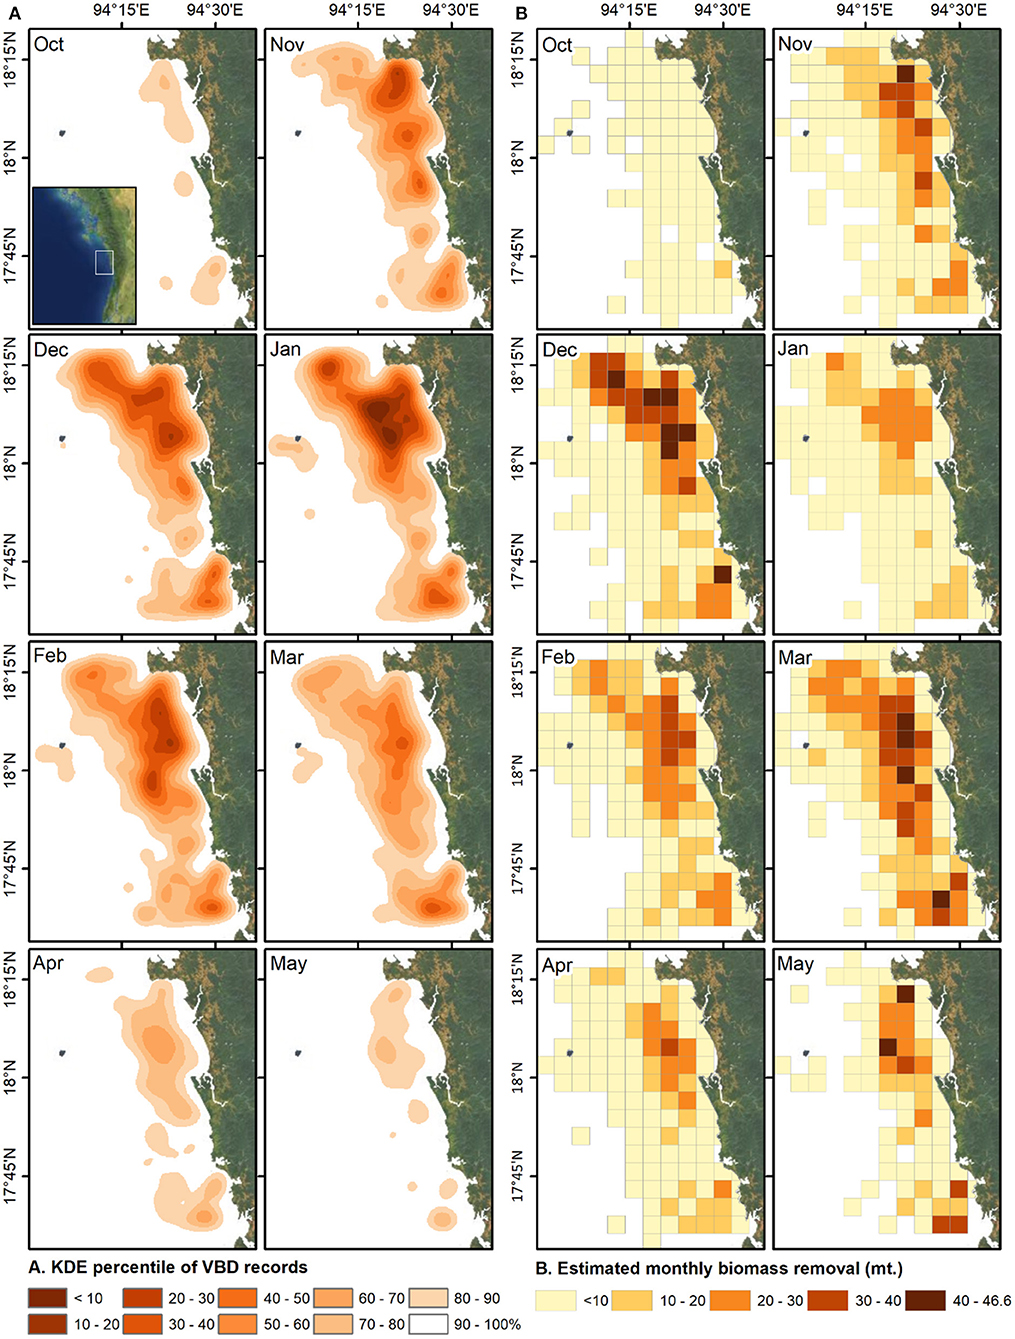
Figure 5. Monthly spatial fishing effort and biomass extraction. (A) KDEs show monthly VBD detections using 250 × 250 m grid cells with a 5 km search radius (October to May 2016–2019). (B) Estimates using a monthly mean of VBD records, corrected by monthly match rates and multiplied by mean monthly catch per haul (kg) to estimate biomass removal at 5 × 5 km grid cell resolution.
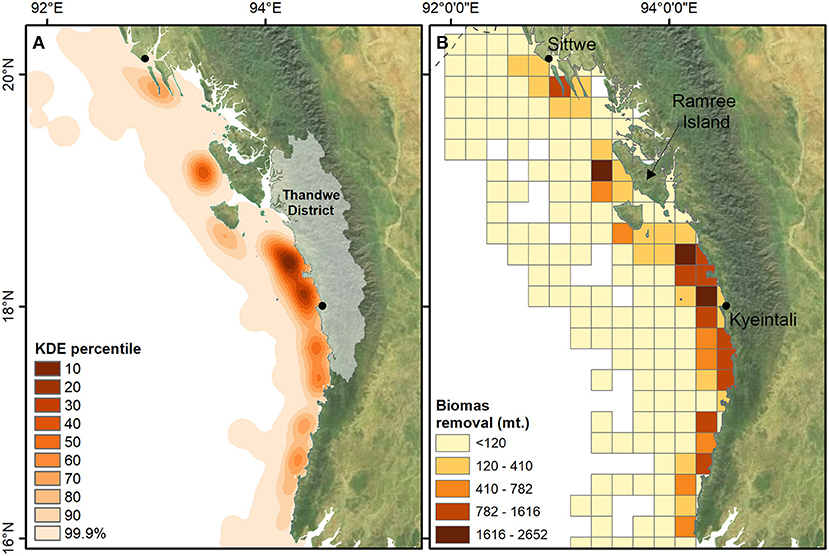
Figure 6. Regional annual spatial fishing effort and biomass removal. (A) Kernel density estimate (KDE) of total VBD detections (01/10/2016 – 31/05/2019) in the North of Myanmar, to highlight regional hotspots of fishing effort. KDE using a 1 × 1 km grid cell and a 20 km search radius and (B) spatial biomass yield estimates using a cumulative sum of monthly estimates at a 20 × 20 km grid cell resolution. Key locations discussed in the text highlighted. Intervals as displayed using a Natural Breaks (Jenks) function generated in ArcMap 10.6.1. Note the KDE symbology excludes the final 0.1% of data to improve visibility of hotspots.
Discussion
This study analyzed more than 5,800 surveyed fishing trips, 2,500 GPS tracks and 724 days of nighttime imagery to quantify the dynamics of a regionally important fishery in Myanmar. The presented method explores the utility of combining remotely sensed and in situ data to quantify a data-poor light-boat fishery. Despite fitting the description of a small-scale fleet (Smith and Basurto, 2019), results show the landings and economic importance of the purse seine fishery to be far from trivial. Key hotspots of biomass extraction are presented, notably to the north of the study site overlapping the conservation priority Maw She KBA reflecting the urgent need for improved spatial management of this area. Regionally, Kyeintali and the surrounding townships are estimated to be the most intensively fished in northern Myanmar. This makes them a focal location for future management, particularly in the context of conserving stocks of small shoaling and juvenile fish. The remote sensing products used here provide a long-term source of data, capable of quantifying an entire fleet (with appropriate caveats to interpretation) which would otherwise require extensive effort in vessel tracking and catch monitoring.
Estimated State of the Fishery
Providing a quantitative baseline of fisheries effort and biomass removal is important to developing long-term stock assessments (Guénette and Gascuel, 2012). Using the corrected detection rate, local purse seine fisher effort is predicted to be 27,053 hauls yr−1, 13,246 higher than when using the raw VBD data alone (13,807 yr−1). In turn, predicted biomass removal may be more than 8,900 mt yr−1, a benchmark that can be used to measure changes in catch and effort against in the future. The minimum (7,674 mt yr−1) and a maximum (10,315 mt yr−1) estimates generated from bootstrapping provide a useful range of uncertainty. The paucity of existing research or government fisheries statistics in Myanmar makes comparison of these values difficult. Data from small-scale purse seine fisheries in the western Indian Ocean reveal comparable mean landings data (349 kg per day ±sd 37.1) (Okemwa et al., 2017). As these vessels also target small shoaling fish, use similar vessel sizes (range: 8–15 m) and operate in similar waters (between 2.6 and 10.5 nautical miles offshore) they provide a useful, if geographically distinct reference for comparison (Okemwa et al., 2017). The benefits of using fine-scale landings data, as opposed to aggregated and often coarse annual estimates are also apparent. For example, the month of March, despite having similar levels of effort to January (mean = 2,494 and 2,485, respectively), is predicted to yield almost double the catch (1,899 and 894 mt) and be the most economically important month of the season. Maps of biomass extraction also provide a valuable contribution to supporting management efforts including marine spatial planning, currently in development nationally (Pei Ya, 2016), or local co-management initiatives. The ten most fished grid cells (250 × 250 m) are estimated to support 4,378 mt of biomass removal, ~50% of total landings within 5% of mapped fishing areas (Figure 4). This high level of fishing intensity focused on relatively small geographic areas is likely to have significant impacts on local ecosystems and marine food webs. This is especially true given potential for hyperstability in catches of small pelagic species, regardless of stock status (Cruz-Rivera et al., 2019). Hyperstability occurs as the biological characteristics of shoaling fish can result in large landings, even if stocks are known to be depleted. If zones of concentrated fishing effort here overlap with potential spawning or recruitment sites for these species, stock declines may be challenging to establish from mass of landed fish alone. Future research investigating trends in age and size class is therefore required.
Considerations
Prior to discussing the state of the local fishery, it is important to examine the caveats and strengths of the method presented here. Acknowledging these caveats provides important context when evaluating uncertainty in results and applying them to inform local management efforts.
Government zonal licenses exclude larger industrial fishing vessels from the majority of the Kyeintali study area. Given the lack of capacity for monitoring and enforcement in Myanmar, we are unable to definitively report that these vessels are not fishing inshore waters. Larger vessels with capacity to remove more biomass per unit effort (due to larger nets) may lead to underestimates of landings within the study area. This is an important consideration in regions where different vessel classes share fishing grounds, or where multiple gear types using light-boats operate. Notwithstanding this issue, locally, fishers rarely report illegal fishing of inshore waters by large transient vessels using lights at night. It is also worth noting that the VBD pixel footprint (742 × 742 m) is large enough to contain multiple vessels if operating in highly clustered formations (Elvidge et al., 2015). The application of VBD to produce high-resolution landings and effort data as presented here is therefore more suited to regions with spatially distinct gear types and individual vessels using light to attract catch.
Environmental variables are known to impact the accuracy of VIIRS imagery. Increased cloud cover and lunar brightness, notably under full moon conditions, can reduce the ability of VIIRS to detect vessels (Elvidge et al., 2015; Hsu et al., 2019). These variables may also increase the proportion of low-quality detections. Locally the month of May is considered the beginning of the wet season. May experienced both lower match rates and a large proportion (50%) of matches from detections with “weak,” “blurry” or “weak and blurry” quality flags (Flags 2, 3, and 10). Peak dry-season months of December, January and February achieved 87.3, 87.3, and 83.3% of their matches with quality flag 1 detections, respectively. Given the prevalence of wet or monsoon rains across the tropics, inter-monthly variation in detection rates and accuracy of detections should be considered when discussing certainty in fishery estimates. Lunar glare on the sea surface may also result in false-positive VBD detections and cause overestimation fishing effort (Elvidge et al., 2015). At present we are unable to determine the exact scale of this issue and additional algorithm development may further minimize false detections. Our approach assumes that all VBD matches are correctly attributed to GPS tracks of vessels operating in proximity. Due to the spatially segregated nature of the fleet (vessels distance themselves to ensure lights attract and condense fish around one vessel) and the relatively fine-scale matching parameters (VBD and GPS data must be within 800 m and 1 min of each other), the chance of GPS tracks false matching is believed to be low. Given the impact of environmental conditions on VIIRS derived data, using a similar cross matching exercise to that presented here is advisable. Cross matching with the high-resolution GPS boat tracking data revealed the potential for VBD data to underestimate the potential true extent and magnitude of fishing effort for the Kyeintali purse seine fleet by ~50%. These results are comparable with detection rates of Indonesia purse seine vessels, using lower resolution spatial data of large VMS tracked commercial vessels (Hsu et al., 2019).
Our results rely on self-reporting of landings by fishers. Whilst logbooks have been shown to be an accurate and comprehensive source of landings data (Vincent et al., 2007; Bastardie et al., 2010), they are inevitably subject to a level of error or intentional misreporting. The removal of shark species from logbooks due to a national ban on landings is likely throughout Myanmar and requires future research. Inspection of the landings data also revealed multiple large (>10,000 kg) landings, suspected to be reporting errors by fishers given the size and capacity of the vessels. To account for this error local landings were trimmed, removing the top 5% of data by mass. Removal of outliers is often applied to landings data (Gill et al., 2019), however, it may mask infrequent but legitimate large catches. Additional statistical methods, including bootstrapping as performed in our study, can also be applied to address uncertainty when extrapolating landings data (Magnusson et al., 2013).
Implications for Local Fisheries Management and Conservation
Despite the discussed limitations the results presented here provide the first comprehensive assessment of a key inshore fishery in Myanmar. Our estimates are likely more representative of true landings than high-level government statistic drawn from large geographical regions (Mills et al., 2011). It is increasingly recognized that adopting a diverse range of management strategies in combination with legitimate community engagement is essential for the effective management of small-scale fisheries (Tilley et al., 2019). There has been a recent move toward decentralization of fisheries and marine management from federal to state level within Myanmar, with the creation of community led local inshore fisheries co-management areas. The first of which was established in the Kyeintali sub-township in 2018 (Kyeintali Inshore Fisheries Co-Management Association, KIFCA), with others planned in adjacent sub-townships along the coast in Rakhine, Tanintharyi and Ayeyerwady State. Without understanding the variation in weight, value and locations of landings, local adaptive management measures such as time-area closures are likely to be poorly designed and could fail to deliver intended benefits increasing uncertainty in food security for dependent communities. Understanding what, where, when, how much and the value of a fishery are fundamental to knowing its impact on target and non-target stocks, the marine ecosystem they are part of and the communities that depend on the fisheries or marine environment for their livelihoods (Glaser et al., 2015). These elements need to be balanced within local (e.g., KIFCA), state or federal fisheries or marine management measures and regulations, to produce positive and sustainable outcomes for coastal communities, and to complement conservation efforts within the region. The spatial estimates of biomass extraction presented here will provide an important baseline understanding of the purse seine inshore fishery in Rakhine and Ayeyerwady, which is thought by many fishers to be in decline due to overfishing (Wildlife Conservation Society, 2018).
The Kyeintali co-management area incorporates a range of management measures, including small no-take zones, seasonal closures and zonal gear restrictions. The success of the co-management area is likely reliant on capacity building to design and implement effective regulations. The voluntary engagement by fishers in this study suggests an interest in designing informed management measures. Data complimenting these measures has, to date, been lacking. Improvements in data availability can provide a quantitative baseline against which management efforts can be assessed. For example, this study provides valuable input to inform zonal gear restrictions potentially based on minimum mesh sizes, notably in January and February, due to higher levels of “non-consumptive catch” reported (mean 19.4 ± sd 17.0). Mapping of extracted biomass reveals most fishing occurs northeast of existing KIFCA gear restrictions during these months (Figure 4). The expansion of minimum mesh size requirements to these more intensively fished areas could reduce the removal of juvenile fish and allow more individuals to reach maturity and spawn (Graham et al., 2007). Whilst these landings play an important part in the local economy and indirectly underpin local food security (due to use as animal feed or fertilizer), the removal of unidentified small and/or juvenile and adult fish by nets with low selectivity in this manner may have implications for the long-term sustainability of stocks (Froese et al., 2016). Certain fishery harvest strategies advocate for the retention or even targeting of small, productive organisms in fisheries (Garcia et al., 2012). Whilst mixed harvests of high fecundity species may be considered sustainable, data on catch composition (size and age class) is still important for monitoring stock status. For example, if landings were found to be comprised of single-species juveniles, then these fishing grounds may be important recruitment sites. If subsequent expansion of gear restrictions were deemed necessary, new co-management areas at adjacent sites could be informed by the spatiotemporal data compiled here. This data would however be most beneficial when used alongside other socioeconomic [e.g., vulnerability of local fishers (Mizrahi et al., 2020)], and biodiversity [e.g., benthic ecology (Vulcan, 2020)] considerations to produce spatial measures that improve the sustainability of small-scale fisheries livelihoods, and complement environmental and species conservation efforts. Community involvement in marine management is known to improve cooperation and trust-building (Stewart et al., 2010). Community led initiatives should therefore be conducted to compliment top-down approaches when designing and implementing management strategies.
Our results can also provide species-specific context to management that may be appropriate for long term sustainability in the fishery. In the Bay of Bengal small shoaling fish species are known to show distinct spatio-temporal trends in distribution (Luther, 2001). This results in species remaining spatially distinct and increases the likelihood of a single species dominating landings at different stages of a season (Ghosh et al., 2013). Consequently, time-area closures need to be well-informed to ensure the effectiveness of management interventions for these species. Locally, there is evidence of seasonality in landings of two dominant species, goldstripe sardinella and Indian anchovy. Together these species account for 51% of total reported landings by weight, not accounting for any juveniles aggregated by fisheries into non-consumptive catch. Hotspots of biomass removal identified in October through December are relevant to management of local goldstripe sardinella stocks, due to their high contribution to landings during these months (mean 52% ±sd 28.2). Time-area closures or zonal total allowable catches are more likely to benefit Indian anchovy from March through May (mean 45% ±sd 24.7). Stocks of small shoaling fish such as these have been overfished globally (Roux and Shannon, 2004; MacCall et al., 2016) and are therefore susceptible to collapse (Eero et al., 2012). As these species occupy a key trophic position as food for a variety of predatory fish, reductions in their population may have wide-ranging impacts on local marine ecosystems (Ghosh et al., 2013). Whilst long term catch per unit effort calculations will help inform the status of local stocks, our results can provide a high-resolution spatial baseline or be applied to catch-based stock assessment tools, specifically designed for data-poor scenarios (Free et al., 2017).
Landings of vulnerable marine species can also be addressed using these data. Low fecundity and conservation concern species which were recorded in the logbooks included longhead eagle ray (Aetobatus flagellum), spinetail devilray (Mobula japonica), bull shark (Carcharhinus leucas), toli shad (Tenualosa toli), fourfinger threadfin (Eleutheronema tetradactylum) and gray bamboo shark (Chiloscyllium griseum). Whilst catches of these species were intermittent, true landings are likely to be higher given the level of unsurveyed fishing effort shown to occur locally through VBDs. The complete ban on shark fishing in Myanmar since 2009 (BOBLME, 2015) may also result in catches of certain species being underreported in the sample of logbooks due to the worry of potential consequences from fishery authorities (MacKeracher et al., 2020). Landings of reef manta rays, a species globally considered Vulnerable (IUCN) (Marshall et al., 2018), appear more substantial. Caught almost exclusively between January and February, the actual number of individuals harvested is unclear. Many of the 29 landings represent processed weights, rather than intact individuals (mean 280 kg range: 6.4–3,261). Application of the VBD informed biomass maps with available GPS data for a subset of these landings (n = 10) reveal they occurred almost exclusively within a cluster of moderate to highly fished grid cells (Supplementary Figure 3). Over the three months, cumulative fishing effort estimated to occur in these grid cells exceeds 2,700 net hauls. Given the high relative levels of fishing effort within these areas, actual manta landings likely exceed those reported here. The clustered nature of landings suggests targeted interventions with fishers known to operate within these areas and could help encourage lower retention rates of bycaught individuals (Restrepo et al., 2016). However, the high post-release mortality of mobulids (Stewart et al., 2018) suggests release of boarded individuals will have limited conservation benefits. In the absence of effective bycatch mitigation strategies for these species (Stewart et al., 2018), further research is warranted to determine the scale of manta landings both locally and regionally. Additionally, the post-release survivorship of bycaught rays and the collection of fine-scale spatial data to inform distribution models and time-area closures should be prioritized. Management of local manta populations should be considered a conservation priority for the fishery given the harvest and trade of manta productions is increasing across Asia (O'Malley et al., 2017).
Wider Application
Extrapolation of local catch data to larger geographic scales requires additional caveats to be considered, in part from variation that could arise in fishing practices and catch composition over the greater geographic scale. Supporting data from interviews conducted in 13 additional coastal villages in southern Rakhine and Ayeyarwady state (Wildlife Conservation Society, 2018) reveal similarity between the study regions. They indicate that purse seine fleets regionally use similar size boats and net mesh, fish the same season (October to May) and target the same (sardinella, mackerel and anchovy spp.) regionally. Birch et al. (2016) also document limited biotic and abiotic variation between local and regional scales. Given these similarities, it is worthwhile providing wider estimations of the fishery's footprint for such a data poor region, providing increased uncertainty is acknowledged.
Whilst the extrapolation of Kyeintali landings to the regional VBD records reduces certainty in predicted biomass values, the hotspots identified here can guide resources, such as developing locally managed marine areas, where they will be most effective for the conservation of marine life. Given these waters encompass the majority of the Rakhine Marine Corridor, a region identified as a marine conservation priority area (Wildlife Conservation Society, 2013), results provide a baseline characterization to underpin conservation efforts. For example, the identification of a fishing hotspot off Ramree Island may have specific implications for marine turtle (Chelonioidea spp.) bycatch, as it is known to support extensive nesting beaches of at least five species (Birch et al., 2016).
Whilst this study tested the application value of the method within Myanmar, its' application value is far broader. Remote sensing data products have been identified as a key tool for future monitoring of Southeast Asian fisheries, with VIIRS imagery specifically highlighted (Gorospe et al., 2016). The ubiquitous nature of vessels using light across Southeast Asia are evident in VIIRS imagery (Figure 7). One of the strengths of VIIRS data is the ability of VBD algorithms to filter a specialized subset of vessel types (Elvidge et al., 2015). Due to the high intensity of light luminescence needed to be detected by VIIRS imagery, typically only fishing vessels using very bright lights to attract catch (i.e., purse-seiners or squid jiggers) are detectable. This makes it unlikely that detection data includes other fishing gear types or most non-fishing vessels. VBD also has the potential to detect IUU activities and dark fleets operating without AIS enabled but with lights deployed at night (Elvidge et al., 2018; Oozeki et al., 2018). Whilst VIIRS imagery captures both large pelagic and small-scale fleets, numerous hotspots of inshore and remote fishing are apparent. The synthesis of landings data with VBDs at these sites have the potential to increase our ability to characterize small scale, data-poor fisheries in a cost-effective manner.
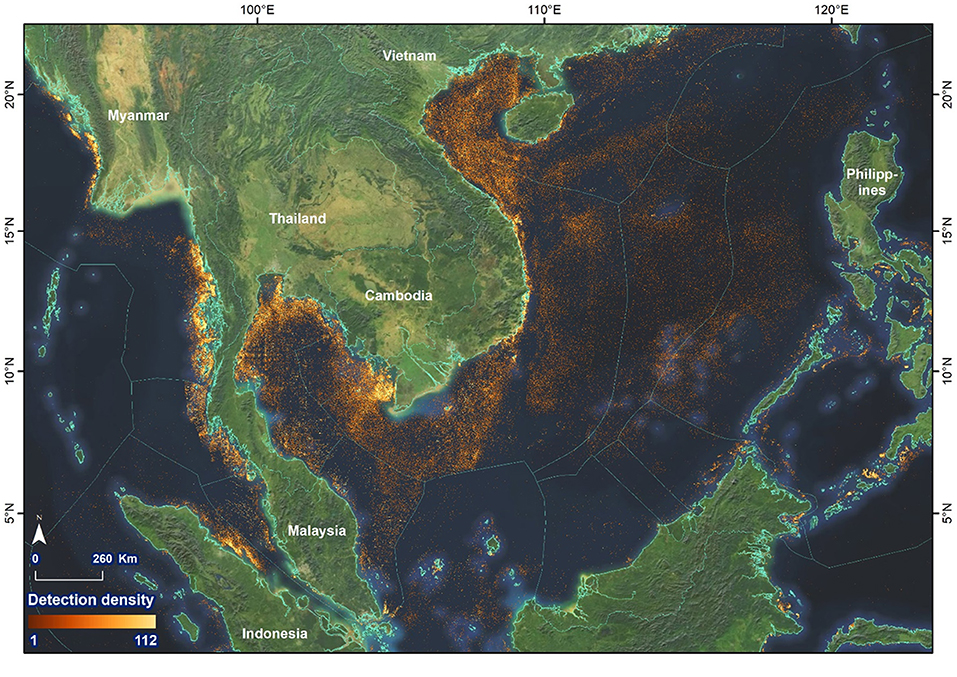
Figure 7. VBD records across Southeast Asia. Showing cumulative detections recorded in 2019 at a 0.0042 degree (~459 m) grid cell resolution. Annual raster data downloaded from the EOG repository (https://eogdata.mines.edu/vbd/), accessed 29/06/2020.
Conclusion
Despite several limitations associated with remotely derived data this study demonstrates how relatively low-cost concentrated fishery landings surveys can be successfully combined with open-source remote sensed data to provide a more holistic characterization of a data-poor fishery. The approach adopted in this study has provided a comprehensive baseline characterization of a fishery, which could not be achieved by applying either remoted sensing imagery, individual vessel tracking or localized data in isolation. Moreover, the effort and expense required to collect and combine such detailed spatial effort and catch data over multiple years would be considerable, highlighting the power in such an approach. Given the increased uptake of VIIRS data to monitor fisheries, the method can serve as an example for application to other coastal fleets using light to attract catch but lacking capacity for long term data collection (Geronimo et al., 2018). The results here provide a valuable baseline in a region of Myanmar high in biodiversity, but lacking data to inform effective management.
Data Availability Statement
VIIRS Boat Detection data productmade available open access by the Earth Observation Group, Payne Institute for Public Policy (https://eogdata.mines.edu/vbd/). The other datasets presented in this article are not readily available because data requests need to be made directly to the WCS Myanmar offices. Requests to access the datasets should be directed to WCS Myanmar, wcsmyanmar@wcs.org.
Author Contributions
OE, AB, RT, CK, and MW contributed to the conception and design of the study. OE, AB, RT, MW, MM, MK, and TH contributed to data collection. OE conducted analyses and OE, AB, RT, CK, and MW developed the first drafts of the manuscript. All authors contributed to further manuscript revisions and read and approved the final version.
Funding
Myanmar data collection was funded as part of the Darwin Initiative grant (23-024) led by WCS. Open access publication fees provided by the University of Exeter Library.
Conflict of Interest
The authors declare that the research was conducted in the absence of any commercial or financial relationships that could be construed as a potential conflict of interest.
Acknowledgments
Thanks to Rakhine Coastal Region Conservation Association members for data collection and fieldwork logistics. We thank M. Callow for initiating research and fostering collaborations between WCS Myanmar, the RCA and the University of Exeter. VIIRS Boat Detection data product made available open access by the Earth Observation Group, Payne Institute for Public Policy (see: Elvidge, Christopher D., Mikhail Zhizhin, Kimberly Baugh, and Feng-Chi Hsu. Automatic boat identification system for VIIRS low light imaging data. Remote sensing 7, no. 3 (2015): 3020-3036). Some Figures use map data from Mapbox and OpenStreetMap and their data sources. To learn more, visit https://www.mapbox.com/about/maps/ and http://www.openstreetmap.org/copyright.
Supplementary Material
The Supplementary Material for this article can be found online at: https://www.frontiersin.org/articles/10.3389/fmars.2020.625766/full#supplementary-material
References
Alfaro-Shigueto, J., Mangel, J. C., Bernedo, F., Dutton, P. H., Seminoff, J. A., and Godley, B. J. (2011). Small-scale fisheries of Peru: a major sink for marine turtles in the Pacific. J. Appl. Ecol. 48, 1432–1440. doi: 10.1111/j.1365-2664.2011.02040.x
Aylesworth, L., Phoonsawat, R., and Vincent, A. C. (2018). Effects of indiscriminate fisheries on a group of small data-poor species in Thailand. ICES J. Mar. Sci. 75, 642–652. doi: 10.1093/icesjms/fsx193
Ban, N. C., Hansen, G. J., Jones, M., and Vincent, A. C. (2009). Systematic marine conservation planning in data-poor regions: socioeconomic data is essential. Mar. Policy 33, 794–800. doi: 10.1016/j.marpol.2009.02.011
Bastardie, F., Nielsen, J. R., Ulrich, C., Egekvist, J., and Degel, H. (2010). Detailed mapping of fishing effort and landings by coupling fishing logbooks with satellite-recorded vessel geo-location. Fish. Res. 106, 41–53. doi: 10.1016/j.fishres.2010.06.016
Bicknell, A. W. J. (2019). Darwin Initiative Project: Income and Landings Data. Wildlife Conservation Society.
Birch, F. C. H., Pikesley, S. K., Bicknell, A. W. J., Callow, M., Doherty, P. D., Exeter, O., et al. (2016). Myanmar Marine Biodiversity Atlas. Exeter: University of Exeter, UK.
Blaber, S. J., Cyrus, D. P., Albaret, J. J., Ching, C. V., Day, J. W., Elliott, M., et al. (2000). Effects of fishing on the structure and functioning of estuarine and nearshore ecosystems. iCES J. Mar. Sci. 57, 590–602. doi: 10.1006/jmsc.2000.0723
BOBLME Department of Fisheries, Myanmar, Fauna and Flora International. (2015). Guide to the Development of Myanmar's National Plan of Action for the conservation and management of sharks. Phuket, Thailand: Bay of Bengal Large Marine Ecosystem Project (BOBLME).
Boon, P. Y., Callow, M., and Grantham, H. (2016). Marine Spatial Planning for Myanmar. Yangon Myanmar: Wildlife Conservation Society Myanmar Programme.
Breen, P., Vanstaen, K., and Clark, R. W. (2015). Mapping inshore fishing activity using aerial, land, and vessel-based sighting information. ICES J. Mar. Sci. 72, 467–479. doi: 10.1093/icesjms/fsu115
Brown, G. (2012). Public Participation GIS for regional and environmental planning: reflections on a decade of empirical research. J. Urban Regional Inf. Syst. 24, 5–16.
Brown, G. (2017). A review of sampling effects and response bias in internet participatory mapping (PPGIS/PGIS/VGI). Transact. GIS 21, 39–56. doi: 10.1111/tgis.12207
Calenge, C. (2006). The package “adehabitat” for the R software: a tool for the analysis of space and habitat use by animals. Ecol. Modell. 197, 516–519. doi: 10.1016/j.ecolmodel.2006.03.017
Cardiec, F., Bertrand, S., Witt, M. J., Metcalfe, K., Godley, B. J., McClellan, C., et al. (2020). “Too big to ignore”: a feasibility analysis of detecting fishing events in gabonese small-scale fisheries. PLoS ONE 15:e0234091. doi: 10.1371/journal.pone.0234091
Chan, A., and Hodgson, P. A. (2017). “A systematic analysis of blast fishing in South-East Asia and possible solutions,” in 2017 IEEE Underwater Technology (UT) (Busan: IEEE). doi: 10.1109/UT.2017.7890330
Chassot, E., Bonhommeau, S., Reygondeau, G., Nieto, K., Polovina, J. J., Huret, M., et al. (2011). Satellite remote sensing for an ecosystem approach to fisheries management. ICES J. Mar. Sci. 68, 651–666. doi: 10.1093/icesjms/fsq195
Choi, K., Lee, C. I., Hwang, K., Kim, S. W., Park, J. H., and Gong, Y. (2008). Distribution and migration of Japanese common squid, Todarodes pacificus, in the southwestern part of the East (Japan) sea. Fish. Res. 91, 281–290. doi: 10.1016/j.fishres.2007.12.009
Cozzolino, E., and Lasta, C. A. (2016). Use of VIIRS DNB satellite images to detect jigger ships involved in the illex argentinus fishery. Rem. Sens. Appl. Soc. Environ. 4, 167–178. doi: 10.1016/j.rsase.2016.09.002
Croft, T. A. (1978). Nighttime images of the earth from space. Sci. Am. 239, 86–101. doi: 10.1038/scientificamerican0778-86
Cruz-Rivera, E., Ramírez, C. H, and Vasilieva, O. (2019). Catch-to-stock dependence: the case of small pelagic fishery with bounded harvesting effort. Nat. Resour. Model. 32:e12193. doi: 10.1111/nrm.12193
Department of Fisheries (2016). Myanmar Fisheries Statistics. Department of Fisheries, Ministry of Agriculture, Livestock and Irrigation.
Dunn, D. C., Stewart, K., Bjorkland, R. H., Haughton, M., Singh-Renton, S., Lewison, R., et al. (2010). A regional analysis of coastal and domestic fishing effort in the wider Caribbean. Fish. Res. 102, 60–68. doi: 10.1016/j.fishres.2009.10.010
Eero, M., Vinther, M., Haslob, H., Huwer, B., Casini, M., Storr-Paulsen, M., et al. (2012). Spatial management of marine resources can enhance the recovery of predators and avoid local depletion of forage fish. Conserv. Lett. 5, 486–492. doi: 10.1111/j.1755-263X.2012.00266.x
Elvidge, C. D., Ghosh, T., Baugh, K., Zhizhin, M., Hsu, F. C., Katada, N. S., et al. (2018). Rating the effectiveness of fishery closures with visible infrared imaging radiometer suite boat detection data. Front. Mar. Sci. 5:132. doi: 10.3389/fmars.2018.00132
Elvidge, C. D., Zhizhin, M., Baugh, K., and Hsu, F. C. (2015). Automatic boat identification system for VIIRS low light imaging data. Rem. Sens. 7, 3020–3036. doi: 10.3390/rs70303020
Ferrà, C., Tassetti, A. N., Grati, F., Pellini, G., Polidori, P., Scarcella, G., et al. (2018). Mapping change in bottom trawling activity in the mediterranean sea through AIS data. Mar. Policy 94, 275–281. doi: 10.1016/j.marpol.2017.12.013
Food and Agriculture Organisation (2014). State of World Fisheries and Aquaculture 2014. Food and Agriculture Organisation.
Food and Agriculture Organisation (2015). Voluntary Guidelines for Securing Sustainable Small-Scale Fisheries in the Context of Food Security and Poverty Eradication. Rome: FAO.
Fox, H. E., and Caldwell, R. L. (2006). Recovery from blast fishing on coral reefs: a tale of two scales. Ecol. Appl. 16, 1631–1635. doi: 10.1890/1051-0761(2006)016[1631:RFBFOC]2.0.CO;2
Free, C. M., Jensen, O. P., Wiedenmann, J., and Deroba, J. J. (2017). The refined ORCS approach: a catch-based method for estimating stock status and catch limits for data-poor fish stocks. Fish. Res. 193, 60–70. doi: 10.1016/j.fishres.2017.03.017
Froese, R., Winker, H., Gascuel, D., Sumaila, U. R., and Pauly, D. (2016). Minimizing the impact of fishing. Fish Fish. 17, 785–802. doi: 10.1111/faf.12146
Garcia, S. M., Kolding, J., Rice, J., Rochet, M. J., Zhou, S., Arimoto, T., et al. (2012). Reconsidering the consequences of selective fisheries. Science 335, 1045–1047.
Geronimo, R. C., Franklin, E. C., Brainard, R. E., Elvidge, C. D., Santos, M. D., Venegas, R., et al. (2018). Mapping fishing activities and suitable fishing grounds using nighttime satellite images and maximum entropy modelling. Rem. Sens. 10:1604. doi: 10.3390/rs10101604
Ghosh, S., Rao, M. V., Sumithrudu, S., Rohit, P., and Maheswarudu, G. (2013). Reproductive biology and population characteristics of Sardinella gibbosa and Sardinella fimbriata from North West Bay of Bengal. Indian J. Geo-Marine Sci. 42, 758–769. Available online at: http://nopr.niscair.res.in/handle/123456789/24812
Gill, D. A., Oxenford, H. A., Turner, R. A., and Schuhmann, P. W. (2019). Making the most of data-poor fisheries: low cost mapping of small island fisheries to inform policy. Mar. Policy 101, 198–207. doi: 10.1016/j.marpol.2017.10.040
Gitzen, R. A., Millspaugh, J. J., and Kernohan, B. J. (2006). Bandwidth selection for fixed-kernel analysis of animal utilization distributions. J. Wildl. Manage. 70, 1334–1344. doi: 10.2193/0022-541X(2006)70[1334:BSFFAO]2.0.CO;2
Glaser, M., Breckwoldt, A., Deswandi, R., Radjawali, I., Baitoningsih, W., and Ferse, S. C. (2015). Of exploited reefs and fishers–a holistic view on participatory coastal and marine management in an Indonesian archipelago. Ocean Coastal Manage. 116, 193–213. doi: 10.1016/j.ocecoaman.2015.07.022
Gorospe, K. D., Michaels, W., Pomeroy, R., Elvidge, C., Lynch, P., Wongbusarakum, S., et al. (2016). The mobilization of science and technology fisheries innovations towards an ecosystem approach to fisheries management in the coral triangle and southeast asia. Mar. Policy 74, 143–152. doi: 10.1016/j.marpol.2016.09.014
Graham, N., Ferro, R. S., Karp, W. A., and MacMullen, P. (2007). Fishing practice, gear design, and the ecosystem approach—three case studies demonstrating the effect of management strategy on gear selectivity and discards. ICES J. Mar. Sci. 64, 744–750. doi: 10.1093/icesjms/fsm059
Guénette, S., and Gascuel, D. (2012). Shifting baselines in European fisheries: the case of the Celtic Sea and Bay of Biscay. Ocean Coastal Manage. 70, 10–21. doi: 10.1016/j.ocecoaman.2012.06.010
Hsu, F. C., Elvidge, C. D., Baugh, K., Zhizhin, M., Ghosh, T., Kroodsma, D., et al. (2019). Cross-matching VIIRS boat detections with vessel monitoring system tracks in Indonesia. Rem. Sens. 11:995. doi: 10.3390/rs11090995
Jennings, S., and Lee, J. (2012). Defining fishing grounds with vessel monitoring system data. ICES J. Mar. Sci. 69, 51–63. doi: 10.1093/icesjms/fsr173
Johnson, A. F., Moreno-Báez, M., Giron-Nava, A., Corominas, J., Erisman, B., Ezcurra, E., et al. (2017). A spatial method to calculate small-scale fisheries effort in data poor scenarios. PLoS ONE 12:e0174064. doi: 10.1371/journal.pone.0174064
Klemas, V. (2013). Fisheries applications of remote sensing: an overview. Fish. Res. 148, 124–136. doi: 10.1016/j.fishres.2012.02.027
Krakstad, J., Michalsen, K., Krafft, B., Bagøien, E., Alvheim, O., and Strømme, T. (2014). Cruise Report “Dr Fridtjof Nansen” Myanmar Ecosystem Survey 13 November – 17December 2013. Bergen: Institute of Marine Research.
Kroodsma, D. A., Mayorga, J., Hochberg, T., Miller, N. A., Boerder, K., Ferretti, F., et al. (2018). Tracking the global footprint of fisheries. Science 359, 904–908. doi: 10.1126/science.aao5646
Léopold, M., Guillemot, N., Rocklin, D., and Chen, C. (2014). A framework for mapping small-scale coastal fisheries using fishers' knowledge. ICES J. Marine Sci. 71, 1781–1792. doi: 10.1093/icesjms/fst204
Liu, Y., Saitoh, S. I., and Hirawake, T. (2015). Detection of squid and pacific saury fishing vessels around Japan using VIIRS day/night band image. Proc. Asia-Pacific Adv. Netw. 39, 28–39. doi: 10.7125/APAN.39.3
Luther, G. (2001). Management of Lesser Sardine Fishery Resources Along North Andhra Coast. Souvenir issued on the Occasion of the inauguration of Visakhapatnam RC of CMFRI 17 October 2001, 5–9.
MacCall, A. D., Sydeman, W. J., Davison, P. C., and Thayer, J. A. (2016). Recent collapse of northern anchovy biomass off California. Fish. Res. 175, 87–94. doi: 10.1016/j.fishres.2015.11.013
MacKeracher, T., Mizrahi, M., Bergseth, B., Maung, K. M. C., Phyu, E. T., Simpfendorfer, C. A., et al. (2020). Understanding non-compliance in small scale fisheries: shark fishing in Myanmar's Myeik Archipelago. AMBIO. doi: 10.1007/s13280-020-01400-1. [Epub ahead of print].
Magnusson, A., Punt, A. E., and Hilborn, R. (2013). Measuring uncertainty in fisheries stock assessment: the delta method, bootstrap, and MCMC. Fish Fish. 14, 325–342. doi: 10.1111/j.1467-2979.2012.00473.x
Mangel, J. C., Alfaro-Shigueto, J., Van Waerebeek, K., Cáceres, C., Bearhop, S., Witt, M. J., et al. (2010). Small cetacean captures in Peruvian artisanal fisheries: high despite protective legislation. Biol. Conserv. 143, 136–143. doi: 10.1016/j.biocon.2009.09.017
Marshall, A., Bennett, M. B., Kodja, G., Hinojosa-Alvarez, S., Galvan-Magana, F., Harding, M., et al. (2018). Mobula birostris (amended version of 2011 assessment). IUCN Red List Threatened Species 2018:eT198921A126669349.
Metcalfe, K., Collins, T., Abernethy, K. E., Boumba, R., Dengui, J. C., Miyalou, R., et al. (2017). Addressing uncertainty in marine resource management; combining community engagement and tracking technology to characterize human behavior. Conserv. Lett. 10, 460–469. doi: 10.1111/conl.12293
Mills, D. J., Westlund, L., de Graaf, G., Kura, Y., Willman, R., and Kelleher, K. (2011). “Under-reported and undervalued: small-scale fisheries in the developing world,” in Small-Scale Fisheries Management: Frameworks and Approaches for the Developing World, eds R. S. Pomeroy, and N. L. Andrew (Wallingford, CT: CABI), 1–15. doi: 10.1079/9781845936075.0001
Mizrahi, M., Duce, S., Khine, Z. L., MacKeracher, T., Maung, K. M. C., Phyu, E. T., et al. (2020). Mitigating negative livelihood impacts of no-take MPAs on small-scale fishers. Biol. Conserv. 245:108554. doi: 10.1016/j.biocon.2020.108554
Natale, F., Gibin, M., Alessandrini, A., Vespe, M., and Paulrud, A. (2015). Mapping fishing effort through AIS data. PLoS ONE 10:e0130746. doi: 10.1371/journal.pone.0130746
Okemwa, G. M., Maina, G. W., Munga, C. N., Mueni, E., Barabara, M. S., Ndegwa, S., et al. (2017). Managing coastal pelagic fisheries: a case study of the small-scale purse seine fishery in Kenya. Ocean Coastal Manage. 144, 31–39. doi: 10.1016/j.ocecoaman.2017.04.013
O'Malley, M. P., Townsend, K. A., Hilton, P., Heinrichs, S., and Stewart, J. D. (2017). Characterization of the trade in manta and devil ray gill plates in China and South-east Asia through trader surveys. Aquat. Conserv. 27, 394–413. doi: 10.1002/aqc.2670
Oozeki, Y., Inagake, D., Saito, T., Okazaki, M., Fusejima, I., Hotai, M., et al. (2018). Reliable estimation of IUU fishing catch amounts in the northwestern Pacific adjacent to the Japanese EEZ: potential for usage of satellite remote sensing images. Mar. Policy 88, 64–74. doi: 10.1016/j.marpol.2017.11.009
Orlov, V. (2012). Don't miss a tiger waking up. Secur. Index Russ. J. Int. Secur. 18, 1–4. doi: 10.1080/19934270.2011.644444
Paulino, C., Aroni, E., Xu, H., Alburqueque, E., and Demarcq, H. (2017). Use of nighttime visible images in the study of the spatial and temporal variability of fishing areas of jumbo flying squid (Dosidicus gigas) outside Peruvian EEZ 2004–2015. Fish. Res. 191, 144–153. doi: 10.1016/j.fishres.2017.03.009
Pauly, D., and Zeller, D. (2016). Catch reconstructions reveal that global marine fisheries catches are higher than reported and declining. Nat. Commun. 7:10244. doi: 10.1038/ncomms10244
Pei Ya, B. (2016). Marine Spatial Planning for Myanmar. Strategic Advice for Securing a Sustainable Ocean Economy. Yangon: Wildlife Conservation Society and Department of Fisheries.
Prescott, G. W., Sutherland, W. J., Aguirre, D., Baird, M., Bowman, V., Brunner, J., et al. (2017). Political transition and emergent forest-conservation issues in Myanmar. Conserv. Biol. 31, 1257–1270. doi: 10.1111/cobi.13021
Restrepo, V., Dagorn, L., and Moreno, G. (2016). Mitigation of silky shark bycatch in tropical tuna purse seine fisheries (ISSF Technical Report 2016-17). Washington, DC: International Seafood Sustainability Foundation.
Roux, J. P., and Shannon, L. J. (2004). Ecosystem approach to fisheries management in the northern Benguela: the Namibian experience. Afr. J. Mar. Sci. 26, 79–93. doi: 10.2989/18142320409504051
Schneider, H., and Thiha, S. (2014). Socioeconomic Baseline Assessment, Thayawthatangyi and Langann Islands Myeik Archipelago, Myanmar. Myanmar: Fauna and Flora International.
Schwamborn, R., Mildenberger, T. K., and Taylor, M. H. (2019). Assessing sources of uncertainty in length-based estimates of body growth in populations of fishes and macroinvertebrates with bootstrapped ELEFAN. Ecol. Modell. 393, 37–51. doi: 10.1016/j.ecolmodel.2018.12.001
Selgrath, J. C., Gergel, S. E., and Vincent, A. C. (2018). Incorporating spatial dynamics greatly increases estimates of long-term fishing effort: a participatory mapping approach. ICES J. Mar. Sci. 75, 210–220. doi: 10.1093/icesjms/fsx108
Shester, G. G., and Micheli, F. (2011). Conservation challenges for small-scale fisheries: bycatch and habitat impacts of traps and gillnets. Biol. Conserv. 144, 1673–1681. doi: 10.1016/j.biocon.2011.02.023
Smith, H., and Basurto, X. (2019). Defining small-scale fisheries and examining the role of science in shaping perceptions of who and what counts: a systematic review. Front. Mar. Sci. 6:236. doi: 10.3389/fmars.2019.00236
Solomon, O. O., and Ahmed, O. O. (2016). Fishing with light: Ecological consequences for coastal habitats. Int. J. Fish. Aquat. Stud. 4, 474–483. Available online at: https://www.fisheriesjournal.com/archives/2016/vol4issue2/PartF/4-2-62.pdf.
Stewart, I. J., and Hamel, O. S. (2014). Bootstrapping of sample sizes for length-or age-composition data used in stock assessments. Can. J. Fish. Aquat. Sci. 71, 581–588. doi: 10.1139/cjfas-2013-0289
Stewart, J. D., Jaine, F. R., Armstrong, A. J., Armstrong, A. O., Bennett, M. B., Burgess, K. B., et al. (2018). Research priorities to support effective manta and devil ray conservation. Front. Mar. Sci. 5:314. doi: 10.3389/fmars.2018.00314
Stewart, K. R., Lewison, R. L., Dunn, D. C., Bjorkland, R. H., Kelez, S., Halpin, P. N., et al. (2010). Characterizing fishing effort and spatial extent of coastal fisheries. PLoS ONE 5:e14451. doi: 10.1371/journal.pone.0014451
Teh, L. C., and Sumaila, U. R. (2013). Contribution of marine fisheries to worldwide employment. Fish Fish. 14, 77–88. doi: 10.1111/j.1467-2979.2011.00450.x
Tezzo, X., Belton, B., Johnstone, G., and Callow, M. (2018). Myanmar's fisheries in transition: current status and opportunities for policy reform. Mar. Policy 97, 91–100. doi: 10.1016/j.marpol.2018.08.031
Thrush, S., imon, F., Paul, K., and Dayton. (2002). Disturbance to marine benthic habitats by trawling and dredging: implications for marine biodiversity. Annu. Rev. Ecol. Syst. 33, 449–473. doi: 10.1146/annurev.ecolsys.33.010802.150515
Tilley, A., Hunnam, K. J., Mills, D. J., Steenbergen, D. J., Govan, H., Alonso-Poblacion, E., et al. (2019). Evaluating the fit of co-management for small-scale fisheries governance in timor-leste. Front. Mar. Sci. 6:392. doi: 10.3389/fmars.2019.00392
Turner, R. A., Polunin, N. V., and Stead, S. M. (2015). Mapping inshore fisheries: comparing observed and perceived distributions of pot fishing activity in Northumberland. Mar. Policy 51, 173–181. doi: 10.1016/j.marpol.2014.08.005
Vincent, A. C., Meeuwig, J. J., Pajaro, M. G., and Perante, N. C. (2007). Characterizing a small-scale, data-poor, artisanal fishery: seahorses in the central Philippines. Fish. Res. 86, 207–215. doi: 10.1016/j.fishres.2007.06.006
Vulcan (2020). Allen Coral Atlas. Available online at: https://allencoralatlas.org (accessed November 2, 2020).
White, T. D., Carlisle, A. B., Kroodsma, D. A., Block, B. A., Casagrandi, R., De Leo, G. A., et al. (2017). Assessing the effectiveness of a large marine protected area for reef shark conservation. Biol. Conserv. 207, 64–71. doi: 10.1016/j.biocon.2017.01.009
Wildlife Conservation Society (2013). Myanmar Biodiversity Conservation Investment Vision Report. Yangon: Wildlife Conservation Society.
Wildlife Conservation Society (2018). Characterisation of Fisheries and Marine Wildlife Occurrence in Southern Rakhine and Western Ayeyarwady Region. Yangon: Wildlife Conservation Society.
Wilson, S. K., Fisher, R., Pratchett, M. S., Graham, N. A. J., Dulvy, N. K., Turner, R. A., et al. (2010). Habitat degradation and fishing effects on the size structure of coral reef fish communities. Ecol. Appl. 20, 442–451. doi: 10.1890/08-2205.1
Witt, M. J., and Godley, B. J. (2007). A step towards seascape scale conservation: using vessel monitoring systems (VMS) to map fishing activity. PLoS ONE 2:e1111. doi: 10.1371/journal.pone.0001111
Witt, M. J., Sheehan, E. V., Bearhop, S., Broderick, A. C., Conley, D. C., Cotterell, S. P., et al. (2012). Assessing wave energy effects on biodiversity: the Wave Hub experience. Philos. Transact. R. Soc. A 370, 502–529. doi: 10.1098/rsta.2011.0265
World Bank (2012). Hidden Harvest: The Global Contribution of Capture Fisheries. Available online at: http://documents.worldbank.org/curated/en/515701468152718292/Hidden-harvest-the-global-contribution-of-capture-fisheries (accessed November 30, 2020).
Keywords: remote sensing, nighttime lights, data-poor fisheries, coastal fisheries, Myanmar, small-scale fisheries
Citation: Exeter OM, Htut T, Kerry CR, Kyi MM, Mizrahi M, Turner RA, Witt MJ and Bicknell AWJ (2021) Shining Light on Data-Poor Coastal Fisheries. Front. Mar. Sci. 7:625766. doi: 10.3389/fmars.2020.625766
Received: 03 November 2020; Accepted: 22 December 2020;
Published: 28 January 2021.
Edited by:
Tomaso Fortibuoni, Higher Institute for Environmental Protection and Research (ISPRA), ItalyReviewed by:
Enrico Nicola Armelloni, National Research Council (CNR), ItalyAndrés M. Cisneros-Montemayor, University of British Columbia, Canada
Alfredo Giron-Nava, Stanford University, United States
Copyright © 2021 Exeter, Htut, Kerry, Kyi, Mizrahi, Turner, Witt and Bicknell. This is an open-access article distributed under the terms of the Creative Commons Attribution License (CC BY). The use, distribution or reproduction in other forums is permitted, provided the original author(s) and the copyright owner(s) are credited and that the original publication in this journal is cited, in accordance with accepted academic practice. No use, distribution or reproduction is permitted which does not comply with these terms.
*Correspondence: Owen M. Exeter, by5leGV0ZXJAZXhldGVyLmFjLnVr