 Enrico Nicola Armelloni1,2
 Martina Scanu1,2*
 Francesco Masnadi1,2
 Gianpaolo Coro3
 Silvia Angelini1
 Giuseppe Scarcella1
- 1Department of Biological, Geological, and Environmental Sciences (BiGeA), Alma Mater Studiorum - University di Bologna, Bologna, Italy
- 2Institute for Marine Biological Resources and Biotechnology, National Research Council (IRBIM-CNR), Ancona, Italy
- 3Institute of Information Science and Technologies “A. Faedo”, National Research Council of Italy (ISTI-CNR), Pisa, Italy
Information on stock status is available only for a few of the species forming the catch assemblage of rapido fishery of the North-central Adriatic Sea (Mediterranean Sea). Species that are caught almost exclusively by this gear, either as target (such as Pectinidae) or accessory catches (such as flatfishes apart from the common sole), remain unassessed mainly due to the lack of data and biological information. Based on cluster analysis, the catch assemblage of this fishery was identified and assessed using CMSY model. The results of this data-poor methodology showed that, among the species analyzed, no one is sustainably exploited. The single-species CMSY results were used as input to an extension of the same model, to test the effect of four different harvest control rule (HCR) scenarios on the entire catch assemblage, through 15-years forecasts. The analysis showed that the percentage of the stocks that will reach Bmsy at the end of the projections will depend on the HCR applied. Forecasts showed that a reduction of 20% of fishing effort may permit to most of the target and accessory species of the rapido trawl fishery in the Adriatic Sea to recover to Bmsy levels within 15 years, also providing a slight increase in the expected catches.
Introduction
Single Species Fishery Management (SSFM) has many limitations since it does not consider the effects of fishing on non-target species and the effect of species interaction on the fisheries (Link, 2010). Typically, in an SSFM context, advice given for a few species is the unique information used to control the whole fishery (Moffitt et al., 2016), and this might lead to over-pressured bycatch species (Browman et al., 2004). Nevertheless, when applying management measures specifically developed for one species (e.g., introduction of quotas), they will affect the entire catch assemblage (“technical interaction”; Punt et al., 2002). Although few practical experiments are available, intergovernmental marine science organizations strongly advise about the limited view given by single-stock management on multiple stocks caught in mixed fisheries (ICES., 2017). To avoid this situation, and under the government’s recommendation, in recent years fishery science has been focused on developing a multi-species approach (Link, 2010; Hilborn, 2011; Froese et al., 2018; Howell and Subbey, 2019). However, to date management advices for the Mediterranean Sea mostly rely on single-species stock assessment methodologies (FAO-GFCM, 2019).
Above all, considering the intrinsic multi-specific nature of the fishery, there is a strong need to move forward to more comprehensive management of stocks in the Mediterranean Sea (Colloca et al., 2013; Cardinale et al., 2017). Sophisticated assessment models able to give insights into ecosystem complexity have been proposed, though they are limited by the large amount of data required (Maunder and Punt, 2013). As such, these models are not easy to fit data-poor environments such as the Mediterranean Sea (Maravelias and Tsitsika, 2008). To find an alternative solution, we tested an advanced surplus production model implementation that assess the status of multiple species at once in data-poor scenarios (Froese et al., 2018). Surplus production models calculate fisheries parameters at Maximum Sustainable Yield (MSY) (e.g., biomass, exploitation, catch) based on the estimates of the intrinsic rate of growth (r) and the carrying capacity (k) parameters that are specific and tailored to the stock, rather than referring to the species in general.
This paper presents the first attempt to analyze and to project in the medium-term future the state of exploitation of the catch assemblage caught by rapido trawlers in the North Adriatic Sea (General Fisheries Commission for the Mediterranean – GFCM, Geographical Sub-Area – GSA 17), one of the most impacting fisheries in the Mediterranean Sea (Colloca et al., 2017). Based on the Annual Economic Report of the Scientific, Technical and Economic Committee for Fisheries (STECF), 64 vessels belonging to this segment were active in 2018, accounting for about 270 engaged crew and a gross value of landing estimated around 20 million € (STECF, 2019). This fishery represents an interesting case study, because—thanks to the gear conformation—rapido trawlers are able to catch some species that are difficult to get with other gears. Many species that are almost exclusively caught by this gear—either as target (such as Pectinidae) or accessory catches (such as flatfishes other than sole)—remain unassessed mainly due to lack of data and biological information. Therefore, it could be difficult to implement an ecosystem approach to fishery management and there is a high risk of underestimating the impact of this fishery. The catch assemblages of the most important demersal gears in GSA 17 were first reconstructed and clustered through multivariate analysis, to detect leading species for rapido fishery. At a second stage, the status of these stocks was evaluated through a Bayesian state-space implementation of the Schaefer production Model (BSM) of the CMSY software (Froese et al., 2017). Finally, the BSM estimates were used to run a CMSY extension on the entire rapido trawl catch assemblage (Froese et al., 2018), to estimate rebuilding time and to forecast expected catches. This extension considers fisheries’ inter-dependencies to predict the overall status of the stocks under four different harvest control rule (HCR; Berger et al., 2012) scenarios up to 15 years in the future (2033). The main novelty of this study is the application of data-poor methodologies to jointly assess the status of the entire catch assemblage, while also assessing how rebuilding time depends on the level of future exploitation.
Materials and Methods
Rapido Fishery
The rapido trawl fishery has been in place for more than 50 years in the western side of the north-central Adriatic Sea (Figure 1), where it is carried out all year round on the soft bottoms outside three nautical miles offshore (Scarcella et al., 2007). This gear is constituted by a cone-shaped net with a rigid metallic mouth opening up to 4 m wide, which slides on the seafloor aided by sleds. The mouth is equipped with a wooden plank on the top, acting as a depressor that allows the iron teeth in the lower edge to penetrate the sediment (Hall-Spencer et al., 1999). The gear shape enables trawlers to target flatfishes and species that live buried in the sediments, which are usually difficult to catch with otter trawling. As a result, catch composition forms a specific assemblage, mainly constituted by Pectinidae, in the sandy offshore areas of the North-East Adriatic (Giovanardi et al., 1998), and by flatfishes in the muddy inshore areas of central Adriatic (Pranovi et al., 2000). The penetration of the iron teeth in the sediment makes this gear particularly invasive to the sea-bottom, especially affecting the macro and meiobenthic communities (Pranovi et al., 2000; Petović et al., 2016; Santelli et al., 2017). Indeed, since many fish species, such as flatfish and gobies, feed on meiofaunal species (Schückel et al., 2013) this fishing gear acts not only as direct pressure on demersal fish stocks but also as an indirect pressure interfering with the distribution of stocks’ preys.
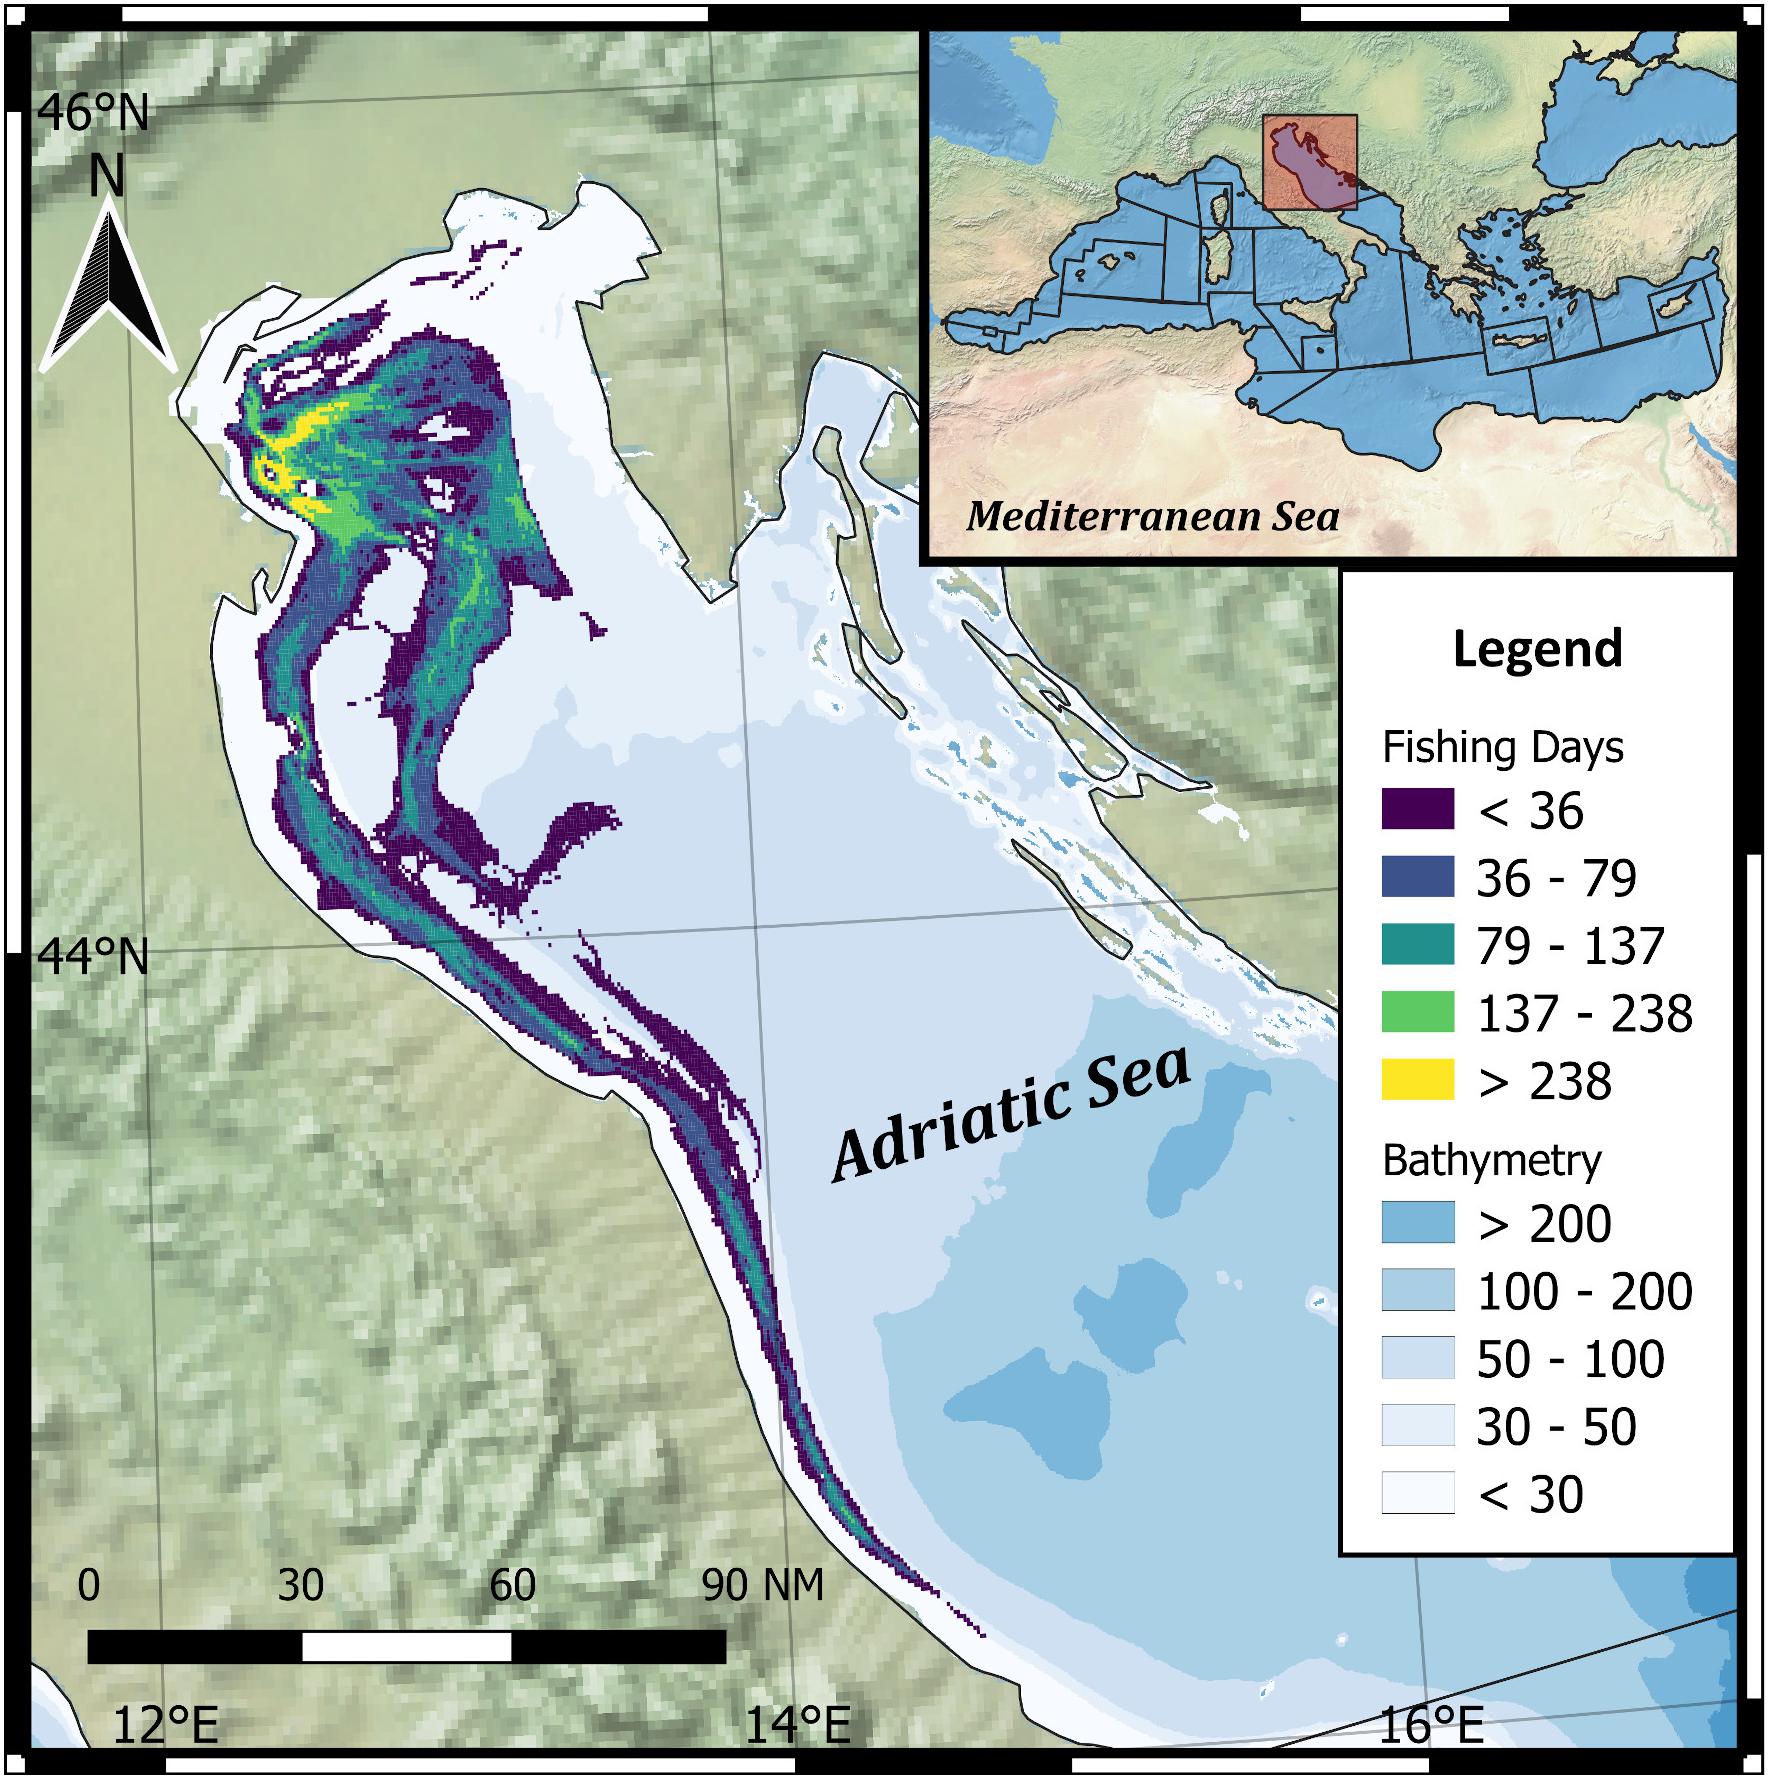
Figure 1. Rapido trawl fishery effort distribution in GSA 17 North Adriatic sea, obtained with AIS data analysis based on Galdelli et al. (2019).
Multivariate Analyses to Define Catch Assemblages
Data used to reconstruct the catch assemblages for main demersal gears in the GSA 17 were gathered from the STECF Annual Economic Report (STECF, 2019), which contains catch amount by species at gear and nation levels. The dataset was manually filtered to exclude pelagic species and taxonomic categories higher than the family level. Fishing gears representing small-scale fishery were grouped under the polyvalent passive gears (PGP) category. The yearly time frame considered was 2012–2017, due to data gaps in STECF (2019), namely Croatian data before 2012 and Italian data for 2018. The species list was sorted by magnitude of total catches and those falling within the 99% of the cumulative distribution were retained for the successive analysis. Then, for each selected species a vector was constructed, with each element representing mean catch by gear and by country. The obtained data were normalized by applying the chord transformation—i.e., scaling each vector to norm 1 (Legendre and Gallagher, 2001). The vectors obtained were assembled into a matrix (MC, Supplementary Table 1), where rows represented species, columns represented gears, and cells included normalized values of catches. Then, a multivariate analysis was applied to verify, firstly, if there were differences between catch assemblages of gears considered and if there were species strictly affected by rapido trawl fishery rather than by other gears. Differences between catch assemblages of gears were assessed through a one-way permutational multivariate analysis of variance (PERMANOVA) with 9,999 permutations (Oksanen et al., 2016) applied to a matrix of Euclidean distances computed over the MC columns. A pairwise analysis (Arbizu, 2017) was used to explore the gear contribution to the difference. Then, to identify species strictly affected by specific gears, the species list was partitioned through a hierarchical cluster analysis—based on the Ward method (Ward, 1963)—applied to the matrix of Euclidean distance computed over the MC rows. As a result, this process identified a group of species that were mostly correlated (i.e., targeted) with rapido trawling on which a joint HCR test would be more meaningful. Multiscale bootstrap resampling (Borcart et al., 2018)—from the “pvclust” R package (Suzuki and Shimodaira, 2015)—was used to verify the statistical robustness of the identification of these species. To understand the contribution of each gear and nation to the cluster definition, MC rows were aggregated on the clusters identified, then mean values by MC column were computed for each group and represented through radar plots (Bion, 2021).
Stock Assessment
The stock assessments of the species identified through cluster analysis were performed using the CMSY software. CMSY includes a BSM, which fits catch and—optionally—biomass (or catch-per-unit-of-effort) data through a Markov Chain Monte Carlo method based on the Schaefer function for biomass dynamics. The model estimates fisheries reference points (MSY, Fmsy, Bmsy) as well as relative stock size (B/Bmsy) and exploitation (F/Fmsy) from catch data and broad priors for “resilience” (approximated by r) and stock’s relative biomass (B/k) at the beginning and the end of the catch time series. For the scopes of this paper, BSM was executed on landing data and biomass indices. The biomass indices were obtained from the SoleMon project (Grati et al., 2013), a trawl survey carried out from 2005 up to the present with rapido trawl in a 36,742-km2 area of the Northern and Central Adriatic Sea (Scarcella et al., 2014). To improve the indices estimates, data were smoothed through the “BCrumb” routine, a state-space model for trend analysis of ecological time series that is part of the JABBA (Winker et al., 2018) and JARA (Winker and Sherley, 2019) models. This tool treats relative biomass as an unobservable state variable that follows a log-linear Markovian process to reduce the influence of observation error on the CMSY estimates (Winker et al., 2018). As input for the catch data, the longest series of landings in GSA17 available for each species were used (see Table 1 and Supplementary Table 2; Fortibuoni et al., 2018; STECF, 2019; DCF-ITA). Missing data of Croatian and Slovenian landings were reconstructed through a mean proportion, derived from the years in which they were available for all GSA17 bordering countries. Priors for r were either taken from previous specific studies in this area (Froese et al., 2018) or inferred from their averages in FishBase and SeaLifeBase (Palomares and Pauly, 2018; Froese and Pauly, 2019).
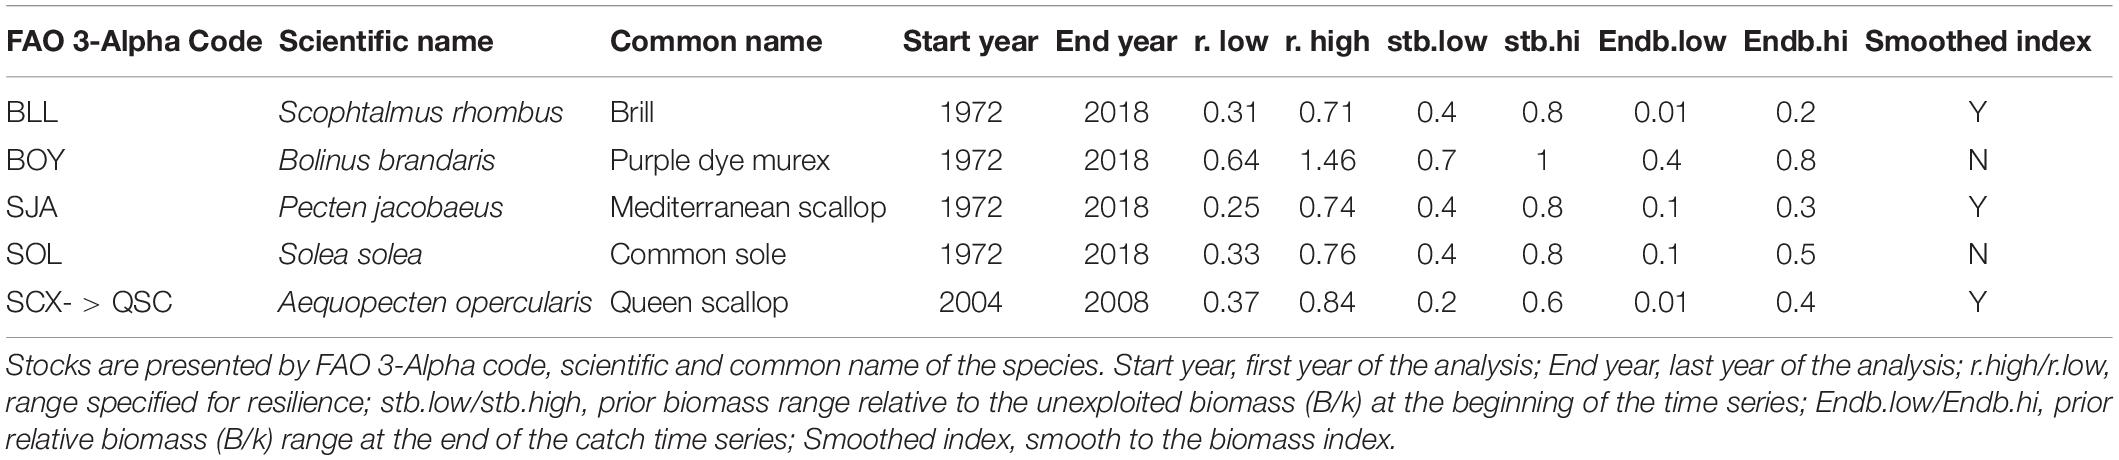
Table 1. Input data of the CMSY analysis.
The choice of an increasing pattern from the initial to the final depletion prior in the reference models was supported by an overall increase in the fishing pressure in the Adriatic Sea (Colloca et al., 2017) followed by a reduction of the productivity of the commercial fishery over the study period (Marini et al., 2017). A sensitivity analysis was conducted to test the effect of different sets of viable depletion priors (Bstart/k and Bend/k) on the final B/Bmsy value. A Feed-Forward Artificial Neural Network was used to estimate these viable prior ranges of relative biomass for each studied species, based on characteristics of the catch time series such as minimum and maximum catch, length, slope in the final years, and shape (Froese et al., 2021 submitted). The network was trained with the data of 400 stock to detect interplay patterns of catch and abundance and predict relative biomass priors directly from the catch time series. Following the procedure described in Falsone et al. (2021), the accuracy of the final result was calculated through the percent difference between the reference model’s values and the Artificial Neural Network model’s values.
Stock Projections
The outputs of single-species stock assessments were used to run an advanced implementation of CMSY (Froese et al., 2018). This model uses a rewrite of the Schaefer function to predict next year’s status of the biomass, based on the parameters estimated by the CMSY model:
In the equation, Bt and Ft, respectively, represent the biomass and the fishing effort in a certain year (t), while Bt+1 is the biomass in the following year. The model assumes that the estimated r and k CMSY parameters remain constant over the projection time. The catch assemblage analysis iteratively uses the above formula under different relative effort scenarios, i.e., as different ratios of fishing mortality (F) over the fishing mortality in the last estimation year (Flast_year). In particular, for the stocks identified in the cluster analysis, the following HCR scenarios, based on the F of every single stock, were used:
• Scenario (1): 0.5 F2018 simulating a reduction of 50%,
• Scenario (2): 0.6 F2018 simulating a reduction of 40%,
• Scenario (3): 0.8 F2018 simulating a reduction of 20%,
• Scenario (4): 0.95 F2018 simulating a reduction of 5%,
where F2018 is the F value of the last year of each stock time series. The advanced implementation of CMSY is a non-Bayesian statistical algorithm that builds on the Bayesian estimates of CMSY. Based on the F scenarios, the algorithm cycles through the following steps for each scenario:
1. For each stock, produce 1,000 iterations of the biomass in time, starting from values in the neighborhoods of B/Bmsy;
2. Average all the generated B/Bmsy time series of each stock;
3. Average the averaged B/Bmsy time series of all stocks;
4. Estimate confidence intervals and plot the forecasts.
Step 1 of the algorithm is necessary to account for uncertainty around the estimate of B/Bmsy, also due to a random error term used in the Schaefer function in CMSY.
Since CMSY accounts for stock depletion at very low biomass levels, the effort scenarios consider also different effects of the exploitation level on low-biomass stocks. In particular, during the projections, the following rules are applied:
1. In Scenario (1), the fishing mortality of a stock is set equal to zero when B < 0.5 Bmsy;
2. In the other scenarios, when B < 0.5 Bmsy, F is linearly decreased with biomass, according to the relation .
Rule number 2 comes from a linearly decreasing multiplier of Fmsy used in CMSY to account for repopulation hysteresis for low relative biomasses (Froese et al., 2018, 2020).
Projecting biomass after fixing relative fishing mortality to the one in the last year for each stock, allows accounting for the real and different effects of the fisheries on each stock. Indeed, this assumption proportionally reduces the effort on each stock, assuming that the fishing strategies and gears do not change. Thus, in this way, a uniform reduction of the fishing hours in a certain year will affect each stock differently.
Results
The taxonomic list analyzed with the multivariate analysis was composed of 87 species (Supplementary Table 3). The PERMANOVA test highlighted a significant difference between the catch assemblages of the nation-gear combination (Table 2). Further, pairwise contrast indicated that rapido (ITA_TBB) column was statistically different from the majority of the gears (Table 3), except for Italian polyvalent passive gears (ITA_PGP) and Croatian bottom trawlers (HRV_DTS).
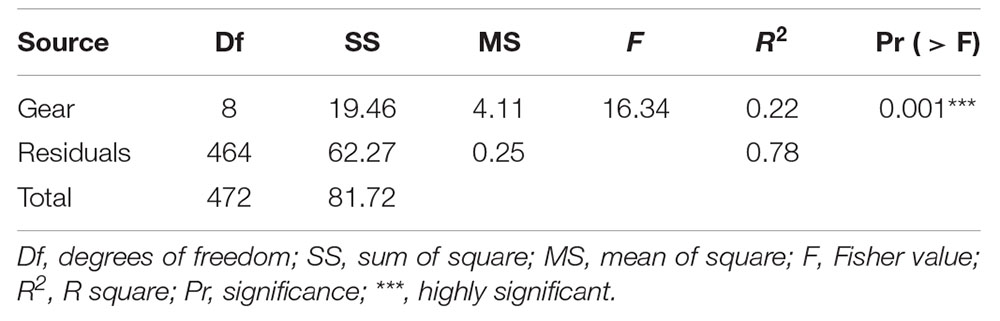
Table 2. Results of One-Way PERMANOVA analysis.
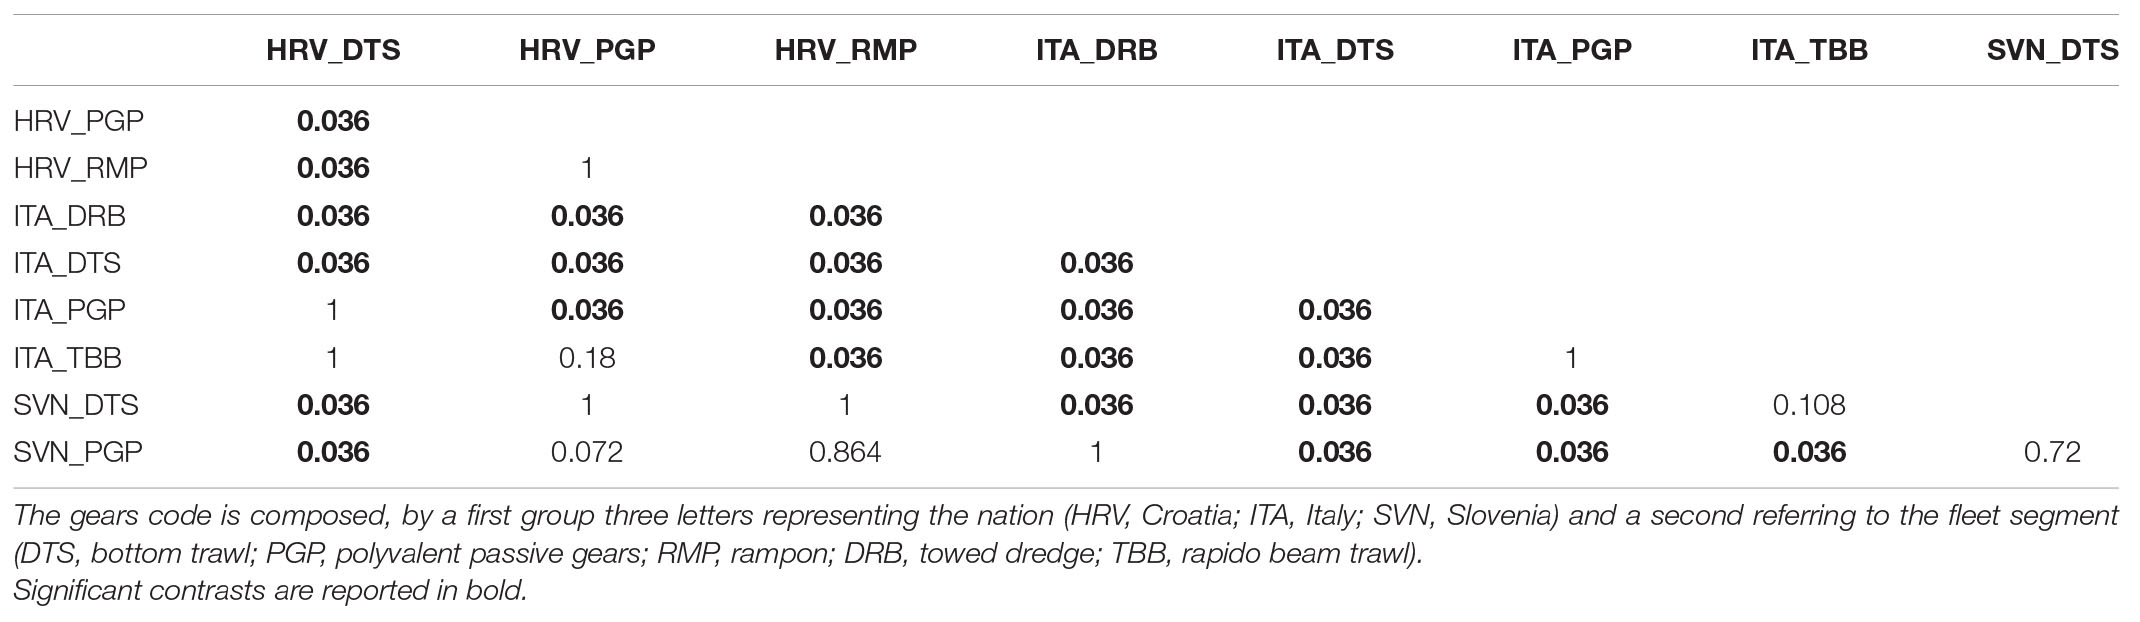
Table 3. Results of pairwise PERMANOVA analysis, p-values corrected with the Bonferroni method.
The cluster analysis partitioned the species list into 11 groups, nine of which statistically confirmed (Figure 2). DTS was the main driver for three clusters (1, 2, and 3), which contrast was due to different contributions of ITA and HRV catches. ITA_PGP was the major driver of three clusters (4, 5, and 6) that were differentiated for the degree of contribution of ITA_DTS. Group 7 was driven by ITA_PGP, while it accounted for large contributions of ITA_DTS and ITA_TBB. One group (8) was entirely driven by ITA_DRB. The last group (9) was almost exclusively driven by ITA_TBB, which therefore was our target group. This latter assemblage of species was composed of Pecten jacobaeus, Scophtalmus rhombus, Solea solea, Bolinus brandaris, and Aequopecten opercularis (SJA, BLL, SOL, BOY, and SCX; Table 2). Even if the SCX FAO 3-Alpha Code stands for the Pectinidae family, the species selected for the stock assessment was Aequopecten opercularis, since this species constitutes the majority of the Pectinidae catches in the north Adriatic basin.
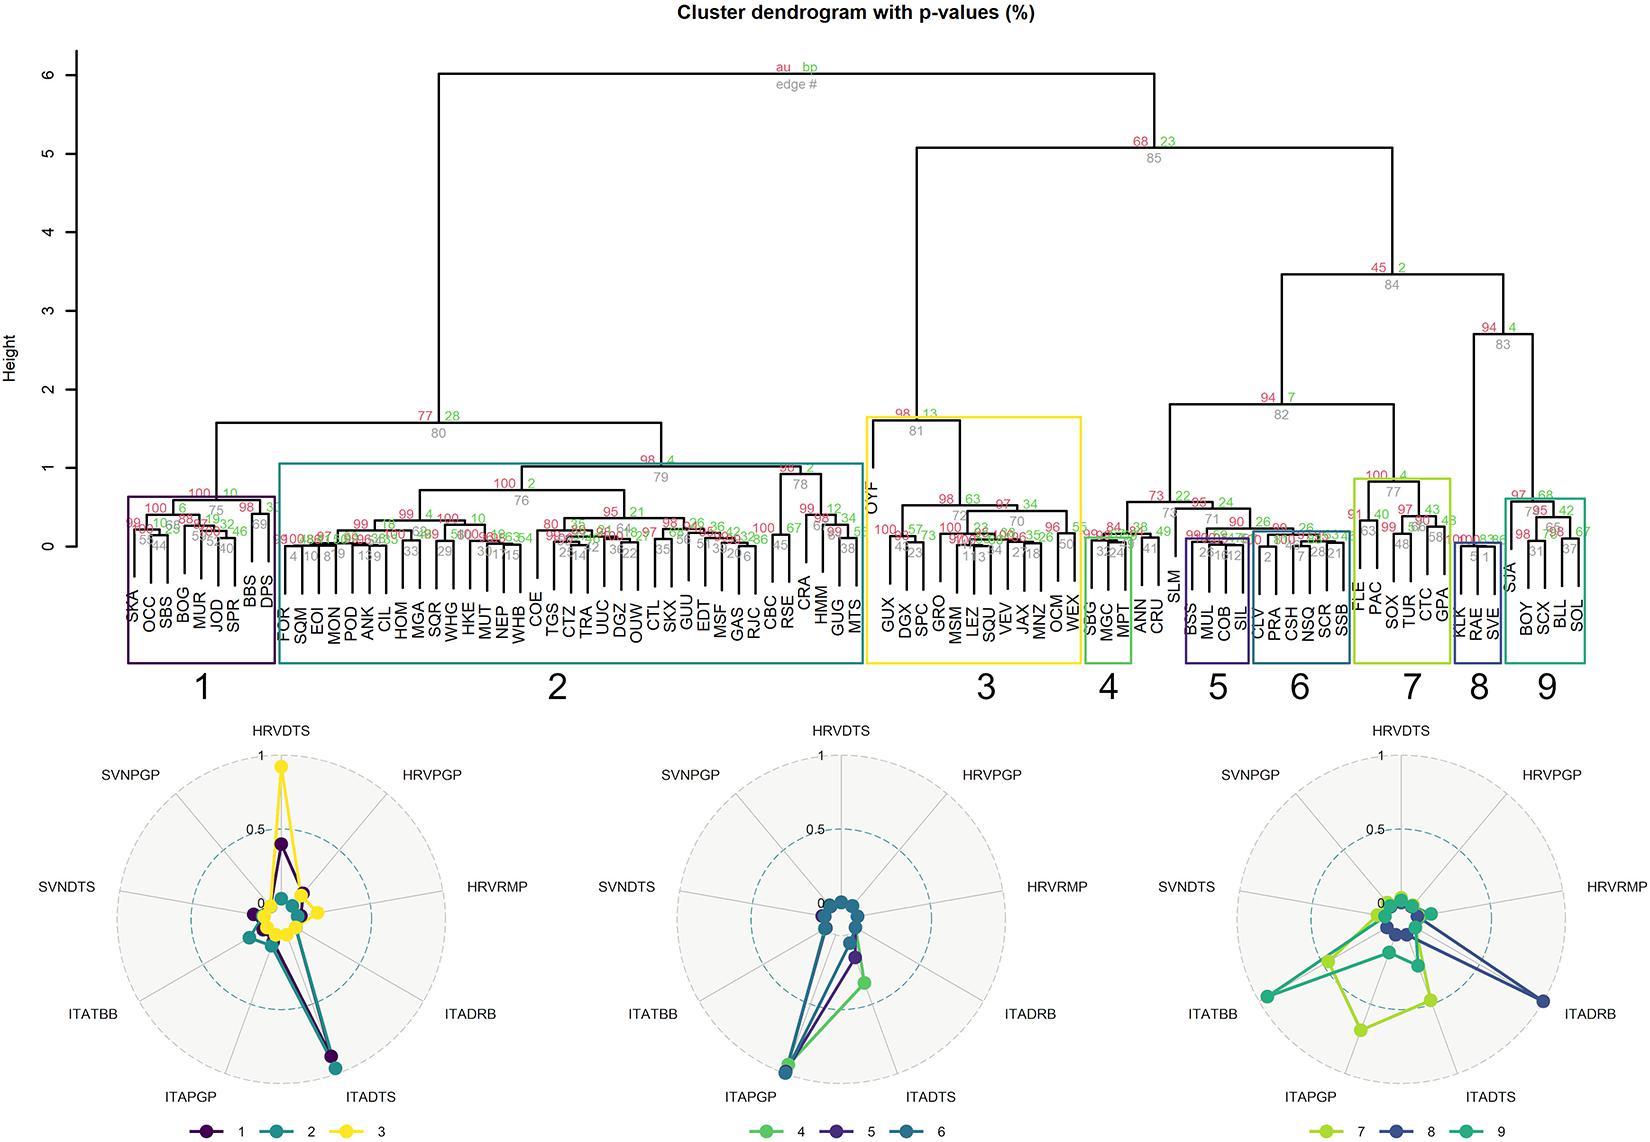
Figure 2. Hierarchical cluster analysis with the Ward method (Ward, 1963) applied to the gear-by-country table. AU p-value (printed in red color in default) is the abbreviation of “approximately unbiased” p-value, which is calculated by multiscale bootstrap resampling. BP value (printed # in green color by default) is “bootstrap probability” value, which is less accurate than AU value as p-value. Clusters with high AU values (e.g., 95%) are indicated with blue edges and are strongly supported by data.
Based on the data series and priors in Table 1, the results of the single species assessments are reported in Figure 3. The majority of the stocks assessed in the present study were considered to be in a data-limited situation due to the lack of information, except for common sole (SOL) for which stock assessment was also available from age-based approaches (GFCM, 2018). For this reason, the most recent common sole estimates (FAO-GFCM, 2019) were used to validate the BSM model.
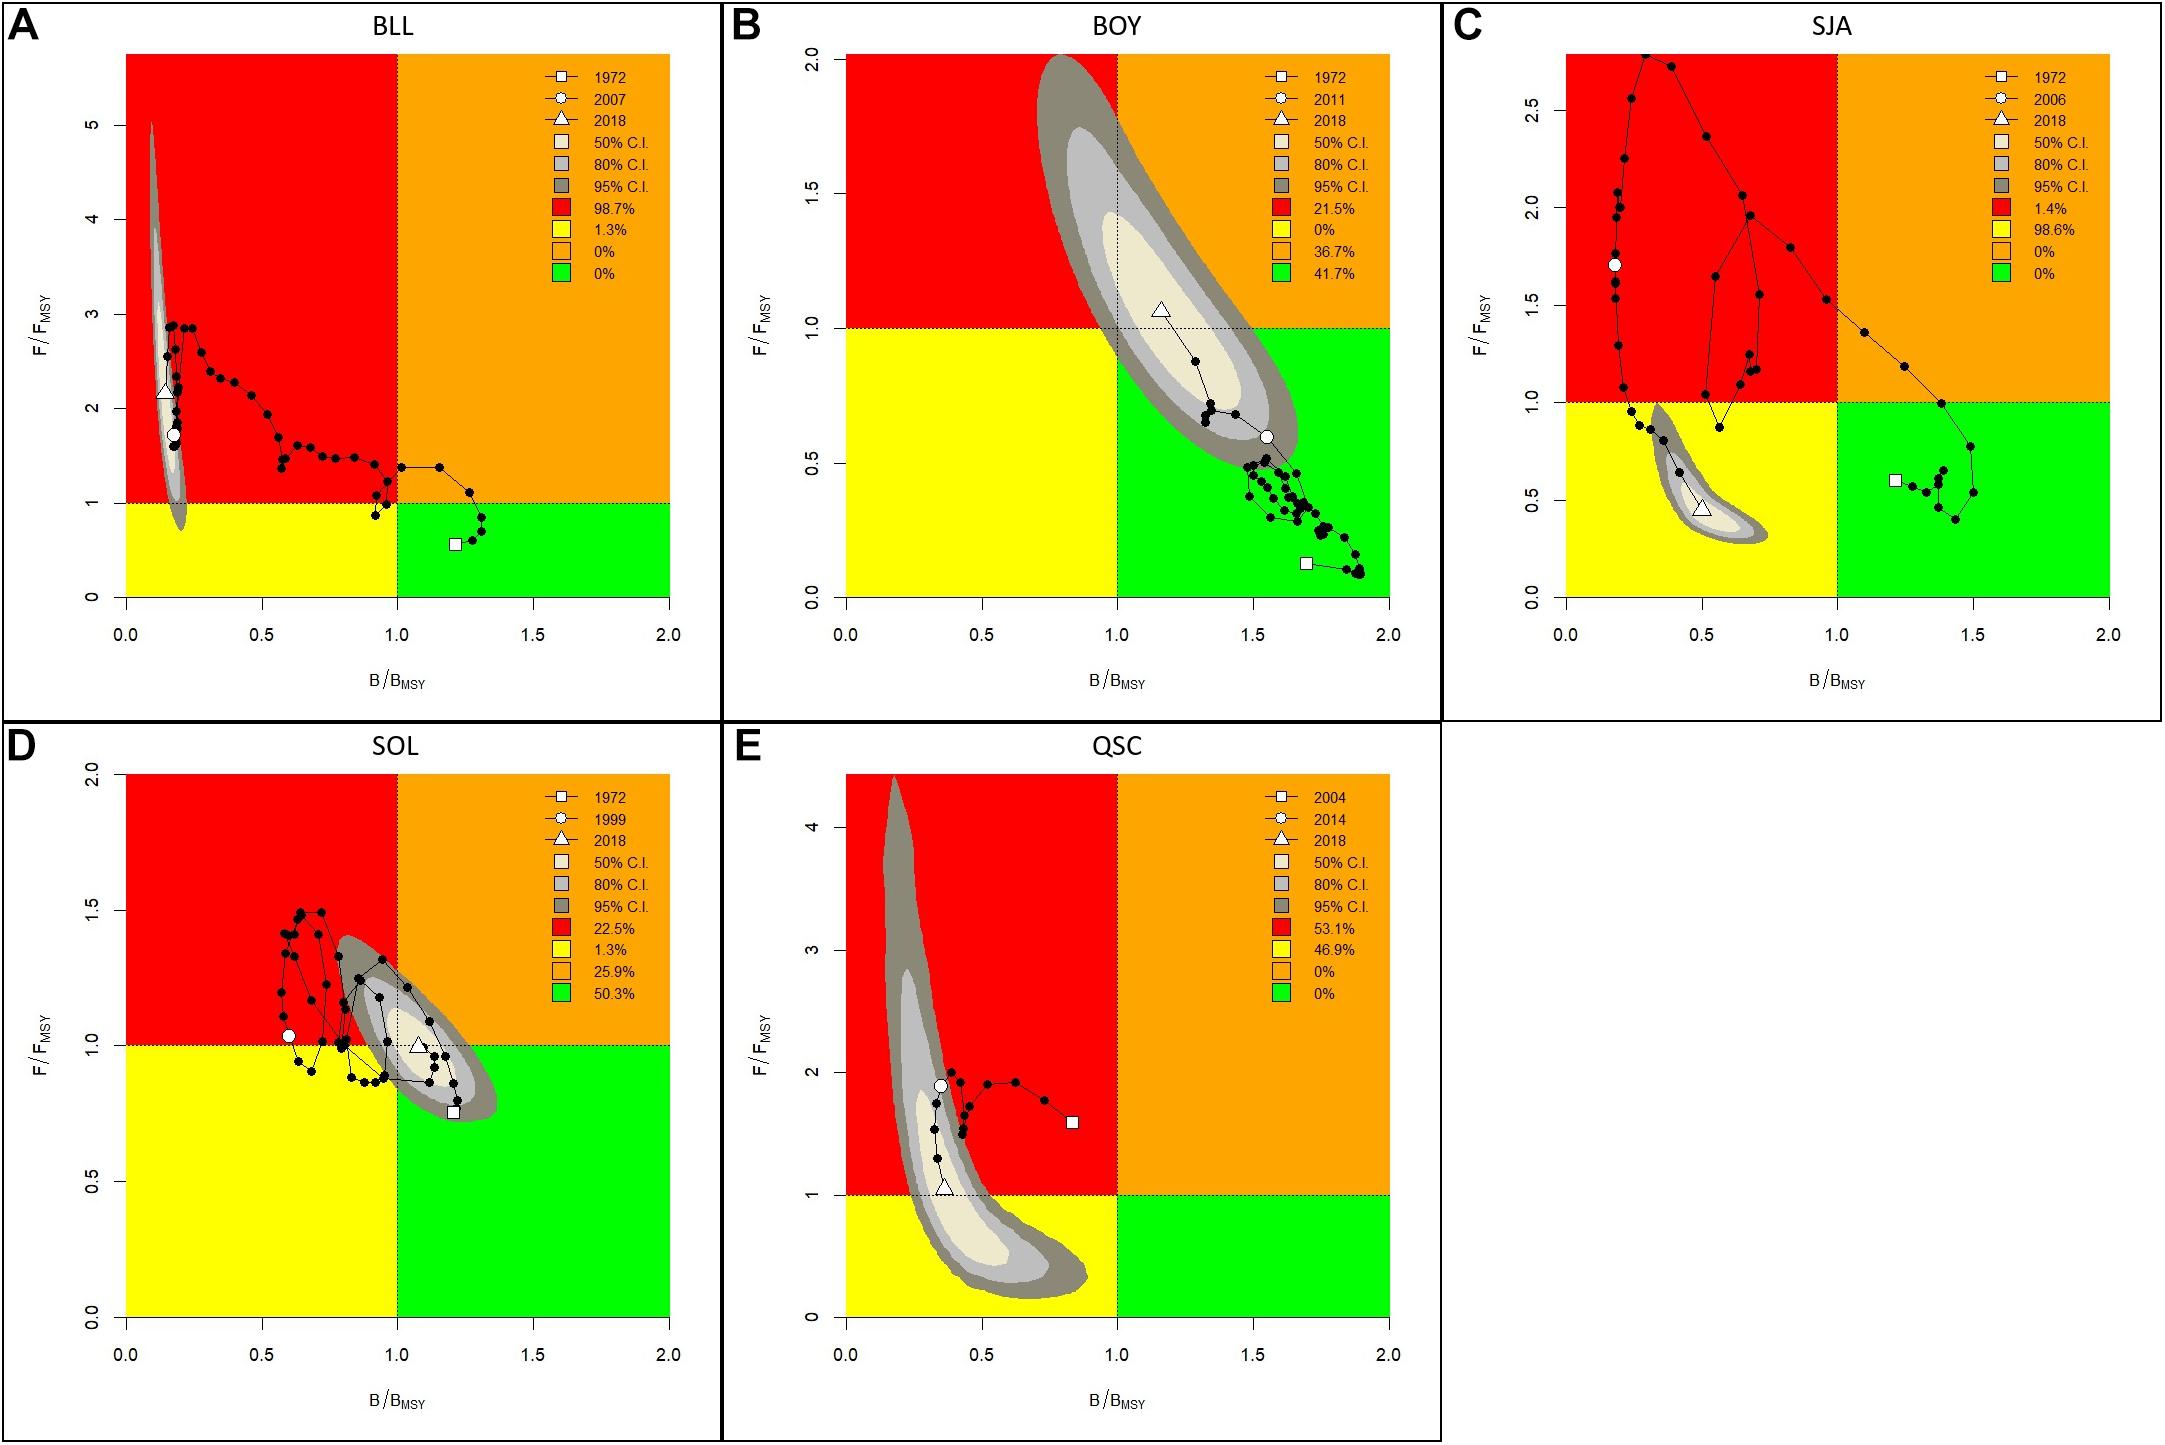
Figure 3. Kobe plots resulting from the single species stock assessment: (A) Brill, (B) Purple dye murex, (C) Mediterranean scallop, (D) Common sole, and (E) Queen scallop.
The BSM analysis highlighted several observations: for what regards biomass, the analyzed stocks showed a value lower than Bmsy from the year 2000 onward, whereas common sole (Figure 3D) and purple dye murex (Figure 3B) were over the reference point in last years. As for the common sole, in the last twenty years, biomass was estimated to range between Bmsy and Blim (50% Bmsy). Purple dye murex was the only species for which values of biomass never went under Bmsy. For what regards fishing mortality, F was estimated to go under Fmsy in the last years for three stocks. On the contrary, brill (Figure 3A) was in a strong overexploitation status due to a continuous increase of fishing mortality (F/Fmsy in 2018 was ∼2). As for the common sole, fishing mortality cycled around Fmsy during the time series, and F showed an increasing trend that reached a F/Fmsy ratio of about 1 in 2018, consistently to the age-based assessment (FAO-GFCM, 2019). The F pace of purple dye murex was a counter-trend: it remained below the reference point until recent times and reached it only in the last year.
To sum up, the stock trajectories of the Mediterranean scallop (Figure 3C) and queen scallop (Figure 3E) reported in the Kobe plot (Maunder and Aires-da-Silva, 2011) passed from red to yellow area, i.e., there was a slight decrease in fishing mortality while the state of biomass was still below the reference point. As for brill, the stock trajectory remained in the red quadrant, with low biomass and a high level of F. The trajectory of the purple dye murex stock indicated sustainable exploitation during the majority of the time series, however, it went into an overfishing status in the last years. Common sole trajectory oscillated around the reference point during the last years and finally stabilized around MSY.
The Artificial Neural Network-based sensitivity analysis showed that a moderate alteration of the relative biomass priors did not affect the final B/Bmsy estimation substantially. The difference between our results and those obtained through the Artificial Neural Network was always under 20% for all studied species, ranging from a 6% minimum for the Mediterranean scallop to a 19% maximum for common sole (Table 4).

Table 4. Summary table of the sensitivity analysis over the B/Bmsy estimation that compares the results obtained from reference model (ref) against the one computed with priors estimated by an Artificial Neural Network (ANN).
Based on these assessments, the CMSY extended analysis, performed on the entire catch assemblage, produced different projections depending on the applied HCR (Figure 4). In Scenarios (1) and (2), 80% of the stocks reached Bmsy in 2030, whereas in Scenario (3) a few more years were required to reach Bmsy. On the contrary, in Scenario (4), under a more permissive HCR, only 60% of the stocks were observed to reach Bmsy in 2033. Catch projections showed an opposite pattern to biomass, with an initial decrease whose steepness depended on the HCR (Figure 5). Overall, scenarios showed an initial drop of the catches followed by a recovery and stabilization. In the long-term, Scenario (3) and (4) stabilized at a higher level than the initial estimates.
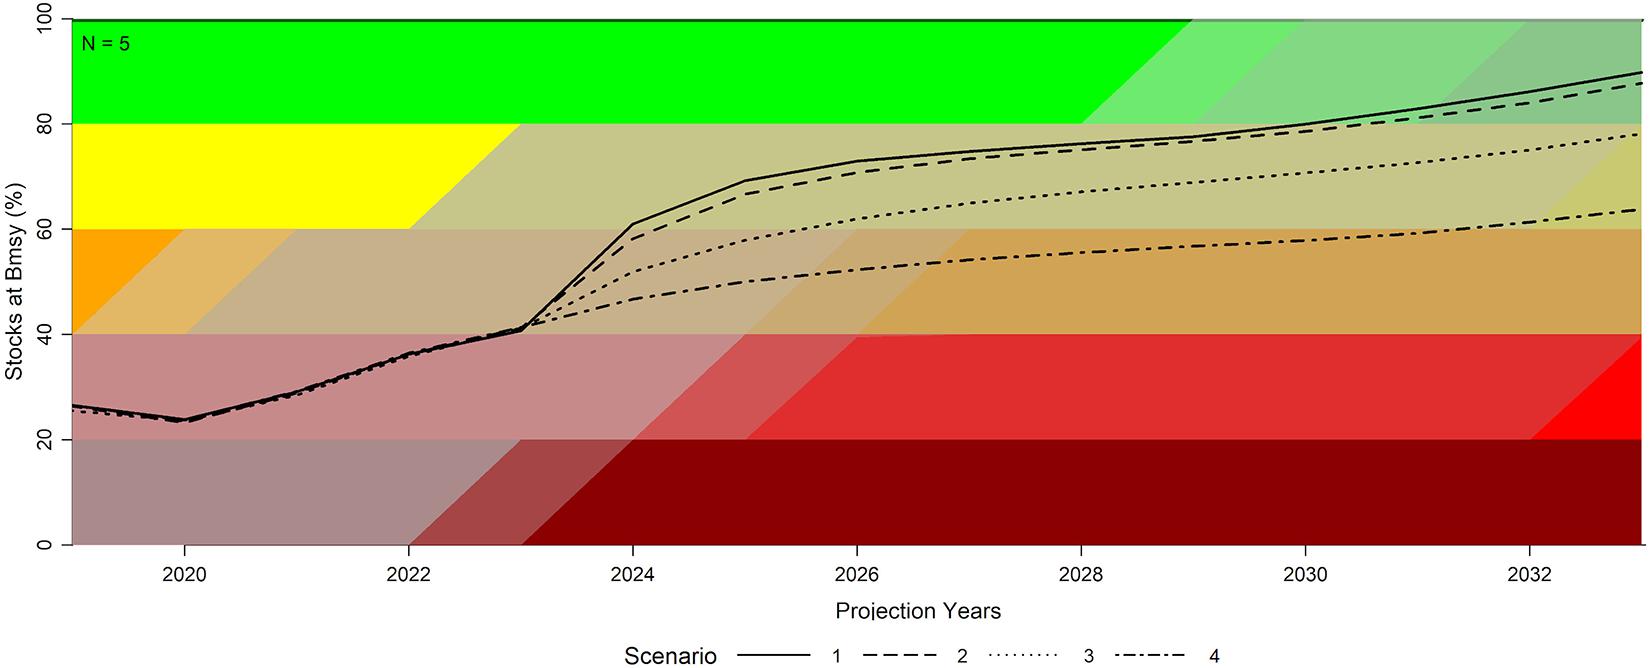
Figure 4. Forecast of alternative HCRs from the CMSY extended analysis on the catch assemblage: percentage of stocks at Bmsy. Stronger the effort reduction, shorter the range of time in which 80% of the stocks will reach the Bmsy. Scen. (1): 50% of effort reduction; Scen. (2): 40% of effort reduction; Scen (3): 20% of effort reduction; Scen. (4): 5% of effort reduction.
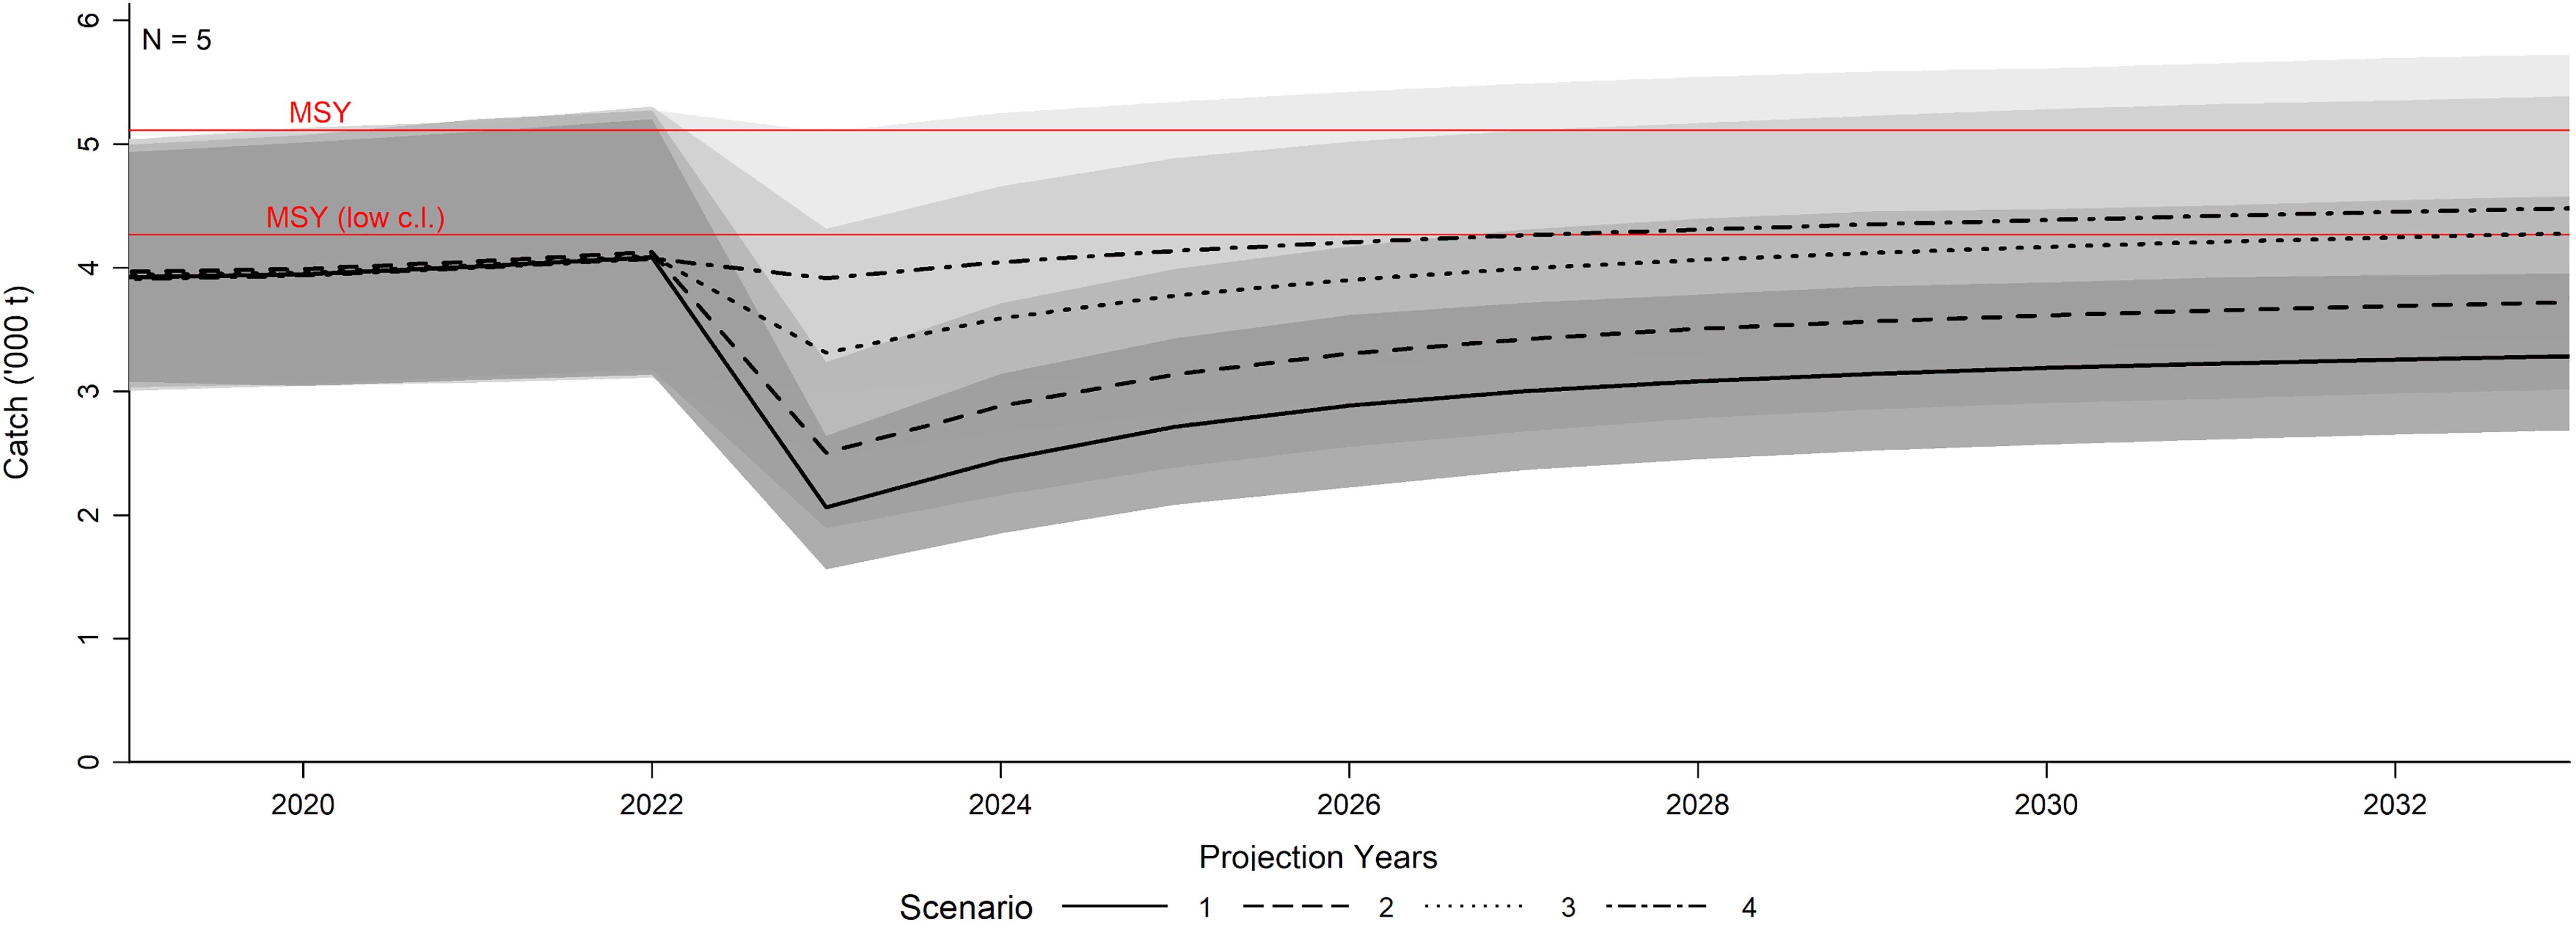
Figure 5. Forecast of alternative HCRs from the CMSY extended analysis on the catch assemblage: projections of catch time series. After a first decrease, all the scenarios, independently from the strength of the control rule, will figure a stabilization in catches.
Discussion
This was the first extensive assessment-based meta-analysis of the main target and accessories species of rapido trawl fishery in the Adriatic Sea. In the case of mixed fisheries, formulating policies for management and conservation requires the use of models capable of predicting how catch assemblages change in response to fishing effort (Welcomme, 1999). However, when management objectives point toward fishing at reference points of the main target species, the overpressure of accessory species of the same catch assemblage is very plausible (Punt et al., 2002). These considerations fit well the Mediterranean context where demersal fisheries are commonly multispecific (Colloca et al., 2003). Within this context, identifying clusters of commercially important species might help to define conservation units in management plans (Rogers and Pikitch, 1992). In the case of the demersal fishery in the Adriatic Sea, the cluster analysis highlights that a few resources were characterizing the catch assemblages of each gear, except for ITA_PGP and ITA/HRV_DTS, which resulted to be the more generalists. The fact that these fleets showed the most diversified assemblage compared with the other gears reflected the modus operandi of these fisheries: ITA_PGP seasonally switches gears and grounds following resource availability (Grati et al., 2018), while the DTS footprint is by far the larger in the area (Russo et al., 2020), spreading across the spatial range of many different species. In contrast, some of the most landed resources were mainly targeted by one specific gear, such as the group formed by clams (SVE: Chamelea gallina, KLK: Callista chione, RAE: Solen marginatus) targeted by Italian DRB, and the cluster made by Pectinidae (SJA, SCX) and flatfishes (SOL: Solea solea, BLL: Scophtalmus rhombus, TUR: Scophthalmus maximus) targeted by Italian TBB. These findings allowed us to consider the assemblage of species analyzed as representative of the exploitation exerted by the rapido fishery.
Although the Adriatic sea is one of the most intensively trawled area of the Mediterranean sea (Eigaard et al., 2017; Ferrà et al., 2018) and in the entire world (Amoroso et al., 2018), some of the stocks analyzed showed an increase in biomass at the end of the analysis time-scale (evident in the single-species Kobe plot trajectory toward the recovery area). A possible explanation may be found in the management measures adopted in the last decades: current regulation includes a summer ban to the trawling activity—total closure for 1 month (EC, 2006), extending temporary spatial restrictions up to 4 or 6 nm depending on vessel length since 2012. These measures might have had relevant consequences for recruitment success in coastal areas (Scarcella et al., 2014) leading to a general improvement in the overall status of stocks exploited by rapido fishery. However, species respond in different manners to effort reduction due to different resilience, competition, and recruitment impairment (Gamble and Link, 2009), and those species for which biomass levels have fallen below 0.5 B/Bmsy, a threshold that characterizes impaired stocks (Froese et al., 2016), remained in alarming status. Nevertheless, literature reports that flatfishes recruitment success does not strictly depend on stock size (Iles, 1994; Maunder, 2012; Van der Hammen et al., 2013), therefore additional work is required to explain the alarming status of brill. Environmental characteristics of the study area may have a large effect on the resources: organic matter input from rivers and the resulting nutrient enrichment can lead to a high rate of primary productivity, particularly in the Northern and the Central Adriatic (Cognetti et al., 2000), which helps to maintain recruitment capacity in marine fish stocks (Britten et al., 2016), mainly for species with high resilience such as common sole. On the other hand, North Adriatic is a recognized key area for seasonal low oxygen depletion, whether it be eutrophication or climate change-related (Kollmann and Stachowitsch, 2001), and has been repeatedly affected over the last three decades by bottom anoxia and benthic mortalities (e.g., Pectinidae family; Mattei and Pellizzato, 1996). This facilitates detritus-feeding group establishment, such as purple-dye murex, that can make a stand to the recovery of the suspension feeders, i.e., Pectinidae, by consuming and smothering the potential recruits (Riedel et al., 2010). These dynamics, together with continuous trawling, might have led scallops to such low biomass. Nevertheless, it is important to underline that the biomass of the Mediterranean scallop was estimated to have recently increased over 0.5 Bmsy.
The aggregated forecast analysis showed that the percentage of the stocks that will reach Bmsy at the end of the projections will depend on the HCR applied. Scenario (1) and (2) were the fastest in reaching Bmsy (80% of the stocks by 2030), however, they required the biggest drop in catches in the short period; this sudden reduction would be probably economically and socially unsustainable for the Adriatic fishing sector. On the opposite, Scenario (4) could be preferable from an economic point of view due to higher catches in the long term, but it would allow fewer stocks to reach Bmsy by 2033 (only 60%), breaching the sustainability principles of the EU Common Fisheries Policy (European Parliament, 2013). Scenario (3) foreseen that 80% of the stocks will reach Bmsy in 15 years if the F will be reduced by 20% providing a possible compromise between long-term environmental and social sustainability (relatively high expected catch and reasonably fast and good rebuilding in stock biomass). Scenario (3) was therefore more sustainable and compatible with the fundamental principles of CFP, which is to match sustainable exploitation of the fish stocks with socio-economic sustainability (Reg EU No. 1380/2013).
Despite simulation of HCRs showed a biomass recovery for the majority of the stocks regardless of the scenario (>60% of the stocks reach for all the rebuilding strategies Bmsy), it may be less reliable for brill and Mediterranean scallop, which were classified in critical status. In fact, in forecast analyses, an increase in the total biomass of the considered species might have been driven by those stocks that were already in a recovering phase.
Therefore, other management measures should be combined with a reduction of fishing effort to allow for stocks’ recovering (Demirel et al., 2020), especially in the most depleted cases. Considering that the areas of persistency of these species are well known (AdriaMed, 2011), specific adaptive measures for rapido trawl fishery should be implemented, such as spatio-temporal closures to protect the stocks (Hall-Spencer et al., 1999): guaranteeing protected areas might allow stocks to be more resilient to local depletions (Kritzer and Liu, 2014). Furthermore, effort reduction by itself does not imply a concomitant overall reduction of the fishing mortality for all stocks (Cardinale et al., 2017). Thus, even if the actual management plan (Recommendation GFCM/43/2019/5) already envisages a fishing effort reduction comparable to scenario (3), other management measures may be necessary to avoid the depletion of the most pressured commercial and accessory species.
The presented approach and the used models implicate strong assumptions on the stocks’ life-history traits as well as in exploitation status that should be carefully considered. In addition, the CMSY model does not account for the size and age structure of the stock and therefore tends to overestimate sustainable productivity in stocks where excessive fishing pressure has truncated the population structure (Froese et al., 2018). Moreover, the forecasting algorithm assumes that fishing strategies and gears do not change in time. Thus, the estimates coming from the present study should not be taken as a detailed reproduction of reality. Nevertheless, they were sufficient to produce an overall sound snapshot of the performance of different future inter-correlated fisheries scenarios, which would have required many years of data preparation and data gap-filling if data-rich approaches had been used.
Data Availability Statement
The original contributions presented in the study are included in the article/Supplementary Material, further inquiries can be directed to the corresponding author/s.
Author Contributions
All authors listed have made a substantial, direct and intellectual contribution to the work, and approved it for publication.
Conflict of Interest
The authors declare that the research was conducted in the absence of any commercial or financial relationships that could be construed as a potential conflict of interest.
The reviewer ND declared a past co-authorship with several of the authors, GC and GS, to the handling editor.
Acknowledgments
FM, MS, and EA thank those who contribute to their training with specific courses. Also, all authors want to thank the DRuMFISH project (EASME/EMFF/2014/.1.3.2.4/SI2.721116), in which this work was initialized. The research leading to these results has been conceived under the International Ph.D. Program “Innovative Technologies and Sustainable Use of Mediterranean Sea Fishery and Biological Resources” (www.FishMed-PhD.org). This study represents partial fulfillment of the requirements for the Ph.D. thesis of FM and EA. Anonymous reviewer are thanked for their comments on an earlier version of this paper.
Supplementary Material
The Supplementary Material for this article can be found online at: https://www.frontiersin.org/articles/10.3389/fmars.2021.552076/full#supplementary-material
References
AdriaMed (2011). Report of the Technical Meeting on Solemon Survey Activities, GCP/RER/010/ITA/SR-01. AdriaMed Scientific Reports N. 01. Rome: FAO AdriaMed. 21.
Amoroso, R. O., Pitcher, C. R., Rijnsdorp, A. D., McConnaughey, R. A., Parma, A. M., Suuronen, P., et al. (2018). Bottom trawl fishing footprints on the world’s continental shelves. Proc. Natl. Acad. Sci. U.S A. 115, E10275–E10282. doi: 10.1073/pnas.1802379115
Arbizu, M. (2017). Pairwiseadonis: Pairwise Multilevel Comparison Using Adonis. R Package. Version 0.0. doi: 10.1109/IROS.2007.4399402
Berger, A., Harley, S., Pilling, G., Davies, N., and Hampton, J. (2012). “Introduction to harvest control rules for WCPO tuna fisheries,” in Proceedings of the Eighth Scientific Committee Meeting for the WCPFC Nouméa.
Borcart, D., Gillet, F., and Legendre, P. (2018). Numerical Ecology with R, 2nd Edn. New York, NY: Springer International Publishing AG.
Britten, G. L., Dowd, M., and Worm, B. (2016). Changing recruitment capacity in global fish stocks. Proc. Natl. Acad. Sci.U.S.A. 113, 134–139.
Browman, H., and Stergiou, K. (2004). Perspectives on ecosystem-based approaches to the management of marine resources. Mar. Ecol. Prog. Ser. 274, 269–303.
Cardinale, M., Osio, G. C., and Scarcella, G. (2017). Mediterranean Sea: a Failure of the European fisheries management system. Front. Mar. Sci. 4:72. doi: 10.3389/fmars.2017.00072
Cognetti, G., Lardicci, C., Abbiati, M., and Castelli, A. (2000). The Adriatic sea and the Tyrrhenian sea. Seas Millenn. Environ. Eval. 1, 267–284.
Colloca, F., Cardinale, M., Belluscio, A., and Ardizzone, G. (2003). Pattern of distribution and diversity of demersal assemblages in the central Mediterranean sea. Estuar. Coast. Shelf Sci. 56, 469–480. doi: 10.1016/S0272-7714(02)00196-8
Colloca, F., Cardinale, M., Maynou, F., Giannoulaki, M., Scarcella, G., Jenko, K., et al. (2013). Rebuilding Mediterranean fisheries: a new paradigm for ecological sustainability. Fish Fish. 14, 89–109. doi: 10.1111/j.1467-2979.2011.00453.x
Colloca, F., Scarcella, G., and Libralato, S. (2017). Recent trends and impacts of fisheries exploitation on mediterranean stocks and ecosystems. Front. Mar. Sci 4:244. doi: 10.3389/fmars.2017.00244
Demirel, N., Zengin, M., and Ulman, A. (2020). First large-scale eastern mediterranean and black sea stock assessment reveals a dramatic decline. Front. Mar. Sci. 7:103. doi: 10.3389/fmars.2020.00103
EC (2006). Council Regulation (EC) No 1967/2006 of 21 December2006 Concerning Management Measures for the Sustainable Exploitation of Fishery Resources in the Mediterranean Sea, amending Regulation (EEC) No 2847/93 and repealing Regulation (EC) No 1626/94.
Eigaard, O. R., Bastardie, F., Hintzen, N. T., Buhl-Mortensen, L., Buhl-Mortensen, P., Catarino, R., et al. (2017). The footprint of bottom trawling in European waters: distribution, intensity, and seabed integrity. ICES J. Mar. Sci. 74, 847–865. doi: 10.1093/icesjms/fsw194
European Parliament (2013). European Parliament and Council. regulation (EU) No. 1380/2013 of the European Parliament and of the Council of 11 December 2013 on the common fisheries policy. Off. J. Eur. Union 354, 22–61.
Falsone, F., Scannella, D., Geraci, M. L., Gancitano, V., Vitale, S., and Fiorentino, F. (2021). How fishery collapses: the case of Lepidopus caudatus (Pisces: Trichiuridae) in the Strait of Sicily (Central Mediterranean). Front. Mar. Sci. 7:584601. doi: 10.3389/fmars.2020.584601
FAO-GFCM (2019). Working Group on Stock Assessment of Demersal Species (WGSAD) 19–24 November 2018 Final Report. Rome: FAO.
Ferrà, C., Tassetti, A. N., Grati, F., Pellini, G., Polidori, P., Scarcella, G., et al. (2018). Mapping change in bottom trawling activity in the Mediterranean sea through AIS data. Mar. Policy 94, 275–281. doi: 10.1016/j.marpol.2017.12.013
Fortibuoni, T., Libralato, S., Arneri, E., Giovanardi, O., Solidoro, C., and Raicevich, S. (2018). Erratum: fish and fishery historical data since the 19th century in the Adriatic Sea, Mediterranean. Sci. Data 5:180144. doi: 10.1038/sdata.2018.144
Froese, R., Demirel, N., Coro, G., Kleisner, K. M., and Winker, H. (2017). Estimating fisheries reference points from catch and resilience. Fish Fish. 18, 506–526. doi: 10.1111/faf.12190
Froese, R., Winker, H., Coro, G., Demirel, N., Tsikliras, A. C., Dimarchopoulou, D., et al. (2018). Status and rebuilding of European fisheries. Mar. Policy 93, 159–170. doi: 10.1016/j.marpol.2018.04.018
Froese, R., Winker, H., Coro, G., Demirel, N., Tsikliras, A. C., Dimarchopoulou, D., et al. (2020). Estimating stock status from relative abundance and resilience. ICES J. Mar. Sci. 77, 527–538. doi: 10.1093/icesjms/fsz230
Froese, R., Winker, H., Coro, G., Palomares, M.-L. D., Tsikliras, A. C., Dimarchopoulou, D., et al. (2021). Catch time series as the basis for fish stock assessments: the CMSY++ method and its worldwide applications. Submitt Fish Fish
Froese, R., Winker, H., Gascuel, D., Sumaila, U. R., and Pauly, D. (2016). Minimizing the impact of fishing. Fish Fish. 17, 785–802. doi: 10.1111/faf.12146
Galdelli, A., Mancini, A., Tassetti, A. N., Ferrà Vega, C., Armelloni, E., Scarcella, G., et al. (2019). “A cloud computing architecture to map trawling activities using positioning data,” in Proceeddings of the 15th IEEE/ASME International Conference on Mechatronic and Embedded Systems and Applications, Vol. 9, (New York; NY: American Society of Mechanical Engineers). doi: 10.1115/DETC2019-97779
Gamble, R. J., and Link, J. S. (2009). Analyzing the tradeoffs among ecological and fishing effects on an example fish community: a multispecies (fisheries) production model. Ecol. Model. 220, 2570–2582. doi: 10.1016/j.ecolmodel.2009.06.022
GFCM (2018). Scientific Advisory Committee on Fisheries (SAC) Working Group on Stock Assessment of Demersal Species (WGSAD) 13 – 18 November 2017 Final Report, Vol. 1. Rome: GFCM and FAO. 13–18.
Giovanardi, O., Pranovi, F., and Franceschini, G. (1998). “Rapido” trawl-fishing in the Northern Adriatic: preliminary observations on effects on macrobenthic communities. Acta Adriat. 39, 37–52.
Grati, F., Aladzuz, A., Azzurro, E., Bolognini, L., Carbonara, P., ?obani, M., et al. (2018). Seasonal dynamics of small-scale fisheries in the Adriatic sea. Mediterr. Mar. Sci. 19:21. doi: 10.12681/MMS.2153
Grati, F., Scarcella, G., Polidori, P., Domenichetti, F., Bolognini, L., Gramolini, R., et al. (2013). Multi-annual investigation of the spatial distributions of juvenile and adult sole (Solea solea L.) in the Adriatic Sea (northern Mediterranean). J. Sea Res. 84, 122–132. doi: 10.1016/j.seares.2013.05.001
Hall-Spencer, J., Froglia, C., Atkinson, R. J. A., and Moore, P. G. (1999). The impact of Rapido trawling for scallops,Pecten jacobaeus(L.), on the benthos of the Gulf of Venice. ICES J. Mar. Sci. 56, 111–124. doi: 10.1006/jmsc.1998.0424
Hilborn, R. (2011). Future directions in ecosystem based fisheries management: a personal perspective. Fish. Res. 108, 235–239. doi: 10.1016/j.fishres.2010.12.030
Howell, D., and Subbey, S. (2019). “Multispecies considerations in stock assessments: “yes we can”,” in Proceedings of the ICES Annual Science Conference ICES C. 2013/E07, (Bergen: IMR).
ICES. (2017). WGMIXFISH – Report of the Working Group on Mixed Fisheries Advice for the North Sea. Copenhagen: ICES. 128.
Iles, T. C. (1994). A review of stock-recruitment relationships with reference to flatfish populations. Neth. J. Sea Res. 32, 399–420. doi: 10.1016/0077-7579(94)90017-5
Kollmann, H., and Stachowitsch, M. (2001). Long-term changes in the benthos of the northern adriatic sea: a phototransect approach. Mar. Ecol. 22, 135–154. doi: 10.1046/j.1439-0485.2001.01761.x
Kritzer, J. P., and Liu, O. R. (2014). “Fishery management strategies for addressing complex spatial structure in marine fish stocks,” in Stock Identification Methods, (Cambridge, MA: Academic Press), 29–57. doi: 10.1016/B978-0-12-397003-9.00003-5
Legendre, P., and Gallagher, E. D. (2001). Ecologically meaningful transformations for ordination of species data. Oecologia 129, 271–280. doi: 10.1007/s004420100716
Link, J. S. (2010). Ecosystem-Based Fisheries Management: Confronting Tradeoffs. New York, NY: Cambridge University Press, doi: 10.1017/CBO9780511667091
Maravelias, C. D., and Tsitsika, E. V. (2008). Economic efficiency analysis and fleet capacity assessment in Mediterranean fisheries. Fish. Res. 93, 85–91. doi: 10.1016/j.fishres.2008.02.013
Marini, M., Bombace, G., and Iacobone, G. (2017). Il Mare Adriatico e le Sue Risorse. Palermo: Carlo Saladino Editore.
Mattei, N., and Pellizzato, M. (1996). A population study on three stocks of a commercial Adriatic pectinid (Pecten jacobaeus). Fish. Res. 26, 49–65. doi: 10.1016/0165-7836(95)00413-0
Maunder, M. N. (2012). Evaluating the stock-recruitment relationship and management reference points: application to summer flounder (Paralichthys dentatus) in the U.S. mid-Atlantic. Fish. Res. 125–126, 20–26. doi: 10.1016/j.fishres.2012.02.006
Maunder, M. N., and Aires-da-silva, A. (2011). Evaluation of the Kobe Plot and Strategy Matrix and Their Application to Tuna in the EPO. Iattc, 191–211. La Jolla, CA. Available online at: https://www.iattc.org/Meetings/Meetings2011/SAC-02/Docs/_English/SAC-02-11_Evaluation-of-Kobe-plot-and-matrix.pdf (accessed May 9-12, 2011)
Maunder, M. N., and Punt, A. E. (2013). A review of integrated analysis in fisheries stock assessment. Fish. Res. 142, 61–74. doi: 10.1016/j.fishres.2012.07.025
Moffitt, E. A., Punt, A. E., Holsman, K., Aydin, K. Y., Ianelli, J. N., and Ortiz, I. (2016). Moving towards ecosystem-based fisheries management: options for parameterizing multi-species biological reference points. Deep Res. Part II Top. Stud. Oceanogr. 134, 350–359. doi: 10.1016/j.dsr2.2015.08.002
Oksanen, A. J., Blanchet, F. G., Friendly, M., Kindt, R., Legendre, P., Mcglinn, D., et al. (2016). Vegan: Community Ecology Package. doi: 10.4135/9781412971874.n145
Petović, S., Markoviæ, O., Ikica, Z., Ðuroviæ, M., and Joksimoviæ, A. (2016). Effects of bottom trawling on the benthic assemblages in the south Adriatic Sea (Montenegro). Acta Adriat. 57, 81–92.
Pranovi, F., Raicevich, S., Franceschini, G., Farrace, M. G., and Giovanardi, O. (2000). Rapido trawling in the northern Adriatic Sea: effects on benthic communities in an experimental area. ICES J. Mar. Sci. 57, 517–524. doi: 10.1006/jmsc.2000.0708
Punt, A. E., Smith, A. D. M., and Cui, G. (2002). Marine Freshwater of technical interactions. Mar. Freshw. Res. 53, 615–629.
Riedel, B., Stachowitsch, M., and Zuschin, M. (2010). “Low dissolved oxygen impacts in the northern Adriatic: critical thresholds for benthic assemblages,” in Proceedings of the ICES Annual Science Conference Vienna. 1–17.
Rogers, J. B., and Pikitch, E. K. (1992). Numerical definition of groundfish assemblages caught off the coasts of oregon and washington using commercial fishing strategies. Can. J. Fish. Aquat. Sci. 49, 2648–2656. doi: 10.1139/f92-293
Russo, E., Monti, M. A., Mangano, M. C., Raffaetà, A., Sarà, G., Silvestri, C., et al. (2020). Temporal and spatial patterns of trawl fishing activities in the Adriatic Sea (Central Mediterranean sea, GSA17). Ocean Coast. Manag. 192:105231. doi: 10.1016/j.ocecoaman.2020.105231
Santelli, A., Cvitkoviæ, I., Despalatoviæ, M., Fabi, G., Grati, F., Marèeta, B., et al. (2017). Spatial persistence of megazoobenthic assemblages in the Adriatic Sea. Mar. Ecol. Prog. Series 566, 31–48. doi: 10.3354/meps12002
Scarcella, G., Fabi, G., and Grati, F. (2007). Rapido trawl fishery in the north-central Adriatic Sea. Rapp. Commun. Int. Mer. Mèditerr 38:591.
Scarcella, G., Grati, F., Raicevich, S., Russo, T., Gramolini, R., Scott, R. D., et al. (2014). Common sole in the northern and central Adriatic sea: spatial management scenarios to rebuild the stock. J. Sea Res. 89, 12–22. doi: 10.1016/j.seares.2014.02.002
Schückel, S., Sell, A. F., Kihara, T. C., Koeppen, A., Kröncke, I., and Reiss, H. (2013). Meiofauna as food source for small-sized demersal fish in the southern North Sea. Helgol. Mar. Res. 67, 203–218. doi: 10.1007/s10152-012-0316-1
STECF (2019). The 2019 Annual Economic Report on the EU Fishing Fleet (STECF 19-06) EUR 28359 EN, eds N. Carvalho, M. Keatinge, and J. Guillen Garcia (Luxembourg: Publications Office of the European Union). doi: 10.2760/911768
Van der Hammen, T., Poos, J. J., Van Overzee, H. M. J., Heessen, H. J. L., Magnusson, A., and Rijnsdorp, A. D. (2013). Population ecology of turbot and brill: what can we learn from two rare flatfish species? J. Sea Res. 84, 96–108. doi: 10.1016/j.seares.2013.07.001
Ward, J. H. (1963). Hierarchical grouping to optimize an objective function. J. Am. Stat. Assoc. 58, 236–244. doi: 10.1080/01621459.1963.10500845
Welcomme, R. L. (1999). A review of a model for qualitative evaluation of exploitation levels in multi−species fisheries. Fish. Manag. Ecol. 6, 1–19. doi: 10.1046/j.1365-2400.1999.00137.x
Winker, H., Carvalho, F., and Kapur, M. (2018). JABBA: just another bayesian biomass assessment. Fish. Res. 204, 275–288. doi: 10.1016/j.fishres.2018.03.010
Keywords: catch assemblage, flatfishes, Mediterranean sea, harvest control rule, CMSY
Citation: Armelloni EN, Scanu M, Masnadi F, Coro G, Angelini S and Scarcella G (2021) Data Poor Approach for the Assessment of the Main Target Species of Rapido Trawl Fishery in Adriatic Sea. Front. Mar. Sci. 8:552076. doi: 10.3389/fmars.2021.552076
Received: 15 April 2020; Accepted: 14 May 2021;
Published: 22 June 2021.
Edited by:
Hui Zhang, Institute of Oceanology, Chinese Academy of Sciences (CAS), ChinaReviewed by:
Nazli Demirel, Istanbul University, TurkeyKui Zhang, Chinese Academy of Fishery Sciences (CAFS), China
Copyright © 2021 Armelloni, Scanu, Masnadi, Coro, Angelini and Scarcella. This is an open-access article distributed under the terms of the Creative Commons Attribution License (CC BY). The use, distribution or reproduction in other forums is permitted, provided the original author(s) and the copyright owner(s) are credited and that the original publication in this journal is cited, in accordance with accepted academic practice. No use, distribution or reproduction is permitted which does not comply with these terms.
*Correspondence: Martina Scanu, bWFydGluYS5zY2FudUBpcmJpbS5jbnIuaXQ=