 Lisette Mekkes1,2*
 Guadalupe Sepúlveda-Rodríguez1,2
 Gintarė Bielkinaitė1,2
 Deborah Wall-Palmer1
 Geert-Jan A. Brummer3
 Linda K. Dämmer3,4
 Jef Huisman2
 Emiel van Loon2
 Willem Renema1,2
 Katja T. C. A. Peijnenburg1,2*
- 1Naturalis Biodiversity Center, Leiden, Netherlands
- 2Institute for Biodiversity and Ecosystem Dynamics (IBED), University of Amsterdam, Amsterdam, Netherlands
- 3Department of Ocean Systems, NIOZ, Royal Netherlands Institute for Sea Research, Texel, Netherlands
- 4Environmental Geology, Department of Geology, Institute of Geosciences, University of Bonn, Bonn, Germany
Ocean acidification is expected to impact the high latitude oceans first, as CO2 dissolves more easily in colder waters. At the current rate of anthropogenic CO2 emissions, the sub-Antarctic Zone will start to experience undersaturated conditions with respect to aragonite within the next few decades, which will affect marine calcifying organisms. Shelled pteropods, a group of calcifying zooplankton, are considered to be especially sensitive to changes in carbonate chemistry because of their thin aragonite shells. Limacina retroversa is the most abundant pteropod in sub-Antarctic waters, and plays an important role in the carbonate pump. However, not much is known about its response to ocean acidification. In this study, we investigated differences in calcification between L. retroversa individuals exposed to ocean carbonate chemistry conditions of the past (pH 8.19; mid-1880s), present (pH 8.06), and near-future (pH 7.93; predicted for 2050) in the sub-Antarctic. After 3 days of exposure, calcification responses were quantified by calcein staining, shell weighing, and Micro-CT scanning. In pteropods exposed to past conditions, calcification occurred over the entire shell and the leading edge of the last whorl, whilst individuals incubated under present and near-future conditions mostly invested in extending their shells, rather than calcifying over their entire shell. Moreover, individuals exposed to past conditions formed larger shell volumes compared to present and future conditions, suggesting that calcification is already decreased in today’s sub-Antarctic waters. Shells of individuals incubated under near-future conditions did not increase in shell weight during the incubation, and had a lower density compared to past and present conditions, suggesting that calcification will be further compromised in the future. This demonstrates the high sensitivity of L. retroversa to relatively small and short-term changes in carbonate chemistry. A reduction in calcification of L. retroversa in the rapidly acidifying waters of the sub-Antarctic will have a major impact on aragonite-CaCO3 export from oceanic surface waters to the deep sea.
Introduction
Since the start of the industrial revolution, the oceans have absorbed approximately 30% of anthropogenic CO2 emissions (Le Quéré et al., 2015; Gruber et al., 2019), which has caused a lowering in surface-ocean pH of ∼0.1 units from ∼8.2 to ∼8.1, a process referred to as “ocean acidification” (Caldeira and Wickett, 2003; Feely et al., 2004). As the oceans become enriched in anthropogenic CO2, the concentration of carbonate ions [(CO32–)] decreases, whilst that of bicarbonate ions [(HCO3–)] increases. The decline of [CO32–] results in lower saturation states of the carbonate minerals calcite and aragonite (Gruber et al., 2019). This will have adverse consequences for a broad variety of marine organisms, particularly those that precipitate calcium carbonate (CaCO3) shells or skeletons, such as coccolithophores, foraminifers, and molluscs (Riebesell et al., 2000; Orr et al., 2005; Hoegh-Guldberg et al., 2007; Moy et al., 2009; Gazeau et al., 2013; Kroeker et al., 2013; Waldbusser et al., 2015). Thecosome pteropods, a group of holoplanktonic gastropods, are considered to be amongst the calcifying organisms that are most susceptible to ocean acidification because of their thin aragonite shells (Fabry et al., 2008; Lischka et al., 2011; Bednaršek et al., 2012a, 2014; Manno et al., 2017).
Calcium carbonate produced by marine calcifiers, and its subsequent export from the surface waters into the deep, drives the ocean’s “carbonate pump” (Holligan and Robertson, 1996; Riebesell et al., 2009). The carbonate pump is one of the key processes in the ocean carbon cycle, and is often described as a CO2 counterpump because precipitation of CaCO3 tends to increase the dissolved CO2 concentration (Zeebe, 2012). The strength of the carbonate pump depends mainly on the relative amount of precipitated CaCO3 by larger calcifying plankton, as they sink down to the deep relatively quickly because of their size and weight (Bernard and Froneman, 2009; Buitenhuis et al., 2019). As the main planktonic producers of aragonite, thecosome pteropods are important contributors to the carbonate pump (Fabry, 1990; Bednaršek et al., 2012b; Manno et al., 2018; Buitenhuis et al., 2019). The rise in atmospheric CO2, and, in turn, decreasing sea surface carbonate concentration are expected to have a profound impact on the calcification efficiency of marine calcifiers, and subsequently affect the strength of the carbonate pump.
At the current rate of anthropogenic CO2 emissions, aragonite undersaturation events are predicted to spread rapidly in the Southern Ocean during the next few decades, due to the high solubility of CO2 in cold waters (Doney et al., 2009; Fabry et al., 2009; Hauri et al., 2016; Negrete-García et al., 2019). More than 80% of the surface waters of the Southern Ocean are expected to become undersaturated with respect to aragonite from four up to 12 months per year by the year 2100 (Feely et al., 2008; Fabry et al., 2009; Hauri et al., 2016; Negrete-García et al., 2019). Thecosome pteropods are functionally important components of the Southern Ocean ecosystem, because of their high abundance (∼100 mg C m–3; Hopkins, 1987; Boysenennen et al., 1991; Bednaršek et al., 2012b), central role in food webs (Hunt et al., 2008), and organic carbon export (Collier et al., 2000). Moreover, being key calcifiers in this region (Hunt et al., 2007, 2008), pteropods often dominate CaCO3 export (Honjo, 2004; Manno et al., 2018; Buitenhuis et al., 2019). Because their aragonite shells dissolve easily (Lischka et al., 2011; Bednaršek et al., 2012a, 2014; Manno et al., 2017, 2018), aragonite undersaturation is expected to affect pteropod calcification, and, consequently, have major implications for the export of ocean surface CaCO3 (Manno et al., 2018; Buitenhuis et al., 2019).
Limacina species are the most abundant shelled pteropods in polar and subpolar waters (Bé and Gilmer, 1977; Hunt et al., 2008; Bednaršek et al., 2012b). Recent pteropod research has focused on the Southern Ocean species Limacina helicina antarctica, the most abundant pteropod species south of the Antarctic Polar Front (Hunt et al., 2008). Their shells were found to already start dissolving in the natural environment of the Southern Ocean where waters are seasonally becoming undersaturated with respect to aragonite (Bednaršek et al., 2012a). Other negative responses were found when L. helicina antarctica pteropods were exposed to acidified conditions in experimental incubations, including suppressed metabolism (Seibel et al., 2012), increased mortality and reduced calcification in larval stages (Gardner et al., 2018), and reduced egg development (Manno et al., 2016). Hence, the ecological and biogeochemical importance of L. helicina antarctica in Antarctic waters, and their vulnerability to ocean acidification has been well documented. However, little is known about calcification and vulnerability to ocean acidification of Limacina retroversa (Fleming, 1823), the most abundant shelled pteropod in the sub-Antarctic waters, north of the polar front, and a key species of the region’s zooplankton community (Bernard and Froneman, 2009; Roberts et al., 2014). L. retroversa has a bipolar distribution pattern, and, in the Southern Ocean, it is named L. retroversa australis (Eydoux and Souleyet, 1840) from now on referred to as L. retroversa. This species can reach up to 800 individuals/m3 (Hunt et al., 2008), and display diel vertical migration down to a depth of 150 m (Hunt et al., 2008). A shallowing of the aragonite saturation horizon to a depth of ∼100 m is projected to happen as early as 2050 in the sub-Antarctic waters (Negrete-García et al., 2019). Given L. retroversa’s major role in the sub-Antarctic ecosystem, it is important to understand how acidified conditions will affect this species’ calcification.
For this study, we incubated sub-Antarctic L. retroversa for 3 days in ocean carbonate chemistry conditions of the past (pH = 8.19; representative of the mid 1880s), present (pH = 8.06), and near-future (pH = 7.93; predicted for 2050) to examine their calcification response. Active calcification was determined using calcein indicator, a fluorescent marker that is only incorporated in the shell where active calcification occurs. The amount of total CaCO3 was estimated by measuring shell weight. Shell thickness, volume, and density were measured using micron-scale computed tomography (Micro-CT) scanning of the same shells. This X-ray technique can quantify variation in calcification of pteropod shells at high spatial resolution (Howes et al., 2017; Oakes and Sessa, 2020; Mekkes et al., 2021), but has not yet been applied to short-term experimental incubations. The combination of these different measurements on the same shells allows for better understanding of how changing ocean carbonate chemistry impacts pteropod calcification in the rapidly acidifying waters of the sub-Antarctic.
Materials and Methods
Pteropod Collection and Calcein Staining
Limacina retroversa was collected during the Atlantic Meridional Transect (AMT) 27 (DY084/085) cruise with the RRS Discovery, on October 30, 2017, at 51° 56′14.4″S, 35° 03′37.8″W, in the sub-Antarctic Zone (Figure 1). Using a ring net (200 μm mesh, 1 m diameter, 1 L closed cod-end) three slow, 20 min oblique tows were taken from a maximum depth of 130 m to the surface, between 00:39 and 01:48 AM local time. Undamaged and lively swimming juvenile pteropods with a height of ∼0.65 mm were immediately sorted on crushed ice using a light microscope. A representative subsample of specimens (N = 25) was taken prior to the incubations (T0) to serve as baseline for potential shell growth at the end of the incubations.
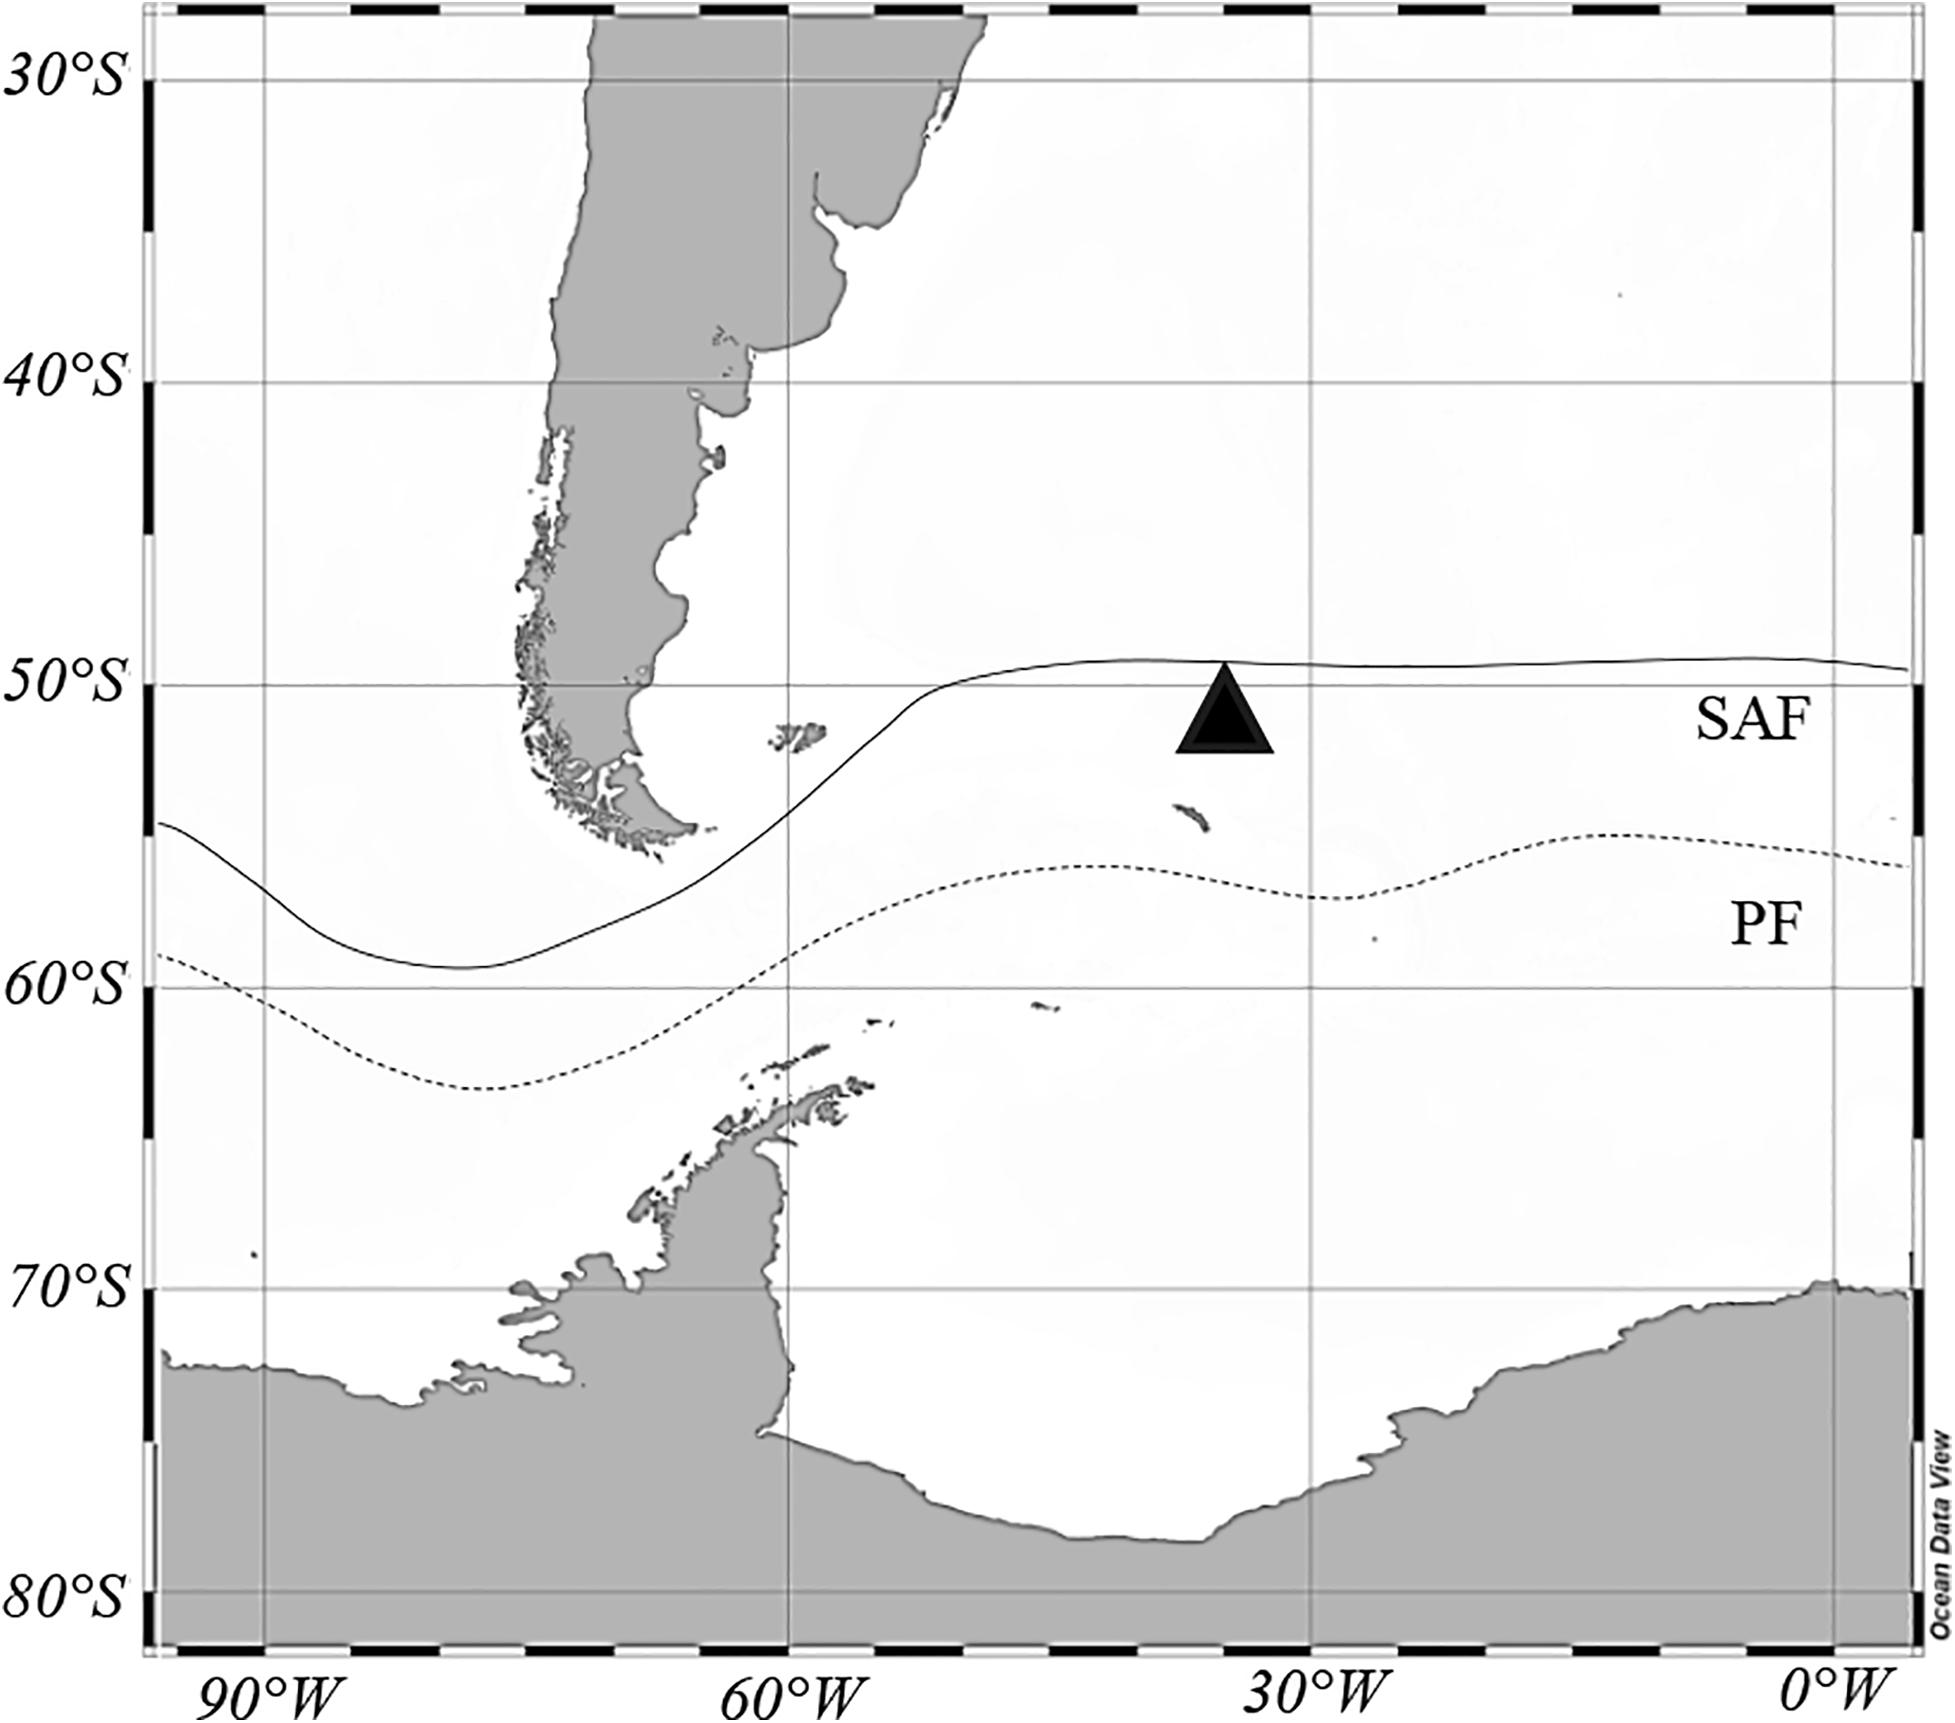
Figure 1. Station where Limacina retroversa was collected on October 30, 2017, in the sub-Antarctic Zone (black triangle). Lines represent mean positions of the sub-Antarctic front (SAF) and the polar front (PF) (Orsi et al., 1995).
Specimens were incubated in 16.8 mL 6-well plates with 0.2 μm filtered sea water with calcein indicator and maintained in the dark for 2 h (MERCK Calcein, CAS 1461-15-0, concentration 50 mg/L in seawater filtered through a 0.2 μm filter). Calcein indicator is commonly used to investigate calcification of pteropods (e.g., Comeau et al., 2009). After staining, specimens were gently rinsed with 0.2 μm filtered ambient seawater, and introduced into the experiment. Calcein is thought to be incorporated into pteropod shells in different ways. One way is by integration of calcein into all shell layers. In previous studies, this was recorded as either a distinct green line formed at the leading edge of the aperture at the time of calcein staining (Comeau et al., 2009), or along the region of apertural extension during experiments (Lischka et al., 2011). Calcein can also be integrated along the inner prismatic shell layer only, which is assumed to represent thickening of the shell (Lischka et al., 2011).
Ocean Acidification Experiment
To simulate past and future carbonate chemistry, two 60 L sealed barrels filled with 0.2 μm filtered surface seawater were bubbled with a gas mixture of either 180 ppm CO2 (past) or 795 ppm CO2 (future) for 12 h inside a temperature-controlled lab onboard. Two additional 60 L barrels were filled with filtered ambient surface seawater, for incubations representing present carbonate chemistry and the control without added pteropods, respectively. Each treatment (including the control) consisted of three replicates of 6 L carboys (3 replicates × 4 treatments = 12 carboys), filled with seawater from the four 60 L barrels right before pteropods were collected. Dried microalgae (a mixture of 33.3% Phaeodactylum, 33.3% Nannochloropsis, and 33.3% Tetraselmis) were added to each of the carboys at a concentration of 0.6 mg/L (3.6 mg per carboy) as a food source. A total of 13–16 calcein-stained L. retroversa were introduced into each carboy randomly, which were subsequently sealed air-tight.
The carboys were incubated for 3 days inside an open tank positioned on the deck of the ship and covered with blackout fabric. During the incubation the ship traveled from 51° 56′14.4″S, 35° 03′37.8″W to 53° 11′05.3″”S, 42° 24′56.9″W. Using continuous flow-through of ambient sea surface water, incubation temperature remained stable throughout the duration of the experiments (mean temperature ± SD of 1.83 ± 0.49°C). We chose to conduct a short-term experiment because shelled pteropods are notoriously difficult to keep under laboratory conditions (Howes et al., 2014; Maas et al., 2018). To further reduce captivity effects, pteropods were fed plentiful microalgae to prevent starvation, which could affect calcification (Ramajo et al., 2016).
After 3 days of incubation inside the carboys, swimming pteropods were carefully sucked into a 20 mL glass pipette to be transferred into a Petri dish, and briefly examined under a light microscope to verify that they were undamaged, alive, and actively swimming. Only one of the 37 specimens was found dead after 3 days of incubation under the present conditions, and thus excluded from further analyses. Given the bright green color observed in the stomachs of all pteropods, they had been feeding successfully. At the start and end of the incubations, temperature, salinity, and pH were measured and dissolved inorganic carbon (DIC) samples were collected from all carboys. Pteropods were rinsed with ultrapure (Milli-Q) water prior to being flash frozen in liquid nitrogen. Until analyses, all specimens were stored at −20°C.
Water Chemistry
Filtered samples for DIC measurements were stored in air-tight 5 mL glass vials after preservation with 15 μL mercury (II) chloride (HgCl2). DIC concentrations were analyzed with a Technicon Traacs 800 autoanalyzer (SEAL Analytical, Germany) (Stoll et al., 2001). A benchtop pH meter (HI5522-02, Hanna Instruments, Nieuwegein, Netherlands) with a glass electrode was used for pH measurements on the NBS scale. Total Alkalinity (TA), partial pressure of CO2 (pCO2), and aragonite saturation state (ΩAr) were calculated from measurements of DIC, pH, salinity, and temperature using the program PyCO2SYS version 1.3 (Humphreys et al., 2020). The calculations used the dissociation constants for carbonic acid (K1 and K2) of Millero et al. (2002), and the KHSO4 dissociation constant of Dickson (1990). Furthermore, the calculations included the silicate and phosphate concentrations (31.92 and 1.36 μmol/kg, respectively) measured in the seawater collected for the experiments using a Bran + Luebbe AAIII autoanalyzer.
To compare the incubation experiments with in situ conditions, the same oceanographic variables were sampled at 5, 40, and 60 m depth with a CTD/rosette sampler (Seabird).
Analyses of Calcein Stained Shells
Shell cleaning, weighing, and fluorescent imaging was carried out at the Royal Netherlands Institute for Sea Research (NIOZ), Texel, Netherlands. After freeze-drying, all organic material was removed from the shells by dry oxidation in a Tracerlab low temperature (∼100°C) asher for 90 min (Fallet et al., 2009). Pteropod shells were individually rinsed with 96% ethanol and Milli-Q water to remove any ash residue, and air dried for at least 24 h in a desiccator. Removal of organic matter is crucial to accurately measure shell weight and to record calcein integration in the shells because organic residues can emit a false fluorescence signal. To demonstrate that all organic material was removed successfully, SEM images were taken of individuals from each of the experimental treatments (Supplementary Figure 1).
A total of 111 shells were imaged using a Zeiss Axioplan 2 microscope with a Colibri light source and fluorescence filter (excitation 485/20 nm, FT 510) (Supplementary Table 1). When exposed to an excitation wavelength of 485 nm (cyan-blue), calcein has its fluorescence maximum at 515 nm (green) and marks the active calcification area of the shells during the experiments. Based on the green-emitting light of calcein incorporated in the shells, we distinguished three patterns of active calcification: no glow, apertural glow (leading edge of the last whorl) and full shell glow (Figure 2). Glow categories for each shell were determined by inspecting and rotating the shell under a fluorescence microscope. Representative images of each specimen are included in Supplementary Figure 2.
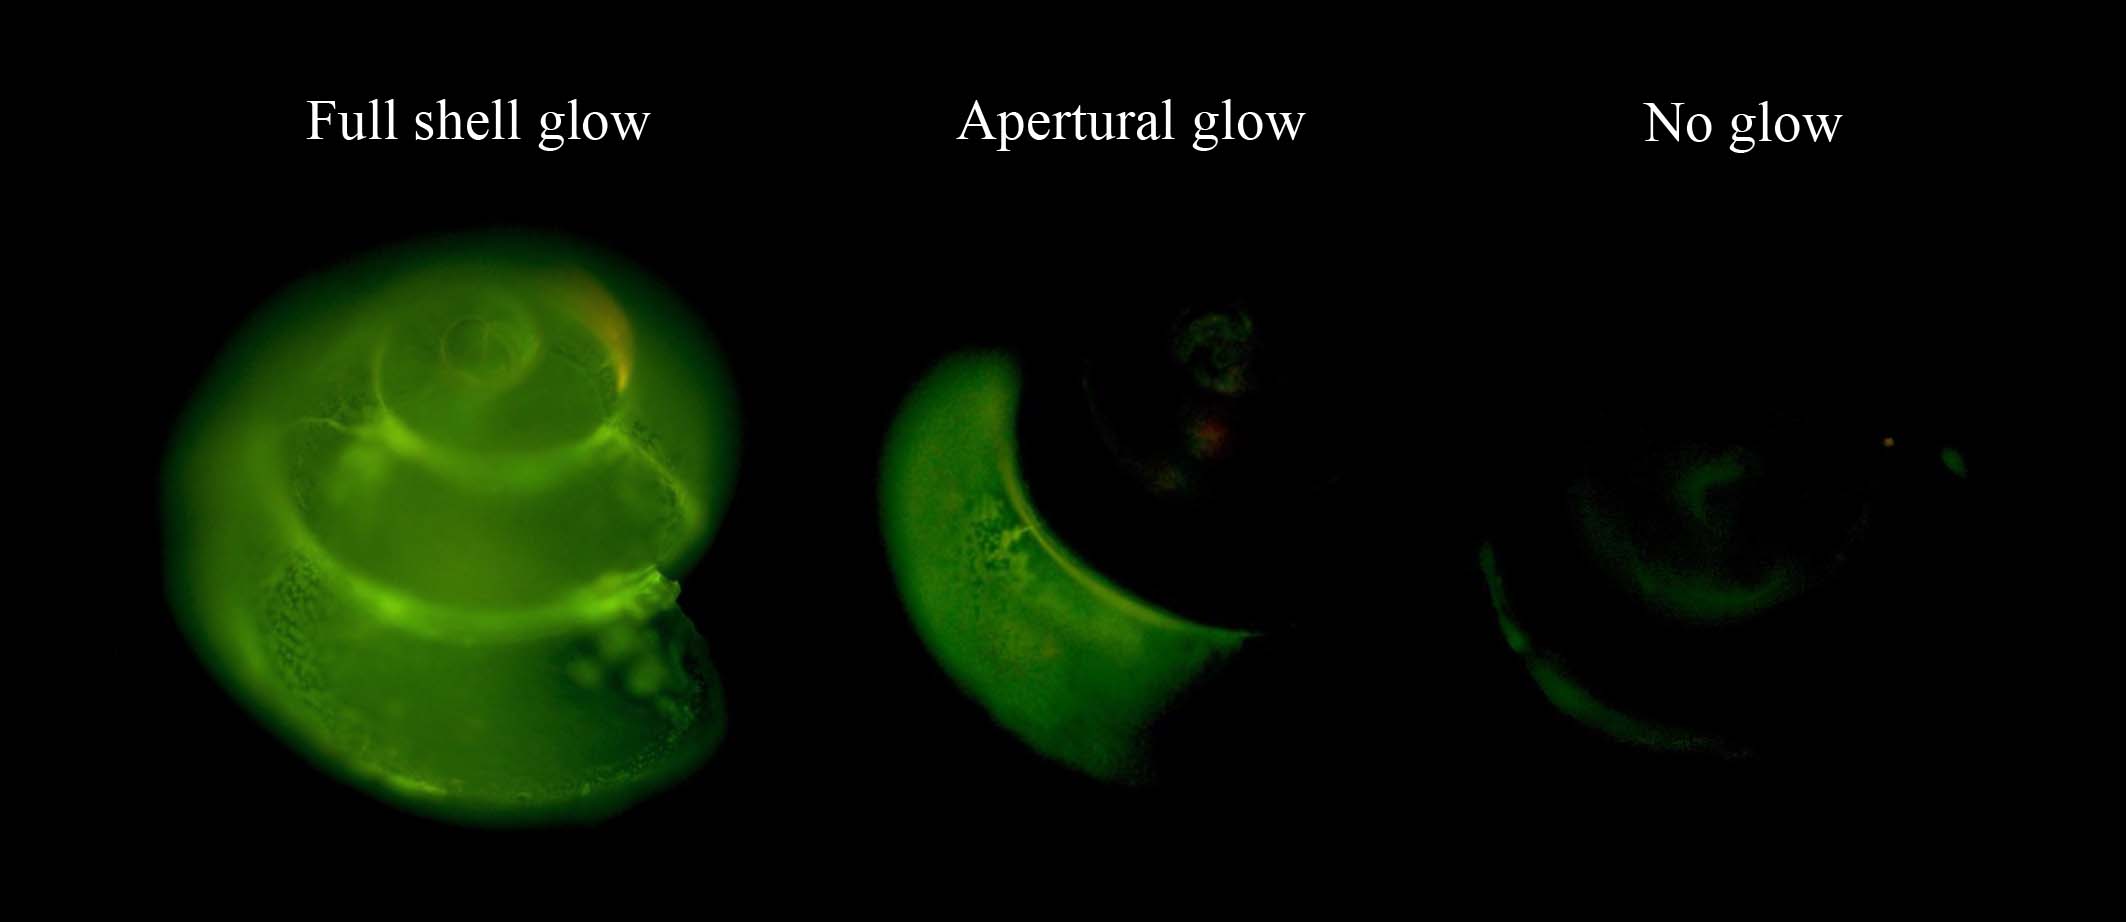
Figure 2. Active calcification as detected by calcein incorporation using fluorescence microscopy. Calcein incorporation in Limacina retroversa showed three different patterns after a 3-day incubation: full glow, apertural glow, and no glow.
To demonstrate which shell layers had incorporated calcein, a shell with apertural glow and a shell with full shell glow were embedded in resin and cross-sections were made. This gives more insight into patterns of active calcification. In the case of apertural glow, all shell layers at the aperture are expected to glow, as a reflection of accretionary shell extension. In the case of fully glowing shells, a combination of shell extension (glow of all shell layers at the aperture) and shell thickening (glow of solely the inner prismatic layer across the entire shell) is expected.
Shell Biometry
A subset of intact shells was used for weighing and Micro-CT scanning as visual inspection by light microscopy showed that some shells were damaged during handling for fluorescence imaging. To estimate shell growth, between 13 and 15 undamaged shells were selected from each treatment (a total of 42 individuals; Supplementary Table 1) and weighed using a Sartorius microbalance Model PRO 11 (Sartorius AG, Göttingen, Germany) with a resolution of 0.001 mg. The 25 shells collected at T0 were weighed to estimate the mean shell weight prior to the incubations. Each specimen was weighed three times to account for random error of the weight measurements (±0.493 μg). Subsequently, the shells were scanned using a micro-CT scanner (SkyScan, model 1172, Aartselaar, Belgium) at Naturalis Biodiversity Center, Leiden, Netherlands. Scans were carried out using 60 kV and a scan resolution of 1.0 μm voxel size was achieved. X-ray projections were reconstructed using NRecon ver. 1.6.6.0 (SkyScan) and introduced into Avizo 9.5 3D software (ThermoFisher Scientific, Waltham, MA, United States) to generate 3D models of the shells for calculating shell thickness, volume, and density. The embedded thickness-measuring tool “Thickness map” in Avizo was used to calculate shell thickness (μm) for each voxel in a binary image, defined as the diameter of the largest sphere containing the voxel. Subsequently, the average shell thickness per shell was calculated. Height of the shells was used as an indication of size and was measured using the measuring tool of Avizo. Shell density was calculated based on the formula:
ρ = m/v
where ρ is density, m is the shell weight, and v is the volume of calcified material (derived from the micro-CT scanned shells).
Statistics
A full pairwise matrix of Pearson’s correlation coefficients for all carbonate variables was determined to assess the relationships among these variables. For potential differences in calcification patterns between treatments, Pearson’s Chi-square test was used. To establish whether pteropod shell weight, height, thickness, and density varied among stations, a one-way ANOVA was performed, and a subsequent Tukey’s HSD post hoc test to indicate differences between treatments. Normality of the residuals in the ANOVA was tested with a Shapiro–Wilk test and homogeneity of variance with Levene’s test. Statistical analyses were conducted in R (R Core Team, 2018), using the packages lme4 (Bates et al., 2015) and vegan (Oksanen et al., 2018).
Results
Carbonate Chemistry
Carbonate chemistry measurements show that the applied treatments achieved realistic past, present and near-future conditions (Table 1). Under the applied past conditions, pH was 8.19, which is 0.13 pH units higher than under the applied present conditions and representative of the mid-1880s (assuming a decrease in pH of 0.001 units per year in sub-Antarctic waters; Kitidis et al., 2017). Under the applied near-future conditions, pH was 7.93, which is ∼0.13 pH units lower than present conditions and similar to predicted conditions for 2050 under IPCC Representative Concentration Pathway RCP8.5 (Hartin et al., 2016). The water was supersaturated with respect to aragonite (ΩAr > 1) in the past and present conditions, but close to the aragonite saturation point (ΩAr ≈ 1) in the near-future condition (Table 1). The carbonate chemistry parameters (ΩAr, pH, pCO2, DIC) in the experiment were all strongly correlated with each other, except for TA (Supplementary Table 2). After 3 days of incubation, most experimental parameters in the treatment under present conditions were still very similar to the in situ values measured in seawater at the sampling location (Table 1), although pCO2 and the DIC concentration in the incubations were slightly higher and ΩAr was slightly lower than the in situ values (possibly due to respiration by the incubated community).

Table 1. Mean (±SD) values of carbonate system parameters determined after 3 days of incubation for each experimental treatment.
Active Calcification
The patterns of active calcification differed consistently between the treatments (Pearson’s Chi-square test: χ2 = 14.841, df = 4, p < 0.01; Figure 3 and Supplementary Table 3). Pteropods exposed to past conditions either calcified over their complete shell (full glow: ∼48% of all shells) or extended their shell at the aperture (apertural glow: ∼48% of all shells) and only one of the 31 shells did not show any calcification. Pteropods from present and near-future conditions predominantly extended their shells at the aperture (apertural glow: ∼67 and ∼70% of all shells, respectively) and few individuals showed active calcification over their entire shell (full glow: ∼17 and ∼14%, respectively). Moreover, a much larger proportion of shells from present and near-future conditions did not show any calcification at all (∼17 and ∼16%, respectively) compared to past conditions (∼3%).
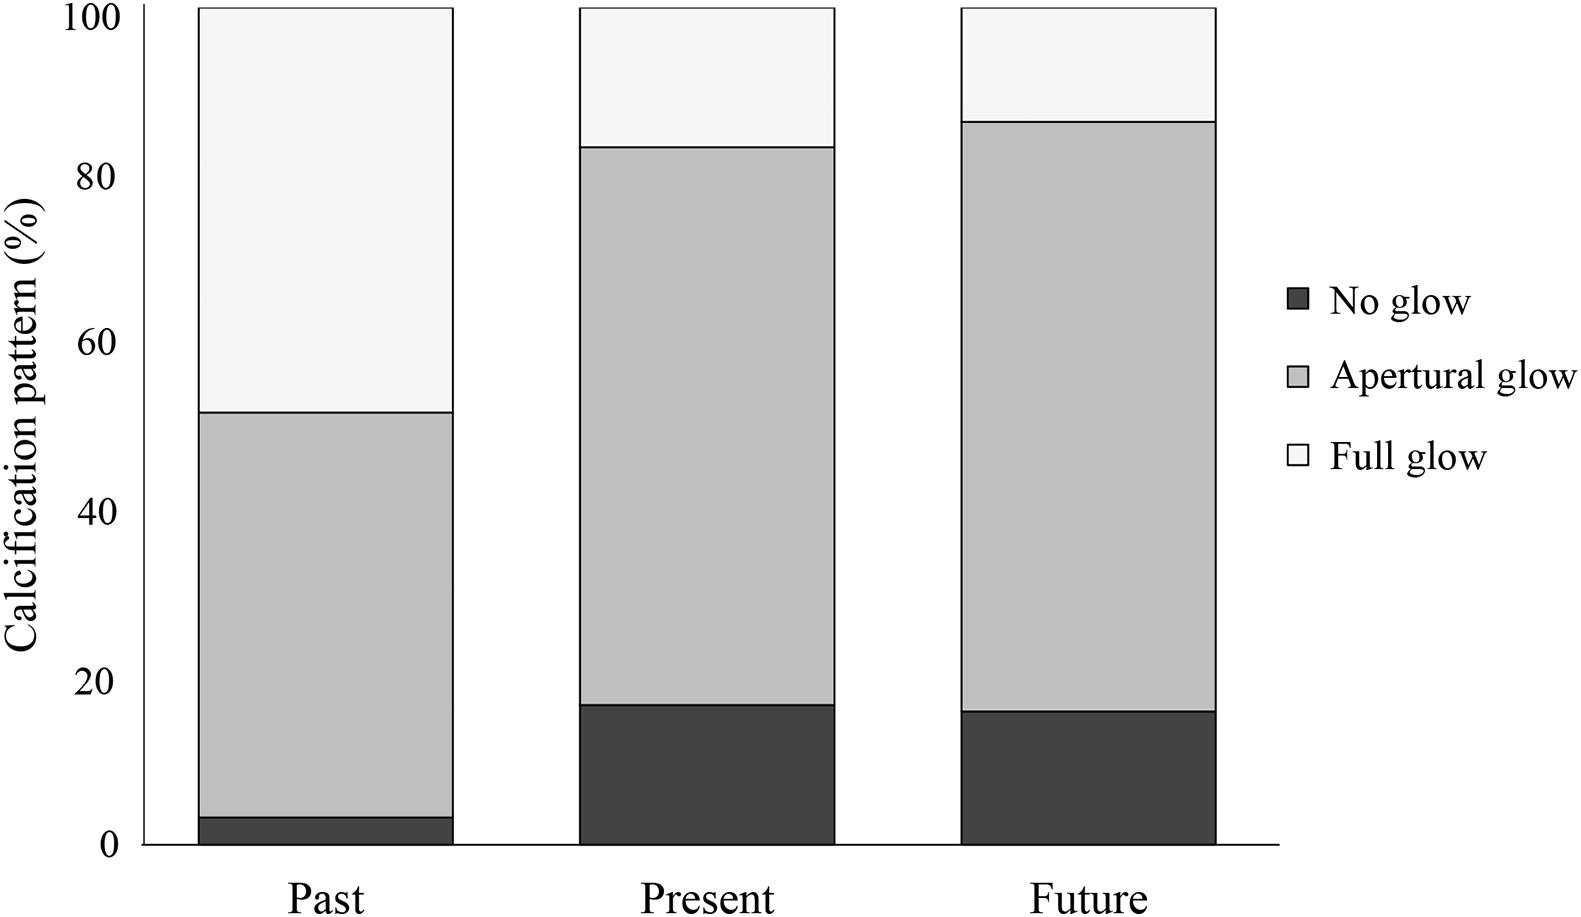
Figure 3. Calcification patterns in the pteropod population after exposure to past, present, and near-future conditions, expressed as percentage of the population that shows no glow (black), apertural glow (gray), and full glow (light gray) (31–44 individuals per treatment), see also Figure 2.
Cross-sections of a shell with full glow and a shell with apertural glow show that they incorporated calcein differently (Figure 4). Fluorescence images show that the shell with full glow incorporated calcein solely at the inner prismatic layer across most of the shell (Figure 4B; see region 1 in Figure 4C for a detailed view), but calcein was integrated into all layers (outer prismatic, middle crossed-lamellar, inner prismatic) near the aperture (region 2 in Figure 4C). This indicates that this fully glowing shell calcified across the entire inner shell and extended its shell by accretionary growth at the aperture. For the shell with apertural glow, calcein was incorporated in all shell layers (prismatic, middle crossed-lamellar, inner prismatic) along the complete region of increment near the aperture, indicating accretionary shell growth only (Figures 4D,E).
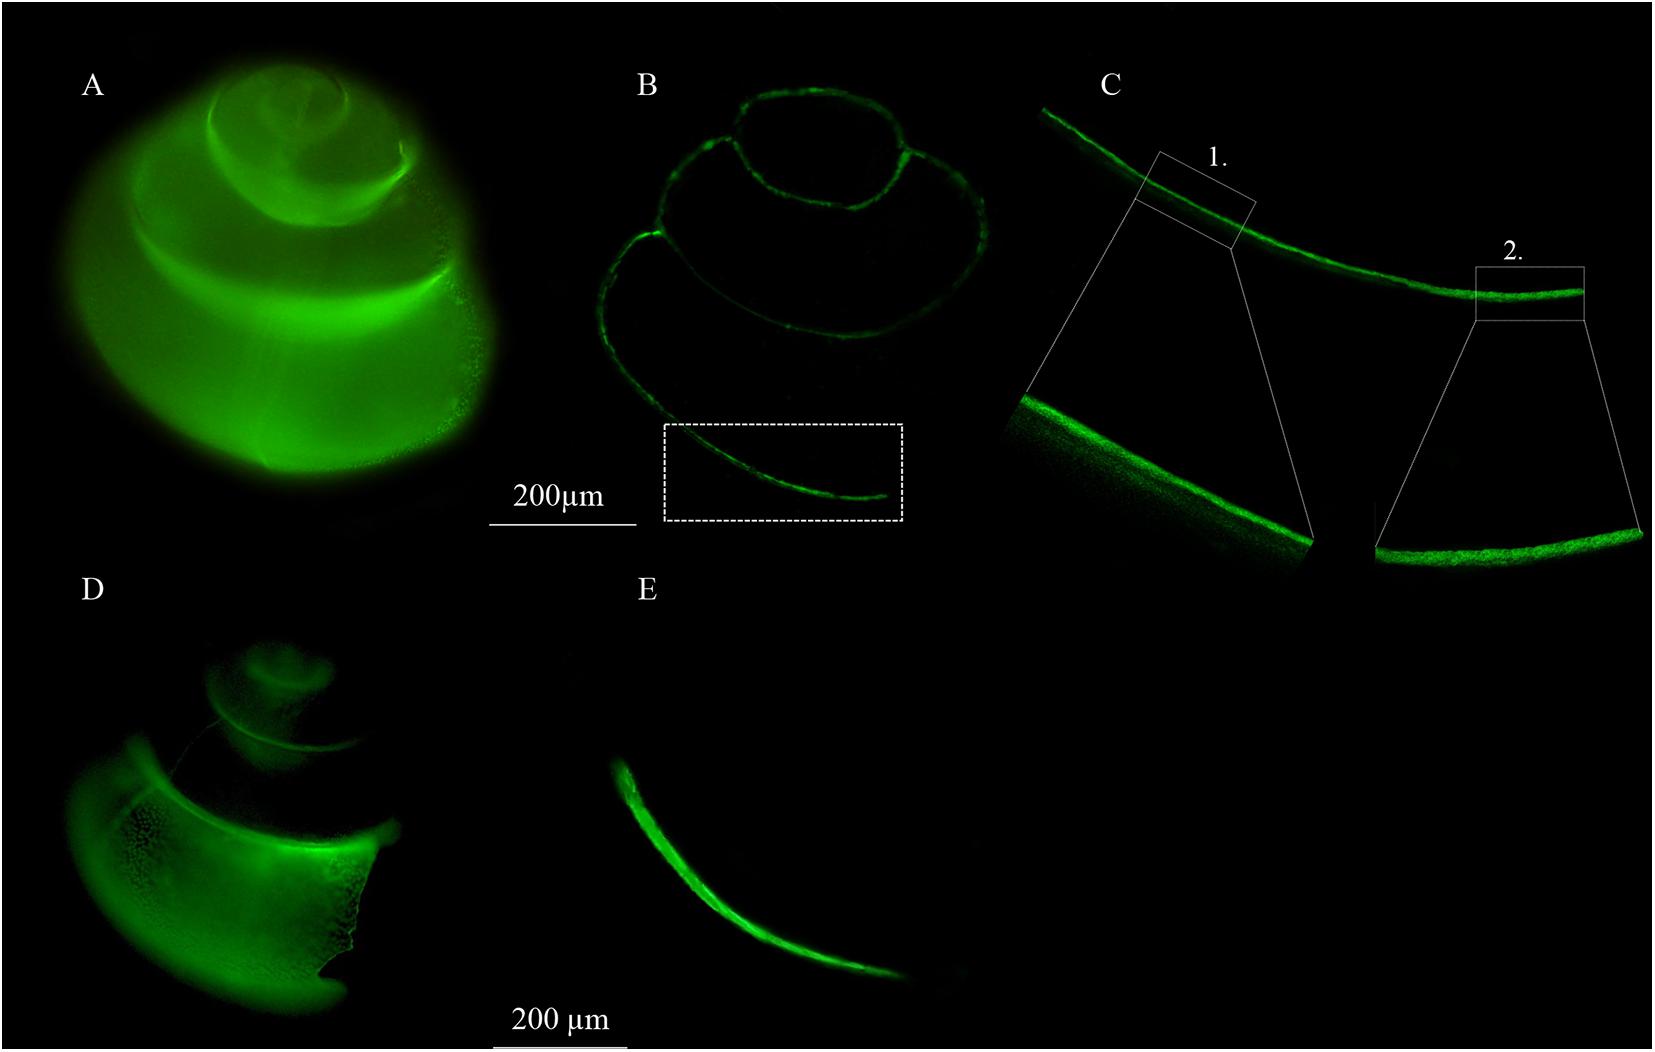
Figure 4. Fluorescence images of shell calcification. (A) Individual that calcified across the entire shell (full glow). (B) Cross section of the same shell with full glow showing calcein incorporation in the shell wall. (C) Detail of cross section of the full glow shell with calcein incorporation (1) along the inner prismatic shell layer of the entire shell, except at (2) the region of apertural extension where calcein was integrated in all shell layers (prismatic, middle crossed- lamellar, inner prismatic). (D) Individual that showed accretionary shell growth at the aperture (apertural glow). (E) Cross section of the same shell with apertural glow showing calcein incorporation in all shell layers (prismatic, middle crossed- lamellar, inner prismatic) along the entire region of apertural extension.
Shell Biometry
Shell weights differed significantly between the treatments (one-way ANOVA: F3,63 = 11.98, p < 0.001; Figure 5A). Specifically, shells exposed to past and present conditions weighed on average 57 and 31% more (mean ± SD: 14.89 ± 3.72 and 12.36 ± 4.28 μg, respectively) than the shells collected at T0 (9.44 ± 2.79 μg; Tukey’s HSD: p < 0.05; Figure 5A). In contrast, shells exposed to near-future conditions (8.11 ± 2.95 μg) did not differ significantly in weight from the shells collected at T0 (Tukey’s HSD: p = 0.62). Shell height was 634 ± 90 μm and did not differ significantly between the treatments (one-way ANOVA: F3,63 = 1.992, p = 0.124; Figure 5B).
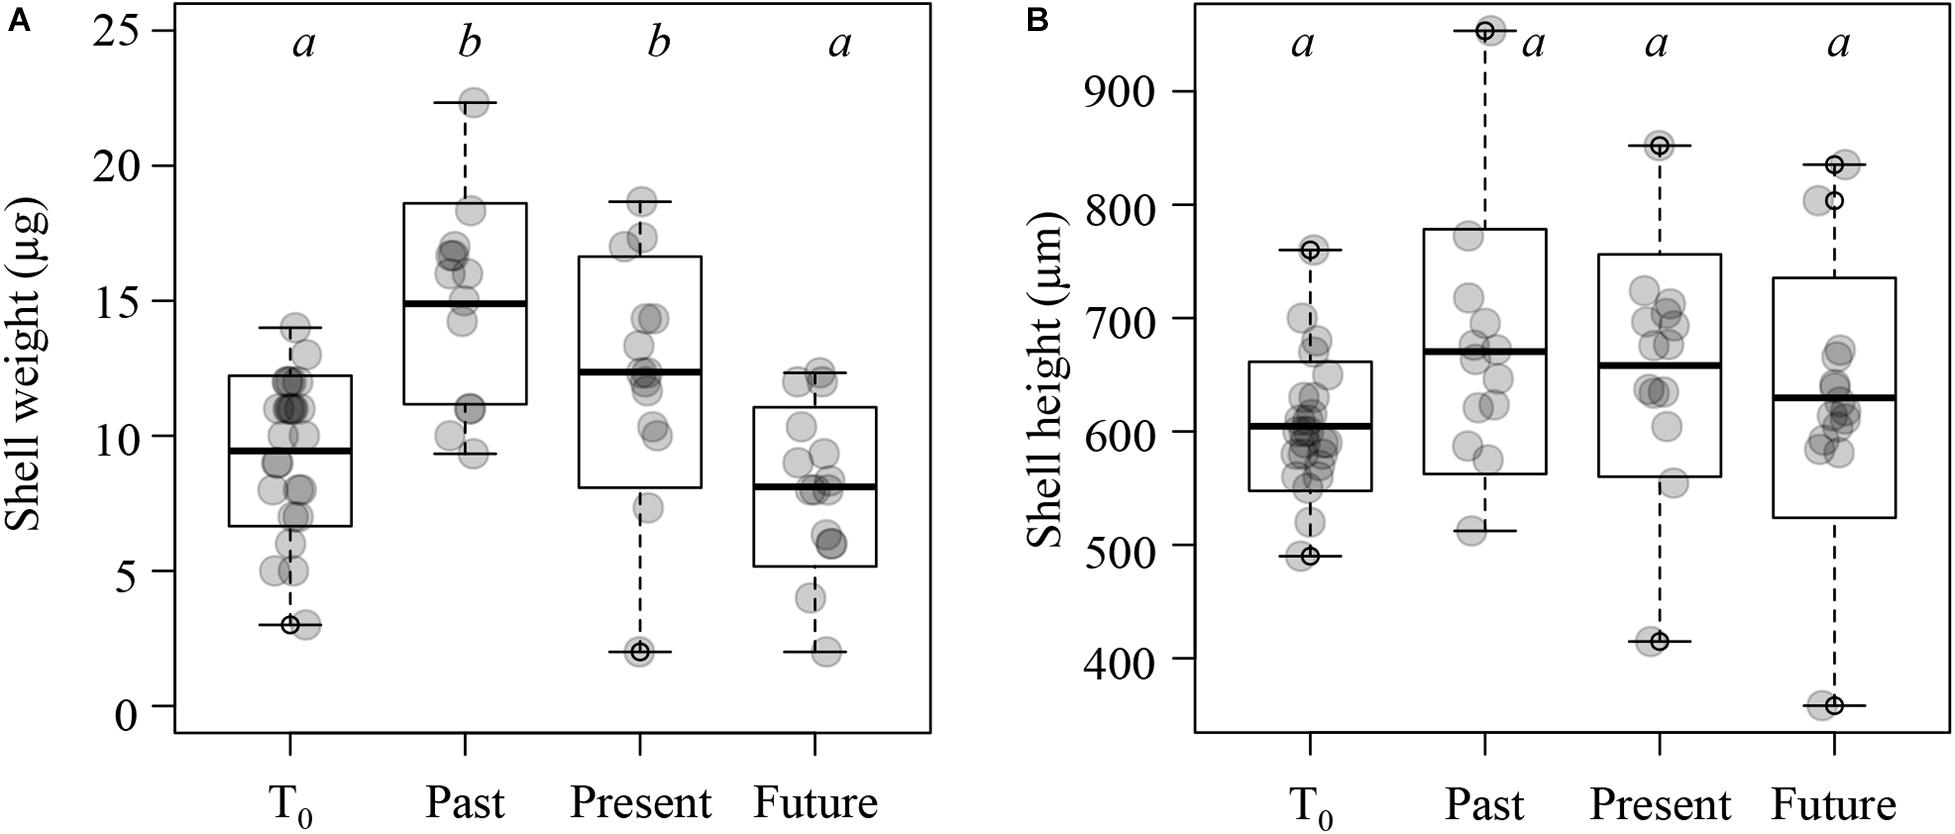
Figure 5. Shell weight and height of Limacina retroversa at T0 (25 individuals), and after exposure to past, present, and near-future conditions (13–15 individuals per treatment). (A) Shell weight. (B) Shell height. Horizontal line within the boxplots represents the mean, the boxes the standard deviation, and bars the minimum and maximum values; scattered dots represent all individual measurements. Boxplots with different letters denote significant differences between treatments (see main text for details).
Shell thickness was on average 6.84 ± 1.00 μm and showed no significant differences between treatments (one-way ANOVA: F2,39 = 2.855, p = 0.567; Figures 6A,B), indicating that changes in seawater carbonate chemistry did not affect overall shell thickness. Shell volume differed significantly between treatments (one-way ANOVA: F2,39 = 4.155, p = 0.023; Figure 6C), with the highest shell volume under past conditions (0.012 ± 0.004 mm3) compared to present and near-future conditions (0.009 ± 0.003 and 0.009 ± 0.002 mm3, respectively; Tukey’s HSD: p ≤ 0.05). Consequently, also shell densities, derived from shell weight and volume, differed between treatments (one-way ANOVA: F2,39 = 7.335, p = 0.002, Figure 6D). Specimens exposed to near-future conditions had a significantly lower shell density (0.93 ± 0.29 mg/mm3) than those exposed to past and present conditions (1.31 ± 0.30 and 1.39 ± 0.43 mg/mm3, respectively; Tukey’s HSD; p < 0.01; Figure 6D). Shells from all treatments remained fully transparent and without signs of shell dissolution (such as surface etching or clouding of the shells), as evidenced by inspection under a light microscope and confirmed by SEM imaging of several shells (N = 3; Supplementary Figure 1).
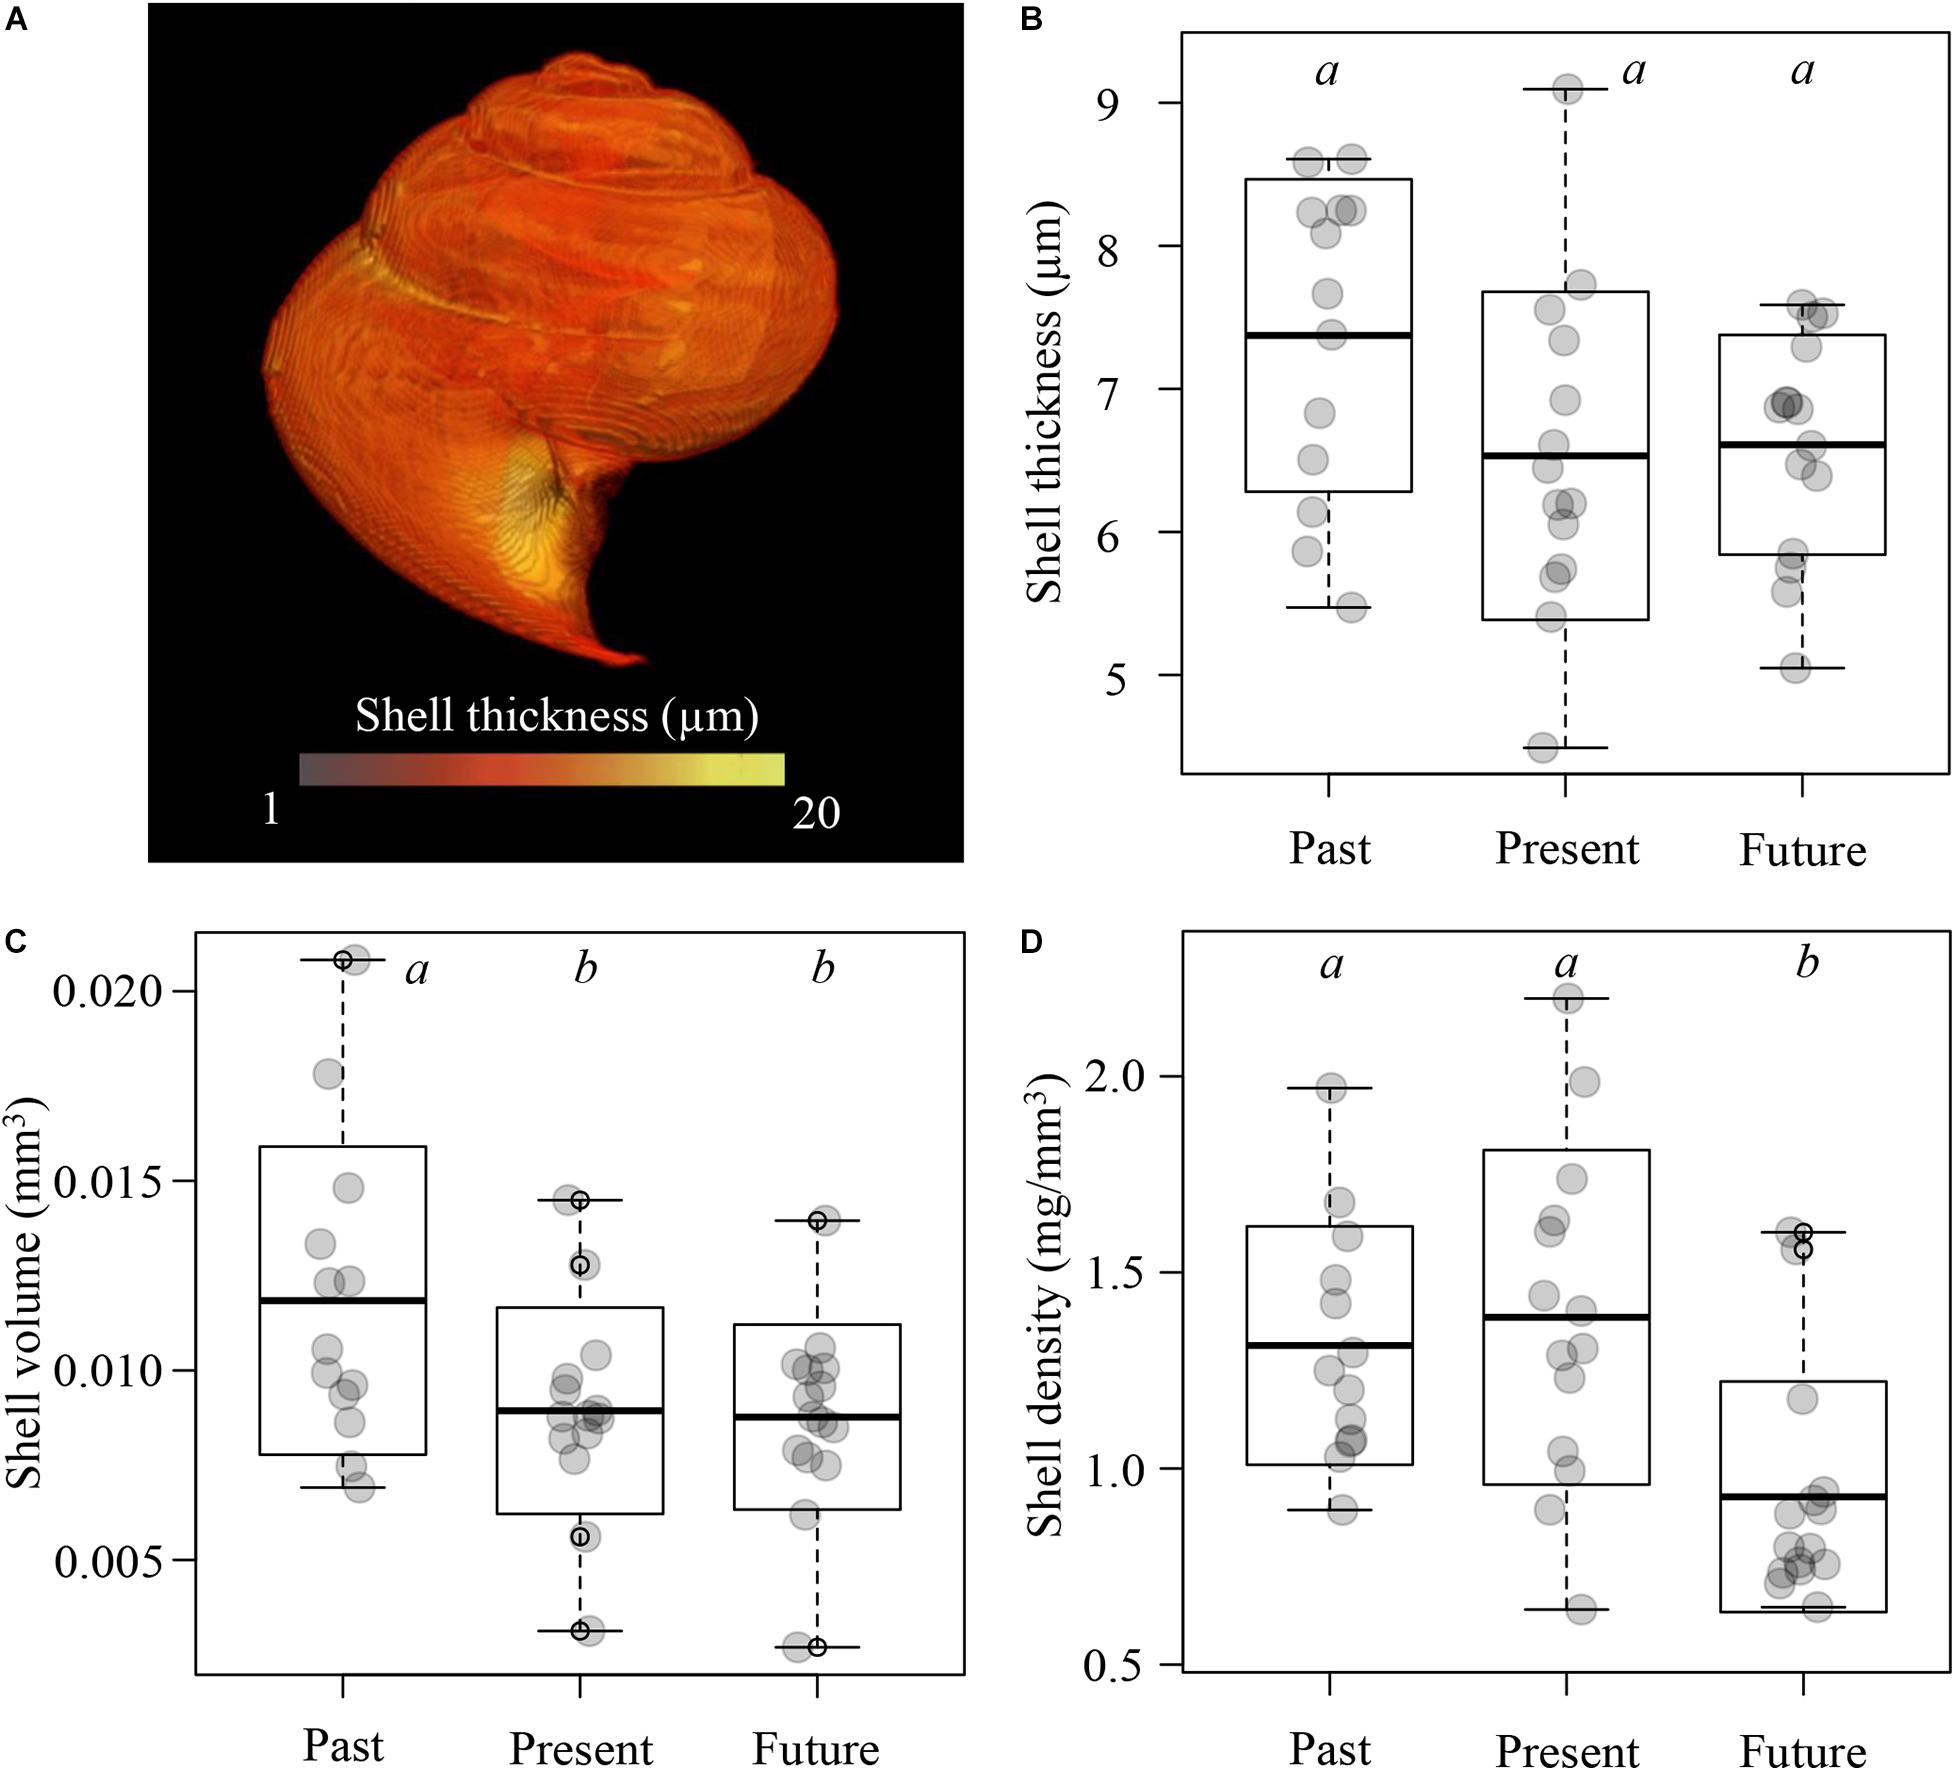
Figure 6. Shell measurements of Limacina retroversa (13–15 individuals per treatment) after exposure to past, present, and near-future conditions. (A) Shell thickness of a representative MicroCT-scanned shell. (B) Shell thickness. (C) Shell volume. (D) Shell density. Boxplots with different letters denote significant differences between treatments (see main text for details).
Discussion
We found pronounced differences in calcification of L. retroversa during short-term exposure to ocean carbonate chemistry conditions representative of the past (mid-1880), present, and near-future. Conditions remained supersaturated with respect to aragonite, and pH was above 8, for the past and present experimental conditions, but closely approached aragonite undersaturation in the near-future treatment with pH values declining to ∼7.9 as expected for the sub-Antarctic by the year 2050 (Hartin et al., 2016; Hauri et al., 2016; Negrete-García et al., 2019). Specimens incubated under these near-future conditions had a lower shell weight and lower shell density than under present and past conditions. Moreover, L. retroversa calcified over their entire shell under past conditions, while they mainly extended their shells by apertural growth only under present and near-future conditions. This suggests that their calcification may already be affected in the present-day sub-Antarctic compared to past conditions. Since our findings are independent of shell size, and the shell weight of L. retroversa incubated in near-future conditions remained similar to initial values at T0, it appears that L. retroversa invested in extending their shells at the expense of a lower shell weight, density and volume when exposed to near-future ocean conditions.
Different Patterns of Active Calcification
Our results show that active calcification shifted from whole shell calcification in many pteropods exposed to past conditions toward a predominance of apertural calcification in pteropods exposed to present and near-future conditions. Calcein studies have revealed a variety of active calcification patterns in pteropods (e.g., Comeau et al., 2009; Lischka et al., 2011; Bednaršek et al., 2017). For example, in L. helicina, calcein integrated into all shell layers, leaving a distinct line on the growing edge (Comeau et al., 2009) or along the complete apertural extension (Lischka et al., 2011). Instead of apertural shell extension, a patchy calcification across the entire shell was reported for Pacific L. helicina (Bednaršek et al., 2017) and Atlantic L. retroversa (Maas et al., 2018). In our study, the cross section of a fully glowing shell showed incorporation of calcein along the inner layer of the entire shell, except at the aperture where calcein was incorporated in all shell layers (Figure 4). In the cross section of a shell with apertural glow, calcein was incorporated in all shell layers, but at the apertural extension region only. These results indicate that the shift from fully glowing shells under past oceanic conditions to apertural glow under present and near-future conditions can be interpreted as a loss of calcification along the inner layers of the older (non-accretionary) part of the shell. Such a distinctive loss of an active calcification area in response to increasingly acidified conditions is a pattern that has not been recorded before.
Calcification efforts are likely enhanced when L. retroversa pteropods are exposed to high pH and ΩAr conditions, resulting in full shell calcification in past conditions. Shifting calcification to only the aperture in lower pH and ΩAr in present and near-future conditions could result from energy reallocation under less optimal conditions. By growing larger-sized shells, growth is sustained, while the energetically expensive process of calcification over the complete shell is reduced (Wood et al., 2008). Moreover, an increased proportion of shells in present and near-future conditions did not show any active calcification, suggesting that calcification may cease entirely during energetically more expensive times when exposed to sub-optimal calcification conditions, as reported by Lischka and Riebesell (2012).
To our knowledge, this is the first incubation experiment in which past carbonate chemistry conditions resulted in more active calcification and a larger shell volume of pteropods than present conditions. Two earlier studies also exposed pteropods to past ocean chemistry conditions (Lischka et al., 2011; Manno et al., 2012). In the study of Lischka et al. (2011), Arctic L. helicina did not produce a larger shell diameter in past conditions compared to present conditions, although their study incubated pteropods in seawater with a similar shift in pH from past conditions (pH 8.27 at 3°C) to present conditions (pH 8.12) as in our study. Northern hemisphere L. retroversa from a Norwegian Fjord also showed no difference in calcification (based on shell mass) between pre-industrial conditions (pH 8.2) and present conditions (pH 8.0) (Manno et al., 2012), despite the larger difference in pH (0.2 units) compared to our study (0.13 units). Differences in calcification responses to acidified conditions between southern and northern hemisphere L. retroversa could indicate evolutionary and ecological differences between the two geographically disjunct populations, and might suggest that southern hemisphere L. retroversa are more susceptible to changes in carbonate chemistry than its northern counterpart.
Changing Shell Properties
Shells incubated under past and present conditions increased in weight by 57 and 31%, respectively, compared to the initial shell weight prior to the experiments (Figure 5B). However, shell weight under near-future conditions was similar to the initial weight prior to the experiments. All shells were transparent and SEM images did not reveal dissolution marks (Supplementary Figure 1), suggesting that the low shell weight under near-future conditions was likely not due to dissolution, but rather the result of ceased aragonite deposition. Similar to the 34% lower shell weight that we found in near-future compared to present conditions, Heliconoides inflatus pteropods in the Mediterranean Sea decreased their calcification by 37% when incubated in near-future (pH 7.9) compared to present-day conditions (pH 8.1) for 3 days (Moya et al., 2016). Here, gene-expression analysis showed that genes linked to calcification were upregulated, presumably to counter a further reduction of the calcification rate. A similar finding was recorded for natural populations of North Atlantic L. retroversa, where lower shell condition and upregulation of biomineralization genes was found in response to seasonally lower ΩAr state (Maas et al., 2020). Hence, lower shell weight of sub-Antarctic L. retroversa in near-future conditions likely indicates that the organisms are less able to maintain calcification rates when exposed to more acidified conditions.
In our study, shell density was 31% lower when exposed to acidified near-future conditions. This exceeds the decline in shell density of 15% between samples 91 years apart for Cavolinia inflexa from the Mediterranean Sea, where pH decreased by 0.1 unit (Howes et al., 2017). In our experiment, pH was 0.13 and 0.26 units lower in near-future compared to present and past conditions, respectively, which could account for the more pronounced decline in shell density. Shell thickness remained similar across treatments, whereas shell density and weight were significantly lower in near-future conditions. This indicates that the lower weight and density of L. retroversa in near-future conditions was not caused by thinning of the shells. A similar result was obtained for Creseis acicula and Diacavolina longirostris sampled between 1963 and 2009 along the Australian coast, where porosity increased for both pteropod species as a function of decreased ΩAr, but shell thickness remained the same (Roger et al., 2012). We argue that this could be the result of a change in packing of the aragonite nanofibers, which affects shell density while shell thickness remains unaltered. Corals also produced less dense aragonite under lower pH conditions (Cohen et al., 2009; Holcomb et al., 2009). Here, coral calcification was less dense, as the packing of the aragonite nanofibers was less densely structured. Therefore, analyzing the organization or packing of the aragonite nanocrystals of L. retroversa may give more insight into how shell density changes when pteropods are exposed to more acidified conditions.
In our experiments, shell weight and density of L. retroversa increased significantly under past and present conditions but was similar to T0 for near-future conditions. In contrast, a field study using sediment-traps in the sub-Antarctic Zone over the period from 1997 to 2007 showed that shell weight of L. retroversa became heavier despite a slight decline in pH from 8.13 to 8.08 (Roberts et al., 2014). This may result from factors other than carbonate chemistry conditions, such as an increase in food availability, which could enhance calcification (Howes et al., 2014; Ramajo et al., 2016; Oakes and Sessa, 2020). As pH was considerably lower in the near-future conditions of our study (pH 7.93) and we supplied all three treatments with the same amount of food, changes in carbonate chemistry likely had a more pronounced effect on calcification in our experiments than in Roberts et al. (2014). However, even stronger negative effects of acidified conditions on L. retroversa calcification may have been mitigated by successfully feeding them in the experiments (bright green algae in their stomachs), as previous studies have shown that food shortages can severely suppress the metabolism of pteropods (Maas et al., 2011).
Similar to Moya et al. (2016), we chose a 3-day incubation period to obtain an impression of the effects of different ocean carbonate chemistry scenarios on calcification. Shelled pteropods are notoriously hard to maintain in captivity (Howes et al., 2014), and longer-duration experiments could affect calcification over time through captivity effects (Maas et al., 2018). Our observations of calcein integration are similar to the results of ocean acidification experiments by Lischka et al. (2011), who used a longer incubation period of 29 days. Lischka et al. (2011) sampled Arctic L. helicina in autumn, close to the seasonal cessation of shell growth during winter time. This differs from our study, where juvenile pteropods were sampled in austral spring. According to Dadon and de Cidre (1992), L. retroversa at the Southern Argentinian coast, near the sub-Antarctic, produces two generations per year. The first generation is produced in austral spring, when a rapid increase in size is essential to reach fertility and produce offspring for the second generation in late summer (Dadon and de Cidre, 1992; Seibel et al., 2007). The same applies to L. retroversa in the Gulf of Maine, where the phytoplankton spring bloom is thought to enable rapid growth of the juvenile pteropods (Maas et al., 2020). We mimicked a scenario of high food abundance in our experiments, by successfully feeding the incubated pteropods with microalgae (as shown by bright-green stomach contents and mucous webs) and all pteropods were still swimming lively after 3 days. Hence, under these conditions, incubating pteropods for only a few days appears sufficient to assess their calcification responses.
Impact of Reduced Calcification on the Carbonate Pump
The relocation of active calcification to only the aperture in present and near-future conditions, and the substantially lower amount of precipitated shell in near-future conditions, suggests that L. retroversa has difficulties maintaining calcification under current and increasingly more acidified conditions. Therefore, this study demonstrates a high sensitivity of juvenile L. retroversa to shallow undersaturated conditions projected to emerge in sub-Antarctic waters from 2050 onward (Negrete-García et al., 2019). A decrease of CaCO3 precipitation by the most abundant sub-Antarctic pteropod species would cause a reduction in the amount of CaCO3 formed in surface water and exported to the deep. Since pteropods are major contributors to the carbonate pump in the Southern Ocean (Hunt et al., 2008; Bednaršek et al., 2012b; Manno et al., 2018), reduced calcification of L. retroversa would have a profound impact on the carbonate pump in these waters.
Data Availability Statement
The raw data supporting the conclusions of this article will be made available by the authors, without undue reservation. Micro-CT scans could be obtained on reasonable request. All fluorescence images of shells are available in the Supplementary Information.
Author Contributions
LM, DW-P, and KP designed the study and performed the experiment. LM, GS-R, G-JB, WR, and LD carried out sample preparation and analysis. LM, GS-R, JH, and EL carried out data analysis. All authors contributed to interpretation of the data and writing of the manuscript, and approved the submitted version.
Funding
The Atlantic Meridional Transect is funded by the United Kingdom Natural Environment Research Council through its National Capability Long-term Single Centre Science Program, Climate Linked Atlantic Sector Science (grant number NE/R015953/1). This study contributes to the international IMBeR project and is contribution number 336 of the AMT program. This research was funded by a Vidi grant (016.161351) from the Dutch Research Council (NWO) awarded to KP. This project has received funding from the European Union’s Horizon 2020 Research and Innovation Program under the Marie Skłodowska–Curie grant agreement no 746186 (POSEIDoN, DW-P). LD was supported by the Netherlands Earth System Science Centre (NESSC), grant number: 024.002.001 from the Dutch Ministry of Education, Culture and Science (OCW).
Conflict of Interest
The authors declare that the research was conducted in the absence of any commercial or financial relationships that could be construed as a potential conflict of interest.
Acknowledgments
We are very grateful to the captain, crew, and scientists of cruise DY084/085 (AMT27) on board the RRS Discovery, and to Vassilis Kitidis (Plymouth Marine Laboratory) for discussion on pH changes and carbonate chemistry calculations. We express our gratitude to Matthew Humphreys (NIOZ) for help with PyCO2SYS, Lennart de Nooijer (NIOZ) for arranging usage of instruments at the NIOZ (Texel), and Michele Grego (NIOZ) for his support during fluorescence microscopy. We would also like to thank Bertie Joan van Heuven and Rob Langelaan for their valuable insights and expertise in the lab.
Supplementary Material
The Supplementary Material for this article can be found online at: https://www.frontiersin.org/articles/10.3389/fmars.2021.581432/full#supplementary-material
References
Bates, D., Maechler, M., Bolker, B., and Walker, S. (2015). Fitting linear mixed-effects models using lme4. J. Stat. Softw. 67, 1-48.
Bé, A.W.H. and Gilmer, R.W. (1977). A zoogeographic and taxonomic review of euthecosomatous Pteropoda. Ocean. Micropal. 1, 733–808.
Bednaršek, N., Feely, R.A., Tolimieri, N., Hermann, A.J., Siedlecki, S.A., Waldbusser, G.G., et al. (2017). Exposure history determines pteropod vulnerability to ocean acidification along the US West Coast. Nat. Comm. 7, 1–12.
Bednaršek, N., Tarling, G.A., Bakker, D.C.E., Fielding, S., Jones, E.M., Venables, H.J., et al. (2012a). Extensive dissolution of live pteropods in the southern ocean. Nat. Geosci. 5, 881–885. doi: 10.1038/ngeo1635
Bednaršek, N., Mozina, J., Vogt, M., O’Brien, C., and Tarling, G.A. (2012b). The global distribution of pteropods and their contribution to carbonate and carbon biomass in the modern ocean. Earth Syst. Sci. Data. 4, 167–186. doi: 10.5194/essd-4-167-2012
Bednaršek, N., Feely, R. A., Reum, J. C. P., Peterson, B., Menkel, J., Alin, S. R., et al. (2014). Limacina helicina shell dissolution as an indicator of declining habitat suitability owing to ocean acidification in the California Current Ecosystem. Proc. R. Soc. B 281:20140123. doi: 10.1098/rspb.2014.0123
Bernard, K.S. and Froneman, P.W. (2009). The sub-Antarctic euthecosome pteropod, Limacina retroversa: distribution patterns and trophic role. Deep-Sea Res. I 56, 582–598. doi: 10.1016/j.dsr.2008.11.007
Boysenennen, E., Hagen, W., Hubold, G., and Piatkowski, U. (1991). Zooplankton biomass in the ice-covered Weddell Sea, Antarctica. Mar. Biol. 111, 227–235. doi: 10.1007/bf01319704
Buitenhuis, E. T., Le Quéré, C., Bednaršek, N. and Schiebel, R. (2019). Large contribution of pteropods to shallow CaCO3 export. Glob. Biogeochem. Cycles 33, 458-468.
Caldeira, K., and Wickett, M.E. (2003). Anthropogenic carbon and ocean pH. Nature 425:365. doi: 10.1038/425365a
Cohen, A.L., McCorkle, D.C., de Putron, S., Gaetani, G.A., and Rose, K.A. (2009). Morphological and compositional changes in the skeletons of new coral recruits reared in acidified seawater: Insights into the biomineralization response to ocean acidification. Geochem. Geophys. Geosyst. 10:Q07005.
Collier, R., Dymond, J., Honjo, S., Manganini, S., Francois, R., and Dunbar, R. (2000). The vertical flux of biogenic and lithogenic material in the Ross Sea: moored sediment trap observations 1996–1998. Deep Sea Res. Part II 47, 3491–3520. doi: 10.1016/s0967-0645(00)00076-x
Comeau, S., Gorsky, G., Jeffree, R., Teyssie, J.L. and Gattuso, J.P. (2009). Impact of ocean acidification on a key Arctic pelagic mollusc (Limacina helicina). Biogeosciences 6, 1877–1882. doi: 10.5194/bg-6-1877-2009
Dadon, J.R. and de Cidre, L.L. (1992). The reproductive cycle of the Thecosomatous pteropod Limacina retroversa in the western South Atlantic. Mar. Biol. 114, 439–442. doi: 10.1007/bf00350035
Dickson, A. G. (1990). Thermodynamics of the dissociation of boric acid in synthetic seawater from 273.15 to 318.15 K. Deep Sea Res. Part A. 37, 755–766. doi: 10.1016/0198-0149(90)90004-f
Doney, S. C., Fabry, V. J., Feely, R. A., and Kleypas, J. A. (2009). Ocean acidification: the other CO2 problem. Ann. Rev. Mar. Sci. 1, 169-192.
Fabry, V. J. (1990). Shell growth rates of pteropod and heteropod molluscs and aragonite production in the open ocean: implications for the marine carbonate system. J. Mar. Res. 48, 209–222. doi: 10.1357/002224090784984614
Fabry, V. J., Seibel, B. A., Feely, R. A., and Orr, J. C. (2008). Impacts of ocean acidification on fauna and ecosystem processes. ICES J. Mar. Sci. 65, 414–432. doi: 10.1093/icesjms/fsn048
Fabry, V.J., McClintock, J.B., Mathis, J.T. and Grebmeier, J.M. (2009). Ocean acidification at high latitudes: the bellwether. Oceanography 22, 160–171. doi: 10.5670/oceanog.2009.105
Fallet, U., Boer, W., van Assen, C., Greaves, M., and Brummer, G. J. A. (2009). A novel application of wet oxidation to retrieve carbonates from large organic−rich samples for ocean−climate research. Geochem. Geophys. Geosyst. 10:Q08004.
Feely, R.A., Sabine, C.L., Hernandez-Ayon, J.M. and Ianson, D. & Hales, B. (2008). Evidence for upwelling of corrosive “acidified” water onto the continental shelf. Science 320, 1490–1492. doi: 10.1126/science.1155676
Feely, R.A., Sabine, C.L., Lee, K., Berelson, W., Kleypas, J., Fabry, V.J., and Millero, F.J. (2004). Impact of anthropogenic CO2 on the CaCO3 system in the oceans. Science 305, 362–366. doi: 10.1126/science.1097329
Gardner, J., Manno, C., Bakker, D.C.E., Peck, V.L., and Tarling, G.A. (2018). Southern Ocean pteropods at risk from ocean warming and acidification. Mar. Biol. 165:8. doi: 10.1007/s00227-017-3261-3
Gazeau, F., Quiblier, C., Jansen, J. M., Gattuso, J.-P., Middelburg, J. J. and Heip, C. H. R. (2013). Impacts of ocean acidification on marine shelled molluscs. Mar. Biol. 160, 2207-2245Google Scholar
Gruber, N., Clement, D., Carter, B.R., Feely, R.A., Van Heuven, S., Hoppema, M., et al. (2019). The oceanic sink for anthropogenic CO2 from 1994 to 2007. Science 363, 1193-1199.
Hartin, C.A., Bond-Lamberty, B. and Patel, P. & Mundra, A. (2016). Ocean acidification over the next three centuries using a simple global climate carbon-cycle model: projections and sensitivities. Biogeosciences 13, 4329–4342. doi: 10.5194/bg-13-4329-2016
Hauri, C. and Friedrich, T. & Timmermann, A. (2016). Abrupt onset and prolongation of aragonite undersaturation events in the southern ocean. Nat. Clim. Change 6, 172–176. doi: 10.1038/nclimate2844
Hoegh-Guldberg, O., Mumby, P.J., Hooten, A.J., Steneck, R.S., Greenfield, P., Gomez, E., et al. (2007). Coral reefs under rapid climate change and ocean acidification. Science 318, 1737–1742.
Holcomb, M., Cohen, A.L., Gabitov, R.I., and Hutter, J.L. (2009). Compositional and morphological features of aragonite precipitated experimentally from seawater and biogenically by corals. Geochim. Cosmochim. Acta. 73, 4166–4179. doi: 10.1016/j.gca.2009.04.015
Holligan, P.M., & Robertson, J.E. (1996). Significance of ocean carbonate budgets for the global carbon cycle. Global Change Biol. 2, 85-95.
Honjo, S. (2004). Particle export and the biological pump in the southern ocean. Antarct. Sci. 16, 501–516. doi: 10.1017/s0954102004002287
Hopkins, T.L. (1987). Midwater food web in McMurdo sound, ross sea, antarctica. Mar. Biol. 89, 197–212.
Howes, E.L., Bednaršek, N., Büdenbender, J., Comeau, S., Doubleday, A., Gallager, S. M., et al. (2014). Sink and swim: a status review of thecosome pteropod culture techniques, J. Plankton Res. 36, 299–315. doi: 10.1093/plankt/fbu002
Howes, E.L., Eagle, R.A., Gattuso, J.P., and Bijma, J. (2017). Comparison of Mediterranean pteropod shell biometrics and ultrastructure from historical (1910 and 1921) and present day (2012) samples provides baseline for monitoring effects of global change. PLoS One 12:e0167891. doi: 10.1371/journal.pone.0167891
Humphreys, M.P., Gregor, L., Pierrot, D., van Heuven, S.M.A.C., Lewis, E., and Wallace, D.W.R. (2020). PyCO2SYS: marine carbonate system calculations in Python. Version 1.3.0. Zenodo.
Hunt, B.P.V., Pakhomov, E.A., Hosie, G.W., Siegel, V., Ward, P., and Bernard, K. (2008). Pteropods in southern ocean ecosystems. Prog. Oceanogr. 78, 193–221. doi: 10.1016/j.pocean.2008.06.001
Hunt, B.P.V., Pakhomov, E.A. and Trotsenko, B.G. (2007). The macrozooplankton of the cosmonaut sea, east antarctica (30 degrees E-60 degrees E), 1987–1990. Deep-Sea Res. Part I 54, 1042–1069. doi: 10.1016/j.dsr.2007.04.002
Kitidis, V., Brown, I., Hardman-Mountford, N. and Lefèvre, N. (2017). Surface ocean carbon dioxide during the Atlantic Meridional Transect (1995–2013); evidence of ocean acidification. Prog. Oceanogr. 158, 65–75. doi: 10.1016/j.pocean.2016.08.005
Kroeker, K. J., Kordas, R. L., Crim, R., Hendriks, I. E., Ramajo, L., Singh, G. S., et al. (2013). Impacts of ocean acidification on marine organisms: quantifying sensitivities and interaction with warming, Glob. Change Biol. 19, 1884–1896. doi: 10.1111/gcb.12179
Le Quéré, C., Moriarty, R., Andrew, R.M., Peters, G.P., Ciais, P., Friedlingstein, P., et al. (2015). Global carbon budget 2014. Earth System Science Data 7, 47–85.
Lischka, S., Büdenbender, J., Boxhammer, T. and Riebesell, U. (2011). Impact of ocean acidification and elevated temperatures on early juveniles of the polar shelled pteropod Limacina helicina: mortality, shell degradation, and shell growth. Biogeosciences 8, 919–932. doi: 10.5194/bg-8-919-2011
Lischka, S. and Riebesell, U. (2012). Synergistic effects of ocean acidification and warming on overwintering pteropods in the Arctic. Glob. Change Biol. 18, 3517–3528. doi: 10.1111/gcb.12020
Maas, A.E., Elder, L. E., Dierssen, H. M., and Seibel, B. A. (2011). Metabolic response of Antarctic pteropods (Mollusca: Gastropoda) to food deprivation and regional productivity. Mar. Ecol. Prog. Ser. 441, 129–139. doi: 10.3354/meps09358
Maas, A.E., Lawson, G.L., Bergan, A.J., and Tarrant, A.M. (2018). Exposure to CO2 influences metabolism, calcification, and gene expression of the thecosome pteropod Limacina retroversa. J. Exp. Biol. 13, 221.
Maas, A.E., Lawson, G.L., Bergan, A.J., Wang, Z.A. and Tarrant, A.M. (2020). Seasonal variation in physiology and shell condition of the pteropod Limacina retroversa in the Gulf of Maine relative to life cycle and carbonate chemistry. Prog. Oceanogr. 186:102371. doi: 10.1016/j.pocean.2020.102371
Manno, C., Bednaršek, N., Tarling, G.A., Peck, V.L., Comeau, S., Adhikari, D., et al. (2017). Shelled pteropods in peril: assessing vulnerability in a high CO2 ocean. Earth Sci. Rev. 169, 132–145. doi: 10.1016/j.earscirev.2017.04.005
Manno, C., Giglio, F., Stowasser, G., Fielding, S., Enderlein, P., and Tarling, G.A. (2018). Threatened species drive the strength of the carbonate pump in the northern Scotia Sea. Nat. Comm. 9, 4592.
Manno, C., Morata, N., and Primicerio, R. (2012). Limacina retroversa’s response to combined effects of ocean acidification and sea water freshening. Estuar. Coast. Shelf S., 113, 163–171. doi: 10.1016/j.ecss.2012.07.019
Manno, C., Peck, V.L. and Tarling, G.A. (2016). Pteropod eggs released at high pCO2 lack resilience to ocean acidification. Sci. Rep. 6:e25752.
Mekkes, L., Renema, W., Bednaršek, N., Alin, S.R., Feely, R.A. and Huisman, J. et al. (2021). Pteropods make thinner shells in the upwelling region of the California Current Ecosystem. Sci. Rep. 11, 1731.
Millero, F.J., Pierrot, D., Lee, K., Wanninkhof, R., Feely, R. and Sabine, C.L. et al. (2002). Dissociation constants for carbonic acid determined from field measurements. Deep-Sea Res. Part I 49, 1705–1723. doi: 10.1016/s0967-0637(02)00093-6
Moy, A.D., Howard, W.R., Bray, S.G., and Trull, T.W. (2009). Reduced calcification in modern southern ocean planktonic foraminifera. Nat. Geosci. 2, 276–280. doi: 10.1038/ngeo460
Moya, A., Howes, E.L., Lacoue-Labarthe, T., Forêt, S., Hanna, B., Medina, M., et al. (2016). Near-future pH conditions severely impact calcification, metabolism and the nervous system in the pteropod Heliconoides inflatus. Glob. Chang. Biol. 22, 3888–3900. doi: 10.1111/gcb.13350
Negrete-García, G., Lovenduski, N. S., Hauri, C., Krumhardt, K. M., and Lauvset, S. K. (2019). Sudden emergence of a shallow aragonite saturation horizon in the Southern Ocean. Nat. Clim. Change 9, 313–317. doi: 10.1038/s41558-019-0418-8
Oakes, R. and Sessa, J. (2020). Determining how biotic and abiotic variables affect the shell condition and parameters of Heliconoides inflatus pteropods from a sediment trap in the Cariaco Basin. Biogeosciences 17, 1975–1990. doi: 10.5194/bg-17-1975-2020
Oksanen, J., Blanchet, F.G., Friendly, M., Kindt, R., Legendre, P., McGlinn, D., et al. (2018). Vegan: Community Ecology Package. R package version 2.5-2.
Orr, J.C., Fabry, V.J., Aumont, O., Bopp, L., Doney, S.C. and Feely, R.A. et al. (2005). Anthropogenic ocean acidification over the twenty-first century and its impact on calcifying organisms. Nature 437, 681–686. doi: 10.1038/nature04095
Orsi, A.H., Whitworth, T., and Nowlin, W.D. (1995). On the meridional extent and fronts of the antarctic circumpolar current. Deep-Sea Res. Part I 42, 641–673. doi: 10.1016/0967-0637(95)00021-w
R Core Team (2018). R: A Language and Environment for Statistical Computing. Vienna: R Foundation for Statistical Computing. https://www.R-project.org/
Ramajo, L., Pérez-León, E., Hendriks, I.E., Marba, N., Krause-Jensen, D., Sejr, M.K., et al. (2016). Food supply confers calcifiers resistance to ocean acidification. Sci. Rep. 6:19374.
Riebesell, U. and Körtzinger, A., & Oschlies, A. (2009). Sensitivities of marine carbon fluxes to ocean change. P. Natl. Acad. Sci. USA 106, 20602-20609.
Riebesell, U., Zondervan, I., Rost, B., Rotell, P. D., Zeebe, R. E., and Morel, F. M. M. (2000). Reduced calcification of marine plankton in response to increased atmospheric CO2. Nature 407, 364–367. doi: 10.1038/35030078
Roberts, D., Howard, W.R., and Roberts, J.L. (2014). Diverse trends in shell weight of three Southern Ocean pteropod taxa collected with Polar Frontal Zone sediment traps from 1997 to 2007. Polar Biol. 37, 1445–1458. doi: 10.1007/s00300-014-1534-6
Roger, L.M., Richardson, A.J., McKinnon, A.D., Knott, B., Matear, R., and Scadding, C. (2012). Comparison of the shell structure of two tropical Thecosomata (Creseis acicula and Diacavolinia longirostris) from 1963 to 2009: potential implications of declining aragonite saturation. ICES J. Mar. Sci. 69, 465–474. doi: 10.1093/icesjms/fsr171
Seibel, B.A., Dymowska, A., and Rosenthal, J. (2007). Metabolic temperature compensation and coevolution of locomotory performance in pteropod molluscs. Integr. Comp. Biol. 47, 880–891. doi: 10.1093/icb/icm089
Seibel, B.A., Maas, A.E., and Dierssen, H.M. (2012). Energetic plasticity underlies a variable response to ocean acidification in the pteropod, Limacina helicina antarctica. PLoS One 7:e30464 doi: 10.1371/journal.pone.0030464
Stoll, M.H.C., Bakker, K., Nobbe, G.H., and Haese, R.R. (2001). Continuous-flow analysis of dissolved inorganic carbon content in seawater. Anal. Chem. 73, 4111–4116. doi: 10.1021/ac010303r
Waldbusser, G.G., Hales, B., Langdon, C.J., Haley, B.A., Schrader, P., Brunner, E.L., et al. (2015). Saturation-state sensitivity of marine bivalve larvae to ocean acidification. Nat. Clim. Change 5, 273–280. doi: 10.1038/nclimate2479
Wood, H. L., Spicer, J. I., and Widdicombe, S. (2008). Ocean acidification may increase calcification rates, but at a cost. Proc. Roy. Soc. Lond. B 275, 1767–1773. doi: 10.1098/rspb.2008.0343
Keywords: pteropods, ocean acidification, micro-CT, calcein, calcification, sub-Antarctic zone
Citation: Mekkes L, Sepúlveda-Rodríguez G, Bielkinaitė G, Wall-Palmer D, Brummer G-JA, Dämmer LK, Huisman J, van Loon E, Renema W and Peijnenburg KTCA (2021) Effects of Ocean Acidification on Calcification of the Sub-Antarctic Pteropod Limacina retroversa. Front. Mar. Sci. 8:581432. doi: 10.3389/fmars.2021.581432
Received: 08 July 2020; Accepted: 08 February 2021;
Published: 02 March 2021.
Edited by:
Clara Manno, British Antarctic Survey (BAS), United KingdomReviewed by:
Silke Lischka, GEOMAR Helmholtz Center for Ocean Research Kiel, GermanyVicky Peck, British Antarctic Survey (BAS), United Kingdom
Copyright © 2021 Mekkes, Sepúlveda-Rodríguez, Bielkinaitė, Wall-Palmer, Brummer, Dämmer, Huisman, van Loon, Renema and Peijnenburg. This is an open-access article distributed under the terms of the Creative Commons Attribution License (CC BY). The use, distribution or reproduction in other forums is permitted, provided the original author(s) and the copyright owner(s) are credited and that the original publication in this journal is cited, in accordance with accepted academic practice. No use, distribution or reproduction is permitted which does not comply with these terms.
*Correspondence: Lisette Mekkes, bGlzZXR0ZW1la2tlc0BnbWFpbC5jb20=; Katja T. C. A. Peijnenburg, ay50LmMuYS5wZWlqbmVuYnVyZ0B1dmEubmw=