Abstract
We have developed an approach that connects a complex and widely used scientific ecosystem modeling approach with a game engine for real-time communication and visualization of scientific results. The approach, OceanViz, focuses on communicating scientific data to non-scientific audiences to foster dialogue, offering experimental, immersive approaches to visualizing complex ecosystems whilst avoiding information overload. Within the context of ecosystem-based fisheries management, OceanViz can engage decision makers into the implicit operation of scientific software as an aid during the decision process, and it can be of direct use for public communication through appealing and informative visualizations. Beside a server-client architecture to centralize decision making around an ecosystem model, OceanViz includes an extensive visualization toolkit capable of accurately reflecting marine ecosystem changes through a simulated three-dimensional (3D) underwater environment. Here we outline the ideas and concepts that went into OceanViz, its implementation and its related challenges. We reflect on challenges to scientific visualization and communication as food-for-thought for the marine ecosystem modeling community and beyond.
Introduction
Marine environmental sciences aim to sustain human societies and the oceans on which they rely. An effective way of doing so is through influencing policy changes, but policies are not changed purely by printing out scientific statements on plausible future scenarios. Rather, they are facilitated by involving concerned parties into a dialog that builds on the scientific data gathered and the predictions made possible through scientific analyses and models (Giebels et al., 2020).
Ecosystem models are increasingly used for policy advice (e.g., Heymans et al., 2020), but their operation is challenging for non-experts, while model results represent abstractions of reality in numbers, which are difficult to comprehend by non-specialists. Although complex scientific data communication can be made more efficient through careful design and the use of standardized and informative indicators (Kelleher and Wagener, 2011; Coll and Steenbeek, 2017; Böttinger et al., 2020), there are inherent communication problems that call for the use of a more processed form of scientific findings (Georgescu et al., 2019; Walling and Vaneeckhaute, 2020).
The huge advances in technology and software usability brought about by video games have opened a wide range of opportunities for initiatives outside the gaming realm. Video games have become an integral part of modern life, surpassing the combined worth of the movie and music industry (BBC News, 2019). Gaming has helped develop and expand different approaches to involving science in decision-making processes, including the area of particular interest for our research: serious gaming (Ritterfeld et al., 2009; Georgescu et al., 2019). In serious games, the primary focus is not purely on amusement, but on exposing the participant to some form of knowledge through the use of explicit educational experiences, multi-media, and entertainment (Laamarti et al., 2014). They harbor multiple elements that lend itself for scientific outreach, communication, and stakeholder involvement, and in particular, for ecosystem management (Madani et al., 2017).
Managing ecosystems is a daunting task, which requires identifying trade-offs and finding compromises between often-conflicting interests regarding ecology, economy, and politics. Environmental Decisions Support Systems (EDSS) are systematic tools to aid the decision process in support of management-related decision-making. For EDSS to be efficient in the decision-making process, they have to be credible from a scientific perspective (Bennett et al., 2013), which is a niche for ecosystem models (Heymans et al., 2020). A particular challenge to this inclusion is the need to obtain and communicate results in forms that facilitates adoption by stakeholders (McIntosh et al., 2011). Audiences must thus be able to explore problem spaces in their specific domains of knowledge without having to worry about the interaction with, and parameterization of, underlying scientific models. Additionally, a wide range of model results must be translated to a condensed set of intuitive indicators that match audience terminology and visuals (e.g., Walling and Vaneeckhaute, 2020). Translating scientific data to target audiences is a science in itself (e.g., Anderson et al., 1983) that requires discussions far beyond the scope of this paper. The aspects that we deemed most important for bringing modeling to non-modeler audiences are (i) limit information overload (Walters, 1986); and (ii) immersion (Wang et al., 2019).
Information overload occurs when audiences lose track of overarching questions due to exposure to too many details that may not be relevant to them, which a mistake is easily made when exposing non-modelers to the plethora of details that ecosystem models produce. Reducing information overload thus requires providing possible stakeholders, from different backgrounds, with just the information that they need to make informed decisions (Walters, 1986). Immersion refers to the use of animated virtual realities that appeal to the hedonic value of seeing an ecosystem as it is rather than having to interpret the state of an ecosystem through graphs and charts. Emotional experiences are an essential part of our ability to engage and learn (Wang et al., 2019), and can add a fundamental dimension to the decision process.
There are a few examples that use immersive 3D underwater visualizations to convey marine ecosystems. Games such as ABZÛ (Giant Squid, 2015) the Subnautica franchise (Unknown Worlds, 2020), and collaborative digital art projects such as theBlu (WEVR, 2020), allow participants to explore different habitats and meet different species in thriving virtual underwater worlds. Although none of these visualizations have scientific models behind it, they have a clear aim to strike emotional connections between audiences and a virtual world. The recently released Virtual Ecosystem Scenario Viewer (VES-V; NOAA Fisheries, 2020) of the National Oceanic and Atmospheric Administration (NOAA) visualizes empirical ecosystem data and model output in 3D via the Internet.
The inclusion of ecosystem models into an EDSS also creates the opportunity to provide estimates whether elected management options will stand the test of time, especially when considering climate variability (Heymans et al., 2020). This we see as an essential feature that most present-day EDSS fail to capitalize on. For instance, none of the operational decision support tools for Maritime Spatial Planning (MSP) reviewed in Pınarbaşı et al. (2017) can perform any form of forecasting. If EDSS cannot present users with plausible short- and long-term implications of potential planning decisions under, for instance, variations in climate, the ability to make reasonable decisions about future ecosystems is limited. To our best knowledge, the recently released MSP Challenge (Mayer et al., 2014; Steenbeek et al., 2020) is the only simulation platform that merges gamified policy exploration with scientific forecasting, but even this powerful platform is lacking the ability to include climate variability.
OceanViz was conceptualized under the pioneering OceanSummits approach (Christensen and Lai, 2011) to address the challenges listed above under a fisheries management context. It was based on two interlinked problem-solving cycles (Figure 1): stakeholder and expert consultation in the decision-making process leads to the collaborative development of an ecosystem model, the definition of various thresholds, and the identification of plausible management options. The ecosystem model must be able to assess the combined impacts of ecosystem dynamics, fisheries management, and climate change. Collaborative modeling sessions take these inputs to explore how policy decisions may affect the ecosystem and derived ecosystem services with the use of the OceanViz software, which provides invaluable input to the decision making process (Christensen and Lai, 2011).
FIGURE 1
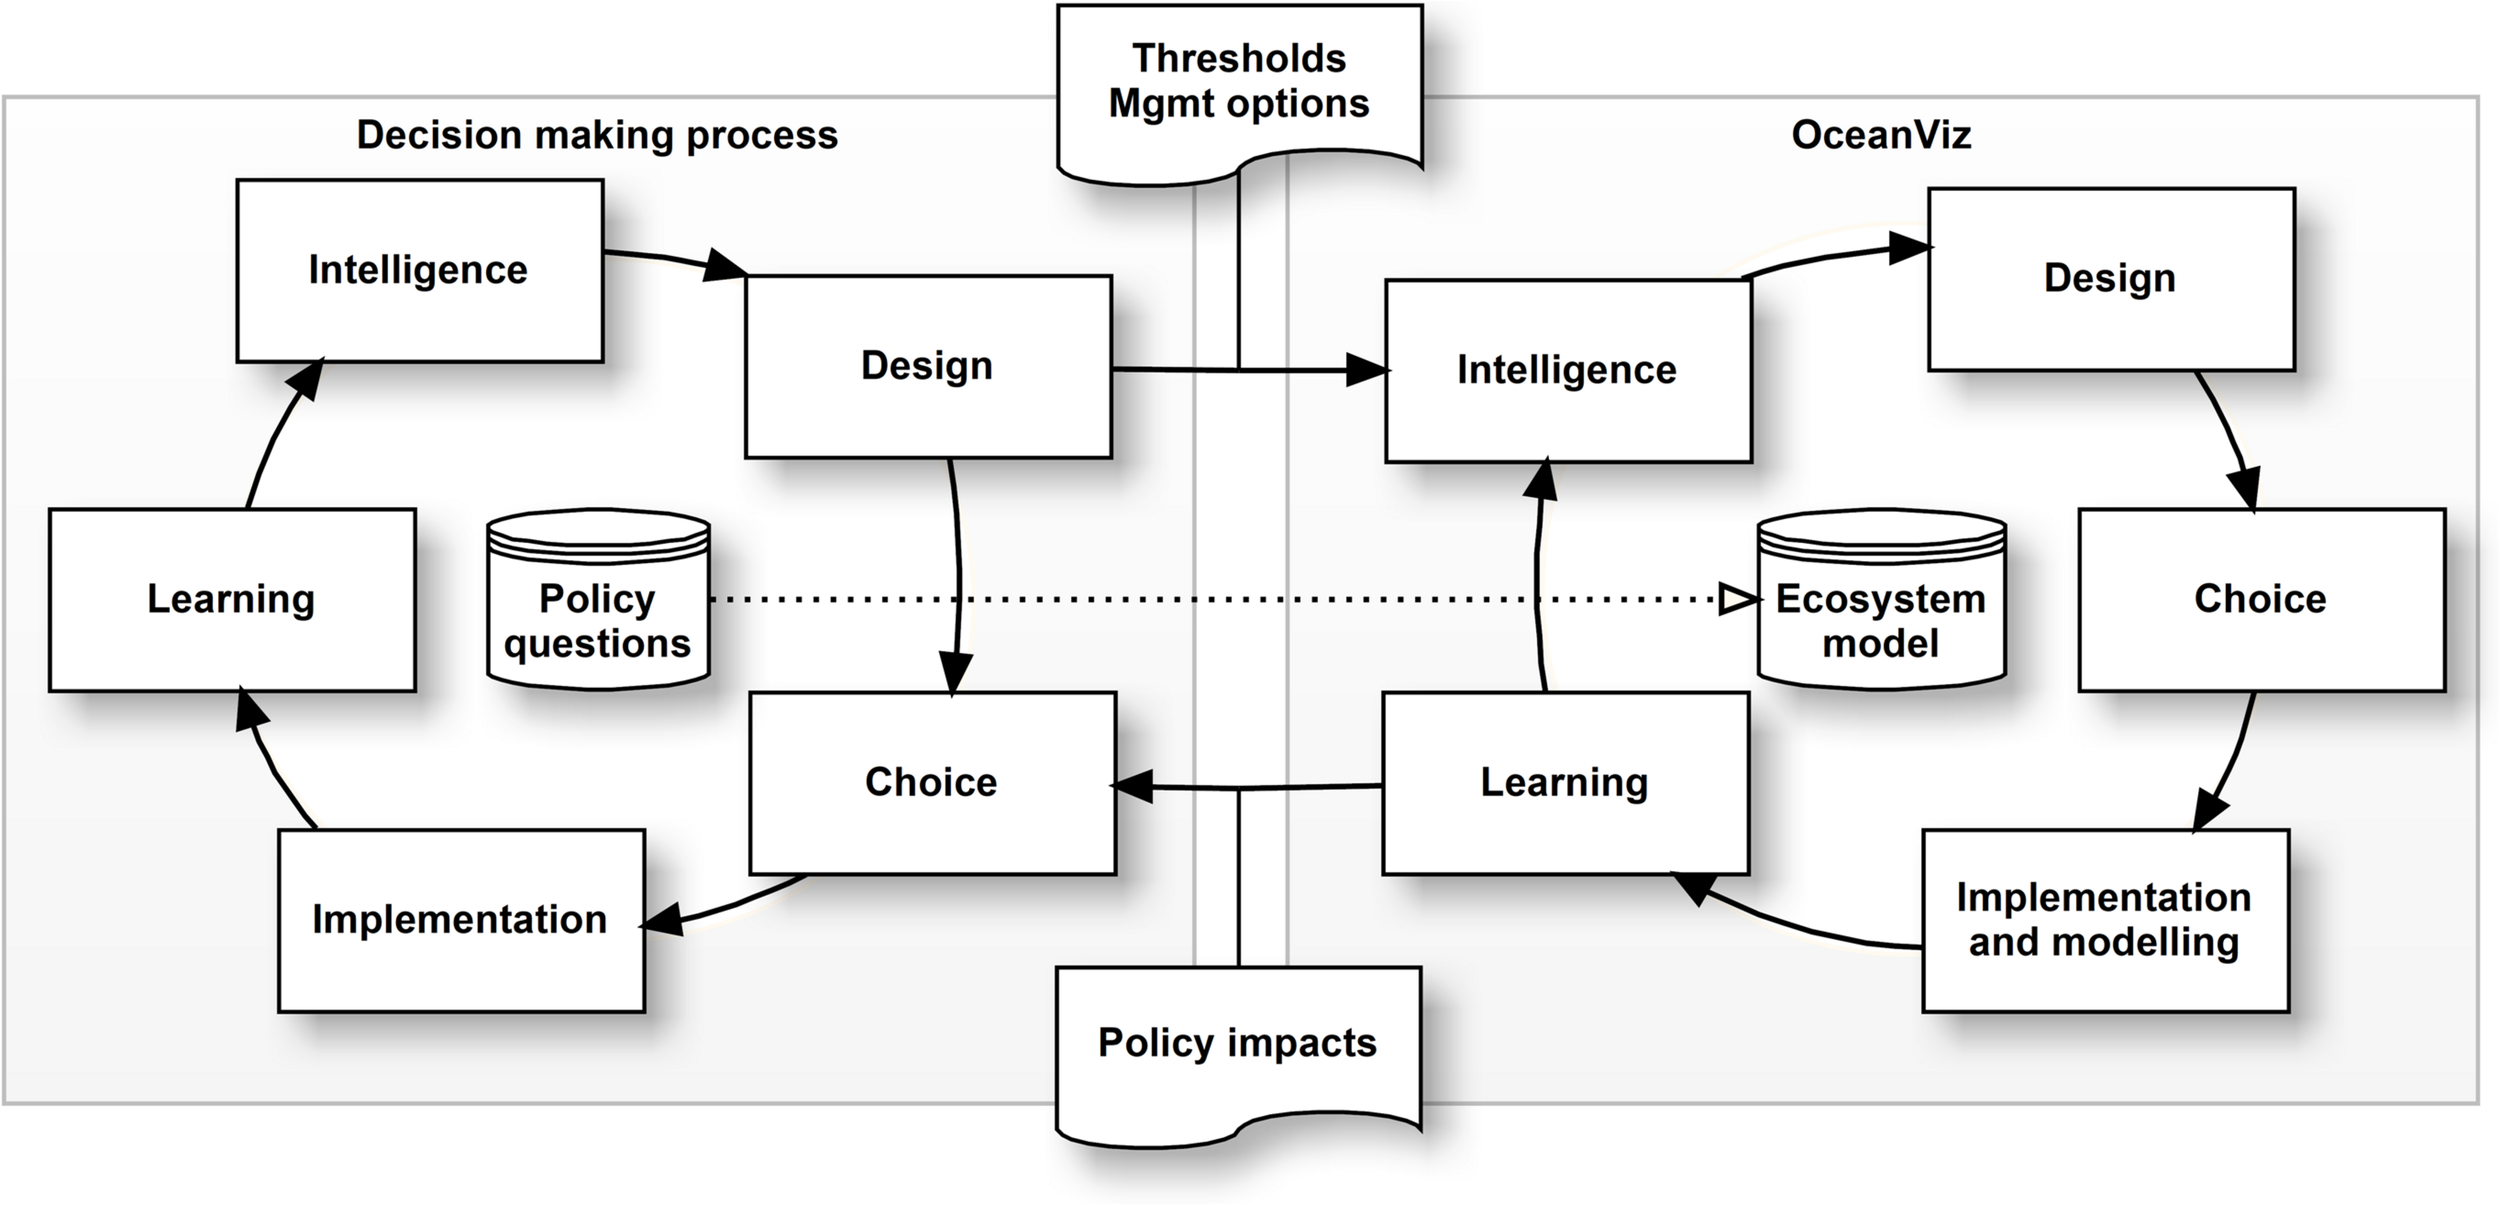
The flow of OceanViz within a decision making process.
This paper focuses on how we constructed OceanViz as a “virtual field trip” into a simulated 3D underwater environment in flux, that, through a direct link with an ecosystem model, allowing exploration of long-term impacts of fisheries management actions (Christensen and Lai, 2011).
Materials and Methods
The OceanViz software consists of three parts: (i) the ecological model, (ii) the client/server system, and (iii) the data visualizations.
Ecological Model
We connected OceanViz to Ecopath with Ecosim (EwE), the world’s most used ecosystem modeling approach to represent aquatic ecosystems (Christensen and Walters, 2004). EwE consists of three main components: Ecopath – a static, mass-balanced snapshot of the ecosystem (Christensen and Pauly, 1992); Ecosim – a time dynamic simulation module for policy exploration (Walters et al., 2000; Ahrens et al., 2012); and Ecospace – a spatial and temporal dynamic module designed for exploring the impact of fishing and environmental change (Walters et al., 1999; Christensen et al., 2014). The EwE approach is widely used to address ecological questions, evaluate ecosystem effects of fishing, explore management policy options, analyze impact, and placement of marine protected areas, model the combined effect of environmental changes, and combinations of the above (Coll et al., 2015; Colléter et al., 2015). EwE is most known as a desktop software for the Windows platform, but it is in fact an ecosystem model-building toolkit written in .NET and can be extended through plugins (Steenbeek et al., 2016). Additionally, EwE is an open-source approach built and supported through a global scientific community. Because of its capabilities, versatility, global reach, and accessible coding structure, the EwE approach was used to drive the ecosystem dynamics in OceanViz. In this manuscript, OceanViz utilizes the capabilities of the temporal-dynamic module Ecosim of the EwE approach.
The Client/Server System
To facilitate group discussions around a central ecosystem model, we developed a client/server system. The server component hosts the ecological model, which dispatches ecological results to the various client components, and accepts input from the client components that are integrated into the ecological model. This design allows any number of human participants to interact through the OceanViz clients with the shared ecosystem model on the OceanViz server, thus building a shared understanding of ecological impacts.
Data Visualizations
The 3D visualizations were developed as an immersive virtual environment to display model simulation results, but also as an interactive aquarium that can be explored on its own. Different scenes in OceanViz were modeled using photos and expert advice. The abundance of the different species was derived from the biomasses in the ecological model as delivered by the client software.
In order to populate the 3D visualizations with the data from the model, we initially focused on visualizing the hundred most exploited or iconic species in the world ocean (Figure 2A shows an example of the library built under OceanViz), and additional species can be added with relative ease. Represented species were built as 3D models using photographs and measurements for guidance. For instance, the fish baseline sizes were obtained through FishBase (Froese and Pauly, 2010). The visualizations followed performance requirements of computer games, leaning toward the construction of 3D meshes with low polygon counts. In average, fish models have around 300 polygons or faces (Figure 2B).
FIGURE 2
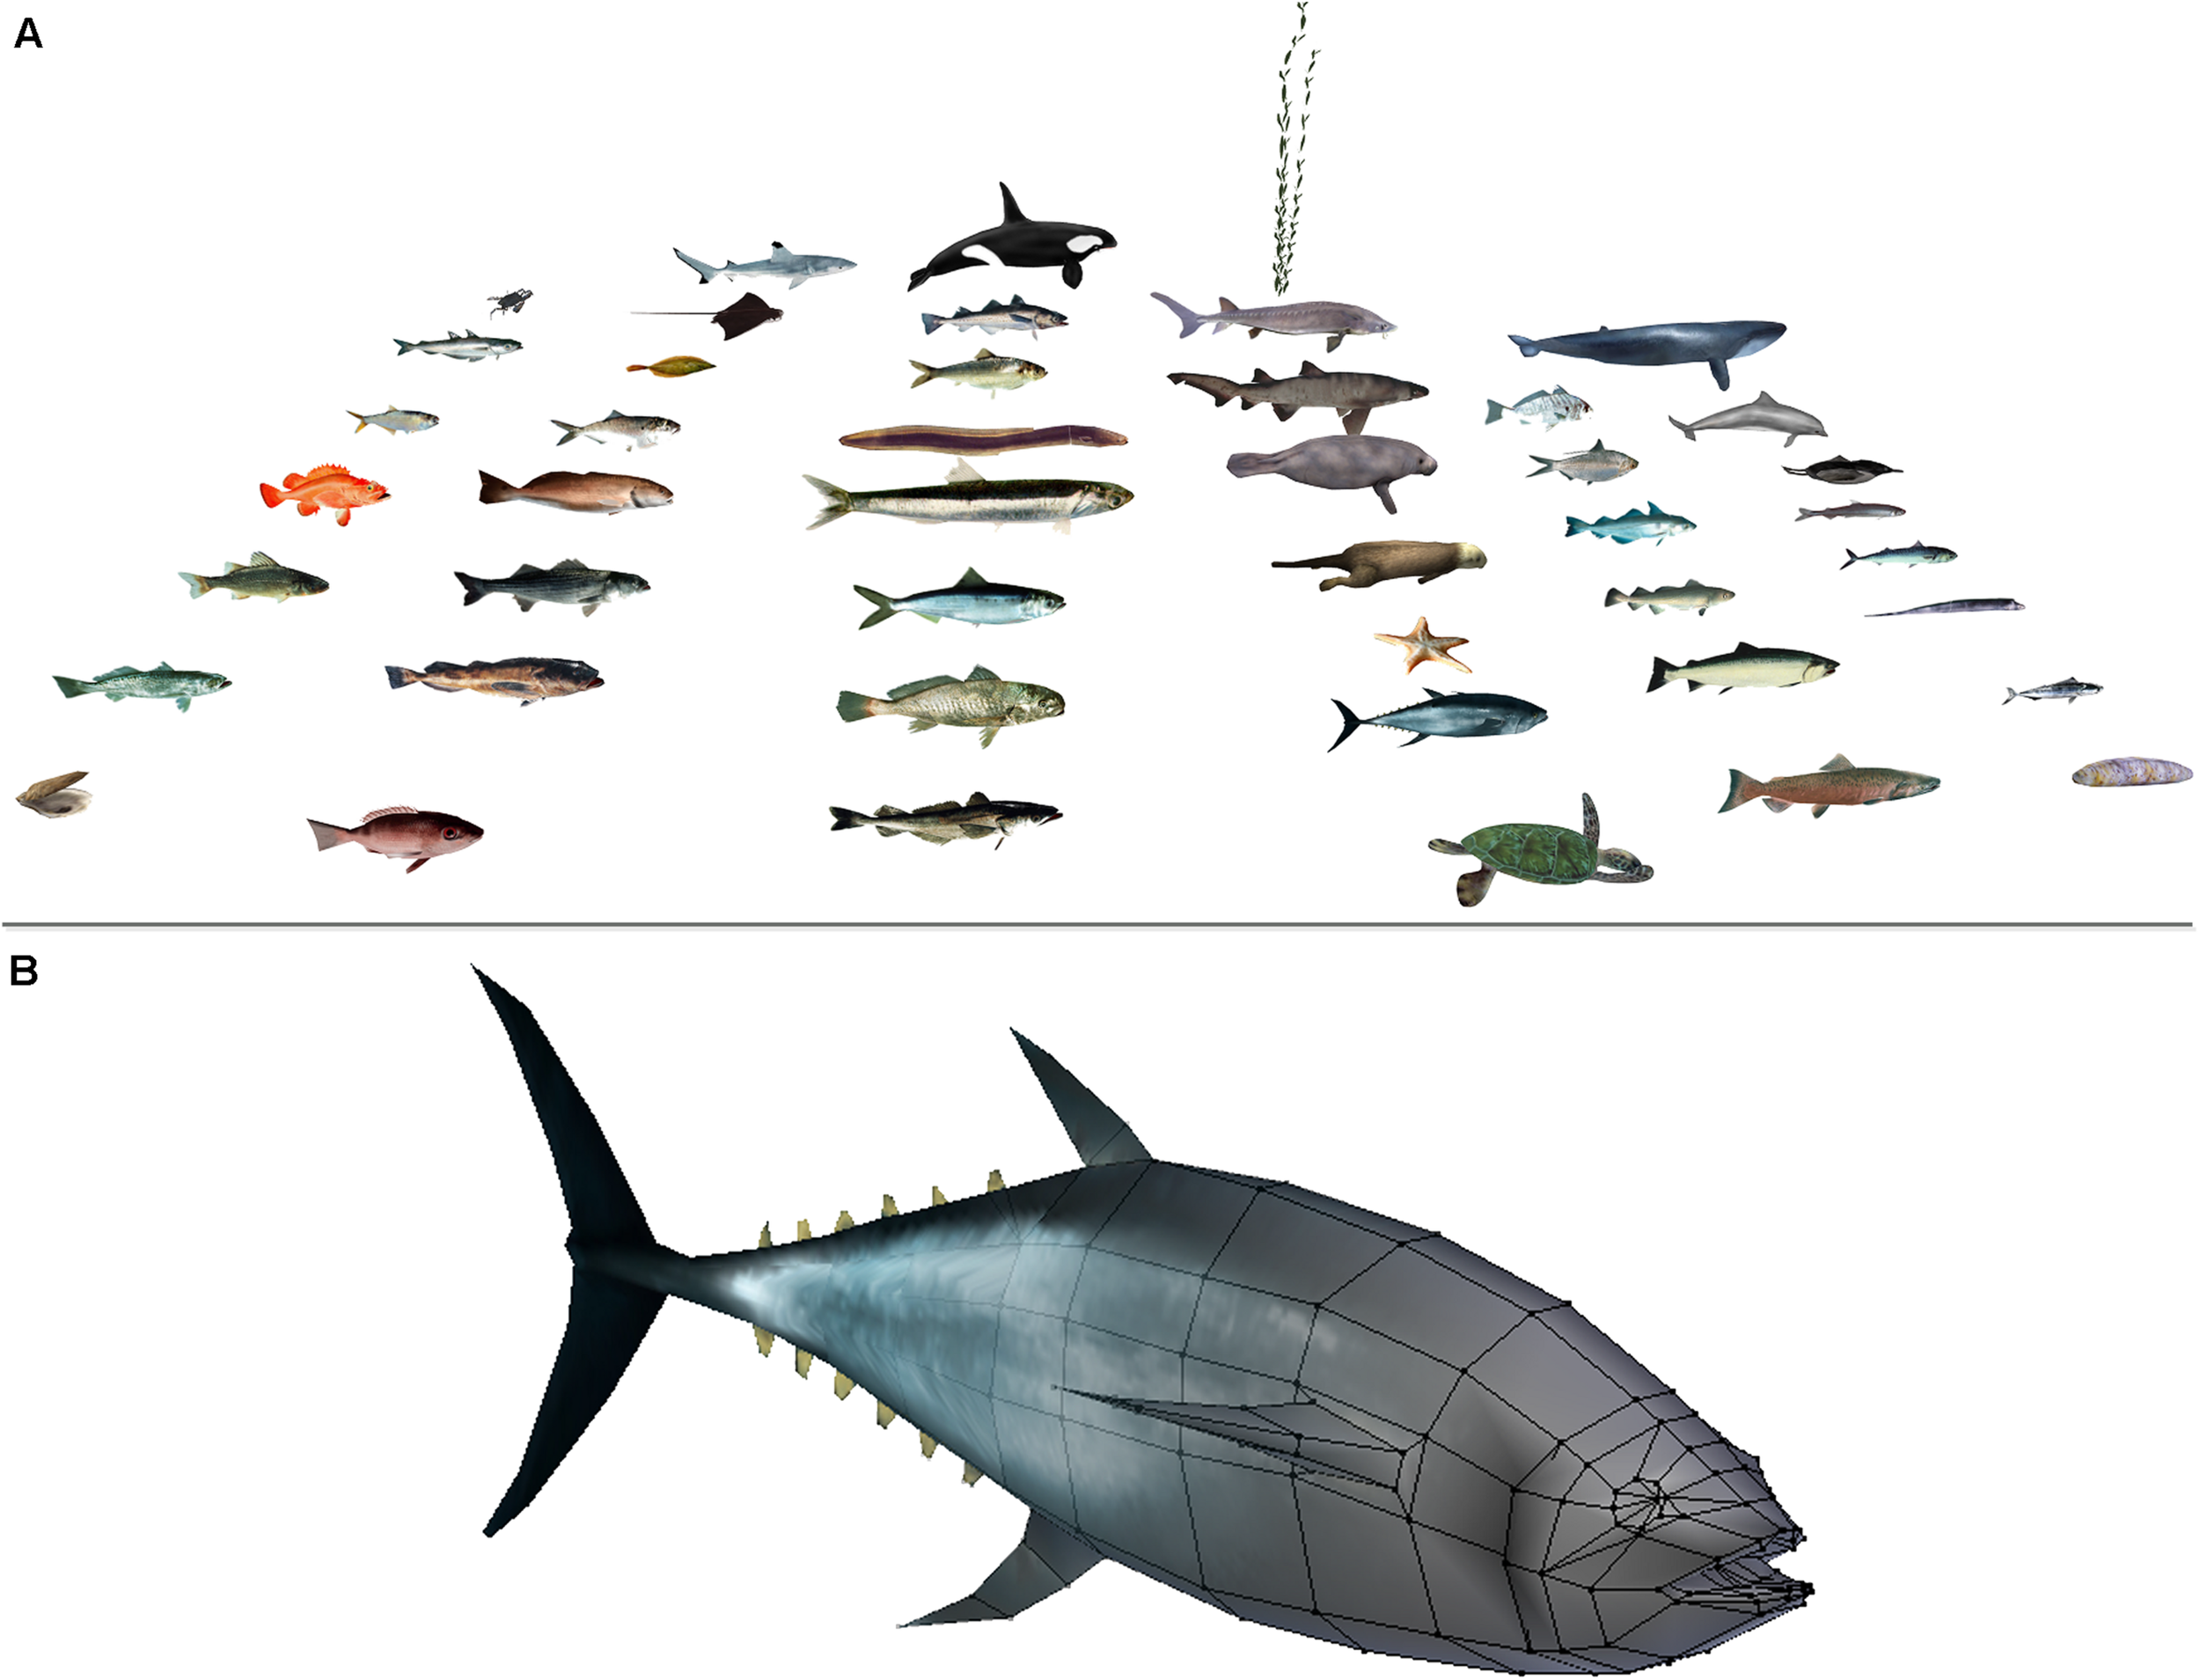
An overview of some of the 3D assets used in OceanViz (A), and a detailed view of a 3D model of a Pacific Bluefin Tuna, Thunnus Orientalis(B). The underlying wireframe is partially shown to demonstrate that reduced use of polygons can still yield convincing 3D models.
The visualization module was developed using the freely available Blender Game Engine. Blender is a 3D content creation suite, available for all major operating systems under the GNU General Public License (Blender Foundation, 2020). Blender is a powerful modeling, rendering, and animation platform, also including real-time and gaming engine capabilities (Felinto and Pan, 2013). This includes a full physics engine, collision detection, dynamic constraints, real-time shadows, support for the OpenGL Shading Language, etc. The open source nature of Blender means that it is possible to make any type of customization as often is needed in complex projects such as OceanViz.
An advantage of using a game engine is that all the assets that populated our visualization can be displayed with dynamic behavior. We implemented a rudimentary artificial intelligence system to reflect animal movement and behavior with configurable tradeoffs between ecological accuracy and the amount of detail that a computer can draw in real time. Technical details about how we implemented the 3D marine life visualizations are provided in Supplementary Material.
OceanViz Architecture
Figure 3 illustrates the architecture of OceanViz. The server software controls the flow of the ecological model, and communicates with clients to disperse scientific results and to receive fisheries management inputs for which new simulations can be run. Any number of clients can be connected. Each client works independently of the others and has two visual components: (i) a data exploration layer through which participants explore background information and ecosystem model results as delivered by the server, and can make changes to fishing management scenarios that are sent to the server; and (ii) a 3D visualization layer that renders the animated underwater environment.
FIGURE 3
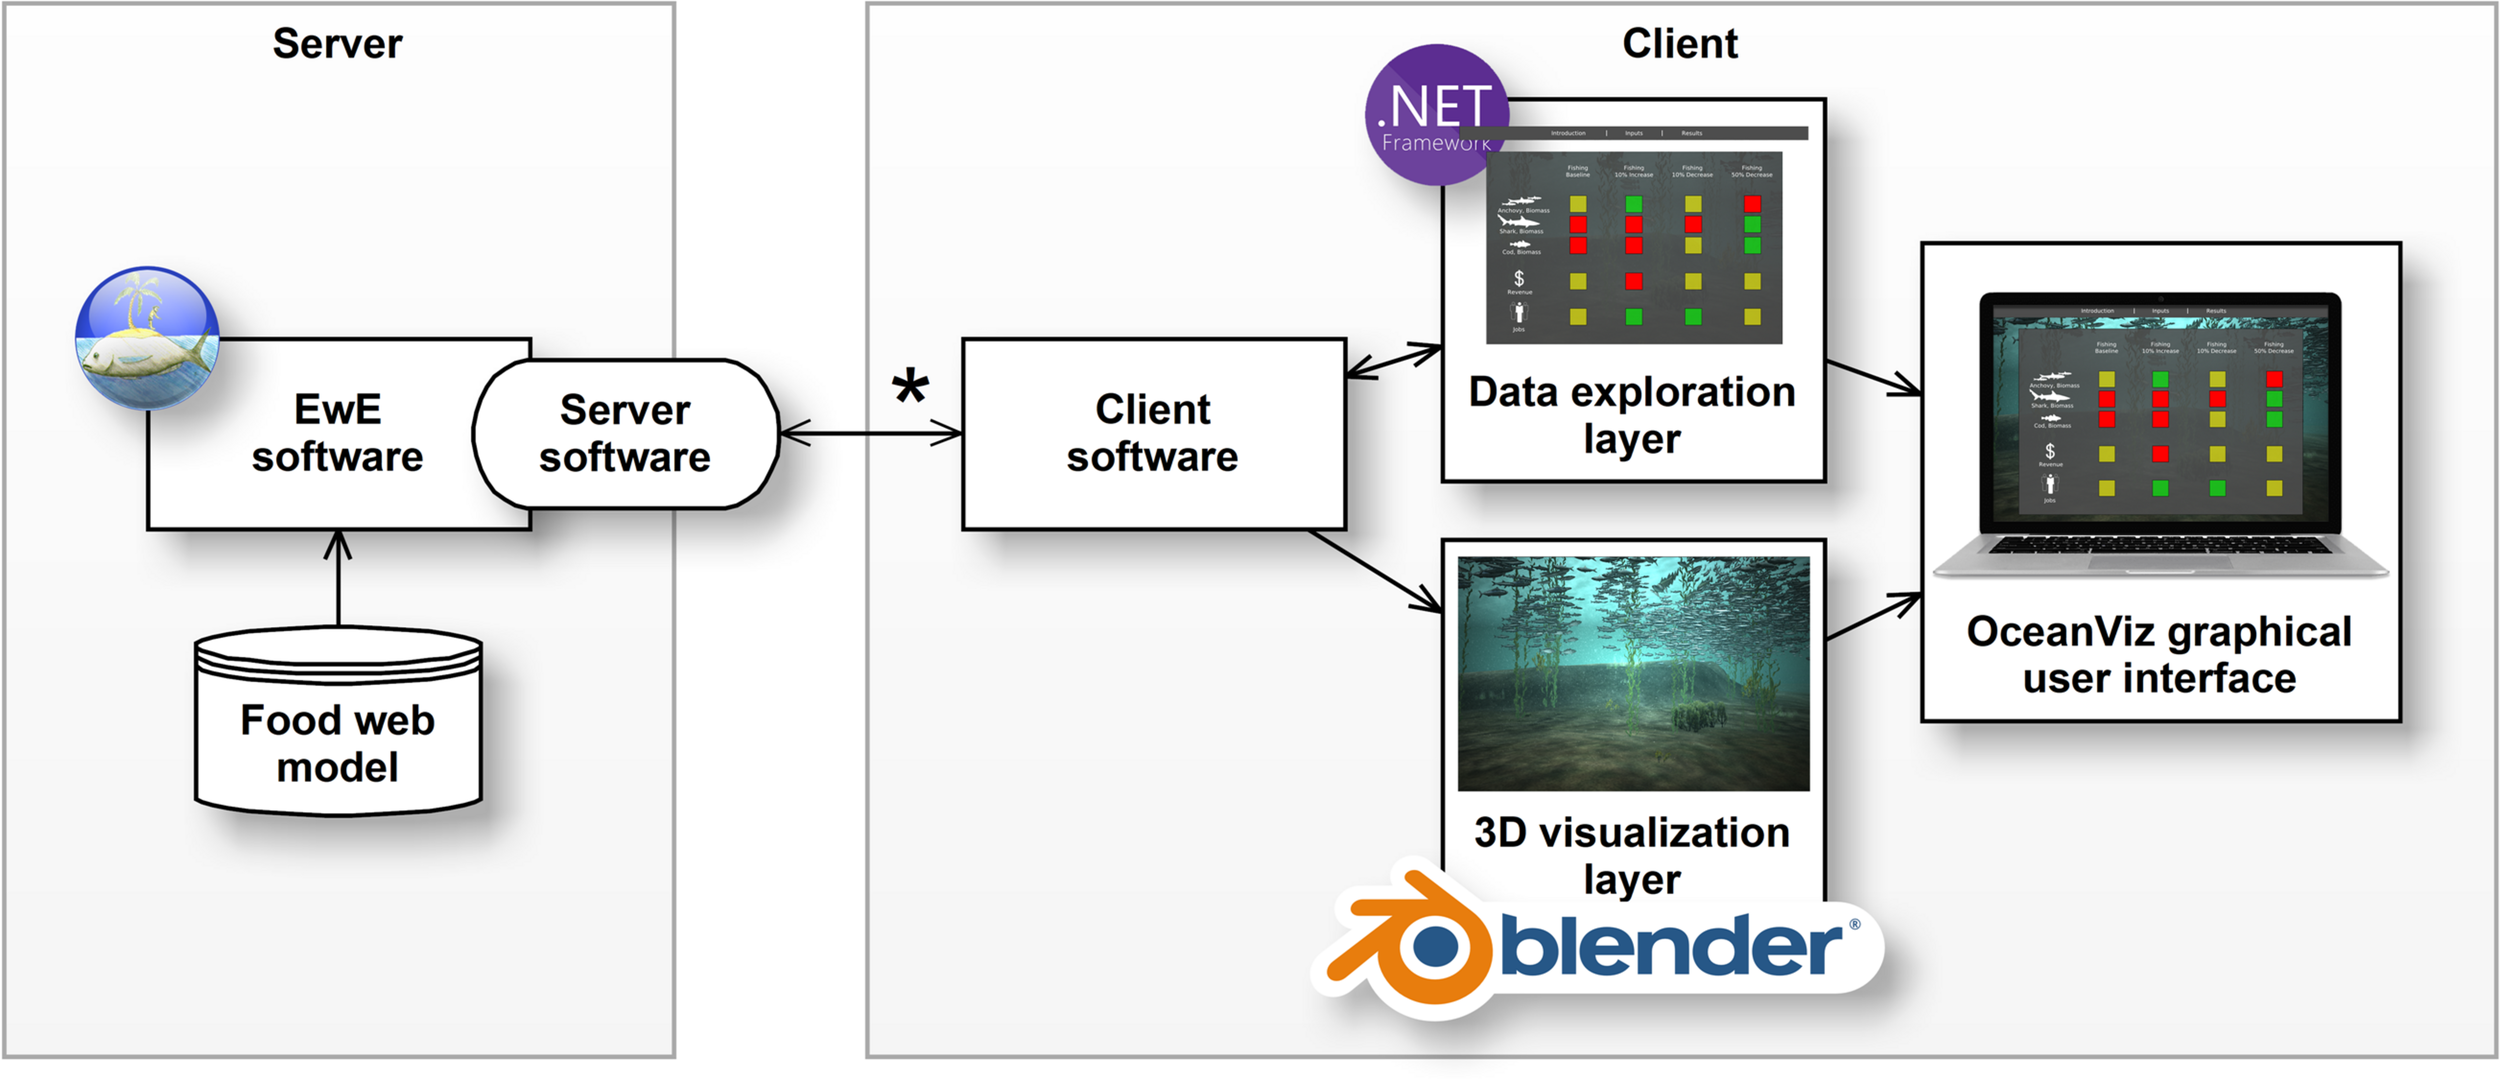
Schematic overview of the OceanViz architecture. On the server side, the EwE desktop software provides model results to multiple clients (*). On the client side, the OceanViz user interface consists of two layers, a data exploration layer written in .NET and 3D visualization layer written in Blender.
Results
Scenarios
We assume that, prior to an OceanViz session, all participants have been involved in the definition of the ecosystem model, the food web structure, its exploitation, and acceptable management thresholds as originally described in Christensen and Lai (2011). During an OceanViz session, the group explores and compares different fisheries management scenarios and the impacts on the mutually agreed ecosystem model and ecosystem services. The OceanViz software offers three or more scenario “slots” where participants can alter fisheries management settings. These alterations are established through group consensus and are entered by a moderator. The ecosystem model then computes the impacts of management scenarios, and communicates the changes in the ecosystem and ecosystem services to the participants.
Data Exploration
Data communication in OceanViz is divided in four sections (Figure 4). The first section, “introduction,” provides a set of screens with background information that is relevant for understanding a given aquatic ecosystem and its exploitation (Figure 4A). The second section, “input,” summarizes the condition of the ecosystem and the management options that can be changed under the different scenarios (Figure 4B). Some values define the ecosystem and cannot be changed during an OceanViz session (e.g., temperature, productivity, ecosystem summaries), while other values can be altered during an OceanViz session to explore fisheries management options. The third section, “results,” provides access to data that explains how the ecosystem changed under alternative scenarios (Figure 4C). To reduce information overload, the main results summarizes the relative change per variable, per management scenario, in relation to the base year in the ecosystem. This provides participants with a first-glance of the magnitude of change. Participants then can explore the change over time of each variable across all management scenarios in detail (Figure 4D). Last, the section “indicators” presents a single snapshot of the most important variables across the management scenarios in relation to the pre-defined thresholds (as established with participants prior to a session). OceanViz uses a simple color-coded “traffic lights” or red-amber-green (RAG) system to indicate whether a parameter value falls below the limit reference point (red), above the target reference (green), or in between (amber). The traffic light system allows for a quick overview of changes in the ecosystem (Figure 4E). The traffic light system is adjustable for colorblindness.
FIGURE 4
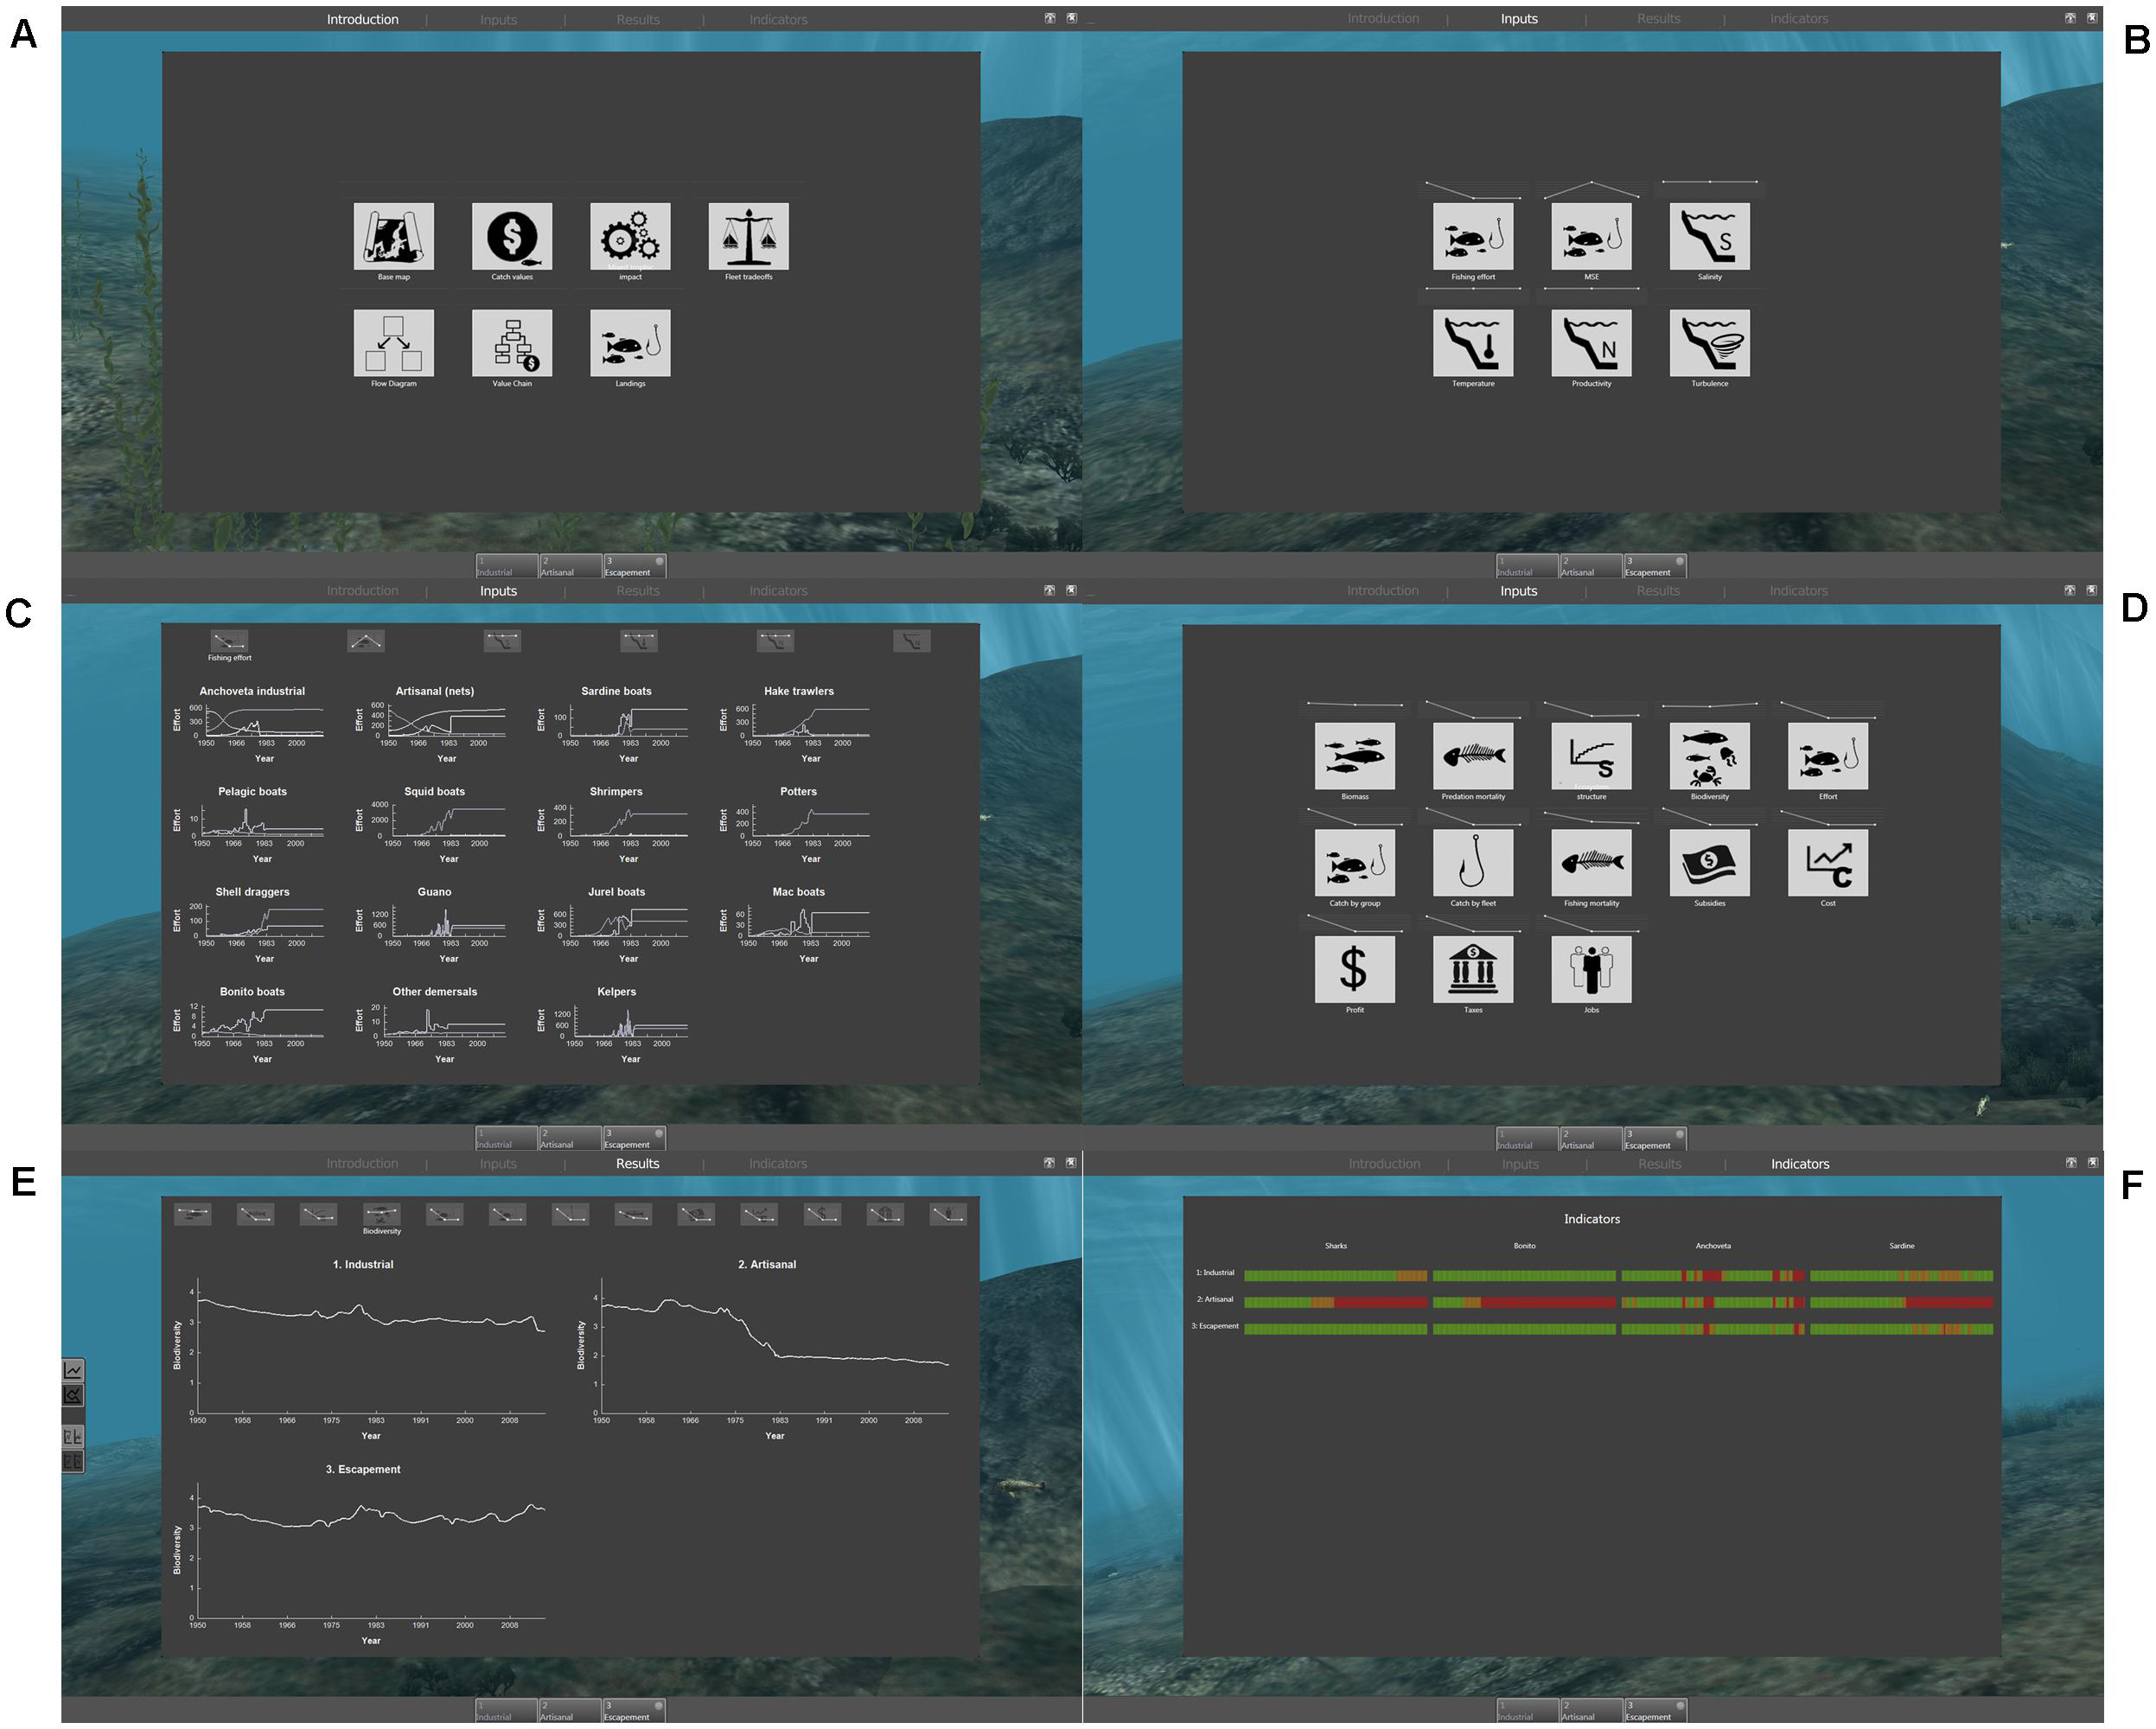
The sections of the OceanViz data exploration interface: information (A), input (B) and an example input screen where users can alter fishing effort by sketching with a mouse or their finger (C), results overview (D) and an example results detail screen showing trends in biodiversity (E), and traffic lights for select ecological indicators (F).
3D Visualization
The 3D visualizations present an immersive virtual ocean with animals and plants in simulated marine habitats (Figure 5). The 3D visualizations reflect the state of the ecosystem as predicted by the ecological model. Sizes and densities of plants and animals vary in response to changes in biomass. Volumetric fog is included to give the first-hand illusion of being under water, and its intensity can be varied through model-calculated nutrient levels to visualize eutrophication. Color attenuation can be used to represent both depth and the distance from the viewers’ eye (Figure 5).
FIGURE 5
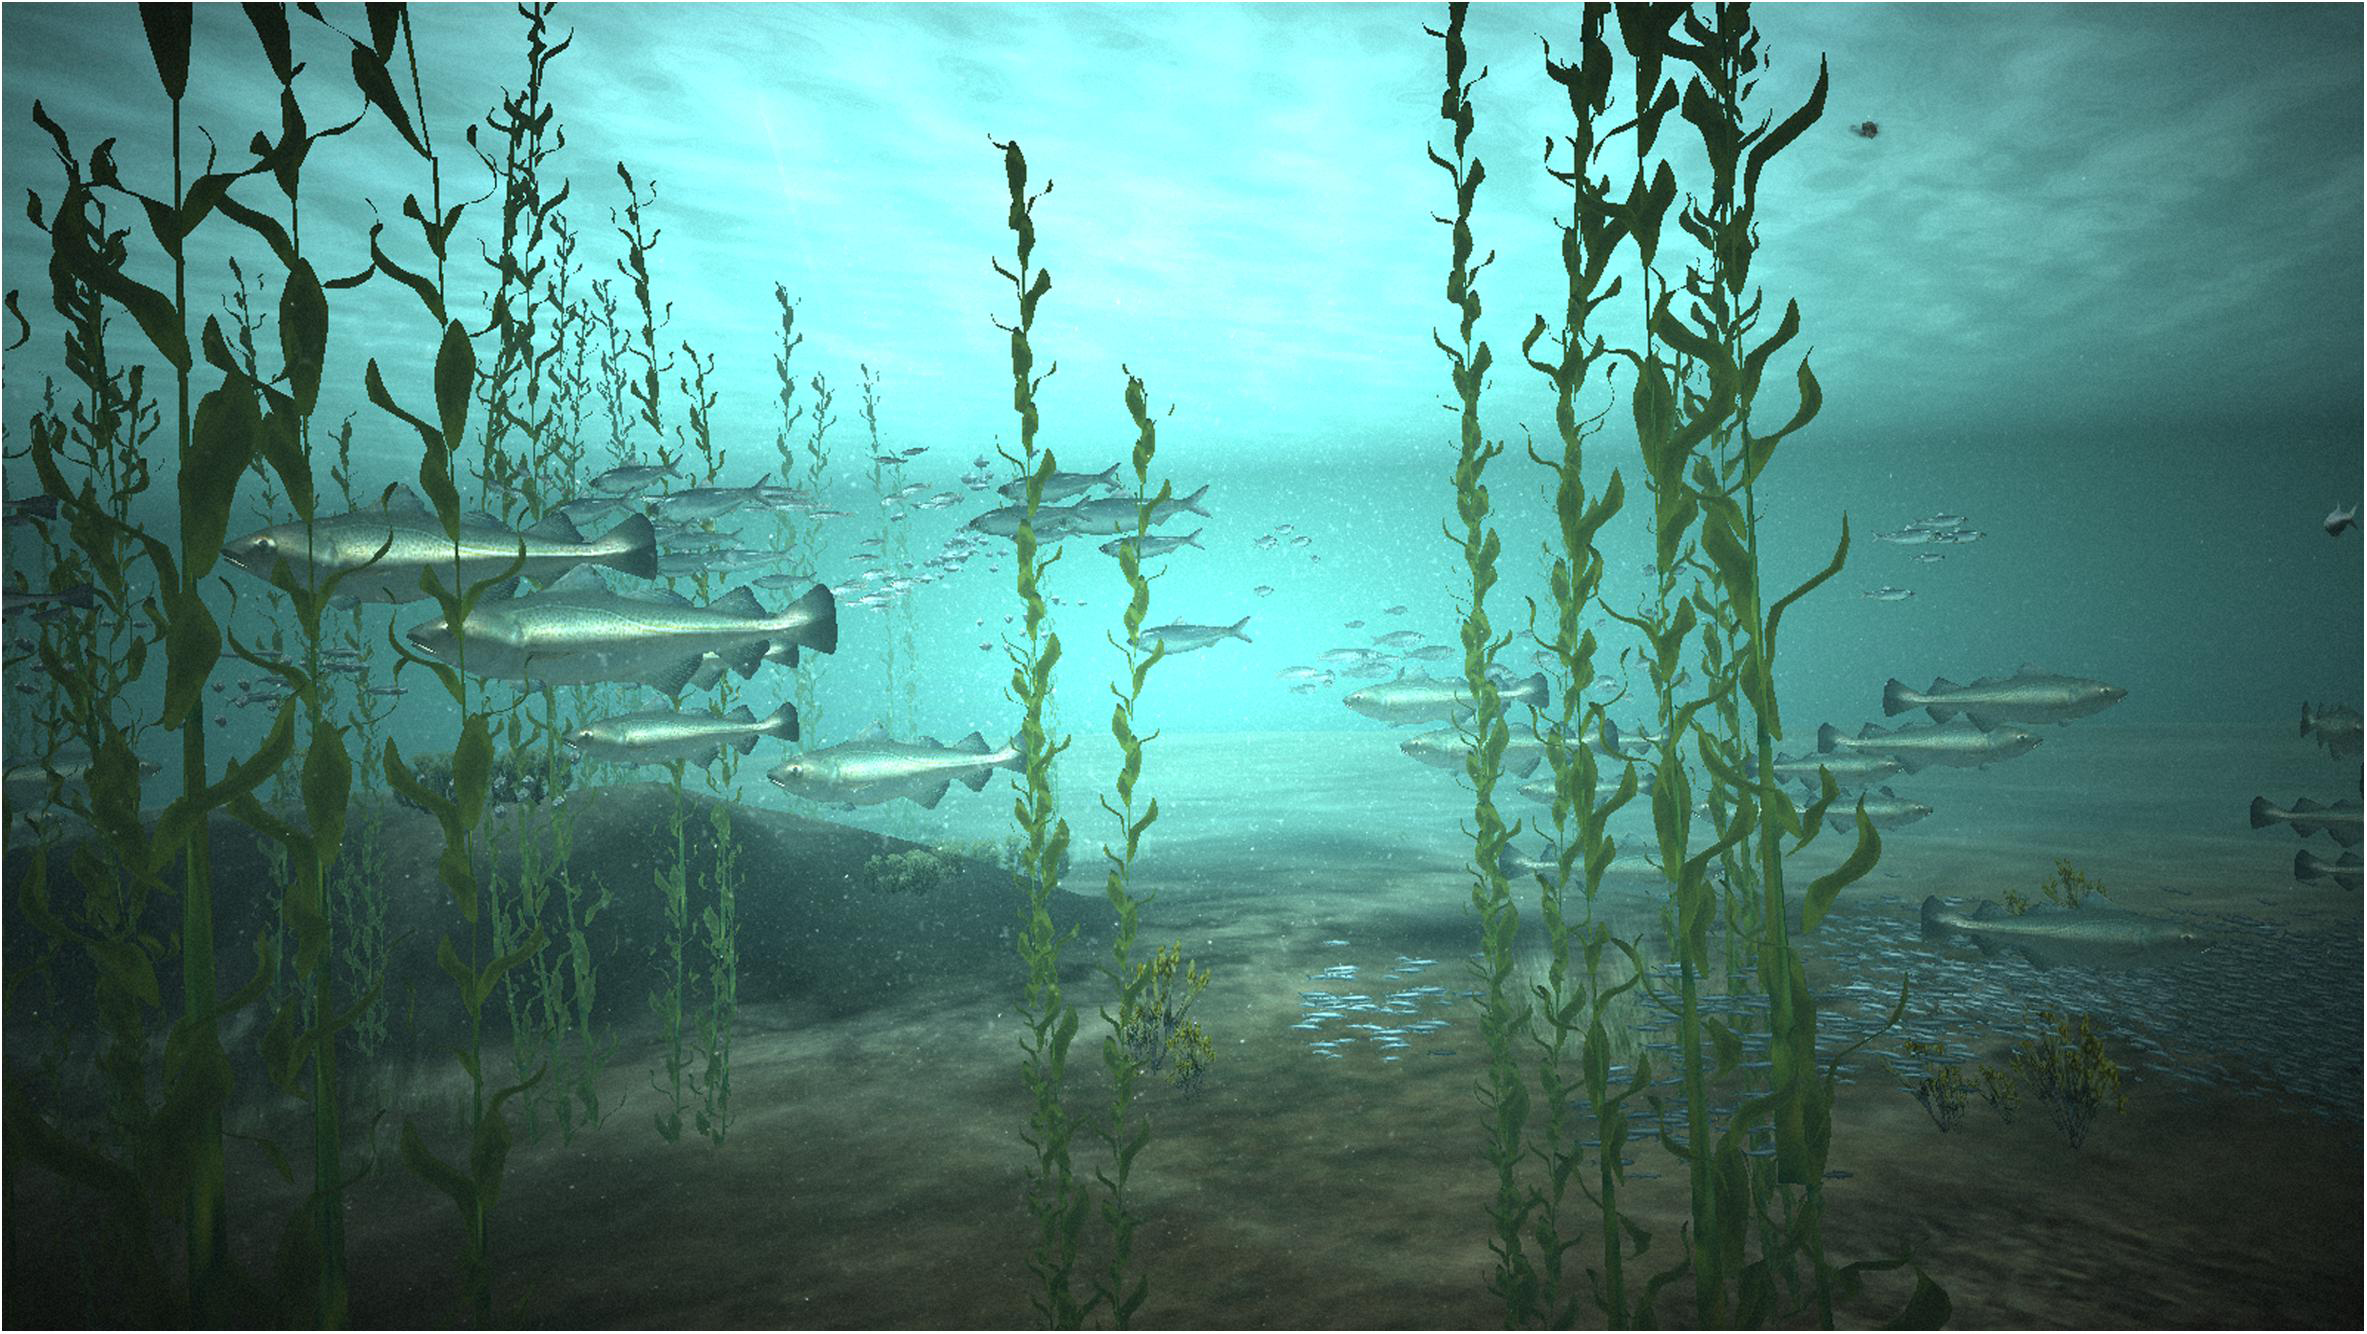
An example of OceanViz 3D visualizations presenting a Peruvian ecosystem.
OceanViz captures substrate and local features of the environment. All living components are spawned into the environment based on their natural occurrence: kelp appear attached to the bottom; coral grow on rock walls or rock outcrops; pelagic animals are placed in mid-water; etc.
As animals and plants tend to unevenly distribute across vast areas and often aggregate within, complex ecosystems are not typically viewed in one glance. To ensure that all relevant species in the ecosystem are visible at any given moment, OceanViz concentrates relative abundances of species within the participants’ field of vision. Albeit not ecologically correct, this allows OceanViz to accurately represent the relative densities of species over time as predicted by the ecological model.
The Challenge of Visualizing Change
Communicating changes over time through animations is challenging due to the shifting baseline effect (Pauly, 1995; Soga and Gaston, 2018). Early versions of OceanViz had a timeline system that stepped through simulation time at 1 month per second, where species population changed according to their abundance while the animation progressed (Figure 6A). However, at the end of an animation of progressive change over 50 years, it was hard to recall the initial state of the ecosystem. It was thus very difficult to make any form of comparison between the initial and final states of an ecosystem simulation. We addressed this issue by visualizing the environment across three panels – three time slices – in a continuous camera (Figure 6B). The panels represent the first, mid-point, and last year of a simulation, where each panel displays animal densities, sizes and environment conditions (e.g., turbidity) according to the ecosystem model. This three-panel setup allows for side-by-side visual comparison of the amount of change in an ecosystem. The panels could also reflect the end-of-simulation year for different management scenarios to allow for a side-by-side visual comparison of fisheries management impacts.
FIGURE 6
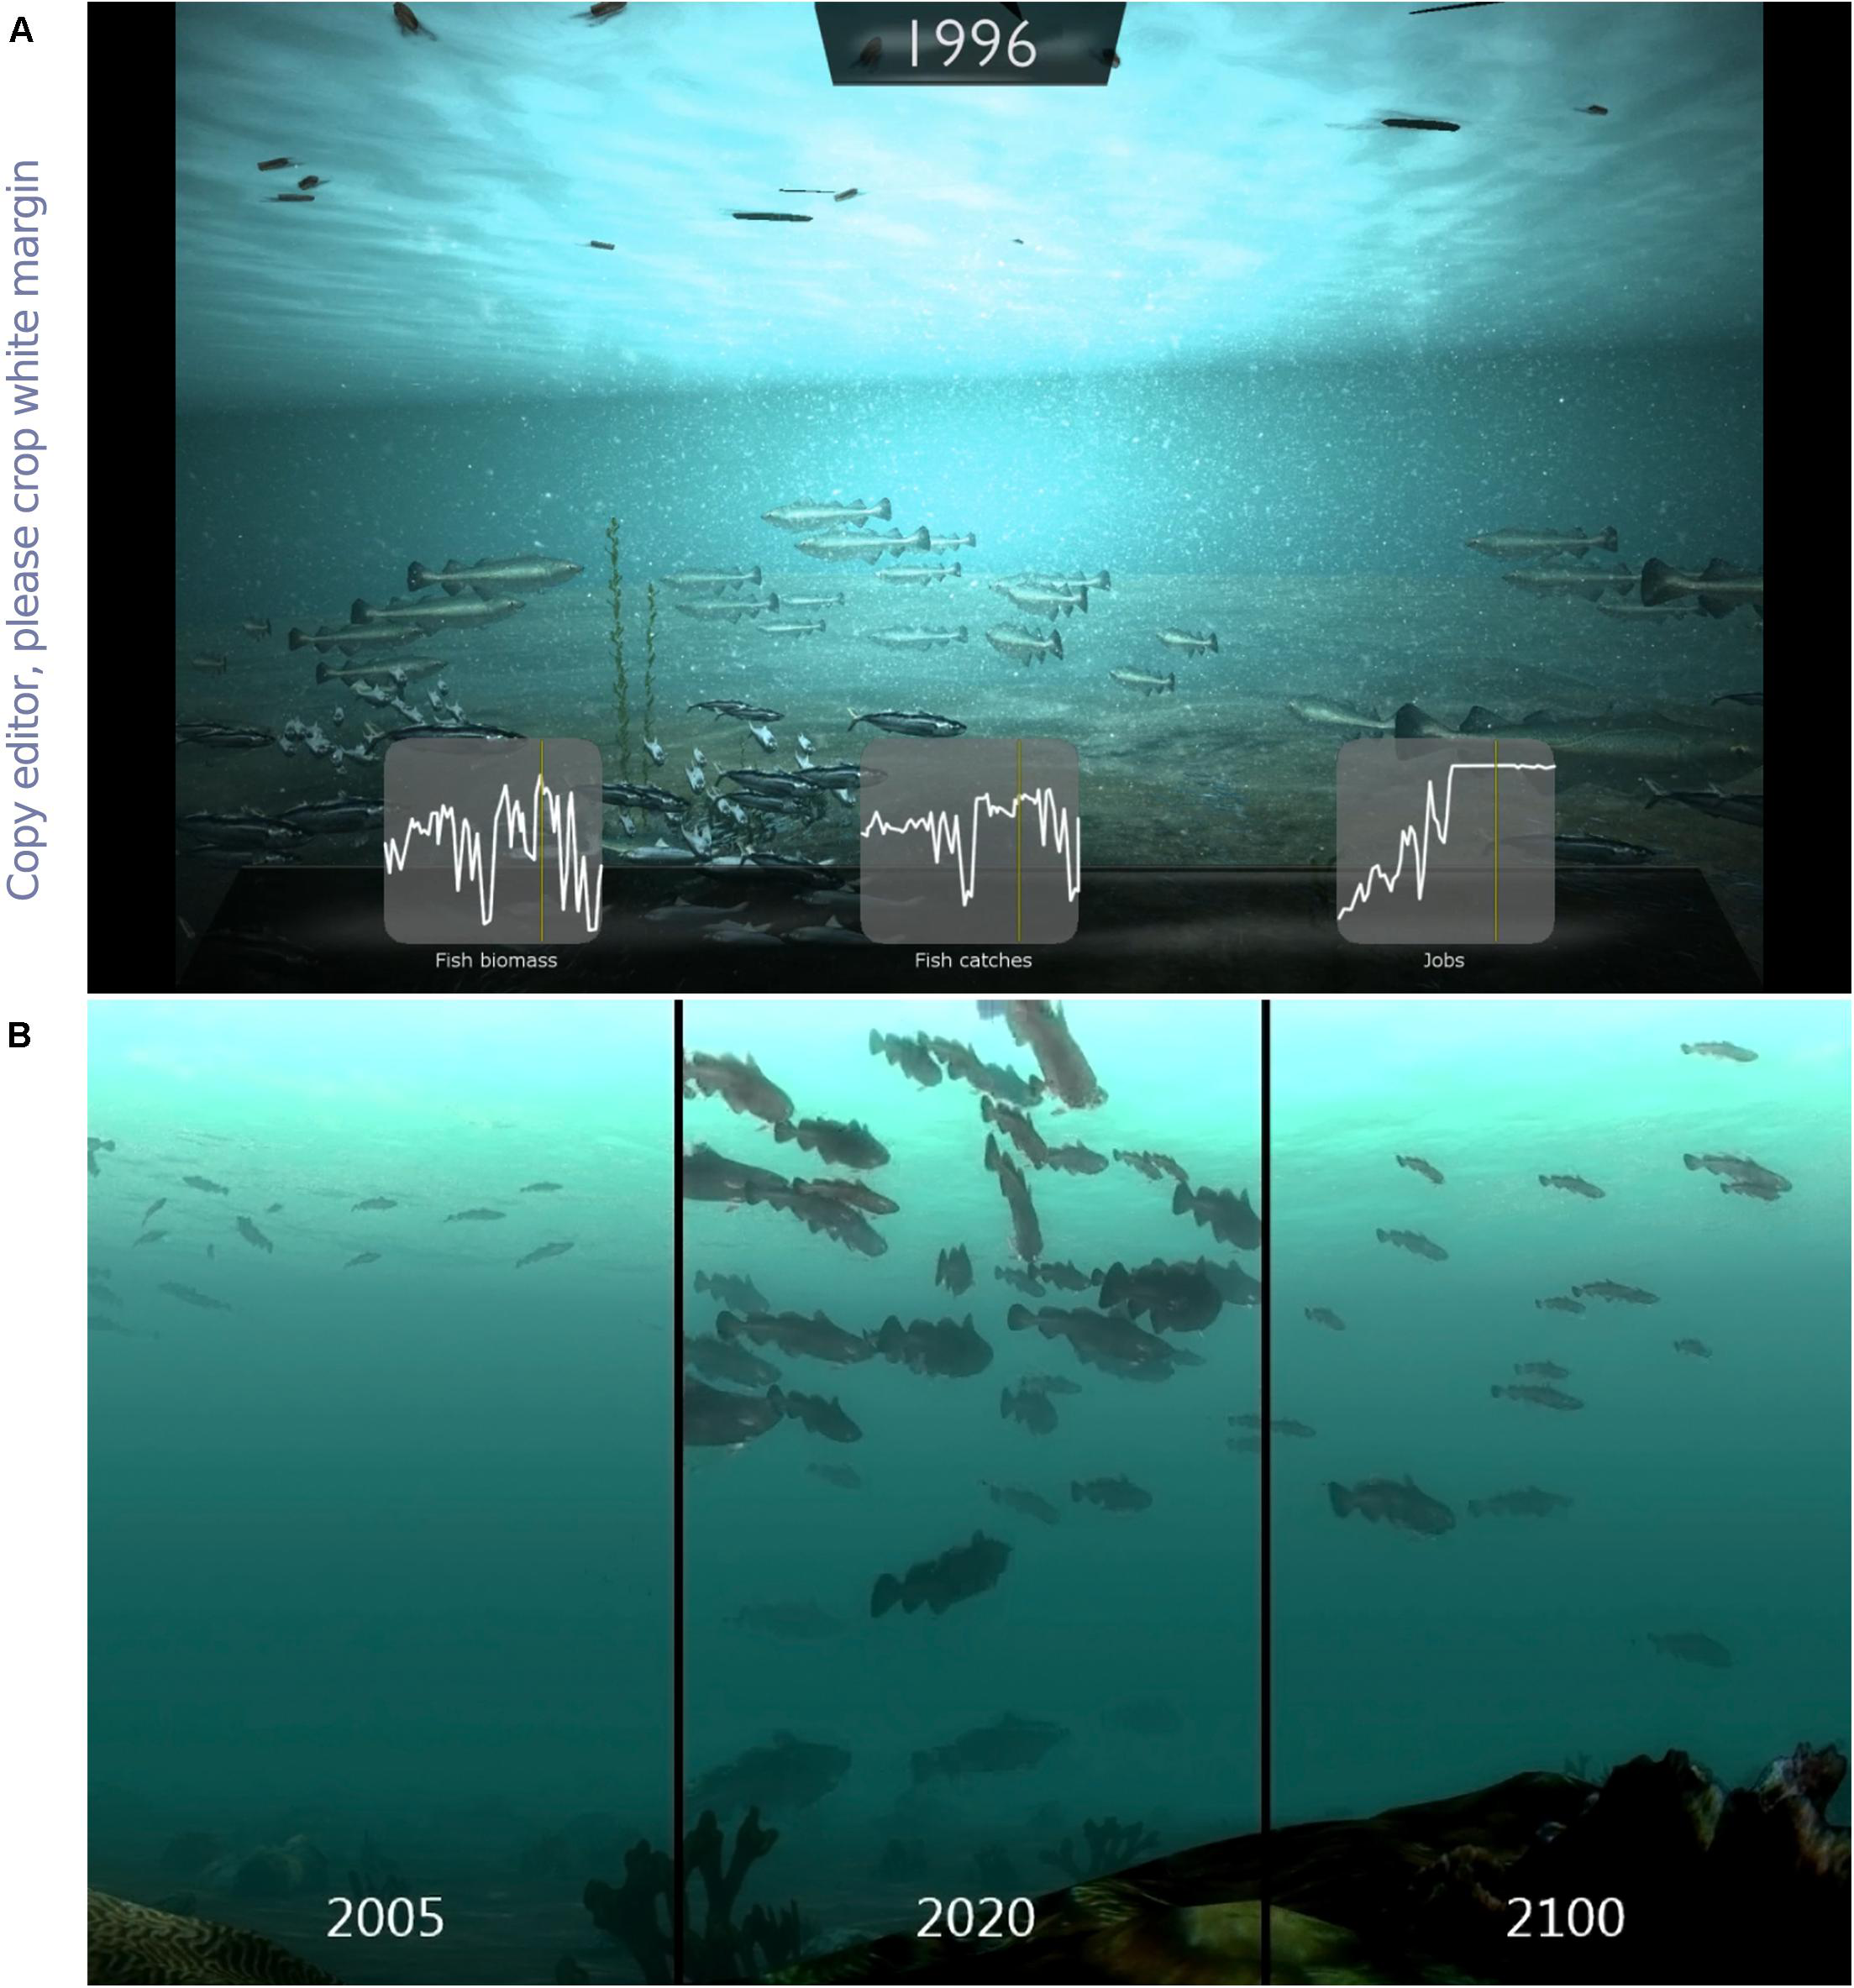
Two approaches of OceanViz to show change. The earliest approach (A) showed ecosystem change through a continuous animation supported by small graphs of ecosystem indicators. This system was replaced by three panels (B) that reflect the first year, mid-point, and end year of the ecosystem as predicted by the ecosystem model.
Discussion
By using software tools tailored toward particular audiences, science can be executed, presented and digested in diverse forms. The OceanViz facility described here was created to explore solutions to specific challenges to the implementation of EDSS: involving stakeholders in the design, implementation and execution of an EDSS; transparent integration of scientific software to support the decision process; and providing a user-friendly system that focuses on communicating meaningful results (e.g., McIntosh et al., 2011; Walling and Vaneeckhaute, 2020).
The OceanViz software is a ready to use tool to engage non-scientific users in the operation of an aquatic ecosystem model through immersive visualizations. De-coupling the ecosystem model from the 3D visualizations across a network allows OceanViz to run on various devices. The OceanViz software is a flexible tool to visualize and communicate changes in a broad range of marine ecosystems, and can be driven by any type of ecological data source.
OceanViz was primarily designed to be used at the decision table – where decision makers can visualize the possible outcomes of different proposed management interventions. However, OceanViz is a modular visualization toolkit that can be deployed to entirely different settings. The 3D visualization engine is a stand-alone, programmable virtual aquarium that can be used in other projects, for any purpose that requires display of an interactive underwater world. For example, it can be used in the classroom – to teach about ecosystem modeling. The current implementation of the OceanViz methodology allows for a smooth (30–60 fps on a high-end desktop computer with a normal graphics card dedicated to gaming) experience and can handle most of the main components available in the EwE models (Christensen and Walters, 2004). In this context, a recent spin-off capability to visualize modeling results in real time using OceanViz was built into a plug-in for EwE (Figure 7, top-left panel). In addition, as a direct consequence of our OceanViz experiments, the EwE software was recently integrated into the Maritime Spatial Planning Challenge simulation platform (Steenbeek et al., 2020).
FIGURE 7
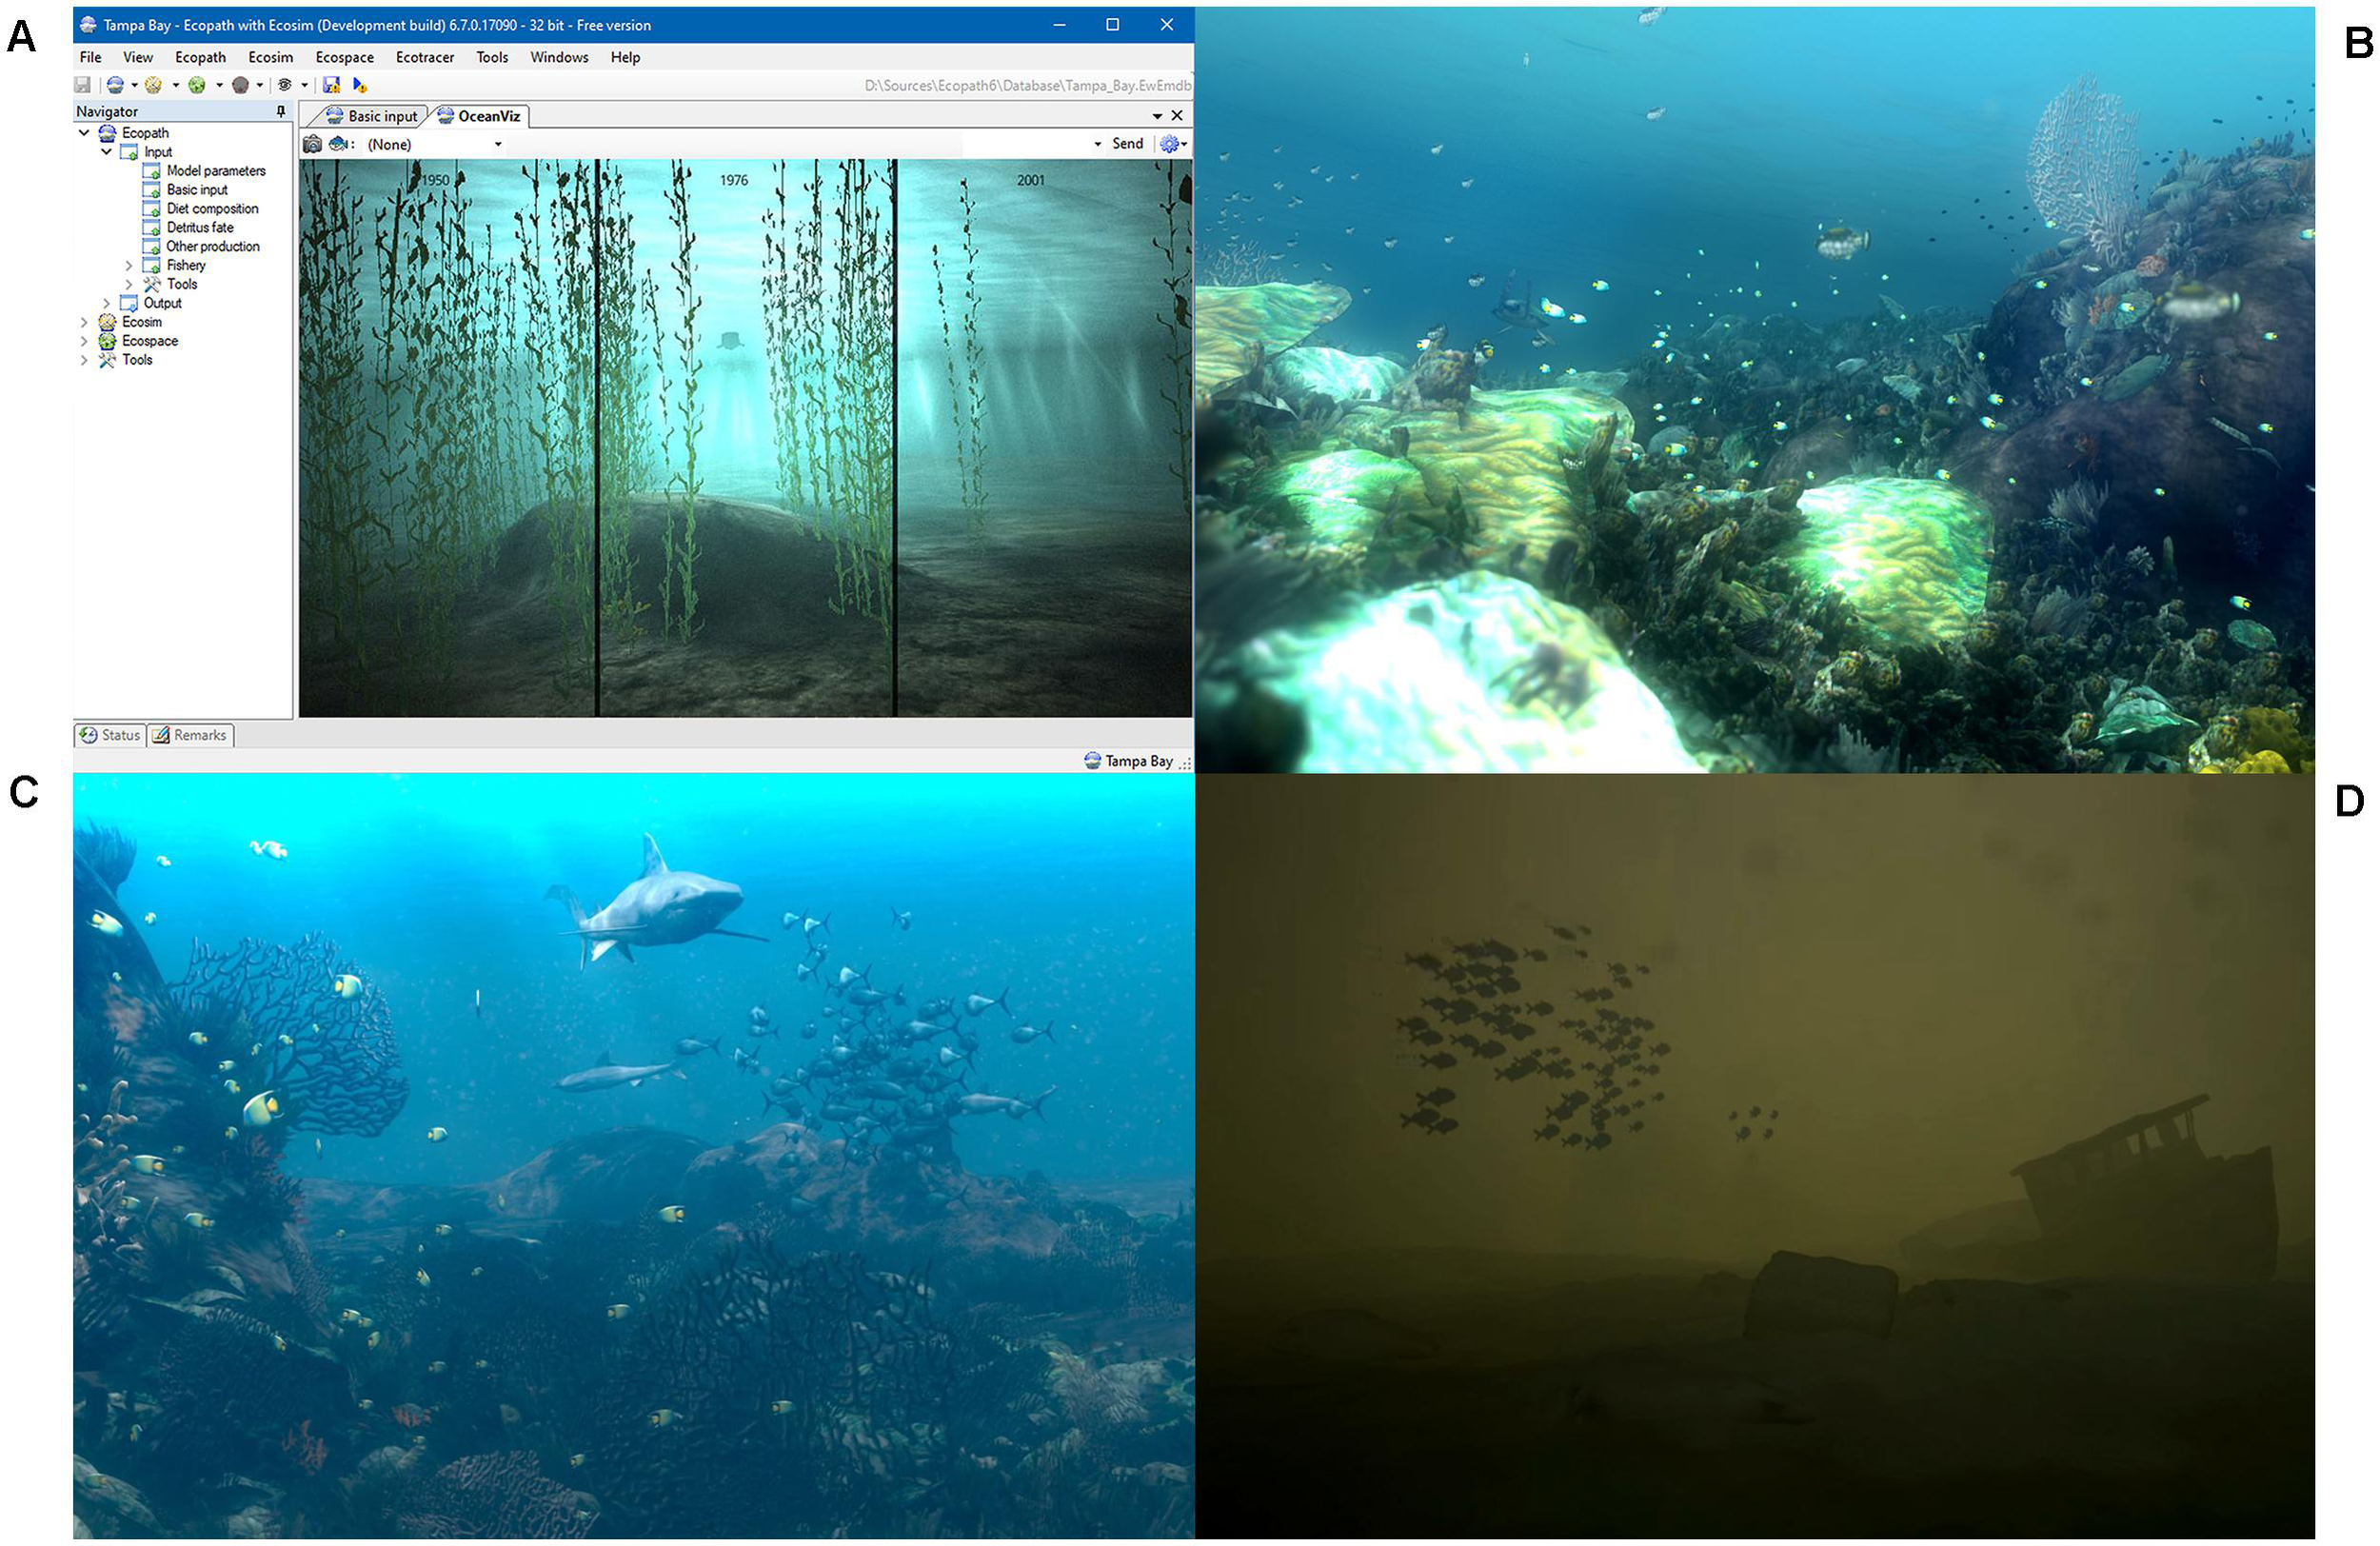
Different uses of the OceanViz visualizations: embedded in the EwE desktop software (A), in a scripted movie to show the impacts of sharks on coral reefs (B), in a scripted movie shows the ecological links between sharks, tuna, and sea birds (C), in a kiosk game that allowed users to explore the combined impacts of eutrophication and fishing in the Baltic (D).
The OceanViz 3D visualizations have already found uptake into a number of other activities. They have been used to produce scripted short movies to such as can be seen at www.globaloceanmodelling.org/visualizations, and they have been integrated into a kiosk game that focused on model-driven exploration of fisheries and eutrophication in the Baltic (a still of BalticViz, unpublished, is shown in Figure 7). Through capabilities of the Blender Game Engine, the OceanViz 3D visualizations are compatible with dome projections, and, via third-party systems like BlenderVR, stereoscopic virtual reality (VR) headsets (Katz et al., 2015).
However, any visualization piece is a biased visualization that displays a virtual world. One of the merits of this project is to combine the rigorous view of the scientific data, with the creative artistic impetus for effectively communicating and connecting to the audience. In fact, OceanViz shows that some level of artistic freedom is needed to visualize a complex and diverse marine ecosystems in a single 3D visualization. For example: (i) water visibility is driven by the scientific engine, but it has the turbidity attenuated to allow visualization at a greater distance than the actual. (ii) Fish interactions are “scenic” and do not affect the net value representation of the individual fish models. (iii) The engine “cheats” on absolute fish abundances but does ensure that the relative abundances are realistic, where biomass numbers can be scaled logarithmically or linearly depending on visualized species. (iv) Last, the challenge to display ecosystem components that would normally not occur in the same visual setting were addressed by using camera pathways to “visit” the various modeled habitats and the species living within, where species were visualized only in their naturally occurring habitats.
Despite being linked to food web models, OceanViz does not explicitly show a predator prey behavior, or more specifically, you won’t see a shark eating a sardine. There are a few reasons for that: (i) performance – with the employed technology, the available computing units were not capable of handling a sophisticated individual fish intelligence as touched upon earlier; (ii) our focus is on displaying abundances; (iii) scene setup – it’s important to reinforce that the species layout in the 3D scene is a raw representation of the data, and not necessarily can be related to a real ecosystem where such behaviors are observed. We have deliberately built a simplified world.
The scope of OceanViz as presented here was deliberately kept small as an experiment in data presentation and virtual reality; we did not set out to develop a comprehensive EDSS. Future developments can certainly include essential EDSS features such as comprehensive usability and uncertainty assessments (Walling and Vaneeckhaute, 2020). As all ecosystem management questions have temporal and spatial components, we can also extend OceanViz to connect to spatial-temporal ecosystem models such as Ecospace, the spatial-temporal module of EwE (Serpetti et al., 2017; Coll et al., 2020), and to explicitly represent the impacts of climate change according to the available forecasting scenarios (Tittensor et al., 2018). We can extend OceanViz to incorporate the effects of hazardous substances and litter if the connected ecological model provides said features, and OceanViz can be made to incorporate socio-economic impact analysis and include non-aquatic species in its considerations if underlying models provide these abilities – providing stakeholder sessions have such needs. The design of OceanViz is open-ended to tap into all features of underlying ecosystem models, and as mentioned prior, different ecosystem models can be used to drive the OceanViz dynamics. Whichever modeling capabilities are used: it is of utmost importance to ensure that information provided by OceanViz is conveyed in a form that only stimulates participatory dialogues for specific stakeholder sessions without leading to information overload (Georgescu et al., 2019).
In the spring of 2018, the Blender Foundation announced that the game engine was no longer part of Blender (Felinto, 2018). Future developments will require to transfer the visual assets and logic of the OceanViz visualizations to another compatible game development platform such as the Unity game engine (Unity Technologies, 2020).
Despite its limitations and potential improvements, upsurges in the interest in stakeholder-driven ecosystem management supported by decision support tools (Pınarbaşı et al., 2017; Keijser et al., 2018; Ernst, 2019; Krueck et al., 2019), and the emergence of ecological decision support tools that not only support the full problem solving cycle but also provide visions of the future based on plausible solutions (Steenbeek et al., 2020), have led us to believe that OceanViz may hold potential for this renewing landscape. EwE ecosystem models are increasingly being used for ecosystem-based fisheries management and integrative assessments (Christensen and Walters, 2011; Coll et al., 2015). The OceanViz approach provides blueprints for addressing the three challenges that Heymans et al. (2020) posed to the ecosystem modeling community, namely: (i) enable ocean managers to use, (ii) communicate, and (iii) co-design ecosystem models. As such, there is a need for tools such as OceanViz to address real world problems.
Due to lack of funding, the OceanViz approach has not yet been applied to an actual decision making process and thus far has been a purely academic exercise. Throughout its development, we have demonstrated and tested OceanViz with scientists, stakeholders, and with broader audiences in over 20 different settings and events to gather feedback. This feedback, in turn, was invaluable in shaping the OceanViz software to the version presented here. This study illustrates that the results from the OceanViz software are promising, and are ready to head toward applying this methodology to address real-world applications. We certainly will keep building on the OceanViz tools and experiences, and we hope that this work will provide inspirational to other research approaches striving to connect scientific software with target policy audiences. OceanViz can serve as a tool for stakeholders, policy makers, students, and scientists to understand the importance of ecosystem-based management and of the need to act now if there is going to be seafood and a healthy ocean for future generations to enjoy.
Statements
Data availability statement
The original contributions presented in the study are included in the article/Supplementary Material, further inquiries can be directed to the corresponding author.
Author contributions
VC conceived the study. JS designed and lead the implementation. JS and JB performed the coding in .NET. DF and MP performed the coding and visual artistry in Blender. All authors contributed to the article and approved the submitted version.
Funding
The OceanViz development was initially supported by the Lenfest Ocean Program, and subsequently by the Nippon Foundation. VC acknowledges support from the Natural Sciences and Engineering Research Council of Canada (NSERC), Discovery Grant RGPIN-2019-04901. The funding agencies have had no impact on the study design, writing of, or decision to publish the manuscript.
Acknowledgments
JS wants to acknowledge institutional support of Universitat Politécnica de Catalunya. Sherman Lai was involved in the conceptualization and initial coding of OceanViz, before leaving science for other endeavors. Thanks for the good times, Shermi.
Conflict of interest
The authors declare that the research was conducted in the absence of any commercial or financial relationships that could be construed as a potential conflict of interest.
Supplementary material
The Supplementary Material for this article can be found online at: https://www.frontiersin.org/articles/10.3389/fmars.2021.619541/full#supplementary-material
References
1
Ahrens R. N. M. Walters C. J. Christensen V. (2012). Foraging arena theory.Fish and Fish.1341–59. 10.1111/j.1467-2979.2011.00432.x
2
Anderson P. V. Brockman J. R. Miller C. R. (1983). New Essays in Technical and Scientific Communication: Research, Theory, Practice.New York, NY: Routledge.
3
BBC News (2019). Gaming Worth More Than Video and Music Combined.BBC News. Available online at: https://www.bbc.com/news/technology-46746593(accessed September 10, 2020).
4
Bennett N. D. Croke B. F. Guariso G. Guillaume J. H. Hamilton S. H. Jakeman A. J. et al (2013). Characterising performance of environmental models.Environ. Model. Softw.401–20. 10.1016/j.envsoft.2012.09.011
5
Blender Foundation (2020). blender.org – Home of the Blender project – Free and Open 3D Creation Software.blender.org. Available online at: https://www.blender.org/(accessed September 6, 2020).
6
Böttinger M. Kostis H.-N. Velez-Rojas M. Rheingans P. Ynnerman A. (2020). “Reflections on Visualization for Broad Audiences,” in Foundations of Data Visualization, edsChenM.HauserH.RheingansP.ScheuermannG. (Cham: Springer), 297–305. 10.1007/978-3-030-34444-3
7
Christensen V. Coll M. Steenbeek J. Buszowski J. Chagaris D. Walters C. J. (2014). Representing variable habitat quality in a spatial food web model.Ecosystems171397–1412. 10.1007/s10021-014-9803-3
8
Christensen V. Lai S. (2011). “Scenario development for decision making,” in Ecosystem Approaches to Fisheries: a Global Perspective, edsChristensenV.MacLeanJ. L. (Cambridge: Cambridge University Press), 304–314.
9
Christensen V. Pauly D. (1992). ECOPATH II—a software for balancing steady-state ecosystem models and calculating network characteristics.Ecol. Modell.61169–185. 10.1016/0304-3800(92)90016-8
10
Christensen V. Walters C. J. (2004). Ecopath with Ecosim: methods, capabilities and limitations.Ecol. Modell.172109–139. 10.1016/j.ecolmodel.2003.09.003
11
Christensen V. Walters C. J. (2011). “Progress in the use of ecosystem models for fisheries management,” in Ecosystem Approaches to Fisheries: A Global Perspective, edsChristensenV.MacLeanJ. (Cambridge: Cambridge University Press), 189–205.
12
Coll M. Akoglu E. Arreguín-Sánchez F. Fulton E. A. Gascuel D. Heymans J. J. et al (2015). Modelling dynamic ecosystems: venturing beyond boundaries with the Ecopath approach.Rev. Fish Biol. Fish.25413–424. 10.1007/s11160-015-9386-x
13
Coll M. Steenbeek J. (2017). Standardized ecological indicators to assess aquatic food webs: the ECOIND software plug-in for Ecopath with Ecosim models.Environ. Model. Softw.89120–130. 10.1016/j.envsoft.2016.12.004
14
Coll M. Steenbeek J. Pennino M. G. Buszowski J. Kaschner K. Lotze H. K. et al (2020). Advancing global ecological modelling capabilities to simulate future trajectories of change in marine ecosystems.Front. Mar. Sci.7:567877. 10.3389/fmars.2020.567877
15
Colléter M. Valls A. Coll M. Gascuel D. Guitton J. Piroddi C. et al (2015). “Modeling the global oceans with the Ecopath software suite: a brief review and application example,” in Global Atlas of Marine Fisheries: A Critical Appraisal of Catches and Ecosystem Impacts, edsPaulyD.ZellerD. (New York: Island Press), 12.
16
Ernst A. (2019). Research techniques and methodologies to assess social learning in participatory environmental governance.Learn. Cult. Soc. Interact.23:100331. 10.1016/j.lcsi.2019.100331
17
Felinto D. (2018). Removing Blender Game Engine from Blender 2.8.blender.org. Available online at: https://developer.blender.org/rB159806140fd33e6ddab951c0f6f180cfbf927d38(accessed October 7, 2020).
18
Felinto D. Pan M. (2013). Game Development with Blender, 1st Edn. Boston, MA: Cengage Learning PTR.
19
Froese R. Pauly D. (eds) (2010). FishBase.Vancouver, BC: Fisheries Centre, University of British Columbia.
20
Georgescu A. Gheorghe A. V. Piso M.-I. Katina P. F. (2019). “Serious Gaming and Policy Gaming,” in Critical Space Infrastructures: Risk, Resilience and Complexity Topics in Safety, Risk, Reliability and Quality, edsGeorgescuA.GheorgheA. V.PisoM.-I.KatinaP. F. (Cham: Springer International Publishing), 215–226. 10.1007/978-3-030-12604-9_8
21
Giant Squid. (2015). ABZÛ. Available onlime at: https://abzugame.com(accessed September 11, 2020).
22
Giebels D. Carus J. Paul M. Kleyer M. Siebenhüner B. Arns A. et al (2020). Transdisciplinary knowledge management: a key but underdeveloped skill in EBM decision-making.Mar. Policy119:104020. 10.1016/j.marpol.2020.104020
23
Heymans J. J. Bundy A. Christensen V. Coll M. de Mutsert K. Fulton E. A. et al (2020). The ocean decade: a true ecosystem modeling challenge.Front. Mar. Sci7:554573. 10.3389/fmars.2020.554573
24
Katz B. F. G. Felinto D. Q. Touraine D. Poirier-Quinot D. Bourdot P. (2015). “BlenderVR: open-source framework for interactive and immersive VR,” in Proceedings of 2015 IEEE Virtual Reality (VR), Arles, 203–204. 10.1109/VR.2015.7223366.
25
Keijser X. Ripken M. Mayer I. Warmelink H. Abspoel L. Fairgrieve R. et al (2018). Stakeholder engagement in maritime spatial planning: the efficacy of a serious game approach.Water10:724. 10.3390/w10060724.
26
Kelleher C. Wagener T. (2011). Ten guidelines for effective data visualization in scientific publications.Environ. Model. Softw.26822–827. 10.1016/j.envsoft.2010.12.006
27
Krueck N. Abdurrahim A. Adhuri D. Mumby P. Ross H. (2019). Quantitative decision support tools facilitate social-ecological alignment in community-based marine protected area design.Ecol. Soc.24:6. 10.5751/ES-11209-240406
28
Laamarti F. Eid M. El Saddik A. (2014). An overview of serious games.Int. J. Comput. Games Technol.2014:e358152. 10.1155/2014/358152
29
Madani K. Pierce T. W. Mirchi A. (2017). Serious games on environmental management.Sustain. Cities Soc.291–11. 10.1016/j.scs.2016.11.007
30
Mayer I. Zhou Q. Keijser X. Abspoel L. (2014). “Gaming the future of the ocean: the marine spatial planning challenge 2050,” in Serious Games Development and Applications Lecture Notes in Computer Science, ed.MaM. (Cham: Springer), 150–162. 10.1007/978-3-319-11623-5_13
31
McIntosh B. S. Ascough J. C. II Twery M. Chew J. Elmahdi A. Haase D. et al (2011). Environmental decision support systems (EDSS) development–challenges and best practices.Environ. Model. Softw.261389–1402. 10.1016/j.envsoft.2011.09.009
32
NOAA Fisheries. (2020). Virtual Ecosystem Scenario Viewer (VES-V).NOAA Fisheries. Available online at: https://www.fisheries.noaa.gov/resource/tool-app/virtual-ecosystem-scenario-viewer-ves-v(accessed September 11, 2020)
33
Pauly D. (1995). Anecdotes and the shifting baseline syndrome of fisheries.Trends Ecol. Evol.10:430. 10.1016/S0169-5347(00)89171-5
34
Pınarbaşı K. Galparsoro I. Borja Á Stelzenmüller V. Ehler C. N. Gimpel A. (2017). Decision support tools in marine spatial planning: present applications, gaps and future perspectives.Mar. Policy8383–91. 10.1016/j.marpol.2017.05.031
35
Ritterfeld U. Cody M. Vorderer P. (eds) (2009). Serious games: Mechanisms and Effects.New York, NY: Routledge.
36
Serpetti N. Baudron A. R. Burrows M. T. Payne B. L. Helaouët P. Fernandes P. G. et al (2017). Impact of ocean warming on sustainable fisheries management informs the Ecosystem approach to fisheries.Sci. Rep.7:13438. 10.1038/s41598-017-13220-7
37
Soga M. Gaston K. J. (2018). Shifting baseline syndrome: causes, consequences, and implications.Front. Ecol. Environ.16222–230. 10.1002/fee.1794
38
Steenbeek J. Buszowski J. Christensen V. Akoglu E. Aydin K. Ellis N. et al (2016). Ecopath with Ecosim as a model-building toolbox: source code capabilities, extensions, and variations.Ecol. Modell.319178–189. 10.1016/j.ecolmodel.2015.06.031
39
Steenbeek J. Romagnoni G. Bentley J. Heymans J. Serpetti N. Gonçalves M. et al (2020). Combining ecosystem modeling with serious gaming in support of transboundary maritime spatial planning.Ecol. Soc.25:21. 10.5751/ES-11580-250221
40
Tittensor D. P. Eddy T. D. Lotze H. K. Galbraith E. D. Cheung W. Barange M. et al (2018). A protocol for the intercomparison of marine fishery and ecosystem models: fish-MIP v1.0.Geosci. Model Dev.111421–1442. 10.5194/gmd-11-1421-2018
41
Unity Technologies (2020). Unity Real-Time Development Platform : 3D, 2D VR & AR Engine. Available online at: https://unity.com/(accessed October 7, 2020).
42
Unknown Worlds (2020). Subnautica. Available online at: https://unknownworlds.com/subnautica/(accessed September 11, 2020).
43
Walling E. Vaneeckhaute C. (2020). Developing successful environmental decision support systems: challenges and best practices.J. Environ. Manage.264:110513. 10.1016/j.jenvman.2020.110513
44
Walters C. Pauly D. Christensen V. Kitchell J. F. (2000). Representing density dependent consequences of life history strategies in aquatic ecosystems: EcoSim II.Ecosystems370–83. 10.1007/s100210000011
45
Walters C. J. (1986). Adaptive Management of Renewable Resources.Basingstoke: Macmillan Publishing.
46
Walters C. J. Pauly D. Christensen V. (1999). Ecospace: prediction of mesoscale spatial patterns in trophic relationships of exploited ecosystems, with emphasis on the impacts of marine protected areas.Ecosystems2539–554. 10.1007/s100219900101
47
Wang Y. Segal A. Klatzky R. Keefe D. F. Isenberg P. Hurtienne J. et al (2019). An emotional response to the value of visualization.IEEE Comput. Graph. Appl.398–17. 10.1109/MCG.2019.2923483
48
WEVR (2020). theBlu Franchise. Available online at: https://wevr.com/theblu(accessed September 6, 2020).
Summary
Keywords
environmental decision support systems, ecopath with ecosim, 3D visualizations, serious gaming, information overload, immersive visualizations
Citation
Steenbeek J, Felinto D, Pan M, Buszowski J and Christensen V (2021) Using Gaming Technology to Explore and Visualize Management Impacts on Marine Ecosystems. Front. Mar. Sci. 8:619541. doi: 10.3389/fmars.2021.619541
Received
20 October 2020
Accepted
12 February 2021
Published
04 March 2021
Volume
8 - 2021
Edited by
Howard Townsend, National Marine Fisheries Service (NOAA), United States
Reviewed by
Cameron Ainsworth, University of South Florida, United States; Laura Uusitalo, Finnish Environment Institute (SYKE), Finland
Updates
Copyright
© 2021 Steenbeek, Felinto, Pan, Buszowski and Christensen.
This is an open-access article distributed under the terms of the Creative Commons Attribution License (CC BY). The use, distribution or reproduction in other forums is permitted, provided the original author(s) and the copyright owner(s) are credited and that the original publication in this journal is cited, in accordance with accepted academic practice. No use, distribution or reproduction is permitted which does not comply with these terms.
*Correspondence: Jeroen Steenbeek, jeroen@ecopathinternational.org; jeroensteenbeek@gmail.com
This article was submitted to Marine Ecosystem Ecology, a section of the journal Frontiers in Marine Science
Disclaimer
All claims expressed in this article are solely those of the authors and do not necessarily represent those of their affiliated organizations, or those of the publisher, the editors and the reviewers. Any product that may be evaluated in this article or claim that may be made by its manufacturer is not guaranteed or endorsed by the publisher.