Abstract
Management strategy evaluation (MSE) is a simulation approach that serves as a “light on the hill” (Smith, 1994) to test options for marine management, monitoring, and assessment against simulated ecosystem and fishery dynamics, including uncertainty in ecological and fishery processes and observations. MSE has become a key method to evaluate trade-offs between management objectives and to communicate with decision makers. Here we describe how and why MSE is continuing to grow from a single species approach to one relevant to multi-species and ecosystem-based management. In particular, different ecosystem modeling approaches can fit within the MSE process to meet particular natural resource management needs. We present four case studies that illustrate how MSE is expanding to include ecosystem considerations and ecosystem models as ‘operating models’ (i.e., virtual test worlds), to simulate monitoring, assessment, and harvest control rules, and to evaluate tradeoffs via performance metrics. We highlight United States case studies related to fisheries regulations and climate, which support NOAA’s policy goals related to the Ecosystem Based Fishery Roadmap and Climate Science Strategy but vary in the complexity of population, ecosystem, and assessment representation. We emphasize methods, tool development, and lessons learned that are relevant beyond the United States, and the additional benefits relative to single-species MSE approaches.
Introduction
What Is MSE?
Management strategy evaluation (MSE) has become a common best practice for managing living marine resources (Sainsbury et al., 2000; Punt et al., 2014b). MSE was developed to implement adaptive environmental management for renewable resources (Walters, 1986; Smith and Sainsbury, 1999; Punt et al., 2014b; Edwards and Dankel, 2016) and is a flexible approach that generally can be applied to any fishery system. It involves a simulation approach that serves as a “light on the hill” (Smith, 1994) allowing us to “assess the consequences of a broad range of management strategies or options [under uncertainty], and presenting the results in a way that lays bare the trade-offs across a range of management options”. MSE builds on a long history of simulation testing of harvest control rules and associated estimation methods and data (e.g., de la Mare, 1986; Butterworth et al., 1997; Kirkwood, 1997; de La Mare, 1998; Butterworth and Punt, 1999; Smith and Sainsbury, 1999). The MSE approach provides a:
-
•
Clearly defined set of management objectives
-
•
Set of performance criteria related to achieving the objectives
-
•
Set of management strategies or regulations to evaluate
-
•
Means of calculating the performance of each strategy under uncertainty
-
•
Evaluation of trade-offs and communication of this with decision makers
A recent international working group defined MSE as “a process whereby the performances of alternative harvest strategies are tested and compared using stochastic simulations of stock and fishery dynamics against a set of performance statistics developed to quantify the attainment of management objectives” (Anon, 2018), and we adopt their terminology for this and other language, with small local adaptations (see Appendix).
Involvement of stakeholders such as commercial and recreational fishers, seafood processors, non-extractive users, conservationists, and the general public is essential if MSE is to be used for complex ecosystem problems with potential trade-offs between users (Feeney et al., 2019); this is also true for single species MSE applications. Input from stakeholder groups determines management objectives, the selection of alternative management options, and the communication of results especially in relation to tradeoffs (Punt et al., 2014b). Objectives and performance criteria can include ecological, social and economic components of the ecosystem under study (Nielsen et al., 2018), with the expectation that different sets of performance metrics will resonate with each group.
Most commonly this simulation approach involves iteratively repeating steps of the MSE loop (Figure 1). Overall, the goal of the MSE is to find the strategies (management, monitoring, or assessment) that achieve the objectives and are robust to the important uncertainties, which are simulated through the evaluation process.
FIGURE 1
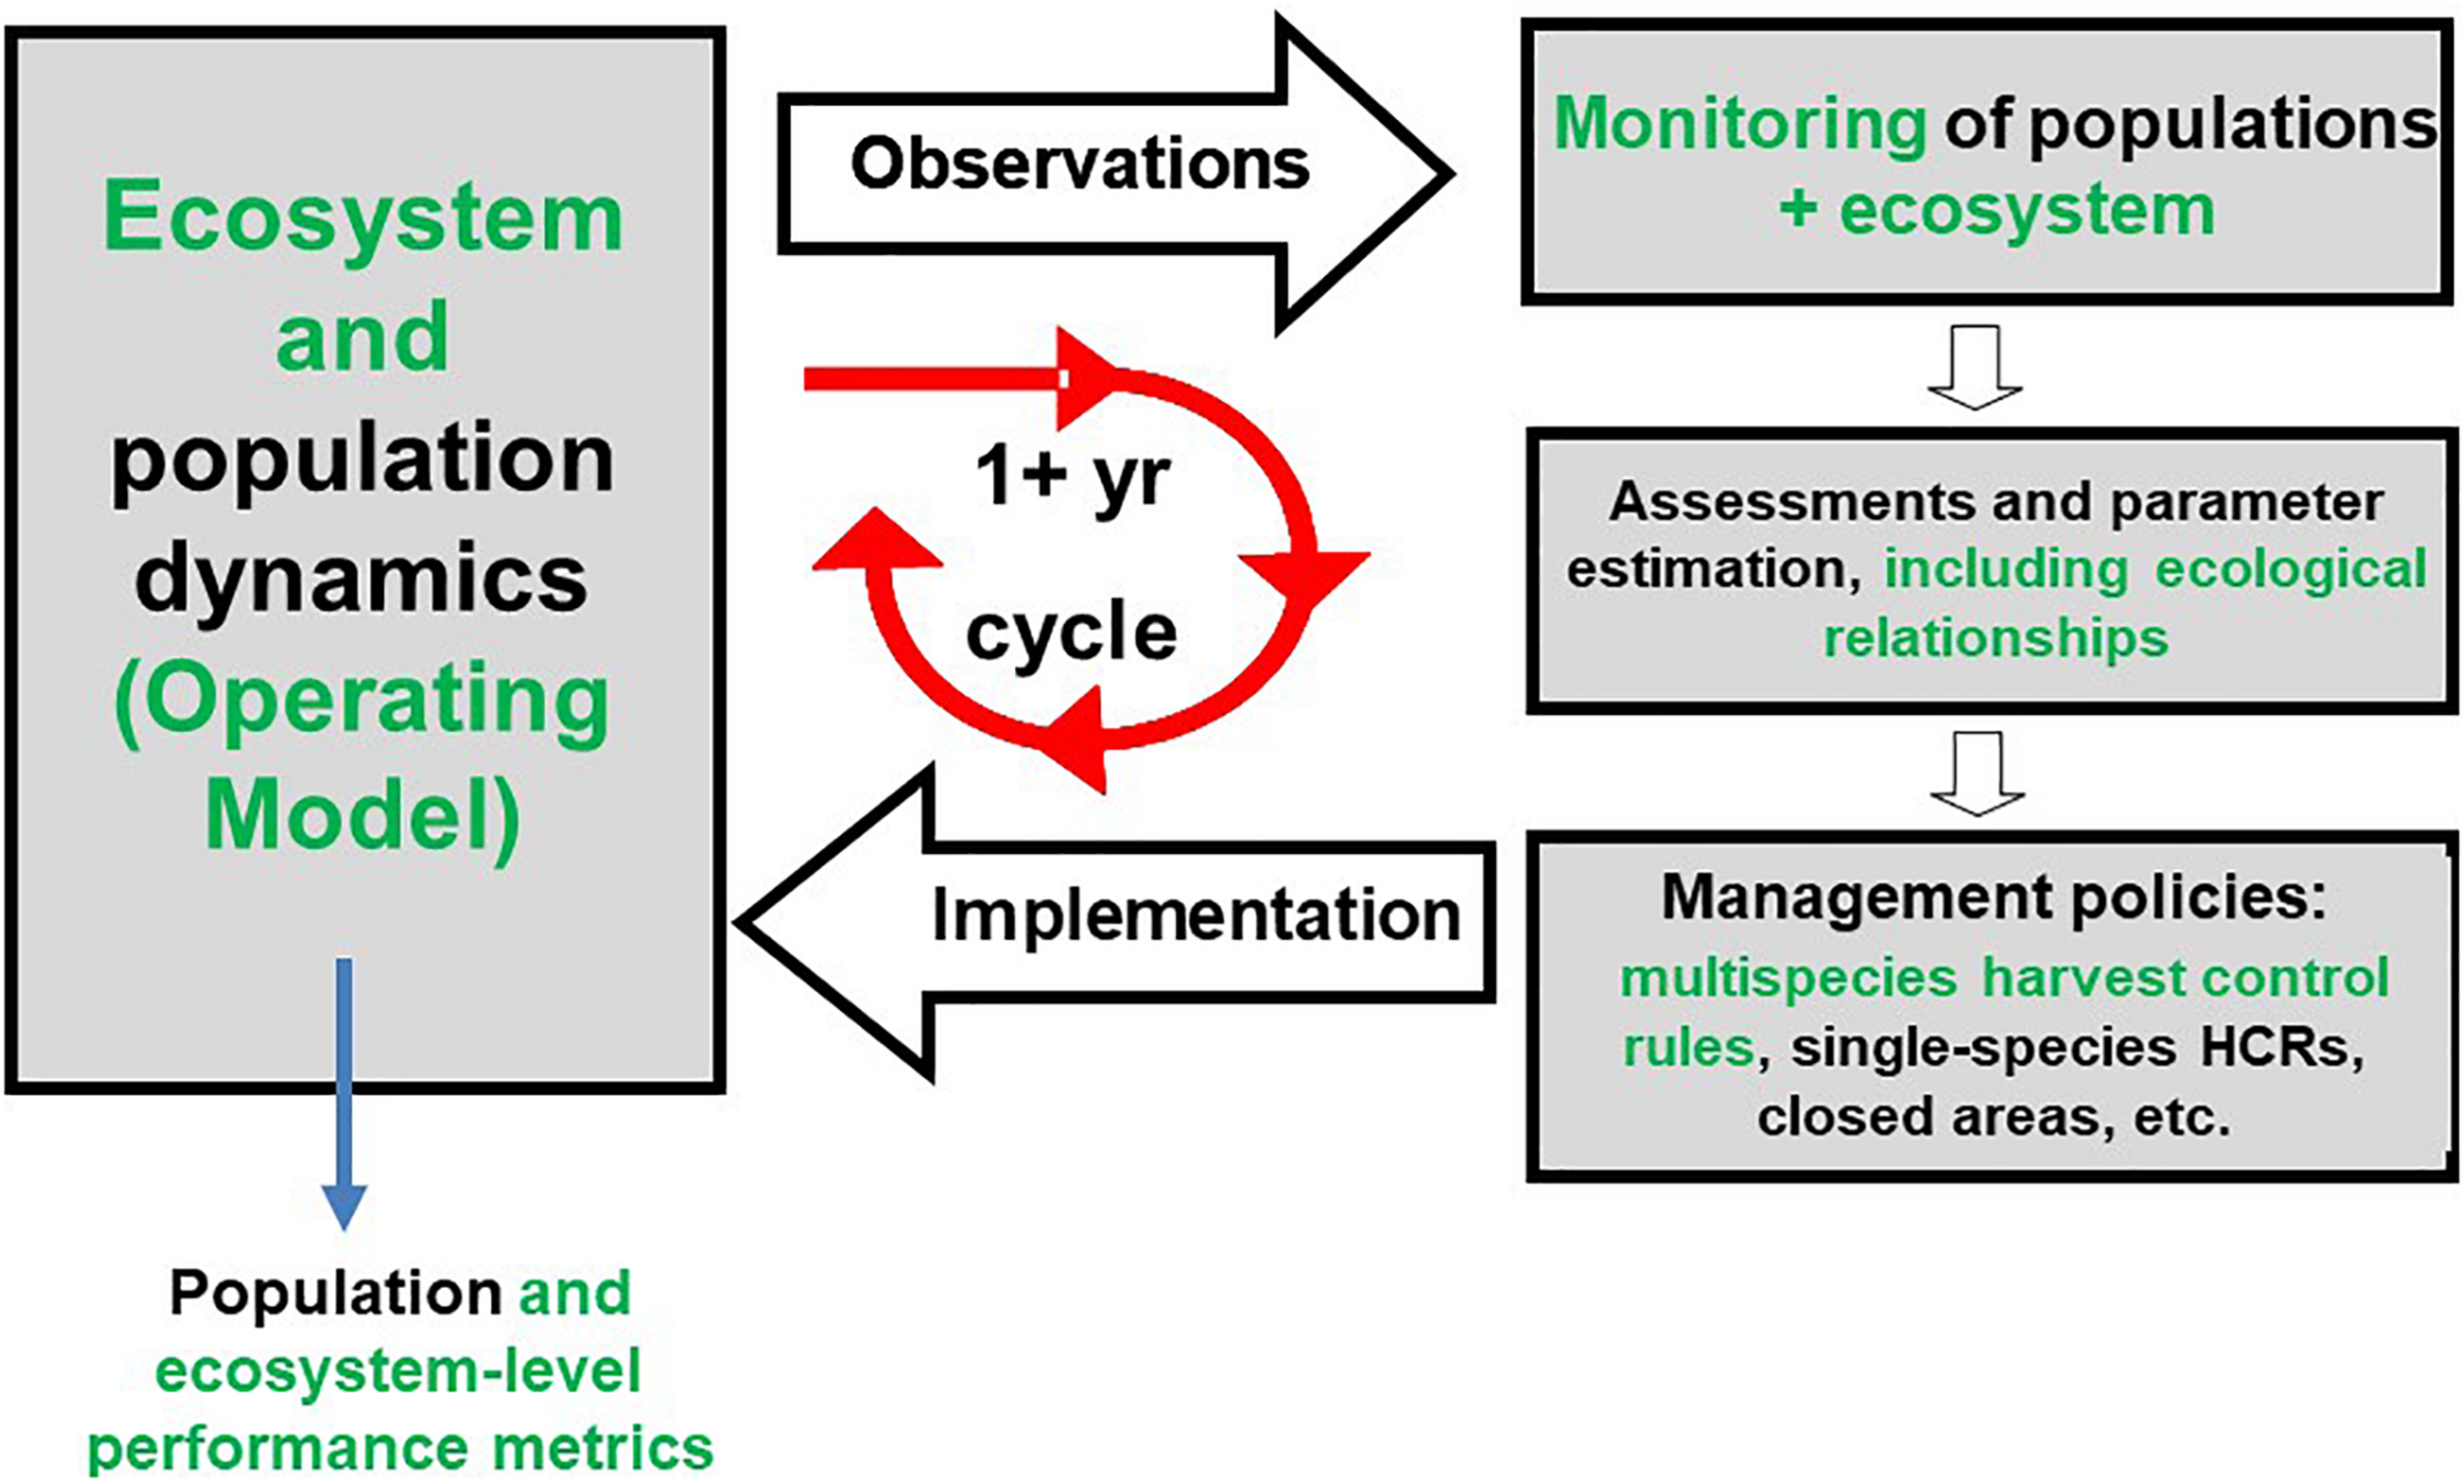
Adapted from Sainsbury et al. (2000). Management strategy evaluation iteratively tests performance of our monitoring, assessment and policies (right side) within the simulated ‘virtual world’ of the operating model (left side). Here we highlight in green some of the ecosystem aspects that can be incorporated into each step of the MSE loop.
The key components of a MSE process can be expressed in a set of general steps (see Punt et al., 2014b), and these can be mapped to the MSE loop (Figure 1). Operating models represent the simulated dynamics of the fishery system and will include components for the population and ecosystem dynamics, fishery resources, and social-economic aspects of the fishing fleet dynamics. Monitoring simulates observations of the populations or ecosystem represented by the operating model, with realistic error, survey design and intensity. Assessment and Parameter Estimation involves analyzing the simulated monitoring data, typically by applying a Bayesian or frequentist estimation model configuration to fit the simulated monitoring data. Alternative management policies are implemented to influence the dynamics of the fishery system to achieve the management objectives, typically via feedback or ‘closed-loop’ policies that depend on the dynamic state of the fishery system. Performance metrics represent the management objectives in a tangible manner (Feeney et al., 2019). Via an iterative process of simulation and replication, the MSE ‘experiment’ aims to see how well each management policy performs conditioned on the operating models and estimation models, and how this policy ranks against others. This simulation experiment requires that the set of paired combinations of an operating model and management strategies be simulated with sufficient randomization and replications to assess the relative performance of the tested strategies.
Historically many MSEs have been devised for management focused on individual species, with ecological processes such as drivers of recruitment or growth being implicitly included (de la Mare, 1986; Bergh and Butterworth, 1987). For example, MSE has been used to evaluate management systems for the international Baltic cod (Gadus morhua) fishery (Bastardie et al., 2010), including comparing controls on fishing effort (input controls) versus catch (output controls), while accounting for key uncertainties in cod recruitment regimes and fleet adaptation. MSE has also been used to assess the sensitivity of a newly employed management procedure in a rock lobster (Jasus edwardsii) fishery to non-stationarity in processes such as recruitment and growth (Punt et al., 2013). More recently, environmental drivers of stock productivity and catchability, such as temperature and oxygen, have been explicitly included into MSE (e.g., A’mar et al., 2009; Ianelli et al., 2011; Froehlich et al., 2017; Haltuch et al., 2019a, b). MSE has also been used to assess the value of incorporating short-term sea surface temperature forecasts into the harvest guideline for Pacific sardine, Sardinops sagax (Tommasi et al., 2017).
The value of further incorporating ecosystem processes into MSE has been emphasized in the literature and in recent policy documents guiding the United States approach to Ecosystem Based Fishery Management (EBFM) (Link et al., 2015; Busch et al., 2016; NOAA, 2016a, b). At the same time, stakeholders increasingly recognize the need to develop MSE frameworks able to assess performance of management actions relative to ecosystem-based objectives. For instance, in management of small pelagic fisheries, provision of adequate forage for dependent species is an important management objective to evaluate and requires use of multi-species ecosystem models (e.g., Robinson et al., 2015; Punt et al., 2016b). Within the US, bolstering the representation of ecosystem processes within MSE helps address EBFM goals including recognizing “physical, biological, economic, and social interactions among the affected fishery-related components of the ecosystem, including humans,” and optimizing “benefits among a diverse set of societal goals” (NOAA, 2016b). Other nations have similar commitments to EBFM (FAO, 2003, 2009; EU, 2008; Hobday et al., 2011). In the United States the emphasis on diverse goals, and trade-offs among them, is underscored by sometimes conflicting mandates to safeguard fisheries, endangered species, and marine mammals. Additional mandates include treaty agreements with sovereign tribes, which are considered in policy decisions related to fishery harvest, for instance within ‘usual and accustomed’ fishing areas in the Pacific Northwest. Cultural objectives and related tradeoffs are also important, and outside the United States they have been directly incorporated into MSE for small-scale fisheries (Plagányi et al., 2013). Identifying trade-offs among these mandates is a key concept of EBFM (Brodziak et al., 2004; Link, 2010; NOAA, 2016a). MSEs encourage stakeholders to identify management objectives and lay bare trade-offs among them, and as such are inherently suited for use in EBFM.
As we illustrate below, many types of ecosystem modeling can serve as “raw material,” to slot into various locations within the MSE loop (Figure 1). A variety of ecosystem models have been developed to support EBFM (Plagányi, 2007), including in the United States (Townsend et al., 2008, 2014, 2017, 2019; Link et al., 2010). Model types include whole ecosystem models; models of intermediate complexity that either extend single species approaches or explicitly include multiple species; individual-based models; bioenergetic models; length-based and size-spectrum models; and multivariate statistical approaches (Plagányi, 2007; Link et al., 2011). However, only a limited number of examples (e.g., Fulton et al., 2014, 2019) have brought these models formally and fully into MSE, though some authors have noted the value of doing so. For instance, Punt et al. (2014b) called for more ecologically realistic operating models, while also bringing in realistic uncertainty to simulated monitoring, assessment, and management. NOAA (2016a) noted that “executing MSEs at the ecosystem level can capture major drivers, pressures, and responses, as well as emergent properties that would be missed if explored on a taxa-by-taxa basis.” These authors acknowledge that building on the extent to which MSEs incorporate ecological mechanisms, and leveraging ecosystem modeling capacity to do so will increasingly be a fruitful way to address uncertainties and refine science and management.
MSE Is Expanding Beyond Single Species Approaches Into EBFM Applications
Here, we describe how and why MSE is growing from a single species approach to one relevant to ecosystem science. In particular, different ecosystem modeling approaches can slot within each of the components of an MSE (Figure 1), to meet particular natural resource management needs.
Ecosystem models can serve as operating models for MSE, providing simulated population and ecosystem dynamics that include ecological complexity sufficient to challenge simulated monitoring, assessment, and management policies. In the United States, for example, we have developed multiple ecosystem, food web, individual-based, and size-spectrum models (see for example National Ecosystem Modeling Workshop workshops: Townsend et al., 2008, 2014, 2017; Link et al., 2010). The trophic and spatial complexity of these models means that they differ in assumptions from commonly used stock assessment methods, thus providing an alternative test of estimation models and management strategies. Ecological models often include alternate scenarios for climate, oceanography, and ecological relationships (e.g., Punt et al., 2016b; Marshall et al., 2017; Woodworth-Jefcoats et al., 2019), which can bound the uncertainty around operating model dynamics within the MSE simulation testing (Link et al., 2010, 2012).
Ecosystem models can also contribute to consideration of monitoring to better design surveys, sampling density, and sample sufficiency. Using a relatively simple spatial and environmentally driven model of Pacific hake (Merluccius productus), one case study below investigates sampling and monitoring of this species, and how this affects management performance. Fulton et al. (2019) compared performance of data-rich to data-poor assessment and management strategies, illustrating the potential value of monitoring data to improve decision making. Alternatively, ecosystem models can identify sensitive, responsive metrics that can be derived from monitoring data and that capture shifts in ecosystem-level response (Hollowed et al., 2020).
Within an MSE, assessments and estimation models can explicitly include terms representing the effects of predation, growth, recruitment, and environmental relationships (Holsman et al., 2016; Haltuch et al., 2019b), and the performance of these terms can be tested within MSE. Such tests have been included in studies addressing both climate and predation impacts on stock assessments in the Northeast United States (Miller et al., 2016; Trijoulet et al., 2019, 2020). For the Bering Sea, the CEATTLE model (Holsman et al., 2016) is being used to evaluate the performance of alternative climate-informed and climate naive reference points for use in multi- and single-species assessments. In this study, the operating model includes process error via temperature effects on growth and random draws of recruitment impacted by climate (Holsman et al., 2020) for both single (decoupled species) and multispecies modes (coupled models through bioenergetics-based predation between species) of the model. Simulated assessments estimate fishery and survey selectivity, as well as predator prey suitability, and biological reference points are estimated following the approach of Holsman et al. (2018).
Multispecies and environmental considerations can be built into harvest control rules, which can be tested in MSE (Kaplan et al., 2020). Robust relationships between productivity of a stock and an environmental driver can be challenging to identify, particularly for species with long pre-recruit survival windows (Haltuch et al., 2019a). However, when such relationships exist (e.g., Haltuch et al., 2019b), catch limits can be increased or decreased depending on current environmental conditions, which serve as a proxy for the population’s productivity. For instance, the harvest strategy for Pacific sardine adjusts the harvest fraction depending on water temperature (Hill et al., 2019), and this harvest strategy and alternatives were extensively tested in an MSE framework before adoption of this rule (Hurtado-Ferro and Punt, 2014). An MSE has also been employed to test performance of this harvest guideline based on forecast, rather than recent past, temperature conditions (Tommasi et al., 2017). Fulton et al. (2019) developed MSEs with end-to-end ecosystem operating models, demonstrating that aggregate catch limits set at a group level can be more effective at achieving both economic and conservation objectives than single-species harvest strategies. Related simulations analyses by Gaichas et al. (2017) found similar results when incorporating aggregate catch limits within a management procedure; in this case the multi-species operating model was length-structured and included predation and temperature-dependent consumption. As demonstrated in the case study below involving swordfish fishing closures, MSE with spatial operating models can be used to assess performance of different spatial management strategies, including those that are dynamic and environmentally informed. Ecosystem models can also test the utility of ecosystem indicators in novel decision criteria and harvest rules (Fay et al., 2015; Fulton et al., 2019; Tam et al., 2019) that extend beyond classical single species management.
Management strategy evaluation is explicitly focused on allowing managers and stakeholders to see trade-offs (Smith, 1994) – and increasingly these tradeoffs are multi-species and multi-sector, therefore there is a natural progression toward ecosystem considerations and applying ecosystem models to calculate performance metrics reported from MSEs. This is increasingly the case as we attempt to devise management that is robust under climate change and in an increasingly crowded ocean. Many early examples of MSE (Bergh and Butterworth, 1987; Punt and Donovan, 2007) focused on single species, with limited examples of pioneering multispecies approaches (e.g., Sainsbury, 1988). More recently, operating models have developed to incorporate objectives and performance metrics that include multiple species (Dichmont et al., 2008), spatial structure (Hurtado-Ferro et al., 2014), and predator–prey interactions (Punt et al., 2016b).
Case Studies
Here, we present case studies that illustrate how MSE in the United States is being increasingly expanded to include ecosystem considerations. We highlight methods, tool development and lessons learned, and the added benefits relative to single species MSE approaches. We focus on recent case studies that emphasize different components of the MSE process. One or more of the coauthors of the present manuscript participated in development of each of these case studies. Most have been featured within the National Ecosystem Modeling Workshops mentioned above, but here we summarize them for broader audiences. In general, these case studies are strategic investigations in which the models represent key aspects of the ecology, fisheries, and management, but are not fully conditioned on (i.e., statistically fitted to) observed historical data. For a recent United States example of ecosystem models conditioned on observed survey biomass, harvest, and diets, we refer the reader to Holsman et al. (2020). We set our four case studies within the goal of full ecosystem MSE, as depicted in Figure 1. We note when shortcuts were necessary, or when aspects of the MSE loop have not yet been completed; these approaches were taken in line with the primary aim of highlighting progress and opportunities to incorporate ecosystem aspects into MSE.
Testing Operational Stock Assessment Approaches With Atlantis Ecosystem Models: The Best of Both Worlds
Goal of the Project
There is a critical need to identify estimation model (stock assessment) configurations that are robust to ongoing changes in fish population dynamics that result from ecosystem variability and climate change (Karp et al., 2019). While MSEs are routinely conducted with stock assessment modeling frameworks (e.g., Kell et al., 2007), these frameworks are not designed to directly incorporate climate-driven cumulative impacts to population dynamics (e.g., temperature and/or ocean acidification driven changes in growth combined with changing predator–prey interactions). While end-to-end ecosystem models, such as Atlantis (Fulton et al., 2011), can account for climate drivers and cumulative impacts directly, incorporating full operational stock assessment models within Atlantis presents a substantial challenge, and achieving thousands of replicate Atlantis runs per MSE scenario (as would be needed if Atlantis was used as an estimation model) requires more computing power than many institutions have. For practical MSEs that fully evaluate cumulative climate impacts on stock assessment to identify assessment methods that are most robust to real-world complexity, some combination of approaches is needed.
For the California Current and Nordic/Barents Seas, a project is underway to simulation test estimation models using Atlantis ecosystem operating models; these estimation models mimic those used in real-world stock assessments. Ecosystem models for the California Current off the United States West Coast (Kaplan et al., 2017; Marshall et al., 2017) and Nordic and Barents Seas off Norway (Hansen et al., 2016, 2019a) have been forced with climate scenarios that include ocean acidification and warming ocean temperature. These ecosystem models are spatially explicit and include biological groups ranging from primary producers to top predators. Scenarios run with Atlantis ecosystem models have demonstrated the cumulative impacts of temperature and ocean acidification changes throughout food webs around the world (Olsen et al., 2018).
In this case study, simulated ‘‘data’’ are being extracted from climate-forced Atlantis models to perform stock assessments on small pelagic and larger demersal species across two ecosystems. As noted above, this case study is a strategic exercise that does not condition models on any particular historical period, but instead generates simulated data that roughly captures species and ecosystem productivity and variability. A new R package (atlantisom1) was developed as part of this project to extract both true and “sampled” survey index and catch data from the ecosystem models, and pass data to the Stock Synthesis 3 (SS3; Methot and Wetzel, 2013) assessment framework as the estimation model. Within SS3, the initial focus has been to evaluate the efficacy of different modeling structures for somatic growth (e.g., time-varying, empirical, or constant), to account for changing productivity driven by climate change over the simulated time period. Initial proof-of concept results are included here, and because the tools are being developed to be generally applicable, this approach can be used to evaluate the robustness of any stock assessment method to climate-driven changes in population dynamics (or to other cumulative impacts simulated within Atlantis). A central feature of the case study is that the structural assumptions of the stock assessment differ from those of the complex operating model (Atlantis), similar to the way that we expect the stock assessment to differ from complex real-world ecological dynamics.
Where in the MSE Loop the Ecosystem Considerations Are Added
Compared to most MSEs to date, this effort uses a more complex operating model (Atlantis), with the primary benefit of generating realistic scenarios for climate-driven time-varying growth and mortality in the future. For example, Atlantis models can be driven by 3D fields of temperature, salinity, pH, and water flux from fully resolved oceanographic models (e.g., ROMS) to produce complex ecosystem reactions to the changed conditions and emergent food web and fishery responses. In our case, the California Current Atlantis model is driven by ocean conditions that include differential warming along the coast and at depth that increases carnivorous zooplankton (euphausiids) biomass, which in turn drives a response of an increase in forage fish somatic growth (weight-at-age) and therefore biomass by the end of the simulation. The food web included in this operating model also drives larger variability in growth through the simulation period, which is driven by trophic relationships but not specifically by warming conditions. Finally, Atlantis can include recruitment variability for particular species as is needed to add realistic process uncertainty for stock assessment, and here the Atlantis operating model is parameterized to exhibit variability in sardine recruitment that mimics recruitment variability in stock assessments.
The “Assessment and parameter estimation” portion (Figure 1) does not attempt to directly incorporate ecosystem information, though the aim is to identify estimation model configurations that successfully provide advice when challenged with complex ecosystem effects. The “Monitoring” portion of the MSE loop is a simplified version of a real-world single-species stock assessment structured similarly to the Pacific sardine assessment model used on the United States West Coast, in which the “data” come from the Atlantis operating model combined with user-defined survey specifications (timing, areas, selectivity, observation error) implemented by atlantisom. Therefore, input data include both changing biology in response to ecosystem projections and realistic sampling error (Figure 2). The biology in the operating model’s 80 year fishing and climate scenario illustrated in Figure 2 responds to 30 years of unfished conditions, then 25 years of overfishing (1.5x FMSY), followed by 25 years of recovery during reduced fishing (0.5x FMSY). In this example, effects of climate change (warming) are manifest starting at simulation year 55, via Q10 effects on metabolic rates. Within Atlantis, sardine recruitment is based on a Beverton–Holt relationship, with process variability drawn from a lognormal distribution. The atlantisom package automates writing assessment input files by importing actual Stock Synthesis data input files from the Pacific sardine assessment (Hill et al., 2017), and replacing biomass, life history parameter values, and composition data with values simulated in our Atlantis operating model. Atlantisom explicitly includes options for incorporating uncertainty and bias associated with survey and catch observations. Performance metrics for assessment model evaluations are intentionally focused on those related to the stock assessment, including those related to population size, fishing intensity, and depletion (i.e., the proportion of pre-exploitation abundance to which a population has been reduced). To date, we have not dynamically included the Management policies or Implementation portions of the MSE loop; the emphasis has been on estimation model performance when confronted with a complex operating model.
FIGURE 2
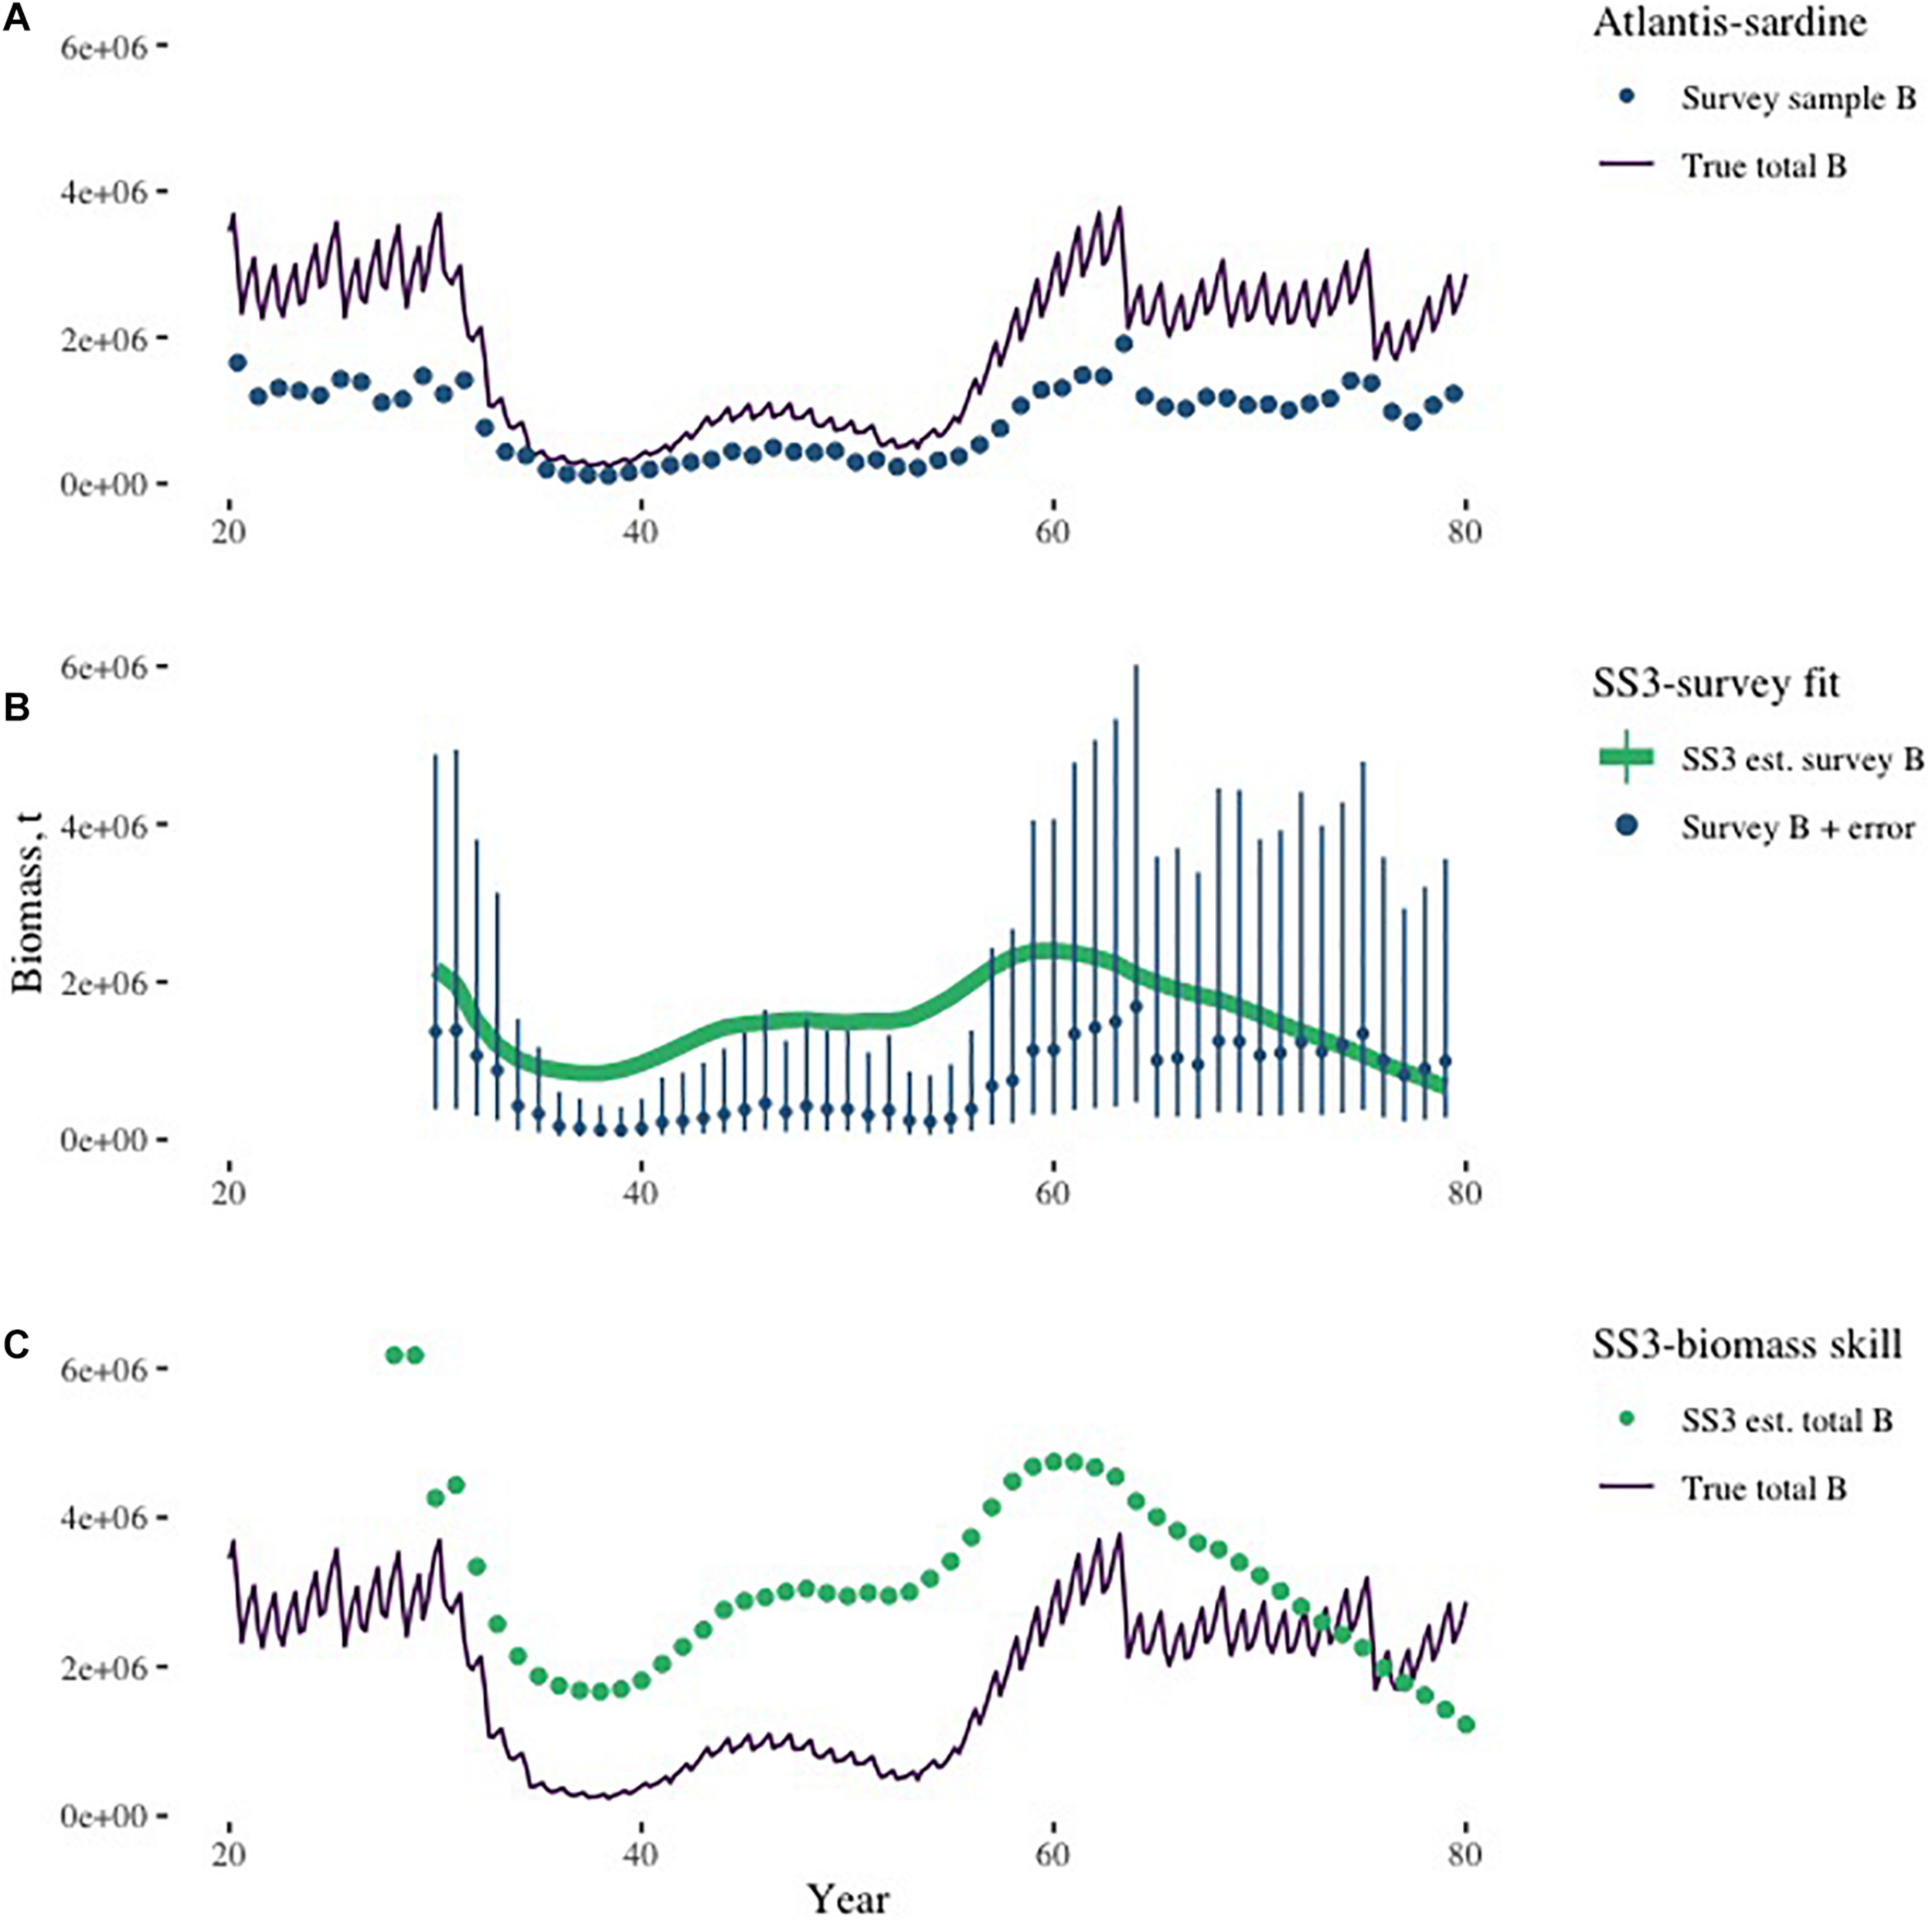
(A, top) Time series of ‘true’ (dark purple line) biomass from California Current Atlantis run with fishing and climate scenario, and survey biomass index (blue points) sampled with atlantisom (summer survey of all model areas with catchability set to 0.5, observation error set to 0.1; in other words, an excellent survey). Note that ‘true’ here means output directly from the operating model, not data from historical surveys or otherwise conditioned on real-world observations. (B, center) Example SS3 model fit (green line) to survey index generated by atlantisom (blue points with error bars); output of r4ss. (C, bottom) Comparison of true Atlantis biomass (dark purple line) with SS3 estimated biomass (green points) for a sample model run.
Results
As a proof of concept, we present outputs of a simulated single-species assessment of a small pelagic fish, using generated data from the Atlantis operating model with atlantisom as the link between Atlantis and Stock Synthesis. Using this approach, we can visualize fits to data and other standard assessment diagnostics as for any other SS3 model using r4ss, a commonly used package for SS3 output visualization and diagnostics (Taylor et al., 2019; Figure 2B). However, the added benefit here is we can now compare SS3 outputs to Atlantis “truth,” for example, for estimated biomass (Figure 2C). Users can then calculate any desired skill assessment metrics to evaluate which model configurations are most robust to the climate forcing combined with errors introduced by observation systems. One caveat is that these operating models are not conditioned on past data; though they capture key aspects of species productivity and variability, they do not recreate historical trends and are not intended as tactical tools to assess estimation model performance over real historical periods.
Lessons Learned
Using existing infrastructure for single-species modeling (such as Stock Synthesis and associated programs) is the best way to use MSE to test real-world estimation models (i.e., those found in operational stock assessments), rather than approximating with scaled down or simplified versions. This approach has the additional benefit of leveraging existing stock assessment workflows and tools to quickly construct flexible estimation models with a wide range of biological complexity and accuracy. The time-consuming component of constructing the estimation model, as is typical in stock assessment, is in data processing and model tuning.
Using existing infrastructure for ecosystem modeling (like Atlantis) is the best way to incorporate complex biophysical interactions likely to be encountered in the real world into MSEs. A common criticism of simulation testing in general is that it is difficult to produce data with as many challenges as are observed in the real world; Atlantis combined with atlantisom allows the user to create a complex virtual world and an observation system with similar bias, variability, and autocorrelation, but still have true characteristics for comparison with estimation model outcomes. Additionally, the complex Atlantis model allows us to explore how biophysical interactions may manifest through the ecosystem to affect the species dynamics visible to the estimation model, i.e., tracing ecological mechanisms and identifying the direction and magnitude of potential changes in recruitment, growth, and mortality, rather than pre-specifying these changes as might be necessary in a simpler operating model.
There are also a growing number of tools developed specifically for the construction of single-species MSEs. Tools associated with single-species models are increasingly more flexible in accepting input data of a number of different structures while the range of single-species models is expanding to facilitate quickly and efficiently running MSEs (ss3sim: Anderson et al., 2014, MSE, mseR). Our study highlights the importance of these flexible tools for MSE; historically most single-species MSEs have focused on parameter misspecification and not model misspecification, where operating and estimation models differ in scope (e.g., single-species vs. ecosystem). The value of “mix-and-match” tools that can pair different simulations with evaluation structures enables faster construction of MSEs with a wide variety of model specifications. This also allows flexibility in cases when practical logistics limit the deployment of a complex model, for instance due to constraints on staff, computing, or data. We envision the atlantisom package or similar tools to be useful to construct ecosystem model-derived data for a variety of single-species models across other model types. The atlantisom code in particular is being applied to the California Current, Norwegian, and Northeast US Atlantis models, and should be generic to the 30+ Atlantis models developed globally. The atlantisom code is also now being used to pass Atlantis operating model data to Norwegian cod estimation models that apply the State Space Assessment Model (SAM) and a Bayesian production model, rather than SS3.
Swordfish Spatial Closures, and Future Seas
Goal of the Project
The Future Climate Change and the California Current Project (‘Future Seas,’ Pozo Buil et al., 2021) aims to develop end-to-end MSE frameworks for three fisheries in the California Current Large Marine Ecosystem (CCLME), namely Pacific sardine, albacore (Thunnus alalunga), and swordfish (Xiphias gladius), to identify climate-resilient management strategies for these fisheries and to evaluate the impacts of climate change on the fishing communities that depend on them. As distribution changes for all three species are expected to occur in response to climate change, it was important that the operating models be spatially explicit, and that the species distributions would be reflective of changes in the regional oceanography. To that end, each operating model integrated data on regional historical and future projections of the oceanography and biogeochemistry of the CCLME produced by a high-resolution regional ocean model (ROMS), downscaled from global climate models. The operating models also needed to be spatially explicit to link changes in distribution to port-specific landings and social vulnerability indices. Stakeholder engagement suggested that port-level metrics and profits were key performance metrics. Below we focus on the swordfish MSE.
The swordfish MSE was created to evaluate spatial management strategies used for bycatch mitigation (Smith et al., 2021). The drift gillnet fishery (DGN) was used as a case study, given the availability of spatially explicit catch data from an extensive observer program, the existence of a large static spatial closure aimed at reducing bycatch of leatherback turtles, Dermochelys coriacea (the Pacific Leatherback Conservation Area, PLCA), and the development of a multi-species dynamic bycatch risk tool for this fishery (‘EcoCast’; Hazen et al., 2018). The MSE was designed to simulate swordfish catch and the bycatch of leatherback turtles and blue sharks (Prionace glauca) by a dynamic fleet that moved in response to static and dynamic time-area closures. This is an example of a multi-species MSE in which the species are not trophically linked. There are very few observed bycatch events for leatherback turtles in the DGN, which made evaluation of the PLCA and a dynamic alternative challenging. Instead, our analysis used this fishery and these species as a foundation to create a realistic, but flexible, simulation to evaluate static and dynamic closures more generally. Part of this evaluation was identifying conditions in the fishery (such as the size of an observer program), and characteristics of the bycatch species (such as the strength of static geographic associations), that influenced the relative performance of static and dynamic closures. Our static closures consisted of either a box drawn around the majority of observed bycatch events (based loosely on the PLCA), or a static correlative model of bycatch risk based on latitude and longitude only. The dynamic closure was based on the EcoCast approach, which identifies areas of high and low bycatch risk based on correlative species distribution models.
Where in the MSE Loop the Ecosystem Considerations Are Added
Ecosystem elements are included in the operating model and management policies. Our operating model consisted of: (1) statistical models, informed by ROMS, to predict potential catch and bycatch of three species throughout the fishable domain (the United States West Coast Exclusive Economic Zone); (2) an agent-based model to simulate fishing locations and effort in open areas (Smith et al., 2020); and (3) the calculation of catch and bycatch at the simulated fishing locations (Figure 3). The management process simulated three possible closure scenarios: no closure; a static closure encompassing most observed bycatch events (enacted for part of the year, like the current PLCA); and a daily updated dynamic closure (based on EcoCast). These closures then determined the locations available to be fished in the operating model. The static and dynamic closures were created using data from a simulated observer program, which provided the management process with the catch and bycatch data from a subset of fishing trips. The different closure scenarios were evaluated against performance measures including catch and bycatch, and trip-level profits (at both the fleet and port levels). Three species were modeled: swordfish (the target species, which influences fishing location decisions), leatherback turtles (the key bycatch species, and focus of the spatial closures), and blue shark (a common bycatch species in the DGN, and able to be considered in the multi-species EcoCast framework).
FIGURE 3
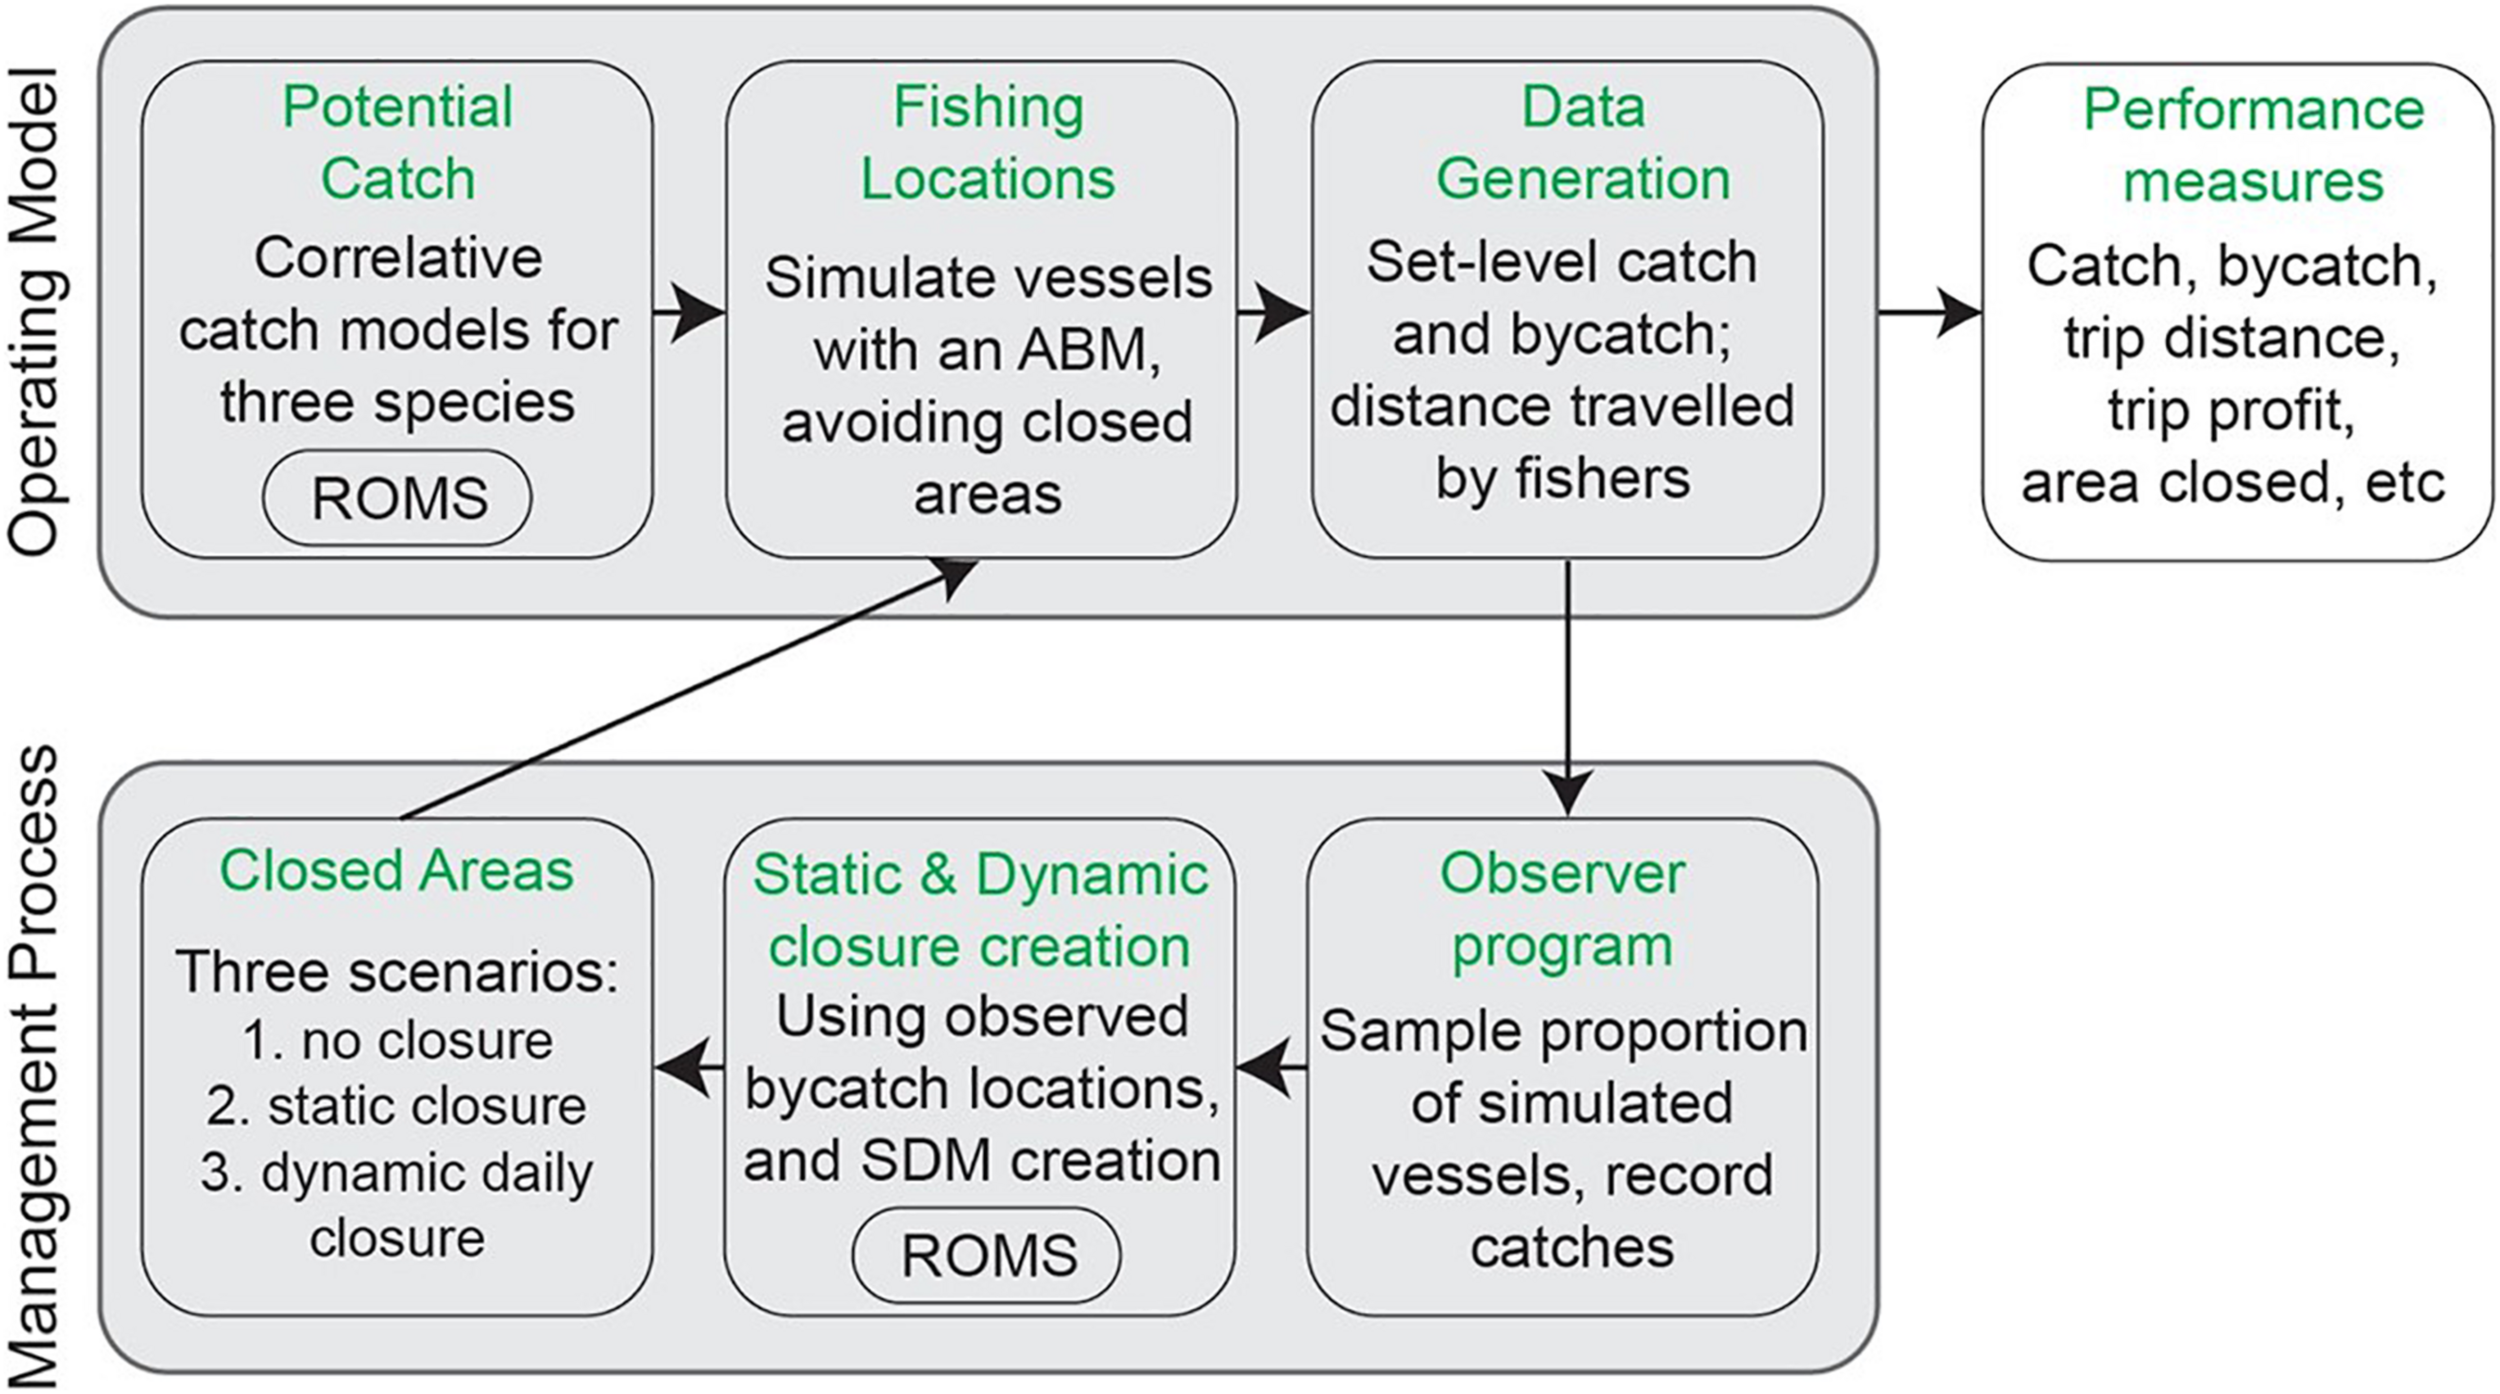
A schematic of the structure of the swordfish MSE, evaluating various spatial closure strategies. ABM, agent-based model; SDM, species distribution model; ROMS, regional ocean modeling system.
Given the reliance of this simulation on fine spatial resolution and correlative models, we ignored population dynamics – assuming that stock size was constant and localized depletion could be ignored. We considered this a reasonable assumption, given our more general focus on comparing static and dynamic closures, as well as the relatively low bycatch rate of leatherback turtles, the high mobility of swordfish, the comparatively small amount of stock-wide fishing mortality for swordfish due to the drift gillnet fishery, and the stability of the Western and Central North Pacific Ocean swordfish stock (ISC Billfish Working Group, 2018).
Results
Our focus was on comparing the relative performance of static and dynamic closures under various scenarios of species distribution and data availability. It was clear that highly dynamic closures require considerable data, and when data are scarce or species have less dynamic habitats, a static closure can be most effective (Static closure, Type 2 in Figure 4); but to avoid effort redistribution issues the static closure should be designed to close areas based on potential (not observed) bycatch. However, static closures can close large blocks of area and greatly impact fishing opportunity (Static closure, Types 1 and 2 in Figure 4). When sufficient data exist, and the species is associated with dynamic ocean variables, more complex models can be developed to create spatial closures (i.e., based on species distribution models) which often close less area, or leave open ‘pockets’ of lower risk habitat, with less impact on fishing opportunity (Dynamic closure in Figure 4). It also became clear that if a management goal is to reduce current bycatch levels, closures would ideally account for the distribution and redistribution of fishing effort (not just the distribution of species), especially for widely distributed bycatch species with low occupancy in their suitable habitat. This is because closures may close areas that are rarely fished (so bycatch is not reduced), or may move fishing into only moderately less risky habitats (and bycatch is not reduced as much as expected). In these cases, failing to consider the fishery distribution means that very large reductions in fishing effort are required to successfully reduce bycatch.
FIGURE 4
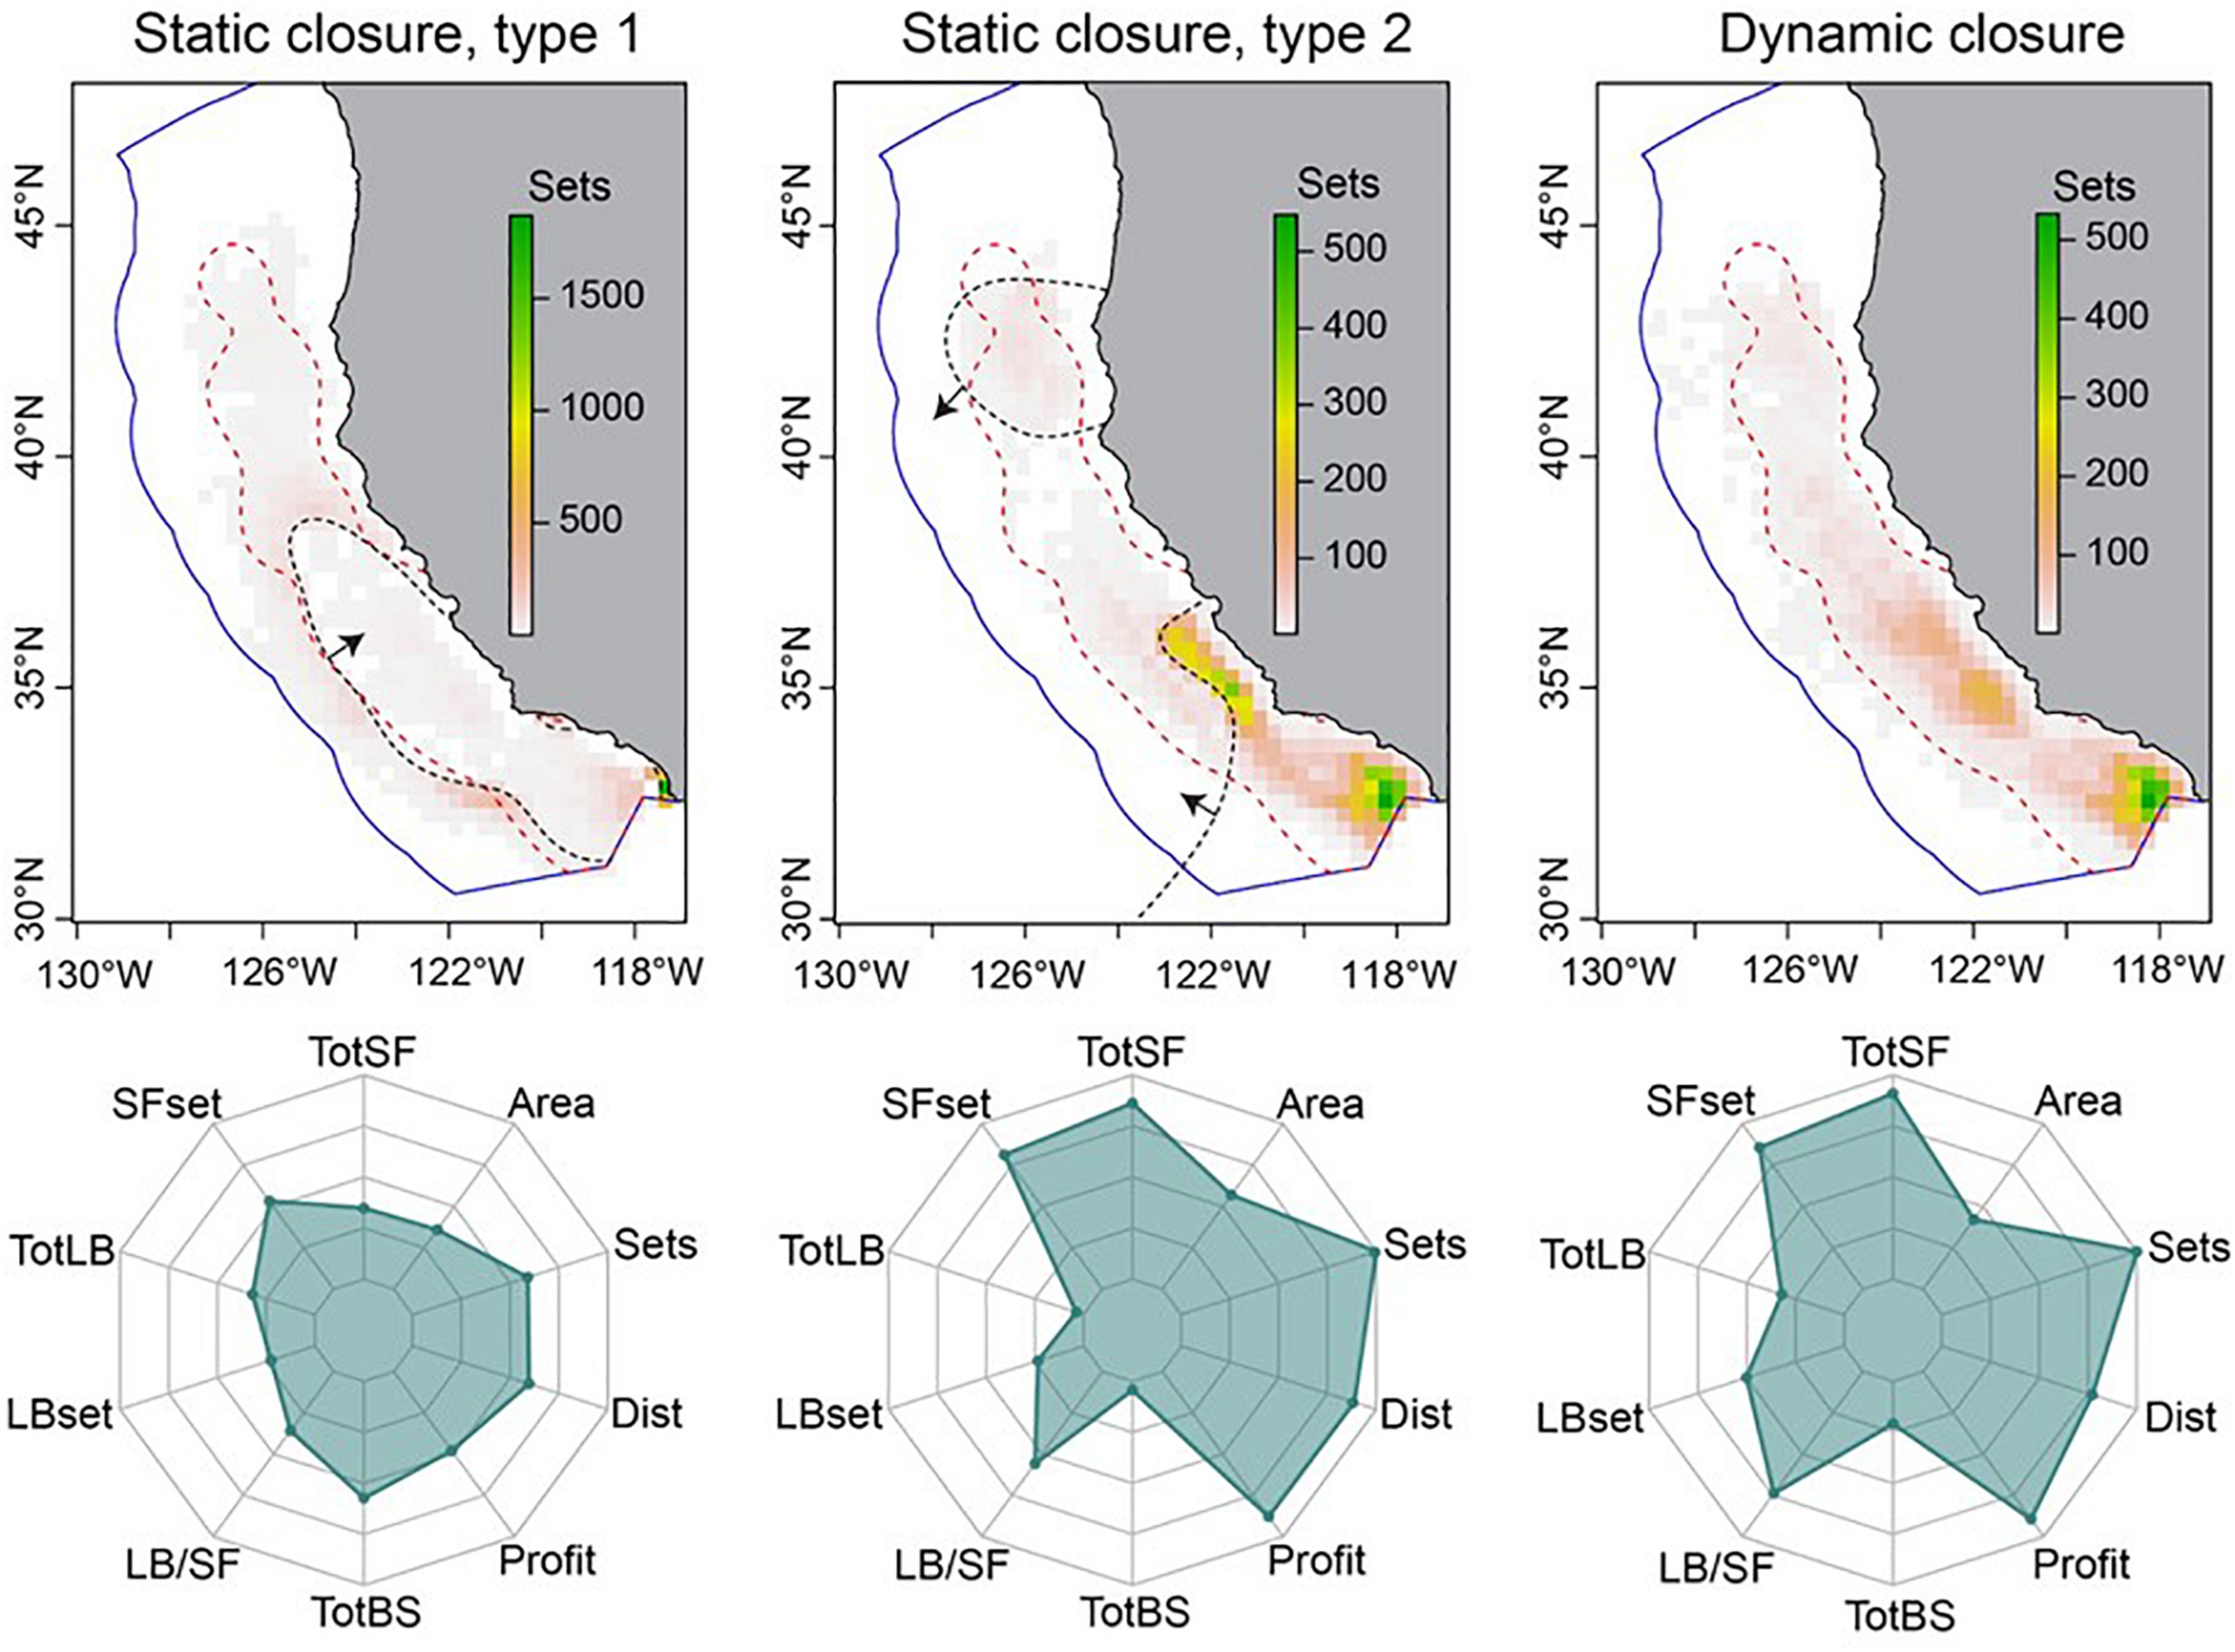
Example results from the spatial closure MSE. The maps show the distribution of fishing effort (number of simulated sets) under three closure scenarios (two types of static, and one dynamic). Under each map is a corresponding radar plot summarizing mean closure performance, relative to no closure, for 10 performance metrics (values toward the outside of the plot indicate better performance). The dashed red line is the observed historical fishing effort, and the black dashed line is the static closure boundary (arrows indicate the closed side; dynamic closure not shown). The distribution of effort in the no closure scenario was most similar to the distribution in the dynamic closure scenario. The ten radar plot performance metrics are: ‘TotSF’ total swordfish catch per fishing season; ‘SFset’ mean number of swordfish caught per set; ‘TotLB’ total number of leatherback turtles caught per season; ‘LBset’ mean number of turtles caught per set; ‘LB/SF’ the number of turtles caught per swordfish caught; ‘TotBS’ the total number of blue sharks caught per season; ‘Profit’ the mean profit per fishing trip from swordfish revenue minus fuel and crew costs; ‘Dist’ the mean distance traveled per fishing trip; ‘Sets’ the number of successful fishing sets (i.e., effort); ‘Area’ the amount of area open to fishing. Figure adapted from Smith et al. (2021).
Lessons Learned
This MSE highlighted the modeling challenges associated with working across models from different disciplines and resolutions. Regional ocean models are highly spatially and temporally resolved, as are agent-based fishing models, whereas population dynamics models used in stock assessments are generally run at seasonal or yearly resolution for a single spatial domain. In the swordfish case study, it seemed prudent to forego attempts to integrate population dynamics, given the desired high spatial resolution of our closures. These challenges in creating a realistic operating model drove our decision to create an MSE that examined more general aspects of spatial closures, rather than a tactical analysis of the optimum turtle closure for the DGN itself. An interesting challenge was having both a correlative operating model (i.e., the statistical catch models) and a correlative management scenario (the dynamic closures based on SDMs built from data simulated by the operating model). This created a scenario in which managers could have perfect information on the location and drivers of species distributions. Thus, a key consideration was ensuring realistic error entered the MSE during the data subsetting process in the observer program stage, and the SDM creation process in the closure creation stage (Figure 3), which was achieved by ensuring similar accuracy of EcoCast in the real and simulated worlds. Multi-species MSEs like this one, with fine spatial and temporal resolutions, and aimed at modeling species distributions, will likely remain challenging to build for management of particular fisheries and species. This is why we did not use this analysis to identify the best closure strategy for a specific fishery, but instead created a realistic fishery on which to test multiple variations of the operating model and management process to identify conditions under which static or dynamic closures performed better.
Pacific Hake MSE: Testing the Robustness of Transboundary Management to Monitoring and Climate Change
Goal of the Project
The Pacific Hake MSE focuses on a single species, exploring how a dynamic migratory stock responding to future scenarios of climate change could influence the ability of the binational management body to meet its objectives. Pacific Hake is managed under an international treaty between the United States and Canada, and an ongoing MSE process is occurring in close collaboration with managers and industry representatives from both countries. A hake-focused MSE is now in its second iteration, having begun several years ago motivated in part by Marine Stewardship Council certification (Tavel Certification Inc, 2009). The previous iteration explored the performance of the harvest control rule in the face of uncertainty in assumed parameter values (Hicks et al., 2016). The focus of this iteration of the Hake MSE has shifted and the complexity of the operating models has increased.
Goals for this iteration of the hake MSE were co-created by analysts and the international management body responsible for the management of Pacific Hake, the Joint Management Committee (Jacobsen et al., 2020). The three goals are to (1) evaluate the performance of current hake management procedure under alternative hypotheses about current and future environmental conditions; (2) better understand the effects of hake distribution and movement on both countries’ ability to catch fish; and (3) better understand how fishing in each country affects the availability of fish to the other country in future years.
Where in the MSE Loop the Ecosystem Considerations Are Added
The operating models for the Hake MSE are spatial, with two areas, one for United States and one for Canada, and have four seasonal time-steps. Hake move between areas, with higher density in the northern area in summer and in the southern area in winter. The fraction of fish that move northward is a function of fish age, with a larger fraction of older age classes migrating northward (more detail on model specification and parameterization available in Jacobsen et al., 2020). The movement and distribution of fish roughly matches recent research on spatially and age-dependent relationships between temperature and the hake distribution observed by an acoustic survey (Malick et al., 2020).
We are exploring two types of management procedures and two types of uncertainty scenarios in the Hake MSE to address the goals above (Jacobsen et al., 2020). The alternative management procedures explore the performance of the current harvest control rule and the effects of changing the frequency of fishery independent surveys. The harvest control rule mimics the threshold rule that is in place for hake (and many other species globally), implementing a default harvest rate when stock biomass is above a trigger reference point, reducing the harvest rate as stock size declines, and prohibiting fishing below a limit reference point or minimum stock size. The uncertainty scenarios explore the sensitivity of performance to future hypotheses about climate-driven movement and changes in the age-dependent selectivity of the fisheries in the two countries. Here we focus on evaluating the robustness of the status quo harvest rule with alternative observation frequencies to climate scenarios.
This MSE explores all the major categories of uncertainty. In particular, an observation model is simulated from the operating model with error, and an estimation model closely mimics the coastwide (non-spatial) assessment model currently in use. We also included an implementation model in several scenarios (not described here) to account for catches being consistently below the annual catch limit imposed by managers, which in turn is typically lower than the allowable biological catch under the treaty.
Within the MSE loop (Figure 1), ecosystem considerations are included in the operating model implicitly in the form of climate change scenarios that force fish movement as described above. Ecosystem considerations are not included in other aspects of this MSE. The choice of simplicity here was made to explore the sensitivity of the operating model to assumptions about movement. If assumptions about movement have large implications, then we could build additional complexity and more realistic projections. However, if changing the movement rates (i.e., fraction of the stock moving northward) has little effect on the performance metrics, then building a more complicated model and scenarios may be of less value. Performance metrics currently focus on stock status, catch, variability in catch, and spatial metrics that describe biomass and catch in the two countries.
Results
Simulation testing suggests that the current harvest rule used for hake is relatively robust to the climate scenarios explored, at a coastwide scale. Shifting the distribution of the stock northward resulted in less than ten percent change in relative spawning biomass and long-term average catch. However, the spatial structure in the model reveals larger changes in diverging directions in each country (Figure 5). If temperature-driven movement pushes more of the hake population into Canadian waters in summer in future years, the model projects slightly lower median biomass and catches in the United States and slightly more median biomass in Canada. Future catches in Canada are not projected to increase with greater biomass because the allocation of the coastwide catch between the two countries is fixed by the international treaty. However, the model does not capture any adaptive changes that could occur in the fisheries within each country; we assume full utilization of the quota if fish are present in an area and assume there will be no changes to the seasonal distribution of fishing mortality for either country during the projections.
FIGURE 5
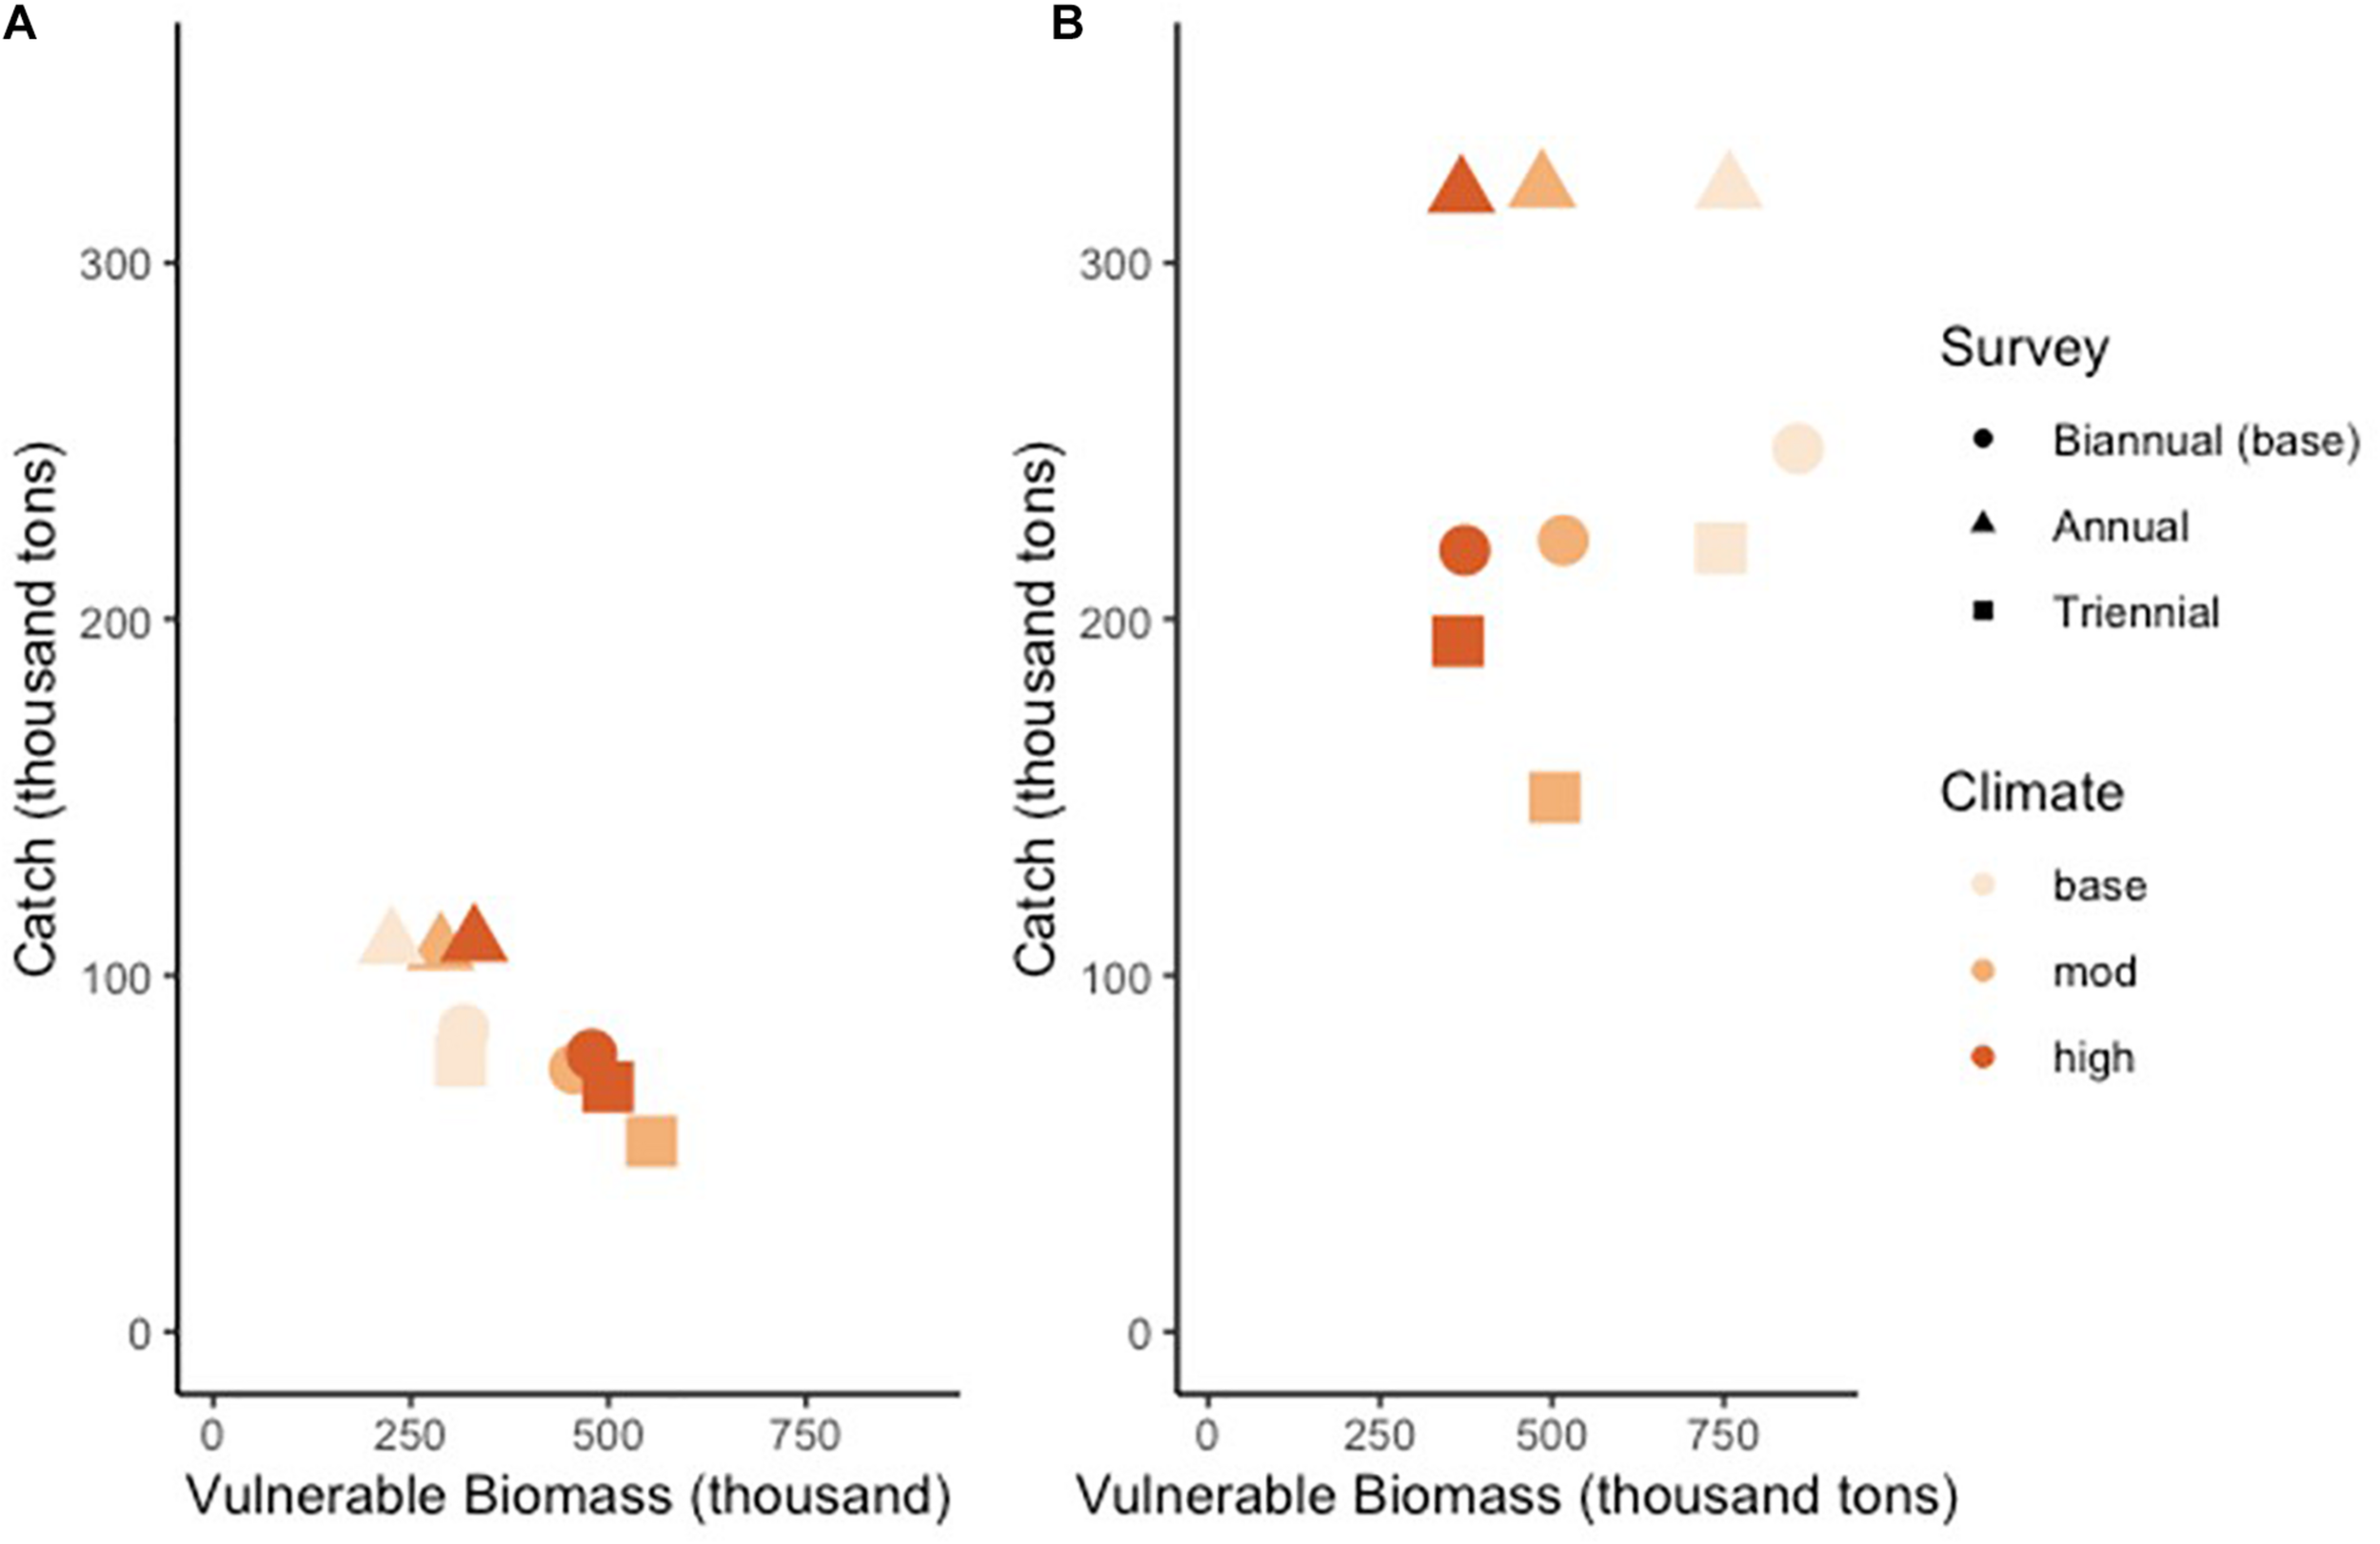
Trade-offs between long-term catch and mid-year vulnerable biomass in Canadian (A) and United States (B) waters under alternative fishery independent survey frequencies and hypothesized climate change scenarios that shift the distribution of the hake stock northwards during the fishing season. Each point represents the country-specific median of average vulnerable biomass and catch in the last 10 years of a 30 year projection over 100 simulated trajectories combining a survey frequency alternative and climate change scenario.
The alternative survey frequencies show that catches could increase with more frequent monitoring, even with a northward shift in the distribution of the population. This benefit is stronger for the United States fishery and increases with more dramatic climate-driven movement. Less frequent surveys lead to lower long-term median catches, but the effect is smaller than with increased survey frequency. These results are driven by increased uncertainty in the estimate of stock size with decreased frequency of observation resulting in increased probability of over-shooting the trigger reference point of the harvest control rule. Annual surveys allow the harvest rate to be set higher and with lower uncertainty.
Lessons Learned
Starting from an operating model that mimics an assessment model currently in use and building complexity iteratively has pros and cons. This project was developed from a previous iteration of the MSE with an operating model very similar to its estimation model (Hicks et al., 2016). New questions posed about the consequences of spatial structure and climate change required a more complex operating model (Pacific Hake Treaty Scientific Review Group, 2015). The goals for the MSE led to an operating model with spatial complexity (2-areas with fish moving seasonally between them). We chose to limit complexity because there were very limited data to inform the spatial distribution of the stock across seasons and its range, and general familiarity with and acceptance of the structure of the current assessment model by the hake management bodies. While the climate scenarios are qualitatively informed by empirical research, linking variability in hake distribution to temperature (Malick et al., 2020), they are more accurately characterized as sensitivity tests rather than true climate change scenarios (Punt et al., 2014a). Limiting operating model complexity at the expense of biophysical realism can save time in the model building phase of a MSE project and may facilitate quicker review by scientific review panels that tend to be familiar with the structure, assumptions, and behavior of assessment models. A potential downside of an approach that builds incrementally from an assessment model may be a tendency to undervalue the potential influences of structural assumptions that are similar between the operating and estimation models on the performance of alternative management strategies.
Multi-Species Harvest Control Rule in the Gulf of Mexico Using Atlantis
Goal of the Project
The Gulf of Mexico (GOM) MSE case study implemented a “blanket” harvest control rule to manage six reef fish groups in the GOM, using the Atlantis ecosystem model (Fulton et al., 2004). These reef fish included four species of snappers (Lutjanidae) and groupers (Serranidae) that are managed in the GOM using single-species stock assessments2, an aggregated group of Deep Serranid species, and an aggregated group of Other Lutjanids. However, considering all six reef fish groups can be co-caught by the same fishing gear (Saul and Die, 2016), assessing the efficacy of adapting a blanket policy seemed practical.
The term blanket was used in this application to describe how the chosen threshold harvest control rule considered the available biomass of all six reef fish groups simultaneously – under one “blanket” policy. Although the policy was applied across the reef fish at a species-complex-level, the available biomass of each individual stock was objectively considered, independently, in each iteration of the MSE, before a new fishing mortality rate (F) was prescribed in the subsequent iteration of the simulation. The primary goal of assessing the impact of changes in F at a complex-level was to show the potential benefits of a simple, adaptive management policy that could be applied across a range of co-caught species, while simultaneously accounting for ecosystem dynamics. The Atlantis model was used to explicitly represent biogeochemical processes in three dimensions (Fulton et al., 2004), while also simultaneously capturing interspecific interactions and fleet dynamics, and the role of these dynamic processes in implementing sustainable multi-species fisheries (Masi et al., 2018).
Where in the MSE Loop the Ecosystem Considerations Are Added
The Atlantis model of the GOM was applied as the operating model in the MSE loop. The parameterization and calibration of the operating model is specified in Ainsworth et al. (2015) with diet uncertainty characterized in Masi et al. (2014) and species distributions defined by Drexler and Ainsworth (2013). At each iteration of the GOM Atlantis MSE simulation, the biomass of the assessed stocks was fed internally (at annual time steps) into the Assessment and Exploitation submodels (Figure 6). Atlantis’s Exploitation submodel defines modeled fishing fleets, and was used to parameterize fleet-specific behavior: gear type, targeted species and selectivity pattern (Fulton et al., 2004). The Atlantis Exploitation submodel then supplied the simulated data to the Assessment submodel; note that this submodel was applied because it includes the integrated (“closed-loop”) MSE routine, even though in this case the assessment was assumed to have perfect knowledge of stock size (Figure 6). The Atlantis operating model included trophic interactions, biogeochemical processes and human interaction (via fleet dynamics).
FIGURE 6
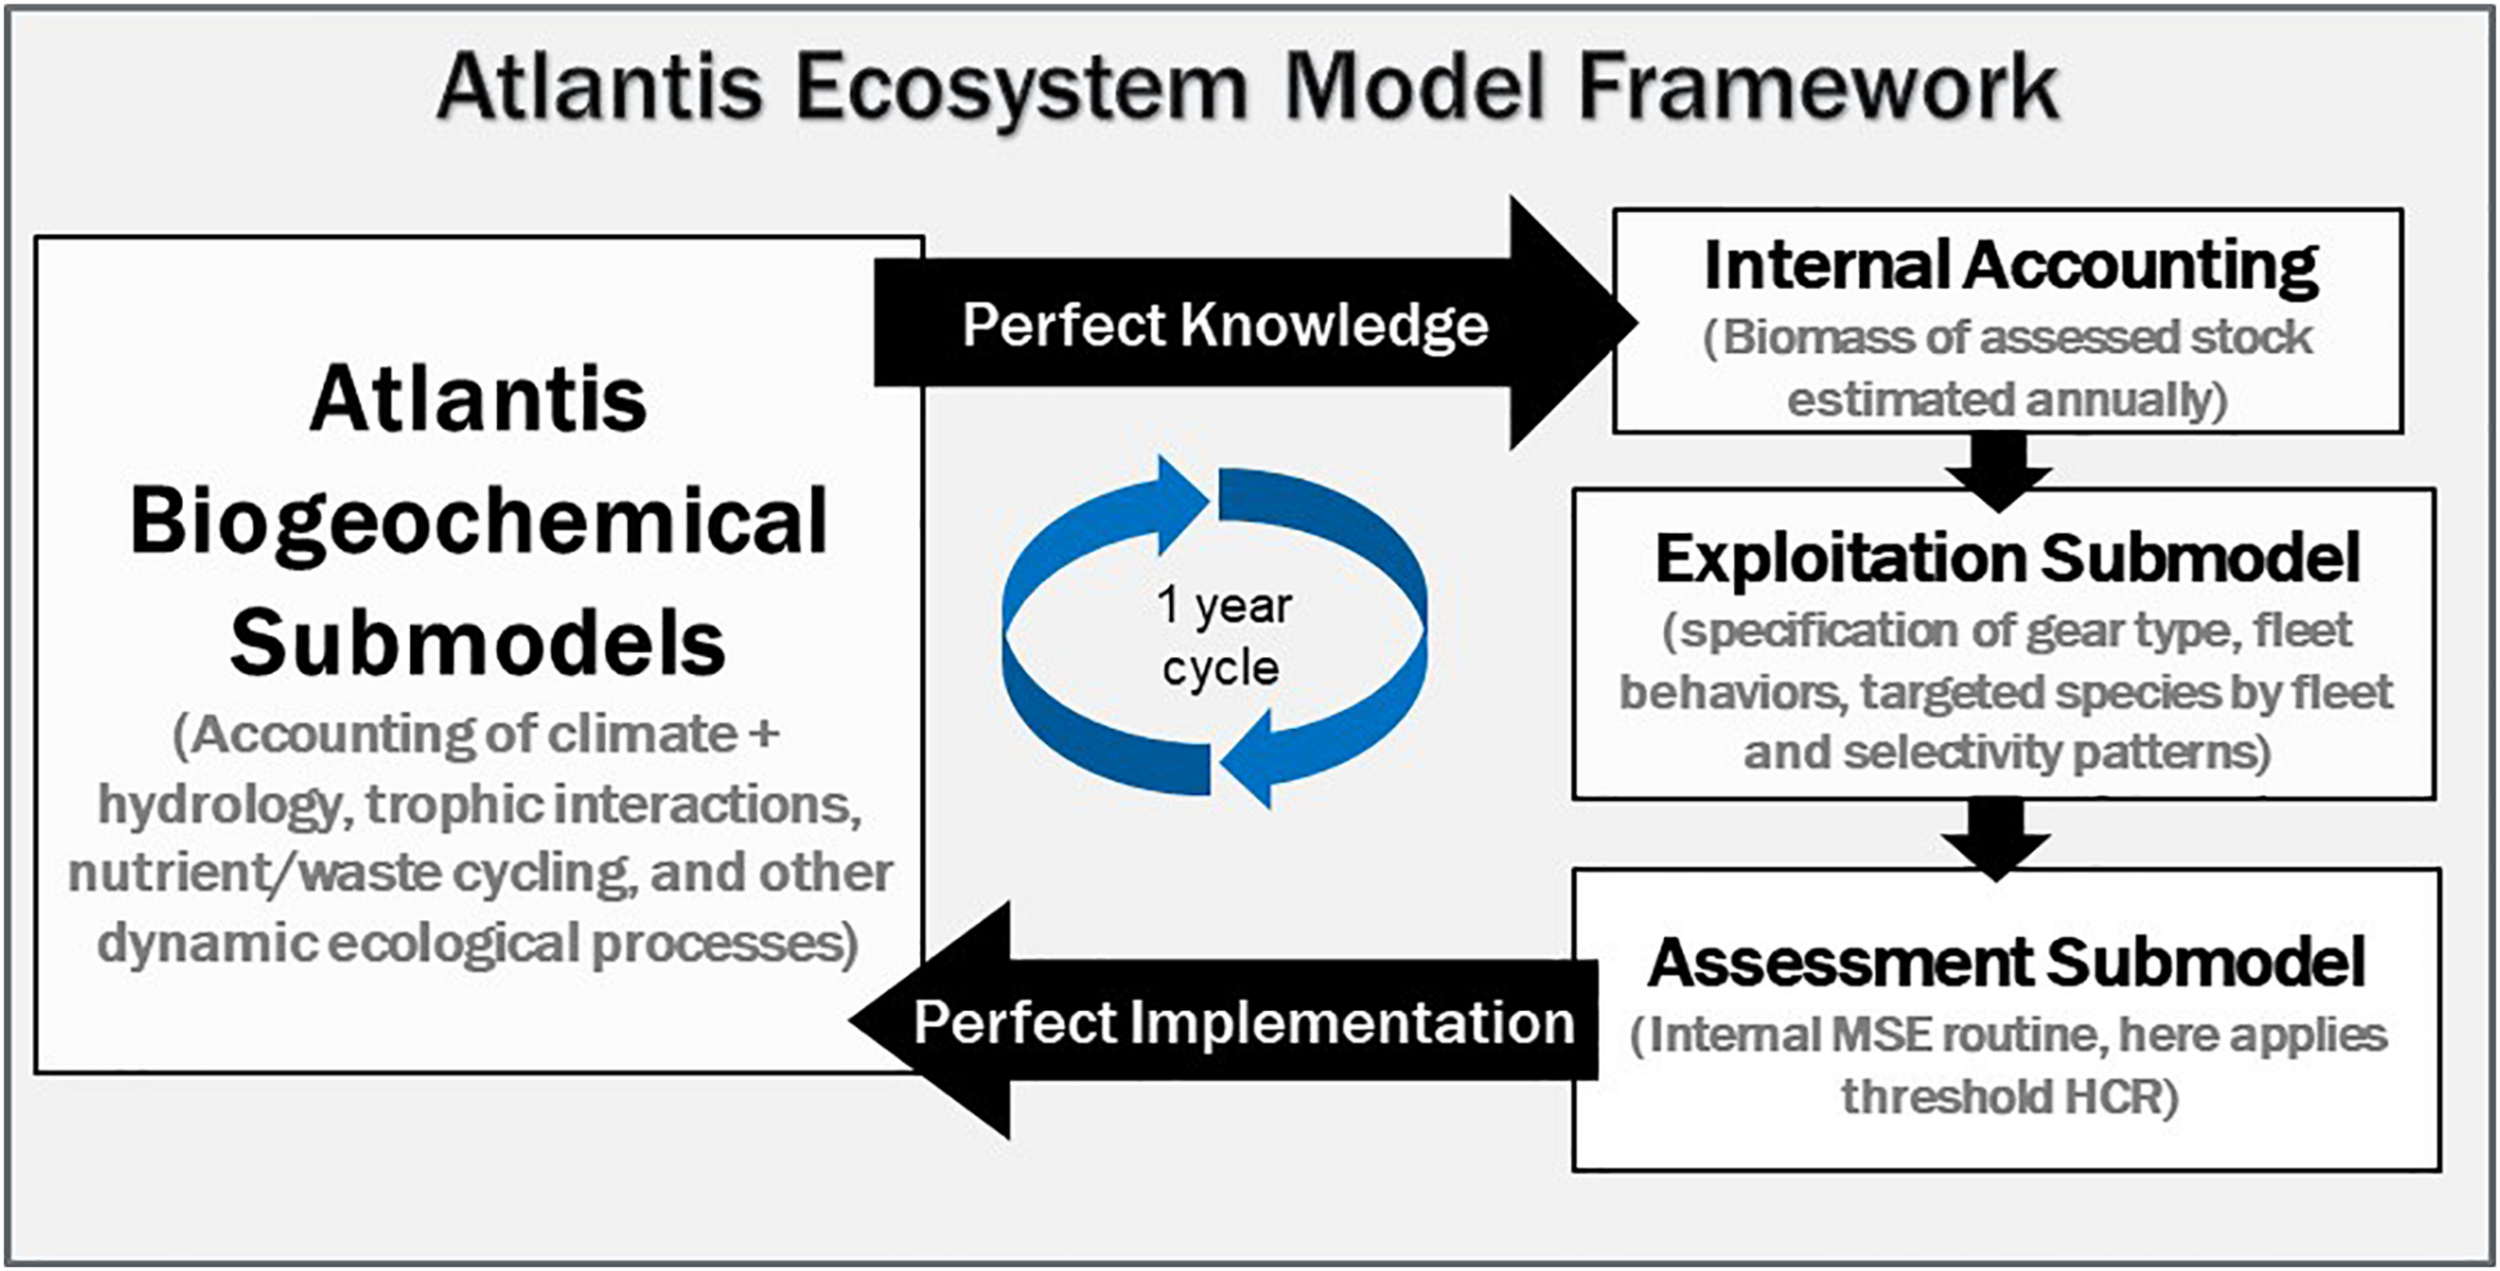
Atlantis submodels utilized in the Gulf of Mexico multispecies harvest control rule testing of Masi et al. (2018). This parallels the general MSE loop illustrated in Figure 1.
Performance Metrics, Objectives, and Trade-Offs, and How These Were Identified
The GOM Atlantis MSE used ecosystem-level performance metrics that were based on analysis in Masi et al. (2017), which evaluated a suite of GOM ecosystem indicators to assess their efficacy in tracking ecosystem perturbations that are caused by changes in F. Specifically, Masi et al. (2017) found that reef fish catch, Gag Grouper (Mycteroperca microlepis) biomass, and biodiversity metrics were among the top indicators, and these were subsequently utilized to score performance in the MSE. Additionally, ecological trade-offs were quantified by summarizing biomass at the guild level, which for instance illustrated interactions between species groups such as the shrimp, crab and benthic invertebrate guild, the pelagic fish guild, and the “all” reef fish (i.e., the assessed reef fish plus all other reef fish functional groups).
Results
By applying the harvest policy at a blanket-level, the GOM Atlantis ecosystem MSE was able to assess the impact of applying varying levels of F for all six reef fish groups both simultaneously and objectively. High levels of F applied to the reef fish complex, under the threshold harvest control rule, achieved a more Pareto-efficient trade-off frontier, where both higher levels of reef fish biomass and catch were attained (at equilibrium). This Pareto-efficiency was achieved because under higher levels of F, more of the large, carnivorous reef fish (those typically targeted by the fishery) were removed earlier in the simulation. With the largest predators in low abundance, smaller reef fish (those that are co-caught, but not typically targeted among the six assessed reef fish) had more prey available (thus increasing their productivity). This is considered a “cultivation effect,” where a reduction in top predators in the short term (i.e., in this case, the first 1–5 years of the simulation) resulted in increased productivity of the reef fish complex – as a whole, in the long term (Masi et al., 2018). To bracket the uncertainty associated with prey preference, this application utilized the Dirichlet distribution to define 10 alternate parameterizations of trophic pathways (Masi et al., 2014). Results were found to be robust to this uncertainty in trophic interactions and diet. Thus the trophic interactions were critically important in the model projections, but the cultivation effect was consistent across realistic uncertainty in the diet and trophic interactions.
Lessons Learned
In this MSE the biomass ‘observed’ by the Assessment submodel was derived annually using perfect knowledge, and simulated policies were implemented without process error (Figure 6). However, in reality stock assessments are not often performed annually, and assessment and implementation error can be substantial. Therefore the results could be considered a theoretical maximum benefit of applying a blanket, threshold harvest control rule policy to manage these 6 reef fishes. Future analyses should account for operational and implementation uncertainty, such as the ability of fishers and managers to actually achieve a target F, and should vary the number of years between assessment intervals. Typically, under single-species management policies a rebuilding plan would be implemented if the assessed stock fell below an established threshold (e.g., BMSY or biomass resulting from F30%), which is similar to how the threshold harvest control rule operated in this application. However, single-species approaches do not typically account for complex, ecosystem dynamics like the role of interspecific interactions on the available biomass of the targeted stock(s). Therefore, this MSE application offered unique, strategic insight that is not achievable through typical single-species approaches.
Discussion
Common Lessons Learned and Challenges: Case Studies
The four case studies above illustrate that ecosystem models and ecosystem approaches improve multiple components of MSEs. The ecosystem modeling approaches considered above are extremely varied, ranging in taxonomic and spatial resolution, and varying in terms of complexity of assessments and management. This demonstrates the customization that is possible (and needed) to apply ecosystem modeling to directly support a range of ocean policy and management needs, ranging from minimizing turtle bycatch to managing fishery stocks across international borders. These case studies also illustrate the collaborative, interactive process that has evolved to support Ecosystem-Based Fishery Management in the United States (Townsend et al., 2019), and we suggest MSE as a natural pathway for that evolution.
Overall, our case studies here, and others globally (Fulton et al., 2014, 2019; Surma et al., 2018; Perryman et al., 2021), also demonstrate that very often ecosystem models fit naturally into MSE as operating models, though applications elsewhere in the MSE loop are emerging, e.g., ecosystem models are contributing to assessment and parameter estimation within the Bering Sea CEATTLE model (Holsman et al., 2016, 2020; Hollowed et al., 2020). In fact, overly simple or non-spatial single species focused models may not provide sufficient contrast to explore the necessary trade-offs facing marine ecosystems and their living marine resources. As demonstrated in some of the above case studies, the inherent complexity of ecosystem models can be beneficial when these are used as MSE operating models. This complexity enables evaluation of management performance and trade-offs across a broad set of metrics that are increasingly of interest to stakeholders, such as spatial complexity and impacts of management strategies on other ecosystem components (e.g., on protected species in the swordfish spatial closure MSE or on other target species in Gulf of Mexico Atlantis MSE).
To evaluate management options in the ecosystem context, an MSE operating model needs to be more complex (i.e., incorporates a broader set of drivers and interactions) than a stock assessment model to ensure that the broader array of issues that can impact marine populations is duly considered (Fulton et al., 2014; Punt et al., 2016b). Use of ecosystem models as operating models allows for an evaluation of management procedures (including data collection and assessment methods) under a broader set of uncertainties, including non-stationary, non-linear effects of climate change and climate variability (e.g., swordfish case study) and trophic dynamics (e.g., GOM Atlantis case study) that are difficult to approximate implicitly using single-species MSE approaches. Indeed, the case studies involving atlantisom, swordfish spatial closures, and Pacific hake all illustrate the need to have sufficiently similar assumptions in the MSE operating model and estimation model to enable linking these two components, but the desire to avoid unrealistically close matches between the ‘virtual world’ and the structure of the estimation model. In these case studies, the latter was achieved by having a different model structure for the operating model and the estimation model, in addition to simulating a realistic data collection scheme. However, the level of additional structural complexity presented in the operating model varied across case studies. For instance, the atlantisom case study maximized differences in the operating model/estimation model by using two completely different modeling approaches, thus allowing a more realistic assessment of the impacts of structural uncertainty on assessment model performance and estimated management quantities. In contrast, in the Pacific hake MSE, the operating model and estimation model were similar, but structural complexity was added into the operating model by increasing the spatial resolution from a 1-area to a 2-area model. The type of additional structural complexity in the operating model will ultimately be dictated by the management objectives of interest to stakeholders, the types of management strategies being examined, the data available to parameterize and condition more complex models, and the uncertainties thought to be most consequential for the system under consideration. Practical constraints on operating model complexity also include availability of skilled staff, computing, time limits for management decisions, and costs relative to value of the fishery or societal values related to conservation or cultural use.
The MSE process is well-suited to include the appropriate amount of complexity to address a question, with ecosystem approaches capable of informing both complexity and uncertainty in operating models. Once key objectives and uncertainties are identified and prioritized with managers and stakeholders, analysts need a range of tools available to build operating models and link them to estimation models appropriate to the situation. In some case studies here, such as for Pacific hake, limiting operating model complexity at the expense of biophysical realism saved time in the model building phase of a MSE project, facilitated reception among stakeholders familiar with the estimation model, and expedited scientific review by panels that were familiar with the structure, assumptions, and behavior of assessment models. However, more complex ecosystem analyses (Malick et al., 2020) informed the key climate driven spatial differences implemented in the hake operating model. In other cases, such as for Pacific swordfish spatial closures and the Gulf of Mexico Atlantis case study, complex ecosystem operating models incorporated more detailed system dynamics while evaluating more general management strategies. These last two cases were scientific research projects rather than management-initiated projects, and therefore were more free to sacrifice realism in the assessment estimation and management modeling, which revealed important ecosystem interactions that could not be addressed using single species assessment-based MSE.
As EBFM progresses in management arenas, approaches incorporating both ecosystem complexity and realistic assessment and management will become increasingly important, and access to a range of modeling tools will be critical. The atlantisom tool presented here aims to take advantage of Atlantis, a vetted and established ecosystem modeling framework, by making it easy to link to vetted and established stock assessment software such as SS3. This is not only efficient use of existing tools, but is a step toward including both ecological and assessment realism in an MSE analysis. Related examples that benefit from a range of modeling tools include the Atlantic herring (Clupea harengus) MSE, where a single species operating model in the spirit of the Pacific hake example here was linked to much simpler models of herring predators and fishery economics to meet the multiple objectives (and tradeoffs between them) of a wide range of stakeholders and the timeline of a management council (Deroba et al., 2019). The Bering Sea CEATTLE model (Holsman et al., 2016) similarly captures predator-prey interactions, and adds climate interactions in a much more sophisticated MICE modeling framework that is familiar to managers and reviewers accustomed to state of the art single species assessment models, and that is suited to address the key climate uncertainties identified by stakeholders. In a global review of MSE applications, Perryman et al. (2021) emphasize the need to have readily available modeling tools, particularly complex operating models, in order to properly address model error. As fishery managers tackle complex questions involving spatial relationships, species interactions, and climate effects as well as stock assessment performance, having a range of mix-and-match tools available to analysts will answer these questions more effectively and efficiently.
The case studies focused on Pacific hake, swordfish, and atlantisom, as well as previous experience (Townsend et al., 2019), all strongly argue for interdisciplinary collaboration to be a central part of MSE. Strong interdisciplinary collaboration is particularly necessary when building complex ecosystem models coupled with flexible stock assessment frameworks, as in the atlantisom case study, or when developing complex modeling frameworks for assessing climate impacts (swordfish spatial closures case study). This type of approach to MSEs requires technical expertise across the fields of ecology, biology, population dynamics, oceanography, climate science, economics, and social science, as well as experience implementing the specific modeling platforms being used. Thus, projects like atlantisom and the Pacific hake study are relatively large endeavors, but a major benefit of these efforts is the facilitation of productive collaborations that bring together a diversity of expertise. Previous experience suggests that this collaboration should extend to stakeholders, to define management objectives (i.e., MSE performance metrics), and to decide who makes those decisions (Feeney et al., 2019). In practice, stakeholder participation is an important but difficult process (see next section below). Experience with single species MSEs suggests that best practices include carefully selecting stakeholders and possibly “intermediary groups” (Feeney et al., 2019; Miller et al., 2019), education about MSE, facilitators, and extensive investment in communication and graphics (Feeney et al., 2019; Goethel et al., 2019; Miller et al., 2019).
Lessons for Ecosystem MSE From Beyond the Case Studies
The ecosystem-oriented MSE case studies presented here reflect and build upon lessons learned from single-species MSEs. First, incorporating uncertainty is a central premise of MSE, including observation errors for data inputs, process errors for system dynamics, and structural uncertainties about how the system operates (Punt et al., 2014b). Best practices for addressing uncertainty in ecosystem modeling (Link et al., 2010, 2012) apply to ecosystem models used in MSE. These best practices include methods for handling parameter, structural, and scenario uncertainty in a variety of model types (Link et al., 2010, 2012; Fulton et al., 2011; Morzaria-Luna et al., 2018; Hansen et al., 2019a). In particular, ecosystem models can play a critical role in testing the role of structural uncertainty, from testing the impacts of missing key processes using simpler variants of more complex models (Trijoulet et al., 2019) to analyses where the operating model and estimation model are fundamentally and intentionally mismatched, as in atlantisom. While some uncertain processes can be specified based on observational data, other ecosystem processes may still be largely unknown and at the frontiers of research, for instance potential fundamental shifts in ocean circulation, nutrient supply, and productivity under climate change. In these cases, the MSE process allows this uncertainty to be incorporated. In single species MSE, multiple operating models are often needed because fishery systems are complex, i.e., have many components and interrelationships among components, and have some components that are typically not observable with a high degree of certainty. Similarly, ecosystem-oriented MSE can use multiple operating models parameterized to bracket the range of uncertainties considered important by managers and stakeholders.
A second challenge identified in single species MSE has been simulating a realistic estimation model fitting process efficiently, which has also been noted in the atlantisom case study. The model fitting process for single species stock assessments may depend on individual analyst decisions on parameter specification (e.g., fixed or estimated, bounded or unbounded, etc.) as well as data weighting (Francis, 2011; Maunder and Punt, 2013). Within single species assessments and estimation models used in MSE, parameters may be unidentifiable and may need to be constrained or set at fixed assumed values rather than being freely estimated. When Ecosystem MSEs include climate and predation interactions in the estimation model, as in the CEATTLE model (Holsman et al., 2016, 2020; Moffitt et al., 2016), these fitting challenges may be exacerbated (based on a higher number of parameters), or reference points may shift relative to those calculated from single species models. Nevertheless, testing of novel, ecologically enhanced harvest control rules and reference points with MSE before implementation may require the use of ecosystem-enhanced estimation models. Such testing necessitates availability of sufficient computing resources, but would allow comparison of the potential of ecosystem-based management measures relative to those without EBM measures, at least in the near-term (Holsman et al., 2020).
Experience from single species and more complex MSEs to date demonstrates that managing and communicating large volumes of outputs and results is critical both for analysts and stakeholders (Deroba et al., 2019; Feeney et al., 2019). Calculation of performance metrics for ecosystem MSE involves adding dimensions beyond those typically handled in single species MSE. This will require a synthesis of additional performance metrics (e.g., Fulton et al., 2014) to quantify how robust individual strategies are, and their ranking relative to other strategies. Improved efficiency in analysis and output management will benefit MSE at any level of organization (see “Institutional Support for Ecosystem MSE,” below).
One of the main challenges for any MSE is stakeholder engagement (Goethel et al., 2019). As the scope of MSEs with ecosystem considerations broadens, so will the effort required to meet each element of best practice in stakeholder engagement (Feeney et al., 2019). For example, MSEs that include ecosystem considerations will have a broader suite of interested stakeholders to consider, have the need for experts from increasingly diverse backgrounds, and have more objectives with associated output metrics that must be communicated and graphically displayed. Nonetheless, for a recent example that demonstrates that Ecosystem MSE can address and communicate disparate metrics (goals) and trade-offs between them, including blending quantitative metrics for fishery targets (e.g., target species biomass or total catch) and more qualitative metrics (e.g., social wellbeing), see Fulton et al. (2019). Stakeholder and management engagement from the onset can also help strengthen the MSE approach by winnowing a large array of potential questions and metrics down to those of highest utility and importance. Inclusion of diverse perspectives helps balance tradeoff analyses through derivation of performance metrics that reflect multiple social, cultural and ecological goals (e.g., equity and diversity across profit, stability, and resiliency metrics). Finally, early engagement helps demystify models, encourages uptake and utility of results, and provides an iterative process for refining future MSEs.
Scanning the Horizon: New Ecosystem MSE Capabilities Required for Decision Making
Marine policy makers are increasingly confronted with spatial trade-offs as species shift distribution under climate change (Poloczanska et al., 2013), new ocean uses such as wind energy emerge3 (Kirkpatrick et al., 2017), and opportunities for spatial management strategies are developed (Hazen et al., 2018). Accounting for spatial structure in operating models remains a challenge for any MSE, and most analyses model a small number of zones to account for (for example) species migration (Hurtado-Ferro et al., 2014; O’Neill et al., 2014), as in the Pacific hake case study, and spatial differences in management regulations (Schweder et al., 1998; Bastardie et al., 2010), stock distribution (Dichmont et al., 2006) or population processes such as growth and recruitment (Punt et al., 2016a). Dichmont et al. (2013) designed a fine-scale MSE to evaluate spatial closures for Australia’s Northern prawn fishery, linking the spatially resolved operating model (Ecospace) to additional existing models of prawn population dynamics and effects of trawling within each grid cell. Beyond these examples, further incorporation of spatial processes in stock assessment (Mormede et al., 2017), the integration of species distribution models and population dynamics (Berger et al., 2017), and collection of fine-scale spatial data, should encourage MSE development at finer spatial resolutions. One caveat is that the configuration of spatial models may need to be reconsidered as species ranges shift under climate change. Though we have advocated ‘mix and match’ software approaches to combine available operating models and estimation models, we acknowledge that many such existing models were configured to match present-day species distributions and migratory behavior. The Pacific hake case study partly addresses the implications of future changes in migratory behavior within the California Current. However, larger scale shifts in distribution (Morley et al., 2018), driven by climate change, would force new geometries for operating models, such as the California Current and Gulf of Mexico Atlantis models which were structured around historical biogeography and fishing areas.
Similarly, improved capabilities for short and medium term ocean forecasting are needed for single species and ecosystem MSEs addressing climate impacts. While climate models provide forecasts at 50+ years that are at an appropriate timescale for many MSEs of long term harvest strategies, fishery stakeholders and managers are primarily interested in the short term performance of strategies and the implications of climate change on decisions made on the seasonal, annual, and 3–5 years timescales. Initiatives such as the NOAA Climate Fisheries Initiative (NOAA, 2020) that improve ocean model capability and availability and evaluate predictive ability at these management relevant timescales, will benefit MSE at multiple levels.
In any MSE process, one aspect of ‘scanning the horizon’ is to define ecosystem aspects (i.e., the structural design decisions) that are meaningful to users and practical and feasible for managers. For instance, trophic interactions need to be explicitly incorporated into the operating model if multi-species fisheries trade-offs are to be addressed. Length structure and time-varying growth of a stock realistically parameterized in an operating model can ultimately be used to inform its status and set catch size limits. Impacts of environmental drivers on population processes need to be represented in operating models if the potential to use climate or environmental indices for informing management is to be tested. These are critical design choices in the construction of estimation models and operating models.
Methods borrowed from integrated ecosystem assessment, such as conceptual models and risk assessments (Holsman et al., 2017) can be helpful to support these decisions and tailor the Ecosystem MSE to local needs. By qualitatively characterizing the components of fisheries systems and their interactions, conceptual models can provide an initial assessment of system feedbacks, response to perturbation, and possible management trade-offs (Dambacher et al., 2009; Harvey et al., 2016). Conceptual models and risk and vulnerability assessments can thus support the selection of ecological components and processes for the operating model, facilitate interdisciplinary communication, and help to set realistic objectives for the Ecosystem MSE (Heemskerk et al., 2003; Gaichas et al., 2016).
To inform future decision making, ecosystem MSEs should quantify performance in terms of a commonly applied set of metrics. Punt (2017) listed the standard set of performance metrics for single species MSE, including biomass, catch, variability of catch, and profit. However, Punt (2017) also noted the lack of consistent output metrics in ecosystem MSEs, though generally those metrics attempt to summarize status of habitats and non-target species, recovery of threatened and endangered species, and at times social and management objectives. In the last several years progress has been made, as many ecosystem modeling efforts have converged upon using similar sets of performance metrics based on ecological indicators and guild-level biomass (Marshall et al., 2017; Olsen et al., 2018; Fay et al., 2019; Hansen et al., 2019b; Kaplan et al., 2020; Nilsen et al., 2020). Further tailoring of ecosystem performance metrics requires long-term commitment to stakeholder engagement, which in the United States is typically at the level of Fishery Management Councils.
Institutional Support for Ecosystem MSE
In the United States, moving ecosystem MSE from an academic and research exercise to one relevant to decision making has required institutional investments (mostly by NOAA Fisheries) that can be replicated in other contexts. Firstly, NOAA Fisheries has committed to building expertise and capacity within the agency for enhanced use of MSEs and ecosystem MSE (e.g., Karp et al., 2018; Lynch et al., 2018). The NOAA Integrated Ecosystem Assessment program has identified MSEs as a core step in the assessment of the status of coupled social-ecological systems (Levin et al., 2013). Multiple strategic initiatives within NOAA Fisheries have identified ecosystem MSEs as important for effective management including the Climate Science Strategy (Link et al., 2015; Busch et al., 2016), and the Ecosystem-Based Fisheries Management Road Map (NOAA, 2016a, b) which provides a framework for ecosystem approaches and ecosystem modeling, and emphasizes MSE.
Secondly, MSE will increasingly benefit from a national (and international) focus on shared code via ‘toolbox’ support, including ecosystem, single species, economic, and protected species models housed within the NOAA Fisheries Integrated Toolbox4. This integrated, cross-disciplinary approach to hosting tools commonly used by NOAA Fisheries is in its early stages, with existing tools being added incrementally. However, by using a standardized, open-source approach, this toolbox creates the potential to better connect various tools, such as single species assessment models with ecosystem models (e.g., the atlantisom case study in this paper). This national approach to providing open access to vetted stock assessment tools has been beneficial for the progression of ecosystem MSEs, since developing a methodology for integrating ecosystem model outputs into broadly used assessment model platforms is easier, technically (e.g., atlantisom), and also provides an entry point to ecosystem considerations for the many United States fishery managers and decision makers familiar with these stock assessment models. Other available tools include methods for species distribution modeling, metapopulation dynamics, and risk assessment, among others. There is an obvious benefit of sharing lessons learned, code bases, and common tools across the disciplines within NOAA Fisheries, which ultimately reduces the time to build, test, and then use a model for an MSE application. In particular, a library of shared tools including existing vetted models for ecosystem MSE would reduce the timeframe needed for analytical development, and allow for more nimble response to management questions and allocation of necessary time to stakeholder engagement. Our move toward open access MSE tools emphasizing reproducibility builds on international efforts, including single species MSE (Kell et al., 2007) and related bio-economic frameworks (Garcia et al., 2017).
Thirdly, ecosystem MSEs in the United States benefit from recent developments in terms of model review and vetting by Fishery Councils and others. The MSE process explicitly aims to inform managers and stakeholders about the predicted implications of potential management actions. In accordance with developing scientific advice under the Magnuson-Stevens Fishery Conservation and Management Act (Anonymous, 2007), NOAA Fisheries utilizes the Center for Independent Experts (CIE)5 to perform independent peer review of agency science, and this process has previously been used to vet ecosystem models in the US (see footnote 3). However, the bulk of CIE reviews has been focused on single species stock assessments, and there is an increased demand for these as well as demand for new reviews of ecosystem models. Regional Fishery Councils should be involved early in the review process in order to facilitate understanding about model strengths and shortcomings prior to presenting MSE outputs at Council meetings. Lessons learned from successful ecosystem model reviews (Kaplan and Marshall, 2016) are being incorporated into ecosystem model updates, for example in the Northeast US.
We acknowledge that the institutional support for ecosystem MSE varies by region and nation. MSE has been used widely in South Africa and Australia, and is seeing growing use in Europe and North America in situations with relatively abundant resources to support the effort. A MSE approach in other contexts with fewer resources may look different, with simpler operating models and estimation models. The principles from the case studies we describe here still apply and relatively simple models (e.g., Carruthers and Hordyk, 2018) may be useful to form scenarios that explore uncertainty in the ecosystem implicitly (sensu Punt et al., 2014a). In some cases, limited resources may be better deployed to support a stakeholder process to improve buy-in of an eventual decision or adoption of a management procedure, rather than increasing model complexity. Ecosystem MSEs, like single species MSEs, cannot be a one size fits all approach, and need to take under consideration both research and management needs and available resources (Nakatsuka, 2017).
Conclusion and Next Steps
Management strategy evaluation, whether at the single species, multispecies, or ecosystem level, has the potential to greatly improve natural resource management by testing strategies in advance to show the potential benefits and drawbacks of each under uncertainty. Though MSE requires substantial investment, our experience within the United States has been that we gain efficiency, avoid legal challenges, and better scope the issues of a problem and in so doing improve decisions. More and more marine ecosystem stakeholders are seeing MSEs as a useful tool to address the challenges they are facing, and have begun to explicitly ask for more of this, such that NOAA Fisheries has recognized the need to expand capacity in this area. The case studies reviewed here demonstrate a wide range of applications of ecosystem information into MSE, as well as the advances in modeling – and better application of existing models – that can greatly increase the inclusion of ecosystem considerations in MSE. Although MSE is a substantial investment, it is well suited for complex questions surrounding ecosystem interactions.
Management agencies in the United States and around the world have identified needs for ecosystem MSEs. The United States Pacific Fishery Management Council recently hosted a workshop for the Scientific and Statistical Committees of the eight Regional Fishery Management Councils on the topic of MSEs to inform fishery management decisions. The workshop specifically identified “ecosystem MSEs” as a subcategory within MSEs, and noted the inherent challenges of incorporating ecosystem dynamics in the MSE process, given the complex nature of ecosystem functioning (DeVore and Gilden, 2019). The types of ecosystem MSEs identified at the workshop included MSEs focused on issues related to climate change, spatial management, multiple objectives and trade-offs, and predator-prey dynamics. Given the potential complexity of ecosystem MSEs, workshop participants emphasized the importance of effective communication to managers and stakeholders so they have enough information to remain engaged and contribute throughout the MSE process. Similarly, a Working Group of the International Council for the Exploration of the Sea (ICES) concluded that multi-species and technical (e.g., gear, mixed stock) interactions should always be included when necessary, or at a minimum, the given process be approximated to the extent possible (ICES, 2019). Also in recognition of the complexity of MSEs, ICES (2019) reviewed the common communication strategies used through much of Europe, provided an overview of available interactive graphics software, and suggested some standardization of communication tools within ICES. All of the case studies reviewed here have addressed ecosystem aspects identified by United States fishery managers, are generally consistent with international best practice, and demonstrate that the inherent challenges can be met.
Statements
Data availability statement
Publicly available datasets were analyzed in this study. This data can be found here: https://github.com/r4atlantis/atlantisomforAtlantisOMcasestudy. Other case studies refer to data archived as detailed in the cited manuscripts.
Author contributions
DT conceived the manuscript. HT led the discussions to focus manuscript. IK framed the manuscript. All the authors wrote the manuscript. SG, KM, JS, and MM created the figures. IK, SG, CS, PL, KM, JS, and MM led the case studies. SG, IK, JD, JB, KA, KH, SK, MW, and JL edited the manuscript.
Funding
The atlantisom case study was supported by the REDUS project and a NOAA Fisheries International Fellowship. The swordfish case study was supported by funding from the NOAA Climate Program Office Coastal and Ocean Climate Applications (COCA) program (NA17OAR4310268).
Acknowledgments
This manuscript is a contribution from NOAA’s National Ecosystem Modeling Workshop, held December 9–11, 2019 in St. Petersburg, FL, United States. We thank H. A. Perryman, C. J. Harvey, J. F. Samhouri, and the two reviewers for their input.
Conflict of interest
CS was employed by the company ECS Federal LLC. The remaining authors declare that the research was conducted in the absence of any commercial or financial relationships that could be construed as a potential conflict of interest.
Footnotes
1.^ https://github.com/r4atlantis/atlantisom
2.^ http://sedarweb.org/sedar-projects
3.^ https://www.mafmc.org/northeast-offshore-wind
4.^ https://noaa-fisheries-integrated-toolbox.github.io/
5.^ https://www.st.nmfs.noaa.gov/science-quality-assurance/cie-peer-reviews/index
References
1
A’mar Z. T. Punt A. E. Dorn M. W. (2009). The evaluation of two management strategies for the Gulf of Alaska walleye pollock fishery under climate change.ICES J. Mar. Sci.661614–1632. 10.1093/icesjms/fsp044
2
Ainsworth C. Schirripa M. Morzaria-Luna H. N. (2015). An Atlantis Ecosystem Model for the Gulf of Mexico supporting Integrated Ecosystem Assessment.Portland: C-IMAGE Publications, 10.7289/V5X63JVH
3
Anderson S. C. Monnahan C. C. Johnson K. F. Ono K. Valero J. L. (2014). ss3sim: an R package for fisheries Stock Assessment simulation with stock synthesis.PLoS One9:e92725. 10.1371/journal.pone.0092725
4
Anon (2018). Glossary of Terms for Harvest Strategies, Management Procedures And Management Strategy Evaluation. Available online at: http://www.tunaorg.org/Documents/MSEGlossary_tRFMO_MSEWG2018.pdf(accessed February 15, 2021).
5
Anonymous (2007). Magnuson-Stevens Fishery Conservation and Management Act.Public Law.94–265.
6
Bastardie F. Rasmus Nielsen J. Kraus G. (2010). The eastern Baltic cod fishery: a fleet-based management strategy evaluation framework to assess the cod recovery plan of 2008.ICES J. Mar. Sci.6771–86. 10.1093/icesjms/fsp228
7
Berger A. M. Goethel D. R. Lynch P. D. Quinn T. Mormede S. McKenzie J. et al (2017). Space oddity: The mission for spatial integration.Can. J. Fish. Aquat. Sci.741698–1716. 10.1139/cjfas-2017-0150
8
Bergh M. O. Butterworth D. S. (1987). Towards rational harvesting of the South African anchovy considering survey imprecision and recruitment variability.S. Afr. J. Mar. Sci.5937–951. 10.2989/025776187784522702
9
Brodziak J. K. T. Mace P. M. Overholtz W. J. Rago P. J. (2004). Ecosystem Trade-offs in Managing New England Fisheries.Bull. Mar. Sci.74529–548.
10
Busch D. S. Griffis R. Link J. Abrams K. Baker J. Brainard R. E. et al (2016). Climate science strategy of the US National Marine Fisheries Service.Mar. Policy7458–67.
11
Butterworth D. S. Punt A. E. (1999). Experiences in the evaluation and implementation of management procedures.ICES J. Mar. Sci.56985–998. 10.1006/jmsc.1999.0532
12
Butterworth D. S. Cochrane K. L. De Oliveira J. A. A. (1997). Management procedures: a better way to manage fisheries? The South African experience.Glob. Trends Fisher. Manage.2083–90.
13
Carruthers T. R. Hordyk A. R. (2018). The Data–Limited Methods Toolkit (DLM tool): An R package for informing management of data–limited populations.Methods Ecol. Evolut.92388–2395. 10.1111/2041-210x.13081
14
Dambacher J. M. Gaughan D. J. Rochet M.-J. Rossignol P. A. Trenkel V. M. (2009). Qualitative modelling and indicators of exploited ecosystems.Fish Fish.10305–322. 10.1111/j.1467-2979.2008.00323.x
15
de la Mare W. K. (1986). Simulation studies on management procedures.Rep. Int. Whaling Commiss.36429–450.
16
de La Mare W. K. (1998). Tidier fisheries management requires a new MOP (management-oriented paradigm).Rev. Fish Biol. Fish.8:349.
17
Deroba J. J. Gaichas S. K. Lee M.-Y. Feeney R. G. Boelke D. Irwin B. J. (2019). The dream and the reality: meeting decision-making time frames while incorporating ecosystem and economic models into management strategy evaluation.Can. J. Fish. Aquat. Sci.761112–1133. 10.1139/cjfas-2018-0128
18
DeVore J. Gilden J. (eds) (2019). “Sixth National Meeting of the Regional Fishery Management Councils’ Scientific and Statistical Committees,” in Report of a National SSC Workshop (Portland: Pacific Fishery Management Council).
19
Dichmont C. M. Deng A. R. Punt A. E. Venables W. Haddon M. (2006). Management strategies for short-lived species: The case of Australia’s Northern Prawn Fishery: 1. Accounting for multiple species, spatial structure and implementation uncertainty when evaluating risk.Fish. Res.82204–220. 10.1016/j.fishres.2006.06.010
20
Dichmont C. M. Deng A. Punt A. E. Ellis N. Venables W. N. Kompas T. et al (2008). Beyond biological performance measures in management strategy evaluation: Bringing in economics and the effects of trawling on the benthos.Fish. Res.94238–250. 10.1016/j.fishres.2008.05.007
21
Dichmont C. M. Ellis N. Bustamante R. H. Deng R. Tickell S. Pascual R. et al (2013). Evaluating marine spatial closures with conflicting fisheries and conservation objectives.J. Appl. Ecol.501060–1070. 10.1111/1365-2664.12110
22
Drexler M. Ainsworth C. H. (2013). Generalized additive models used to predict species abundance in the Gulf of Mexico: an ecosystem modeling tool.PLoS One8:e64458. 10.1371/journal.pone.0064458.g002
23
Edwards C. T. T. Dankel D. J. (2016). Management Science in Fisheries: An introduction to simulation-based methods.London: Routledge.
24
EU (2008). Directive 2008/56/EC of the European Parliament and of the Council of 17 June 2008 establishing a framework for community action in the field of marine environmental policy (Marine Strategy Framework Directive).Offic. J. Eur. Union16419–40.
25
FAO (2003). Fisheries Management. 2. The Ecosystem Approach to Fisheries.Rome: FAO.
26
FAO (2009). Fisheries management. 2. The ecosystem approach to fisheries. 2.2 Human dimensions of the ecosystem approach to fisheries.Rome: FAO.
27
Fay G. DePiper G. Steinback S. Gamble R. J. Link J. S. (2019). Economic and Ecosystem Effects of Fishing on the Northeast US Shelf.Front. Mar. Sci.6:133. 10.3389/fmars.2019.00133
28
Fay G. Link J. S. Large S. I. Gamble R. J. (2015). Management performance of ecological indicators in the Georges Bank finfish fishery.ICES J. Mar. Sci.721285–1296. 10.1093/icesjms/fsu214
29
Feeney R. G. Boelke D. V. Deroba J. J. (2019). Integrating management strategy evaluation into fisheries management: advancing best practices for stakeholder inclusion based on an MSE for Northeast US Atlantic.J. Fisher.76:125.
30
Francis R. I. C. C. (2011). Data weighting in statistical fisheries stock assessment models.Can. J. Fish. Aquat. Sci.681124–1138. 10.1139/f2011-025
31
Froehlich H. E. Essington T. E. McDonald P. S. (2017). When does hypoxia affect management performance of a fishery? A management strategy evaluation of Dungeness crab (Metacarcinus magister) fisheries in Hood Canal, Washington, USA.Can. J. Fish. Aquat. Sci.74922–932. 10.1139/cjfas-2016-0269
32
Fulton E. A. Link J. S. Kaplan I. C. (2011). Lessons in modelling and management of marine ecosystems: the Atlantis experience.Fish Fisher.12171–188. 10.1111/j.1467-2979.2011.00412.x
33
Fulton E. A. Parslow J. S. Smith A. D. M. Johnson C. R. (2004). Biogeochemical marine ecosystem models II: the effect of physiological detail on model performance.Ecol. Model.173371–406. 10.1016/j.ecolmodel.2003.09.024
34
Fulton E. A. Punt A. E. Dichmont C. M. Harvey C. J. Gorton R. (2019). Ecosystems say good management pays off.Fish Fisher.2066–96. 10.1111/faf.12324
35
Fulton E. A. Smith A. D. M. Smith D. C. Johnson P. (2014). An integrated approach is needed for ecosystem based fisheries management: insights from ecosystem-level management strategy evaluation.PLoS One9:e84242. 10.1371/journal.pone.0084242.t001
36
Gaichas S. K. Fogarty M. Fay G. Gamble R. Lucey S. Smith L. (2017). Combining stock, multispecies, and ecosystem level fishery objectives within an operational management procedure: simulations to start the conversation.ICES J. Mar. Sci.74552–565. 10.1093/icesjms/fsw119
37
Gaichas S. K. Seagraves R. J. Coakley J. M. DePiper G. S. Guida V. G. Hare J. A. et al (2016). A Framework for Incorporating Species, Fleet, Habitat, and Climate Interactions into Fishery Management.Front. Mar. Sci.3:105. 10.3389/fmars.2016.00105
38
Garcia D. Sánchez S. Prellezo R. Urtizberea A. Andrés M. (2017). FLBEIA: A simulation model to conduct Bio-Economic evaluation of fisheries management strategies.SoftwareX6141–147. 10.1016/j.softx.2017.06.001
39
Goethel D. R. Lucey S. M. Berger A. M. Gaichas S. K. Karp M. A. Lynch P. D. et al (2019). Closing the feedback loop: on stakeholder participation in management strategy evaluation.Under Press. Address. Fisher. Challen. Manage. Strategy Evaluat.011895–1913. 10.1139/cjfas-2018-0162
40
Haltuch M. A. Brooks E. N. Brodziak J. Devine J. A. Johnson K. F. Klibansky N. et al (2019a). Unraveling the recruitment problem: A review of environmentally-informed forecasting and management strategy evaluation.Fish. Res.217198–216. 10.1016/j.fishres.2018.12.016
41
Haltuch M. A. Teresa A’mar Z. Bond N. A. Valero J. L. (2019b). Assessing the effects of climate change on US West Coast sablefish productivity and on the performance of alternative management strategies.ICES J. Mar. Sci.761524–1542. 10.1093/icesjms/fsz029
42
Hansen C. Drinkwater K. F. Jähkel A. Fulton E. A. Gorton R. Skern-Mauritzen M. (2019a). Sensitivity of the Norwegian and Barents Sea Atlantis end-to-end ecosystem model to parameter perturbations of key species.PLoS One14:e0210419. 10.1371/journal.pone.0210419
43
Hansen C. Nash R. D. M. Drinkwater K. F. Hjøllo S. S. (2019b). Management Scenarios Under Climate Change – A Study of the Nordic and Barents Seas.Front. Mar. Sci.6:668. 10.3389/fmars.2019.00668
44
Hansen C. Skern-Mauritzen M. van der Meeren G. Jähkel A. Drinkwater K. (2016). Set-up of the Nordic and Barents Seas (NoBa) Atlantis Model.Bergen: Havforskningsinstituttet.
45
Harvey C. J. Reum J. C. P. Poe M. R. Williams G. D. Kim S. J. (2016). Using Conceptual Models and Qualitative Network Models to Advance Integrative Assessments of Marine Ecosystems.Coast. Manage.44486–503. 10.1080/08920753.2016.1208881
46
Hazen E. L. Scales K. L. Maxwell S. M. Briscoe D. K. Welch H. Bograd S. J. et al (2018). A dynamic ocean management tool to reduce bycatch and support sustainable fisheries.Sci. Adv.4:eaar3001. 10.1126/sciadv.aar3001
47
Heemskerk M. Wilson K. Pavao-Zuckerman M. (2003). Conceptual Models as Tools for Communication Across Disciplines.Conservat. Ecol.7:70308. 10.5751/es-00554-070308
48
Hicks A. C. Cox S. P. Taylor N. Taylor I. G. (2016). “Conservation and yield performance of harvest control rules for the transboundary Pacific hake fishery in US and Canadian waters,” in Management Science in Fisheries (Abingdon: Routledge), 89–105.
49
Hill K. T. Crone P. R. Zwolinski J. P. (2017). Assessment of the Pacific Sardine Resource in 2019 for USA Management in 2017-18.Washington, D.C.: National Oceanic and Atmospheric Administration.
50
Hill K. T. Crone P. R. Zwolinski J. P. (2019). Assessment of the Pacific Sardine Resource in 2019 for US Management in 2019-20.Washington, D.C.: National Oceanic and Atmospheric Administration.
51
Hobday A. J. Smith A. D. M. Stobutzki I. C. Bulman C. Daley R. Dambacher J. M. et al (2011). Ecological risk assessment for the effects of fishing.Fish. Res.108372–384.
52
Hollowed A. B. Holsman K. K. Haynie A. C. Hermann A. J. Punt A. E. Aydin K. et al (2020). Integrated Modeling to Evaluate Climate Change Impacts on Coupled Social-Ecological Systems in Alaska.Front. Mar. Sci.6:775. 10.3389/fmars.2019.00775
53
Holsman K. K. Haynie A. C. Hollowed A. B. Reum J. C. P. Aydin K. Hermann A. J. et al (2020). Ecosystem-based fisheries management forestalls climate-driven collapse.Nat. Commun.11:4579.
54
Holsman K. K. Ianelli J. N. Aydin K. Spies I. Adams G. Kearney K. (2018). 2018 climate-enhanced multi-species stock assessment for walleye pollock, pacific cod, and arrowtooth flounder in the eastern bering sea.Washington, D.C.: National Oceanic and Atmospheric Administration.
55
Holsman K. K. Ianelli J. Aydin K. Punt A. E. Moffitt E. A. (2016). A comparison of fisheries biological reference points estimated from temperature-specific multi-species and single-species climate-enhanced stock assessment models.Deep Sea Res. Part 2 Top. Stud. Oceanogr.134360–378. 10.1016/j.dsr2.2015.08.001
56
Holsman K. Samhouri J. Cook G. Hazen E. Olsen E. Dillard M. et al (2017). An ecosystem–based approach to marine risk assessment.Null3:e01256. 10.1002/ehs2.1256
57
Hurtado-Ferro F. Punt A. (2014). Revised Analyses Related To Evaluating Parameter Value Choices For Pacific Sardine.Portland: Pacific Fishery Management Council.
58
Hurtado-Ferro F. Punt A. E. Hill K. T. (2014). Use of multiple selectivity patterns as a proxy for spatial structure.Fish. Res.158102–115. 10.1016/j.fishres.2013.10.001
59
Ianelli J. N. Hollowed A. B. Haynie A. C. Mueter F. J. Bond N. A. (2011). Evaluating management strategies for eastern Bering Sea walleye pollock (Theragra chalcogramma) in a changing environment.ICES J. Mar. Sci.681297–1304. 10.1093/icesjms/fsr010
60
ICES (2019). Report of the Workshop on Guidelines for Management Strategy Evaluations (WKGMSE2).Copenhagen: ICES, 10.17895/ICES.PUB.5331
61
ISC Billfish Working Group (2018). Stock Assessment for Swordfish (Xiphias gladius) in the Western and Central North Pacific Ocean Through 2016. Available online at: http://isc.fra.go.jp/reports/isc/isc18_reports.html(accessed July 16, 2018)
62
Jacobsen N. Marshall K. Berger A. Grandin C. Taylor I. (2020). “A management strategy evaluation of Pacific Hake,” in Prepared for the Scientific Review Group of the Pacific Whiting Treaty (Washington, D.C.: National Oceanic and Atmospheric Administration).
63
Kaplan I. C. Koehn L. E. Hodgson E. E. Marshall K. N. Essington T. E. (2017). Modeling food web effects of low sardine and anchovy abundance in the California Current.Ecol. Model.359, 1–24.
64
Kaplan I. C. Marshall K. N. (2016). A guinea pig’s tale: learning to review end-to-end marine ecosystem models for management applications.ICES J. Mar. Sci.731715–1724. 10.1093/icesjms/fsw047
65
Kaplan I. C. Hansen C. Morzaria-Luna H. N. Girardin R. Marshall K. N. (2020). Ecosystem-Based Harvest Control Rules for Norwegian and US Ecosystems.Front. Mar. Sci.7:652. 10.3389/fmars.2020.00652
66
Karp M. A. Peterson J. O. Lynch P. D. Griffis R. B. Adams C. F. Arnold W. S. et al (2019). Accounting for shifting distributions and changing productivity in the development of scientific advice for fishery management.ICES J. Mar. Sci.761305–1315.
67
Karp M. A. Peterson J. Lynch P. D. Griffis R. (2018). Accounting for Shifting Distributions and Changing Productivity in the Fishery Management Process: From Detection to Management Action.Washington, D.C.: National Oceanic and Atmospheric Administration.
68
Kell L. T. Mosqueira I. Grosjean P. Fromentin J.-M. Garcia D. Hillary R. et al (2007). FLR: an open-source framework for the evaluation and development of management strategies.ICES J. Mar. Sci.64640–646. 10.1093/icesjms/fsm012
69
Kirkpatrick A. J. Benjamin S. DePiper G. S. Murphy T. Steinback S. Demarest C. (2017). Socio-Economic Impact of Outer Continental Shelf Wind Energy Development on Fisheries in the U.S. Atlantic, Volume I—Report Narrative.Washington, D.C: U.S Dept. of the Interior.
70
Kirkwood G. P. (1997). “The revised management procedure of the international whaling commission,” in Global trends: fishery management, edsPikitchE. K.HuppertD. D.SissenwineM. P. (Maryland: American Fisheries Society), 91–99.
71
Levin P. S. Kelble C. R. Shuford R. L. Ainsworth C. deReynier Y. Dunsmore R. et al (2013). Guidance for implementation of integrated ecosystem assessments: a US perspective.ICES J. Mar. Sci.711198–1204. 10.1093/icesjms/fst112
72
Link J. (2010). Ecosystem-Based Fisheries Management: Confronting Tradeoffs.Cambridge: Cambridge University Press.
73
Link J. S. Gamble R. J. Fogarty M. J. (2011). An Overview of the NEFSC’s Ecosystem Modeling Enterprise For The Northeast Us Shelf Large Marine Ecosystem: Towards Ecosystem-Based Fisheries Management.Washington, D.C.: National Oceanic and Atmospheric Administration.
74
Link J. S. Griffis R. B. Busch D. S. (2015). NOAA Fisheries Climate Science Strategy.Washington, D.C.: National Oceanic and Atmospheric Administration.
75
Link J. S. Ihde T. F. Harvey C. J. Gaichas S. K. Field J. C. Brodziak J. K. T. et al (2012). Dealing with uncertainty in ecosystem models: The paradox of use for living marine resource management.Prog. Oceanogr.102102–114. 10.1016/j.pocean.2012.03.008
76
Link J. S. Ihde T. F. Townsend H. M. Osgood K. E. Schirripa M. J. Kobayashi D. R. et al (2010). Report of the 2nd National Ecosystem Modeling Workshop (NEMoW II): Bridging The Credibility Gap Dealing With Uncertainty In Ecosystem Models.Washington, D.C.: National Oceanic and Atmospheric Administration.
77
Lynch P. D. Methot R. D. Link J. S. (eds) (2018). Implementing a Next Generation Stock Assessment Enterprise. An Update To The Noaa Fisheries Stock Assessment Improvement Plan.Washington, D.C.: National Oceanic and Atmospheric Administration.
78
Malick M. J. Hunsicker M. E. Haltuch M. A. Parker-Stetter S. L. Berger A. M. Marshall K. N. (2020). Relationships between temperature and Pacific hake distribution vary across latitude and life-history stage.Mar. Ecol. Prog. Ser.639185–197. 10.3354/meps13286
79
Marshall K. N. Kaplan I. C. Hodgson E. E. Hermann A. Busch D. S. McElhany P. et al (2017). Risks of ocean acidification in the California Current food web and fisheries: ecosystem model projections.Glob. Chang. Biol.231525–1539. 10.1111/gcb.13594
80
Masi M. Ainsworth C. H. Chagaris D. (2014). A probabilistic representation of fish diet compositions from multiple data sources: A Gulf of Mexico case study.Ecol. Modell.28460–74. 10.1016/j.ecolmodel.2014.04.005
81
Masi M. Ainsworth C. H. Jones D. L. (2017). Using a Gulf of Mexico Atlantis model to evaluate ecological indicators for sensitivity to fishing mortality and robustness to observation error.Ecol. Indic.74516–525. 10.1016/j.ecolind.2016.11.008
82
Masi M. D. Ainsworth C. H. Kaplan I. C. Schirripa M. J. (2018). Interspecific Interactions May Influence Reef Fish Management Strategies in the Gulf of Mexico.Mar. Coast. Fish.1024–39. 10.1002/mcf2.10001
83
Maunder M. N. Punt A. E. (2013). A review of integrated analysis in fisheries stock assessment.Fish. Res.14261–74. 10.1016/j.fishres.2012.07.025
84
Methot R. D. Wetzel C. R. (2013). Stock synthesis: A biological and statistical framework for fish stock assessment and fishery management.Fish. Res.14286–99. 10.1016/j.fishres.2012.10.012
85
Miller S. K. Anganuzzi A. Butterworth D. S. Davies C. R. Donovan G. P. Nickson A. et al (2019). Improving communication: the key to more effective MSE processes.Can. J. Fish. Aquat. Sci.76, 643–656. 10.1139/cjfas-2018-0134
86
Miller T. J. Hare J. A. Alade L. A. (2016). A state-space approach to incorporating environmental effects on recruitment in an age-structured assessment model with an application to southern New England yellowtail flounder.Can. J. Fish. Aquat. Sci.731261–1270. 10.1139/cjfas-2015-0339
87
Moffitt E. A. Punt A. E. Holsman K. Aydin K. Y. Ianelli J. N. Ortiz I. (2016). Moving towards ecosystem-based fisheries management: Options for parameterizing multi-species biological reference points.Deep Sea Res. Part II Top. Stud. Oceanogr.134350–359. 10.1016/j.dsr2.2015.08.002
88
Morley J. W. Selden R. L. Latour R. J. Frölicher T. L. Seagraves R. J. Pinsky M. L. (2018). Projecting shifts in thermal habitat for 686 species on the North American continental shelf.PLoS One13:e0196127. 10.1371/journal.pone.0196127
89
Mormede S. Dunn A. Parker S. Hanchet S. (2017). Using spatial population models to investigate the potential effects of the Ross Sea region Marine Protected Area on the Antarctic toothfish population.Fish. Res.190164–174. 10.1016/j.fishres.2017.02.015
90
Morzaria-Luna H. N. Ainsworth C. H. Tarnecki J. H. Grüss A. (2018). Diet composition uncertainty determines impacts on fisheries following an oil spill.Ecosyst. Servi.33187–198. 10.1016/j.ecoser.2018.05.002
91
Nakatsuka S. (2017). Management strategy evaluation in regional fisheries management organizations- How to promote robust fisheries management in international settings.Fisher. Res.187127–138. 10.1016/j.fishres.2016.11.018
92
Nielsen J. R. Thunberg E. Holland D. S. Schmidt J. O. Fulton E. A. Bastardie F. et al (2018). Integrated ecological-economic fisheries models-Evaluation, review and challenges for implementation.Fish Fish.191–29. 10.1007/978-90-481-2655-2_1
93
Nilsen I. Kolding J. Hansen C. Howell D. (2020). Exploring Balanced Harvesting by Using an Atlantis Ecosystem Model for the Nordic and Barents Seas.Front. Mar. Sci.7:70. 10.3389/fmars.2020.00070
94
NOAA (2016a). Ecosystem Based Fisheries Management Policy of the National Marine Fisheries Service.Washington, D.C.: National Oceanic and Atmospheric Administration.
95
NOAA (2016b). NOAA Fisheries Ecosystem-Based Fisheries Management Road Map.Washington, D.C.: National Oceanic and Atmospheric Administration.
96
NOAA (2020). NOAA Climate and Fisheries Initiative Steering Committee White Paper.Washington, D.C.: National Oceanic and Atmospheric Administration.
97
O’Neill M. F. Leigh G. M. Wang Y.-G. Braccini J. M. Ives M. C. (2014). Linking spatial stock dynamics and economics: evaluation of indicators and fishery management for the travelling eastern king prawn (Melicertus plebejus).ICES J. Mar. Sci.711818–1834. 10.1093/icesjms/fst218
98
Olsen E. Kaplan I. C. Ainsworth C. Fay G. Gaichas S. Gamble R. et al (2018). Ocean Futures Under Ocean Acidification, Marine Protection, and Changing Fishing Pressures Explored Using a Worldwide Suite of Ecosystem Models.Front. Mar. Sci.5:64. 10.3389/fmars.2018.00064
99
Pacific Hake Treaty Scientific Review Group (2015). Joint U.S.-Canada Scientific Review Group Report.Washington, D.C.: National Oceanic and Atmospheric Administration.
100
Perryman H. A. Hansen C. Howell D. Olsen E. (2021). A review of applications evaluating fisheries management scenarios through marine ecosystem models.Rev. Fisher. Sci. Aquacult.20211–36. 10.1080/23308249.2021.1884642
101
Plagányi ÉE. (2007). Models for an Ecosystem Approach to Fisheries.Rome: Food and Agriculture Organization.
102
Plagányi ÉE. van Putten I. Hutton T. Deng R. A. Dennis D. Pascoe S. et al (2013). Integrating indigenous livelihood and lifestyle objectives in managing a natural resource.Proc. Natl. Acade. Sci.1103639–3644. 10.1073/pnas.1217822110
103
Poloczanska E. S. Brown C. J. Sydeman W. J. Kiessling W. Schoeman D. S. Moore P. J. et al (2013). Global imprint of climate change on marine life.Nat. Clim. Chang.3919–925.
104
Pozo Buil M. Jacox M. G. Fiechter J. Alexander M. A. Bograd S. J. Curchitser E. N. et al (2021). A dynamically downscaled ensemble of future projections for the California Current System.Front. Mar. Sci.8:324. 10.3389/fmars.2021.612874
105
Punt A. E. (2017). Strategic management decision-making in a complex world: quantifying, understanding, and using trade-offs.ICES J. Mar. Sci.74499–510. 10.1093/icesjms/fsv193
106
Punt A. E. Donovan G. P. (2007). Developing management procedures that are robust to uncertainty: lessons from the International Whaling Commission.ICES J. Mar. Sci.64603–612. 10.1093/icesjms/fsm035
107
Punt A. E. A’mar T. Bond N. A. Butterworth D. S. de Moor C. L. De Oliveira J. A. et al (2014a). Fisheries management under climate and environmental uncertainty: control rules and performance simulation.ICES J. Mar. Sci.712208–2220. 10.1093/icesjms/fst057
108
Punt A. E. Butterworth D. S. Moor C. L. De Oliveira J. A. A. Haddon M. (2014b). Management strategy evaluation: best practices.Fish Fish.17303–334.
109
Punt A. E. Haddon M. Little L. R. Tuck G. N. (2016a). The effect of marine closures on a feedback control management strategy used in a spatially aggregated stock assessment: a case study based on pink ling in Australia.Can. J. Fish. Aquat. Sci.741960–1973. 10.1139/cjfas-2016-0017
110
Punt A. E. MacCall A. D. Essington T. E. Francis T. B. Hurtado-Ferro F. Johnson K. F. et al (2016b). Exploring the implications of the harvest control rule for Pacific sardine, accounting for predator dynamics: A MICE model.Ecol. Modell.33779–95. 10.1016/j.ecolmodel.2016.06.004
111
Punt A. E. Trinnie F. Walker T. I. McGarvey R. Feenstra J. Linnane A. et al (2013). The performance of a management procedure for rock lobsters, Jasus edwardsii, off western Victoria, Australia in the face of non-stationary dynamics.Fish. Res.137116–128. 10.1016/j.fishres.2012.09.017
112
Robinson W. M. L. Butterworth D. S. Plagányi ÉE. (2015). Quantifying the projected impact of the South African sardine fishery on the Robben Island penguin colony.ICES J. Mar. Sci.721822–1833. 10.1093/icesjms/fsv035
113
Sainsbury K. J. (1988). “The ecological basis of multispecies fisheries and management of a demersal fishery in tropical Australia,” in Fish Population Dynamics, ed.GullandJ. A. (London: John Wiley), 349–382.
114
Sainsbury K. J. Punt A. E. Smith A. D. M. (2000). Design of operational management strategies for achieving fishery ecosystem objectives.ICES J. Mar. Sci.57731–741. 10.1006/jmsc.2000.0737
115
Saul S. Die D. (2016). Modeling the Decision-Making Behavior of Fishers in the Reef Fish Fishery on the West Coast of Florida.Hum. Dimens. Wildlife21567–586. 10.1080/10871209.2016.1198853
116
Schweder T. Hagen G. S. Hatlebakk E. (1998). On the effect on cod and herring fisheries of retuning the Revised Management Procedure for minke whaling in the greater Barents Sea.Fisher. Res.3777–95. 10.1016/s0165-7836(98)00128-3
117
Smith A. D. M. (1994). Management strategy evaluation: the light on the hill. Population dynamics for fisheries management.Austral. Soci. Fisher. Biol. Proce.1994249–253.
118
Smith A. D. M. Sainsbury K. J. (1999). Implementing effective fisheries-management systems–management strategy evaluation and the Australian partnership approach.ICES J. Mar. Sci.56967–979. 10.1006/jmsc.1999.0540
119
Smith J. A. Tommasi D. Sweeney J. Brodie S. Welch H. Hazen E. L. et al (2020). Lost opportunity: Quantifying the dynamic economic impact of time–area fishery closures.J. Appl. Ecol.57502–513. 10.1111/1365-2664.13565
120
Smith J. A. Tommasi D. Welch H. Hazen E. Sweeney J. Brodie S. et al (2021). Comparing dynamic and static time-area closures for bycatch mitigation: a management strategy evaluation of a swordfish fishery.Front. Mar. Sci.8:607. 10.3389/fmars.2021.630607
121
Surma S. Pitcher T. J. Kumar R. Varkey D. Pakhomov E. A. Lam M. E. (2018). Herring supports Northeast Pacific predators and fisheries: Insights from ecosystem modelling and management strategy evaluation.PLoS One13:e0196307. 10.1371/journal.pone.0196307
122
Tam J. C. Fay G. Link J. S. (2019). Better Together: The Uses of Ecological and Socio-Economic Indicators With End-to-End Models in Marine Ecosystem Based Management.Front. Mar. Sci.6:560. 10.3389/fmars.2019.00560
123
Tavel Certification Inc (2009). Pacific Hake (Merluccius productus) Mid-Water Trawl Fishery: US (WOC) Pacific EEZ and Canadian Pacific EEZ Waters.Halifax: Tavel Certification Inc.
124
Taylor I. G. Stewart I. J. Hicks A. C. Garrison T. M. Punt A. E. Wallace J. R. (2019). r4ss: R Code for Stock Synthesis.San Francisco: GitHub.
125
Tommasi D. Stock C. A. Pegion K. Vecchi G. A. Methot R. D. Alexander M. A. et al (2017). Improved management of small pelagic fisheries through seasonal climate prediction.Ecol. Appl.27378–388.
126
Townsend H. M. Harvey C. Aydin K. Y. Grüss G. R. Levin P. S. Link J. S., et al. (eds) (2014). Report of the 3rd National Ecosystem Modeling Workshop (NEMoW 3): Mingling Models for Marine Resource Management – Multiple Model Inference.Washington, D.C: U.S. Dept. of Commerce.
127
Townsend H. M. Link J. S. Osgood K. E. Gedamke T. Watters G. M. Polovina J. J., et al. (eds) (2008). Report of the NEMoW (National Ecosystem Modeling Workshop.Washington, D.C: U.S. Dept. of Commerce.
128
Townsend H. Aydin K. Holsman K. Harvey C. Kaplan I. Hazen E., et al. (eds) (2017). Report of the 4th National Ecosystem Modeling Workshop (NEMoW 4): Using Ecosystem Models to Evaluate Inevitable Trade-Offs.Washington, D.C: U.S. Dept. of Commerce.
129
Townsend H. Harvey C. J. deReynier Y. Davis D. Zador S. G. Gaichas S. et al (2019). Progress on Implementing Ecosystem-Based Fisheries Management in the United States Through the Use of Ecosystem Models and Analysis.Front. Mar. Sci.6:641. 10.3389/fmars.2019.00641
130
Trijoulet V. Fay G. Miller T. J. (2020). Performance of a state–space multispecies model: What are the consequences of ignoring predation and process errors in stock assessments?J. Appl. Ecol.57121–135.
131
Trijoulet V. Fay G. Curti K. L. Smith B. Miller T. J. (2019). Performance of multispecies assessment models: insights on the influence of diet data.ICES J. Mar. Sci.761464–1476. 10.1093/icesjms/fsz053
132
Walters C. J. (1986). Adaptive Management of Renewable Resources.Basingstoke: Macmillan Publishers Ltd.
133
Woodworth-Jefcoats P. A. Blanchard J. L. Drazen J. C. (2019). Relative impacts of simultaneous stressors on a pelagic marine ecosystem.Front. Mar. Sci.6:383. 10.3389/fmars.2019.00383
Appendix | Glossary of MSE terms
Despite focusing on examples from the United States, we generally follow MSE terminology consistent with a recent international tuna workshop (Anon, 2018). Key terms are listed below from that report, with our minor adaptations noted in bold italics.
| Term | Definition [non-italicized text from Anon (2018)] |
| Conditioning | The process of fitting an Operating Model (OM) of the resource dynamics to the available data on the basis of some statistical criterion, such as a Maximum Likelihood. The aim of conditioning is to select those OMs consistent with the data and reject OMs that do not fit these data satisfactorily and, as such, are considered implausible. We note that conditioning OMs generally relies on statistical criteria, but some multispecies OM cases also involve simpler comparisons with data, consistent withPunt et al. (2016b). |
| Error | Differences, primarily reflecting uncertainties in the relationship between the actual dynamics of the resource (described by the OMs) and observations. Four types of error may be distinguished, and simulation trials may take account of one or more of these: ⋅ Estimation error: differences between the actual values of the parameters of the OM and those provided by the estimator when fitting a model to the available data; ⋅ Implementation error: differences between intended management actions (as output by an MP) and those actually achieved (e.g., reflecting over-catch); ⋅ Observation error (or measurement error): differences between the measured value of some resource index and the corresponding value calculated by the OM; ⋅ Process error: natural variations in resource dynamics (e.g., fluctuations about a stockrecruitment curve or variation in fishery or survey selectivity/catchability). |
| Estimator or Estimation Model | The statistical estimation process within a population model (assessment or OM); in a Management Strategy Evaluation (MSE) context, the component that provides information on resource status and productivity from past and generated future resource-monitoring data for input to the Harvest Control Rule (HCR) component of a Management Procedure in projections. |
| Harvest control rule | A pre-agreed and well-defined rule or action(s) that describes how management should adjust management measures in response to the state of specified indicator(s) of stock status. This is described by a mathematical formula. |
| Harvest Strategy or Management Strategy | Some combination of monitoring, assessment, harvest control rule and management action designed to meet the stated objectives of a fishery. Sometimes referred to as a Management Strategy (see below). A fully specified harvest strategy that has been simulation tested for performance and adequate robustness to uncertainties is often referred to as a Management Procedure. In our case studies, we use the term “management strategy” rather than candidate “Management Procedure,” but with the understanding that these are synonymous in our examples. Our case studies utilize simulation testing. |
| Management Strategy Evaluation | A process whereby the performances of alternative harvest strategies are tested and compared using stochastic simulations of stock and fishery dynamics against a set of performance statistics developed to quantify the attainment of management objectives. |
| Operating model | A mathematical–statistical model (usually models) used to describe the fishery dynamics in simulation trials, including the specifications for generating simulated resource monitoring data when projecting forward in time. Multiple models will usually be considered to reflect the uncertainties about the dynamics of the resource and fishery. |
| Performance metrics, performance measures/statistics | A set of statistics used to evaluate the performance of Candidate Management Procedures against specified management objectives, and the robustness of these Management Procedures to important uncertainties in resource and fishery dynamics. |
| Stock assessment | The process of estimating stock abundance and the impact of fishing on the stock, similar in many respects to the process of conditioning OMs. We use “stock assessment” to refer to both actual stock assessments of historical data, and simulated stock assessments (applications of estimation models) within MSE. These simulated assessments can involve simulated past or future data. |
| Observation model | The component of the OM that generates fishery dependent and/or fishery-independent resource monitoring data from the underling true status of the resource provided by the OM, for input to a Management Procedure or Management Strategy. |
Summary
Keywords
management strategy evaluation, ecosystem-based fishery management, ecosystem modeling, operating models, simulation testing
Citation
Kaplan IC, Gaichas SK, Stawitz CC, Lynch PD, Marshall KN, Deroba JJ, Masi M, Brodziak JKT, Aydin KY, Holsman K, Townsend H, Tommasi D, Smith JA, Koenigstein S, Weijerman M and Link J (2021) Management Strategy Evaluation: Allowing the Light on the Hill to Illuminate More Than One Species. Front. Mar. Sci. 8:624355. doi: 10.3389/fmars.2021.624355
Received
31 October 2020
Accepted
17 May 2021
Published
22 June 2021
Volume
8 - 2021
Edited by
Athanassios C. Tsikliras, Aristotle University of Thessaloniki, Greece
Reviewed by
Doug Butterworth, University of Cape Town, South Africa; Brett W. Molony, Oceans and Atmosphere (CSIRO), Australia
Updates
Copyright
© 2021 Kaplan, Gaichas, Stawitz, Lynch, Marshall, Deroba, Masi, Brodziak, Aydin, Holsman, Townsend, Tommasi, Smith, Koenigstein, Weijerman and Link.
This is an open-access article distributed under the terms of the Creative Commons Attribution License (CC BY). The use, distribution or reproduction in other forums is permitted, provided the original author(s) and the copyright owner(s) are credited and that the original publication in this journal is cited, in accordance with accepted academic practice. No use, distribution or reproduction is permitted which does not comply with these terms.
*Correspondence: Isaac C. Kaplan, Isaac.Kaplan@noaa.gov
This article was submitted to Marine Fisheries, Aquaculture and Living Resources, a section of the journal Frontiers in Marine Science
Disclaimer
All claims expressed in this article are solely those of the authors and do not necessarily represent those of their affiliated organizations, or those of the publisher, the editors and the reviewers. Any product that may be evaluated in this article or claim that may be made by its manufacturer is not guaranteed or endorsed by the publisher.