Abstract
Despite an increasing research conducted on ocean plastic pollution over the last decade, there are still large knowledge gaps in our current understanding of how floating plastic debris accumulating in subtropical oceanic gyres may harm the surface-associated pelagic community known as neuston. Removing floating plastic debris from the surface ocean can minimize potentially adverse effects of plastic pollution on the neuston, as well as prevent the formation of large quantities of secondary micro- and nanoplastics. However, due to the scarcity of observational data from remote and difficult to access offshore waters, neuston dynamics in subtropical oceanic gyres and thus the potential impacts of plastic pollution as well as of cleanup activities on the neuston remain uncertain. Here, we provide rare observational data of the relative distribution of floating plastic debris (0.05–5 cm in size) and members of the neuston in the eastern North Pacific Ocean. Our results reveal that the dominant neustonic species co-occurring with high concentrations of floating plastic debris in the North Pacific Garbage Patch (NPGP) such as Porpita porpita, Halobates spp., pteropods, isopods, heteropods, and crabs depict either a low atmospheric drag due to physical attributes or a potential plastic-associated fitness benefit such as increased surface area for oviposition and structure for habitat. We further observe relatively higher plastic to organism ratios inside the NPGP for most target species compared to waters outside the NPGP. The findings presented here provide a first observational baseline to develop ecological models that can help evaluate the long-term risks of plastic pollution and of offshore cleanup activities for neuston in the eastern North Pacific Ocean. We further suggest that offshore mitigation strategies aiming at removing floating plastic debris from the ocean surface need to evaluate both, the direct impact of neuston bycatch during plastic removal on neuston population dynamics, as well as the potential benefits of reducing the negative effects of plastic pollution on the neuston.
Introduction
Pollution of our oceans by plastic debris is widely recognized as a major environmental problem. Each year, several million metric tons of mismanaged plastic waste are estimated to enter the world’s oceans from coastal environments (Jambeck et al., 2015; Lebreton et al., 2017; Schmidt et al., 2017; Borrelle et al., 2020), of which roughly two thirds have a density lower than seawater (Geyer et al., 2017). The fate of these positively buoyant plastic objects in the marine environment is highly influenced by a wide range of physical transport processes (Van Sebille et al., 2020). Beaching onto coastlines removes a large fraction of the floating plastic debris from the sea surface relatively quickly after these objects have entered the ocean (Lebreton et al., 2019; Olivelli et al., 2020; Ryan, 2020). The remaining floating plastic objects, typically characterized by high buoyancy and durability (Ryan, 2015; Lebreton et al., 2018), escape the coastal environment and are transported over large distances on the global scale (Van Sebille et al., 2020), both horizontally (Lebreton et al., 2012; Maximenko et al., 2012; Van Sebille et al., 2012) as well as vertically within the ocean water column (Kukulka et al., 2012; Reisser et al., 2015; Choy et al., 2019; Mountford and Maqueda, 2019; Egger et al., 2020b; Kvale et al., 2020; Pabortsava and Lampitt, 2020; Tekman et al., 2020).
Particularly high concentrations of floating plastic debris are observed in the surface ocean of remote subtropical oceanic gyres, accumulation zones known as ocean garbage patches, where plastic concentrations can exceed one million pieces per km2 for fragments >0.5 mm and hundreds of kilograms per km2 (Cózar et al., 2014; Eriksen et al., 2014; Van Sebille et al., 2015; Lebreton et al., 2018). The highest concentrations of positively buoyant plastic debris have been recorded in the North Pacific Garbage Patch (NPGP, also referred to as the Great Pacific Garbage Patch), located in the eastern part of the North Pacific subtropical gyre (Moore et al., 2001; Howell et al., 2012; Goldstein et al., 2013; Law et al., 2014; Lebreton et al., 2018). Current estimates suggest that there are at least 80,000 tons of plastic debris larger than 0.5 mm afloat inside the NPGP (Lebreton et al., 2018). Some of the plastic debris floating in the NPGP is lost to the underlying deep-sea through sedimentation of once-buoyant microplastics (<5 mm) (Egger et al., 2020b). However, the data available to date indicate that most of the plastic mass in the NPGP is still afloat in the surface ocean (Egger et al., 2020b) and that the plastic debris accumulating in these offshore waters could persist at the sea surface for decades (Lebreton et al., 2019). With exponentially increasing emissions of plastic waste into the ocean, the amount of plastic debris floating in the NPGP is therefore predicted to rapidly increase in the future (Lebreton et al., 2018). Yet, the long-term risks of increasing levels of plastic pollution for the ecosystems in ocean garbage patches and beyond remain largely unknown. The characteristics of geographically remote ecosystems such as the subtropical oceanic gyres or the underlying deep-sea, which have evolved in relatively constant environmental conditions with little human influence and which often contain a large number of endemic and sensitive species suggest that they might be especially vulnerable to adverse effects of plastic pollution (Horton and Barnes, 2020). Due to their remoteness, however, the subtropical gyres remain severely under sampled (Karl, 1999; Karl and Church, 2017). Consequently, the ecosystem structure and dynamics in these offshore waters, as well as the impacts of plastic pollution and of associated rafting of invasive species on the fitness of individual endemic organisms or possible population-level impacts are still poorly understood.
To effectively minimize potential adverse effects of plastic pollution on marine life present in subtropical oceanic gyres and the deep sea below, a rapid reduction in plastic emissions into the ocean is needed in combination with removal of legacy plastic debris that has already accumulated in these offshore waters (Lebreton et al., 2019; Borrelle et al., 2020). Removing floating plastic debris from the surface waters of the subtropical oceanic gyres while maintaining a net positive environmental gain requires an understanding of the relative abundance and distribution of the surface-associated pelagic community (henceforth collectively termed neuston) and associated species population dynamics (Falk-Andersson et al., 2020). In this study, we report rare observational data on the relative spatiotemporal distribution of floating plastic debris (0.05–5 cm in size) and members of the neuston in the eastern North Pacific Ocean. Our results provide new insights into how the neustonic community structure relates to the spatial distribution and magnitude of plastic pollution in the region. We further discuss the implications of our findings on environmental mitigation strategies aiming at removing floating plastic debris accumulating at the ocean surface.
Materials and Methods
Sampling and Sample Processing
This study is based on 54 Manta trawl samples collected in the eastern North Pacific Ocean during two expeditions between August 2015 and December 2019. A total of 9 Manta trawls (Ocean Instruments, Inc.) were conducted during The Ocean Cleanup’s Mega Expedition (Lebreton et al., 2018) in August 2015 (green circles in Figure 1), of which six were deployed during day time and three during night time. The Manta trawl, with an aperture of 90 cm × 15 cm (width × height) and a square mesh net of 500 μm (333 μm mesh size cod-end), was deployed for 60–180 min at a towing speed of <3 knots. A further 45 Manta trawls (red circles in Figure 1) were conducted for 30 min at a towing speed of <2.5 knots during The Ocean Cleanup’s North Pacific Mission 3 (NPM3) research expedition onboard the Maersk Transporter in November/December 2019 (39 during daytime and 6 during night time) (Egger et al., 2020a). Note that the longer Manta trawl deployments during the Mega Expedition compared to the NPM3 expedition result in a lower average detection limit during the Mega Expedition (114 individual/km2) compared to the NPM3 expedition (611 individuals/km2) (see Supplementary Material for detection limits of individual trawl deployments). All night deployments were restricted to surface waters within the NPGP (Area C in Figure 1). Sampled water volumes were estimated based on distance measurements from a mechanical flow meter (General Oceanics, Inc.) multiplied by the net mouth area. After each deployment, the net was rinsed from the outside with freshwater and the entire cod-end removed, sealed with staples, placed in individual zip-lock bags, wrapped in aluminum foil and stored frozen until further analysis in the onshore laboratory of The Ocean Cleanup in Rotterdam, Netherlands. The coordinates, date, daytime, sea state during sampling, as well as trawling time and distance for each Manta trawl deployment are provided in Supplementary Material.
FIGURE 1
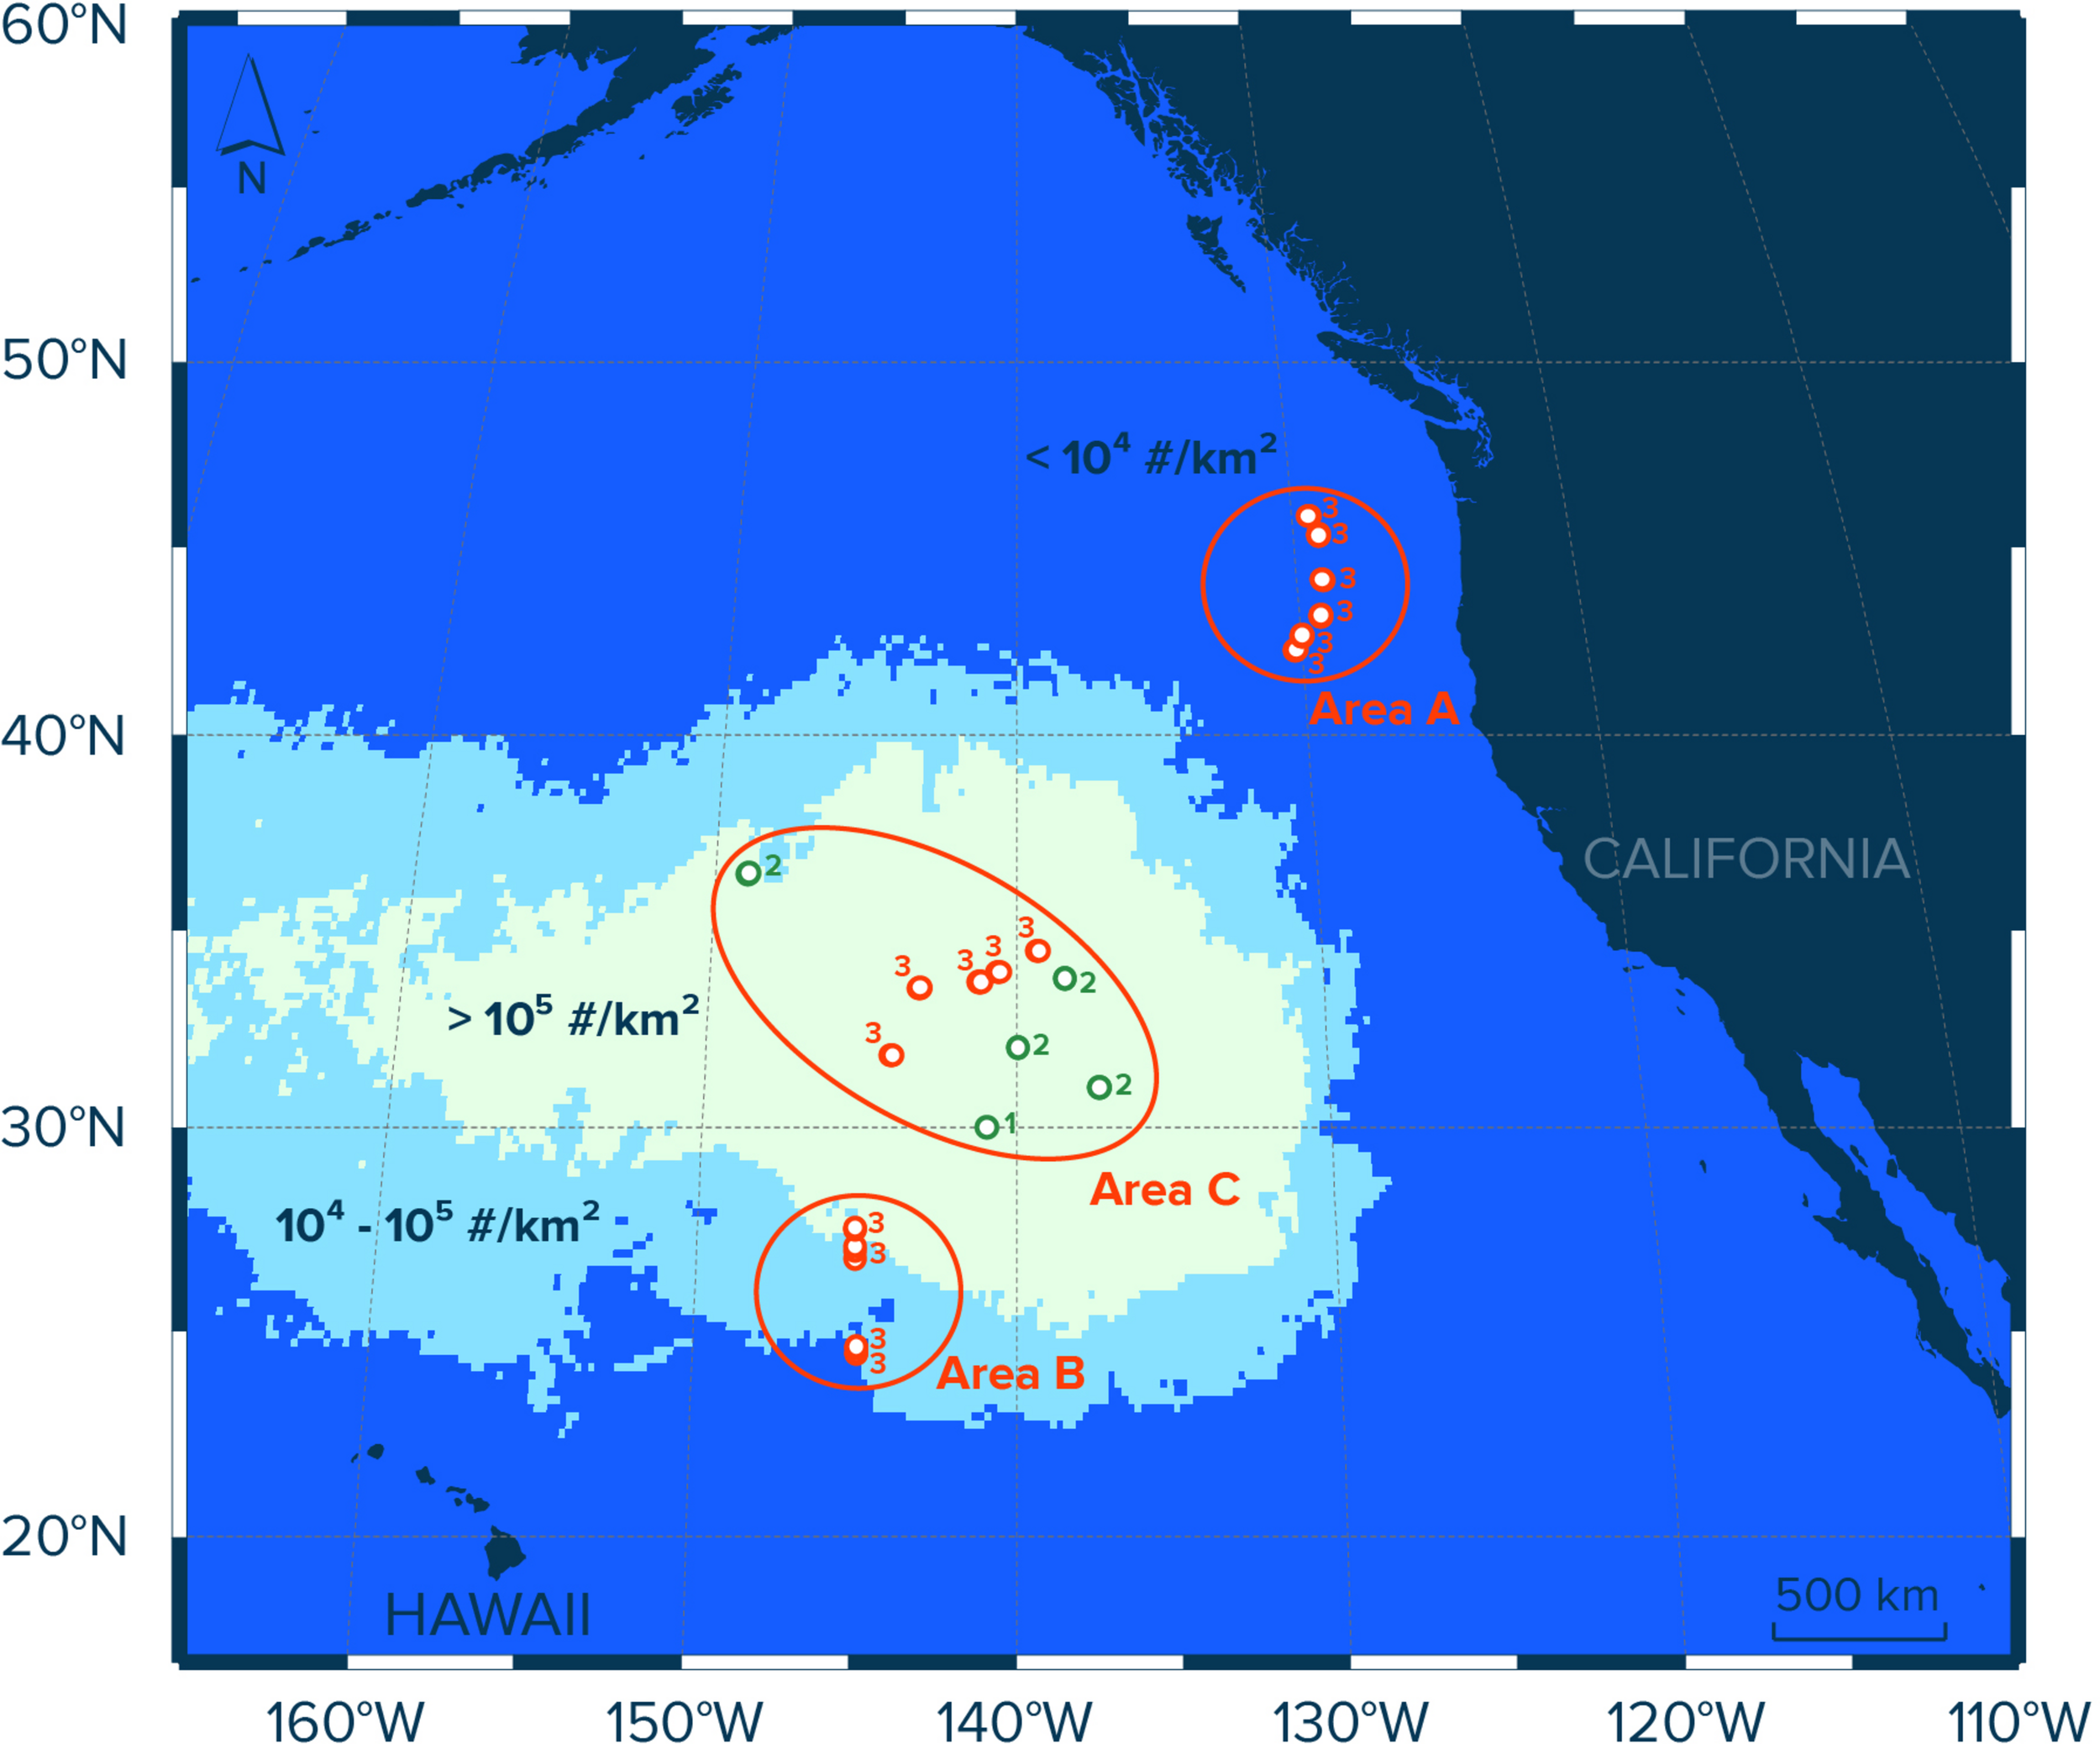
Study area in the eastern North Pacific Ocean and contours of modeled numerical concentrations (#/km2) of floating plastic debris (>0.5 mm) in the region as estimated by Lebreton et al. (2018). Red circles indicate Manta trawl deployment locations during the NPM3 Expedition (November/December 2019), while green circles indicate trawl locations during the Mega Expedition (August 2015). Circle numbers indicate the number of Manta trawl deployments at the sampling location. Samples in Area A (n = 18) were collected in waters with modeled concentrations of floating plastic debris of <104 #/km2, samples in Area B (n = 12) were taken in waters with modeled concentrations of plastic of between 104 and 105 #/km2, and samples collected in waters with modeled concentrations of floating plastic debris exceeding 105 #/km2 were assigned to Area C (n = 24).
The content of each sample was washed into a stainless-steel sieve (500 μm square mesh, 29 cm diameter). The sieve was then placed separately into round aluminum tins (30 cm diameter) filled with filtered seawater (<1 μm) from the North Atlantic Ocean (salinity 35). Multiple LED lights were placed over the sieve from various angles to ensure good light conditions, which is particularly important for detecting small microplastics and organisms. Subsequently, floating objects and particles attached to biomass identified as buoyant anthropogenic debris according to the criteria described in Hidalgo-Ruz et al. (2012), as well as all organisms were hand-picked individually with the naked eye using stainless-steel tweezers. The widest particle dimension was measured with a ruler and the particles subsequently separated into the four size classes introduced in Lebreton et al. (2018): (I) 0.05–0.15 cm (small microplastics), (II) 0.15–0.5 cm (large microplastics), (III) 0.5–1.5 cm (small mesoplastics), and (IV) 1.5–5 cm (large mesoplastics), respectively. Plastic objects >5 cm were excluded in this study due to an underestimation bias of fragments in this size class when sampling with Manta trawls (Lebreton et al., 2018). The organisms (typically varying between 0.05 and 5 cm in size) were further inspected under a light microscope (Leica DMC2900) and identified with the aid of expert taxonomists (see section “Acknowledgments”) as the following categories: Velella velella, Halobates spp., Janthina janthina, Porpita porpita, Physalia physalis, Glaucus spp., copepods, amphipods, pteropods, isopods, heteropods, crabs, squid, euphausiids and shrimps, and fish (see Supplementary Material for organism counts and corresponding abundances in each Manta trawl sample). Note that in samples with high abundances of copepods, the number of copepods was estimated by homogenously distributing the copepods in a glass petri dish (20 cm diameter), counting the individuals within one quarter of the petri dish, and subsequently multiplying the counts by four. The samples for which such an approach was taken are highlighted in Supplementary Material.
The numerical concentrations of plastic items (count of plastic per sea surface area) measured by each Manta tow were calculated for each plastic size and type category separately. Positively buoyant plastic items are mixed within the upper water column due to wind-induced turbulent mixing (Kukulka et al., 2012; Reisser et al., 2015). As a result, plastic items collected by Manta trawling may underestimate the total amount of plastics afloat in the area sampled, especially at higher sea states. Kukulka et al. (2012) developed a one-dimensional model that predicts the vertical distribution of buoyant plastic particles at different sea states. Their model can be applied to calculate depth-integrated numerical concentrations for the Manta trawl measurements in the upper 5 m of the water column, thus accounting for wind-driven mixing of buoyant plastics at the sea surface using the following equation (Kukulka et al., 2012):
where Cs represents the concentration of a plastic type and size category as measured by the Manta trawl (in pieces per surface area), d is the depth sampled by the trawl (equal to 0.15 m), Wb is the terminal rising velocity of plastic within a plastic type and size category (in m/s) taken from Lebreton et al. (2018), ρa is the air density (1.225 kg/m3), ρw is the seawater density (1024 kg/m3), Cd is the drag coefficient (equal to 0.0012), U is the wind speed during sampling (in m/s), k is the Karman constant (equal to 0.4), g is the gravitational constant (equal to 9.81 m/s2), and σ is the wave age, equal to 35 (assuming a fully developed sea state). Values for depth-integrated concentrations were estimated using wind speeds equal to 0, 2, 5, 9, 13, and 19 knots for sampling events associated with Beaufort sea states 0, 1, 2, 3, 4, and 5, respectively, and the median values for rising velocity measurements provided in Lebreton et al. (2018). Note that we combine all plastic types and size classes in the following discussion. However, the depth-integrated numerical concentrations for each plastic type and size class are provided in Supplementary Material. Further note that for the comparison between plastic concentrations and abundance of neuston, we used the uncorrected plastic concentration values to allow for comparisons of equivalent measures (i.e., only comparing what was caught in the Manta trawl in particular conditions).
Contamination Controls
To minimize contamination with plastic fragments, standard non-plastic laboratory, and fieldwork equipment made of metal and glass were used whenever possible, and the samples always remained covered with aluminum foil when not in use. Furthermore, all nets and all cod-ends were thoroughly rinsed from the outside prior to each deployment and carefully inspected for the presence of (micro)plastic particles. The seawater (taken from the North Atlantic Ocean) used in the laboratory was filtered through a sequence of filters (<20, <5, <1 μm) and all laboratory equipment (sieves, tweezers, aluminum tins, and dishes) was thoroughly rinsed and carefully inspected for cleanliness prior to each use. Note that we did not include any microfibers in our analyses, as these fibers typically pass through the 500 μm trawling nets deployed here. Thus, possible contamination with airborne fibers (a major source of microplastic contamination) does not impact our results. Consequently, the work was performed outside a glove box or laminar flow cabinet.
Grouping of Sampling Sites
To evaluate the spatial distribution of neuston and floating plastic debris in the eastern North Pacific Ocean, we divided our sampling sites into three areas (A, B, and C; Figure 1). Each area represents surface waters with different concentrations of floating plastic debris >0.5 mm in the region as estimated previously by Lebreton et al. (2018). The samples in Area A (n = 18) were collected in waters with modeled numerical concentrations of floating plastic debris (>0.5 mm) of <104 particles per km2 (#/km2), stations in Area B (n = 12) are located in waters with modeled concentrations of plastic (>0.5 mm) of between 104 and 105 #/km2, and samples collected in waters with modeled concentrations of floating plastic debris (>0.5 mm) exceeding 105 #/km2 were assigned to Area C (n = 24). In other words, the three areas correspond to surface waters outside the NPGP (Area A), surface waters in the outer boundary of the NPGP located in the subtropical gyre (Area B) and surface waters inside the NPGP (Area C).
Results
Spatial Distribution
Observed median (corrected) numerical concentrations of floating plastic debris (0.05–5 cm in size) increased from 16,468 #/km2 in the Manta trawls deployed outside the NPGP (Area A) to 773,114 #/km2 in the samples collected from inside the NPGP (Area C) (Figure 2 and Table 1). We note that although no polymer analysis was performed on floating plastic items extracted in this study, the polymer composition of floating plastic debris in the NPGP is typically dominated by polyethylene and polypropylene (Lebreton et al., 2018; Egger et al., 2020a). The observed abundance of V. velella was 110,962 individuals/km2 outside the NPGP and 639 individuals/km2 inside the NPGP. No individuals of V. velella were observed in the outer boundaries of the NPGP. Except for one Halobates spp. found in a Manta trawl outside the NPGP, the presence of Halobates spp. and J. janthina was restricted to surface waters in the outer and inner NPGP, where their median relative abundance was 15,033 and 16,650 individuals/km2 (Halobates spp.) and 3,315 and 1,897 individuals/km2 (J. janthina), respectively. P. porpita was only observed inside the NPGP during this study. One individual of P. physalis was collected in the outer boundaries of the NPGP. The abundance of Glaucus spp. was generally low (i.e., <103 individuals/km2), with one individual observed each in the outer and inner NPGP. The abundance of copepods increased from 1,230 individuals/km2 outside the NPGP to 397,079 individuals/km2 inside NPGP. Amphipods were observed in all three regions and their abundance varied between 740 and 3,818 individuals/km2. Pteropods, isopods, and heteropods were only observed inside the NPGP, with abundances varying between 561 and 659 individuals/km2. Crabs, squid, and euphausiids and shrimps were present at similar concentrations in waters outside the NPGP and in the inner NPGP. Fish were present throughout all three areas, with Pacific saury (Cololabis saira) and Lanternfish (Myctophidae) as the dominant fish species (see Supplementary Material). Note that for many organisms, very few individuals were collected and that in many cases, the species abundance was below our limit of detection (Table 1). The raw counts (i.e., number of individuals) for each Manta trawl sample are provided in Supplementary Material.
FIGURE 2
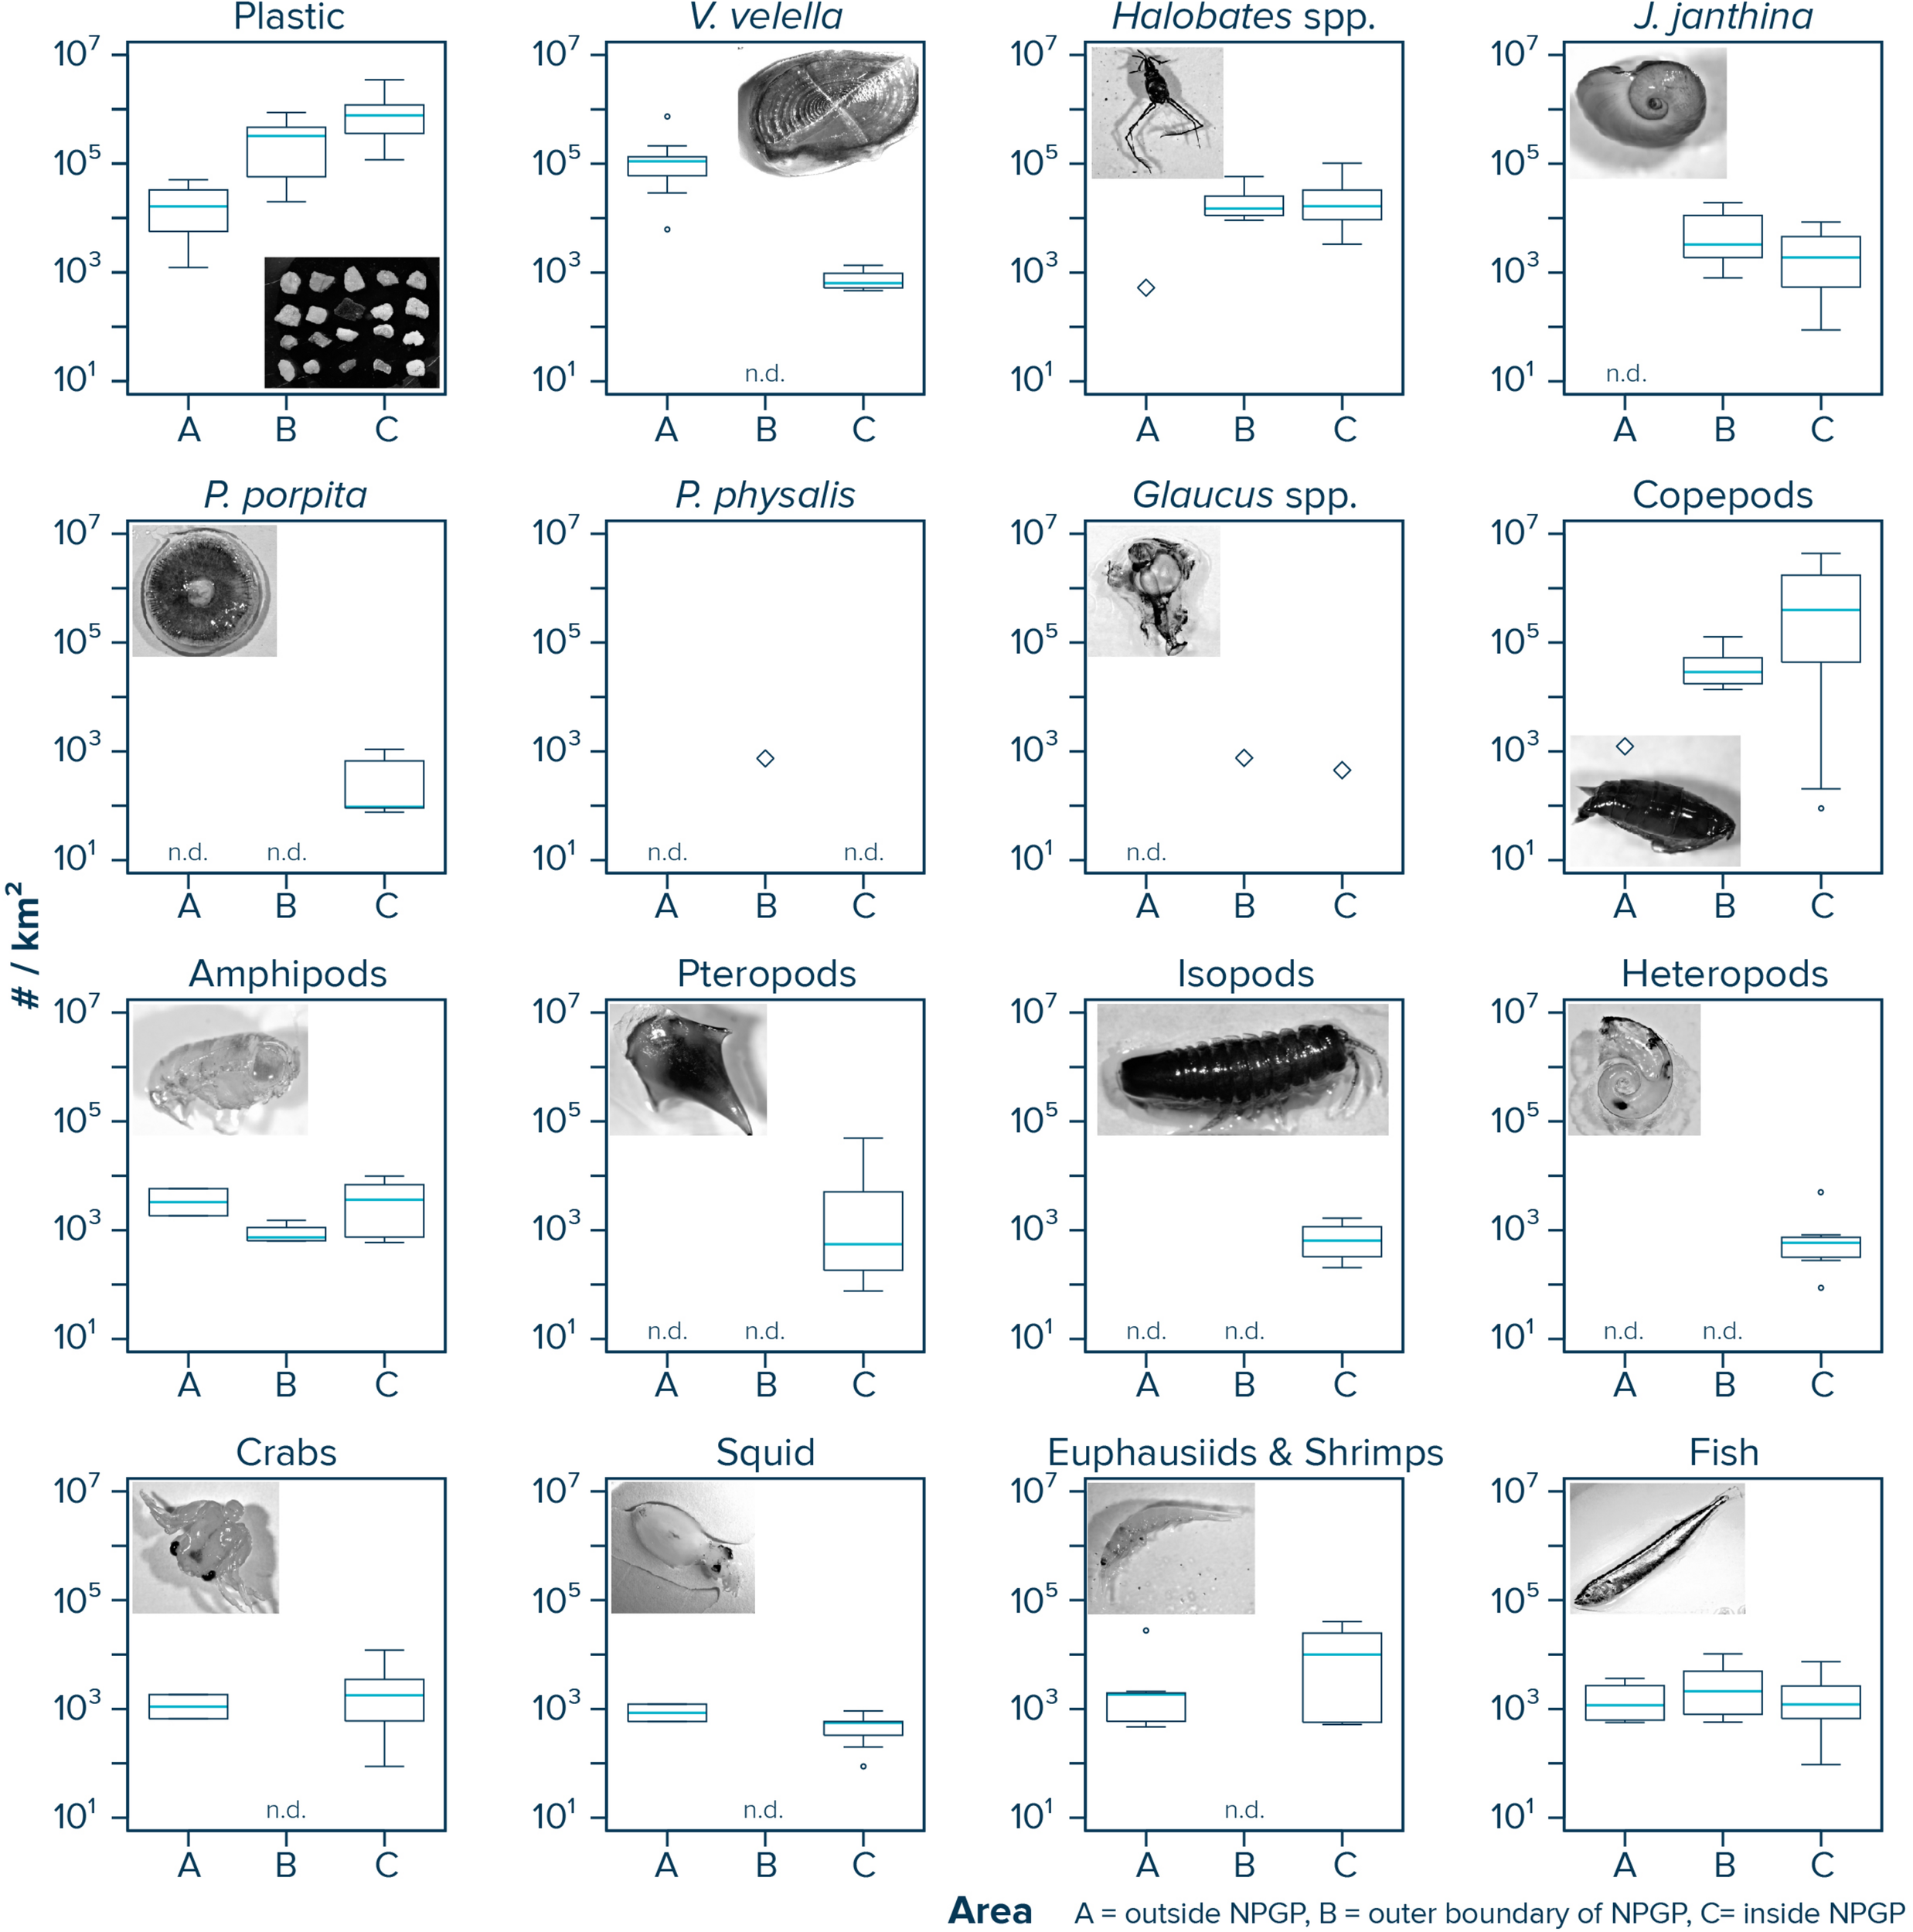
Numerical concentrations (#/km2) of floating plastic debris (0.05–5 cm in size) and of different members of the neuston observed in Manta trawls deployed outside the NPGP (Area A), in the outer boundary of the NPGP (Area B), and inside the NPGP (Area C). Horizontal lines represent median values. Box plots extend from the 25th to the 75th percentiles, while whiskers extend from the minimum to the maximum observed values. Large diamonds indicate that the species was only present in one Manta trawl. Dots indicate outliers. n.d., not detected in any of the Manta trawls. Note that plastic concentrations represent depth-integrated values.
TABLE 1
| Species/group | Unit | Outside NPGP (Area A) | Outer NPGP (Area B) | Inner NPGP (Area C) |
| a Plasticcorrected | #/km2 | 16,468 (5,686–32,998) | 323,256 (57,578–470,330) | 773,114 (360,599–1,208,975) |
| b Plasticuncorrected | #/km2 | 6,150 (4,677–13,960) | 245,833 (57,539–357,422) | 214,625 (132,908–889,558) |
| V. velella | #/km2 | 110,962 (61,541–133,935) | <LOD** | 639 (557–855) |
| Halobates spp. | #/km2 | 526* | 15,033 (11,227–25,493) | 16,650 (9,429–32,655) |
| J. janthina | #/km2 | <LOD** | 3,315 (2,124–9,363) | 1,897 (542–4,566) |
| P. porpita | #/km2 | <LOD** | <LOD** | 95 (91–678) |
| P. physalis | #/km2 | <LOD** | 738* | <LOD** |
| Glaucus spp. | #/km2 | <LOD** | 754* | 448* |
| Copepods | #/km2 | 1,230* | 28,770 (17,526–52,411) | 397,079 (43,545–1,731,593) |
| Amphipods | #/km2 | 3,818 (2,831–4,804) | 740 (643–1,000) | 3,640 (748–6,939) |
| Pteropods | #/km2 | <LOD** | <LOD** | 561 (187–4,654) |
| Isopods | #/km2 | <LOD** | <LOD** | 659 (438–1,018) |
| Heteropods | #/km2 | <LOD** | <LOD** | 588 (319–741) |
| Crabs | #/km2 | 1,255 (959–1,550) | <LOD** | 1,785 (604–3,501) |
| Squid | #/km2 | 908 (747–1,069) | <LOD** | 555 (371–588) |
| Euphausiids and shrimps | #/km2 | 1,840 (592–1,975) | <LOD** | 9,991 (570–25,320) |
| Fish | #/km2 | 1,171 (622–2,697) | 2,105 (797–4,949) | 1,219 (680–2,545) |
Numerical concentrations (#/km2) of floating plastic debris (0.05–5 cm in size) and of different members of the neuston observed in the eastern North Pacific Ocean.
The three areas (see Figure 1 for a geographical reference) correspond to surface waters outside the North Pacific Garbage Patch [NPGP; Area A; number of Manta trawls (n) = 18], within the outer boundary of the NPGP (Area B; n = 12), and inside the NPGP (Area C; n = 24). Numbers correspond to median values (#/km2). Values in parentheses refer to the 25th and 75th percentiles. aDepth-integrated numerical concentrations, corrected for wind-induced turbulent mixing (see Eq. 1). bUncorrected plastic concentrations. * Based on one value only (i.e., animal was only found in one out of n Manta trawls); ** below detection limit [note that the average limit of detection (LOD) was 611 individuals/km2 during the NPM3 Expedition and 114 individuals/km2 during the Mega Expedition]. Raw counts are provided in Supplementary Material.
No significant (i.e., P < 0.05) diurnal trend was observed inside the NPGP for Halobates spp. (Wilcoxon–Mann–Whitney test: W = 106, P = 0.212), J. janthina (W = 25, P = 0.330), P. porpita (W = 10, P = 0.229), copepods (W = 40, P = 0.733), amphipods (W = 4, P = 0.629), pteropods (W = 26, P = 0.109), heteropods (W = 10, P = 0.229), crabs (W = 43, P = 0.934), squid (W = 4, P = 0.571), and total fish abundance (W = 8, P = 0.058). Not enough observations (i.e., n < 3) were available from both, day- and nighttime, to statistically evaluate possible diurnal trends in the abundance of V. velella, P. physalis, Glaucus spp., isopods, euphausiids and, shrimps and individual vertically migrating fish species. However, we note that most (i.e., 83%) of our samples were taken during daytime, thus potential resulting in an underestimation of the average abundances of vertically migrating species such as, for example, copepods, fish, and euphausiids and shrimps in the surface waters.
Correlations With Plastic Concentrations
The abundance of V. velella was negatively correlated with (uncorrected) concentrations of floating plastic debris (log–log linear regression with R2 of 0.68 and a P-value of 3.94e–6) (Figure 3). While copepods, amphipods, crabs, squid, euphausiids and shrimps, and fish were observed across the whole range of plastic concentrations, with no significant correlations between species abundance and plastic density, the presence of Halobates spp., J. janthina, and pteropods was restricted to samples with plastic concentrations exceeding 104 #/km2. Furthermore, P. porpita, Glaucus spp., isopods, and heteropods were only observed in surface waters where concentrations of floating plastic debris exceeded 105 #/km2.
FIGURE 3
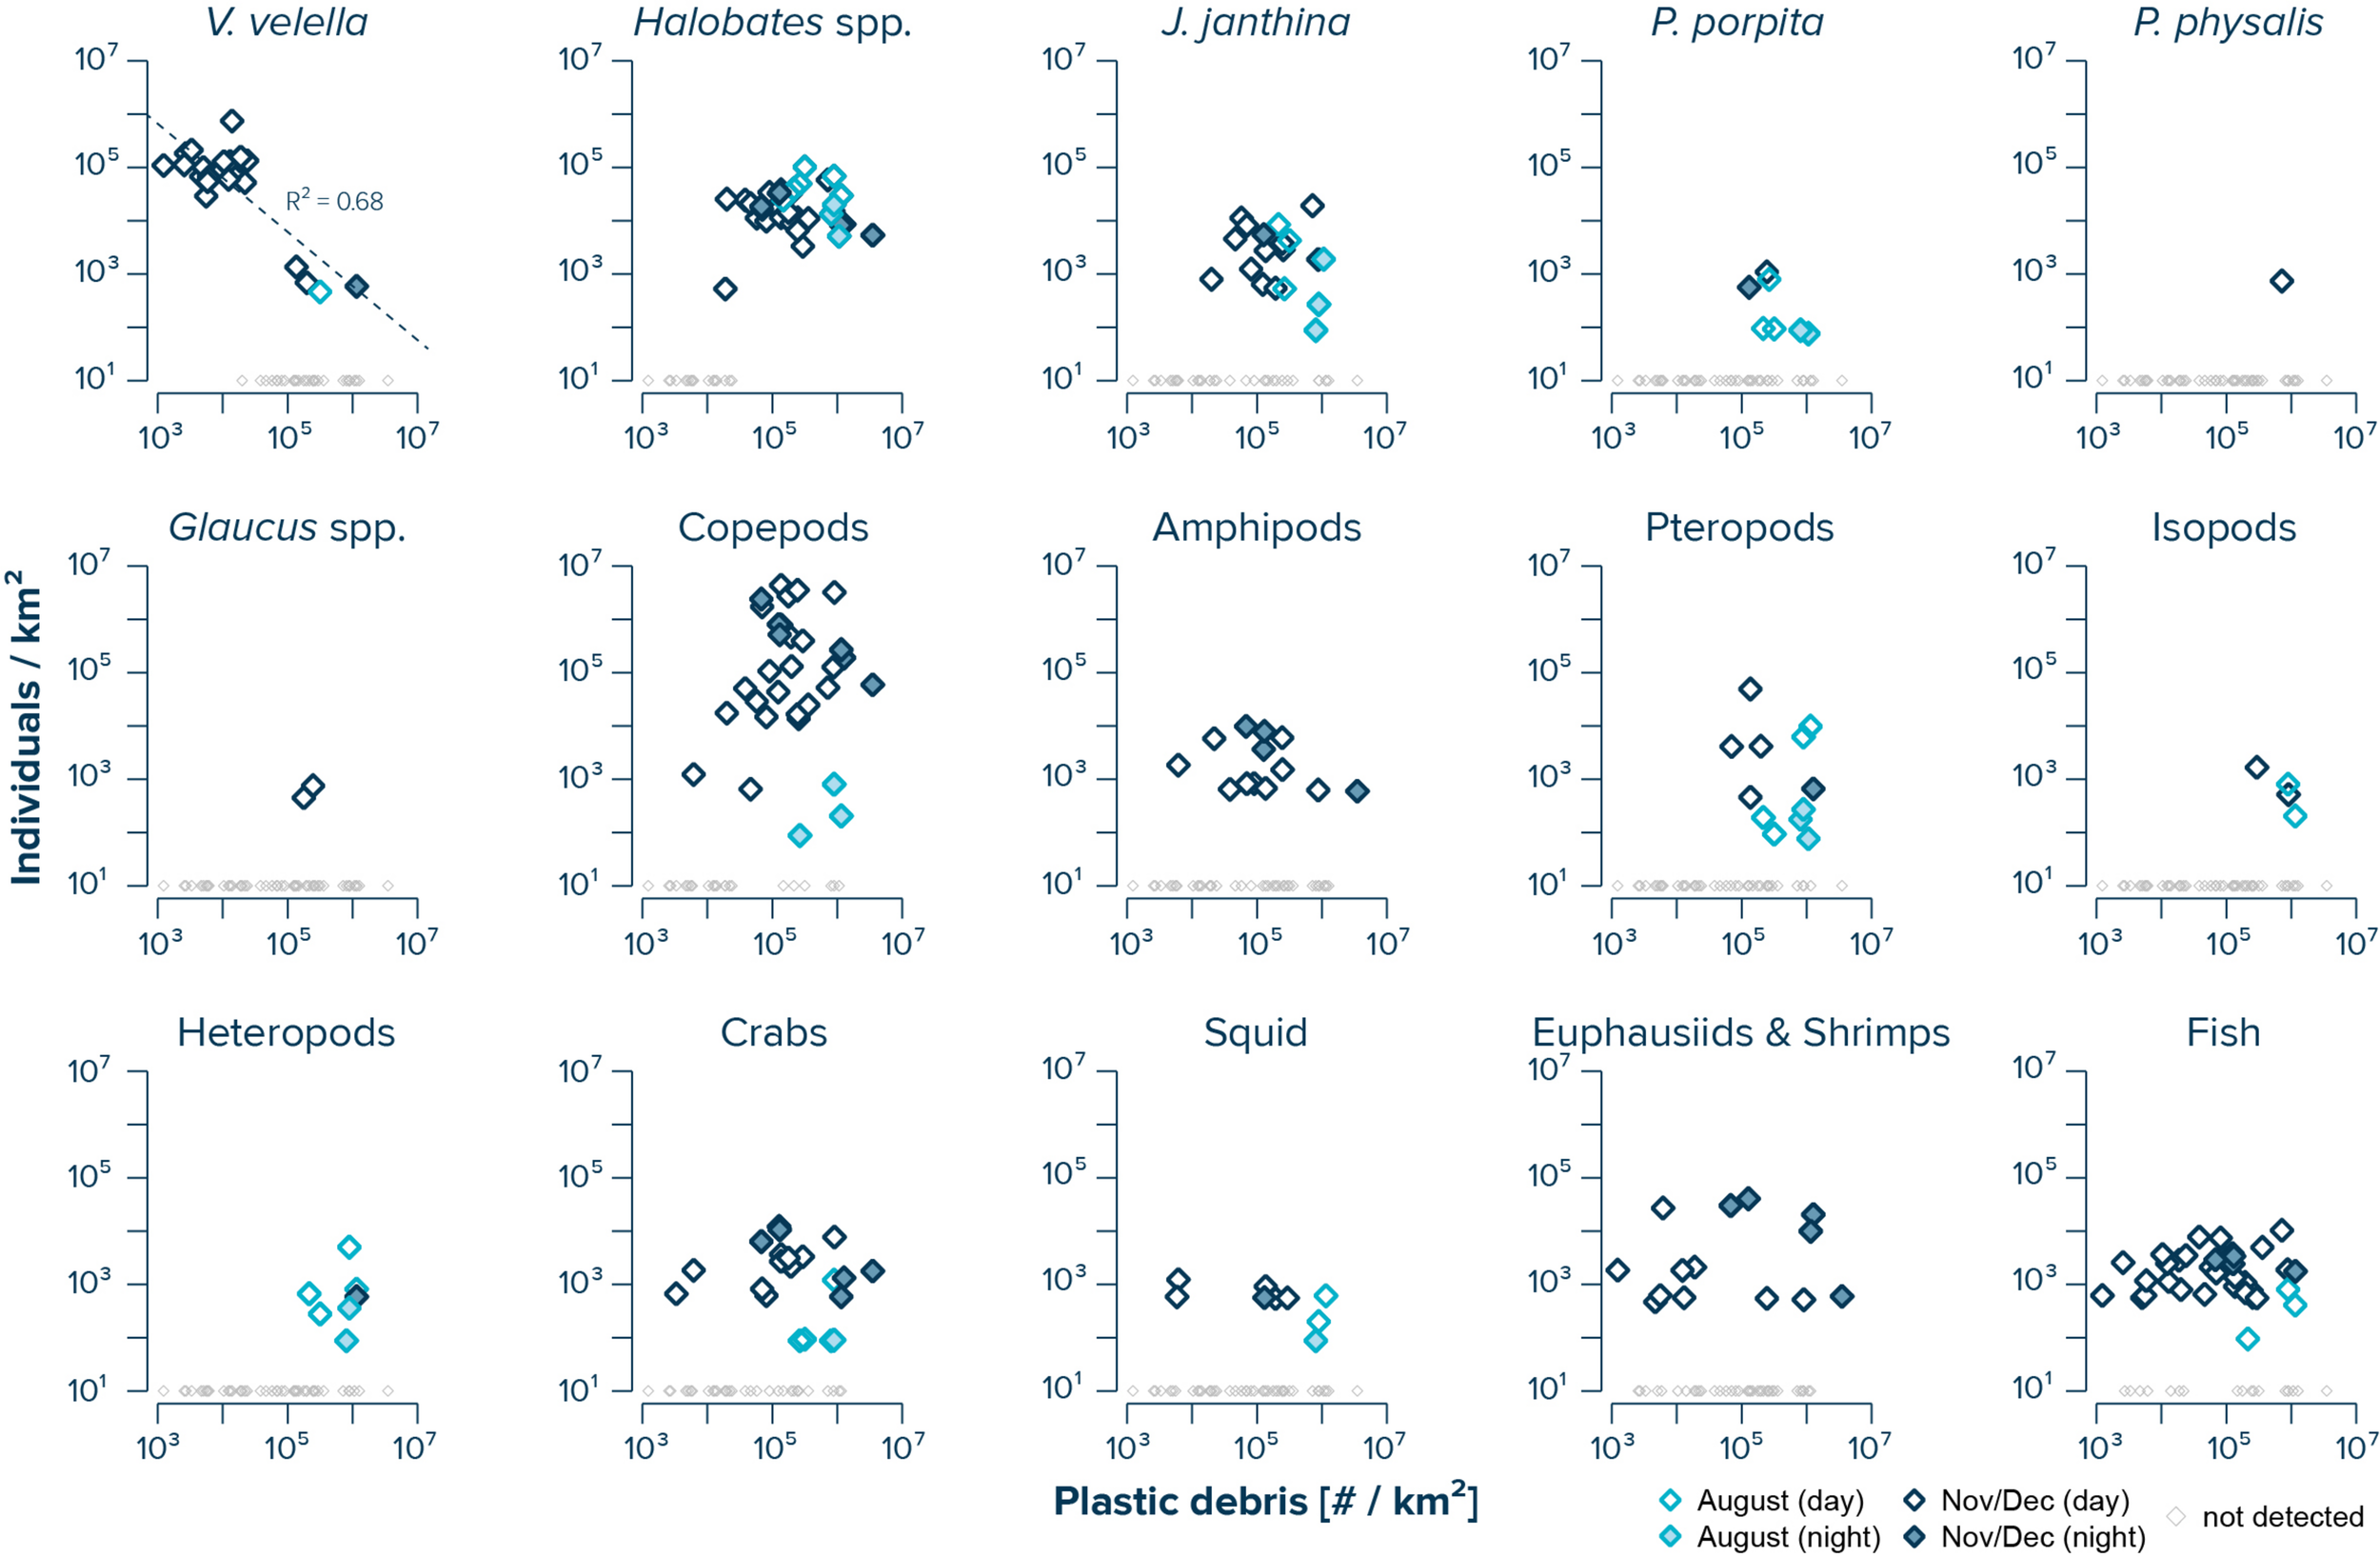
Log–log correlations of measured (uncorrected) concentrations of floating plastic debris (0.05–5 cm in size) and observed numbers of individuals per species. Dark blue diamonds represent samples taken during the NPM3 Expedition in November/December 2019, while light blue diamonds are samples collected during the Mega Expedition in August 2015. Filled diamonds indicates sampling after sunset. Small gray diamonds represent Manta trawls samples where no individuals of the corresponding species were observed. Note that the average limit of detection was 611 individuals/km2 during the NPM3 Expedition and 114 individuals/km2 during the Mega Expedition.
The numbers of plastic pieces (0.05–5 cm in size) present per individual V. velella significantly (Wilcoxon–Mann–Whitney test: W = 0, P = 0.00033) increased from 0.09 plastic pieces/individual in surface waters outside the NPGP to 484 plastic pieces/individual in surface waters inside the NPGP (Figure 4 and Table 2). A similar increasing trend from the outside to the inside of the NPGP in the numbers of plastic items per individual organism was observed for crabs, squid, euphausiids and shrimps, and fish. The number of plastic particles per individual Halobates spp. and J. janthina were similar in the outer NPGP boundary and inside of the NPGP, depicting values of 12 and 51–74 plastic pieces/individual, respectively. Plastic to copepods ratios decreased from the outer to the inner NPGP boundary. Plastic to amphipods ratios were lowest outside the NPGP and highest in the outer NPGP. The plastic to organism ratios of species only observed inside the NPGP (i.e., P. porpita, pteropods, isopods, and heteropods) were generally high, with 713–2,259 plastic fragments per individual.
FIGURE 4
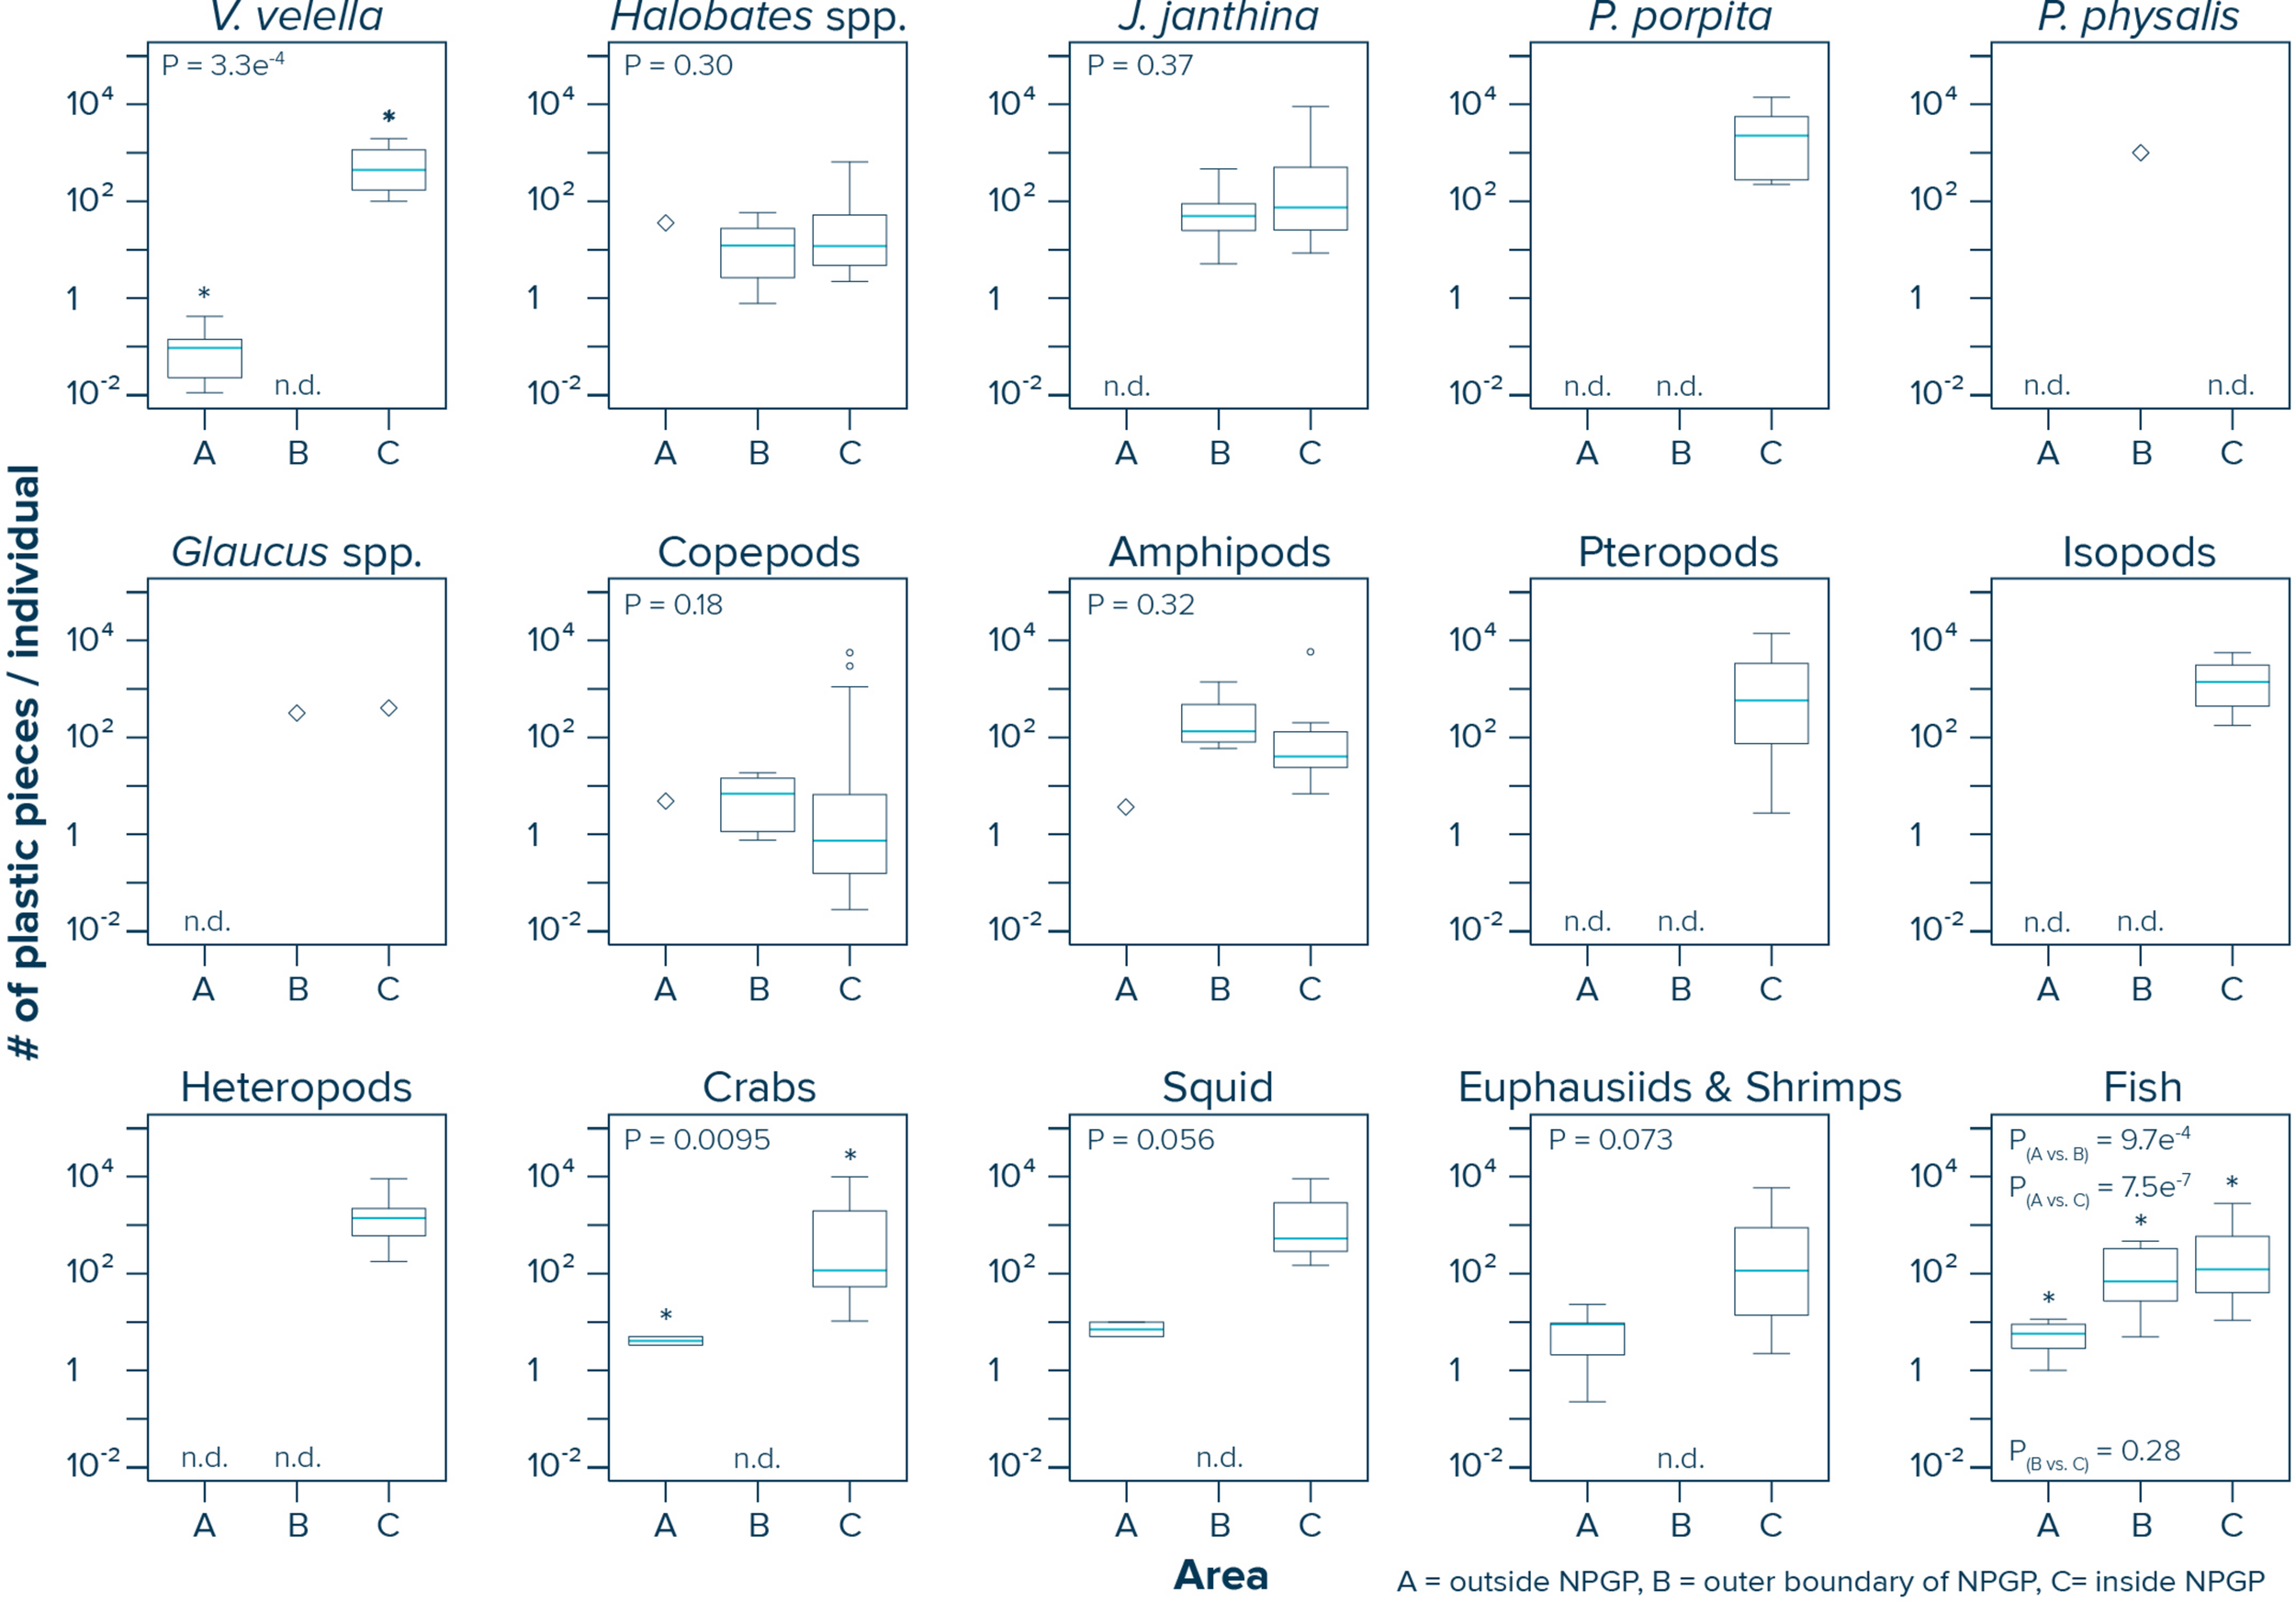
Numbers of plastic pieces (0.05–5 cm in size) present per individual species observed in Manta trawls deployed outside the NPGP (Area A), in the outer boundary of the NPGP (Area B) and inside the NPGP (Area C). Horizontal lines represent median values. Box plots extend from the 25th to the 75th percentiles, while whiskers extend from the minimum to the maximum observed values. Large diamonds indicate that the species was only present in one Manta trawl. Dots indicate outliers. n.d., not detected in any of the Manta trawls. Asterisk indicates a statistically significant (P < 0.05; Wilcoxon–Mann–Whitney test) difference between the sampling areas. Note that these ratios are based on uncorrected plastic concentrations.
TABLE 2
| Species | Unit | Outside NPGP (Area A) | Outer NPGP (Area B) | Inner NPGP (Area C) |
| V. velella | #/individual | 0.09 (0.02–0.14) | <LOD** | 484 (240–1,000) |
| Halobates spp. | #/individual | 36* | 12 (3–28) | 12 (5–52) |
| J. janthina | #/individual | <LOD** | 51(28–83) | 74 (25–500) |
| P. porpita | #/individual | <LOD** | <LOD** | 2,259 (282–6,263) |
| P. physalis | #/individual | <LOD** | 967* | <LOD** |
| Glaucus spp. | #/individual | <LOD** | 326* | 395* |
| Copepods | #/individual | 5* | 7 (1–14) | 0.7 (0.2–6.7) |
| Amphipods | #/individual | 3.6 (3.5–3.7) | 136 (96–471) | 41 (26–143) |
| Pteropods | #/individual | <LOD** | <LOD** | 713 (99–3,320) |
| Isopods | #/individual | <LOD** | <LOD** | 1,427 (876–2,712) |
| Heteropods | #/individual | <LOD** | <LOD** | 1,401 (729–2,215) |
| Crabs | #/individual | 4.2 (3.8–4.6) | <LOD** | 116 (53–1,958) |
| Squid | #/individual | 7.5 (6.2–8.7) | <LOD** | 531 (294–3,157) |
| Euphausiids and shrimps | #/individual | 9.0 (3.7–9.5) | <LOD** | 115 (33–1,097) |
| Fish | #/individual | 5.8 (3.4–8.5) | 69 (27–326) | 124 (41–561) |
Numbers (#) of plastic pieces (0.05–5 cm in size) present per individual of different members of the neuston observed in the eastern North Pacific Ocean.
The three areas (see Figure 1 for a geographical reference) correspond to surface waters outside the North Pacific Garbage Patch (NPGP; Area A), within the outer boundary of the NPGP (Area B), and inside the NPGP (Area C). Numbers correspond to median values (# plastic pieces / individual). Values in parentheses refer to the 25th and 75th percentiles. Note that these ratios are based on uncorrected plastic concentrations. * Based on one value only (i.e., animal was only found in one out of n Manta trawls); ** below detection limit [note that the average limit of detection (LOD) was 611 individuals/km2 during the NPM3 Expedition and 114 individuals/km2 during the Mega Expedition].
Differences Between Sampling Campaigns
Our data from inside the NPGP indicate that copepods (Wilcoxon–Mann–Whitney test: W = 53, P = 0.003), crabs (W = 67, P = 0.0035) and fish (W = 36, P = 0.025) were more abundant in the samples collected during the NPM3 Expedition (November/December 2019), while plastic debris (Wilcoxon–Mann–Whitney test: W = 39, P = 0.031) and Halobates spp. (W = 39, P = 0.031) were present in higher numbers in the samples collected during the Mega Expedition (August 2015) (Figure 5). We did not observe a significant difference in the abundance of J. janthina (W = 28, P = 0.37), pteropods (W = 27, P = 0.15), and squid (W = 9, P = 0.4) between the two sampling campaigns. Not enough observations (i.e., n < 3) were available from both campaigns to statistically evaluate possible differences in the abundance of V. velella, P. porpita, P. physalis, Glaucus spp., amphipods, isopods, heteropods, and euphausiids and shrimps inside the NPGP. It is important to note that our variability assessment between the two sampling campaigns is associated with large uncertainties. Importantly, the observed differences between the two sampling campaigns are likely influenced by the spatiotemporal variability within the NPGP, as the samples were taken 4 years apart, from different seasons and not from the same specific locations.
FIGURE 5
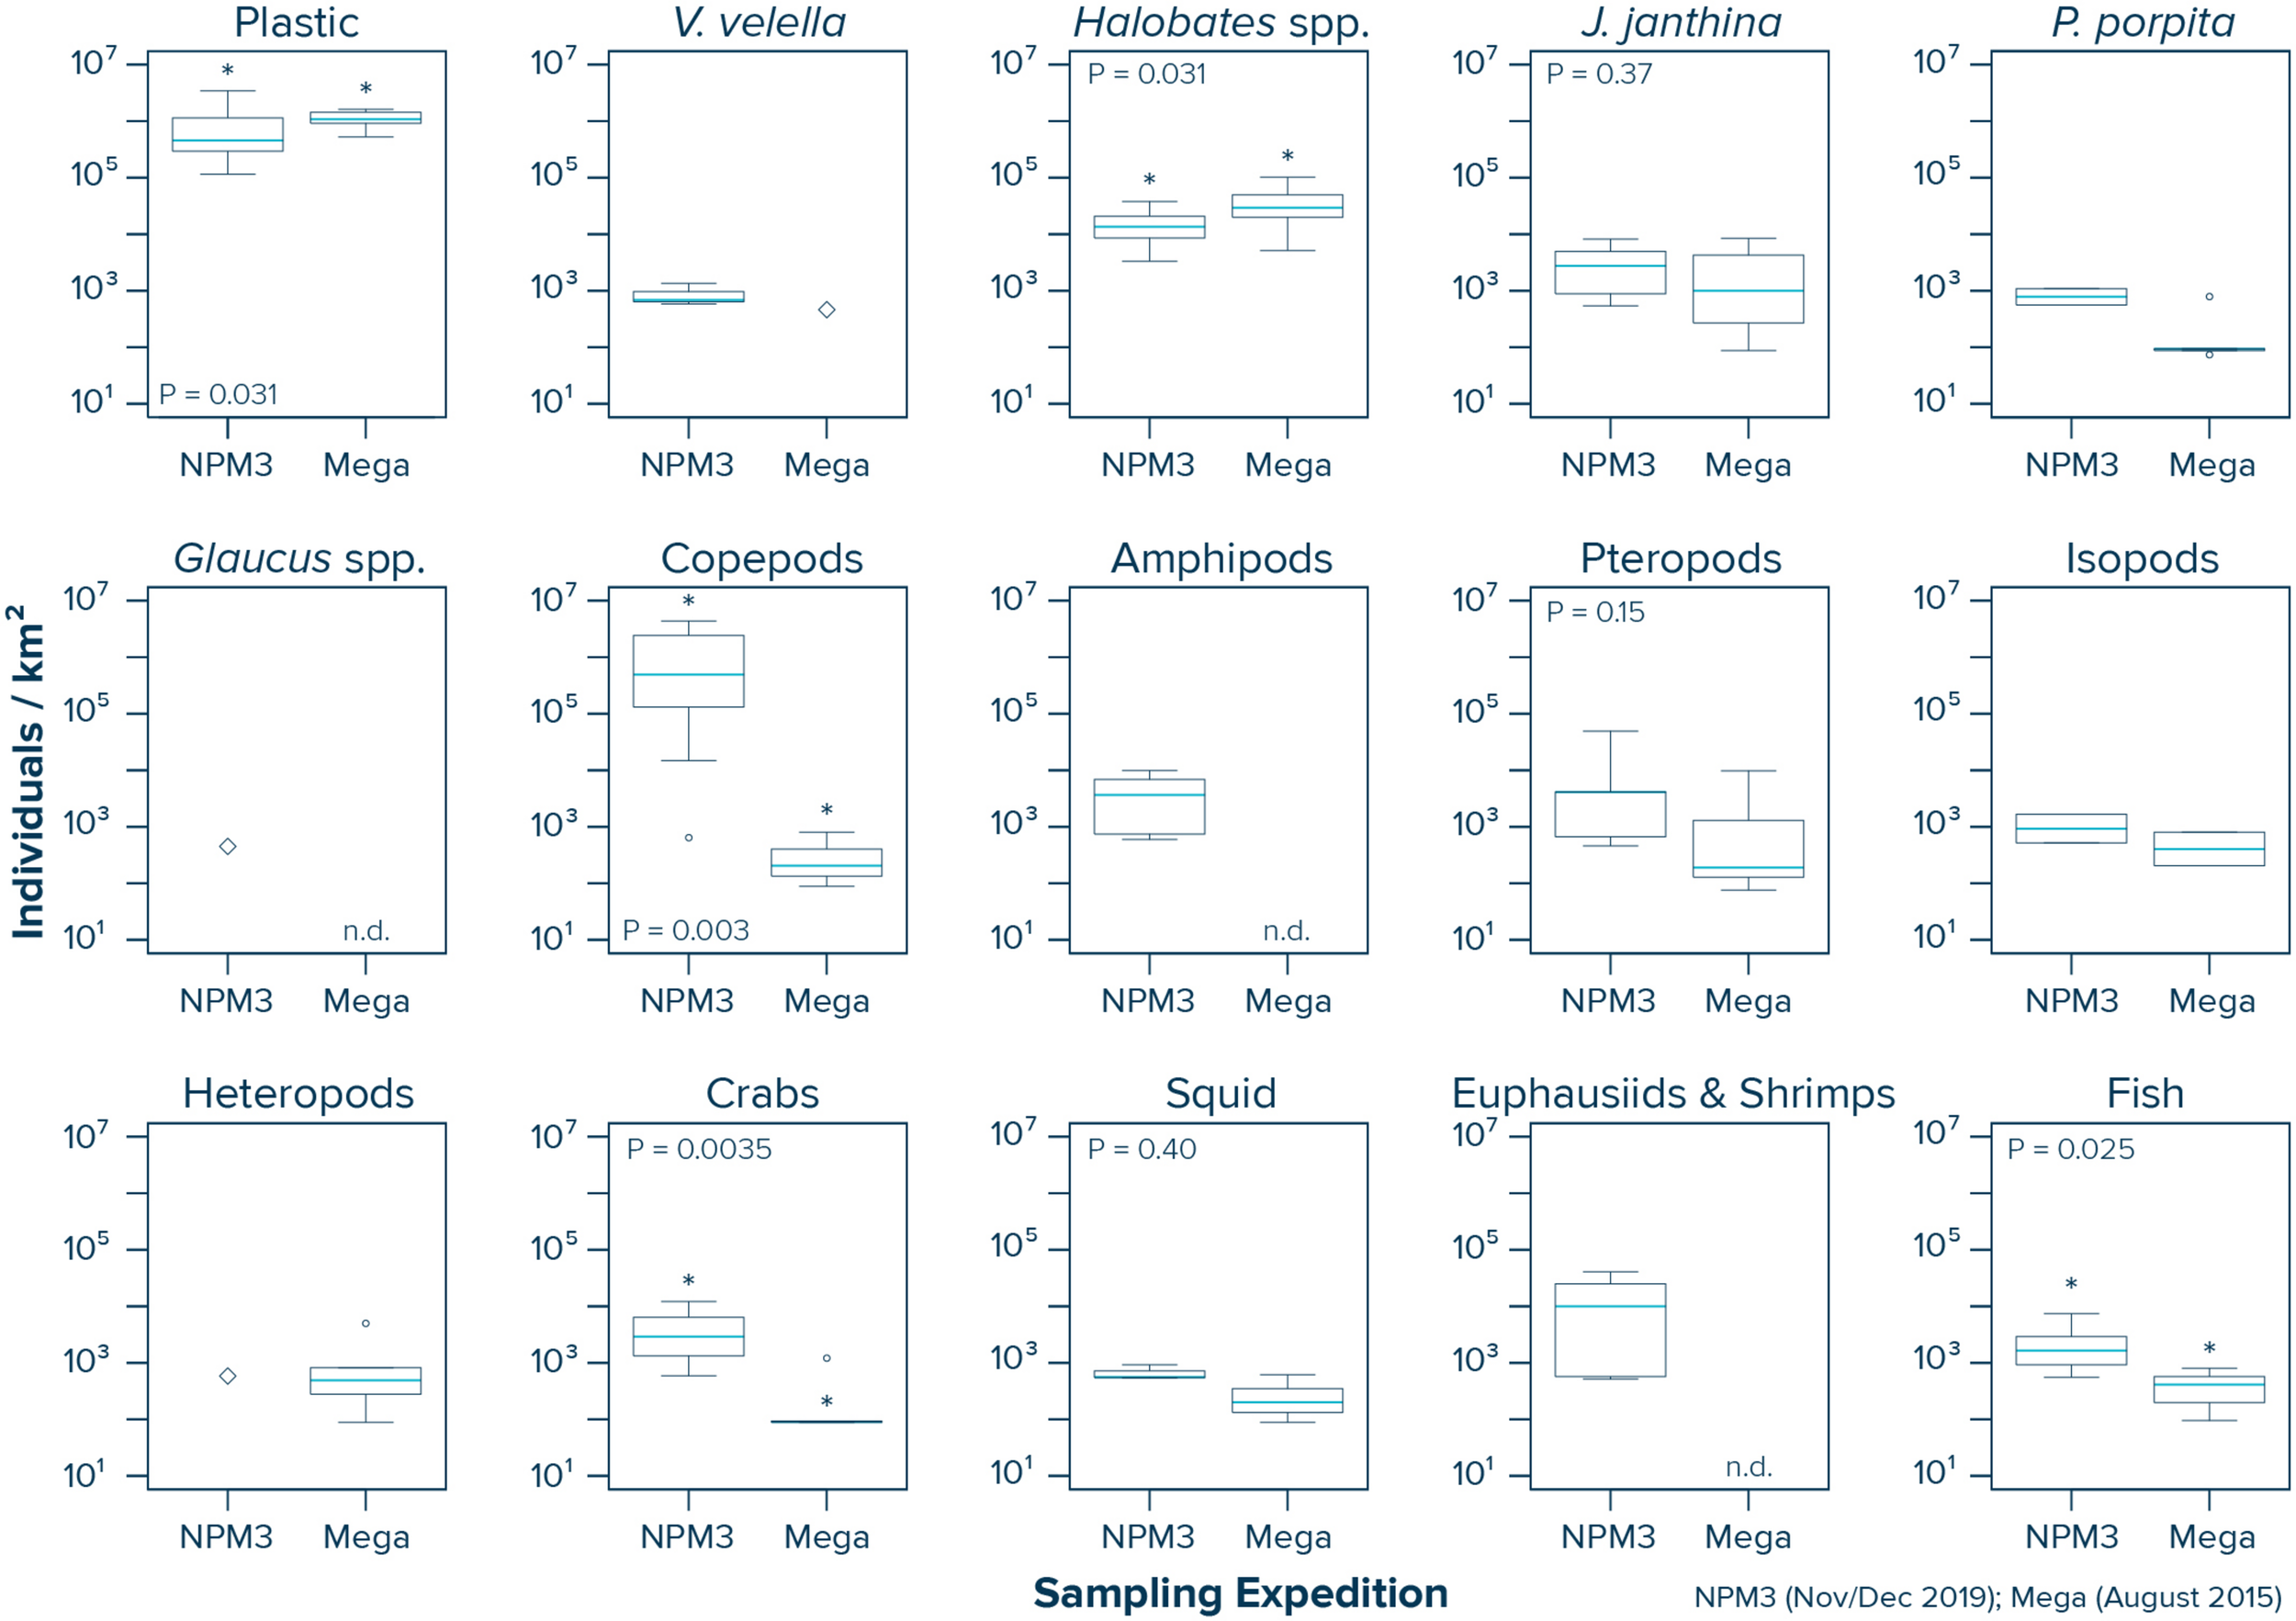
Comparison of the observed plastic and species abundance inside the North Pacific Garbage Patch (Area C) during the NPM3 Expedition (November/December 2019; red circles in Figure 1) and the Mega Expedition (August 2015; green circles in Figure 1). Horizontal lines represent median values. Box plots extend from the 25th to the 75th percentiles, while whiskers extend from the minimum to the maximum observed values. Large diamonds indicate that the species was only present in one Manta trawl. Dots indicate outliers. Asterisk indicates a statistically significant (P < 0.05; Wilcoxon–Mann–Whitney test) difference between the two sampling campaigns. n.d., not detected in any of the Manta trawls.
Discussion
The spatial distribution and magnitude of plastic pollution observed here are in good agreement with predicted spatial patterns of plastic pollution for the region (Van Sebille et al., 2015; Lebreton et al., 2018), depicting low (<104 #/km2) concentrations of floating micro- and mesoplastic debris along the continental margins of the North American west coast and high (>105 #/km2) concentrations in the NPGP. This spatial distribution of positively buoyant plastics at the sea surface is the result of a dynamic interplay between currents, waves and wind (Van Sebille et al., 2020). Previous work has shown that plastic debris accumulating in the NPGP is dominated by objects with a low atmospheric drag such as plastic fragments and ghostnets, while plastic particles subject to greater atmospheric drag such as foam or highly buoyant objects such as floating docks, boats, and large buoys tend to escape the NPGP or never reach it (Lebreton et al., 2018; Maximenko et al., 2018). Given the nature of the neuston, a community dominated by passively drifting organisms living at the sea-air interface (Cheng, 1975), it is likely that the spatial distribution of these organisms is, at least to a certain degree, influenced by these same oceanic transport processes that also govern the dispersal of floating plastic debris at the ocean surface. Our results indeed indicate that, like high-windage floating plastic debris, members of the neuston subject to a greater atmospheric drag such as V. velella or P. physalis who possess an upright chitin sail protruding above the sea surface could be less likely to accumulate in the NPGP. Observations of organisms with presumably lower atmospheric drag such as P. porpita, pteropods, isopods, or heteropods, on the other hand, were mostly restricted to surface waters inside the NPGP. Interestingly, the raft-building marine gastropod J. janthina, who keeps itself afloat using a raft made of air bubbles, was observed in the inner and outer boundaries of the NPGP. Their rafts could thus depict an intermediate atmospheric drag, which is high enough for a wider distribution within the subtropical gyre yet small enough to allow for a predominantly current- rather than wind-driven dispersal (i.e., to avoid being blown outside the gyre). Neustonic species with a higher vertical mobility, such as zooplankton, fish, squid, and euphausiids and shrimps, were observed in surface waters both with low and high concentrations of floating plastic debris. Thus, these more mobile species are likely dominated by additional transport mechanisms that differ from the dispersal of positively buoyant plastics at the sea surface, such as active swimming and vertical migration within the water column.
While the physical transport plays an important role in the spatial distribution of passively drifting marine organisms, additional factors such as limited nutrient supply in the oligotrophic subtropical oceanic gyres, prey, and predator abundances, as well as species life cycle dynamics need to be considered when evaluating the spatiotemporal dynamics of neuston (Karl, 1999; Karl and Church, 2017). Specific groups of neuston species such as euphausiids, pteropods, and heteropods, for example, appear to occur more frequently in specific water masses of the North Pacific, suggesting that these groups are composed of species with similar reactions to properties of the environment including the history of the water (Fager and McGowan, 1963). Consistent with these earlier observations, we note that pteropods and heteropods show similar abundance patterns in our study. However, the underlying dynamics of such observations remain poorly understood (Fager and McGowan, 1963; Karl and Church, 2017). Food and predation have further been suggested as the two main limiting factors affecting species abundances and neuston population dynamics (Hayward and Mcgowan, 1979). In addition, the presence of positively buoyant plastic objects has been shown to release Halobates spp. from substrate limitation for oviposition (Goldstein et al., 2012). Floating plastic objects further provide a hard-substrate habitat for pelagic crab species in an environment where natural flotsam is rare. Thus, we hypothesize that the high abundances of Halobates spp. and crabs observed in surface waters of the NPGP are likely not the result of species dispersal by oceanic transport only, but that they could stem from a plastic-associated fitness benefit due to release from oviposition and habitat limitation. To assess the relative dispersal of floating plastic debris and individual members of the neuston species more accurately, quantitative data is needed to understand how the transport of neuston and different types of floating plastic debris may be influenced by wind, waves, vertical species migration, nutrient availability, predation, seasonal species dynamics and interactions of individual species with floating plastic objects.
At present, large uncertainties in our understanding of plastic-induced alteration of neustonic ecosystem dynamics remain. Zooplankton (Sun et al., 2018; Wieczorek et al., 2019; Brandon et al., 2020), plastic-associated rafting organisms (Goldstein and Goodwin, 2013), and planktivorous fishes (Boerger et al., 2010; Davison and Asch, 2011) have been reported to ingest floating plastic debris, which could impede their feeding, function, and fecundity as demonstrated for copepods (Cole et al., 2015, 2019). Plastic debris afloat in the NPGP further depicts high levels of toxic persistent chemicals (Chu et al., 2015; Chen et al., 2018), thus the longer it remains in the environment, the higher the risk for accumulation in the food chain upon ingestion by members of the neuston (Jang et al., 2016; Alava et al., 2020). Increasing plastic to fish ratios toward the NPGP as observed here could indicate a higher probability of fish encountering plastic particles inside the NPGP compared to outside the NPGP. The dispersal of positively buoyant plastic debris at the ocean surface and subsequent accumulation in the NPGP also acts as a vector that distributes non-native and potentially harmful organisms (Gregory, 2009; Goldstein et al., 2014; Bryant et al., 2016; Carlton et al., 2017). This introduction of invasive species could have significant implications for the neustonic ecosystem structure, either through direct predation on native species or by increased competition for food. At present, it remains unknown how invasions of plastic-rafting non-native species and pathogens impact the neuston in the NPGP.
Removing plastic debris afloat in the NPGP could reduce the possible adverse effects of plastic pollution on the neuston. In addition, it would prevent the formation of large quantities of secondary microplastics and their subsequent vertical transfer toward deeper water layers (Egger et al., 2020b). Thus, removal of floating plastic debris in the NPGP can also minimize the negative impacts of plastic pollution on the still largely undiscovered deep-sea ecosystems below. However, mitigating the adverse effects of plastic pollution by removing plastic debris afloat at the ocean surface has raised concerns in some members of the scientific community due to possible neuston bycatch during plastic removal (Helm, 2019; Falk-Andersson et al., 2020). Environmental monitoring of mitigation strategies aimed at removing floating plastic debris therefore need to collect data to evaluate both, possible ecosystem benefits associated with removing plastic debris as well as impacts of possible neuston bycatch on neuston population dynamics.
Our findings reveal that many of the neustonic species present inside the NPGP, such as Halobates spp., J. janthina, Glaucus spp., copepods, amphipods, and fish are also present in similar abundances in the outer boundary of the NPGP. This observation indicates a possible recolonialization potential of these organisms inside the NPGP from the wider North Pacific subtropical gyre, which should be assessed in more detail with ecological models and DNA analyses. Many of these species (i.e., Halobates spp., J. janthina, and Glaucus spp.) further show highest plastic to organism ratios inside the NPGP. Focusing cleanup operations in the subtropical gyre on surface waters inside the NPGP therefore could reduce organism bycatch per unit of plastic extracted for these species. Species that were only observed in the NPGP, such as P. porpita, pteropods, isopods, and heteropods, could be at higher risk and their vulnerability to cleanup efforts in the NPGP should be monitored and assessed closely. The possible removal of neuston during cleanup can further be reduced by considering the seasonal and diurnal species distribution patterns (Falk-Andersson et al., 2020), as well as by taking into account species life cycle dynamics.
It is important to note that the species investigated here have patchy distributions and were infrequently sampled in the Manta trawls (Figure 3, gray diamonds), highlighting that our low sample size within each region (i.e., Areas A–C) limits the ability of this study to detect and quantitatively describe the full suite of neustonic diversity, especially for rarer species. Consequently, our observed species abundance and plastic density correlations, as well as the variability assessments are associated with large uncertainties and thus should be taken as first indications rather than statistically significant conclusions. More observational data of neustonic community structures down to species level and associated concentrations and characteristics of floating plastic debris, spanning large spatial scales, and considering temporal aspects, are essential to improve our understanding on this subject. In addition, future studies should also include phytoplankton communities, encrusting organisms attached to the plastic debris, as well as gelatinous species such as salps, jellyfish, and fish eggs. Furthermore, more observational data on levels of plastic ingestion, nutritional state, and chemical contamination of neustonic organisms is urgently needed to evaluate whether neuston inside the NPGP is harmed to a larger extent by plastic pollution compared to waters outside the NPGP with lower concentrations of floating plastic debris. To overcome the present knowledge gaps, we call for marine scientists studying ocean plastic pollution to also collect information on the neuston present in their samples. We further advocate for more quantitative research on the importance of natural neuston loss rates such as beaching of neuston onto coastlines (Betti et al., 2019), as well as on the ecological impact of other anthropogenic activities such as, for example, fisheries and shipping on the neustonic ecosystem. This study highlights that scientific collaborations between academic research institutions, non-profit organizations, and private institutions provide a unique platform to conduct extended research on the spatiotemporal distribution of neuston and floating plastic debris in remote and difficult to access oceanic gyres. Data from these remote areas are urgently needed to assess the lasting risks of ocean plastic pollution for the neuston and to advance optimized mitigation strategies.
Conclusion
The results presented here provide a first observational baseline for the types of observational data that ecological models would need to evaluate the impacts of plastic pollution and of possible offshore mitigation strategies on the neuston in the eastern North Pacific Ocean. Our findings indicate that surface waters inside the NPGP depict higher plastic to organism ratios for some target species compared to waters in the outer boundaries of the NPGP, while showing similar numerical abundances in many neustonic species. Thus, neuston residing within the NPGP could be more likely to interact with floating plastic debris. However, it is important to note that more observational data on the spatiotemporal dynamics of individual members of the neuston and their interactions with floating plastic debris, combined with ecological modeling, is needed for more accurate predictions. We advocate for a more systematic assessment based on repeated and standardized monthly sampling of specific locations across the eastern North Pacific Ocean over multiple years. Furthermore, we stress that cleanup technologies need to closely monitor neuston bycatch and to ensure that it remains below the maximum acceptable limit determined based on seasonal reproductive capabilities of neustonic organisms. Lastly, we argue that besides quantifying possible bycatch during removal, ecological risk assessments of the impact of offshore cleanup activities on neuston and associated marine food chains also need to consider potential benefits of reducing the negative effects of plastic pollution.
Statements
Data availability statement
The original contributions presented in the study are included in the article/Supplementary Material, further inquiries can be directed to the corresponding author/s.
Author contributions
ME designed the study, conducted the statistical analyses and the calculations, and prepared figures and tables. ME and FF collected the samples. LQ, GL, and ME analyzed the samples. ME wrote the manuscript with contributions from all authors. All authors contributed to the article and approved the submitted version.
Funding
This work was funded by the donors of The Ocean Cleanup.
Acknowledgments
We thank The Ocean Cleanup donors who helped fund this research, as well as the captains and crew of the Mega and NPM3 expeditions for their support during sampling. We also acknowledge Mark de Boer and the Zoo of Rotterdam (Diergaarde Blijdorp) for providing access to their marine laboratory facilities and for support with sample analyses. Jennifer Brandon and Linsey Sala helped with plankton identification and contributed literature and edits to the manuscript. We are further grateful to Greg Rouse for help with species identification and Rebecca Asch for general advice on the research, as well as to Laurent Lebreton and Linsey Haram for reviewing earlier versions of this manuscript. Lastly, we thank all reviewers for their insightful comments and suggestions that improved the quality of this work.
Conflict of interest
ME, FF, LQ, and MT are or were employed by The Ocean Cleanup, a non-profit organization aimed at advancing scientific understanding and developing solutions to rid the oceans of plastic, headquartered in Rotterdam, Netherlands. The remaining authors declare that the research was conducted in the absence of any commercial or financial relationships that could be construed as a potential conflict of interest.
Supplementary material
The Supplementary Material for this article can be found online at: https://www.frontiersin.org/articles/10.3389/fmars.2021.626026/full#supplementary-material
References
1
Alava J. J. (2020). Modeling the bioaccumulation and biomagnification potential of microplastics in a cetacean foodweb of the northeastern pacific: a prospective tool to assess the risk exposure to plastic particles.Front. Mar. Sci.7:566101. 10.3389/fmars.2020.566101
2
Betti F. Bo M. Enrichetti F. Manuele M. Cattaneo-Vietti R. Bavestrello G. (2019). Massive strandings of Velella velella (Hydrozoa: Anthoathecata: Porpitidae) in the Ligurian Sea (North-western Mediterranean Sea).Eur. Zool. J.86343–353. 10.1080/24750263.2019.1671506
3
Boerger C. M. Lattin G. L. Moore S. L. Moore C. J. (2010). Plastic ingestion by planktivorous fishes in the North Pacific Central Gyre.Mar. Pollut. Bull.602275–2278. 10.1016/j.marpolbul.2010.08.007
4
Borrelle S. B. Ringma J. Law K. L. Monnaham C. C. Lebreton L. McGivern A. et al (2020). Predicted growth in plastic waste exceeds efforts to mitigate plastic pollution.Science3691515–1518. 10.1126/science.aba3656
5
Brandon J. A. Freibott A. Sala L. M. (2020). Patterns of suspended and salp-ingested microplastic debris in the North Pacific investigated with epifluorescence microscopy.Limnol. Oceanogr. Lett.546–53. 10.1002/lol2.10127
6
Bryant J. A. Clemente T. M. Viviani D. A. Fong A. A. Thomas K. A. Kemp P. et al (2016). Diversity and activity of communities inhabiting plastic debris in the North Pacific Gyre.mSystems11–19. 10.1128/msystems.00024-16
7
Carlton J. T. Chapman J. W. Geller J. B. Miller J. A. Carlton D. A. McCuller M. I. et al (2017). Tsunami-driven rafting: Transoceanic species dispersal and implications for marine biogeography.Science3571402–1406. 10.1126/science.aao1498
8
Chen Q. Reisser J. Cunsolo S. Kwadijk C. Kotterman M. Proietti M. et al (2018). Pollutants in plastics within the North Pacific Subtropical Gyre.Environ. Sci. Technol.52446–456. 10.1021/acs.est.7b04682
9
Cheng L. (1975). Marine pleuston - animals at the sea-air interface.Ocean. Mar. Bio. Ann. Rev.13181–212.
10
Choy C. A. Robison B. H. Gagne T. O. Erwin B. Firl E. Halden R. U. et al (2019). The vertical distribution and biological transport of marine microplastics across the epipelagic and mesopelagic water column.Sci. Rep.9:7843. 10.1038/s41598-019-44117-2
11
Chu S. Wang J. Leong G. Woodward L. A. Letcher R. J. Li Q. X. (2015). Perfluoroalkyl sulfonates and carboxylic acids in liver, muscle and adipose tissues of black-footed albatross (Phoebastria nigripes) from Midway Island.North Pacific Ocean. Chemosphere13860–66. 10.1016/j.chemosphere.2015.05.043
12
Cole M. Coppock R. Lindeque P. K. Altin D. Reed S. Pond D. W. et al (2019). Effects of nylon microplastic on feeding, lipid accumulation, and moulting in a coldwater copepod.Environ. Sci. Technol.537075–7082. 10.1021/acs.est.9b01853
13
Cole M. Lindeque P. Fileman E. Halsband C. Galloway T. S. (2015). The impact of polystyrene microplastics on feeding, function and fecundity in the marine copepod Calanus helgolandicus.Environ. Sci. Technol.491130–1137. 10.1021/es504525u
14
Cózar A. Echevarría F. Gonzalez-Gordillo J. I. Irigoien X. Úbeda B. Hernández-León S. et al (2014). Plastic debris in the open ocean.Proc. Natl. Acad. Sci.U.S.A.11110239–10244. 10.1073/pnas.1314705111
15
Davison P. Asch R. G. (2011). Plastic ingestion by mesopelagic fishes in the North Pacific Subtropical Gyre.Mar. Ecol. Prog. Ser.432173–180. 10.3354/meps09142
16
Egger M. Nijhof R. Quiros L. Leone G. Royer S.-J. McWhirter A. C. et al (2020a). A spatially variable scarcity of floating microplastics in the eastern North Pacific Ocean.Environ. Res. Lett.15:114056. 10.1088/1748-9326/abbb4f
17
Egger M. Sulu-Gambari F. Lebreton L. (2020b). First evidence of plastic fallout from the Great Pacific Garbage Patch.Sci. Rep.10:7495. 10.1038/s41598-020-64465-8
18
Eriksen M. Lebreton L. C. M. Carson H. S. Thiel M. Moore C. J. Borerro J. C. et al (2014). Plastic pollution in the world’s cceans: more than 5 trillion plastic pieces weighing over 250,000 tons afloat at sea.PLoS One9:e111913. 10.1371/journal.pone.0111913
19
Fager E. W. McGowan J. A. (1963). Zooplankton species groups in the North Pacific.Science140453–460. 10.1126/science.140.3566.453
20
Falk-Andersson J. Larsen Haarr M. Havas V. (2020). Basic principles for development and implementation of plastic clean-up technologies: what can we learn from fisheries management?Sci. Total Environ.745:141117. 10.1016/j.scitotenv.2020.141117
21
Geyer R. Jambeck J. Law K. (2017). Production, use, and fate of all plastics ever made.Sci. Adv.325–29.
22
Goldstein M. C. Carson H. S. Eriksen M. (2014). Relationship of diversity and habitat area in North Pacific plastic-associated rafting communities.Mar. Biol.1611441–1453. 10.1007/s00227-014-2432-8
23
Goldstein M. C. Goodwin D. S. (2013). Gooseneck barnacles (Lepas spp.) ingest microplastic debris in the North Pacific Subtropical Gyre.PeerJ1e184. 10.7717/peerj.184
24
Goldstein M. C. Rosenberg M. Cheng L. (2012). Increased oceanic microplastic debris enhances oviposition in an endemic pelagic insect.Biol. Lett.8817–820. 10.1098/rsbl.2012.0298
25
Goldstein M. C. Titmus A. J. Ford M. (2013). Scales of spatial heterogeneity of plastic marine debris in the northeast Pacific Ocean.PLoS One8:e80020. 10.1371/journal.pone.0080020
26
Gregory M. R. (2009). Environmental implications of plastic debris in marine settings- entanglement, ingestion, smothering, hangers-on, hitch-hiking and alien invasions.Philos. Trans. R. Soc. B Biol. Sci.3642013–2025. 10.1098/rstb.2008.0265
27
Hayward T. L. Mcgowan J. A. (1979). Pattern and structure in an oceanic zooplankton community.Amer. Zool.191045–1055. 10.1093/icb/19.4.1045
28
Helm R. (2019). How Plastic Cleanup Threatens the Ocean’s living islands.Atl. Available online at: https://www.theatlantic.com/science/archive/2019/01/ocean-cleanup-projectcould-%0Adestroy-neuston/580693/(accessed January 22, 2019).
29
Hidalgo-Ruz V. Gutow L. Thompson R. C. Thiel M. (2012). Microplastics in the marine environment: a review of the methods used for identification and quantification.Environ. Sci. Technol.463060–3075. 10.1021/es2031505
30
Horton A. A. Barnes D. K. A. (2020). Microplastic pollution in a rapidly changing world: implications for remote and vulnerable marine ecosystems.Sci. Total Environ.738:140349. 10.1016/j.scitotenv.2020.140349
31
Howell E. A. Bograd S. J. Morishige C. Seki M. P. Polovina J. J. (2012). On North Pacific circulation and associated marine debris concentration.Mar. Pollut. Bull.6516–22. 10.1016/j.marpolbul.2011.04.034
32
Jambeck J. R. Geyer R. Wilcox C. Siegler T. R. Perryman M. Andrady A. et al (2015). Plastic waste inputs from land into the ocean.Science347768–771. 10.1126/science.1260879
33
Jang M. Shim W. J. Han G. M. Rani M. Song Y. K. Hong S. H. (2016). Styrofoam debris as a source of hazardous additives for marine organisms.Environ. Sci. Technol.504951–4960. 10.1021/acs.est.5b05485
34
Karl D. M. (1999). A sea of change: biogeochemical variability in the North Pacific Subtropical Gyre.Ecosystems2181–214. 10.1007/s100219900068
35
Karl D. M. Church M. J. (2017). Ecosystem structure and dynamics in the North Pacific Subtropical Gyre: new views of an old ocean.Ecosystems20433–457. 10.1007/s10021-017-0117-0
36
Kukulka T. Proskurowski G. Morét-Ferguson S. Meyer D. W. Law K. L. (2012). The effect of wind mixing on the vertical distribution of buoyant plastic debris.Geophys. Res. Lett.39:L07601. 10.1029/2012GL051116
37
Kvale K. Prowe A. E. F. Chien C. T. Landolfi A. Oschlies A. (2020). The global biological microplastic particle sink.Sci. Rep.10:16670. 10.1038/s41598-020-72898-4
38
Law K. L. Morét-Ferguson S. E. Goodwin D. S. Zettler E. R. Deforce E. Kukulka T. et al (2014). Distribution of surface plastic debris in the eastern pacific ocean from an 11-year data set.Environ. Sci. Technol.484732–4738. 10.1021/es4053076
39
Lebreton L. Egger M. Slat B. (2019). A global mass budget for positively buoyant macroplastic debris in the ocean.Sci. Rep.9:12922. 10.1038/s41598-019-49413-5
40
Lebreton L. Slat B. Ferrari F. Sainte-Rose B. Aitken J. Marthouse R. et al (2018). Evidence that the Great Pacific Garbage Patch is rapidly accumulating plastic.Sci. Rep.8:4666. 10.1038/s41598-018-22939-w
41
Lebreton L. C. M. Greer S. D. Borrero J. C. (2012). Numerical modelling of floating debris in the world’s oceans.Mar. Pollut. Bull.64653–661. 10.1016/j.marpolbul.2011.10.027
42
Lebreton L. C. M. Van Der Zwet J. Damsteeg J. W. Slat B. Andrady A. Reisser J. (2017). River plastic emissions to the world’s oceans.Nat. Commun.8:15611. 10.1038/ncomms15611
43
Maximenko N. Hafner J. Kamachi M. MacFadyen A. (2018). Numerical simulations of debris drift from the Great Japan Tsunami of 2011 and their verification with observational reports.Mar. Pollut. Bull.1325–25. 10.1016/j.marpolbul.2018.03.056
44
Maximenko N. Hafner J. Niiler P. (2012). Pathways of marine debris derived from trajectories of Lagrangian drifters.Mar. Pollut. Bull.6551–62. 10.1016/j.marpolbul.2011.04.016
45
Moore C. J. Moore S. L. Leecaster M. K. Weisberg S. B. (2001). A comparison of plastic and plankton in the North Pacific Central Gyre.Mar. Pollut. Bull.421297–1300. 10.1016/S0025-326X(01)00114-X
46
Mountford A. S. Maqueda M. (2019). Eulerian modeling of the three − dimensional distribution of seven popular microplastic types in the global ccean.J. Geophys. Res. Ocean.1248558–8573. 10.1029/2019JC015050
47
Olivelli A. Hardesty B. D. Wilcox C. (2020). Coastal margins and backshores represent a major sink for marine debris: insights from a continental-scale analysis.Environ. Res. Lett.15:074037. 10.1088/1748-9326/ab7836
48
Pabortsava K. Lampitt R. S. (2020). High concentrations of plastic hidden beneath the surface of the Atlantic Ocean.Nat. Commun.11:4073. 10.1038/s41467-020-17932-9
49
Reisser J. Slat B. Noble K. du Plessis K. Epp M. Proietti M. et al (2015). The vertical distribution of buoyant plastics at sea: an observational study in the North Atlantic Gyre.Biogeosciences121249–1256. 10.5194/bg-12-1249-2015
50
Ryan P. G. (2015). Does size and buoyancy affect the long-distance transport of floating debris?Environ. Res. Lett.10:084019. 10.1088/1748-9326/10/8/084019
51
Ryan P. G. (2020). Land or sea? What bottles tell us about the origins of beach litter in Kenya.Waste Manag.11649–57. 10.1016/j.wasman.2020.07.044
52
Schmidt C. Krauth T. Wagner S. (2017). Export of plastic debris by rivers into the sea.Environ. Sci. Technol.5112246–12253. 10.1021/acs.est.7b02368
53
Sun X. Liang J. Zhu M. Zhao Y. Zhang B. (2018). Microplastics in seawater and zooplankton from the Yellow Sea.Environ. Pollut.242585–595. 10.1016/j.envpol.2018.07.014
54
Tekman M. B. Wekerle C. Lorenz C. Primpke S. Hasemann C. Gerdts G. et al (2020). Tying up loose ends of microplastic pollution in the Arctic: distribution from the sea surface, through the water column to deep-sea sediments at the HAUSGARTEN observatory.Environ. Sci. Technol.544079–4090. 10.1021/acs.est.9b06981
55
Van Sebille E. Aliani S. Law K. L. Maximenko N. Alsina J. M. Bagaev A. et al (2020). The physical oceanography of the transport of floating marine debris.Environ. Res. Lett.15:023003.
56
Van Sebille E. England M. H. Froyland G. (2012). Origin, dynamics and evolution of ocean garbage patches from observed surface drifters.Environ. Res. Lett.7:044040. 10.1088/1748-9326/7/4/044040
57
Van Sebille E. Wilcox C. Lebreton L. Maximenko N. Hardesty B. D. van Franeker J. A. et al (2015). A global inventory of small floating plastic debris.Environ. Res. Lett.10:124006. 10.1088/1748-9326/10/12/124006
58
Wieczorek A. M. Croot P. L. Lombard F. Sheahan J. N. Doyle T. K. (2019). Microplastic ingestion by gelatinous zooplankton may lower efficiency of the biological pump.Environ. Sci. Technol.535387–5395. 10.1021/acs.est.8b07174
Summary
Keywords
marine debris, ocean plastic pollution, neuston, North Pacific Garbage Patch, offshore cleanup
Citation
Egger M, Quiros L, Leone G, Ferrari F, Boerger CM and Tishler M (2021) Relative Abundance of Floating Plastic Debris and Neuston in the Eastern North Pacific Ocean. Front. Mar. Sci. 8:626026. doi: 10.3389/fmars.2021.626026
Received
04 November 2020
Accepted
26 April 2021
Published
03 June 2021
Volume
8 - 2021
Edited by
Juan José Alava, University of British Columbia, Canada
Reviewed by
Matthew Savoca, Stanford University, United States; Jean-Pierre Desforges, McGill University, Canada
Updates
Copyright
© 2021 Egger, Quiros, Leone, Ferrari, Boerger and Tishler.
This is an open-access article distributed under the terms of the Creative Commons Attribution License (CC BY). The use, distribution or reproduction in other forums is permitted, provided the original author(s) and the copyright owner(s) are credited and that the original publication in this journal is cited, in accordance with accepted academic practice. No use, distribution or reproduction is permitted which does not comply with these terms.
*Correspondence: Matthias Egger, matthias.egger@theoceancleanup.com
This article was submitted to Marine Pollution, a section of the journal Frontiers in Marine Science
Disclaimer
All claims expressed in this article are solely those of the authors and do not necessarily represent those of their affiliated organizations, or those of the publisher, the editors and the reviewers. Any product that may be evaluated in this article or claim that may be made by its manufacturer is not guaranteed or endorsed by the publisher.