Abstract
Global increases in temperature are altering land-sea temperature gradients. Bakun (1990) hypothesized that changes within these gradients will directly affect atmospheric pressure cells associated with the development of winds and will consequently impact upwelling patterns within ecologically important Eastern Boundary Upwelling Systems (EBUS). In this study we used daily time series of NOAA Optimally Interpolated sea surface temperature (SST) and ERA 5 reanalysis wind products to calculate a series novel of metrics related to upwelling dynamics. We then use these to objectively describe upwelling signals in terms of their frequency, intensity and duration throughout the four EBUS during summer months over the last 37 years (1982–2019). We found that a decrease (increase) in SST is associated with an increase (decrease) in the number of upwelling “events,” a decrease (increase) in the intensity of upwelling, and an increase (decrease) in the cumulative intensity of upwelling, with differences between EBUS and regions within EBUS. The Humboldt Current is the only EBUS that shows a consistent response from north to south with a general intensification of upwelling. However, we could not provide clear evidence for associated changes in the wind dynamics hypothesized to drive the upwelling dynamics.
Introduction
Coastal upwelling is a major oceanic process driven by prominent currents, of which those within Eastern Boundary Upwelling Systems (EBUS) are most important globally (Bakun and Nelson, 1991; Messié et al., 2009; Gruber et al., 2011; Pegliasco et al., 2015; Varela et al., 2015, 2016, 2018; Bonino et al., 2019; Brady et al., 2019). EBUS include the California (CCS), Humboldt (HCS), Canary (CnCS), and Benguela (BCS) current systems (Figure 1), with each of these significantly impacting their associated coastal ecosystems. These systems are present along the western shores of landmasses in the Pacific and Atlantic Oceans where they comprise vast regions of coastal ocean water (Bakun, 1990; Pauly and Christensen, 1995; Bakun et al., 2010, 2015; Santos et al., 2012b,a; Seabra et al., 2019). EBUS encompass a multitude of coastal regions stratified across several latitudes. Accordingly, these systems vary heterogeneously in terms of their environments and atmospheric conditions (Wang et al., 2015). As a result, variability within each EBUS naturally differs as the oceanic variables are driven by and respond to the combined effects of an assortment of differing oceanic and atmospheric processes and phenomena. For example, ocean temperatures within the CCS vary due to the combined effects of both El Niño-Southern Oscillation (ENSO) and Pacific Decadal Oscillation (PDO) (Jacox et al., 2015). Similarly, North Atlantic Oscillation (NAO), Benguela Niños, and Pacific ENSO are primarily responsible for driving variability in environmental conditions in the CnCs, BCS, and HCS respectively (Minobe, 1999; Chhak and Di Lorenzo, 2007; Di Lorenzo et al., 2008; García-Reyes et al., 2015; Gómez-Letona et al., 2017). One potential source of shared variability is suggested to stem from anthropogenically-mediated climate change (Bakun, 1990); although the anticipated direction of the response remains uncertain (García-Reyes et al., 2015; Varela et al., 2018; Bonino et al., 2019), no study, yet report shared variability and a consistent response across all EBUS (McGregor et al., 2007; Narayan et al., 2010; Patti et al., 2010; Pardo et al., 2011; Varela et al., 2015, 2018; Bonino et al., 2019).
FIGURE 1
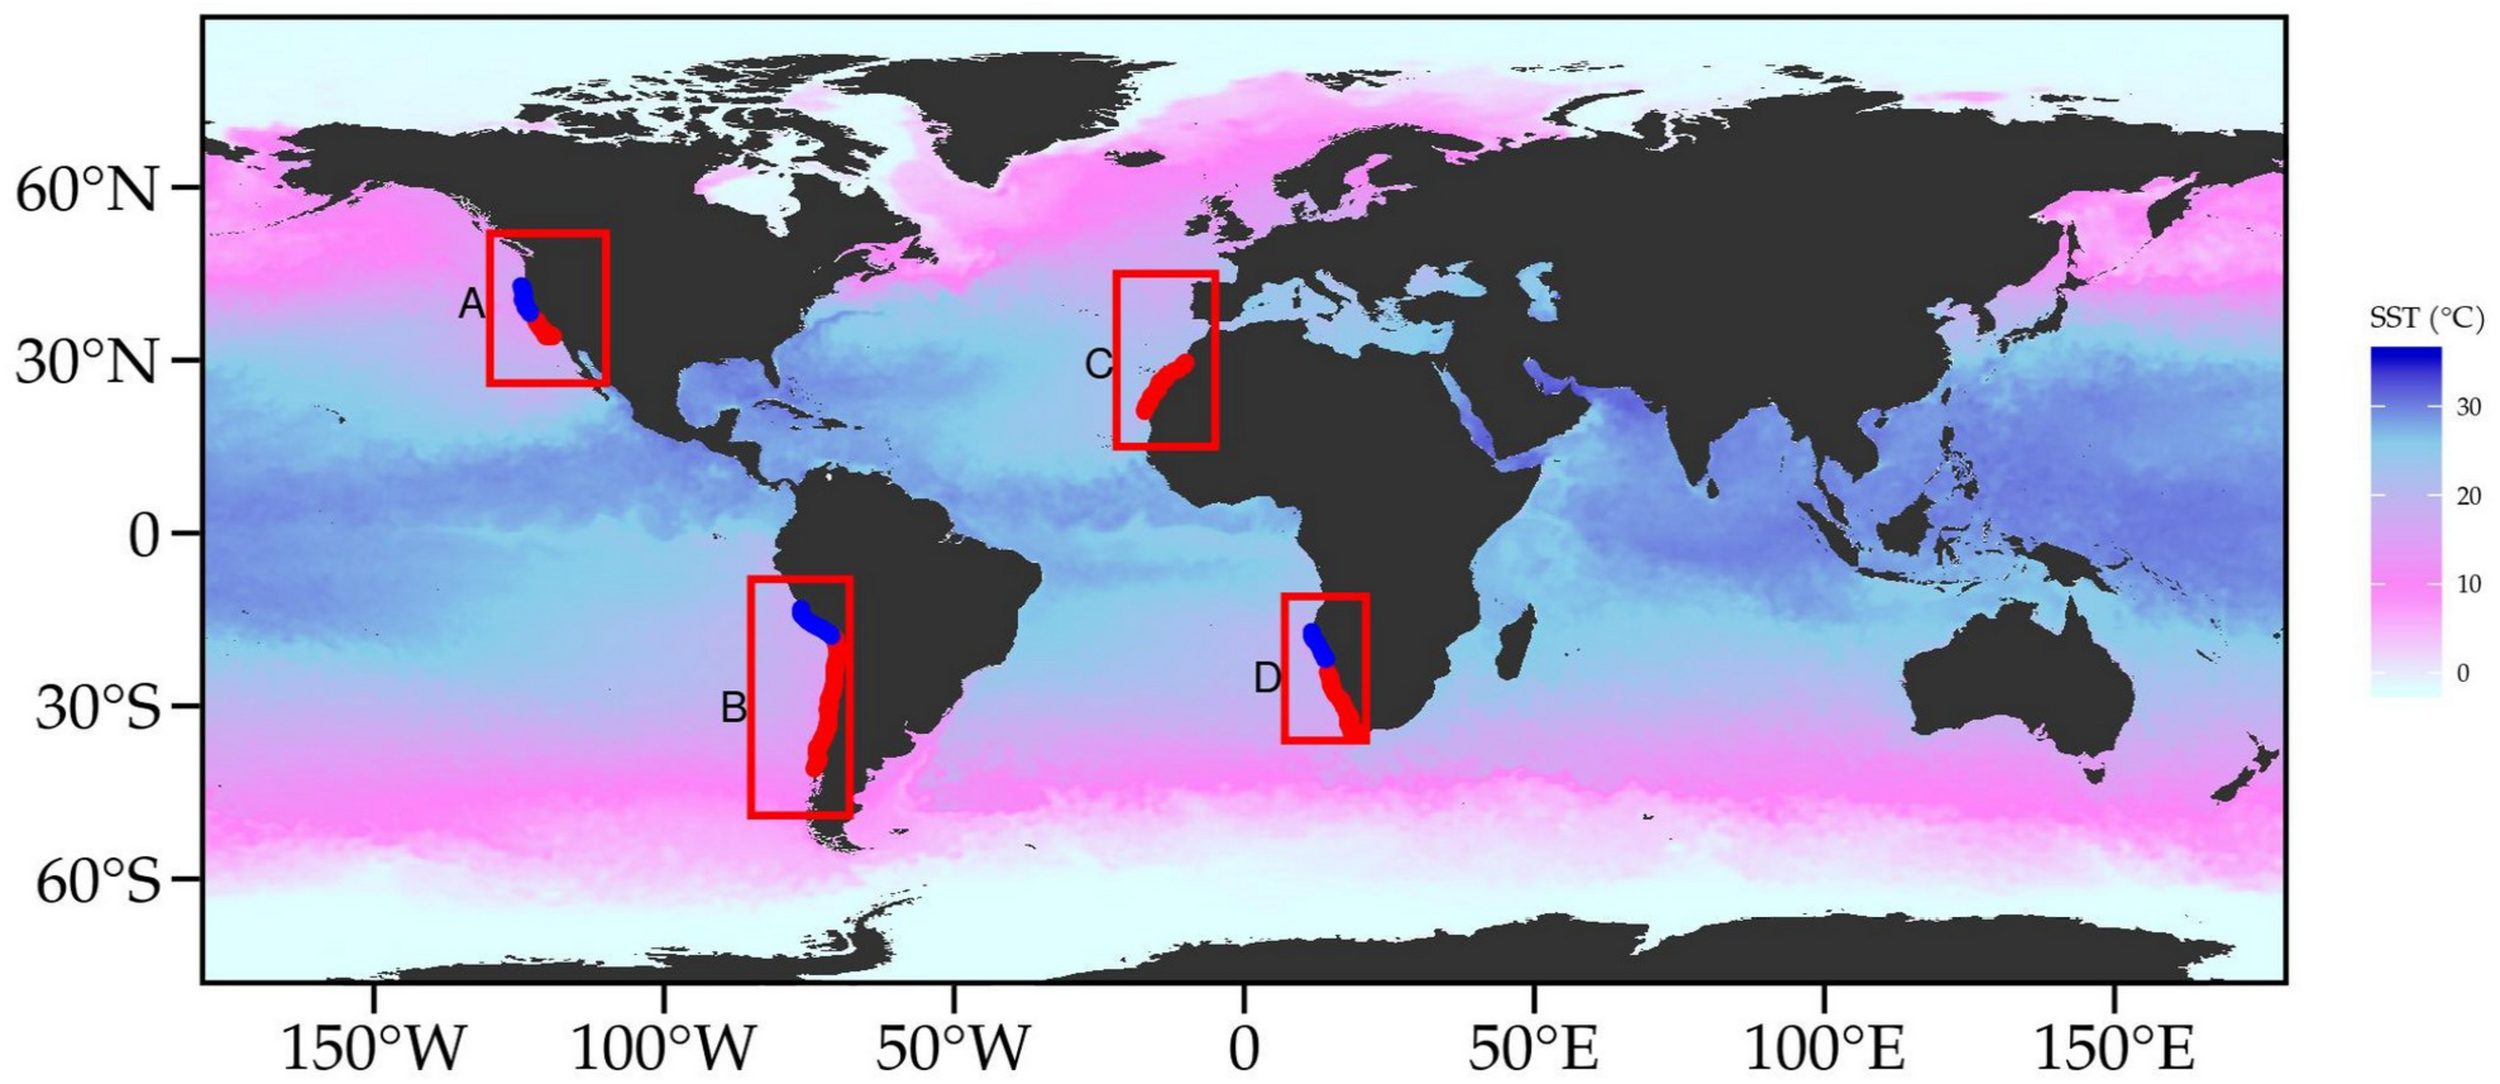
OISST throughout the global ocean. The red colored rectangles delimit EBUS: (A) California (CCS), (B) Humboldt (HCS), (C) Canary (CnCS), and (D) Benguela (BCS) current systems. Two upwelling systems were analyzed along the Eastern Atlantic Ocean, these are the (A) Benguela (South 30.13–23.26°S; North 20.76–16.39°S) and Canary (18.89–32.63°N). Two upwelling systems were assessed in the Eastern Pacific Ocean, including the Humboldt Current (HCS: Chile 37.62–28.88°S, Peru 16.39–10.15°S) and California Current (CCS: South 33.88–36.06°N, North 37.94–42.31°N).
Eastern Boundary Upwelling Systems are a common focus of oceanographic and biological research because the complex interplay of biotic and abiotic processes within EBUS results in them being highly productive (Bakun, 1990; Pauly and Christensen, 1995; Tretkoff, 2011; Varela et al., 2015), diverse, and abundant in marine life. EBUS provide up to 20% of the world’s fishery output despite only covering <1% of global ocean area (Bakun et al., 2010; Bakun et al., 2015). Warm-season upwelling, driven by equatorial winds advected offshore by the Coriolis effect, is primarily responsible for the high levels of biological productivity present within EBUS (Huyer, 1983; Borges et al., 2003; Chavez and Messié, 2009; García-Reyes and Largier, 2010; Varela et al., 2018). These regions provide both lucrative economic (Costanza et al., 1997) as well as significant recreational services to people living along these coastlines, linking indirectly to the rest of the world. Recent studies have shown ecological changes in EBUS ecosystem structure (Fréon et al., 2009; Wang et al., 2015), hence monitoring these systems is becoming increasingly important. EBUS are formed in part by wind-driven ocean circulation, and their upwelling is dependent on wind direction and strength (Capet et al., 2004; Messié and Chavez, 2015; Steinfeldt et al., 2015). Recognizing that alongshore winds that drive upwelling are initiated by changes in atmospheric pressure gradients at the cross-shore, Bakun (1990) hypothesized that long-term changes in climatic conditions would likely intensify continental oceanic pressure gradients (Bakun, 1990; García-Reyes et al., 2015) and subsequently result in an increase in the frequencies and intensities of upwelling-favorable winds. Understanding, therefore, how these winds will change is of high importance for anticipating how upwelling might respond (Varela et al., 2015). For example, weaker upwelling may limit nutrient enrichment and potentially impact primary production (Figueiras et al., 2002; Chhak and Di Lorenzo, 2007; García-Reyes et al., 2015). In contrast, stronger upwelling may increase nutrient input and therefore offshore transport (Bakun et al., 2010, 2015). Increased wind intensity could also induce changes in water turbulence (Cury and Roy, 1989) which could affect chemical mechanisms and processes like ocean acidification and deoxygenation (Gruber et al., 2011) that may ultimately impact on productivity (García-Reyes and Largier, 2010). Elucidating the drivers of upwelling and their relationship to nutrient enrichment and productivity could therefore inform conservation and facilitate management of fishers and other EBUS dependent resources. Such understanding is particularly important toward predicting the impacts of future climate change scenarios.
Recent reports from studies investigating patterns related to changes in upwelling winds have produced conflicting results, and a consensus on current trends has not been reached (Phillips, 2005; Bakun et al., 2010; Varela et al., 2015). This is largely due to contrasting findings regarding seasonal, interannual, and decadal fluctuations of unidirectional winds because of limited time series (Bonino et al., 2019; Seabra et al., 2019). Some researchers question whether the impacts of differential heating on the pressure gradient force drives intensification of coastal upwelling. Rather, a complementary hypothesis proposes that evidence of an intensifying pressure gradient force is limited to poleward migration of the Hadley Cell (Rykaczewski et al., 2015; Brady et al., 2017; Grise et al., 2019; Grise and Davis, 2020). Further complications preventing the agreement on findings in EBUS largely include (a) researchers deriving conclusions from non-comparative datasets, (b) data and analyses being treated in an inconsistent manner, (c) variable quality between datasets, and (d) inconsistencies in measurement techniques (Jacox et al., 2015; Bonino et al., 2019).
Upwelling has been investigated for several decades using a variety of statistical models and simulations (e.g., Bakun, 1990, Shannon et al., 1992; Bakun et al., 2010; Varela et al., 2015; Wang et al., 2015; Bonino et al., 2019). However, a common theme among these attempts has been the broad temporal scale at which estimates were made. Most of studies on upwelling trends have used wind and temperature variables captured and averaged at monthly intervals. Here, we aimed to test the efficacy of a novel method for detecting upwelling signals and characterizing them in terms of intensity, frequency, and duration of upwelling “events” in a more reliable and objective manner. This is accomplished by using data at a fine temporal scale of daily intervals. In this context, the atmospheric and oceanic mechanics responsible for coastal upwelling are interdependent, and changes in one variable, such as wind speed, should directly affect variables such as upwelling intensity (Varela et al., 2015, 2016; Bonino et al., 2019). The objective of this study was to quantify the variation and changes in upwelling signals over time. The phenology of many marine ecosystem processes is highly affected and dependent on upwelling events such as its duration, frequency, and intensity (Barth et al., 2007). For example, intertidal communities require intermediate disturbance on rocky shores to maintain diversity (McGregor et al., 2007; Landry et al., 2009). Upwelling events may cause substantial or minimal disturbance depending on the frequency, duration, and intensity of the events (Benoit-Bird et al., 2019). However, upwelling also affects other marine communities and changes in upwelling patterns are likely to dramatically impact them (Wang et al., 2015). We therefore set out to detect if changes occur in the (a) SST patterns, (b) intensity, duration, and frequency of upwelling-favorable wind, and (c) the frequency, mean, and cumulative intensity of upwelling signals during summer months over a period of 37 years. Understanding changes within these systems could allow for predictive management and conservation of fisheries and marine resources.
Methods
Data
To evaluate if there are changes in upwelling dynamics, this study used the gridded data of the global 0.25° National Oceanic and Atmospheric Administration (NOAA) daily Optimally-Interpolated Sea Surface Temperature (dOISST, v.2.1) (Reynolds et al., 2007; Banzon et al., 2016). This remotely-sensed satellite product has any gaps in spatial coverage filled through the interpolation of data collected from ships, and buoys (Reynolds et al., 2007; Banzon et al., 2016). The OISST data product has been collected for nearly four decades, hence providing us with a long (>30 years) time series from which upwelling trends and their rate of change can be calculated. High resolution SST data sets are useful but often have limited time series. Most high-resolution data products (i.e., those with a resolution of ∼0.01°) do not exceed 30 years in duration; for example, MUR (2002–2020) and G1SST (2010–2019). To detect variations in upwelling signals among the four EBUS (Figure 1; Bakun, 1990; Bakun et al., 2015; García-Reyes et al., 2015; Varela et al., 2015, 2016; Sousa et al., 2017), wind speed and direction were also necessary. Wind speed and direction variables were downloaded from the ERA5 climate reanalysis produced by ECMWF, providing daily data on regular latitude-longitude grid at 0.25° × 0.25° resolution (C3S, 2017). Upwelling zones representative of each EBUS were selected according to previous studies (Sydeman et al., 2014; Varela et al., 2015, 2018, 2020; Seabra et al., 2019). Two upwelling systems were analyzed along the Eastern Atlantic Ocean, these are the Benguela Current (BCS: South 30.13–23.26°S, North 20.76–16.39°S) and Canary Current (CnCS: 18.89–32.63°N), and another two in the Eastern Pacific Ocean, including the Humboldt Current (HCS: Chile 37.62–28.88°S, Peru 16.39–10.15°S and California Current (CCS: South 33.88–36.06°N, North 37.94–42.31°N).
Upwelling Identification
To identify whether changes exist in the frequency and intensity of upwelling signals across EBUS it must first be determined when upwelling occurs. To do this, a set of upwelling threshold values needed to be established. Given that upwelling is primarily caused by alongshore, equatorward winds, both SST and wind data were used. Wind data were used to calculate the upwelling index using the formula presented in Fielding and Davis (1989):
Where μ represents the wind speed (ms–1), θ represents the wind direction in degrees, and τ is the orientation of the coastline (Jury 1980). This index relies on wind speed and direction to identify upwelling-favorable conditions. When the upwelling index is >0, SST usually drop, as expected, suggesting that upwelling is occurring. Here we established that the drop in SST that coincided with a positive upwelling index was close to the seasonally varying 25th percentile threshold for SST. This threshold temperature was subsequently used in combination with the upwelling index to identify upwelling signals. With the upwelling index and SST threshold set, the detect_event() function from the heatwaveR package (Schlegel and Smit, 2018) was used to calculate metrics for the upwelling signals. By using this method of detecting signals, we were able to obtain upwelling metrics (Table 1) such as the frequency of occurrence, mean intensity, and cumulative intensity. Here, we defined the mean intensity (°C) as the mean temperature exceedance (i.e., duration below the 25th percentile) during the upwelling signal. Cumulative intensity (°C days) is defined as the sum of daily intensity exceedances across the duration of an event. Because upwelling signals were calculated relative to seasonal climatologies of percentile exceedances, rather than an absolute definition such as temperatures below a fixed temperature threshold, these signals could occur any time of the year; however, upwelling was proven to be more dominant during summer months, as expected. To quantify metrics of upwelling-favorable winds [i.e., southeasterly (SE) winds in the Southern Hemisphere and northeasterly (NE) winds in the Northern Hemisphere], we again made use of the detect_event() function. For these analyses, by setting the seasonality and threshold to a value of 0 allowed the statistical functions of the package to compensate for using wind data rather than SST data. This allowed us to estimate wind metrics such as the duration, intensity, and count of upwelling-favorable wind events within each of the regions.
TABLE 1
| Name (unit) | Definition |
| Count (n) | Number of upwelling signals per year |
| Mean intensity (°C) | Mean temperature anomaly during the upwelling signal |
| Cumulative intensity (°C days) | Sum of the daily intensity anomalies over the duration of the signal |
Metrics of upwelling signals and their descriptions.
With upwelling being influenced by wind patterns, Bakun (1990) predicted that changes in wind patterns would influence the intensity of upwelling signals. As a first step, we calculated trends in SST to understand how temperatures within these cold-water regions are changing over time. We selected all coastal SST pixels along the latitudinal bands shown for each EBUS (Figure 1), as the coastal region is the most utilized for human habitation, leisure, recreational activities, or tourism. Given that the OISST time series length is greater than 30 years, it should be possible to discern long-term trends within the data from interannual noise (Hobday et al., 2018). Using linear regression analyses, we observed if there were changes in the number of times wind blew in an upwelling favorable direction, the duration of those winds, and their intensity, with an emphasis on austral (DJF) and boreal (JJA) summer months. The month variable was selected to observe which month expressed the most intense signal. To establish whether differences existed between currents and upwelling metrics over time, we assessed the upwelling metrics as a function year or month. Thereafter, using regression analysis, we compared the mean numbers of upwelling signals detected in each of the currents.
Results
Our investigations of trends in upwelling metrics across individual time series for each of the EBUS currents revealed the presence of noticeable shifts in SST patterns at each EBUS over the past 37 years (Figures 2A,B). We found that SST dramatically differed across each EBUS (two-way ANOVA: F = 1878.76, SS = 6966, p < 0.05). This was in part driven by variable increases in SST in the BCS North (Table 2). Conversely, the BCS South and HCS showed a significant decrease in SST (Table 2). We further found a significant negative trend in monthly SST within the HCS, specifically during the months of January near Chile (R2 = 0.01, slope = −0.2°C.dec–1, and p < 0.05) and during December near Peru (R2 = 0.03, slope = −0.4°C.dec–1, and p < 0.05).
FIGURE 2
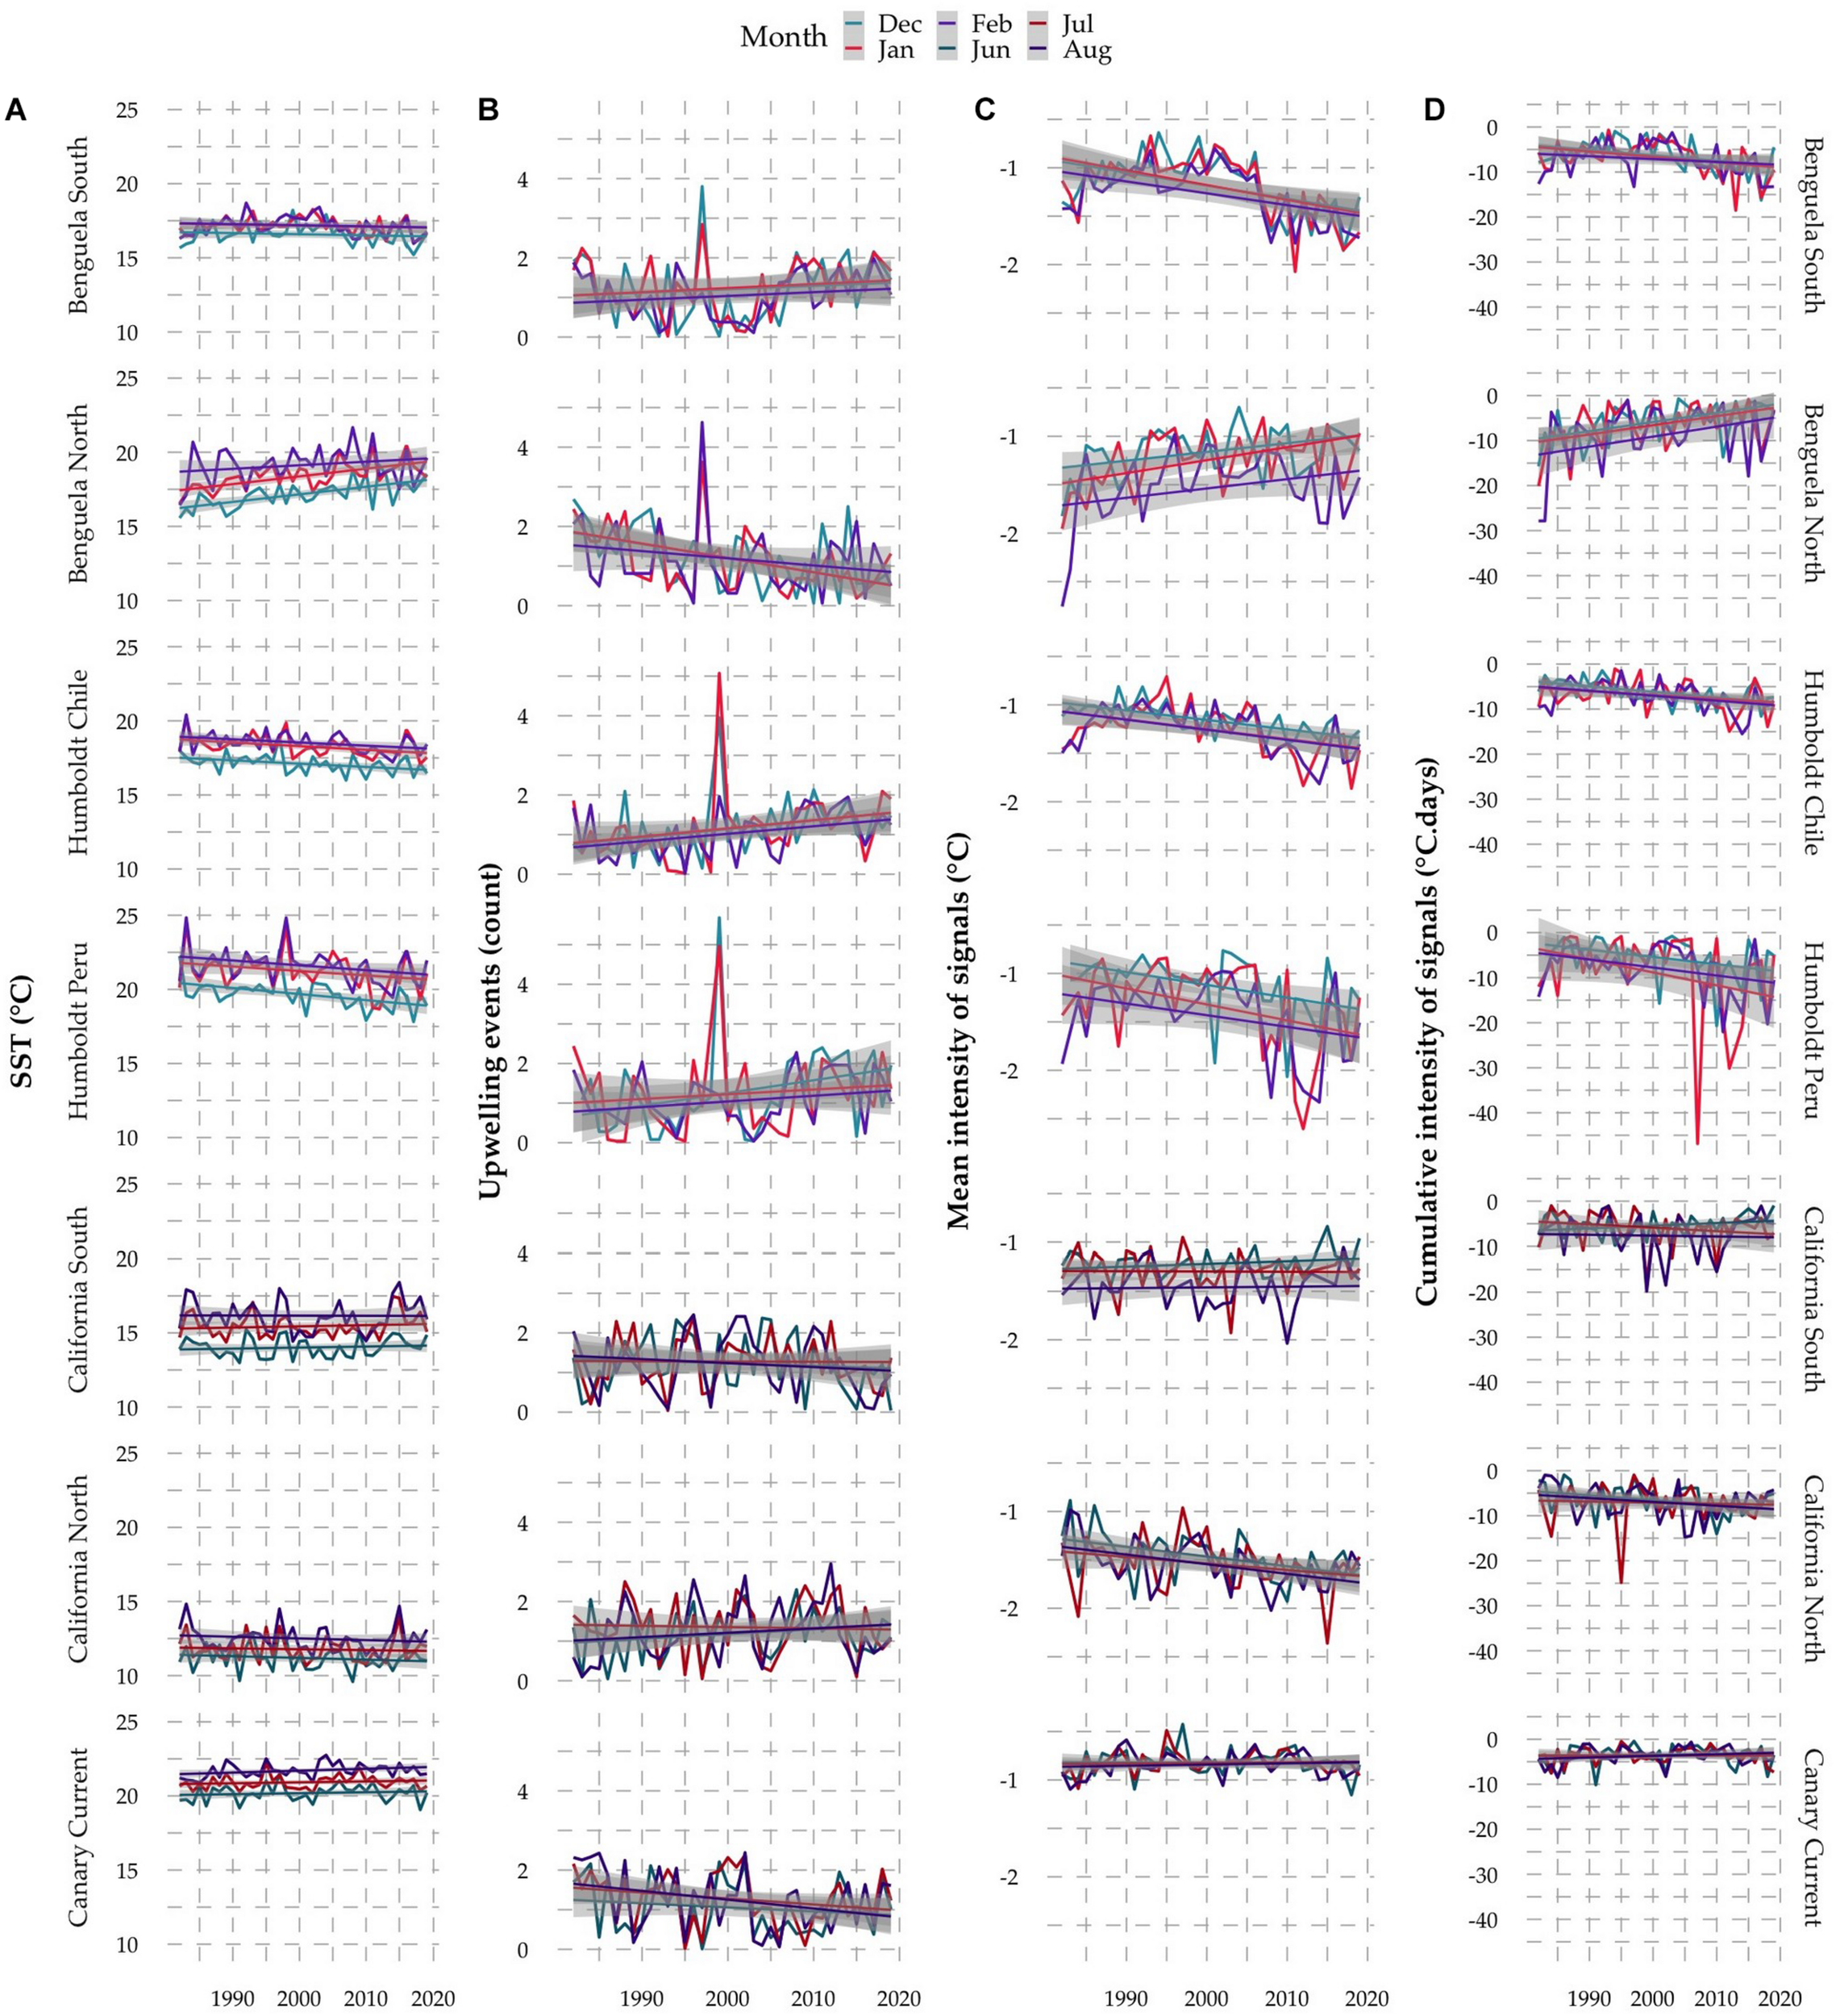
SST trends (A) and the count (B), mean (C), and cumulative intensity (D) of upwelling signals during austral (DJF) and boreal (JJA) summer months over a period of 37 years. Where a more negative intensity represent a more intense signal.
TABLE 2
| EBUS | Benguela Current South | Benguela Current North | Humboldt Current Chile | Humboldt Current Peru | California Current South | California Current North | Canary Current |
| SST (°C.dec–1) | (−) R2 = 0.02, slope = −0.12, p < 0.05 | (+) R2 = 0.12 slope = 0.14 p < 0.001 | (−) R2 = 0.08 slope = −0.08 p < 0.001 | (−) R2 = 0.08 slope = −0.12 p < 0.01 | R 2 = 0.02 slope = 0.02 p > 0.05 | R 2 = 0.01 slope = −0.02 p > 0.05 | R 2 = 0.02 slope = 0.03 p > 0.05 |
| No. of upwelling signals (count.dec–1) | R 2 = 0.02 slope = 0.03 p > 0.05 | (−) R2 = 0.15 slope = −0.10 p < 0.05 | (+) R2 = 0.10 slope = 0.10 p < 0.05 | (+) R2 = 0.05 slope = 0.10 p < 0.005 | R 2 = 0.001 slope = −0.02 p > 0.05 | R 2 = 0.01 slope = −0.02 p > 0.05 | (−) R2 = 0.06 slope = −0.05 p < 0.005 |
| Mean intensity (°C.dec–1) | (−) R2 = 0.02 slope = −0.05 p < 0.05 | (+) R2 = 0.02 slope = 0.04 p < 0.01) | (−) R2 = 0.006 slope = −0.03 p < 0.001 | (−) R2 = 0.01 slope = −0.05 p < 0.05 | (0) R2 = 0.03 slope = 0.001 p > 0.05 | (−) R2 = 0.001 slope = −0.01 p < 0.001 | (+) R2 = 0.03 slope = 0.01 p < 0.05 |
| Cumulative intensity (°C days.dec–1) | (−) R2 = 0.001 slope = −0.40 p < 0.001 | (+) R2 = 0.02 slope = 0.70 p < 0.001) | (−) R2 = 0.001 slope = −0.003 p < 0.05) | (−) R2 = 0.001 slope = −0.08 p < 0.05) | (0)R2 = 0.000, slope = −0.06 p > 0.05 | (−) R2 = 0.01 slope = −0.20 p < 0.05 | (0) R2 = 0.003 slope = −0.05 p > 0.05 |
| No. of upwelling- favorable wind (count.dec–1) | R 2 = 0.002 slope = −0.01 p > 0.05 | R 2 = 0.003 slope = 0.02 p > 0.05 | R 2 = 0.009 slope = 0.005 p > 0.05 | R 2 = 0.004 slope = −0.011 p > 0.05 | R 2 = 0.03 slope = 0.02 p > 0.05 | (−) R2 = 0.04 slope = −0.008 p < 0.05 | R 2 = 0.000 slope = 0.003 p > 0.05 |
| Wind duration (days.dec–1) | R 2 = 0.001 slope = 0.01 p > 0.05 | R 2 = 0.01 slope = −0.08 p > 0.05 | R 2 = 0.003 slope = 0.02 p > 0.05 | R 2 = 0.0002 slope = 0.03 p > 0.05 | R 2 = 0.01 slope = 0.01 p > 0.05) | R 2 = 0.004 slope = −0.009 p > 0.05 | R 2 = 0.002 slope = −0.08 p > 0.05 |
| Wind intensity (ms–1 dec –1) | R 2 = 0.02 slope = 0.01 p > 0.05 | R 2 = 0.03 slope = 0.02 p > 0.05 | R 2 = 0.006 slope = −0.01 p > 0.05 | R 2 = 0.01 slope = 0.01 p > 0.05 | R 2 = 0.02 slope = 0.08 p > 0.05 | R 2 = 0.001 slope = 0.02 p > 0.05 | R 2 = 0.03 slope = 0.03 p > 0.05 |
Results from linear regressions in upwelling favourable winds and upwelling metrics over a period of 37 years.
Positive (+) and (−) trends are shown in bold texts.
The number of upwelling signals decreased over time in the BCS North and CnCS, but slightly increased in HCS (Figure 2B). Increases in detections were particularly prominent when SST decreased (Figure 2A). A regression analysis showed a significant negative trend in the number of upwelling signals detected in the BCS North and CnCS (Figure 2C). However, a positive trend is present in HCS Chile, HCS Peru. Conversely, a significant positive trend was detected in the mean intensity of upwelling in the BCS North and CnCS (Table 2). Results of a linear regression showed significant negative trends in the mean intensity of upwelling signals in the BCS South, HCS Chile and Peru and CCS North. We also found that the cumulative intensity of upwelling signals significantly differed between the EBUS (ANOVA: F = 371.15, SS = 178853, and p < 0.05) and between month (ANOVA: F = 139.78, SS = 123484, and p < 0.05; Figure 2D). Results of a linear regression showed significant negative trends in cumulative intensity within the BCS South, HCS Chile and Peru and CCS North.
Counts of discrete upwelling-favorable wind events were not uniform among the four EBUS (Figure 3A). A two-way ANOVA analysis showed a significant difference in upwelling-favorable wind events between currents (F = 1878.76, SS = 6966, and p < 0.05). However, a regression analysis showed no significant changes in wind events detected over the past 37 years; the CCS North was the only exception showing a significant negative trend in upwelling-favorable winds (Table 2). A significant positive trend was detected in the number of monthly upwelling-favorable winds during July in the CCS South (R2 = 0.25, slope = 0.05 count dec–1, and p < 0.05) and during February in the HCS Chile (R2 = 0.14, slope = −1.1 count dec–1, p < 0.05) within the HCS. A significant negative trend was present during December within the HCS (R2 = 0.10, slope = −1.1 count dec–1, p < 0.05).
FIGURE 3
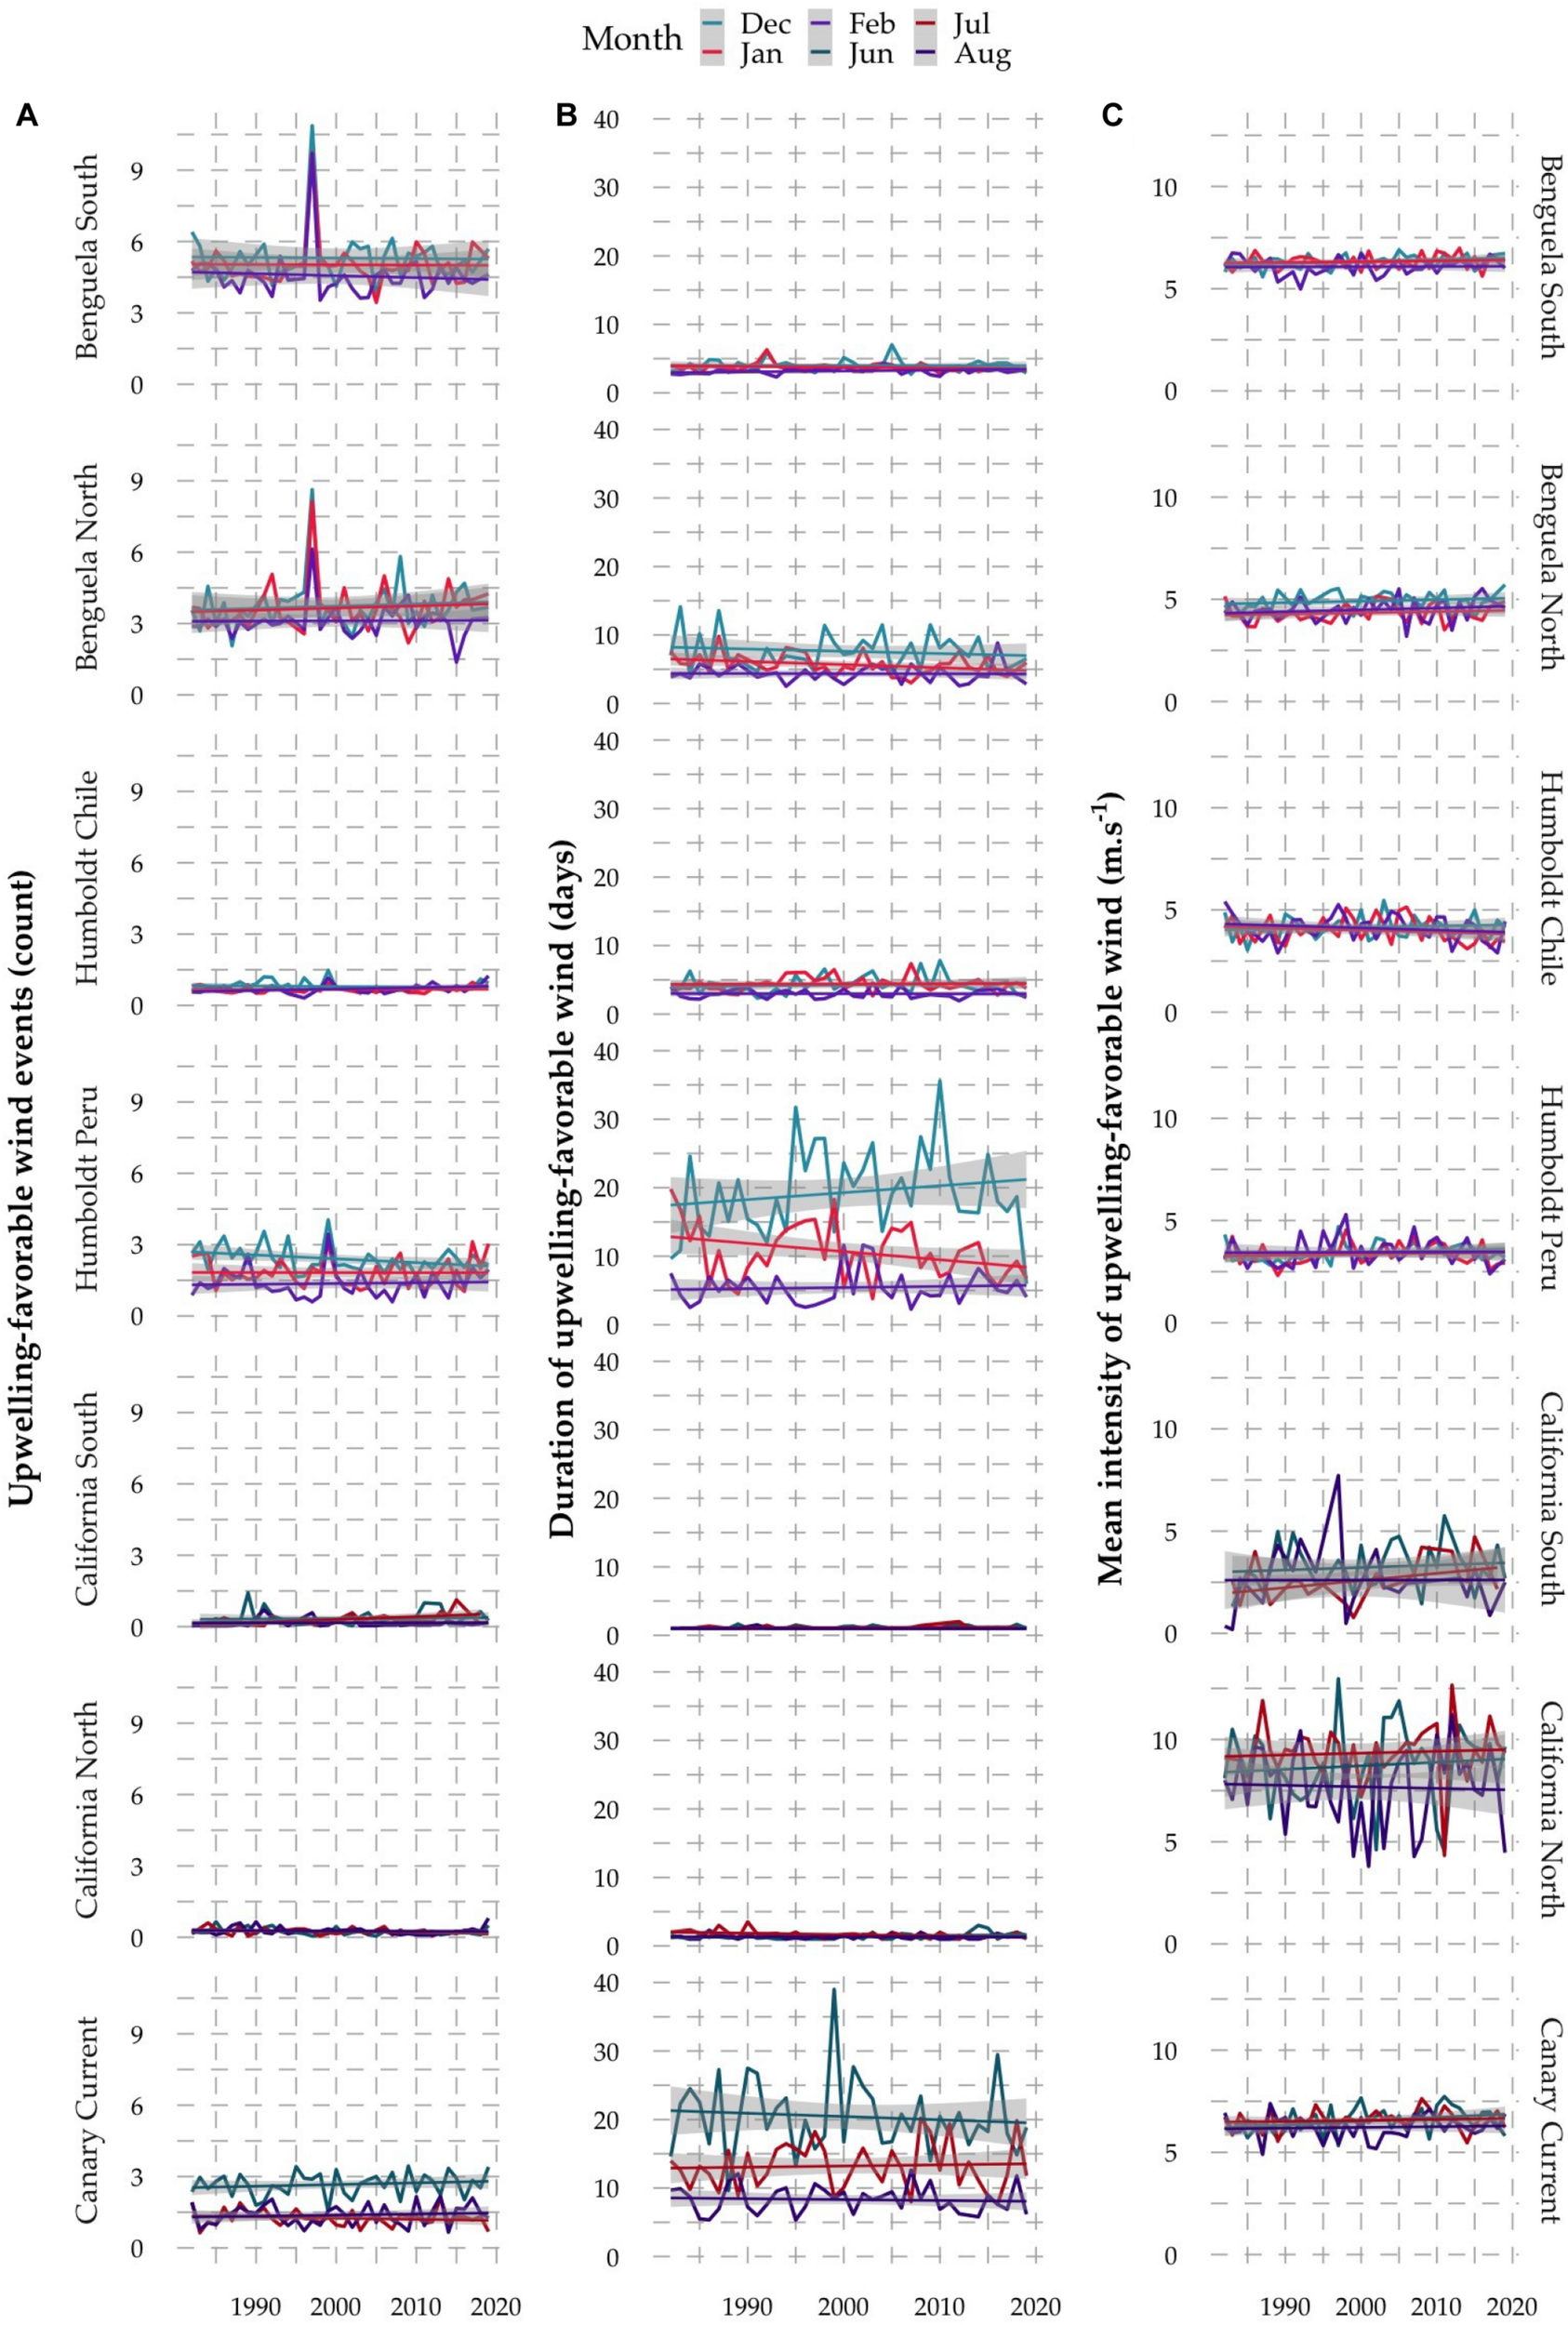
Count (A), duration (B) and mean intensity (C) of upwelling-favorable winds during austral (DJF) and boreal (JJA) summer months over a period of 37 years.
The typical duration of south-easterly winds in the BCS and HCS Chile ranged between 3–6 days with the HCS Peru being the only exception with a duration >10 days (Figure 3B). Upwelling-favorable winds in the CCS often did not exceed 2 days, and in the CnCS the average duration was 14 days (Figure 3C). Results of an ANOVA analysis showed a significant difference in the duration of upwelling-favorable winds between the EBUS regions (F = 431.29, SS = 16,113, and p < 0.005) (Table 2). A significantly negative monthly trends in wind duration during July months in the CCS North (R2 = 0.004, slope = −0.2 days dec–1, and p < 0.05) and during January in the HCS Peru (R2 = 0.008, slope = −1.1 days dec–1, and p < 0.05) was detected. Upwelling-favorable winds appeared to be most intense in the CCS North, often exceeding 7 ms–1 (Figure 3C). Winds were least intense in the CCS South with a speed of approximately 4 ms–1 being commonplace (Figure 3C). There were no significant changes in the overall wind intensity over time within the EBUS regions (Table 2). A regression analysis comparing wind intensity per month, however, showed a significant change during July in the CnCS (R2 = 0.01, slope = 0.10 ms–1 dec–1, and p < 0.05). We also found no significant change in the wind intensity of EBUS over time (Table 2).
Discussion
Bakun (1990) hypothesized that an increase in greenhouse gases will result in considerable changes in land-sea pressure gradients that will affect global wind patterns and ultimately result in an increase in the intensity of upwelling across the world’s oceans. We tested this hypothesis by analyzing upwelling trends at four prominent coastal upwelling regions, with an emphasis on austral (DJF) and boreal (JJA) summer months as this is when upwelling is most prevalent. By combining wind and SST data we were able to observe trends in upwelling responses. Specifically, change in upwelling metrics—as established by our novel methodology—was ubiquitous across all four EBUS. Trends in the metrics are coupled such that we see a decrease (increase) in SST combined with a concurrent increase (decrease) in the number of upwelling “events” and an increase (decrease) in the mean and cumulative intensity of upwelling. However, the change was inconsistent across the upwelling regions. In terms of the SST response, the Humboldt Current off Peru and Chile and the southern Benguela Current displayed decreases of ∼0.37°C and 0.44°C during past 37 years, while in the northern Benguela Current region it increased by ∼0.52°C during this time. No significant changes were observed for the Canary and California Currents in the northern hemisphere. Surprisingly, it was interesting that anticipated changes in the decadal trend in mean intensity, duration, and count of upwelling-favorable winds were generally not detected.
The significant cooling trend of the southern region of the Benguela Current is in agreement with previous research (Lima and Wethey, 2012; Santos et al., 2012b) that suggested that these decreases were related to increased upwelling. Further, at the southern end of the Benguela Current the highest upwelling intensities were observed during summer seasons (Narayan et al., 2010; Patti et al., 2010). Other studies (for example Cropper et al., 2014; Benazzouz et al., 2015; Varela et al., 2015, 2020; Santos et al., 2016) demonstrated that a cooler SST associated with an increase in upwelling in coastal areas, as was also observed in Chile and Peru in this study. Previous studies demonstrated that trends in upwelling along the Peru coastline were variable. Here we report no significant change in upwelling-favorable winds along the Peru coastline, which contrasts with the studies reported by Gutiérrez et al. (2011) and Varela et al. (2015). The California Current displayed a positive trend in the mean intensity of upwelling signals over time, which is in disagreement with the study conducted by Varela et al. (2015). Here we also report no significant trend in wind speed, which contrasts with the studies reported by Mendelssohn and Schwing (2002), Narayan et al. (2010) and García-Reyes et al. (2014). The Canary Current displayed increases over time in metrics indicative of upwelling-favorable wind (Narayan et al., 2010; Patti et al., 2010), but apparently without an associated change in upwelling. Our findings here, and the findings of the aforementioned studies, suggest that warming rates are generally depressed along the coast within upwelling regions (Santos et al., 2012b,a), but we show that this seems to be the case for the southern hemisphere upwelling systems only (excluding the northern Benguela Current where it is increasing).
Using our novel method of determining upwelling signals, our results do not support the hypothesis that intensified upwelling will result from the increased land-sea temperature difference associated with climate change. However, it is possible that natural multi-decadal scale climate variability impacted the trends discussed. For example, the occurrence of ENSO at the end of the time series could also have initiated an anomalously warm SST in EBUS and potentially affected the trends observed. These results also lead to discussion about the potential connection between ENSO within EBUS and the Benguela Niño in the Benguela Current (Peterson and Schwing, 2003; Blamey et al., 2012). ENSO represents a weakening of the Walker cell circulation (Wang, 2004). During normal Walker cell conditions there is consistent upwelling, and this upwelling contributes to cool SST (Bakun et al., 2010). Since the Canary Current shows an increase in SST, it may suggest that there has been a weakening or reversal of the trade winds as has been indicated by earlier studies (Vallis, 1986; Saji et al., 1999). ENSO drives atmospheric and oceanic Rossby waves that can influence climate processes (Battisti, 1989; Holbrook et al., 2011). The ENSO’s counterpart, La Niña, produces a teleconnection that alters the mean climatic states (Diaz et al., 2001; Fogt and Bromwich, 2006; Yeh et al., 2018). As a result, it can also be reasoned that the fewer upwelling signals are detected in Chile and Peru is potentially a consequence of the effects of La Niña. During La Niña, the Walker cell circulation is enhanced (Sohn et al., 2013), meaning that pre-existing trade winds and SST strengthen. The low SSTs created by the presence of La Niña are accompanied by anticyclones. The anticyclones rotate counterclockwise in the southern hemisphere, and therefore its winds travel equatorward where they move surface water away from the shore, resulting in a net Ekman veering that encourages coastal upwelling and lowers SST (Alford, 2001). Given these results, the need to consider changes in both thermal and in-shore hydrodynamic processes such as wind driven currents when interpreting the full dynamical response such as in conditions of changing wind magnitude and direction of the coupled atmospheric-ocean system to climate warming is important. In this regard, our conclusion differs in respect to recent studies (e.g., Wang et al., 2015) that have examined the relationship between increasing summertime land-sea temperature differences and intensified upwelling in response to climate change. Rykaczewski et al. (2015) recommended that expanded land-sea temperature contrasts are omnipresent in projections of future conditions, but that summertime upwelling is limited to the polar extremes of upwelling zones. If true, this would indicate that increased land-sea temperature differences do not have a dominant influence on upwelling intensity (Tim et al., 2015, 2016). Additionally, changes in upwelling-favorable winds are not always directly related to broad increases in land-sea temperature differences associated with climate change (Rykaczewski et al., 2015). Research suggests that changes in sea level pressure (SLP) fields are expected in response to increased greenhouse gas concentration (Gillett et al., 2013). These shifts will initiate changes in the magnitude, location and timing of upwelling-favorable winds that are more consequential than increased land-sea temperature differences.
Simulations of ocean patterns in the Benguela Current using high resolution data over the past few decades have thus far failed to detect predicted intensification of upwelling. For instance, Tim et al. (2015) demonstrate that upwelling has not dramatically intensified over at least the past 50 years. Moreover, broader investigations of global climate changes have also failed to detect meaningful intensification patterns of upwelling and in addition have not forecasted that such intensification will occur in the future (Wang et al., 2015; Tim et al., 2016). One potential reason for our results contrasting with the predictions by Bakun (1990) could be that the differences in quality of wind data employed were too severe. Bakun (1990) used Wave and Anemometer-based Sea surface Wind (WASWind) data whereas we made use of ERA5 climate reanalysis. Both datasets are biased to some degree. WASWind data are based on ship-based measurements and were fund to produce an artificial upward trend in sea surface wind speeds due to variable increases in the heights of anemometers (Tokinaga and Xie, 2011). These data have since been corrected, and the trends expressed by Bakun (1990) are no longer applicable with the corrected wind data, at least in some regions such as Peru (Belmadani et al., 2014). ERA5 climate reanalysis data are also susceptible to several biases (see Astudillo et al., 2017; Taboada et al., 2019) but are considerably more accurate and reliable given the spatial and temporal resolution at which winds are measured (Graham et al., 2019; Mayer et al., 2019; Tetzner et al., 2019). For comparison, ERA5 products are provided daily at a 0.25° × 0.25° latitude-longitude and are available from 1979 to present, whereas WASWind data are available at monthly intervals at 4° × 4° latitude-longitude resolution and cover the years from 1950–2008. One potential caveat of our analysis and the interpretations thereof lays in the limited nature of the time series we assessed. Because we sought to detect and quantify patterns of upwelling at a fine spatio-temporal scale, our choice in datasets was limited to high-resolution data that only cover the past 37 years. In the context of broader climate change, 37 years is likely too short a duration of time from which to inform long-term shifts in patterns of global phenomena like upwelling and so our findings here should be regarded with some caution. While we cannot provide evidence in support of Bakun’s hypothesis regarding intensification of upwelling (Bakun, 1990), we cannot rule out the possibility that an analysis with longer time series could produce a different outcome. Unfortunately, high-resolution SST datasets that cover longer time periods do not exist. Some longer reanalysis products like ERA20C or 20CR provide data over a time series of more than 100 years but these data products are only available at a considerably coarser resolution and may not be suitably sufficient to reliably estimate upwelling.
There is not yet an adequate amount of data to effectively investigate the effects of changes in climatic conditions on coastal SSTs and biogeochemistry in the EBUS (García-Reyes et al., 2015). Despite this, consideration is now given to changes in terms of the location and intensity of upwelling due to its necessity for the identification of high-risk regions of the coast that are prone to processes such as ocean acidification, increased hypoxia, and eutrophication which have been projected in accordance with future warming (Rykaczewski et al., 2015). These patterns are affected by both complex global and local processes; however, the availability of the data and their corresponding resolution in conjunction with a wide range of decadal temperature variability and biogeochemical properties also play a significant role. Most of the remotely sensed SST and wind products do not have sufficient resolution to accurately detect nuances within the upwelling process. Despite this, data providers have been yielding promising advancements in higher resolution products by using land and air-sea interactions, cloud formation, and oceanic mesoscale processes to correct the biases presented in older sources. It has since become necessary to take into consideration changes in local, alongshore winds when investigating the relationship between sensitivity of upwelling and climate change (Bakun et al., 2015). Environmental variables that drive upwelling like temperature and wind measures are highly variable in EBUS regions, both spatially and temporally. Changes in these variables are shown here to directly affect upwelling patterns. As a result, major shifts in these drivers can greatly influence the frequencies, intensities, and the durations of upwelling events. Increases and decreases in SST are negatively associated with corresponding shifts in detected upwelling. Similarly, heterogeneous winds can dramatically influence upwelling responses. Accordingly, it is vital to take into consideration both the geostrophic and ageostrophic processes that affect the boundary layer of the coastal ocean when investigating upwelling. By analyzing these coupled processes, researchers can further elucidate upon the drivers that regulate changes in the characteristics of upwelling events. This is especially true since changes in water-column stratification can distort upwelling signals (Roemmich and McGowan, 1995; Chhak and Di Lorenzo, 2007) and so external processes like wind direction are important to consider. However, we found that the dynamics of upwelling-favorable winds have not changed significantly over the past 37 years. Further analyses may be required to fully interrogate the effects of shifts in climate on upwelling dynamics in EBUS.
In this study we produce metrics that track the duration and intensity of upwelling signals over the past 37 years. These metrics are based in part on those used to quantify marine heatwaves (Hobday et al., 2018; Schlegel and Smit, 2018) and they offer a valuable new approach that can be used to determine the changing dynamics of upwelling consistently and objectively in daily time series of SST and winds. While all four EBUS experienced some change in upwelling metrics, only those in the southern hemisphere generally responded with a decrease in SST (the northern Benguela Current region trended upward). Although decreases in SST were associated with corresponding changes in upwelling intensity, a trend in wind dynamics apparently did not explain the upwelling dynamical response. We thus follow in the long tradition of not being able to conclusively support Bakun (1990) hypothesis. Continuing shifts in climate may indeed facilitate increased upwelling in certain coastal areas and thus buffer ecosystems from climate change (Bakun, 1990, Bakun et al., 2010; García-Reyes et al., 2015), but it seems that this might not be seen consistently across all EBUS. The degree to which all EBUS can be characterized as resilient and robust to natural climate variability remains uncertain, as is the universal benefit of upwelling intensification to maintaining an abundance of species of high commercial and conservation value (Bell et al., 2015; Wilson and Forsyth, 2018). However, given the coarse resolution of current climate models for ocean variables, it is difficult to reproduce the relatively fine-scale upwelling features necessary for such research at present (García-Reyes et al., 2015). Continuing development of geophysical time series in the future will likely yield data series that are better able to yield trends indicative of climatic change. The knowledge of future changes in upwelling systems is a key factor for estimating changes in economic and biological trends. The metrics of intensity and duration of upwelling (and of frequency of upwelling “events” that can be also established using our approach) will more than likely also relate to a diversity of measures of ecological functioning and well-being and provide researchers with another tool to track environmental drivers and responses.
Statements
Data availability statement
The data and analyses used in this paper may be downloaded at: https://github.com/AmierohAbrahams/EBUS.
Author contributions
AS conceptualized the scope of the research reported here. AA undertook the statistical analyses, made the first round of interpretation, and did the majority of the writing. AS and RS provided guidance in terms of writing, statistical analyses, and the final draft of the manuscript. All authors contributed to the article and approved the submitted version.
Funding
The research was funded by the South African National Research Foundation funding number, SFH180604339745. The National Research Foundation provided no input in the study design, decision to publish, or preparation of this document. This research was also supported by the Ocean Frontier Institute through an award from the Canada First Research Excellence Fund.
Acknowledgments
We thank the reviewers for their careful reading of our manuscript and their insightful comments and suggestions.
Conflict of interest
The authors declare that the research was conducted in the absence of any commercial or financial relationships that could be construed as a potential conflict of interest.
References
1
Alford M. H. (2001). Internal swell generation: The spatial distribution of energy flux from the wind to mixed layer near-inertial motions.J. Phys. Oceanogr.312359–2368. 10.1175/1520-04852001031<2359:isgtsd<2.0.co;2
2
Astudillo O. Dewitte B. Mallet M. Frappart F. Rutllant J. A. Ramos M. et al (2017). Surface winds off Peru-Chile: observing closer to the coast from radar altimetry.Remote Sens. Environ.191, 179–196. 10.1016/j.rse.2017.01.010
3
Bakun A. (1990). Global climate change and intensification of coastal ocean upwelling.Science247198–201. 10.1126/science.247.4939.198
4
Bakun A. Black B. A. Bograd S. J. Garcia-Reyes M. Miller A. J. Rykaczewski R. R. et al (2015). Anticipated effects of climate change on coastal upwelling ecosystems.Curr. Clim. Change Rep.185–93. 10.1007/s40641-015-0008-4
5
Bakun A. Field D. B. Redondo-Rodriguez A. N. A. Weeks S. J. (2010). Greenhouse gas, upwelling-favorable winds, and the future of coastal ocean upwelling ecosystems.Glob. Change Biol.161213–1228. 10.1111/j.1365-2486.2009.02094.x
6
Bakun A. Nelson C. S. (1991). The seasonal cycle of wind-stress curl in subtropical eastern boundary current regions.J. Phys. Oceanogr.211815–1834. 10.1175/1520-04851991021<1815:tscows<2.0.co;2
7
Banzon V. Smith T. M. Chin T. M. Liu C. Y. Hankins W. (2016). A long-term record of blended satellite and in situ sea-surface temperature for climate monitoring, modeling and environmental studies.Earth Syst. Sci. Data8165–176. 10.5194/essd-8-165-2016
8
Barth J. A. Menge B. A. Lubchenco J. Chan F. Bane J. M. Kirincich A. R. et al (2007). Delayed upwelling alters nearshore coastal ocean ecosystems in the northern California current.Proc. Natl. Acad. Sci.1043719–3724. 10.1073/pnas.0700462104
9
Battisti D. S. (1989). On the role of off-equatorial oceanic Rossby waves during ENSO.J. Phys. Oceanogr.19551–560. 10.1175/1520-04851989019<0551:otrooe<2.0.co;2
10
Bell J. D. Albert J. Andréfouët S. Andrew N. L. Blanc M. Bright P. et al (2015). Optimising the use of nearshore fish aggregating devices for food security in the Pacific Islands.Mar. Policy5698–105. 10.1016/j.marpol.2015.02.010
11
Belmadani A. Echevin V. Codron F. Takahashi K. Junquas C. (2014). What dynamics drive future wind scenarios for coastal upwelling off Peru and Chile?Clim. Dyn.43, 1893–1914. 10.1007/s00382-013-2015-2
12
Benazzouz A. Demarcq H. González-Nuevo G. de Vigo C. O. (2015). Recent changes and trends of the upwelling intensity in the Canary Current Large Marine Ecosystem.Oceanogr. Biol. Features Canary Curr. Large Mar. Ecosyst.115321–330. 10.4060/ca7253en
13
Benoit-Bird K. J. Waluk C. M. Ryan J. P. (2019). Forage species swarm in response to coastal upwelling.Geophys. Res. Lett.461537–1546. 10.1029/2018gl081603
14
Blamey L. K. Howard J. A. Agenbag J. Jarre A. (2012). Regime-shifts in the southern Benguela shelf and inshore region.Prog. Oceanogr.10680–95. 10.1016/j.pocean.2012.07.001
15
Bonino G. Di Lorenzo E. Masina S. Iovino D. (2019). Interannual to decadal variability within and across the major Eastern Boundary Upwelling Systems.Sci. Rep.91–14. 10.1038/s41598-019-56514-8
16
Borges M. F. Santos A. M. P. Crato N. Mendes H. Mota B. (2003). Sardine regime shifts off Portugal: a time series analysis of catches and wind conditions.Sci. Mar.67235–244. 10.3989/scimar.2003.67s1235
17
Brady R. X. Alexander M. A. Lovenduski N. S. Rykaczewski R. R. (2017). Emergent anthropogenic trends in California Current upwelling.Geophys. Res. Lett.445044–5052. 10.1002/2017gl072945
18
Brady R. X. Lovenduski N. S. Alexander M. A. Jacox M. Gruber N. (2019). On the role of climate modes in modulating the air–sea CO2 fluxes in eastern boundary upwelling systems.Biogeosciences16329–346. 10.5194/bg-16-329-2019
19
Capet X. J. Marchesiello P. Mcwilliams J. C. J. C. (2004). Upwelling response to coastal wind profiles.Geophys. Res. Lett.13:20123. 10.1029/2004gl020123
20
Chavez F. P. Messié M. (2009). A comparison of eastern boundary upwelling ecosystems.Prog. Oceanogr.8380–96. 10.1016/j.pocean.2009.07.032
21
Chhak K. Di Lorenzo E. (2007). Decadal variations in the California Current upwelling cells.Geophys. Res. Lett.34:30203. 10.1029/2007gl030203
22
Costanza R. d’Arge R. De Groot R. Farber S. Grasso M. Hannon B. et al (1997). The value of the world’s ecosystem services and natural capital.Nature387253–260. 10.1038/387253a0
23
Cropper T. E. Hanna E. Bigg G. R. (2014). Spatial and temporal seasonal trends in coastal upwelling off Northwest Africa, 1981–2012.Deep Sea Res. Part I Oceanogr. Res. Papers8694–111. 10.1016/j.dsr.2014.01.007
24
Cury P. Roy C. (1989). Optimal environmental window and pelagic fish recruitment success in upwelling areas.Can. J. Fisheries Aquatic Sci.46670–680. 10.1139/f89-086
25
Di Lorenzo E. Schneider N. Cobb K. M. Franks P. J. S. Chhak K. Miller A. J. et al (2008). North Pacific Gyre Oscillation links ocean climate and ecosystem change.Geophys. Res. Lett.35:32838. 10.1029/2007gl032838
26
Diaz H. F. Hoerling M. P. Eischeid J. K. (2001). ENSO variability, teleconnections and climate change.Int. J. Clim. J. R. Meteorol. Soc.211845–1862. 10.1002/joc.631
27
Fielding P. J. Davis C. L. (1989). Carbon and nitrogen resources available to kelp bed filter feeders in an upwelling environment.Mar. Ecol. Prog. Ser.55181–189. 10.3354/meps055181
28
Figueiras F. G. Labarta U. Reiriz M. F. (2002). “Coastal upwelling, primary production and mussel growth in the Rías Baixas of Galicia,” in Proceedings of the 1st Maricult Conference. Sustainable Increase of Marine Harvesting: Fundamental Mechanisms and New Concepts (Dordrecht: Springer), 121–131. 10.1007/978-94-017-3190-4_11
29
Fogt R. L. Bromwich D. H. (2006). Decadal variability of the ENSO teleconnection to the high-latitude South Pacific governed by coupling with the southern annular mode.J. Clim.19979–997. 10.1175/jcli3671.1
30
Fréon P. Arístegui J. Bertrand A. Crawford R. J. Field J. C. Gibbons M. J. et al (2009). Functional group biodiversity in Eastern Boundary Upwelling Ecosystems questions the wasp-waist trophic structure.Prog. Oceanogr.8397–106. 10.1016/j.pocean.2009.07.034
31
García-Reyes M. Largier J. (2010). Observations of increased wind-driven coastal upwelling off central California.J. Geophys. Res. Oceans115:jc005576. 10.1029/2009jc005576
32
García-Reyes M. Largier J. L. Sydeman W. J. (2014). Synoptic-scale upwelling indices and predictions of phyto-and zooplankton populations.Prog. Oceanogr.120177–188. 10.1016/j.pocean.2013.08.004
33
García-Reyes M. Sydeman W. J. Schoeman D. S. Rykaczewski R. R. Black B. A. Smit A. J. et al (2015). Under pressure: Climate change, upwelling, and eastern boundary upwelling ecosystems.Front. Mar. Sci.2:109. 10.3389/fmars.2015.00109
34
Gillett N. P. Fyfe J. C. Parker D. E. (2013). Attribution of observed sea level pressure trends to greenhouse gas, aerosol, and ozone changes.Geophys. Res. Lett.402302–2306. 10.1002/grl.50500
35
Gómez-Letona M. Ramos A. G. Coca J. Arístegui J. (2017). Trends in primary production in the canary current upwelling system—A regional perspective comparing remote sensing models.Front. Mar. Sci.4:370. 10.3389/fmars.2017.00370
36
Graham R. M. Hudson S. R. Maturilli M. (2019). Improved performance of ERA5 in Arctic gateway relative to four global atmospheric reanalyses.Geophys. Res. Lett.46, 6138–6147. 10.1029/2019gl082781
37
Grise K. M. Davis S. M. (2020). Hadley cell expansion in CMIP6 models.Atmospher. Chem. Phys.20:2020. 10.5194/acp-20-5249-2020
38
Grise K. M. Davis S. M. Simpson I. R. Waugh D. W. Fu Q. Allen R. J. et al (2019). Recent tropical expansion: Natural variability or forced response?J. Clim.321551–1571. 10.1175/jcli-d-18-0444.1
39
Gruber N. Lachkar Z. Frenzel H. Marchesiello P. Münnich M. McWilliams J. C. et al (2011). Eddy-induced reduction of biological production in eastern boundary upwelling systems.Nat. Geosci.4787–792. 10.1038/ngeo1273
40
Gutiérrez D. Bouloubassi I. Sifeddine A. Purca S. Goubanova K. Graco M. et al (2011). Coastal cooling and increased productivity in the main upwelling zone off Peru since the mid-twentieth century.Geophys. Res. Lett.38:l046324. 10.1029/2010gl046324
41
Hobday A. J. Oliver E. C. Gupta A. S. Benthuysen J. A. Burrows M. T. Donat M. G. et al (2018). Categorizing and naming marine heatwaves.Oceanography31162–173. 10.5670/oceanog.2018.205
42
Holbrook N. J. Goodwin I. D. McGregor S. Molina E. Power S. B. (2011). ENSO to multi-decadal time scale changes in East Australian Current transports and Fort Denison sea level: Oceanic Rossby waves as the connecting mechanism.Deep Sea Res. Part II Topical Stud. Oceanogr.58547–558. 10.1016/j.dsr2.2010.06.007
43
Huyer A. (1983). Coastal upwelling in the California Current system.Prog. Oceanogr.12259–284. 10.1016/0079-6611(83)90010-1
44
Jacox M. G. Fiechter J. Moore A. M. Edwards C. A. (2015). ENSO and the C alifornia C urrent coastal upwelling response.J. Geophys. Res. Oceans1201691–1702. 10.1002/2014jc010650
45
Landry M. R. Ohman M. D. Goericke R. Stukel M. R. Tsyrklevich K. (2009). Lagrangian studies of phytoplankton growth and grazing relationships in a coastal upwelling ecosystem off Southern California.Prog. Oceanogr.83, 208–216. 10.1016/j.pocean.2009.07.026
46
Lima F. P. Wethey D. S. (2012). Three decades of high-resolution coastal sea surface temperatures reveal more than warming.Nat. Commun.31–13. 10.1038/ncomms1713
47
Mayer M. Tietsche S. Haimberger L. Tsubouchi T. Mayer J. Zuo H. (2019). An improved estimate of the coupled Arctic energy budget.J. Clim.32, 7915–7934. 10.1175/jcli-d-19-0233.1
48
McGregor H. V. Dima M. Fischer H. W. Mulitza S. (2007). Rapid 20th-century increase in coastal upwelling off northwest Africa.Science315637–639. 10.1126/science.1134839
49
Mendelssohn R. Schwing F. B. (2002). Common and uncommon trends in SST and wind stress in the California and Peru–Chile current systems.Prog. Oceanogr.53141–162. 10.1016/s0079-6611(02)00028-9
50
Messié M. Chavez F. P. (2015). Seasonal regulation of primary production in eastern boundary upwelling systems.Prog. Oceanogr.1341–18. 10.1016/j.pocean.2014.10.011
51
Messié M. Ledesma J. Kolber D. D. Michisaki R. P. Foley D. G. Chavez F. P. (2009). Potential new production estimates in four eastern boundary upwelling ecosystems.Prog. Oceanogr.83151–158. 10.1016/j.pocean.2009.07.018
52
Minobe S. (1999). Resonance in bidecadal and pentadecadal climate oscillations over the North Pacific: Role in climatic regime shifts.Geophys. Res. Lett.26855–858. 10.1029/1999gl900119
53
Narayan N. Paul A. Mulitza S. Schulz M. (2010). Trends in coastal upwelling intensity during the late 20th century.Ocean Sci.6815–823. 10.5194/os-6-815-2010
54
Pardo P. C. Padín X. A. Gilcoto M. Farina-Busto L. Pérez F. F. (2011). Evolution of upwelling systems coupled to the long-term variability in sea surface temperature and Ekman transport.Clim. Res.48231–246. 10.3354/cr00989
55
Patti B. Guisande C. Riveiro I. Thejll P. Cuttitta A. Bonanno A. et al (2010). Effect of atmospheric CO2 and solar activity on wind regime and water column stability in the major global upwelling areas.Estuar. Coastal Shelf Sci.8845–52. 10.1016/j.ecss.2010.03.004
56
Pauly D. Christensen V. (1995). Primary production required to sustain global fisheries.Nature374255–257. 10.1038/374255a0
57
Pegliasco C. Chaigneau A. Morrow R. (2015). Main eddy vertical structures observed in the four major Eastern Boundary Upwelling Systems.J. Geophys. Res. Oceans1206008–6033. 10.1002/2015jc010950
58
Peterson W. T. Schwing F. B. (2003). A new climate regime in northeast Pacific ecosystems.Geophys. Res. Lett.30:l017528. 10.1029/2003gl017528
59
Phillips N. E. (2005). Growth of filter-feeding benthic invertebrates from a region with variable upwelling intensity.Mar. Ecol. Prog. Ser.29579–89. 10.3354/meps295079
60
Reynolds R. W. Smith T. M. Liu C. Chelton D. B. Casey K. S. Schlax M. G. (2007). Daily high-resolution-blended analyses for sea surface temperature.J. Clim.205473–5496. 10.1175/2007jcli1824.1
61
Roemmich D. McGowan J. (1995). Climatic warming and the decline of zooplankton in the California Current.Science2671324–1326. 10.1126/science.267.5202.1324
62
Rykaczewski R. R. Dunne J. P. Sydeman W. J. García-Reyes M. Black B. A. Bograd S. J. (2015). Poleward displacement of coastal upwelling-favorable winds in the ocean’s eastern boundary currents through the 21st century.Geophys. Res. Lett.426424–6431. 10.1002/2015gl064694
63
Saji N. H. Goswami B. N. Vinayachandran P. N. Yamagata T. (1999). A dipole mode in the tropical Indian Ocean.Nature401360–363. 10.1038/43854
64
Santos F. DeCastro M. Gómez-Gesteira M. Álvarez I. (2012a). Differences in coastal and oceanic SST warming rates along the Canary upwelling ecosystem from 1982 to 2010.Continent. Shelf Res.471–6. 10.1016/j.csr.2012.07.023
65
Santos F. Gomez-Gesteira M. Decastro M. Alvarez I. (2012b). Differences in coastal and oceanic SST trends due to the strengthening of coastal upwelling along the Benguela current system.Continent. Shelf Res.3479–86. 10.1016/j.csr.2011.12.004
66
Santos F. Gómez-Gesteira M. Varela R. Ruiz-Ochoa M. Días J. M. (2016). Influence of upwelling on SST trends in La Guajira system.J. Geophys. Res. Oceans1212469–2480. 10.1002/2015jc011420
67
Schlegel R. W. Smit A. J. (2018). heatwaveR: a central algorithm for the detection of heatwaves and cold-spells.J. Open Sour. Softw.3:821. 10.21105/joss.00821
68
Seabra R. Varela R. Santos A. M. Gómez-Gesteira M. Meneghesso C. Wethey D. S. et al (2019). Reduced nearshore warming associated with eastern boundary upwelling systems.Front. Mar. Sci.6:104. 10.3389/fmars.2019.00104
69
Shannon L. V. Crawford R. J. M. Pollock D. E. Hutchings L. Boyd A. J. Taunton-Clark J. et al (1992). The 1980s – a decade of change in the Benguela ecosystem.Afr. J. Mar. Sci.12, 271–296. 10.2989/02577619209504707
70
Sohn B. J. Yeh S. W. Schmetz J. Song H. J. (2013). Observational evidences of Walker circulation change over the last 30 years contrasting with GCM results.Clim. Dynam.401721–1732. 10.1007/s00382-012-1484-z
71
Sousa M. C. Alvarez I. deCastro M. Gomez-Gesteira M. Dias J. M. (2017). Seasonality of coastal upwelling trends under future warming scenarios along the southern limit of the canary upwelling system.Prog. Oceanogr.15316–23. 10.5194/bg-12-7519-2015
72
Steinfeldt R. Sültenfuß J. Dengler M. Fischer T. Rhein M. (2015). Coastal upwelling velocities inferred from helium isotope disequilibrium.Biogeosci. Discuss.1211019–11059. 10.5194/bgd-12-11019-2015
73
Sydeman W. J. García-Reyes M. Schoeman D. S. Rykaczewski R. R. Thompson S. A. Black B. A. et al (2014). Climate change and wind intensification in coastal upwelling ecosystems.Science34577–80. 10.1126/science.1251635
74
Taboada F. G. Stock C. A. Griffies S. M. Dunne J. John J. G. Small R. J. et al (2019). Surface winds from atmospheric reanalysis lead to contrasting oceanic forcing and coastal upwelling patterns.Ocean Model.133, 79–111. 10.1016/j.ocemod.2018.11.003
75
Tetzner D. Thomas E. Allen C. (2019). A validation of ERA5 reanalysis data in the southern antarctic peninsula—Ellsworth land region, and its implications for ice core studies.Geosciences9:289. 10.3390/geosciences9070289
76
Tim N. Zorita E. Hünicke B. (2015). Decadal variability and trends of the Benguela upwelling system as simulated in a high-resolution ocean simulation.Ocean Sci.11483–502. 10.5194/os-11-483-2015
77
Tim N. Zorita E. Hünicke B. Yi X. Emeis K. C. (2016). The importance of external climate forcing for the variability and trends of coastal upwelling in past and future climate.Ocean Sci.12807–823. 10.5194/os-12-807-2016
78
Tokinaga H. Xie S. P. (2011). Wave- and anemometer-based sea surface wind (WASWind) for climate change analysis.J. Clim.24, 267–285. 10.1175/2010jcli3789.1
79
Tretkoff E. (2011). Research Spotlight: Coastal cooling and marine productivity increasing off Peru.Eos Transact. Am. Geophys. Union92184–184. 10.1029/2011eo210009
80
Vallis G. K. (1986). El Niño: A chaotic dynamical system?Science232243–245. 10.1126/science.232.4747.243
81
Varela R. Álvarez I. Santos F. DeCastro M. Gómez-Gesteira M. (2015). Has upwelling strengthened along worldwide coasts over 1982-2010?Sci. Rep.51–15. 10.1038/srep10016
82
Varela R. Lima F. P. Seabra R. Meneghesso C. Gómez-Gesteira M. (2018). Coastal warming and wind-driven upwelling: a global analysis.Sci. Total Environ.6391501–1511. 10.1016/j.scitotenv.2018.05.273
83
Varela R. Rodríguez-Díaz L. de Castro M. Gómez-Gesteira M. (2020). Influence of Eastern Upwelling systems on marine heatwaves occurrence.Glob. Planetary Change196:103379. 10.1016/j.gloplacha.2020.103379
84
Varela R. Santos F. Gómez-Gesteira M. Álvarez I. Costoya X. Días J. M. (2016). Influence of coastal upwelling on SST trends along the south coast of Java.PLoS One11:e0162122. 10.1371/journal.pone.0162122
85
Wang C. (2004). “ENSO, Atlantic climate variability, and the Walker and Hadley circulations,” in The Hadley circulation: Present, past and future, edsBradleyR. S.DiazH. F. (Dordrecht: Springer), 173–202. 10.1007/978-1-4020-2944-8_7
86
Wang D. Gouhier T. C. Menge B. A. Ganguly A. R. (2015). Intensification and spatial homogenization of coastal upwelling under climate change.Nature518390–394. 10.1038/nature14235
87
Wilson A. M. W. Forsyth C. (2018). Restoring near-shore marine ecosystems to enhance climate security for island ocean states: aligning international processes and local practices.Mar. Policy93284–294. 10.1016/j.marpol.2018.01.018
88
Yeh S. W. Cai W. Min S. K. McPhaden M. J. Dommenget D. Dewitte B. et al (2018). ENSO atmospheric teleconnections and their response to greenhouse gas forcing.Rev. Geophys.56185–206. 10.1002/2017rg000568
Summary
Keywords
upwelling, seawater temperature, climate change, coastal regions, remotely sensed SST
Citation
Abrahams A, Schlegel RW and Smit AJ (2021) Variation and Change of Upwelling Dynamics Detected in the World’s Eastern Boundary Upwelling Systems. Front. Mar. Sci. 8:626411. doi: 10.3389/fmars.2021.626411
Received
05 November 2020
Accepted
08 January 2021
Published
03 February 2021
Volume
8 - 2021
Edited by
Isabel Iglesias, University of Porto, Portugal
Reviewed by
Maite deCastro, University of Vigo, Spain; Eduardo Zorita, Helmholtz Centre for Materials and Coastal Research (HZG), Germany
Updates
Copyright
© 2021 Abrahams, Schlegel and Smit.
This is an open-access article distributed under the terms of the Creative Commons Attribution License (CC BY). The use, distribution or reproduction in other forums is permitted, provided the original author(s) and the copyright owner(s) are credited and that the original publication in this journal is cited, in accordance with accepted academic practice. No use, distribution or reproduction is permitted which does not comply with these terms.
*Correspondence: Amieroh Abrahams, amierohabrahams@gmail.com
This article was submitted to Coastal Ocean Processes, a section of the journal Frontiers in Marine Science
Disclaimer
All claims expressed in this article are solely those of the authors and do not necessarily represent those of their affiliated organizations, or those of the publisher, the editors and the reviewers. Any product that may be evaluated in this article or claim that may be made by its manufacturer is not guaranteed or endorsed by the publisher.