 Ellen M. Ditria
 Rod M. Connolly
 Eric L. Jinks1
 Sebastian Lopez-Marcano
- 1Coastal and Marine Research Centre, School of Environment and Science, Australian Rivers Institute, Griffith University, Gold Coast, QLD, Australia
- 2Quantitative Imaging Research Team, Data61, CSIRO, Marsfield, NSW, Australia
Introduction
Technological advances are improving the collection, processing and analysis of ecological data. One of these technologies that has been adopted in recent studies by ecologists is computer vision (CV). CV is a rapidly developing area of machine learning that aims to infer image content at the same level humans can by extracting information from pixels (LeCun et al., 2015; Weinstein, 2018). CV in ecology has gained much attention as it can quickly and accurately process image from remote video imagery while allowing scientists to monitor both individuals and populations at unprecedented spatial and temporal scales. Automated analysis of imagery through CV has also become more accurate and streamlined with the implementation of deep learning (a subset of machine learning) models that have improved the capacity to processes raw images compared to traditional machine learning methods (LeCun et al., 2015; Villon et al., 2016). As the use of camera systems for monitoring fish abundances is common practice in conservation ecology (Gilby et al., 2017; Whitmarsh et al., 2017; Langlois et al., 2020), deep learning allows for the automated processing of big data from video or images, a step which usually creates a bottleneck when these data must be analyzed manually.
Fish monitoring in their natural habitat represents a key step in effective management of fish and fisheries. Deep learning enables researchers to process raw image-based data at high volumes at a much quicker rate than manual methods (González-Rivero et al., 2020). By enabling more data to be analyzed, sampling can be expanded to increase sample sizes across greater spatial and temporal scales. Automated monitoring using deep learning can reduce labor costs and increase efficiency and has been shown to be equally or more accurate than humans at processing data (Torney et al., 2019; Ditria et al., 2020a). To develop automated monitoring tools for fish in aquatic ecosystems, comprehensive training and test datasets are required. To obtain ecologically relevant information using these methods, the models must contain enough labeled training data (annotated appropriately to be implemented into the chosen algorithm) to perform at a high enough standard to be considered for replacing manual methods of data processing. Additionally, datasets should capture the complexity and variability of aquatic ecosystems to create a robust and flexible model for use in monitoring.
While applications of deep learning techniques into marine environments have shown promising results as a viable alternative for manual analysis, there are significant challenges in term of data acquisition and preparing training data to create useful models. Additionally, the reluctance or inability of some parties to share annotated datasets, may slow progress in the development and applications of computer vision techniques for monitoring. Initiatives such as the FishCLEF 15 challenge have expanded the body of literature on computer vision techniques by challenging participants to create a high performing model for fish identification, importantly in unconstraint underwater habitats which is critical for applying this technology to real-world scenarios (Joly et al., 2015). However, the expansion of deep learning techniques in the last few years in marine science call for higher volumes of data for training than traditional machine learning methods. Therefore, there is a need for accessible, quality annotated datasets for deep learning models to further the progress of applying these techniques in ecology.
Although there are currently few datasets available, several research groups have begun adding much needed annotated datasets to support further research into the application of CV for fish identification (Table 1). There are several ways these labeled datasets can contribute to the understanding of CV techniques. The datasets available currently are labeled to achieve either one or a number of the following: object recognition/classification to determine what is in a frame, localization to pin-point where it is in a frame, and object detection which is a combination object classification and object localization (Wang, 2016).
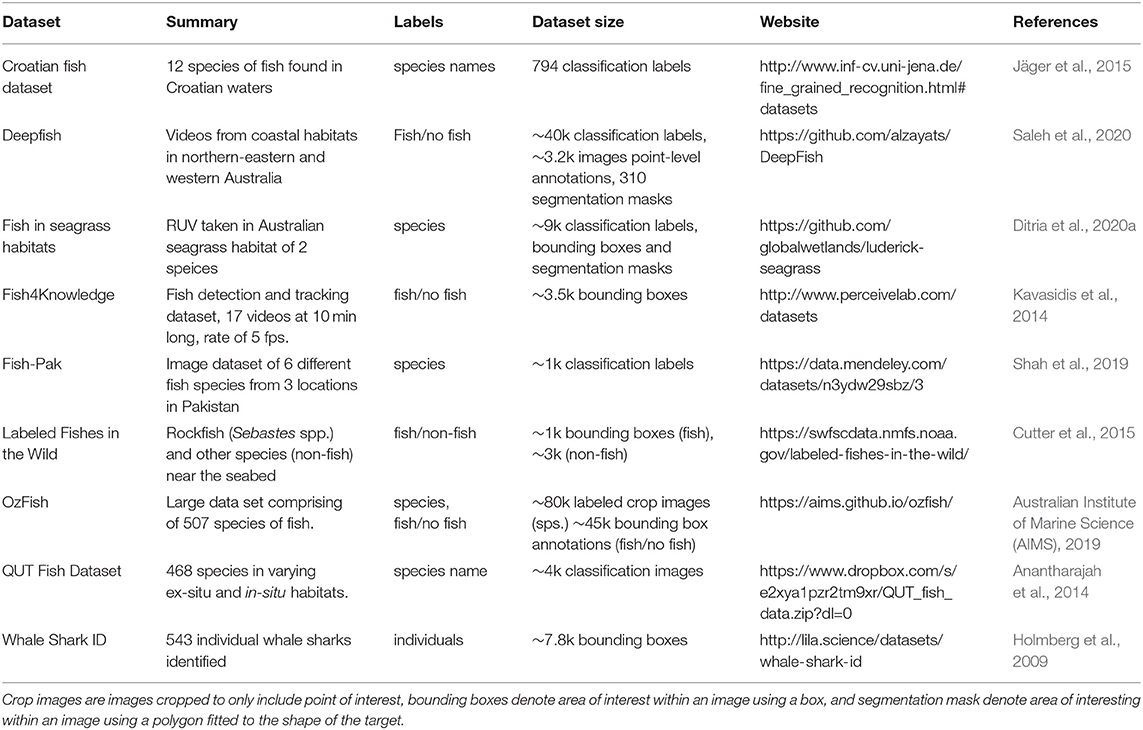
Table 1. Summary of some currently available datasets for training and testing computer vision models for fish.
The contributions of this dataset include: (1) a comprehensive dataset of ecologically important fish species that captures the complexity of backgrounds observed in unconstrained seagrass ecosystems to form a robust and flexible model; (2) a variety of modalities for rapid and flexible testing or comparison of different frameworks, and (3) unaltered imagery for investigation of possible data augmentation and performance enhancement using pre- and post-processing techniques.
Dataset
To continue the development of automated tools for fish monitoring, we report a dataset “Annotated videos of luderick from estuaries in southeast Queensland, Australia” which was used to train a deep learning algorithm for automated species identification and abundance counts presented in Ditria et al. (2020a). This dataset contains footage from remote underwater video (RUV) recordings of two common fish species, luderick (Girella tricuspidata) and Australian bream (Acanthopagrus australis) from seagrass habitats in the estuaries of two river systems in southeast Queensland, Australia. The raw data was obtained using submerged action cameras (Haldex Sports Action Cam HD 1080p) to collect video footage in the Tweed River estuary in southeast Queensland (−28.169438, 153.547594), between February and July 2019. Additional footage was collected from seagrass meadows in a separate estuary system in Tallebudgera Creek (−28.109721, 153.448975). Each sampling day, six cameras were deployed for 1 h over a variety of seagrass patches; the angle and placement of cameras was varied among deployments. Videos were manually trimmed for training to contain only footage of luderick (the target species for the study) and split evenly into 5 frames per second for manual annotation to create a labeled dataset. The dataset consists of 4,281 images and 9,429 annotations (9,304 luderick, 125 bream) at the standard high resolution (1920 × 1080 p). The background varies in complexity due to 18 individual camera deployments at a range of different camera angles and depths showcasing a range of backgrounds and lighting as well as fish positions and angles (Figure 1).

Figure 1. (A) Example images of free swimming fish (luderick) in uncontrained seagrass habitats. This dataset provides footage from different angles, from cameras exposed to different environmental conditions such as tide, lighting, water clarity, color hue experienced under real-world conditions. (B) Segmentation masks around luderick allow for this dataset to be used for a number of computer vision techniques.
The presented data were used to train a deep learning algorithm via transfer learning (Torrey and Shavlik, 2010). The deep learning framework implemented in this study was Mask R-CNN (Massa and Girshick, 2018). To develop this model, we used a ResNet50 configuration, pre-trained on the ImageNet-1k dataset. We conducted the model training, testing and prediction tasks on a Microsoft Azure Data Science Virtual Machine powered by an NVIDIA V100 GPU. Data preparation (uploading raw videos, splitting videos into 5 frames per second frames) and annotation tasks were carried out using software developed at Griffith University (https://globalwetlandsproject.org/tools/fishid/).
The performance metrics used for this dataset were based on precision (P) and recall (R) which were calculated form the false positives, false negatives and true positives (Ditria et al., 2020a).
An F1 score was used to calculate how well the model was able to determine the maximum number of fish in a video at any one time (MaxN) and was calculated as below:
A mean average precision value (mAP) was used to determine the trained model's ability to detect and classify ground-truth segmentation mask annotations. Specifically, the mAP50 metric was used to evaluate model performance in Ditria et al. (2020a), which assigns a true positive when a predicted segmentation mask (Figure 1) overlaps the ground-truth annotated segmentation by at least 50% (https://github.com/cocodataset/cocoapi). mAP50 was calculated as follows:
The results using these metrics and the proposed dataset can be found in Ditria et al. (2020a), where the mAP50 and F1 are both >92% for detecting the target species and counting abundance.
By providing the datasets in different modalities, we propose that it can be used to understand fish dynamics in seagrass ecosystems, develop novel fish counting methods (beyond only MaxN) and for understanding and exploring different methods to improve accuracy for implementation in an ecological context.
Data Presentation
This dataset is organized into 3 sub-datasets that have been allocated for suggested training, test and novel test purposes as used in Ditria et al. (2020a). Each annotation includes object instance annotations which consist of the following key fields: Labels are provided as a common name, either “luderick” for Girella tricuspidata or “bream” for Acanthopagrus australis. Bounding boxes that enclose the species in each frame are provided in “[x, y, width, height]” format, in pixel units; Segmentation masks which outline the species as a polygon are provided as a list of pixel coordinates in the format “[x, y, x, y, …]”; The corresponding image is provided as an image filename. All image coordinates (bounding box and segmentation masks) are measured from the top left image corner and are 0-indexed. Each dataset includes object instance annotations which consist of a corresponding image, label, bounding box, and segmentation mask.
Annotations are provided in both CSV format and COCO JSON format (https://cocodataset.org/#format-data), which is a commonly used data format for integration with object detection frameworks including PyTorch and TensorFlow. Images are included in a ZIP archive. Additional metadata for each image can be found in dataset_images.csv, including deployment dates, geo-coordinates, and habitat type.
Recommendations for Additional Uses of the Dataset in Future Publications
Author recommendations for future work using this dataset include the potential to answer both ecological and technological questions. There are multiple ways of using this dataset for developing automation for application in fish ecology. Different deep learning architectures (Liu et al., 2017), types of augmentation (Shorten and Khoshgoftaar, 2019), and pre and post-processing techniques can be tested for different objectives. New types of analyses also continue to be developed as the body of literature for applied deep learning in ecology grows. There are also several observed phenomena that have been described in deep learning studies that are yet to be quantified in unconstrained underwater habitats. These include how models perform through time when the predicted data begins to differ from the training data set, for example due to changed environmental conditions. The dataset allows analyses of automation effectiveness from videos at different times. The 6-month spread of sampling dates incorporates summer conditions (austral summer: February/March) with warmer water temperatures and poorer water visibility due to increased rainfall in river catchments, as well as winter conditions (austral winter: June/July) typically with cooler, clearer water.
The results in Ditria et al. (2020b) suggest that this data may be suitable to train models for monitoring purposes across habitats, however further research is needed to account for error rates for manual annotation bias and model prediction. This study produced reliable automated predictions, but there is room for further improvement. Pre- and post-processing steps to further investigate the effects of performance can also be applied, as unlike most available datasets, this dataset contains unaltered images extracted directly from the video data, including the background habitat.
This dataset also may be used in conjunction with other datasets to train composite models on multiple species since the segmentation masks and bounding boxes are labeled at the species level unlike most available datasets. This data has been annotated to be used for object detection or classification as well as being suitable to test a range of movement tracking algorithms. Ongoing testing of this standardized dataset will be valuable, especially as new deep-learning architectures become available.
A full analysis and interpretation of the data are reported in Ditria et al. (2020a).
Data Availability Statement
The datasets presented in this study can be found in online repositories. The names of the repository/repositories and accession number(s) can be found at: https://doi.org/10.1594/PANGAEA.926930.
Author Contributions
ED and SL-M conducted the fieldwork to obtain raw data. ED (& volunteers) annotated the dataset. EJ developed the deep learning architecture and user interface on which data annotation was conducted. ED drafted the manuscript. All authors commented on the manuscript.
Funding
RC was supported by a Discovery Project from the Australian Research Council (DP180103124).
Conflict of Interest
The authors declare that the research was conducted in the absence of any commercial or financial relationships that could be construed as a potential conflict of interest.
Acknowledgments
We thank the volunteers who assisted in annotating the dataset. This work benefitted from the support of the Global Wetlands Project.
References
Anantharajah, K., Ge, Z., McCool, C., Denman, S., Fookes, C., Corke, P., et al. (2014). “Local inter-session variability modelling for object classification,” in 2014 IEEE Winter Conference on Applications of Computer Vision (Steamboat Springs, CO: IEEE), 309–316. doi: 10.1109/WACV.2014.6836084
Australian Institute of Marine Science (AIMS) University of Western Australia (UWA), and Curtin University. (2019). OzFish Dataset - Machine learning dataset for Baited Remote Underwater Video Stations.
Cutter, G., Stierhoff, K., and Zeng, J. (2015). “Automated detection of rockfish in unconstrained underwater videos using Haar cascades and a new image dataset: labeled fishes in the wild,” in 2015 IEEE Winter Applications and Computer Vision Workshops (Waikoloa, HI: IEEE), 57–62. doi: 10.1109/WACVW.2015.11
Ditria, E. M., Lopez-Marcano, S., Sievers, M., Jinks, E. L., Brown, C. J., and Connolly, R. M. (2020a). Automating the analysis of fish abundance using object detection: optimizing animal ecology with deep learning. Front. Marine Sci. 7:429. doi: 10.3389/fmars.2020.00429
Ditria, E. M., Sievers, M., Lopez-Marcano, S., Jinks, E. L., and Connolly, R. M. (2020b). Deep learning for automated analysis of fish abundance: the benefits of training across multiple habitats. Environ. Monit. Assess. 192:698. doi: 10.1007/s10661-020-08653-z
Gilby, B. L., Olds, A. D., Connolly, R. M., Yabsley, N. A., Maxwell, P. S., Tibbetts, I. R., et al. (2017). Umbrellas can work under water: using threatened species as indicator and management surrogates can improve coastal conservation. Estuarine Coastal Shelf Sci. 199, 132–140. doi: 10.1016/j.ecss.2017.10.003
González-Rivero, M., Beijbom, O., Rodriguez-Ramirez, A., Bryant, D. E., Ganase, A., Gonzalez-Marrero, Y., et al. (2020). Monitoring of coral reefs using artificial intelligence: a feasible and cost-effective approach. Remote Sens. 12:489. doi: 10.3390/rs12030489
Holmberg, J., Norman, B., and Arzoumanian, Z. (2009). Estimating population size, structure, and residency time for whale sharks Rhincodon typus through collaborative photo-identification. Endangered Species Res. 7, 39–453. doi: 10.3354/esr00186
Jäger, J., Simon, M., Denzler, J., Wolff, V., Fricke-Neuderth, K., and Kruschel, C. (2015). “Croatian fish dataset: fine-grained classification of fish species in their natural habitat,” in Proceedings of the Machine Vision of Animals and their Behaviour (MVAB), eds T. Amaral, S. Matthews, T. Plötz, S. McKenna, and R. Fisher (London: BMVA Press), 6.1–6.7. doi: 10.5244/C.29.MVAB.6
Joly, A., Goëau, H., Glotin, H., Spampinato, C., Bonnet, P., Vellinga, W.-P., et al. (2015). “LifeCLEF 2015: multimedia life species identification challenges,” in International Conference of the Cross-Language Evaluation Forum for European Languages (Cham: Springer), 462–483. doi: 10.1007/978-3-319-24027-5_46
Kavasidis, I., Palazzo, S., Di Salvo, R., Giordano, D., and Spampinato, C. (2014). An innovative web-based collaborative platform for video annotation. Multimedia Tools Appl. 70, 413–432. doi: 10.1007/s11042-013-1419-7
Langlois, T., Goetze, J., Bond, T., Monk, J., Abesamis, R. A., Asher, J., et al. (2020). A field and video annotation guide for baited remote underwater stereo-video surveys of demersal fish assemblages. Methods Ecol. Evol. 11, 1401–1409. doi: 10.1111/2041-210X.13470
LeCun, Y., Bengio, Y., and Hinton, G. (2015). Deep learning. Nature 521, 436–444. doi: 10.1038/nature14539
Liu, W., Wang, Z., Liu, X., Zeng, N., Liu, Y., and Alsaadi, F. E. (2017). A survey of deep neural network architectures and their applications. Neurocomputing 234, 11–26. doi: 10.1016/j.neucom.2016.12.038
Massa, F., and Girshick, R. (2018). maskrcnn-benchmark: Fast, modular reference implementation of instance segmentation and object detection algorithms in PyTorch (accessed April 29, 2019).
Saleh, A., Laradji, I. H., Konovalov, D. A., Bradley, M., Vazquez, D., and Sheaves, M. (2020). A realistic fish-habitat dataset to evaluate algorithms for underwater visual analysis. Sci. Rep. 10, 1–10. doi: 10.1038/s41598-020-71639-x
Shah, S. Z. H., Rauf, H. T., IkramUllah, M., Khalid, M. S., Farooq, M., Fatima, M., et al. (2019). Fish-Pak: fish species dataset from Pakistan for visual features based classification. Data Brief 27:104565. doi: 10.1016/j.dib.2019.104565
Shorten, C., and Khoshgoftaar, T. M. (2019). A survey on image data augmentation for deep learning. J. Big Data 6:60. doi: 10.1186/s40537-019-0197-0
Torney, C. J., Lloyd-Jones, D. J., Chevallier, M., Moyer, D. C., Maliti, H. T., Mwita, M., et al. (2019). A comparison of deep learning and citizen science techniques for counting wildlife in aerial survey images. Methods Ecol. Evol. 10, 779–787. doi: 10.1111/2041-210X.13165
Torrey, L., and Shavlik, J. (2010). “Transfer learning,” in Handbook of Research on Machine Learning Applications and Trends: Algorithms, Methods, and Techniques, eds E. S. Olivas, J. D. Guerrero, M. Martinez-Sober, J. R. Magdalena-Benedito, and A. J Serrano López (Hershey, PA: IGI Global), 242–264. doi: 10.4018/978-1-60566-766-9.ch011
Villon, S., Chaumont, M., Subsol, G., Villéger, S., Claverie, T., and Mouillot, D. (2016). “Coral reef fish detection and recognition in underwater videos by supervised machine learning: Comparison between Deep Learning and HOG+ SVM methods,” in 2016 International Conference on Advanced Concepts for Intelligent Vision Systems (Cham: Springer), 160–171. doi: 10.1007/978-3-319-48680-2_15
Wang, X. (2016). Deep learning in object recognition, detection, and segmentation. Found. Trends Signal Process. 8, 217–382. doi: 10.1561/2000000071
Weinstein, B. G. (2018). A computer vision for animal ecology. J. Anim. Ecol. 87, 533–545. doi: 10.1111/1365-2656.12780
Keywords: annotated dataset, automation, machine learning, seagrass, automated monitoring, deep learning—CNN
Citation: Ditria EM, Connolly RM, Jinks EL and Lopez-Marcano S (2021) Annotated Video Footage for Automated Identification and Counting of Fish in Unconstrained Seagrass Habitats. Front. Mar. Sci. 8:629485. doi: 10.3389/fmars.2021.629485
Received: 15 November 2020; Accepted: 08 February 2021;
Published: 03 March 2021.
Edited by:
Gretta Pecl, Centre for Marine Socioecology, AustraliaReviewed by:
David John Booth, University of Technology Sydney, AustraliaEuan S. Harvey, Curtin University, Australia
Copyright © 2021 Ditria, Connolly, Jinks and Lopez-Marcano. This is an open-access article distributed under the terms of the Creative Commons Attribution License (CC BY). The use, distribution or reproduction in other forums is permitted, provided the original author(s) and the copyright owner(s) are credited and that the original publication in this journal is cited, in accordance with accepted academic practice. No use, distribution or reproduction is permitted which does not comply with these terms.
*Correspondence: Ellen M. Ditria, ZWxsZW4uZGl0cmlhQGdyaWZmaXRodW5pLmVkdS5hdQ==