 Sara Cernadas-Martín
 Konstantine J. Rountos
 Janet A. Nye2,4
 Michael G. Frisk
 Ellen K. Pikitch
- 1Institute for Ocean Conservation Science, Stony Brook University, Stony Brook, NY, United States
- 2School of Marine and Atmospheric Science, Stony Brook University, Stony Brook, NY, United States
- 3Department of Biology, St. Joseph’s College, Patchogue, NY, United States
- 4Institute of Marine Sciences, University of North Carolina at Chapel Hill, Morehead City, NC, United States
This study assessed the diet of Summer flounder (SF, Paralichthys dentatus) in Shinnecock Bay, NY. Summer flounder are a recreationally and commercially important marine flatfish species found along the Eastern United States coastline. Despite their importance, few studies have examined the trophodynamics of a broad size spectrum of this species. Diet composition of summer flounder (n = 88) was assessed from 2014 to 2016 throughout Shinnecock Bay, a eutrophic bar-built estuary in New York. Species consumed and diet species richness differed significantly amongst SF size classes, with large [≥375 mm total length (TL)] and medium (>225: <375 mm) summer flounder showing higher levels of piscivory and more diverse diets than small-sized (≤225 mm) conspecifics. As voracious plastic predators, trends in annual and monthly diet variation generally followed prey availability in Shinnecock Bay. One exception to this general pattern occurred for winter flounder (Pseudopleuronectes americanus). Despite their low relative abundance in the bay, winter flounder was highly preferred as prey by summer flounder (Chesson index, α = 0.35) and was their predominant prey item accounting for 12.3% (SD ± 3.9%) of the diet by weight. Other factors that explained the variability of the diet of summer flounder were year, month, dissolved oxygen concentration, bay region and habitat, with a cumulative variance of 10.3%. Interestingly, clear differences in the diet (i.e., species richness and abundance) of summer flounder were found within regions of Shinnecock Bay, with a decrease in teleost biomass and species richness observed in the western region where water quality is more degraded and less seagrass is available compared to the more pristine eastern region. Distinct trophic dynamics in degraded habitats suggests fundamentally different food webs that could have important consequences to ecosystem stability and resilience. As coastal areas continue to experience degradation, diet studies of economically and ecologically important species can aid in the development of effective ecosystem-based management plans.
Introduction
Summer flounder (SF, Paralichthys dentatus) populations range from northeastern Florida to Nova Scotia with the highest concentration located in the Mid Atlantic Bight (MAB), which extends from North Carolina to Massachusetts (Grosslein and Azarovitz, 1982). These fish enter estuarine waters during the late spring/summer and return to the open ocean, off the continental shelf, at the end of the summer (Able and Kaiser, 1994; Capossela et al., 2013). Summer flounder is the most recreationally and commercially important marine flatfish species found along the Eastern United States coastline (Terceiro, 2012). Current regulations limit annual commercial landings to ∼5,000 mt and recreational fishing landings account for 2500 mt (Terceiro, 2018). After the stock collapsed in 1989, new and stricter commercial and recreational fishing regulations were enacted (Terceiro, 2002). The 2019 stock assessment concluded that the stock was not overfished nor being overfished (NEFSC and NMFS, 2019).
The diet composition of SF has been shown to vary with total length (TL) and habitat (Able and Kaiser, 1994; Latour et al., 2008). Thus, location is an important factor in trophodynamics and cannot be disentangled from degradation. Generally, young-of-year (YOY, >50−≤225 mm) summer flounder eat zooplankton and small benthic invertebrates, juveniles (>225−<375 mm) consume macroinvertebrates such as crustaceans, as well as small forage fish, and adults (≥375 mm) have the most diverse diet, comprised of various sized invertebrates, small forage fish and some medium/large-sized fishes such as weakfish (Cynoscion regalis) or spotted hake (Urophycis regia) (Witting et al., 2004; Buchheister and Latour, 2011).
Diet composition of summer flounder also varies among seasons, as the species migrates between estuarine (spring–summer) and offshore-pelagic (fall–winter) habitats, and the origin of prey items changes correspondingly (Able and Kaiser, 1994). The offshore and estuarine diet composition of summer flounder has been previously described (Rountree and Able, 1992; Link et al., 2002; Staudinger, 2006, Latour et al., 2008, Buchheister and Latour, 2011; Taylor and Gervasi, 2017). Although offshore studies may have the advantage of large sample sizes, their data are skewed toward large-sized specimens, and thus, do not reflect all age classes of summer flounder. Estuarine-based studies, however, typically sample a wider size range of summer flounder and can better characterize the diet composition of different age groups, albeit only for estuarine environments. The bulk of summer flounder annual growth occurs during estuarine phases; thus, understanding their trophic habits in these systems is critical. Most prior studies of estuarine diets were conducted in Chesapeake Bay, New Jersey or North Carolina (Rountree and Able, 1992; Burke, 1995, Latour et al., 2008; Buchheister and Latour, 2011). The diets of summer flounder sampled in those locations potentially differ from those of summer flounder sampled at higher latitudes, due to possible difference in prey assemblages. Summer flounder play a crucial ecological role and support the most important recreational fishery in New York (Poole, 1964; Kraus and Musick, 2001, Bochenek et al., 2010; Sagarese et al., 2011). Diet composition of summer flounder in New York estuaries has only been described in two studies conducted almost 50 years apart (Poole, 1964; Sagarese et al., 2011) and, to our knowledge, the factors driving intraspecific diet variability in summer flounder residing in New York estuaries has not been assessed.
Shinnecock Bay is the second largest commercial fishing port in the state of New York. Landings include a variety of species caught primarily by bottom trawlers that operate outside of the bay (McCay and Cieri, 2000; NEFSC, 2008b). It is a productive, shallow lagoon estuary located on the south shore of eastern Long Island, NY approximately 122 km east of New York City (Figure 1). The bay covers an area of 40 km2, has an average salinity of 30 psu, an average depth of 2 m (maximum depth 4 m) and surface water temperatures that typically range from −2 to 24°C within a year (Green and Chambers, 2007). Despite eutrophication, the bay contains a variety of habitats including salt marshes, tidal flats, and seagrass beds that provide important nursery and feeding grounds for numerous fish and invertebrate species (USACE, 2004). The bay can be divided into roughly equivalently sized portions, a western region (18 km2) where water quality is generally more degraded (Table 1), and a more pristine eastern region (22 km2) that has an inlet with the Atlantic Ocean (Figure 1). The western region of Shinnecock bay is connected to Quantuck bay (2.5 km2) via the Quogue canal. Quantuck is included as part of the western region in this study, as the water masses are connected, and summer flounder were collected from both areas.
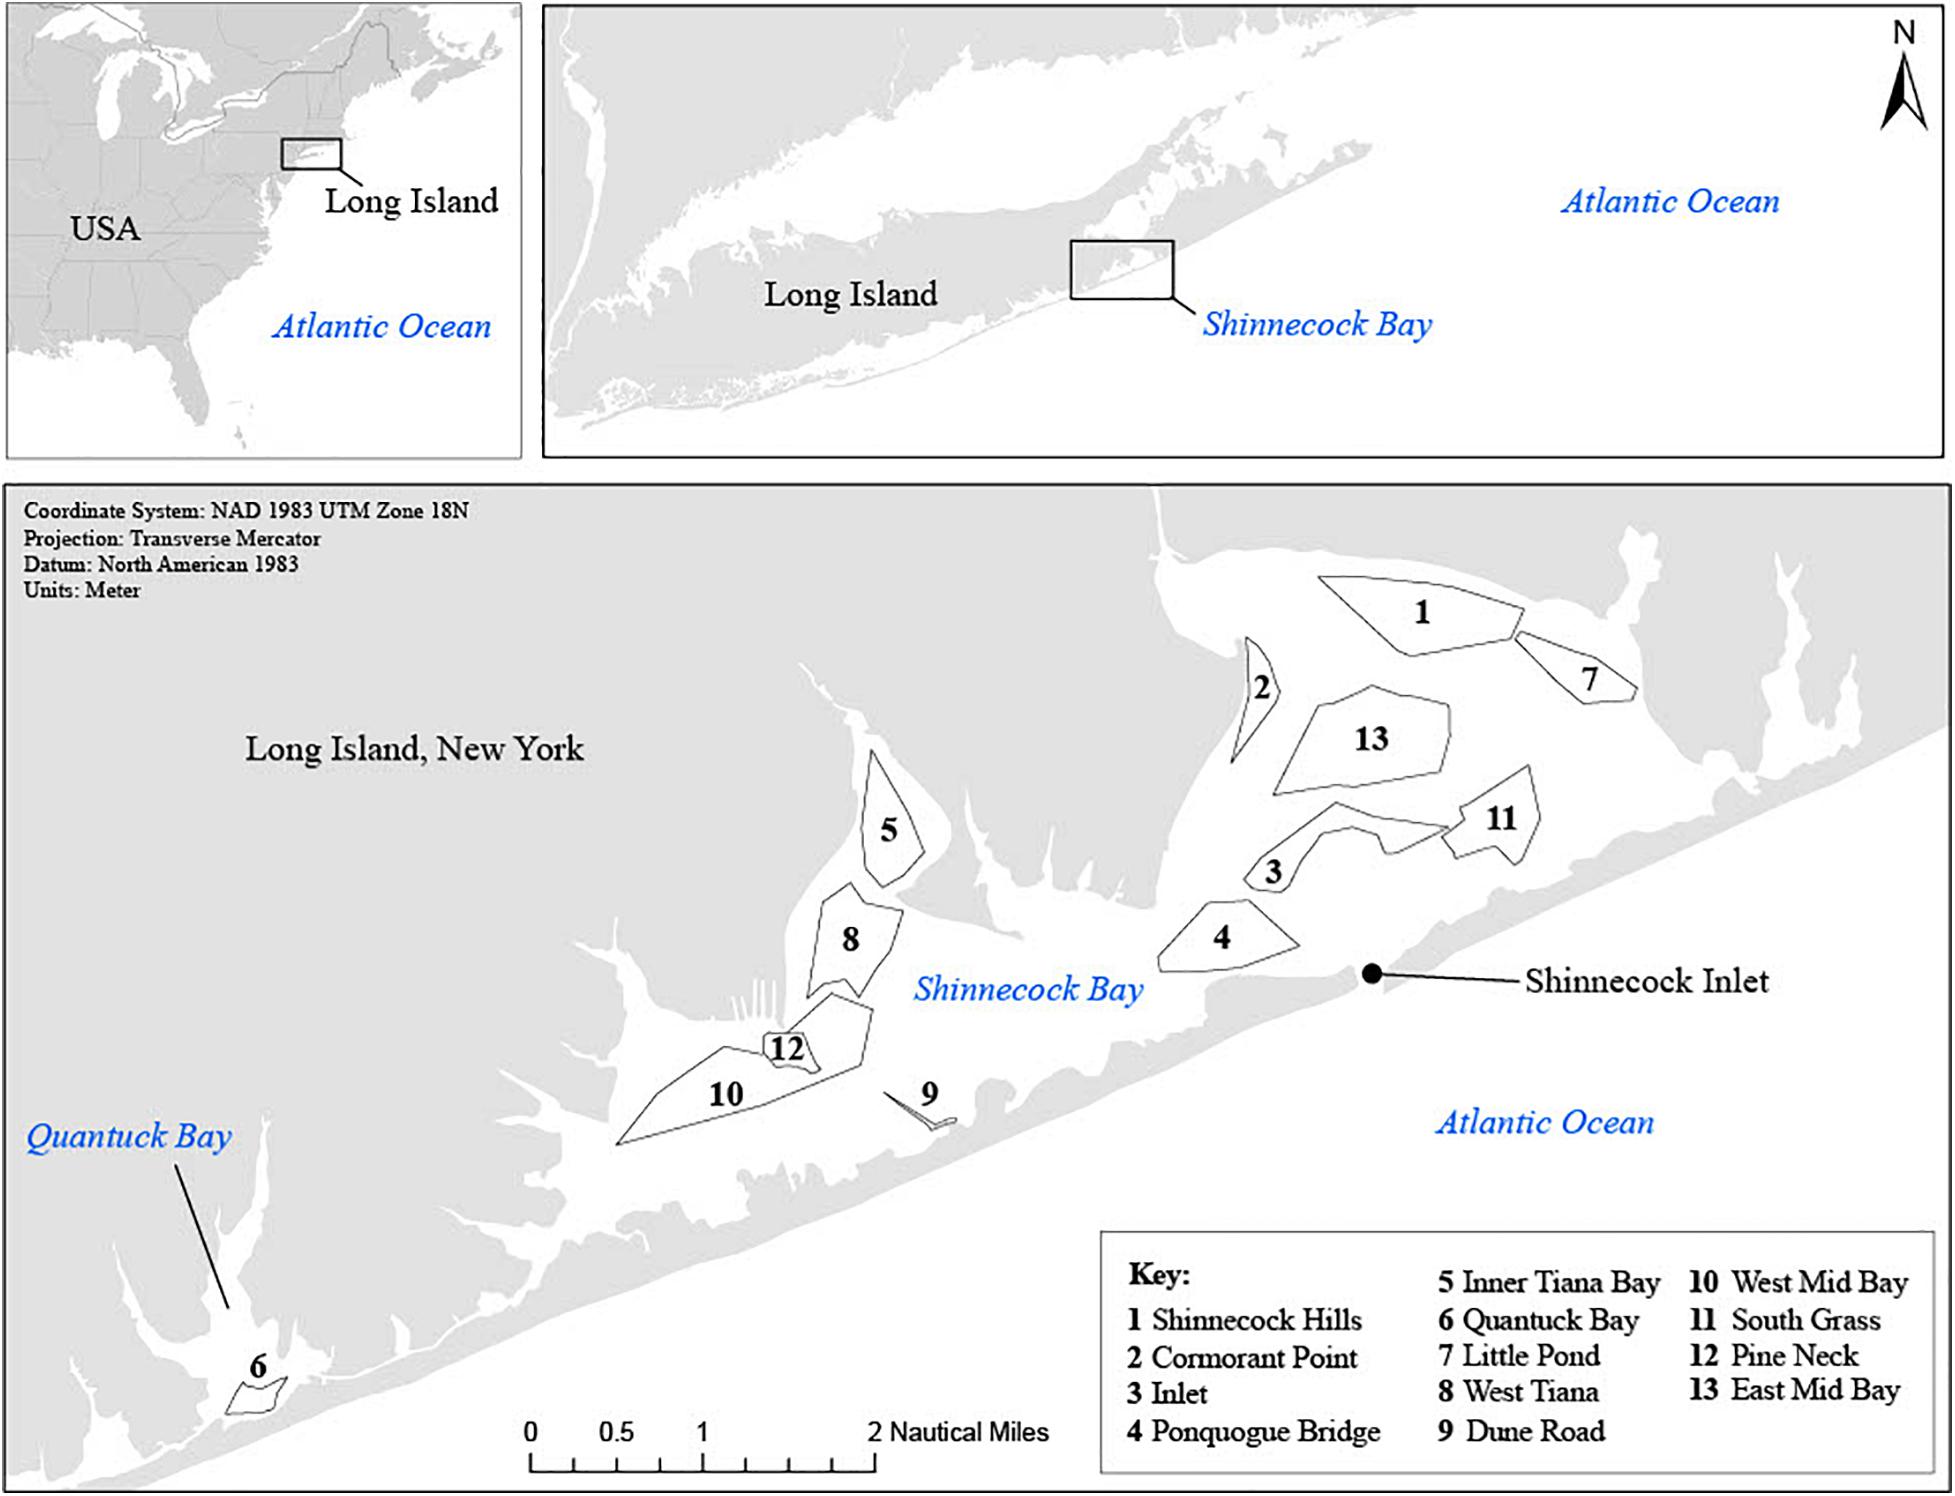
Figure 1. Map of Shinnecock Bay with station areas, station numbers and station IDs, for the sampling seasons of 2014, 2015, and 2016. Data source: ESRI, HERE, Garmin© OpenStreetMap contributors, GIS user community. Map credit: Maria Grima.
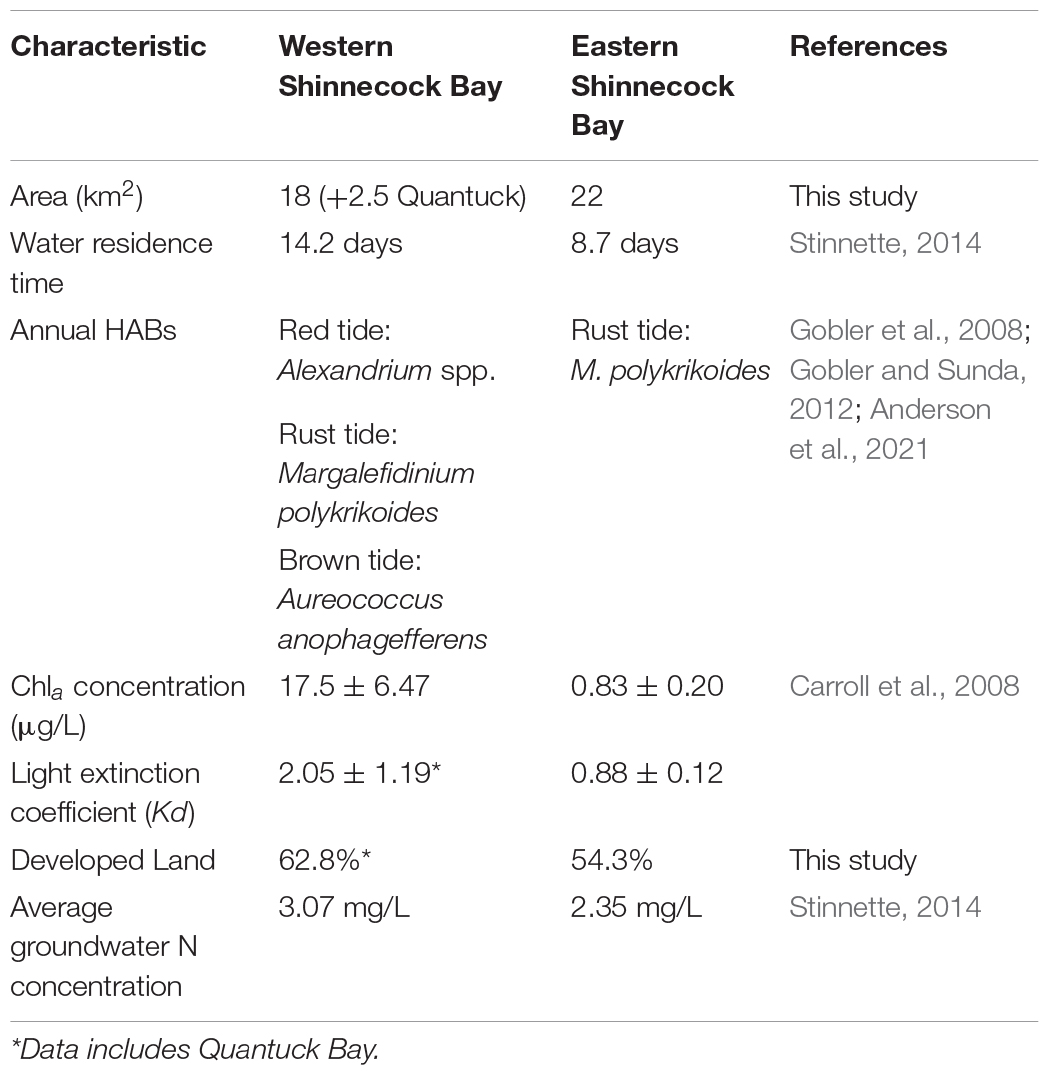
Table 1. Water quality and physical characteristics of the eastern region and western region of Shinnecock Bay.
When compared to the eastern region, the western region of Shinnecock Bay is characterized by higher upland urban development (Supplementary Figure A), higher area covered with bulkheads along the shoreline, reduced flushing times, increased diversity of HABs and generally greater bloom densities due to eutrophication, and a subsequent decrease in light penetration (Gobler et al., 2005; Carroll et al., 2008) which over time, led to a biomass decline of native seagrass species (i.e., eelgrass; Zostera marina) beds in the bay (Peterson et al., 2013). These factors result in poor water quality (Carroll et al., 2008; Gobler et al., 2008), low fish diversity and reduced community structure (Bilkovic and Roggero, 2008; Gittman et al., 2016). Light transparency is greater in the eastern region of the bay due to mixing the estuarine water with less eutrophic ocean water through the inlet (Buonaiuto and Bokuniewicz 2008). As such, the eastern region of Shinnecock Bay is characterized by more numerous and healthier eelgrass beds and better water quality (Warren and Peterson, 2007; Jackson et al., 2017, Stubler et al., 2017; Zarnoch et al., 2017).
Due to the well-established role of eelgrass beds as nursery grounds for teleost species (Boehlert and Mundy, 1988, Heck et al., 2003), higher biodiversity and biomass of summer flounder teleost prey would be expected in the eastern region of bay than in the western region. Therefore, this New York estuary provides an excellent case that allows comparison of an estuarine ecosystem under severe anthropogenic stress (western region of the bay) with one in a near-pristine state in the same watershed (eastern region of the bay).
The main objective of this study was to provide a comprehensive length-based assessment of the diet of summer flounder and its trophic dynamics in Shinnecock Bay, NY, during the late spring-summer and early fall seasons of the years 2014, 2015, and 2016. The influence of water quality, benthic habitat, and other factors were examined as explanatory factors of diet composition. It was hypothesized that the diet composition of SF is significantly different in the degraded western region as compared to the eastern region of Shinnecock Bay. We expect the diet of SF to differ based on prey preference and availability, the latter being potentially affected by differences in water quality, habitat and community structure. As estuaries globally continue to experience eutrophication and habitat degradation, understanding the effects on commercially and recreationally important species is critical for ecosystem-based fisheries management.
Materials and Methods
Collection and Sampling
Summer flounder were collected as part of the Shinnecock Bay Restoration Program’s (ShiRP; www.shinnecockbay.org) annual benthic trawl survey (n = 88). This program is aimed at improving water quality in the bay through the restoration of native filter-feeding bivalves and seagrass beds. The trawl survey was established in 2009 to provide a baseline for fish and invertebrate species richness and relative abundance in Shinnecock Bay to ultimately assess the effects of restoration activities. In this study, we use data on the relative abundance of macroinvertebrates and fish from this bi-monthly trawl survey conducted from late spring (May) to fall (October) for the years 2014–2016. Briefly, a stratified random sampling design was followed in which random sites were trawled within 13 predesignated areas (i.e., six in the eastern region of the bay, six in the western region, and one in the adjacent Quantuck Bay) between 09:00 and 17:00 (Figure 1). The benthic otter trawl net used for this survey was 4.9 m wide, 1.2 m high, with mesh 3.81 cm in diameter and a soft bag with a mesh of 3.18 cm in diameter. All trawls were deployed for 3 min, except for trawls located in the mid-bay area of eastern and western Shinnecock Bay, which were deployed for 7 min each to ensure adequate catches. Water temperature (°C), dissolved oxygen (mg L–1) and salinity (psu) data were collected at each station at 0.5-m depth prior to deploying the trawl using a YSI® Y85 Multifunction D.O. Meter (YSI-Xylem Inc. Ohio, United States). All trawls were conducted aboard the R/V Shinnecock (Stony Brook University, Southampton, NY, United States) following procedures approved by the Stony Brook Institutional Animal Care and Use Committee (Permit #338686). In addition to the trawl survey, an extensive benthic habitat mapping survey using an underwater HD camera was conducted by ShiRP to generate a krigged GIS map of benthic habitats in Shinnecock Bay, which was used to categorize the habitat s trawled (i.e., seagrass, sand, and mud).
All summer flounder captured for this study were measured to the nearest mm, weighed, and humanely euthanized by ice slurry immersion followed by complete freezing (Stony Brook University IACUC permit #573953). Fish were on ice before being brought to the lab for storage at −20°C until further processing. Samples were thawed at a later time for gut content analysis.
Stomach Content Processing
Summer flounder samples were sorted by TL into three size class groups (i.e., small <225 mm, medium 225–375 mm, and large >375 mm). These sizes were selected based on previously published data, where size classes were based on significant differences in the diet composition of summer flounder (Latour et al., 2008). Stomachs were excised from thawed summer flounder specimens and placed in petri dishes. Any prey item found in the esophagus was included and was assumed not to be the result of net feeding (Latour et al., 2008). Intestines were ignored due to the difficulty of identifying digested food. Stomachs were weighed both full and empty to the nearest mg. Prey items found inside the stomachs were classified to the lowest possible taxonomic category. More general categories were created for marine organic matter “MOM” (i.e., seagrass and macroalgae), terrestrial organic matter “TOM” (i.e., leaves and sticks), inorganic matter “IM” (e.g., stones, plastic debris etc.), unknown fish “UF”, unknown organic matter “UOM” and unknown matter “UM”. All prey items were weighed to the nearest mg and measured to the nearest mm along the longest axis when possible.
Diet Composition
The magnitude of feeding was estimated using the stomach fullness index (SFI) equation (Hureau, 1970):
In Equation (1), WC represents the weight of the stomach and its contents (mg) and WF is the weight of the summer flounder (mg). Empty stomachs were included in the calculations. SFI results for the sampled summer flounder were compared across location (i.e., Eastern region or Western region) and benthic habitat (i.e., seagrass, mud, or sand), and box plots were created to visually assess possible differences.
Diet composition was presented as frequency of occurrence (O%) and percent by weight of prey item (WP) (Hyslop, 1980) as calculated in Equation (2) and corrected for autocorrelation of specimens due to the sampling regime using a cluster sampling estimator (Buckel et al., 1999; Latour et al., 2008).
where n is the number of trawls where summer flounder was captured, Mi is the number of summer flounder collected at sampling site i, wi is the total weight of all prey items in the stomachs of summer flounder collected at site i and wip is the total weight of prey type p in those stomachs. The standard deviation for WP was calculated based on Equation (3).
where
The resulting WP value was log transformed to account for the log normal distribution of the weight data (ln [x + 1]) (Garrison and Link, 2000; Latour et al., 2008). Stomach content contributions (Wp) were grouped for analysis based on our explanatory variables; year (2014–2016), sampling month (June–September), water quality (i.e., dissolved oxygen, salinity, and temperature), size class, habitat where they were collected (seagrass, mud, or sand), and bay region (East or West).
Individual stomach content composition (mg) was grouped into two classes: teleost and invertebrates (IM, TOM, MOM, UM, and UOM were not used in these analyses). The existence of significant differences in the amount of teleost and invertebrates in the diet of summer flounder based on bay region (i.e., East or West) and benthic habitat (seagrass, mud, or sand) was assessed by means of a two-way ANOVA for each independent variable (i.e., teleost and invertebrates). The data were previously checked for normality (Shapiro-Wilk test) and equal variance (Brown-Forsythe test). Canonical correspondence analysis (CCA) (Ter Braak, 1986) was used to assess the variance in the data set (Garrison and Link, 2000). CCA analysis was carried out with the program PC-ORDTM (version 5, MjM Software, Gleneden Beach, Oregon, United States). The possible explanatory variables used in the analysis were bay region (i.e., East or West), habitat type (i.e., seagrass, mud or sand), site (i.e., sampling station), month (e.g., June to October, quantitative variable), year (i.e., 2014, 2015, and 2016, quantitative variable), temperature (°C), dissolved oxygen (mg L–1), salinity (psu) and summer flounder TL (mm). Results obtained from CCA were represented as a biplot to elucidate the relationship and trends between the significant explanatory variables, the canonical axes and the identified prey items.
Diet Preference
The selective predation of summer flounder was calculated using the preference index “α” (Chesson, 1978, 1983) displayed in Equation (4).
where ri is the ratio of food type i in the consumer’s stomach content, ni is the ratio of food type i in the environment and m is the total number of prey items found in the stomachs of the studied summer flounder. An α value of 0 reflects prey avoidance, whereas a value of 1 reflects exclusive consumption of that prey type. The reduction in food density due to summer flounder consumption was considered insignificant compared to the total amount of food available (i.e., ni is constant).
The ratio of prey items biomass in the environment was estimated from available trawl data for the years 2014, 2015, and 2016. During the ShiRP trawl surveys the morphological data collected included length/width of organisms but not weight. Therefore, biomass of organisms sampled was estimated using published Length–Weight and Width–Weight equations (Supplementary Table A). Due to the trawl mesh diameter of 3.18 cm, small invertebrates (i.e., mysid shrimp, mud crab, grass shrimp, and sand shrimp) could pass through the trawl mesh and were therefore excluded from the biomass ratios and diet preference analyses.
Results
General Diet Description
In total 88 summer flounder were collected during the sampling seasons of 2014, 2015, and 2016 (Table 2) ranging in size from 89 to 649 mm. Nearly 20% (i.e., 17 out of 88) of SF had empty stomachs. A sample size of n = 88 is justified as a rarefaction curve of the unique summer flounder prey items indicated that the number of samples used did adequately represent the number of potential prey items in the summer flounder diet (Supplementary Figure B).
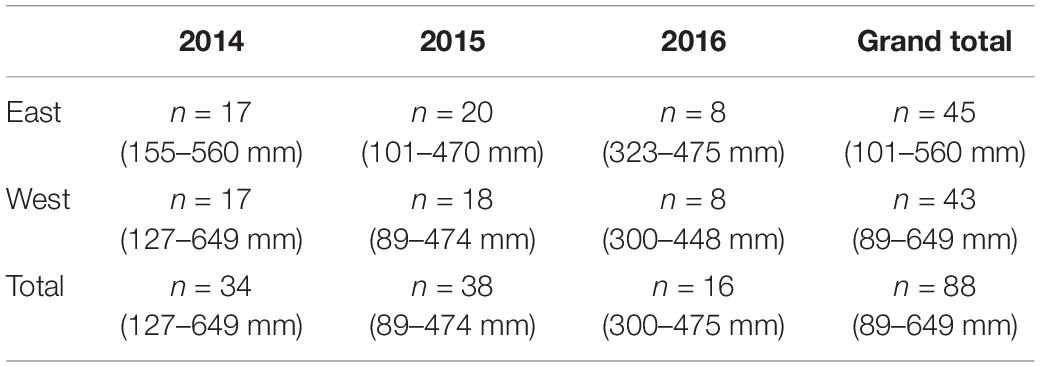
Table 2. Number of summer flounder collected (n) per sampling year and Bay region. Total length (TL) range in parenthesis.
The TL of the summer flounder collected for this study were not significantly different based on bay region or benthic habitat (two-way ANOVA, p > 0.05). Similarly, there were no significant differences in the TL of summer flounder captured based on month of sampling (Kruskal–Wallis one way analysis of variance on ranks, p = 0.44).
Stomach contents were subdivided into 28 different prey types, with 16 of those types identified to the species level (i.e., nine fish and seven invertebrates, respectively; Table 3). YOY winter flounder was the predominant prey item in summer flounder collected in Shinnecock Bay, accounting for 12. 3% (SD ± 3.9%) of the diet by weight. Other fish species eaten by summer flounder included the Northern puffer (Sphoeroides maculatus) and Atlantic silverside (Menidia menidia) accounting for 1.89% (SD ± 1.87%) and 1.85% (SD ± 1.30%) of the diet by weight, respectively. Invertebrate species observed in the diet included sand shrimp (Crangon septemspinosa), blue crab (Callinectes sapidus), and mantis shrimp (Squilla empusa) representing 6.5% (SD ± 2.6%), 5.7% (SD ± 2.6%), and 5.6% (SD ± 3.7%) of the diet by weight, respectively (Figure 2).
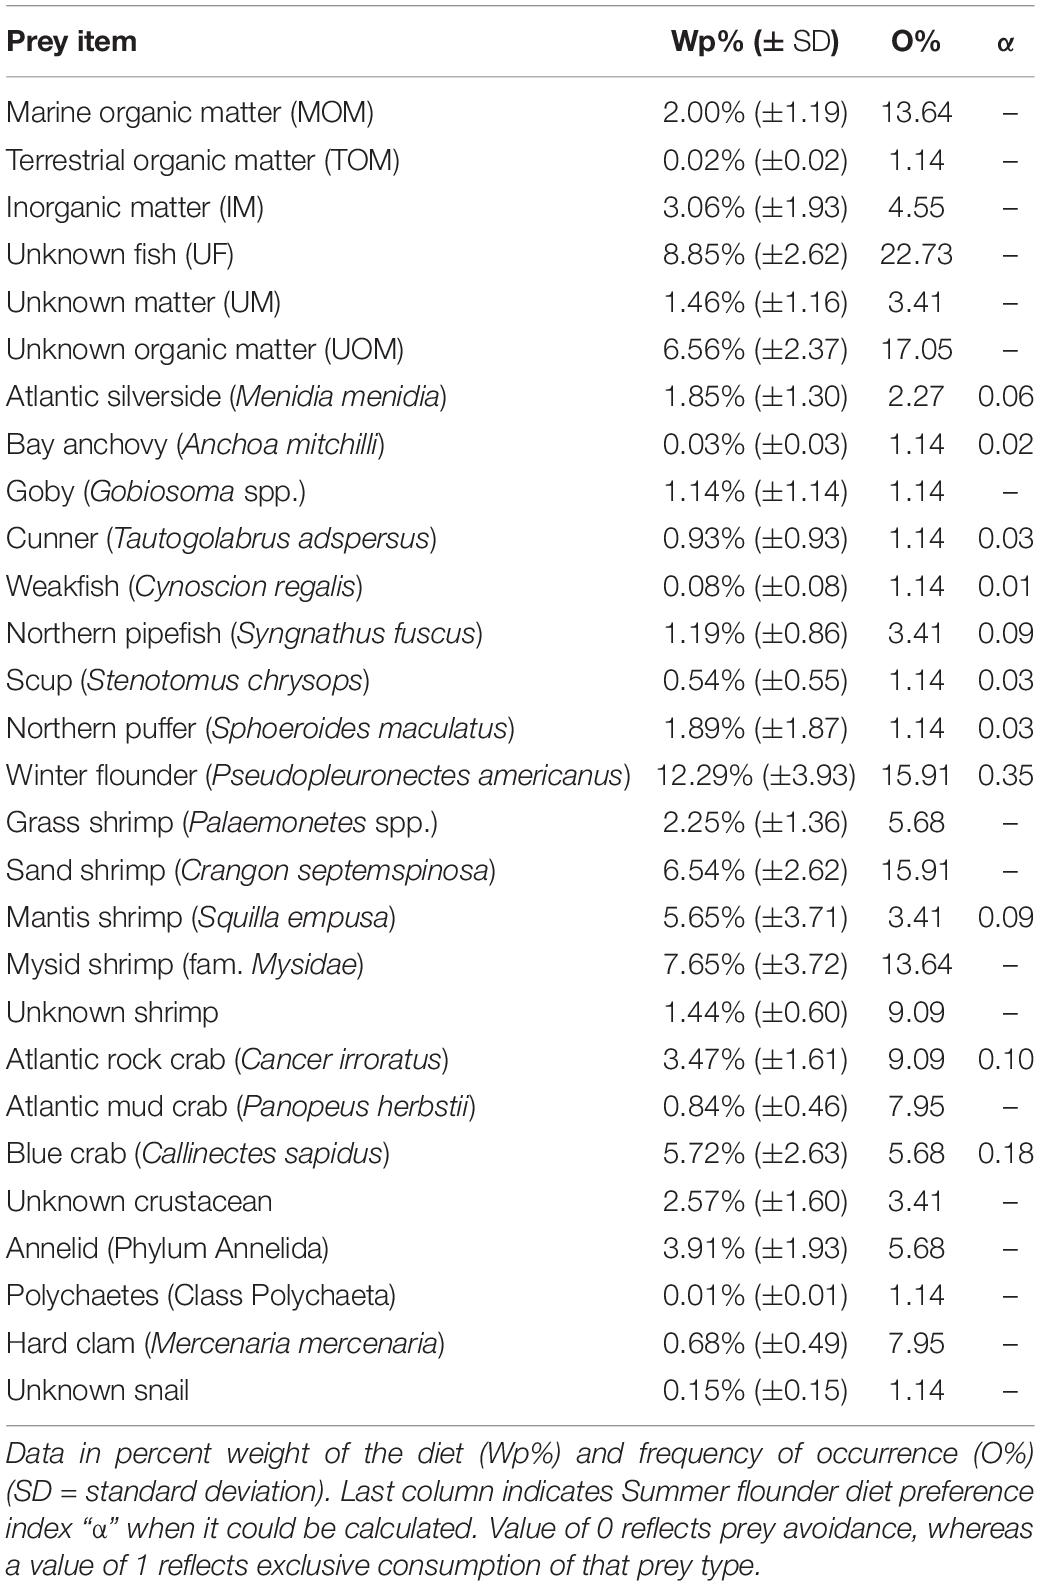
Table 3. Diet composition of summer flounder collected in Shinnecock Bay (2014–2016).
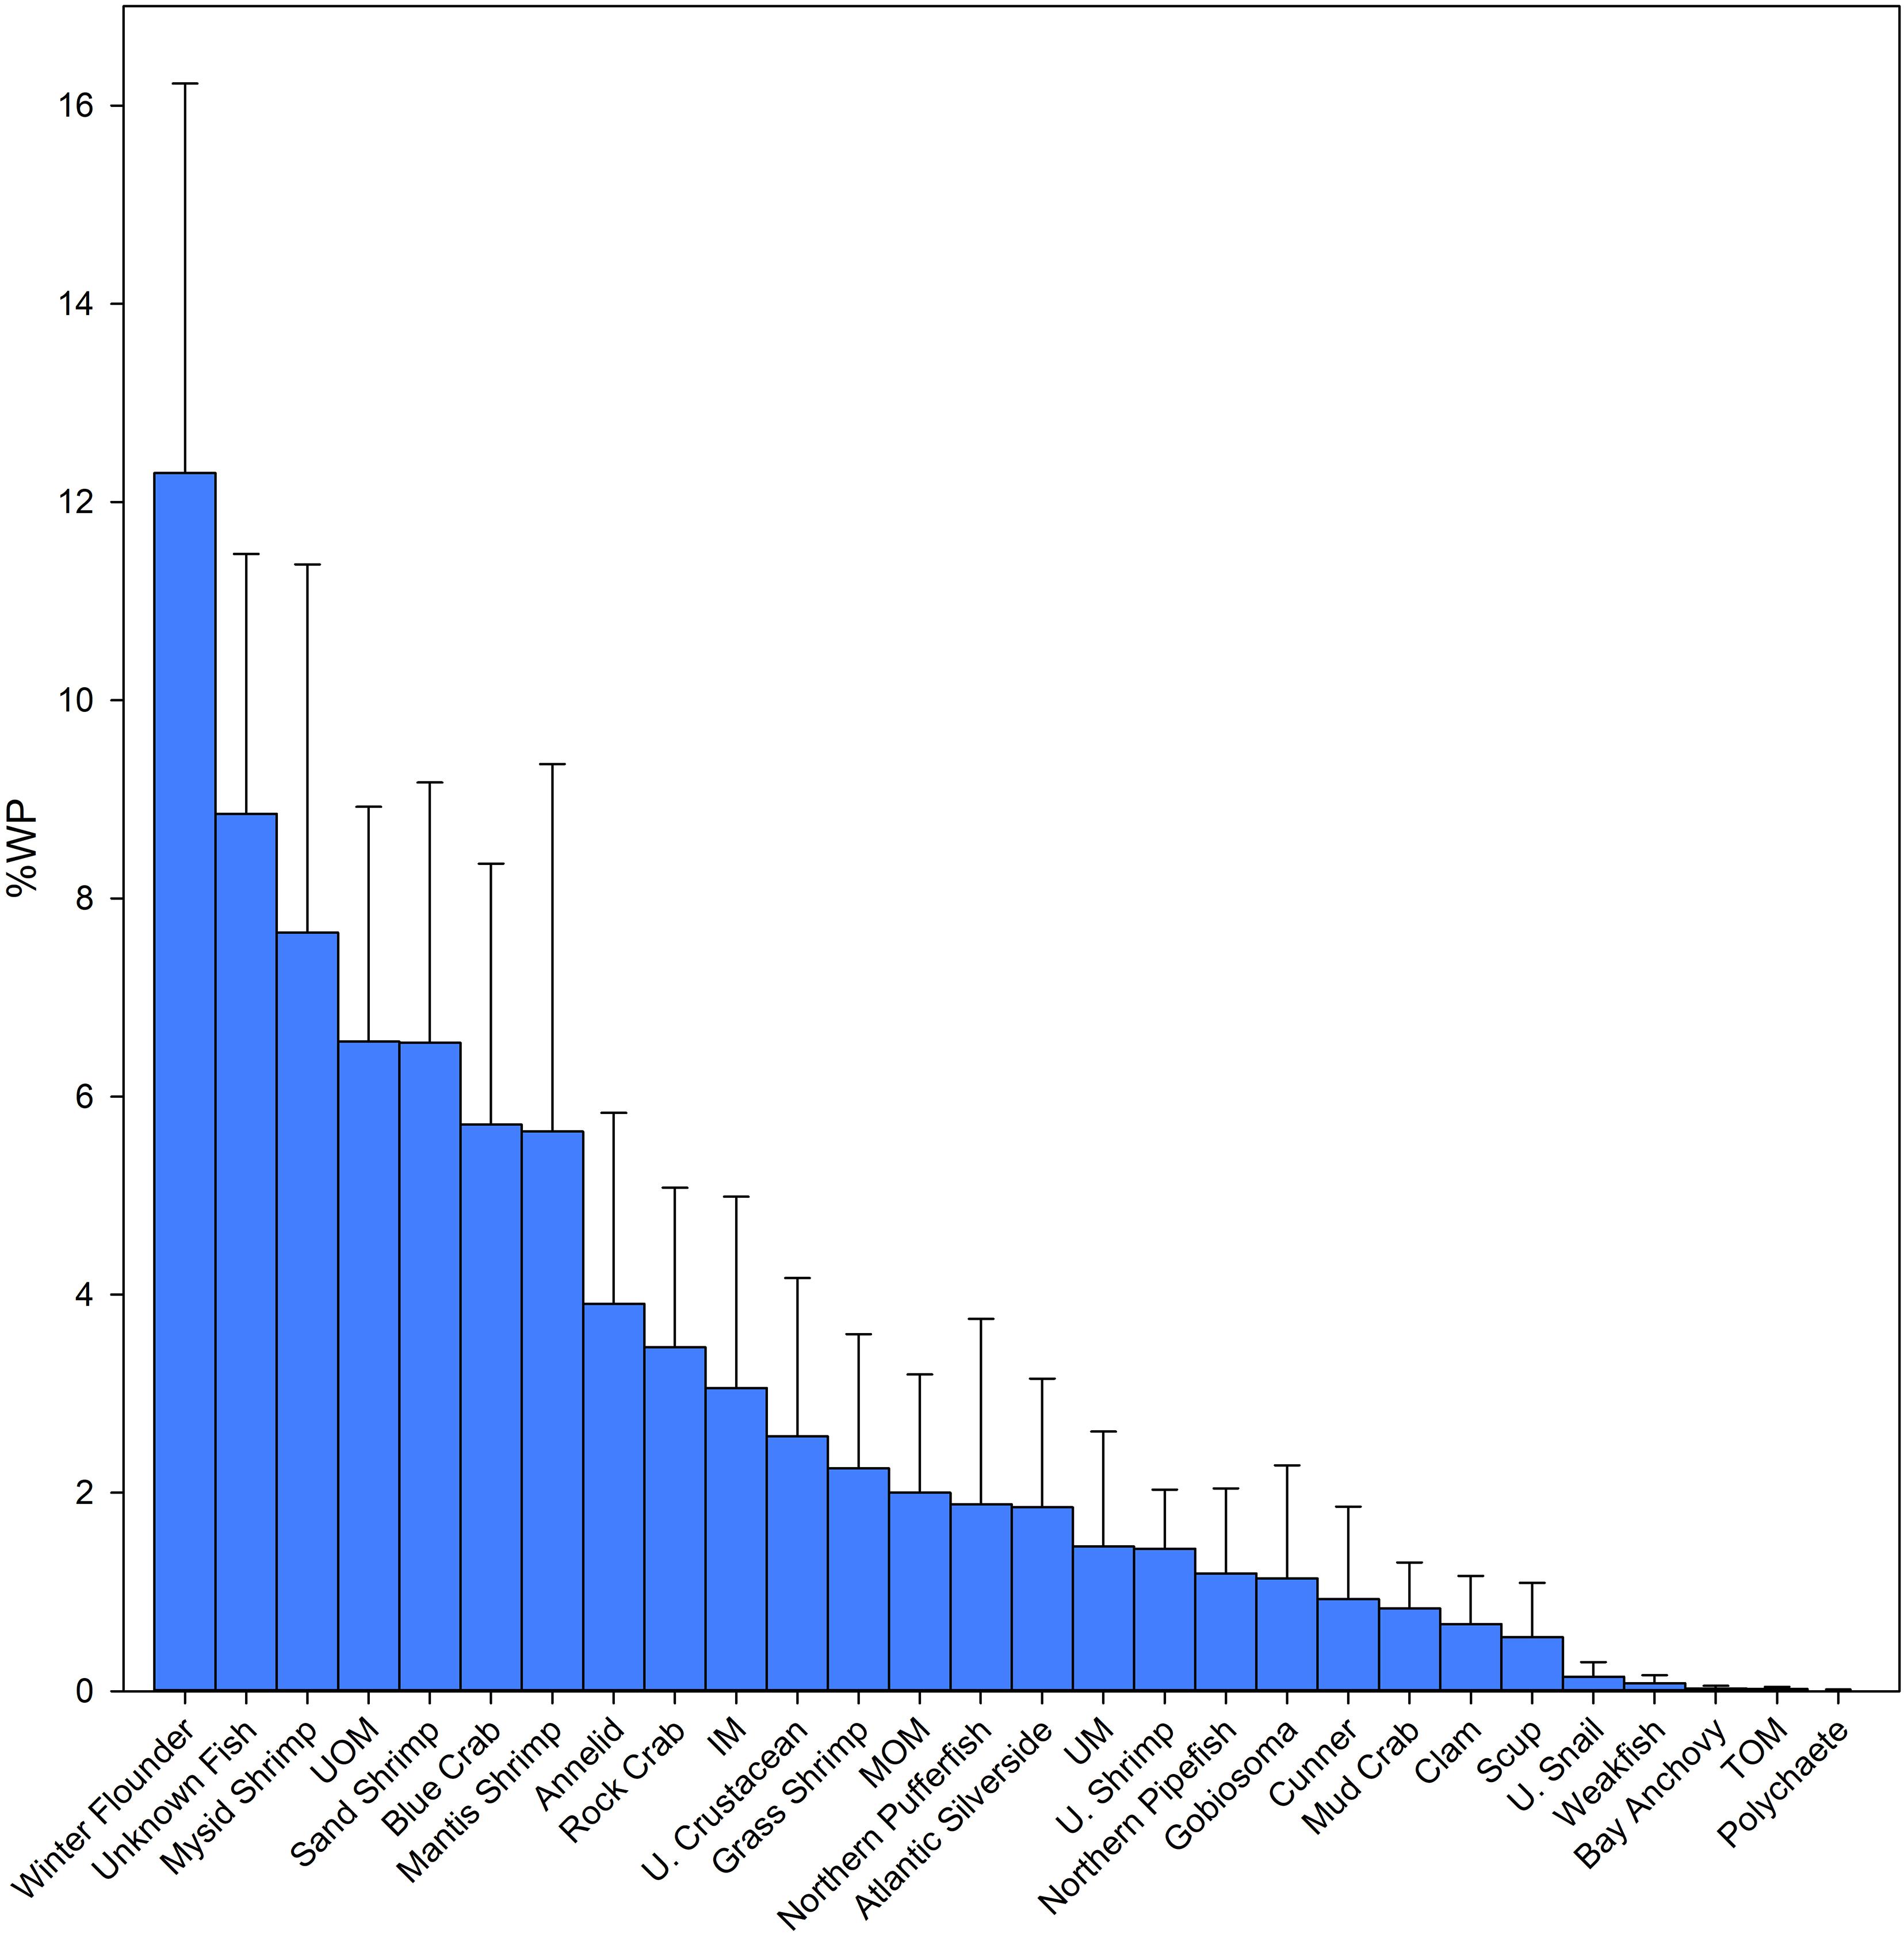
Figure 2. Diet composition in percent weight (Wp%) of summer flounder (Paralichthys dentatus) collected in Shinnecock Bay during the summer inshore migration of 2014, 2015, and 2016. Error bars represent standard deviation.
The sum of all MOM, TOM, and IM found in the stomachs of the studied summer flounder accounted for 5.1% (SD ± 2.3%) of stomach weight. Unidentified matter, which included UM, UOM and UF and is caused by the mechanical destruction of the prey items within the mouth and the digestive processes accounted for 16.9% (SD ± 3.7%) of the diet by weight. Of this group, UF accounted for 8.8% (SD ± 2.6%) of the diet by weight (Figure 2).
Winter flounder was present in the stomachs of 14 summer flounder, and its frequency of occurrence (O%) was surpassed only by Unknown Fish (O% = 22.7%) and Unidentified Organic Matter (O% = 17.0%). Winter flounder and sand shrimp had equal O%, which was the highest for all the identifiable prey items (15.9%). The second-most commonly occurring prey item was mysid shrimp (Neomysis spp.) accounting for 7.6% (SD ± 3.7%) of the diet by weight with an O% of 13.6%.
Factors Explaining Variance in Diet
Canonical correspondence analysis indicated that TL, month, year, dissolved oxygen, temperature, habitat, and bay region all had a significant effect as explanatory factors in the diet variance, whereas salinity and station did not. The cumulative percent variance explained by the canonical axis was 10.3%. The first, second and third canonical axes accounted for 48, 29, and 23% of the explained variation, respectively. Dissolved oxygen as well as the temporal variables (i.e., year and month) were more closely correlated to Axis 1 (Supplementary Figure C), which as expected, is influenced by seasonal changes and significantly correlated with month (Pearson product moment correlation, r =−0.298, p = 0.005). Habitat and TL were more closely correlated to Axis 2 (Supplementary Figures D,E) and bay region and temperature to Axis 3 (Figure 3). Water temperature in the western region of Shinnecock Bay was significantly higher on average than in the Eastern region of the bay (one-tailed T-test, p = 0.043).
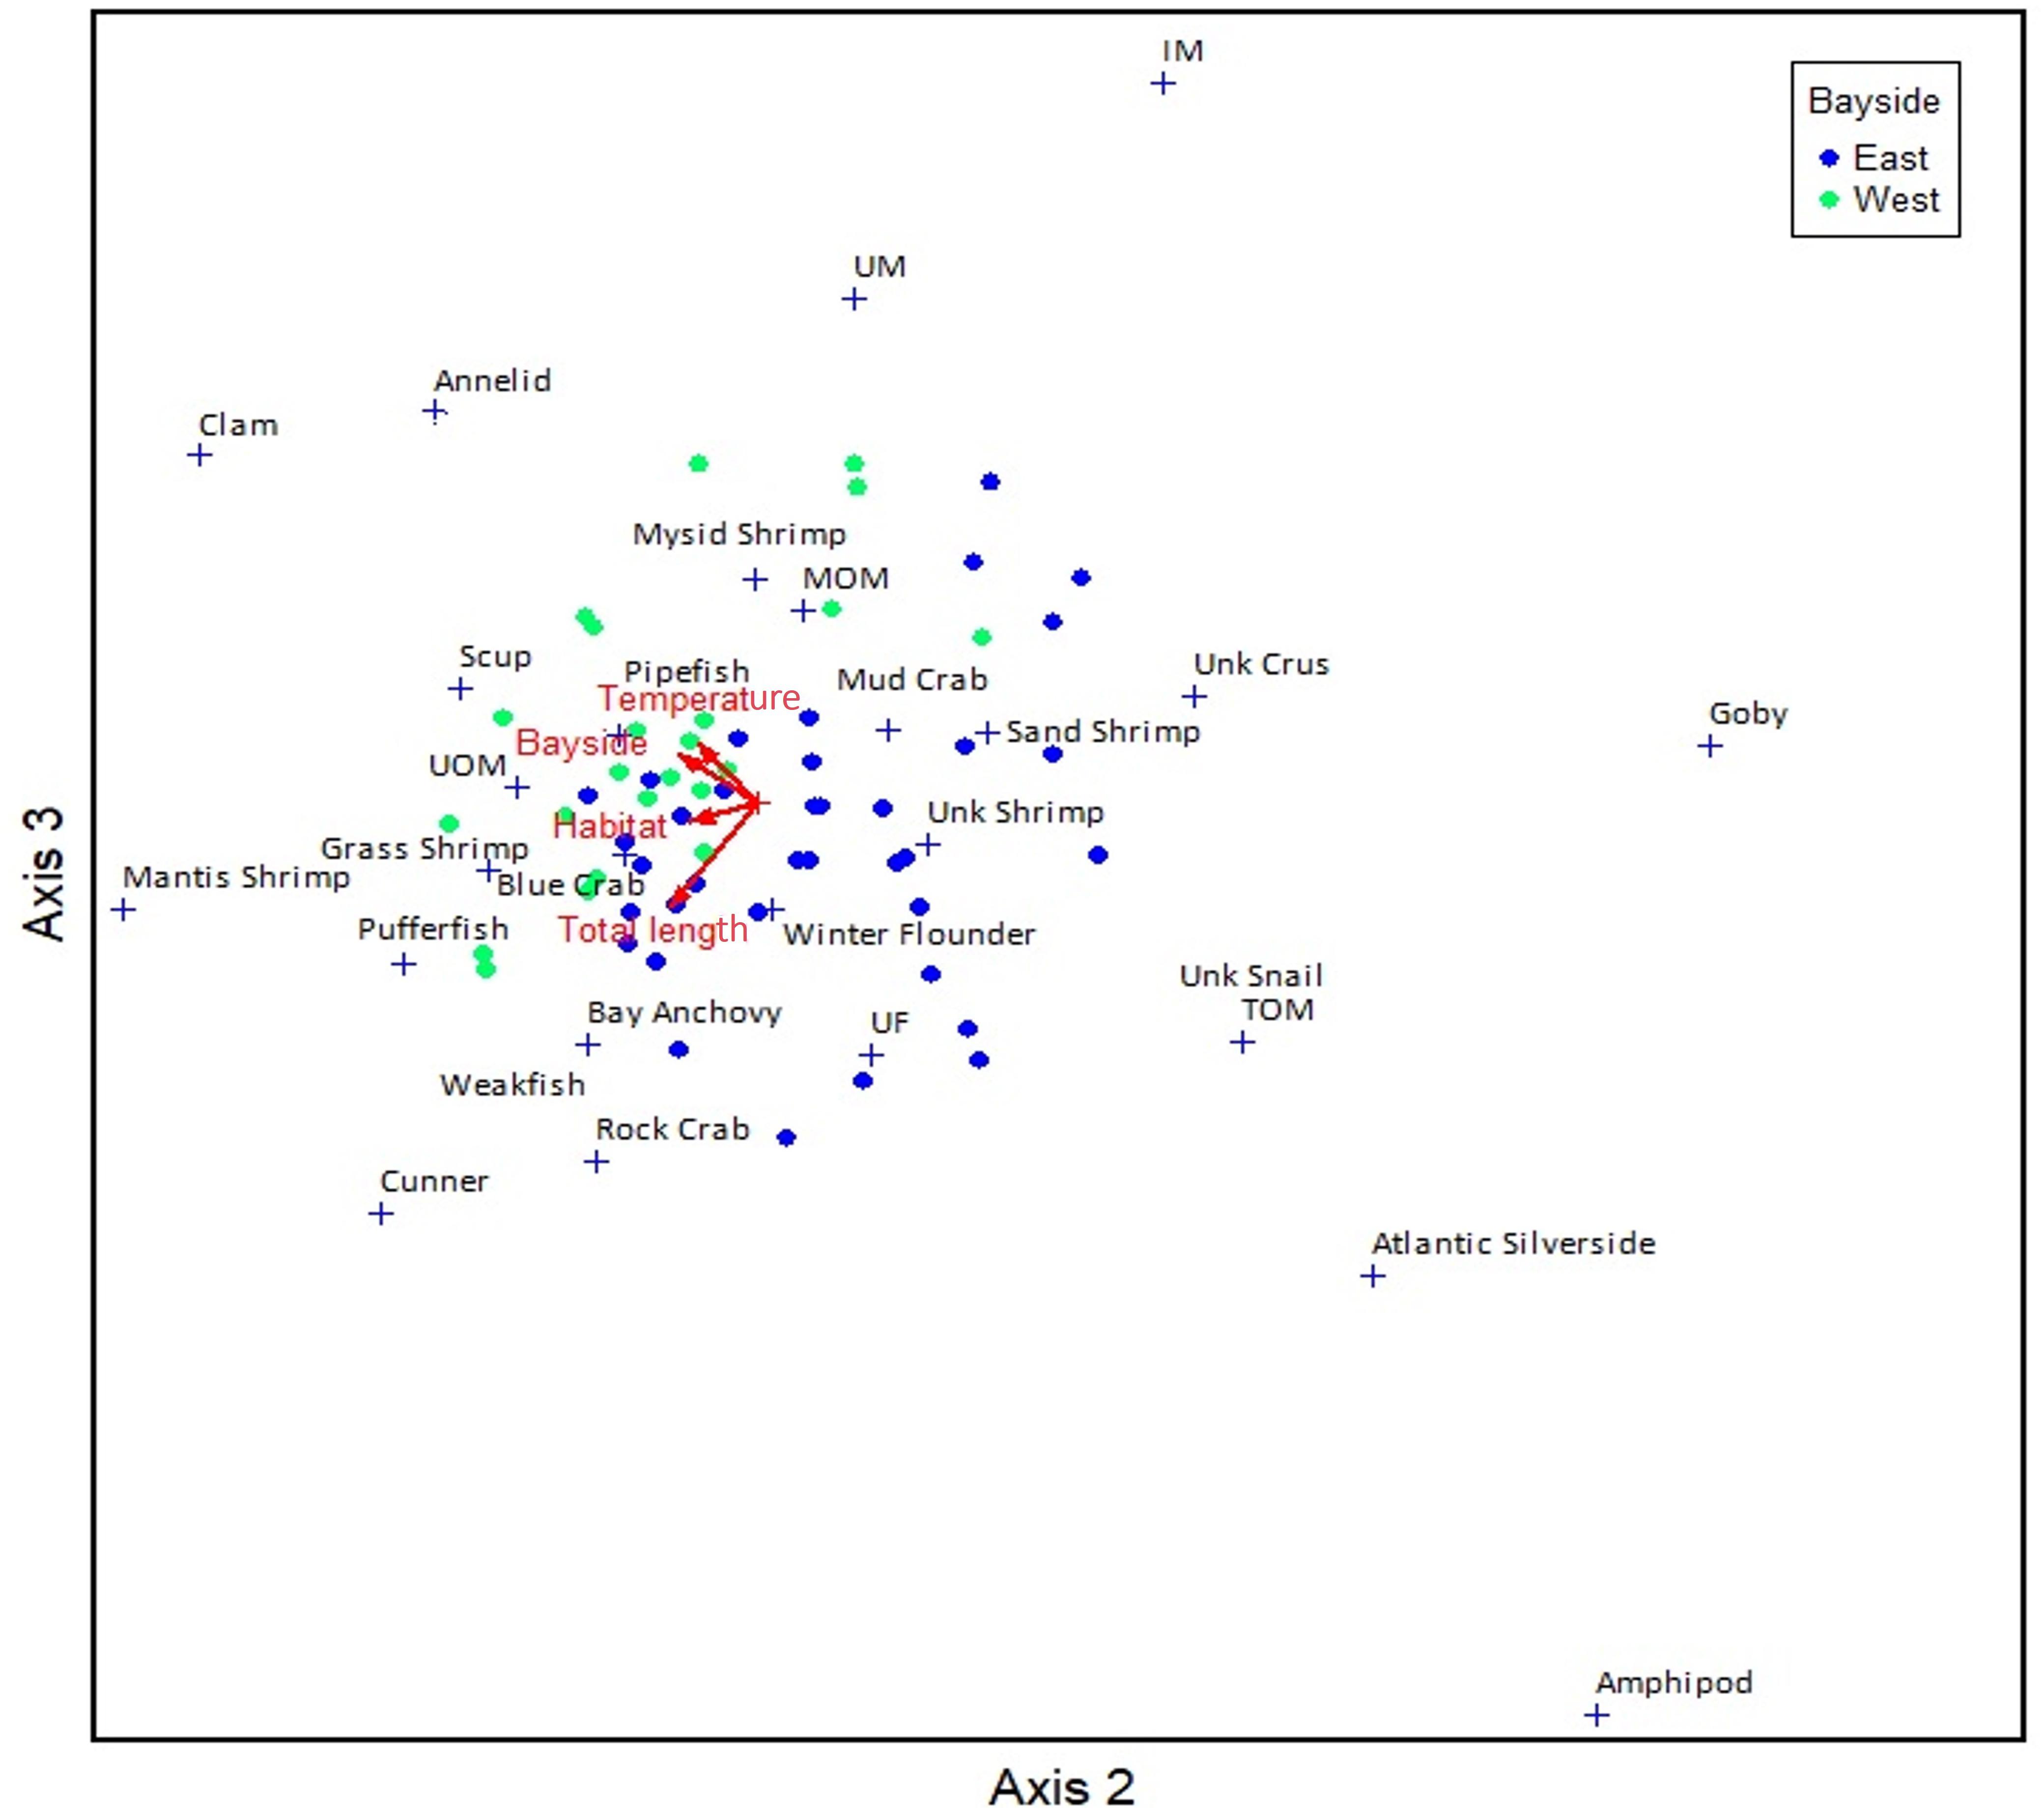
Figure 3. Canonical correspondence analysis (CCA) plot for Axis 2–3, color coded by Bay regions (East/West). Arrows represent significant explanatory factors; dots represent individual summer flounder and + symbols represent centroids of individual prey items
Variability Due to Size Changes
Summer flounder size significantly affected diet species richness and piscivory. Considering only the prey items that were identified to the genus or species level, small summer flounder (<225 mm) ingested five unique and identifiable prey items, medium-sized specimens (>225: <375 mm) had ingested 13 different prey items and large summer flounder (>375 mm) had 17 different prey items in their stomachs. The main prey items for small summer flounder were mysid shrimp and sand shrimp, which represented 20.5% (±16.3% SD) and 17.5% (±12. 1% SD) of the diet by weight, respectively. Invertebrates totaled 51.7% (±22. 3% SD), while teleosts accounted for only 2.2% (±2.1% SD) of their diet by weight. Unidentified fish were the only teleost group found in the stomachs of small summer flounder for any of the sampled years.
Winter flounder accounted for 22.4% (±8.1% SD) of the diet by weight for medium-sized summer flounder, followed by mysid shrimp with 8.1% (±4.4% SD). The main prey items of large-sized summer flounder were mantis shrimp and blue crabs, accounting for 13. 1% (±8.0% SD) and 10.8% (±5.4% SD) of the diet by weight. Winter flounder were also present in the stomachs of large summer flounder, accounting for 8.4% (±4.1% SD) of their diet by weight and being the third most important (by Wp%) prey item for large-sized summer flounder. In medium and large-sized summer flounder, UF had an important contribution to their diet composition (9.7 ± 4.6% SD and 10.9 ± 4.4% SD, respectively) (Figure 4). Other teleost species found in the stomachs of medium-sized summer flounder were Gobies (Gobiosoma spp.), Northern pipefish (Syngnathus fuscus) and Atlantic silversides. Teleost species present in large-sized summer flounder were similar to the medium-sized fish, but also included Northern puffer, Cunner (Tautogolabrus adspersus), Scup (Stenotomus chrysops), Weakfish and Bay anchovy (Anchoa mitchilli). Both medium and large-sized summer flounder had more teleosts in their diets (39.9 ± 10.3% SD and 30.0 ± 8.1% SD, respectively) when compared to small-sized summer flounder (2.2 ± 2.1% SD). Invertebrates were the main food source in large-sized summer flounder (42.2 ± 11.2% SD), but were secondary in the diet of medium-sized summer flounder (34.3 ± 8% SD).
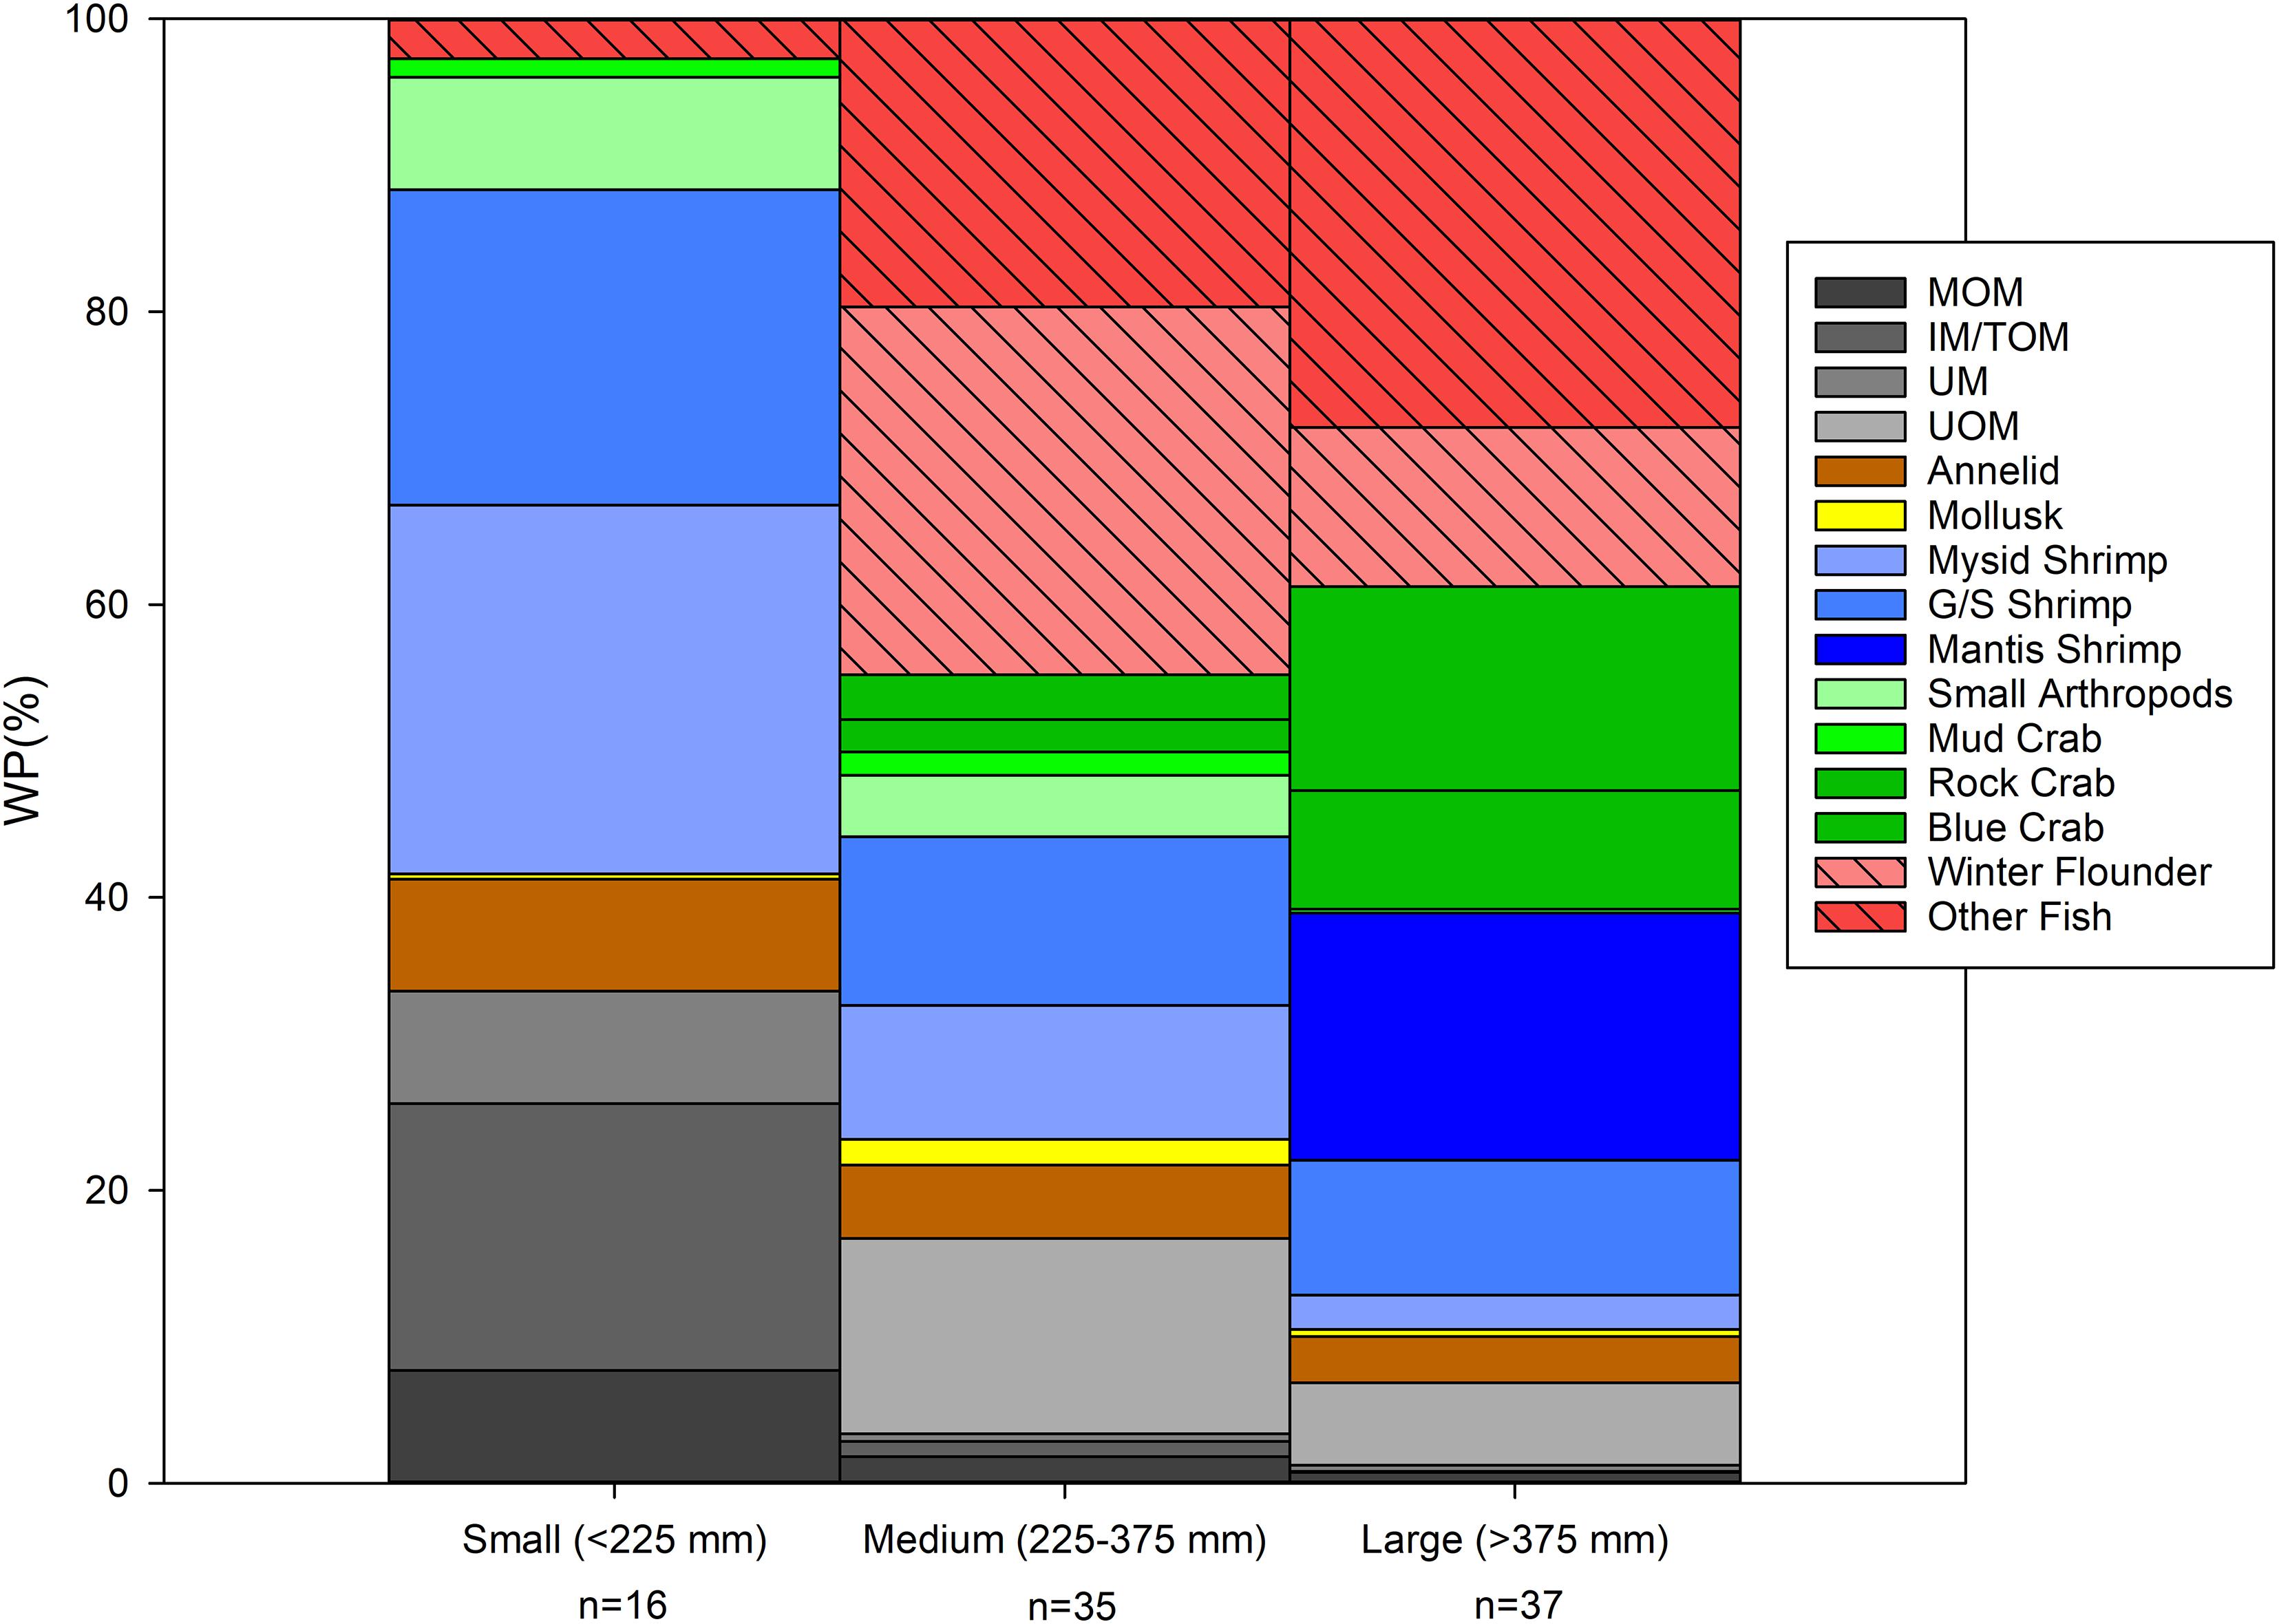
Figure 4. Diet composition (percent by weight) of summer flounder collected in Shinnecock Bay (2014–2016) by size class [small (<225 mm), medium (225–375 mm), and large (>375 mm)]. To ease graphic representation of the data, closely related prey items were grouped into higher taxonomic levels such as “other fish” or “small arthropods.”
Spatiotemporal Variability in Stomach Fullness and Diet Composition
Our results show an annual shift in the main prey item for summer flounder from blue crabs in 2014 (14.8 ± 6.5%) to winter flounder in 2015 and 2016 (15.3 ± 3.1 and 20.3 ± 9.1%, respectively). Secondary prey items for all years consisted of other invertebrates and unknown fish (Table 4). Changes in the diet composition followed trends in the relative abundance of prey items in Shinnecock Bay and reflected natural changes in species assemblage seen in the bay during the warmer months (ShiRP trawl survey data). Upon examination of winter flounder and blue crab CPUE from 2014 to 2016 of the sizes consumed by summer flounder (i.e., <100 mm), we would expect to see an increase in CPUE of winter flounder from 2014 to 2015, and similar values for 2015 and 2016; and a decrease in blue crab CPUE from 2014 to 2015 and 2016. The data followed the expected changes in CPUE for winter flounder but did not follow those assumptions for blue crab CPUE, which doubled from 2015 to 2016 (Table 5).
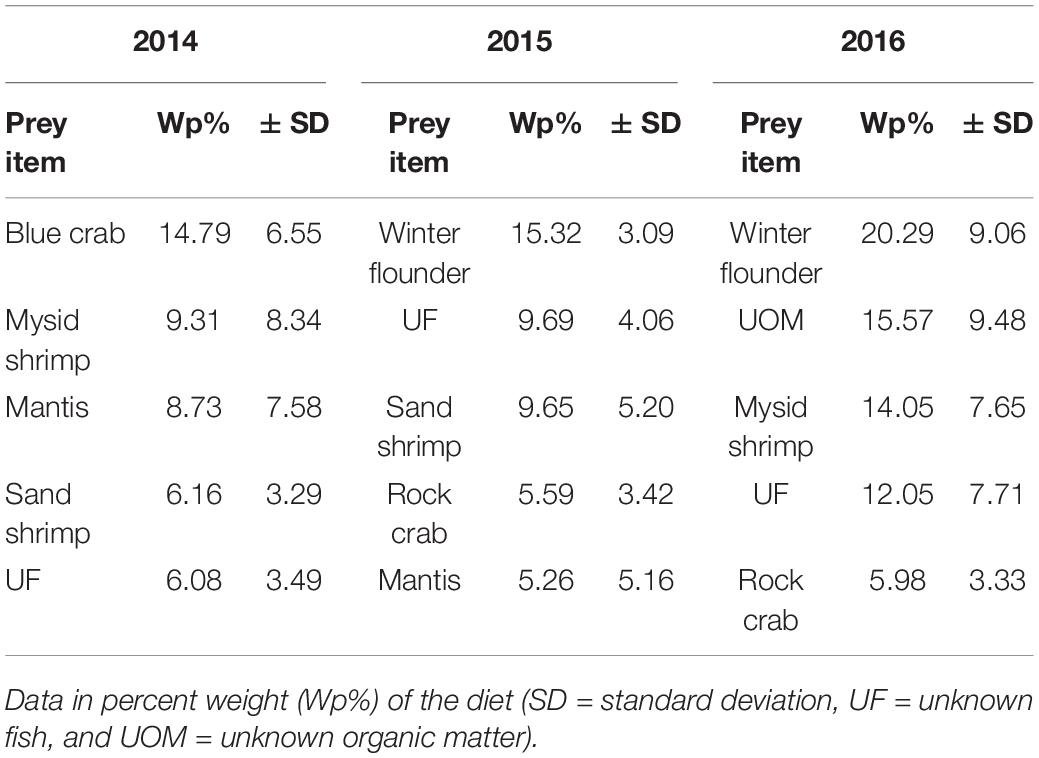
Table 4. Top five prey items for summer flounder collected in Shinnecock Bay based on sampling year.
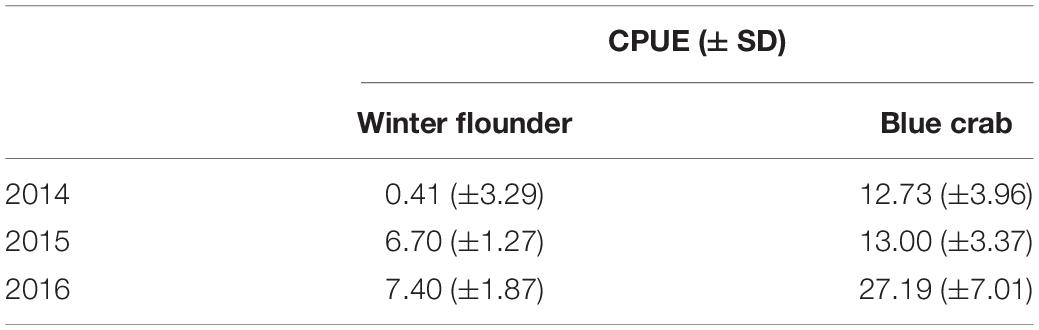
Table 5. Catch per unit effort (CPUE, number of individuals per hour trawled) for winter flounder (Pseudopleuronectes americanus) and blue crab (Callinectes sapidus) of the selected sizes for summer flounder predation (<100 mm) in Shinnecock Bay (SD = standard deviation).
Species richness in Shinnecock Bay was found to increase dramatically in the summer months (ShiRP trawl survey data). SF gut content diet variability reflects this with six different species found in gut contents in the month of June, 12 for the months of July and August, and seven for the month of September. During the month of June, grass shrimp (Palaemonetes spp.) and unknown small crustaceans were the main prey items of the total diet. In July the main prey items were winter flounder and mysid shrimp. Mantis shrimp and blue crabs were the main prey items in August. Finally, the main prey items for the month of September were unknown fish and blue crabs (Table 6).
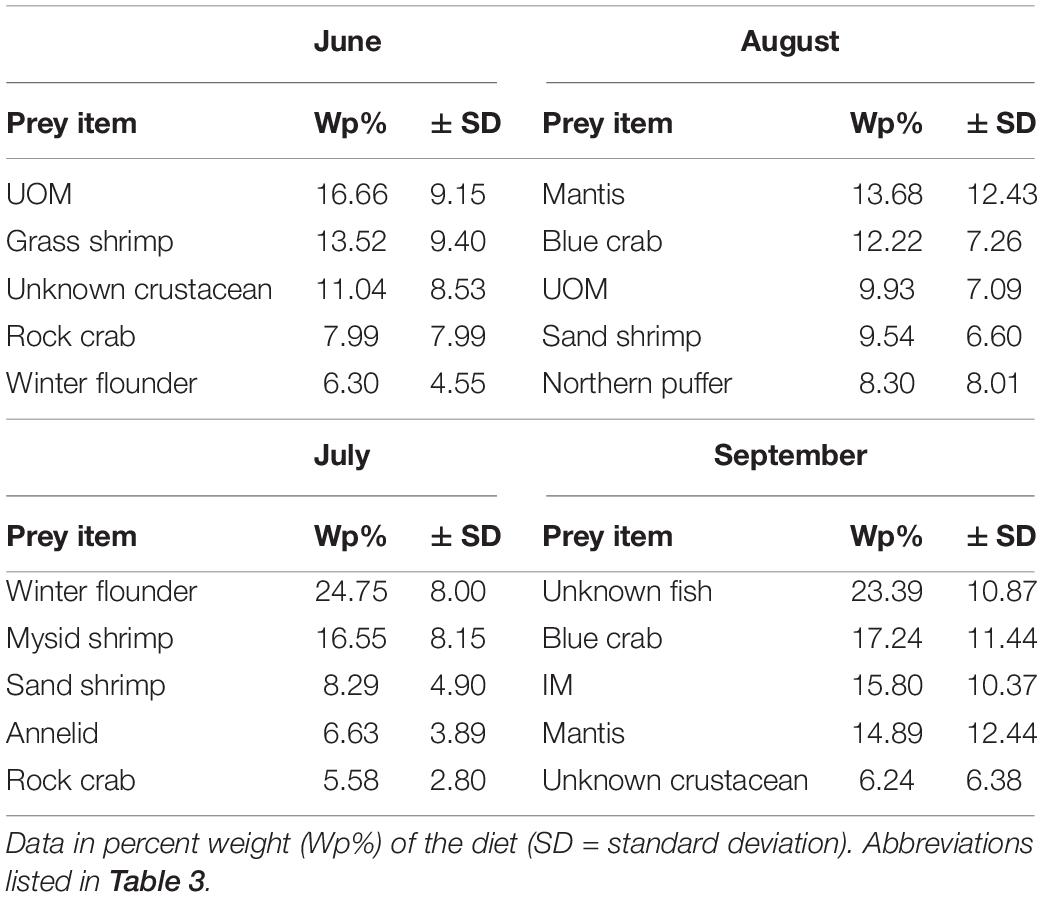
Table 6. Top five prey items for summer flounder collected in Shinnecock Bay (2014–2016) based on month.
Values for SFI of the summer flounder collected on the east region of the bay were identical to those on the western region and between habitat types (Supplementary Figure F). Summer flounder in the eastern region had significantly greater biomass of teleost in their diets (mean = 1.69 mg, median = 0.43 mg) compared to the western region (mean = 0.30 mg, median = 0.00 mg; Mann–Whitney Rank Sum Test, p < 0.001), but no significant differences were found in the total biomass of consumed invertebrates (Mann–Whitney Rank Sum Test, p = 0.855) (Figure 5). Similarly, the quantity of ingested teleosts and invertebrates were not significantly different across benthic habitats (Kruskal–Wallis one way analysis of variance on ranks; teleosts: H = 2.726, df = 2, p = 0.256; invertebrates: H = 0.883, df = 2, p = 0.643, Supplementary Figure G).
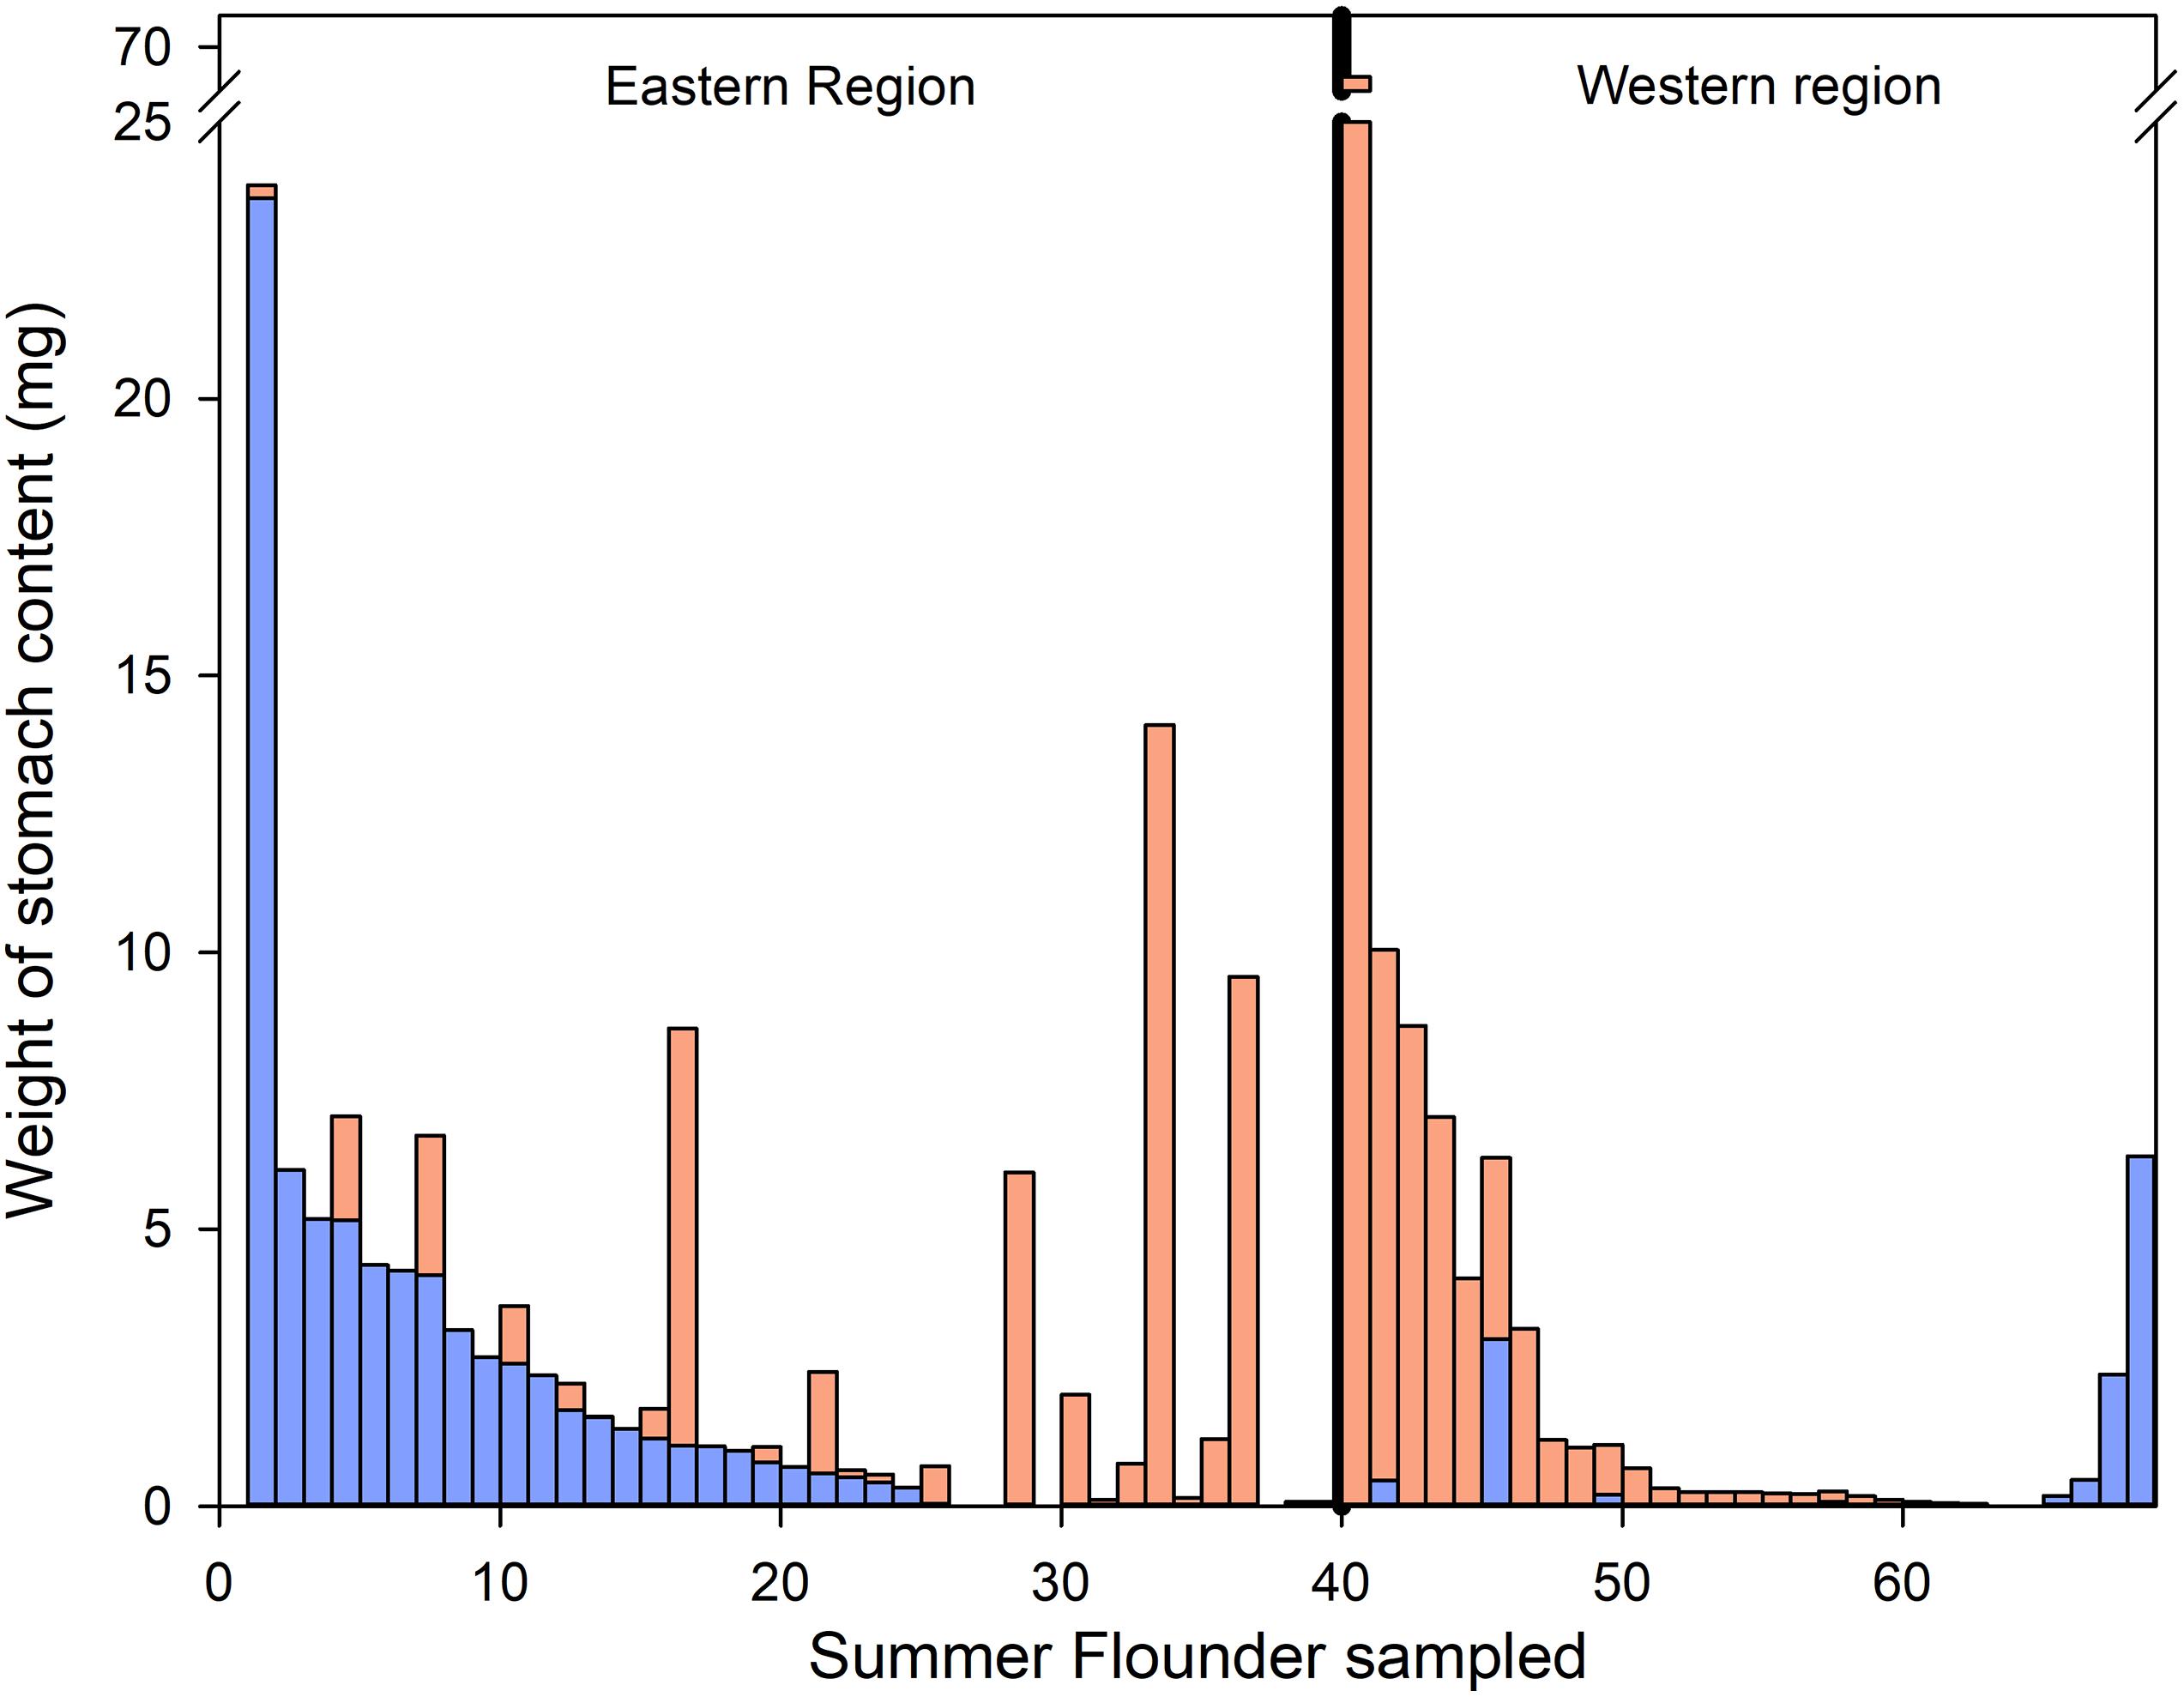
Figure 5. Weight of total teleost (blue) and invertebrate (orange) prey found in the stomach of the sampled summer flounder divided by bay region (eastern and western region).
General diet composition of summer flounder also exhibited variation based on the region of the bay, with teleosts dominating the diet composition by Wp% in the East and invertebrates dominating the diet composition on the western region (Table 7). The main prey items for summer flounder captured in the eastern region of the bay were winter flounder followed by unknown fish. The main prey items in the western region of the bay were mysid shrimp and mantis shrimp. Winter flounder ranked 5th in the diet of summer flounder collected in the western region of the bay (Table 7).
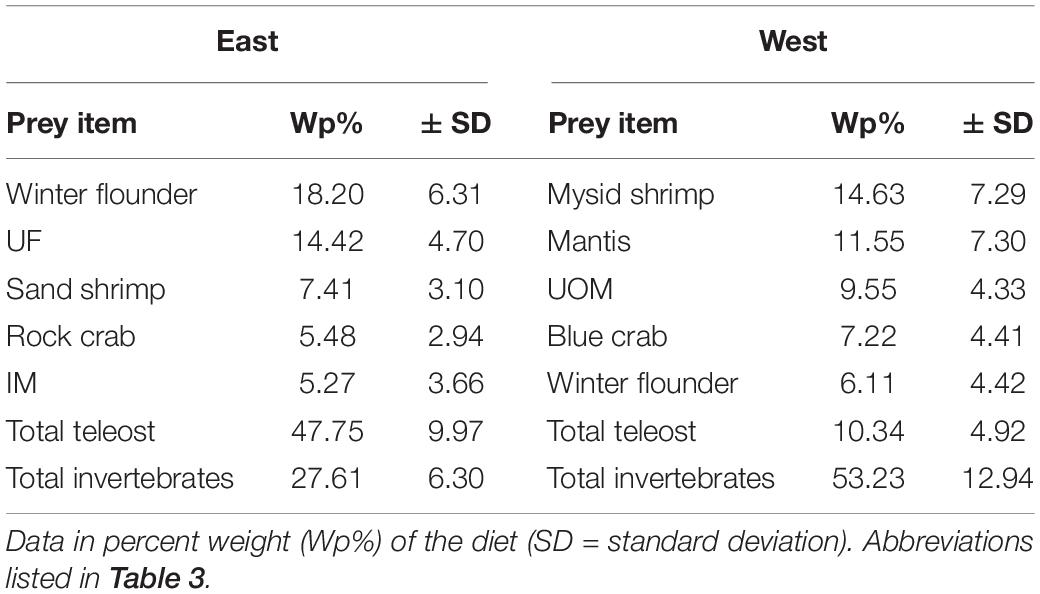
Table 7. Top five prey items for summer flounder collected in Shinnecock Bay based on bay region (East and West) and the total amount of teleost and invertebrates.
The contribution of prey to the diet of summer flounder varied based on habitat type, with similar contributions by teleosts and invertebrates in seagrass habitats (teleost: 35.7 ± 12.0% SD; invertebrates: 39.4 ± 12.6% SD), teleost dominated diets in sand habitats (teleost: 31.3 ± 14.5% SD; invertebrates: 26.30 ± 13.27% SD) and invertebrate dominated diets in mud habitats (teleost: 25.3 ± 7.5% SD; invertebrates: 45.3 ± 10.1% SD) (Supplementary Table B). The main prey items for summer flounder collected on seagrass habitats were unknown fish (15.9 ± 8.0% SD) and blue crab (13.5 ± 7.4% SD). Winter flounder was the third most important prey item (12.3 ± 7.0% SD). The main prey items for summer flounder collected on sand habitats were mysid shrimp (11.5 ± 8.8% SD) and northern puffer (10.4 ± 8.3% SD) and rock crabs (9.2 ± 7.9% SD). Winter flounder ranked fourth in their diet (9.1 ± 7.8% SD). The main prey items for summer flounder collected in mud habitats were winter flounder (13.4 ± 5.5% SD) and mantis shrimp (10.3 ± 4.8% SD).
Diet Preference
Among the 11 species used in the preference analysis, winter flounder had the highest score (α = 0.35) followed by blue crab and Atlantic rock crab (α = 0.18 and 0.10, respectively) when large and medium-sized SF data were pooled. The overall diet preference index for teleosts compared to macroinvertebrates (i.e., mantis shrimp, Atlantic rock crab, and blue crab) was estimated for large and medium-sized summer flounder. Large-sized summer flounder had preference values of α = 0.47 and 0.53 for teleost and invertebrates, respectively (Table 3). Medium-sized summer flounder had a preference score of α = 0.87 and 0.13 for teleost and invertebrates, respectively. Preference indices were not calculated for the small summer flounder, since the items that comprise their stomach content were not sampled in the ShiRP trawl due to their small size.
Discussion
Abiotic and Biotic Factors Influencing Summer Flounder Diet Composition
Stomach fullness analysis revealed that, although summer flounder collected in the eastern and western regions of the bay were equally full, samples from the e astern region of Shinnecock Bay displayed a significantly greater contribution of teleosts in their diet than those from the western region. East to West changes in the bay were also significantly associated with higher diet species richness, where summer flounder collected in the e astern region of Shinnecock Bay exhibited more diverse diets. Due to its predatory plasticity, summer flounder were able to adapt to the prey community changes in the western region of the bay by thriving on a different array of prey than in the eastern region, such as macroinvertebrates. Our results align with previous research done on another generalist demersal piscivorous species, the Spotted seatrout (Cynoscion nebulosus), where shifts in diet composition and species richness were observed to correlate with habitat degradation and loss of seagrass coverage (Hall-Scharf et al., 2016).
Summer flounder captured during the late spring-early fall seasons had a taxonomically diverse diet as expected for this opportunistic predator (Witting et al., 2004; Staudinger and Juanes, 2010) with more than 28 different prey types identified in their stomachs. Our results show significant seasonal changes among the main prey items, where higher predation levels on fish species and mysid shrimp occurred during the warmest months of the sampling season whereas feeding on sand shrimp, mud crabs, and blue crabs dominated during cooler months. Despite the effect of season (month and temperature) on the diet composition variability of summer flounder found in our CCA results as well as in previous studies (Latour et al., 2008), there was no significant correlation in the species richness of the diet based on month or temperature in Shinnecock Bay (Spearman Rank Order Correlation, p > 0.05).
Canonical correspondence analysis showed significant changes in the diet variability of summer flounder due to fish TL. Similarly, there were significant differences in the species richness of summer flounder diet based on length, with large summer flounder exhibiting a more diverse diet than small-sized summer flounder. Although the low species richness in small summer flounders could have been driven by our small sample size, these results align with previous studies in which small summer flounder, similarly to other fish species, have a diet consisting primarily of small invertebrates such as polychaetes and mysid shrimp (Burke, 1995; Nye et al., 2011, Sánchez-Hernández et al., 2019) and experience a transition toward a more diverse and piscivorous diet at around 225 mm (Buchheister and Latour, 2011; Taylor and Gervasi, 2017). Off-shore studies on the diet composition of summer flounder found increased predation on invertebrates with larger summer flounder length but limited to soft bodied species such as squid (Link et al., 2002). Previous studies carried out in estuarine systems or laboratory conditions (Witting et al., 2004; Latour et al., 2008) have reported a significant ontogenetic increase in piscivory in summer flounder, but our results tell a different story for Shinnecock Bay.
It has been previously reported that summer flounder have a preference for demersal species such as winter flounder or mummichog (Fundulus heteroclitus) versus other possible pelagic prey such as squid or Atlantic silverside (Manderson et al., 2000; Staudinger and Juanes, 2010). Our results show that summer flounder preference for teleost species decreases with size in this estuary. Medium-sized summer flounder had higher levels of piscivory than large-sized summer flounder. Larger summer flounder supplemented their diets with larger crustaceans such as blue crabs and mantis shrimp. While blue crabs were present in the diet of both medium and large flounders, mantis shrimp were only consumed by large summer flounder. The ontogenic shift in diet preference from medium to large summer flounder was confirmed when examining our diet preference index results (α). Medium-sized summer flounder preferred teleost species and selected against macroinvertebrates whereas large-sized summer flounder had almost equal preference index for both groups.
Multiple studies demonstrate that the diet composition of summer flounder is influenced by factors such as habitat sampled or TL of the samples collected. The main prey items are usually invertebrates, such as mysid shrimp (Buchheister and Latour, 2011), sand shrimp (Manderson et al., 2000; Sagarese et al., 2011), or small teleosts such as Atlantic silverside or Bay anchovy (Rountree and Able, 1992; Manderson et al., 2004). Our diet composition results generally agree with these studies and reflect a typical diet structure for a generalist predator, except for the role of winter flounder as the main prey species.
Importance of Winter Flounder as Prey
Winter flounder is a known prey item for summer flounder in estuarine systems (Poole, 1964; Manderson et al., 2000), but only our study and a recently published study in New England (Taylor et al., 2019) have reported winter flounder as the most important (% by weight and % frequency, respectively) prey item for summer flounder. Previous research in Great South Bay (New York) reported sand shrimp as the main prey item for summer flounder, and winter flounder as the secondary prey item (Poole, 1964). Similar to our results, the study reported annual shifts in the importance of winter flounder and blue crabs as secondary prey items (Poole, 1964). Although variability in the diet composition is not direct proof of selection toward specific prey items, our diet preference index estimates and CPUE data from Shinnecock Bay suggest that summer flounder prefer winter flounder above blue crabs or any other prey items available. Laboratory feeding experiments have also demonstrated a strong preference toward winter flounder against other pelagic fish or benthic invertebrates (Manderson et al., 2000). Thus, our data suggest that summer flounder will shift toward a diet focused on blue crabs only during years when YOY winter flounder recruitment is low.
Previous research in Great South Bay, Port Jefferson Harbor, and Shinnecock Bay estuaries, found similar results on the main species of invertebrates consumed, but completely different teleost compositions in the diets, with sand lance (Ammodytes spp.) and scup being the main prey fish species (Sagarese et al., 2011). Importantly, their sampling season (May-October) and summer flounder TL range (260–649 mm) were similar to that in our study. Thus, our results on the importance of winter flounder in the diet of summer flounder agree with the results originally reported locally more than 50 years ago (Poole, 1964) and disagree with those within Long Island estuaries at a more recent time (2011). This disparity likely reflects local fluctuations in the biomass of the prey species, leading to significant differences in the diet composition of summer flounder (Sagares and Frisk, 2011).
Taking into consideration that New York estuaries support genetically distinct groups of winter flounder (Sagarese and Frisk, 2011; O’Leary et al., 2013), local differences within neighboring estuaries could be caused by summer flounder feeding on two different stocks of winter flounder. The winter flounder stock residing in Shinnecock Bay, although also experiencing high YOY mortality, is one of the healthiest in Long Island, New York (McElroy et al., 2015; Frisk et al., 2018). This likely explains why they are more abundant in the diet of summer flounder collected in Shinnecock Bay than in Great South Bay within New York, and more abundant in New York than estuaries farther south at the edge of winter flounder range (i.e., Chesapeake Bay, Great Bay-New Jersey or Palmico Sound–North Carolina) (Rountree and Able, 1992; Burke, 1995, Latour et al., 2008; Buchheister and Latour, 2011, Sagarese et al., 2011).
Conclusions and Management Implications
Due to Shinnecock Bay’s hydrodynamics and upland urban development distribution, this New York estuary provides an excellent case study for the effects environmental degradation may have on its finfish community, and the results drawn from this research can be generalized to many other estuaries of similar characteristics.
Our results provide evidence of reduced teleost biomass and species richness in the diets of summer flounder captured in the western region of Shinnecock Bay. These results are consistent with reduced teleost biomass and species richness in the western region of Shinnecock Bay, likely caused by environmental degradation, poor water, and reduced seagrass habitat, which have affected the diet composition of summer flounder. We also show how those parameters improved in the eastern region due to its proximity to Shinnecock Inlet and reduced anthropogenic influence. Summer flounder in this region therefore modified their diet by consuming other prey items. It also can be inferred from our results that summer flounder, and by default, other fish species with similar trophic plasticity, are able to adapt and outcompete other piscivorous species that are more trophically limited. Other piscivorous species whose adults have limited predatory plasticity such as striped bass or bluefish (Manooch, 1973; Hartman and Brandt, 1995), would have to limit their habitat range to the more pristine eastern region of the bay, which in turn would increase intra- and inter-specific competition (Byström et al., 1998). These results offer a window into the impacts and changes driven by anthropogenic habitat degradation and provide a critical understanding into the trophic structure of these changing ecosystems to support the development of future ecosystem-based management plans. Similar trophic behavior has been previously reported on juvenile Pacific salmon (Oncorhynchus spp.) in degraded habitats within Puget Sound (Munsch et al., 2015). Thus, summer flounder have the capacity to not only adapt to ecosystems with a changing prey pool and diminished teleost prey biomass, but also have the potential to benefit from decreased interspecific competition and predator mortality. These potential benefits are most likely offset by the increased water turbidity associated with lower water quality conditions, which affects any predators relying on visual acuity for food foraging as well as the cost of consuming alternative diets with potentially lower nutritional values.
Annual fluctuations in summer flounder population can lead to changes in the trophic structure of the bay, especially due to the plasticity and efficiency of this opportunistic predator (Witting et al., 2004; Staudinger and Juanes, 2010). Predatory pressure exerted by piscivorous fish can affect recruitment and hinder the recovery of prey species experiencing a general decline in their stocks (Bailey, 2000) due to overfishing or environmental factors (Bell et al., 2014). One of those affected species is winter flounder, which its Southern New England stock crashed in 1990 (NEFSC, 2015) due to overfishing, and despite management efforts and changes to regulations, the population still has not recovered (DeLong et al., 2001; O’Leary et al., 2013).
Due to its small length at settlement, macroinvertebrates and piscivorous fish heavily consume YOY winter flounder (Witting and Able, 1993; Manderson et al., 2004 and Collier et al., 2014). Winter flounder settle at a smaller standard length than summer flounder (7.8 and 13 mm, respectively) and have lower burying and swimming capabilities (Keefe and Able, 1994; Phelan et al., 2001). Crustaceans such as sand shrimp and blue crab have been shown to consume winter flounder during settlement, but mortality due to these invertebrate species quickly becomes negligible as winter flounder reach lengths larger than 20 and 50 mm for sand shrimp and blue crabs, respectively (Witting and Able, 1995; Collier et al., 2014). YOY winter flounder present size refuge from invertebrate predation but become vulnerable to summer flounder in estuaries during the late spring-early fall seasons (Able and Fahay, 1998; Capossela et al., 2013).
Young-of-year mortality is an important factor in stock recruitment and even small amounts of predation at these life stages can become a population bottleneck (Bailey, 2000; Doherty et al., 2004). Our results are consistent with high YOY winter flounder (>50 mm) mortality caused by summer flounder predation in northwest Atlantic estuaries. This may be a factor in aggravating the observed decline in winter flounder stocks (NEFSC, 2008a; Sagarese and Frisk, 2011; O’Leary et al., 2013). In accordance with our results, a recent study has found a significant inverse correlation between winter flounder productivity and summer flounder abundance in southern New England/Mid-Atlantic region (Frisk et al., 2018).
Study Limitations and Future Work
We acknowledge that the benthic trawling gear selectivity and methodology used during the ShiRP trawl surveys might have underestimated the biomass of small fish species, blue crabs and other small invertebrates. We were restricted from sampling in shallower areas or salt marshes within the bay and by the mesh size of the cod end. As a result, our biomass estimates and selectivity results need to be interpreted carefully. Additionally, a portion of the stomach contents of the summer flounder studied was classified as unidentified fish. Unfortunately, identification via molecular analysis and metabarcoding of these unidentified fish samples found in the stomachs was not possible here (Miya et al., 2015). However, these results did not influence the total piscivory assessments and still reveal the importance of YOY winter flounder to the overall diets of SF.
From a management perspective, future work should be expanded to assess the gut contents of summer flounder residing in adjacent or nearby estuaries, such as Peconic, Moriches, or Great South Bay to assess possible differences in diet among bays and general trends for the whole area. As this is a regionally important species whose population mix during its oceanic migration, understanding trophodynamics in local estuaries is prudent for ecosystem-based fisheries management (e.g., Pikitch et al., 2004). In-shore summer flounder bioenergetic models could also provide a better understanding of the potential effect this fish has on YOY winter flounder mortality (Hartman, 2003) Although gut content analysis offers an important snapshot of the diet of specimens, stable isotope analyses are also recommended, as they provide integrated data that can span from a few days (liver) to months (muscle) or years (bone or scales) (Buchheister and Latour, 2011). Future studies should integrate stable isotope data to provide a better understanding of the long-term differences in diet composition among specimens and provide more robust evidence of any differences among bays.
Data Availability Statement
The raw data supporting the conclusions of this article will be made available by the authors, without undue reservation.
Ethics Statement
The animal study was reviewed and approved by the Stony Brook University, Institutional Animal Care and Use Committee (IACUC) Project approved under IRBNet #: 573953 Project Title: Multidisciplinary ecological characterization of summer flounder (Paralichthys dentatus) in Shinnecock Bay; use of the Bay, trophic interactions, predatory pressure and management implications. Fisheries survey and sample collection permitted by New York State Department of Environmental Conservation (NYSDEC) License to collect or posses: scientific. Project approved under LCPSci#1713.
Author Contributions
SC-M designed, carried out the experiment, analyzed the data, and wrote the manuscript with support from KJR, JAN, and MGF. EKP supervised the project. All authors contributed to the article and approved the submitted version.
Funding
This work was primarily supported by the Laurie Landeau Foundation, LLC and the Simons Foundation as part of the Shinnecock Bay Restoration Program (ShiRP) and the Institute for Ocean Conservation Science.
Conflict of Interest
The authors declare that the research was conducted in the absence of any commercial or financial relationships that could be construed as a potential conflict of interest.
Acknowledgments
The authors would like to thank the staff of the Stony Brook Southampton Marine Station, the crew of the R/V Shinnecock and Alfredo Esposito and Maria Grima for their invaluable help in the laboratory and field, Christine Santora for her effective management of the Shinnecock Bay Restoration Program, and Bob Maze and Laurie Landeau for their encouragement and support, which made this work possible.
Supplementary Material
The Supplementary Material for this article can be found online at: https://www.frontiersin.org/articles/10.3389/fmars.2021.632751/full#supplementary-material
References
Able, K. W., and Fahay, M. P. (1998). First Year In The Life Of Estuarine Fishes In The Middle Atlantic Bight. New Brunswick, NJ: Rutgers University Press.
Able, K. W., and Kaiser, S. C. (1994). Synthesis of Summer Flounder Habitat Parameters. Science For Solutions, Noaa Coastal Ocean Program. Silver Springi, MD: NOAA Coastal Ocean Office, 68.
Anderson, D. M., Fensin, E., Gobler, C. J., Hoeglund, A. E., Hubbard, K. A., Kulis, D. M., et al. (2021). Marine harmful algal blooms (HABs) in the united states: history, current status and future trends. Harmful Algae 102:101975. doi: 10.1016/j.hal.2021.101975
Bailey, K. M. (2000). Shifting control of recruitment of walleye pollock theragra chalcogramma after a major climatic and ecosystem change. Mar. Ecol. Prog. Ser. 198, 215–224. doi: 10.3354/meps198215
Bell, R. J., Hare, J. A., Manderson, J. P., and Richardson, D. E. (2014). Externally driven changes in the abundance of summer and winter flounder. ICES J. Mar. Sci. J. du Conseil 71, 2416–2428. doi: 10.1093/icesjms/fsu069
Bilkovic, D. M., and Roggero, M. M. (2008). Effects of coastal development on nearshore estuarine nekton communities. Mar. Ecol. Prog. Ser. 358, 27–39. doi: 10.3354/meps07279
Bochenek, E. A., Powell, E. N., DePersenaire, J., and King, S. E. (2010). Evaluating catch, effort, and bag limits on directed trips in the recreational summer flounder party boat fishery. Mar. Coast. Fish. 2, 412–423. doi: 10.1577/c09-050.1
Boehlert, G. W., and Mundy, B. C. (1988). Roles of behavioral and physical factors in larval and juvenile fish recruitment to estuarine nursery areas. Am. Fish. Soc. Sympos. 3, 1–67.
Buchheister, A., and Latour, R. J. (2011). Trophic ecology of summer flounder in lower chesapeake bay inferred from stomach content and stable isotope analyses. Trans. Am. Fish. Soc. 140, 1240–1254. doi: 10.1080/00028487.2011.618364
Buckel, J. A., Conover, D. O., Steinberg, N. D., and McKown, K. A. (1999). Impact of age-0 bluefish (Pomatomus saltatrix) predation on age-0 fishes in the hudson river estuary: evidence for density-dependent loss of juvenile striped bass (Morone saxatilis). Can. J. Fish. Aqua. Sci. 56, 275–287. doi: 10.1139/f98-173
Buonaiuto, F. S. Jr., Bokuniewicz, H. J., and FitzGerald, D. M. (2008). Principal component analysis of morphology change at a tidal inlet: shinnecock inlet, New York. J. Coast. Res. 24, 867–875. doi: 10.2112/06-0739.1
Burke, J. S. (1995). Role of feeding and prey distribution of summer and southern flounder in selection of estuarine nursery habitats. J. Fish Biol. 47, 355–366. doi: 10.1111/j.1095-8649.1995.tb01905.x
Byström, P., Persson, L., and Wahlström, E. (1998). Competing predators and prey: juvenile bottlenecks in whole-lake experiments. Ecology 79, 2153–2167. doi: 10.1890/0012-9658(1998)079[2153:cpapjb]2.0.co;2
Capossela, K. M., Fabrizio, M. C., and Brill, R. W. (2013). Migratory and within-estuary behaviors of adult summer flounder (paralichthys dentatus) in a lagoon system of the southern mid-atlantic bight. Fish. Bull. 111, 189–201. doi: 10.7755/fb.111.2.6
Carroll, J., Gobler, C. J., and Peterson, B. J. (2008). Resource-restricted growth of eelgrass in New York estuaries: light limitation, and alleviation of nutrient stress by hard clams. Mar. Ecol. Prog. Ser. 369, 51–62. doi: 10.3354/meps07593
Chesson, J. (1978). Measuring preference in selective predation. Ecology 59, 211–215. doi: 10.2307/1936364
Chesson, J. (1983). The estimation and analysis of preference and its relationship to foraging models. Ecology 64, 1297–1304. doi: 10.2307/1937838
Collier, J. L., Fitzgerald, S. P., Hice, L. A., Frisk, M. G., and McElroy, A. E. (2014). A new PCR-based method shows that blue crabs (Callinectes sapidus (rathbun)) consume winter flounder (pseudopleuronectes americanus (walbaum)). PloS one 9:e85101. doi: 10.1371/journal.pone.0085101
DeLong, A. K., Collie, J. S., Meise, C. J., and Powell, J. C. (2001). Estimating growth and mortality of juvenile winter flounder, pseudopleuronectes americanus, with a lengthbased model. Can. J. Fish. Aqua. Sci. 58, 2233–2246. doi: 10.1139/f01-162
Doherty, P. J., Dufour, V., Galzin, R., Hixon, M. A., Meekan, M. G., and Planes, S. (2004). High mortality during settlement is a population bottleneck for a tropical surgeonfish. Ecology 85, 2422–2428. doi: 10.1890/04-0366
Frisk, M. G., Dolan, T. E., McElroy, A. E., Zacharias, J. P., Xu, H., and Hice, L. A. (2018). Assessing the drivers of the collapse of winter flounder: implications for management and recovery. J. Sea Res. 141, 1–13. doi: 10.1016/j.seares.2018.07.009
Garrison, L. P., and Link, J. S. (2000). Diets of five hake species in the northeast united states continental shelf ecosystem. Mar. Ecol. Prog. Ser. 204, 243–255. doi: 10.3354/meps204243
Gittman, R. K., Peterson, C. H., Currin, C. A., Joel Fodrie, F., Piehler, M. F., and Bruno, J. F. (2016). Living shorelines can enhance the nursery role of threatened estuarine habitats. Ecol. Appl. 26, 249–263. doi: 10.1890/14-0716
Gobler, C. J., Lonsdale, D. J., and Boyer, G. L. (2005). A review of the causes, effects, and potential management of harmful brown tide blooms caused by Aureococcus anophagefferens (hargraves et sieburth). Estuaries 28, 726–749. doi: 10.1007/bf02732911
Gobler, C. J., Berry, D. L., Anderson, O. R., Burson, A., Koch, F., Rodgers, B. S., et al. (2008). Characterization, dynamics, and ecological impacts of harmful cochlodinium polykrikoides blooms on eastern long island, NY, USA. Harmful Algae 7, 293–307. doi: 10.1016/j.hal.2007.12.006
Gobler, C. J., and Sunda, W. G. (2012). Ecosystem disruptive algal blooms of the brown tide species, Aureococcus anophagefferens and Aureoumbra lagunensis. Harmful Algae 14, 36–45. doi: 10.1016/j.hal.2011.10.013
Green, B. S., and Chambers, R. (2007). Maternal effects vary between source populations in the atlantic tomcod microgadus tomcod. Mar. Ecol. Prog. Ser. 344, 185–195. doi: 10.3354/meps06955
Grosslein, M. D., and Azarovitz, T. R. (1982). Fish distribution. MESA New York Bight Atlas Monograph 15. Albany: New York Sea Grant Institute.
Hall-Scharf, B. J., Switzer, T. S., and Stallings, C. D. (2016). Ontogenetic and long-term diet shifts of a generalist juvenile predatory fish in an urban estuary undergoing dramatic changes in habitat availability. Trans. Am. Fish. Soc. 145, 502–520. doi: 10.1080/00028487.2016.1143396
Hartman, K. J., and Brandt, S. B. (1995). Trophic resource partitioning, diets, and growth of sympatric estuarine predators. Trans. Am. Fish. Soc. 124, 520–537. doi: 10.1577/1548-8659(1995)124<0520:trpdag>2.3.co;2
Hartman, K. J. (2003). Population-level consumption by atlantic coastal striped bass and the influence of population recovery upon prey communities. Fish. Manag. Ecol. 10, 281–288. doi: 10.1046/j.1365-2400.2003.00365.x
Heck, K. L. Jr., Hays, G., and Orth, R. J. (2003). Critical evaluation of the nursery role hypothesis for seagrass meadows. Mar. Ecol. Prog. Ser. 253, 123–136. doi: 10.3354/meps253123
Hureau, J. C. (1970). Biologie comparée de quelques poissons antarctiques (Nototheniidae). Bull. Inst. Océanogr. Monaco 68, 1–50. doi: 10.1051/978-2-7598-0896-0-004
Hyslop, E. J. (1980). Stomach contents analysis—a review of methods and their application. J. Fish Biol. 17, 411–429. doi: 10.1111/j.1095-8649.1980.tb02775.x
Jackson, L. J., Furman, B. T., and Peterson, B. J. (2017). Morphological response of zostera marina reproductive shoots to fertilized porewater. J. Exper. Mar. Biol. Ecol. 489, 1–6. doi: 10.1016/j.jembe.2017.01.002
Keefe, M., and Able, K. W. (1994). Contributions of abiotic and biotic factors to settlement in summer flounder, Paralichthys dentatus. Copeia 2, 458–465. doi: 10.2307/1446993
Kraus, R. T., and Musick, J. A. (2001). A brief interpretation of summer flounder, paralichthys dentatus, movements and stock structure with new tagging data on juveniles. Mar. Fish. Rev. 63, 1–6. doi: 10.1016/j.fishres.2014.05.003
Latour, R. J., Gartland, J., Bonzek, C. F., and Johnson, R. A. (2008). The trophic dynamics of summer flounder (paralichthys dentatus) in chesapeake bay. Fish. Bull. 106, 47–57.
Link, J. S., Bolles, K., and Milliken, C. G. (2002). The feeding ecology of flatfish in the northwest atlantic. J. Northwest Atlantic Fish. Sci. 30, 1–18. doi: 10.2960/j.v30.a1
Manderson, J. P., Phelan, B. A., Stoner, A. W., and Hilbert, J. (2000). Predator–prey relations between age-1+ summer flounder (paralichthys dentatus, linnaeus) and age-0 winter flounder (pseudopleuronectes americanus, walbaum): predator diets, prey selection, and effects of sediments and macrophytes. J. Exper. Mar. Biol. Ecol. 251, 17–39. doi: 10.1016/s0022-0981(00)00191-x
Manderson, J. P., Pessutti, J., Hilbert, J. G., and Juanes, F. (2004). Shallow water predation risk for a juvenile flatfish (winter flounder; pseudopleuronectes americanus, walbaum) in a northwest atlantic estuary. J. Exper. Mar. Biol. Ecol. 304, 137–157. doi: 10.1016/j.jembe.2003.12.004
Manooch, C. S. (1973). Food habits of yearling and adult striped bass, morone saxatilis (walbaum), from albemarle sound, north carolina. Chesapeake Sci. 14, 73–86. doi: 10.2307/1350872
McCay, B., and Cieri, M. (2000). Fishing ports of the Mid-Atlantic. Dover, Delaware: Mid-Atlantic Fishery Management Council.
McElroy, A. E., Hice, L. A., Frisk, M. G., Purcell, S. L., Phillips, N. C., and Fast, M. D. (2015). Spatial patterns in markers of contaminant exposure, glucose and glycogen metabolism, and immunological response in juvenile winter flounder (pseudopleuronectes americanus). Comp. Biochem. Physiol. Part D Genomics Proteomics 14, 53–65. doi: 10.1016/j.cbd.2015.01.006
Miya, M., Sato, Y., Fukunaga, T., Sado, T., Poulsen, J. Y., Sato, K., et al. (2015). MiFish, a set of universal PCR primers for metabarcoding environmental DNA from fishes: detection of more than 230 subtropical marine species. Royal Soc. Open Sci. 2:150088. doi: 10.1098/rsos.150088
Munsch, S. H., Cordell, J. R., and Toft, J. D. (2015). Effects of seawall armoring on juvenile Pacific salmon diets in an urban estuarine embayment. Mar. Ecol. Prog. Ser. 535, 213–229. doi: 10.3354/meps11403
NEFSC. (2008a). Assessment of 19 northeast groundfish stocks through 2007. Report of the third groundfish assessment review meeting (GARM III), Chap. Woods Hole, MA. NEFSC, Reference Document, 08–15.
NEFSC. (2008b). Community Profile of Hampton Bays/Shinnecock, NY. Prepared under the auspices of the National Marine Fisheries Service. Woods Hole, MA: Northeast Fisheries Science Center.
NEFSC. (2015). Southern New England Mid-Atlantic Winter Flounder 2015 Assessment Update Report. U.S. Department of Commerce. National Oceanic and Atmospheric Administration. Woods Hole, MA: Northeast Fisheries Science Center.
NEFSC, and NMFS. (2019). 66th Northeast Regional Stock Assessment Workshop (66th SAW) Assessment Summary Report. Woods Hole, MA: Northeast Fisheries Science Center reference document, 1–19.
Nye, J. A., Loewensteiner, D. A., and Miller, T. J. (2011). Annual, seasonal, and regional variability in diet of atlantic croaker (Micropogonias undulatus) in chesapeake bay. Estuaries Coasts 34, 691–700. doi: 10.1007/s12237-010-9348-4
O’Leary, S. J., Hice, L. A., Feldheim, K. A., Frisk, M. G., McElroy, A. E., Fast, M. D., et al. (2013). Severe inbreeding and small effective number of breeders in a formerly abundant marine fish. PLoS One 8:e66126. doi: 10.1371/journal.pone.0066126
Peterson, B. J., Bricker, E., Brisbin, S. J., Furman, B. T., Stubler, A. D., Carroll, J. M., et al. (2013). Genetic diversity and gene flow in Zostera marina populations surrounding long island, New York, USA: no evidence of inbreeding, genetic degradation or population isolation. Aqua. Bot. 110, 61–66. doi: 10.1016/j.aquabot.2013.05.003
Phelan, B. A., Manderson, J. P., Stoner, A. W., and Bejda, A. J. (2001). Size-related shifts in the habitat associations of young-of-the-year winter flounder (Pseudopleuronectes americanus): field observations and laboratory experiments with sediments and prey. J. Exper. Mar. Biol. Ecol. 257, 297–315. doi: 10.1016/s0022-0981(00)00340-3
Pikitch, E. K., Santora, C., Babcock, E. A., Bakun, A., Bonfil, R., Conover, D. O., et al. (2004). Ecosystem-based fishery management. Science 305, 346–347. doi: 10.1126/science.1098222
Poole, J. C. (1964). Feeding habits of the summer flounder in great south bay. NY Fish Game J. 11, 28–34.
Rountree, R. A., and Able, K. W. (1992). Foraging habits, growth, and temporal patterns of salt-marsh creek habitat use by young-of-year summer flounder in new jersey. Trans. Am. Fish. Soc. 121, 765–776. doi: 10.1577/1548-8659(1992)121<0765:fhgatp>2.3.co;2
Sagarese, S. R., and Frisk, M. G. (2011). Movement patterns and residence of adult winter flounder within a long island estuary. Mar. Coastal Fish. 3, 295–306. doi: 10.1080/19425120.2011.603957
Sagarese, S. R., Cerrato, R. M., and Frisk, M. G. (2011). Diet composition and feeding habits of common fishes in long island bays, New York. Northeastern Nat. 18, 291–314. doi: 10.1656/045.018.0304
Sánchez-Hernández, J., Nunn, A. D., Adams, C. E., and Amundsen, P. A. (2019). Causes and consequences of ontogenetic dietary shifts: a global synthesis using fish models. Biol. Rev. 94, 539–554. doi: 10.1111/brv.12468
Staudinger, M. D. (2006). Seasonal and size-based predation on two species of squid by four fish predators on the northwest atlantic continental shelf. Fish. Bull. 104:605.
Staudinger, M. D., and Juanes, F. (2010). Feeding tactics of a behaviorally plastic predator, summer flounder (paralichthys dentatus). J. Sea Res. 64, 68–75. doi: 10.1016/j.seares.2009.08.002
Stinnette, I. (2014). Nitrogen Loading to the South Shore, Eastern Bays, NY: Sources, Impacts, and Management Options, Doctoral dissertation. Stony Brook, NY: Stony Brook University.
Stubler, A. D., Jackson, L. J., Furman, B. T., and Peterson, B. J. (2017). Seed production patterns in zostera marina: effects of patch size and landscape configuration. Estuaries Coasts 40, 564–572. doi: 10.1007/s12237-016-0165-2
Taylor, D. L., and Gervasi, C. L. (2017). Feeding habits and dietary overlap of age-0 winter flounder (pseudopleuronectes americanus) and summer flounder (paralichthys dentatus) in southern new england tidal rivers. Fish. Bull. 115, 167–185. doi: 10.7755/fb.115.2.4
Taylor, D. L., Cribari, K. J., and Scro, A. (2019). Piscivory in age-0 summer flounder Paralichthys dentatus with a focus on predator-induced mortality of post-settlement winter flounder Pseudopleuronectes americanus. Mar. Ecol. Prog. Ser. 612, 7–28. doi: 10.3354/meps12885
Ter Braak, C. J. (1986). Canonical correspondence analysis: a new eigenvector technique for multivariate direct gradient analysis. Ecology 67, 1167–1179. doi: 10.2307/1938672
Terceiro, M. (2002). The summer flounder chronicles: science, politics, and litigation, 1975–2000. Rev. Fish Biol. Fish. 11, 125–168.
Terceiro, M. (2012). Stock Assessment of Summer Flounder for 2012. Woods Hole, MA: US Dept Commer, Northeast Fish Science Center Reference Document 12-21. 148.
Terceiro, M. (2018). The summer flounder chronicles III: struggling with success, 2011–2016. Rev. Fish Biol. Fish. 28, 381–404. doi: 10.1007/s11160-017-9506-x
USACE. (2004). Atlantic coast of Long Island, Fire Island to Montauk Point, New York, Reformulation study. Submerged aquatic vegetation (SAV) bed characterization. New York: US Army Corps of Engineers.
Warren, J. D., and Peterson, B. J. (2007). Use of a 600-kHz acoustic doppler current profiler to measure estuarine bottom type, relative abundance of submerged aquatic vegetation, and eelgrass canopy height. Estuarine Coastal Shelf Sci. 72, 53–62. doi: 10.1016/j.ecss.2006.10.026
Witting, D. A., and Able, K. W. (1993). Effects of body size on probability of predation for juvenile summer flounder, paralichthys dentatus and winter flounder, pleuronectes americanus, based on laboratory experiments. Fish. Bull. 91, 577–581.
Witting, D. A., and Able, K. W. (1995). Predation by sevenspine bay shrimp crangon septemspinosa on winter flounder Pleuronectes americanus during settlement: laboratory observations. Mar. Ecol. Prog. Ser. 123, 23–31. doi: 10.3354/meps123023
Witting, D. A., Chambers, R. C., Bosley, K. L., and Wainright, S. C. (2004). Experimental evaluation of ontogenetic diet transitions in summer flounder (paralichthys dentatus), using stable isotopes as diet tracers. Can. J. Fish. Aqua. Sci. 61, 2069–2084. doi: 10.1139/f04-156
Zarnoch, C. B., Hoellein, T. J., Furman, B. T., and Peterson, B. J. (2017). Eelgrass meadows, zostera marina (L.), facilitate the ecosystem service of nitrogen removal during simulated nutrient pulses in shinnecock bay, New York, USA. Mar. Poll. Bull. 124, 376–387. doi: 10.1016/j.marpolbul.2017.07.061
Keywords: summer flounder, urbanization, Shinnecock Bay, trophic dynamics, anthropogenic environmental changes
Citation: Cernadas-Martín S, Rountos KJ, Nye JA, Frisk MG and Pikitch EK (2021) Composition and Intraspecific Variability in Summer Flounder (Paralichthys dentatus) Diets in a Eutrophic Estuary. Front. Mar. Sci. 8:632751. doi: 10.3389/fmars.2021.632751
Received: 23 November 2020; Accepted: 16 April 2021;
Published: 11 May 2021.
Edited by:
Eliza C. Heery, Smithsonian Institution, United StatesReviewed by:
Stuart Munsch, Northwest Fisheries Science Center (NOAA), United StatesDaniel Abel Shilla, University of Dar es Salaam, Tanzania
Goutam Kumar Kundu, University of Dhaka, Bangladesh
Rochelle Diane Seitz, College of William & Mary, United States
Mark Stoeckle, The Rockefeller University, United States
Copyright © 2021 Cernadas-Martín, Rountos, Nye, Frisk and Pikitch. This is an open-access article distributed under the terms of the Creative Commons Attribution License (CC BY). The use, distribution or reproduction in other forums is permitted, provided the original author(s) and the copyright owner(s) are credited and that the original publication in this journal is cited, in accordance with accepted academic practice. No use, distribution or reproduction is permitted which does not comply with these terms.
*Correspondence: Sara Cernadas-Martín, c2FyYS5jZXJuYWRhc0BzdG9ueWJyb29rLmVkdQ==