 Yoonja Kang1†
 Matthew J. Harke1†
 Dianna L. Berry1
 Jackie L. Collier1
 Steven W. Wilhelm2
 Sonya T. Dyhrman3,4
 Christopher J. Gobler1*
- 1School of Marine and Atmospheric Sciences, Stony Brook University, Stony Brook, NY, United States
- 2Department of Microbiology, University of Tennessee, Knoxville, Knoxville, TN, United States
- 3Department of Earth and Environmental Sciences, Columbia University, New York, NY, United States
- 4Lamont-Doherty Earth Observatory, Columbia University, Palisades, NY, United States
Pelagophytes are abundant picophytoplankton within open ocean ecosystems and the causative algae of harmful brown tide blooms in estuaries. The physiological capabilities facilitating the ecological success of pelagophytes in these diverse ecosystems remains poorly understood. Here, we investigated the transcriptional response of two coastal pelagophytes (Aureococcus anophagefferens and Aureoumbra lagunensis) and two open ocean pelagophytes (Pelagococcus subviridis and Pelagomonas calceolata) to conditions commonly found within the marine ecosystems where they thrive: low concentrations of nitrogen (N), phosphorus (P), or light. OrthoMCL was used to generate a total of 62,653 orthologous groups (OGs) with only a small fraction of these OGs (2,776 or 4.4%) being shared among all four pelagophytes. Of the commonly shared OGs, 8% were significantly differentially abundant under low N, P, or light with the majority associated with energy and lipid metabolism. Distinct responses among pelagophytes included increased abundance of transcripts encoding phosphate transporters (Aureococcus) and transcripts encoding a pyrophosphatase (Aureococcus and Pelagomonas) under low P, the expression of a suite of organic nitrogen-degrading enzymes under low N (Aureoumbra and Pelagomonas), increased abundance of transcripts encoding flavodoxins relative to ferredoxins (Pelagomonas) and transcripts encoding lysophospholipase (Pelagococcus) under low light, and both increases and decreases in abundance of transcripts encoding selenoproteins in all pelagophytes except Pelagococcus. Collectively, this study provides new information on the expressed gene compliment of these poorly characterized taxa and demonstrates that these pelagophytes possess a combination of shared and unique physiological features that likely facilitate their adaptation to distinct environmental conditions.
Introduction
Pelagophytes are important members of ocean plankton communities as they are numerically abundant and ubiquitously distributed across marine ecosystems (Simon et al., 1994; Andersen et al., 1996; John et al., 2007). Of the known pelagophytes, four genera (Aureococcus, Aureoumbra, Pelagomonas, and Pelagococcus) have received increasing attention due to their ability to form harmful algal blooms (Aureococcus and Aureoumbra; Gobler and Sunda, 2012) and their prevalence in open ocean ecosystems (Pelagomonas and Pelagococcus; Lewin et al., 1977; Dupont et al., 2014). Flow cytometric and electron microscopic analyses were initially used to demonstrate that the pelagophyte Pelagomonas sp. is one of the most abundant picoeukaryotes in the North Atlantic and Pacific subtropical oceans (Simon et al., 1994). More recent studies utilizing sorting flow cytometry and sequencing have revealed that Pelagomonas calceolata is ubiquitously distributed across world oceans (Cuvelier et al., 2010; Worden et al., 2012) and can be numerically dominant within the deep chlorophyll maximum (DCM) (Dimier et al., 2009; Li et al., 2013) where it is thought to be responsible for the majority of nitrate assimilation (Dupont et al., 2014). Less is known about the distribution of Pelagococcus subviridis, but it appears to be widely distributed in the ocean (Lewin et al., 1977) and carries a unique pigment profile of fucoxanthin and a 19’-butnoyloxyfucoxanthin with diadinoxanthin and diatoxanthin (Vesk and Jeffrey, 1987). In coastal ecosystems, the bloom-forming pelagophytes Aureococcus anophagefferens and Aureoumbra lagunensis are notorious for their ability to form brown tides that damage shellfisheries and seagrass meadows and disrupt energy flow to upper trophic levels (Gobler and Sunda, 2012).
While the prevailing environmental conditions in coastal and open ocean ecosystems can differ radically, some characteristics of turbid estuaries may mimic those of the subsurface chlorophyll maximum (e.g., low light, low-to-moderate nutrient levels, and abundance of organic matter, Cullen, 1982, 2015; Gobler et al., 2011). Brown tide blooms often occur during periods of low dissolved inorganic nitrogen (DIN) and phosphorus (DIP) (Gobler et al., 2004, 2013a). Both Aureococcus and Aureoumbra can assimilate dissolved organic nitrogen (DON) and phosphorus (DOP) for growth (Gobler et al., 2004; Muhlstein and Villareal, 2007), and the levels of DON and DOP can significantly decrease during the course of a brown tide, suggesting active degradation of compounds in these nutrient pools (Gobler et al., 2004, 2013a). Further, the ability of Aureococcus and Aureoumbra to utilize DON and DOP has been highlighted in previous genomic, transcriptomic, and proteomic studies (Berg et al., 2008; Gobler et al., 2011; Wurch et al., 2011b, 2013; Sun et al., 2012; Frischkorn et al., 2014). Lastly, Pelagomonas, Aureococcus, and Aureoumbra are all capable of maintaining maximal growth rates under low light conditions such as those found at the DCM or under high biomass bloom conditions (Dimier et al., 2009; Gobler et al., 2011, 2013a). While Aureococcus and Aureoumbra share a similar ecological niche in estuaries (Gobler and Sunda, 2012) and Pelagococcus and Pelagomonas reside in open ocean ecosystems (Lewin et al., 1977; Dupont et al., 2014), it appears Aureococcus is phylogenetically more similar to Pelagomonas than to Aureoumbra, based upon plastid genome comparisons (Deyoe et al., 1995; Worden et al., 2012), suggesting potential other shared genetic traits.
During the past two decades, genome sequencing has provided significant insight into the physiological potential of multiple species of phytoplankton (Palenik et al., 2003; Gobler et al., 2011; Lin et al., 2015). With continued development of sequencing techniques and bioinformatic approaches, assessment of messenger RNA transcript abundances, also known as transcriptomes, have been used to bridge the information gap between genomic potential and phytoplankton response to ecosystem conditions (Keeling et al., 2014; Mock et al., 2016). Transcriptomics has revealed how this genomic potential in phytoplankton responds to a variety of nutrient regimes (Dyhrman et al., 2012; Bender et al., 2014; Frischkorn et al., 2014) and phytoplankton group-specific metabolic responses to varying environments (Alexander et al., 2015; Harke et al., 2015).
While Aureococcus is one of the few eukaryotic algae with a sequenced genome (CCMP1984, Gobler et al., 2011), there is relatively little known about gene content of other pelagophytes or how members of this group respond to changes in their environment. These changes are important as they shape not only the physiology of the organisms in isolation but also how they interact with competitors (Wurch et al., 2019) and predators (Gann et al., 2020a, b). Here, we compared the transcriptomic responses of two coastal pelagophytes, Aureococcus anophagefferens and Aureoumbra lagunensis, and two open ocean pelagophytes, Pelagococcus subviridis and Pelagomonas calceolata, to conditions commonly found within the ecosystems where they thrive: low levels of N, P, or light.
Materials and Methods
Culture Maintenance
Two coastal pelagophytes, Aureococcus anophagefferens (CCMP1850 isolated from Great South Bay, NY, United States, 40.651°N, −73.152°W, in 1998) and Aureoumbra lagunensis (CCMP1510 isolated from Laguna Madre, TX, United States, 27.471°N, −97.320°W, in 1992), and two oceanic pelagophytes, Pelagococcus subviridis (CCMP1429 isolated from the subarctic Pacific, 49.917° N, −145.117°, isolation date unknown) and Pelagomonas calceolata (CCMP1214 isolated from the sub-tropical Pacific, 30.833°N, −136.833°, in 1973), were used for experiments. Cultures were grown in modified GSe medium (Tang and Gobler, 2009) made with boiled and then filter-sterilized (0.22 μm) North Atlantic Ocean seawater (40.290°N, −71.989°W) with a final salinity of 32.5 and amended with 60 μM NH4Cl and 5 μM K2HPO4. All cultures were maintained with a final concentration of 1% antibiotic solution (primary stock was a mixture of 10,000 I.U. penicillin and 10,000 μg mL–1 streptomycin; Mediatech Inc., United States) to minimize bacterial contamination. Cultures were maintained with a 14:10 h light:dark cycle, illuminated by a bank of fluorescent lights (T-12 medium bipin) providing 100 μmol photons m–2 s–1 for Aureococcus and Aueoumbra and 50 μmol photons m–2 s–1 for Pelagomonas and Pelagococcus. Aureococcus, Aureoumbra, and Pelagomonas were grown at 21 ± 1° C whereas Pelagococcus, isolated from the subarctic Pacific, was grown at 14 ± 1°C.
Experimental Design
To investigate the transcriptomic responses of these pelagophytes to conditions commonly present in their native ecosystems, cultures were incubated under starting conditions of either low P (1 μM PO4–), low N (30 μM NH4+), or low light (20 μE m–2 s–1) to elicit stress responses in comparison with replete control cultures (5 μM PO4–, 60 μM NH4+, 100 μmol photons m–2 s–1). Low P and low N cultures were incubated at the same light intensity (100 μmol photons m–2 s–1 for Aureococcus and Aueoumbra and 50 μmol photons m–2 s–1 for Pelagomonas and Pelagococcus) as control cultures, while low light cultures were incubated with the same nutrient concentration as control cultures (60 μM NH4+, 5 μM PO4–). Triplicate 450 mL cultures were inoculated with ∼3.5 × 10⁵ cells mL–1 harvested from exponentially growing maintenance cultures and monitored daily at 2 pm each day to avoid diel variation. In vivo fluorescence was measured on Turner Designs TD-700 fluorometer (EM filter of > 665 nm and EX filter of 340-500 nm; Sunnyvale, CA, United States). Maximum quantum efficiency of photosystem II (Fv/Fm) was estimated from in vivo (Fv) and DCMU (3,4-dichlorophenyl-1,1-dimethylurea)-enhanced in vivo fluorescence (Fm) of each replicate culture on the same fluorometer (EM filter of 410–600 nm and EX filter of 300–400 nm; Parkhill et al., 2001). All readings were blank corrected using sterile culture media. The addition of DCMU blocks the electron transfer between photosystem I and photosystem II, maximizing the fluorescence (Parkhill et al., 2001). Fv/Fm has been utilized as an indicator of nutrient status with values of ∼ 0.6 under nutrient replete conditions and decreasing to ∼ 0.3 under nutrient deplete conditions (Parkhill et al., 2001; Harke and Gobler, 2013). Bulk alkaline phosphatase activity (APA) was measured daily on the TD-700 fluorometer (EM filter of 410–600 nm and EX filter of 300–400 nm) using 4-methylumbelliferyl phosphate at 250 μM concentration (Hoppe, 1983). Lugol’s iodine-preserved cells (Yoon, 2016) were quantified with a 50 μm aperture using a Beckman Multisizer 3 Coulter Counter (Fullerton, CA, United States). Growth rates were calculated for 3 days before harvest.
RNA Extraction and cDNA Sequencing
Physiological parameters were used to determine a harvesting time for each treatment. Fv/Fm and APA were utilized as indicators of nutrient stress (N or P, respectively), in low N and low P cultures while growth rates were utilized as an indicator of physiological status under low light. For each species, control cultures were harvested during exponential growth phase while low N treatments were harvested when Fv/Fm was reduced relative to the replete control. Low P treatments were harvested when APA was elevated relative to the replete control and low light treatments were harvested when cultures established a stable but slower growth rate relative to the replete control. In some cases, the differences in APA or Fv/Fm between treatments and the control were present but not significant at the p < 0.05 level. Harvest timing differed by treatment and species, occurring at the last timepoint plotted in Figure 1. At the time of harvest, cell pellets of each culture were collected by centrifuging the entire volume of each biological replicate (n = 3) in an IEC CL31R Multispeed centrifuge (Thermo Electron Corporation, Milford, MA, United States) for 8 min at 1300 × g at culture growth temperatures stated above. After supernatant removal, the pellets were transferred to 2 mL microcentrifuge tubes and centrifuged again under the same conditions and any remaining supernatant was removed. Concentrated cells were immediately frozen in liquid nitrogen and stored at −80°C. Total processing time from experimental conditions to flash freezing was < 20 min.
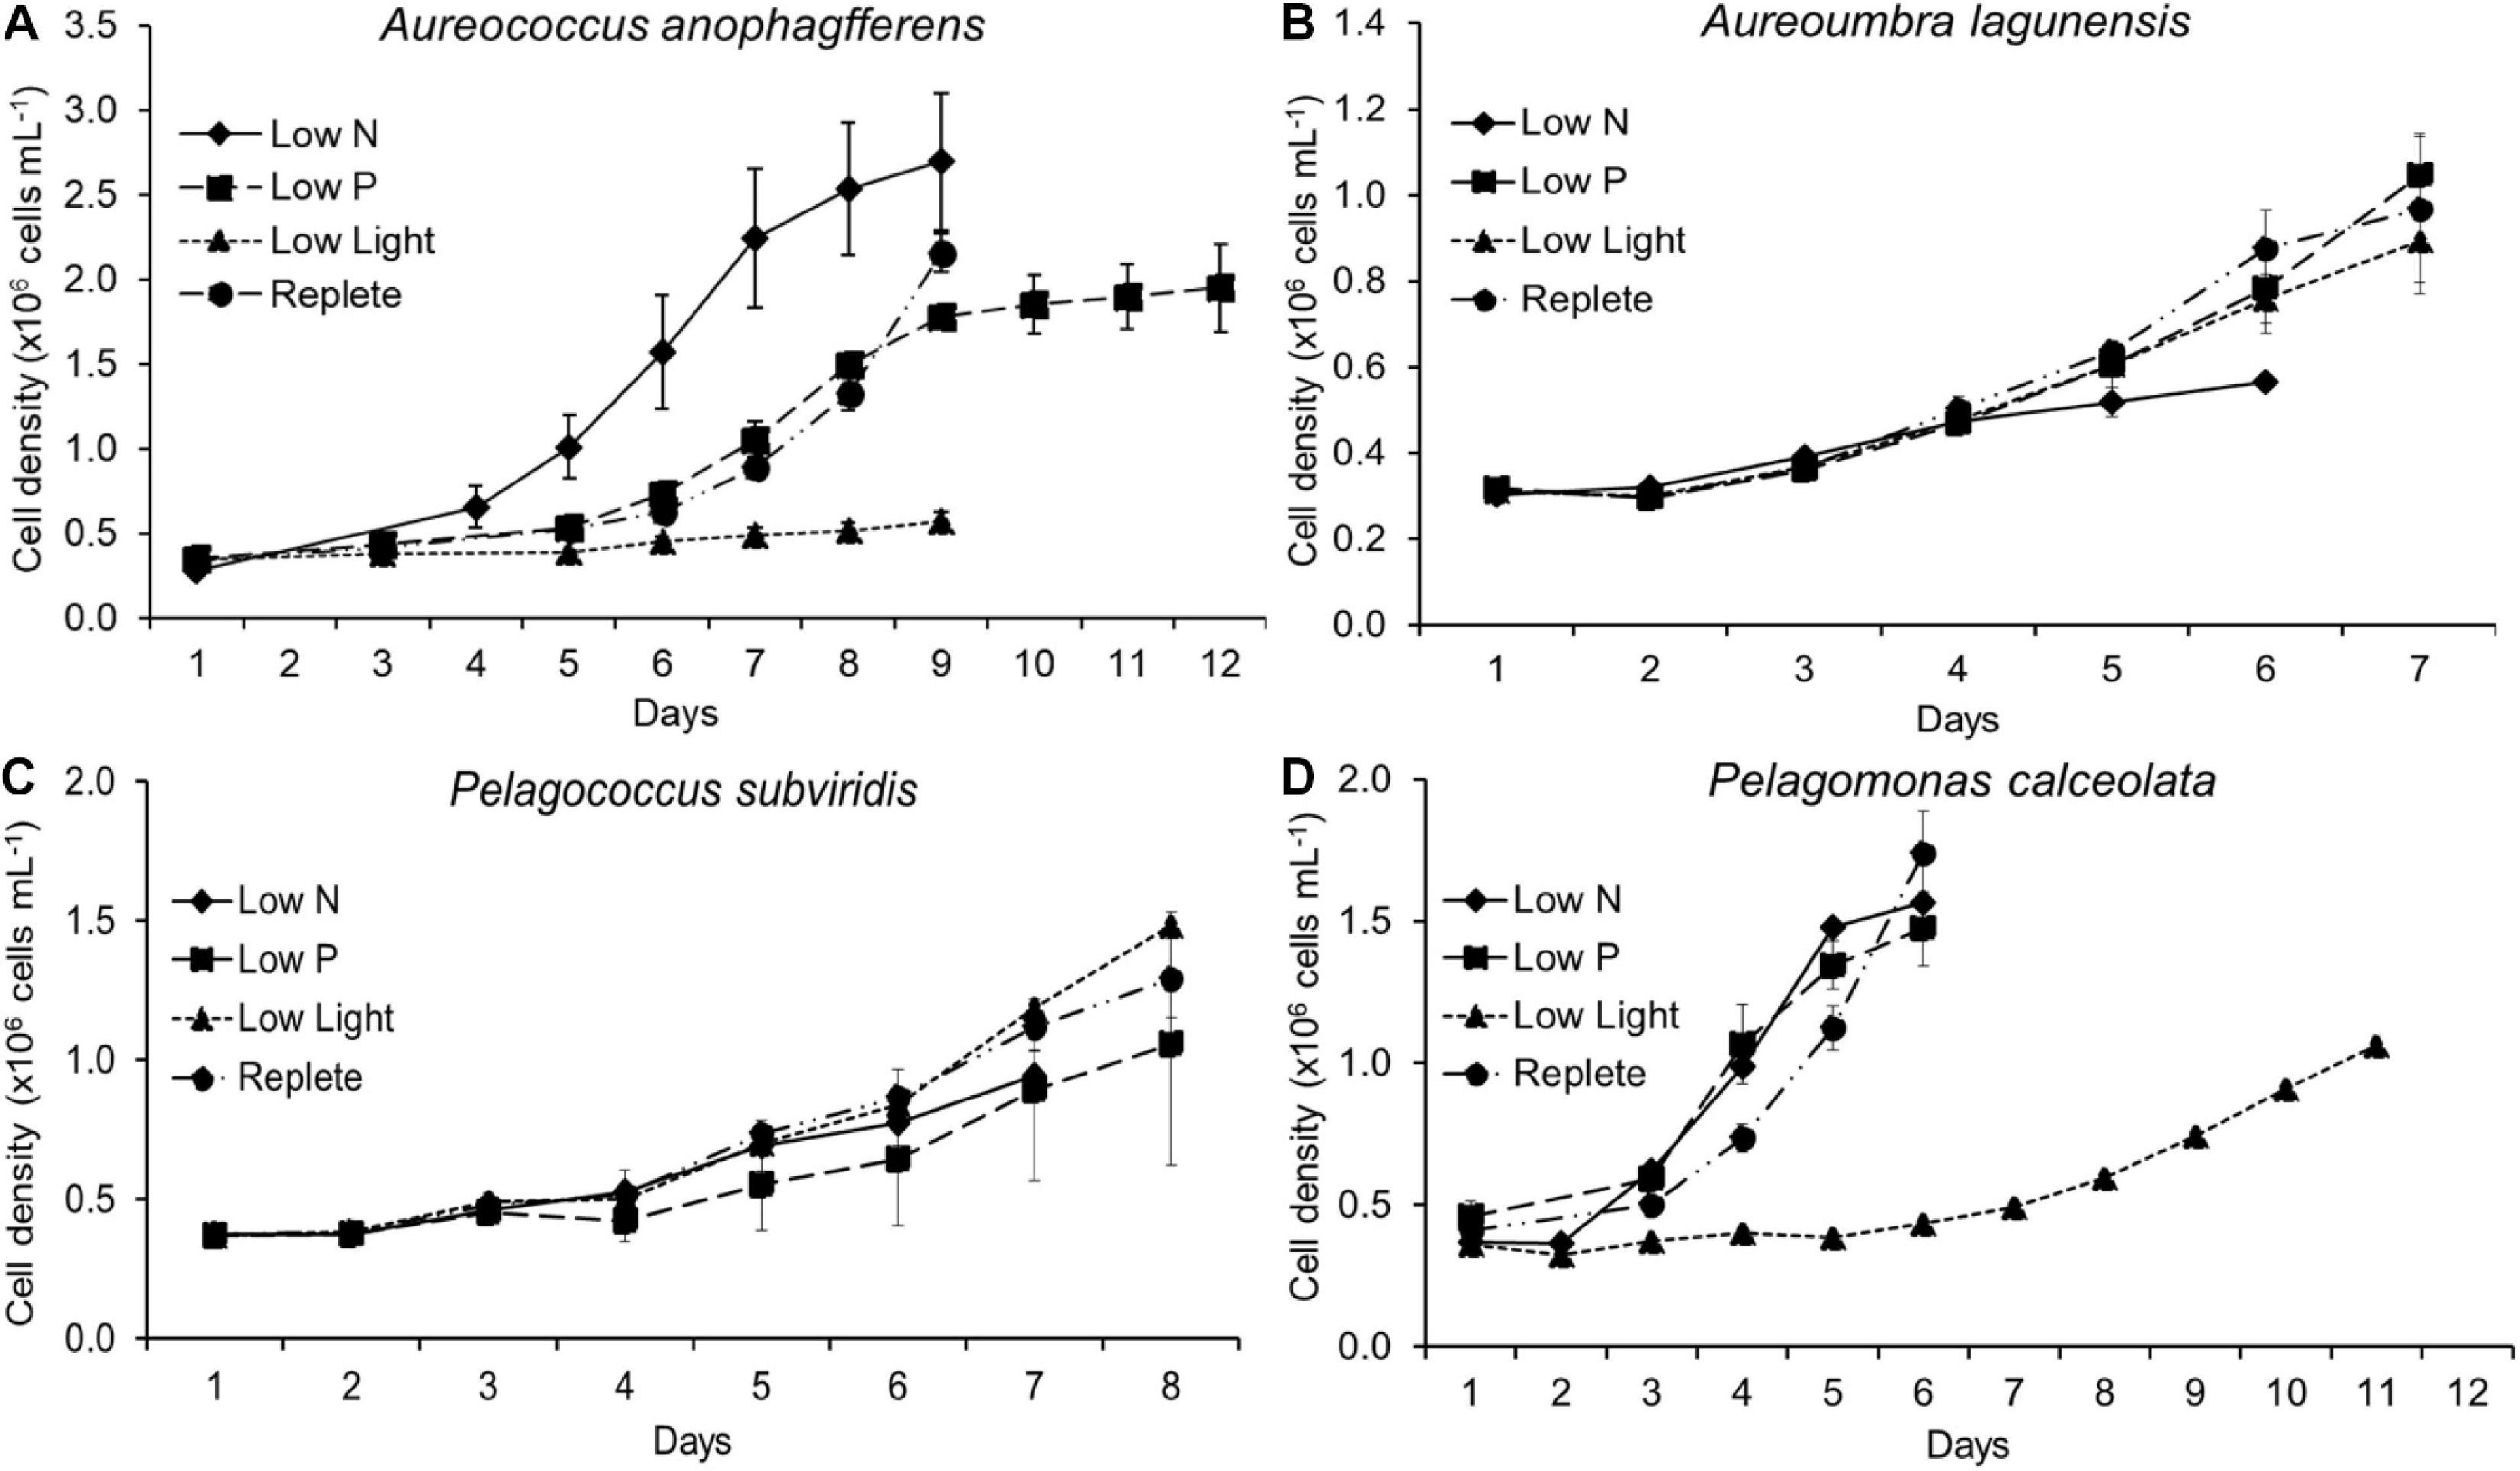
Figure 1. Cell density during experiments. Cells from each treatment and each species were harvested at different times indicated by the last time point of each line. Aureococcus anophagefferens data have been previously reported in Frischkorn et al. (2014). (A) cell density of Aureococcus anophagefferens, (B) cell density of Aureoumbra lagunensis, (C) cell density of Pelagococcus subviridis, (D) cell density of Pelagomonas calceolata.
Total RNA of each biological replicate (n = 3 per treatment) was extracted with an UltraCleanTM Plant RNA Isolation kit (Mo Bio Laboratories Inc., CA, United States) according to manufacturer’s instructions. As sequencing of biological replicates was not available through the Marine Microbial Eukaryote Transcriptome Sequencing Project (MMETSP; Keeling et al., 2014), replicates were then pooled to average across biological variability in transcriptional response between replicate flasks. Residual DNA was digested using an Ambion Turbo DNA-freeTM kit according to manufacturer’s instructions and NanoDropTM 2000 Spectrophotometer (Thermo Fisher Scientific, Wilmington, DE, United States) was used to confirm no DNA contamination of RNA. RNA quantity was assessed with an Invitrogen Qubit Q32855 (Invitrogen, Carlsbad, CA, United States) and RNA quality was assessed with an Agilent 2100 Bioanalyzer (Agilent Technologies, Palo Alto, CA, United States). As a part of the MMETSP, library prep and sequencing was performed at the National Center for Genome Resources (NCGR) using an Illumina TruSeq RNA Sample Preparation Kit to generate libraries from ∼2 μg of RNA. Sequencing of 50 base pair paired-end reads from each library was performed on an Illumina HiSeq 2000, generating 2 Gbp of sequence per library. Sequence data are available on the iMicrobe repository1 with the identification numbers MMETSP0914 – MMETSP0917 for Aureococcus anophagefferens (0914 = replete control, 0915 = low N, 0916 = low P, 0917 = low light), MMETSP0890 – MMETSP0893 for Aureoumbra lagunensis (0890 = replete control, 0891 = low N, 0892 = low P, 0893 = low light), MMETSP0882 – MMETSP0885 for Pelagococcus subviridis (0882 = replete control, 0883 = low N, 0884 = low P, 0885 = low light), and MMETSP0886 – MMETSP0889 for Pelagomonas calceolata (0886 = replete control, 0887 = low N, 0888 = low P, 0889 = low light).
De novo Assembly, Annotations, OrthoMCL Orthologous Grouping, and Expression Analysis
As part of the MMETSP, a combined assembly of all treatments fusing NCGR’s pipeline (Batch Parallel Assembly version 2.0) was performed for each species. Low quality reads were trimmed using a String Graph Assembler with swinging average at Q15 (SGA; Simpson and Durbin, 2012). After reads shorter than 25 base pairs were discarded, preprocessed sequences were assembled with ABySS using 20 unique k-mer sizes between k = 26 and k = 50 (Simpson and Durbin, 2012). ABySS was run requiring a minimum k-mer coverage of 5, popping at > 0.9 branch identity, with the scaffolding flag disabled to avoid over reduction of divergent regions. The assembled reads (= unitigs) from all k-mer assemblies were combined and grouped at 98% sequence identity using CD-Hit (Li and Godzik, 2006). Then, CAP3 was used to identify minimum 100 bp overlaps between the resultant contigs and assembled them into larger sequences (Huang and Madan, 1999), and the resulting contigs were paired-end scaffolded using ABySS (Simpson et al., 2009). GapCloser, a part of the SOAP de novo package, was used to close gaps created during scaffolding. Redundant sequences were removed using CD-Hit and contigs less than 150 bp were filtered out (Li and Godzik, 2006). RSEM (Li and Dewey, 2011) was used to generate read counts with default parameters.
Initial annotations were carried out by NCGR using ESTScan (Iseli et al., 1999) to predict coding sequences with a Bacillariophyta scoring matrix. Peptide predictions over 30 amino acids in length were annotated. Matches against the UniProtKB/Swiss-Prot database were generated using blastp (Altschul et al., 1990). Coding sequences were also characterized using HMMER3 (Zhang and Wood, 2003) against Pfam (Bateman et al., 2004), TIGRFAM (Haft et al., 2001), and SUPERFAMILY (Gough et al., 2001) databases. In addition, contigs from each species were mapped to the KEGG database (Kanehisa et al., 2006) using the KEGG Automatic Annotation Server2 on complete or draft genome mode.
Predicted peptide sequences were clustered into orthologous groups (OGs) using OrthoMCL (Li et al., 2003) by running all versus all Blastp with default settings: a P-value cutoff of 1e–5 and an inflation value (-I) of 1.5, which provides the best granularity (i.e., cluster tightness; Li et al., 2003). OrthoMCL was performed via virtual workbench in the Discovery Environment of the iPlant Collaborative3 (Stein, 2008; Oliver et al., 2013). Total OGs generated from OrthoMCL analysis included OGs with single-copy contigs. The differentially abundant OGs were divided into three groups: OGs that were shared among all four pelagophytes (here called “core OGs”), OGs that were found in two or three species (here called “shared OGs”), and OGs that were found in a single species (here called “unique OGs”). To characterize biochemical pathways, KEGG annotations from above were assessed for contigs within OGs. In addition, as the majority of OGs that are involved in N and P metabolism do not have KEGG annotations (Marchetti et al., 2012; Alexander et al., 2015), the initial MMETSP annotations from NCGR pipeline were also used. OGs associated with P metabolism were assigned to the KEGG energy metabolism module, which also includes N metabolism.
Sequence reads were aligned to contigs using Burrows-Wheeler Alignment tool (BWA; Li and Durbin, 2009). Read counts were summed at the OG level by each treatment and each species. An Analysis of Sequence Counts (ASC; Wu et al., 2010) was then performed on OGs from each species separately by comparing each treatment to the replete control. ASC estimates the prior distribution by modeling biological variability using the data itself. This empirical Bayesian method has been used in other marine phytoplankton studies without sequenced replicates (Dyhrman et al., 2012; Konotchick et al., 2013; Kopf et al., 2015; Harke et al., 2017). A statistically significant increase or decrease in abundance relative to replete was determined using a fold-change greater than or equal to 2 and a posterior probability greater than 0.95 (Wu et al., 2010). Significant differences were represented as log2 transcripts per million (TPM). The differentially abundant OGs were divided into three groups: OGs that were shared among all four pelagophytes (here called “core OGs”), OGs that were found in two or three species (here called “shared OGs”), and OGs that were found in a single species (here called “unique OGs”). The core and shared OGs were used to assess the common responses among pelagophytes while the unique OGs were used to assess the response of each species to the experimental conditions. Core, shared, and unique differentially abundant OGs were displayed in Ratio-Average (RA) plots of taxa-specific differential gene expression in response to treatments using R.
Transcriptome Completeness Analysis Using BUSCO
For quantitative assessment of transcriptome completeness, Benchmarking Universal Single-Copy Orthologs4 (BUSCO v2.0) was performed using a eukaryotic lineage to classify matches. The covered matches are classified with BUSCO notations of complete, fragmented, and missing genes. Complete genes are genes when gene lengths are within two standard deviations of BUSCO groups mean length, fragmented genes are when genes are only partially recovered, and missing genes are when genes are not recovered (Simão et al., 2015).
Statistics
Differences in growth rates, Fv/Fm, and APA among cultures were assessed via One-Way Analysis of Variance (ANOVA) and post hoc Tukey tests using Sigma Plot 11.0 (Systat Software Inc., San Jose, CA, United States). Bray-Curtis dissimilarity analysis was performed using the ‘vegan’ version 2.5 package in RStudio5 on core and shared OGs with significantly different expression patterns among four pelagophytes to quantify the compositional dissimilarity across all treatments. For simplicity, significantly differentially expressed OGs will be referred to as differentially abundant henceforth.
Results
Culture Growth in Different Treatments
The timing of cell harvest was set to assure replete or resource-stressed conditions were present for each culture (Figure 1). At the time of harvest, growth rates of nutrient-replete cultures (= control) were significantly higher than those of all three experimental conditions for all species (p < 0.05; One-Way ANOVA; Tukey test) except for Aureoumbra, for which growth rates in low P and low light were similar to the control and Pelagococcus, for which growth rates in low P were similar to control (Table 1). Photosynthetic efficiencies (Fv/Fm) were lower than that of the control in all species for low N treatments but only significantly different in Aureococcus and Pelagomonas (p < 0.05; One-Way ANOVA; Tukey test; Table 1). APA in low P cultures was significantly higher than control cultures on the day of harvest for all species except for Aureococcus in which APA was below 0.001 nmol mL–1 h–1 in the replete condition (p < 0.05; One-Way ANOVA; Tukey test; Table 1).
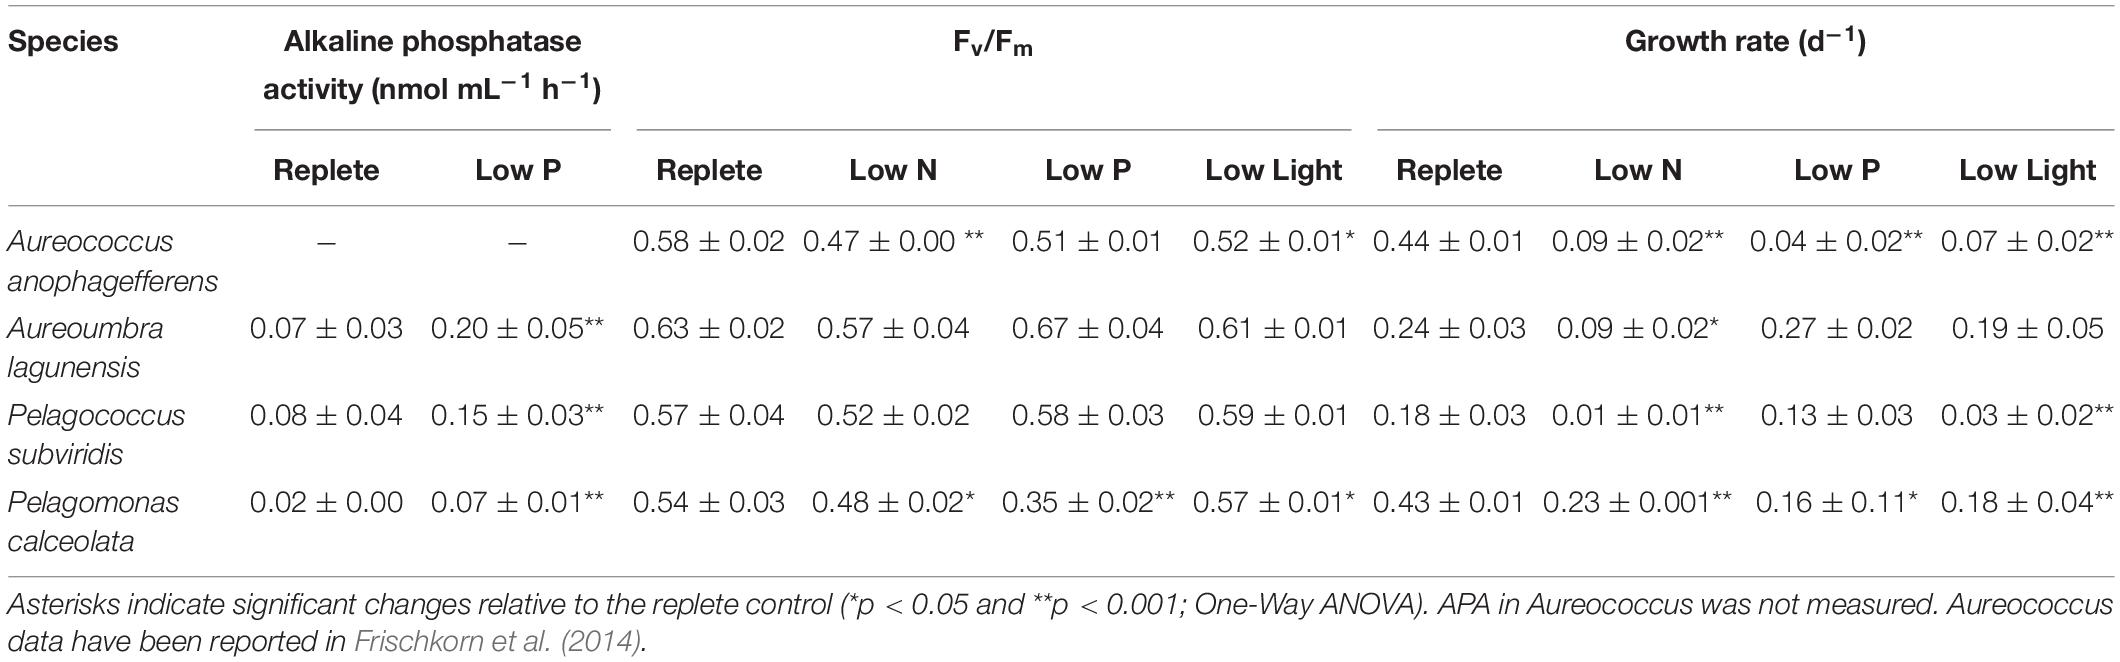
Table 1. Alkaline phosphatase activity, photosynthetic efficiency (Fv/Fm) and growth rate for 3 days at the exponential stage.
OGs Comparison
A total of 62,653 OGs were generated from the 78,780 peptides predicted from contigs, comprising 8,482 OGs for Aureoumbra, 15,578 OGs for Pelagomonas, 17,033 OGs for Pelagococcus, and 21,560 OGs for Aureococcus (Figures 2A,B). OGs were divided into three groups: core OGs found in all species, shared OGs found in at least two species, and unique OGs found in only one species (Figures 2A,C). The core set of 2,776 OGs accounted for a relatively small proportion of the total OGs in each species, ranging from 13% in Aureococcus to 33% in Aureoumbra, while the proportions of shared and unique OGs were much higher (Figure 2C). Of the total OGs, 26,508 OGs were composed of single copy contigs and 36,145 OGs were composed of multiple copy contigs (Supplementary Figure S1). Among the significantly differentially abundant OGs (4,879), 60% were shared OGs while core and unique OGs were responsible for 14% and 25% of the DE OGs, respectively (Supplementary Table S1). Of the shared OGs, 65% were not assigned a KEGG pathway. Considering all of the core and unique OGs, 77% and 54% were assigned a function within central metabolism (Supplementary Table S1). For Aureococcus, Aureoumbra, and Pelagomonas, > 60% of BUSCOs were complete, while 7∼11% were fragmented and < 30% was missing (Supplementary Figure S2). In contrast, Pelagococcus had the least completed transcriptome with 39% of BUSCOs complete and 40% of BUSCOs missing (Supplementary Figure S2). For core OGs, 32∼48% were completed while more than 50% of core OGs were missing among four pelagophytes (Supplementary Figure S2). Full OrthoMCL and ASC results are reported in Supplementary Tables S2, S3.
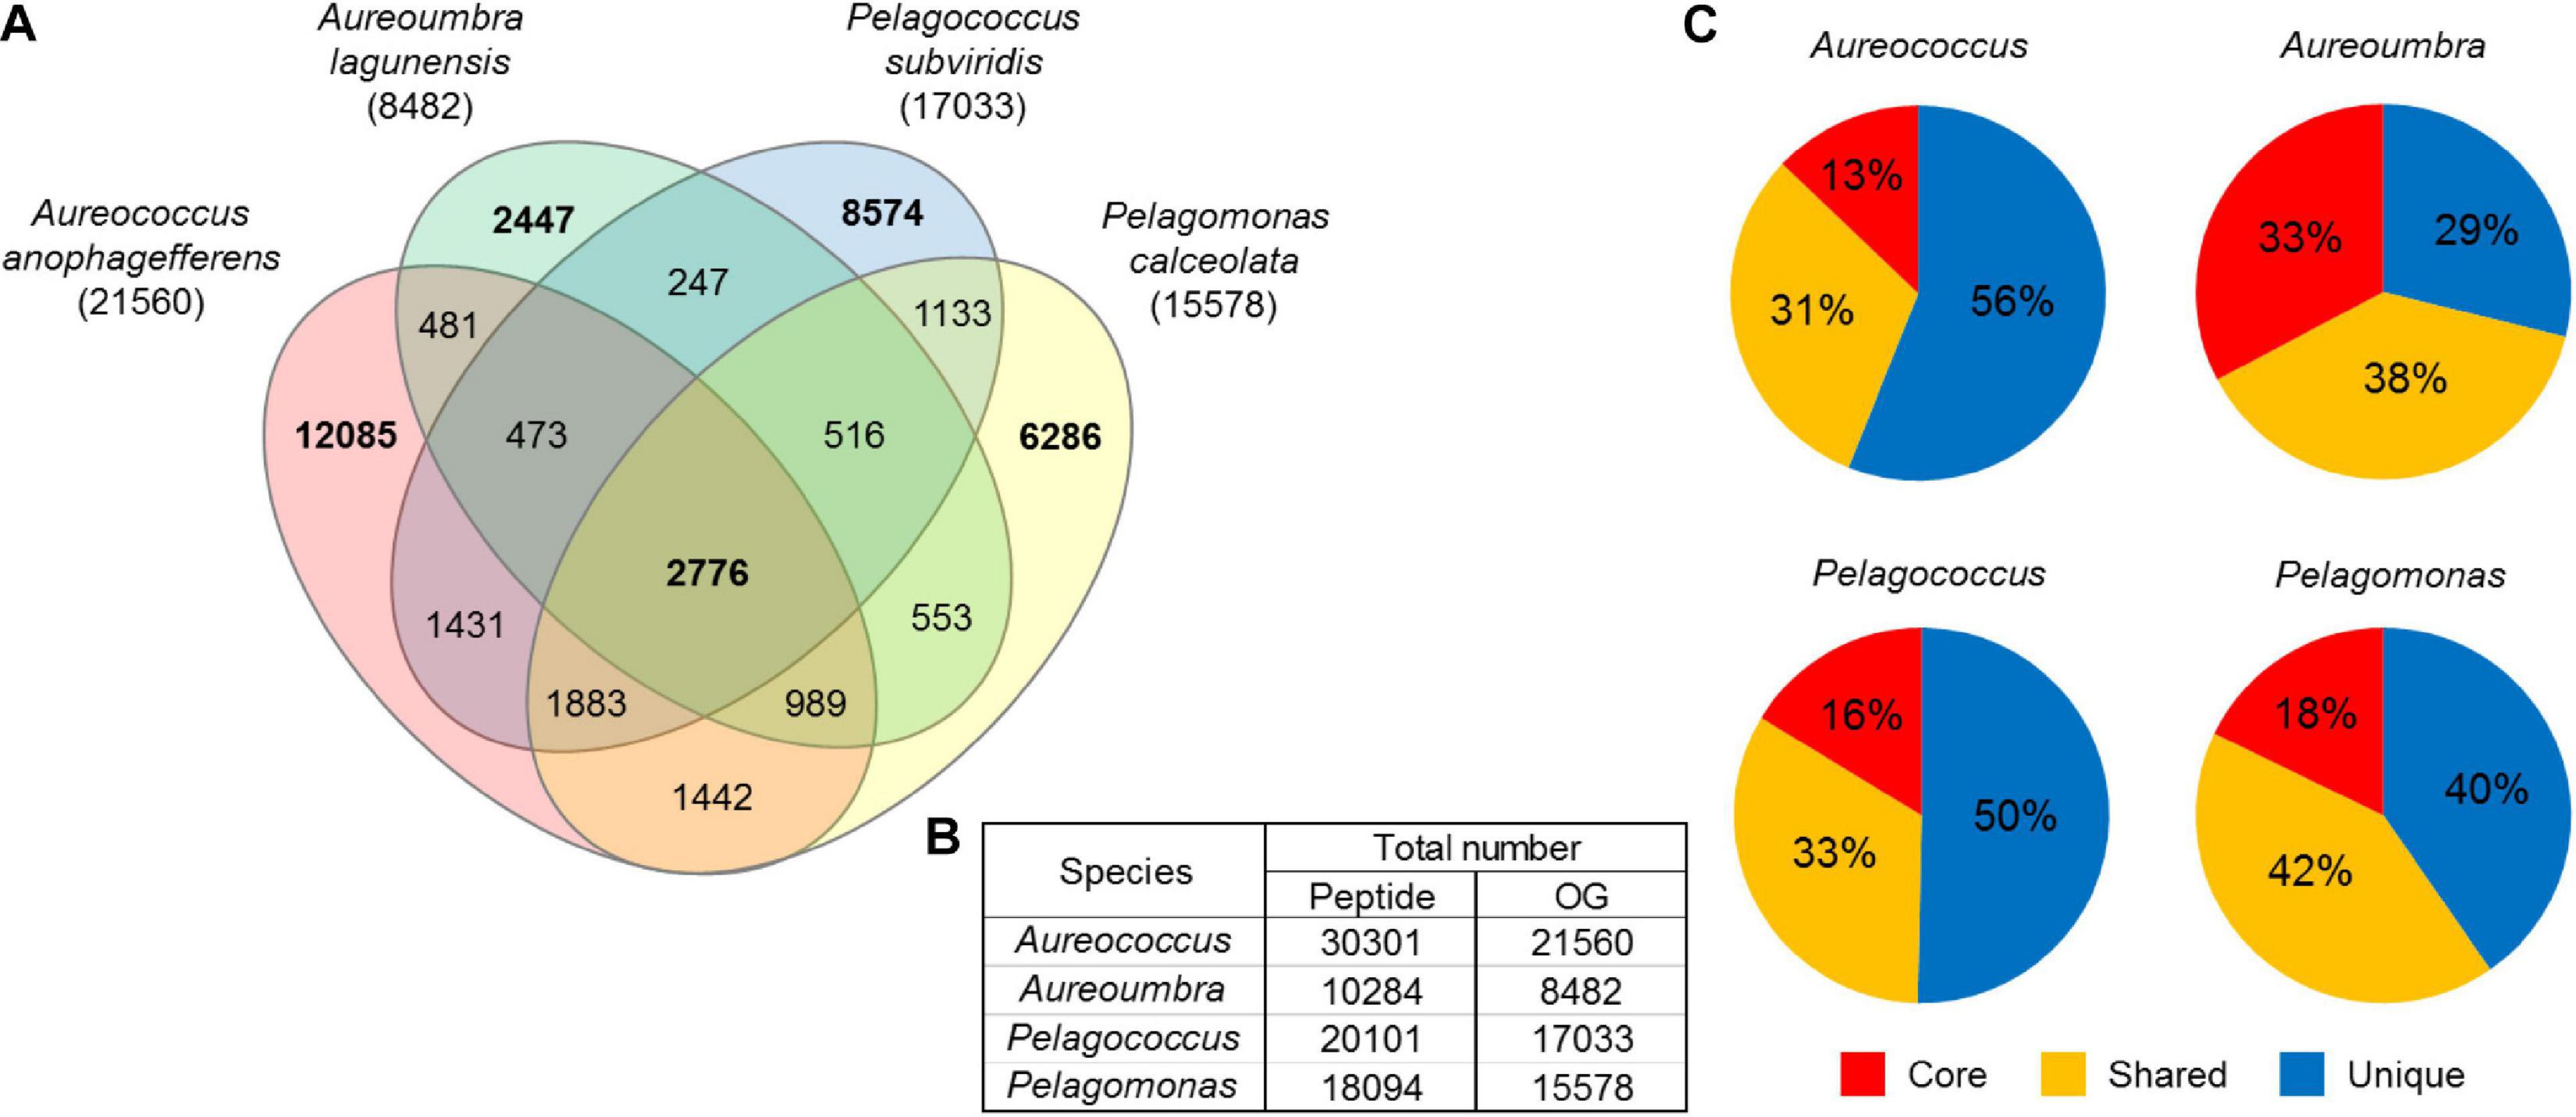
Figure 2. (A) Venn diagram displaying the number of core, shared, and unique OGs among the four pelagophytes where bold numbers are unique and core OGs, (B) the number of peptide sequences that were used for OrthoMCL analysis and the number of OGs after the analysis, and (C) the proportion of core (red), shared (yellow), and unique (blue) OGs in each species. Core OGs were found in all four species, shared OGs were expressed in two or three of the four species, and unique OGs were expressed in a single species.
Significant Changes in Relative Abundance of OGs Under Resource Stress
Raw read counts summed at the OG level were analyzed using ASC to identify differentially abundant OGs within each species and Bray-Curtis dissimilarity of OGs was used to assess compositional dissimilarity among four pelagophytes across treatments. Overall, pelagophytes responded to environmental stress differently. Response to low light was most different from responses to low N and low P among pelagophytes except for Aureococcus, which showed the most divergent response to low P and similar responses to low N and low light (Figure 3). Principal component analyses (PCA) of these responses (Supplementary Figure S3) highlighted that each pelagophyte had a species-specific signal that was greater that the specific responses to individual stressors.
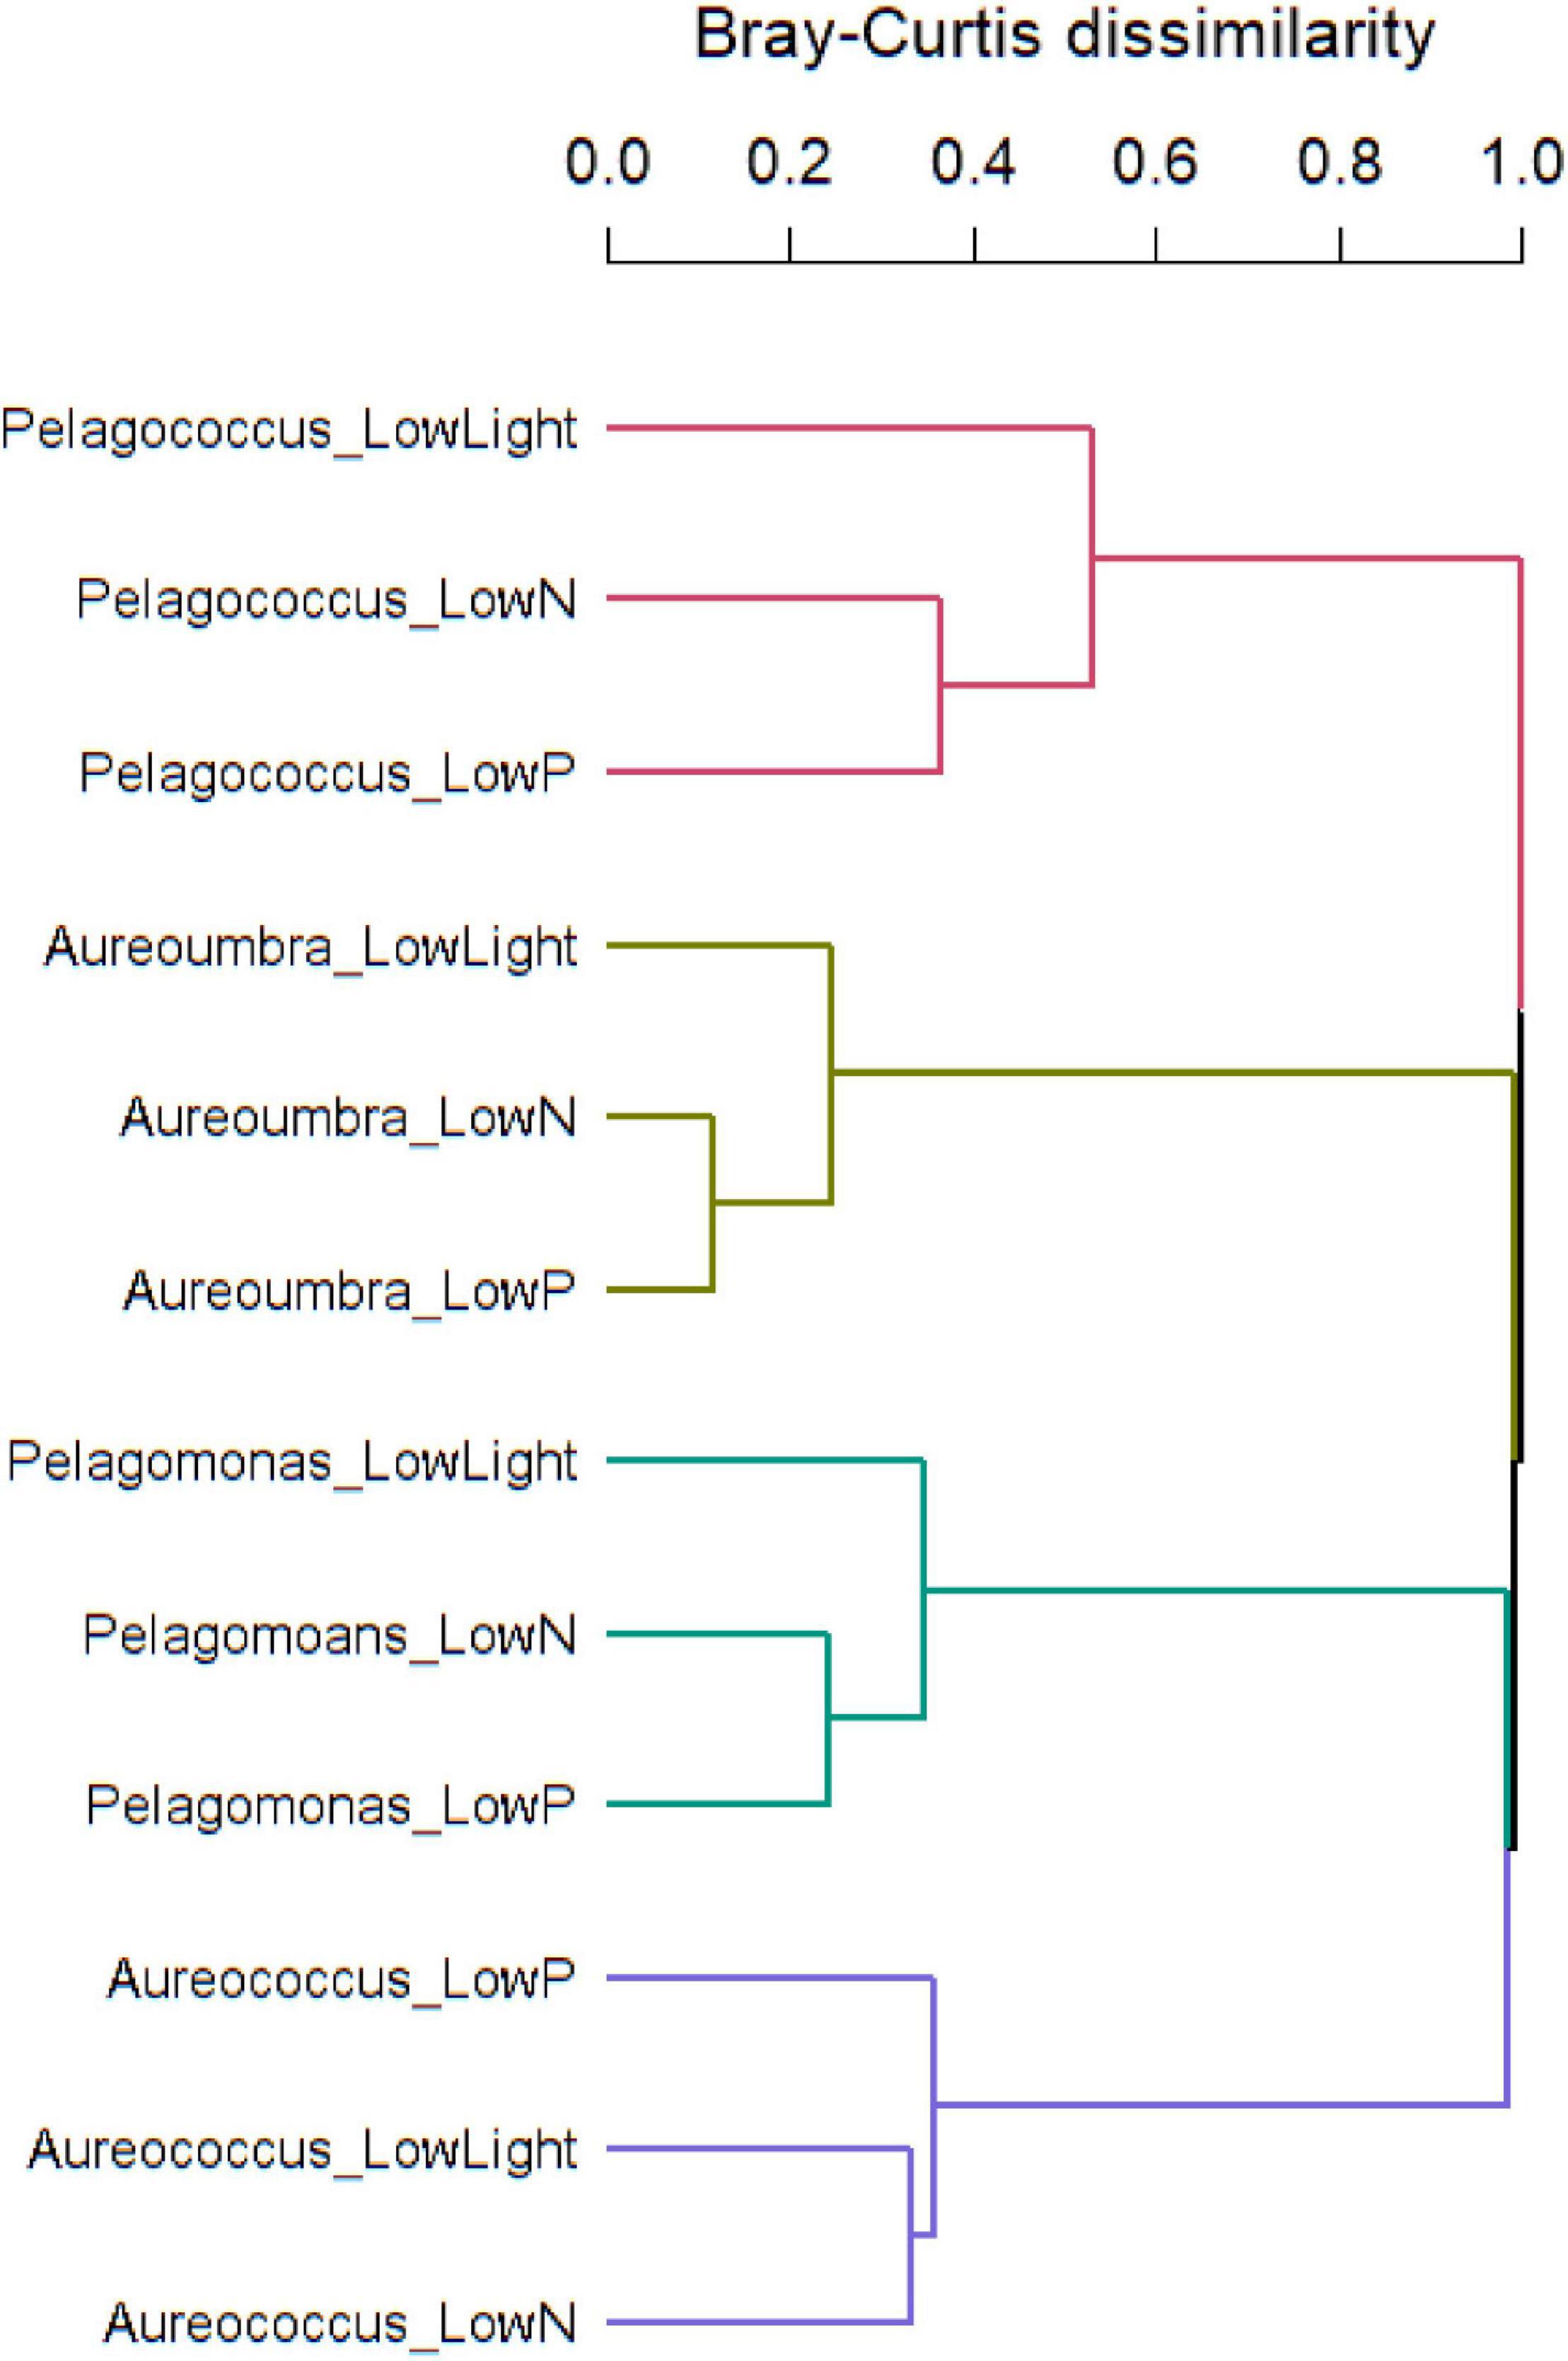
Figure 3. Bray-Curtis dissimilarity of OGs in response to treatments showing dissimilarity among four pelagophytes.
Of the total OGs generated, 4,879 OGs were differentially abundant among treatments with 936 OGs significantly increased and 3,943 OGs significantly decreased relative to the control (Figure 4). Among the total OGs that had increased relative transcript abundance compared to the replete condition, a disproportionate number (483 or 52%) came from Pelagomonas while 1,867 (or 47%) of the total OGs with significantly decreased relative transcript abundance the majority were from Aureococcus (Figure 4). The treatment eliciting the largest number of OGs with differentially abundant transcripts relative to replete varied among species; in low N for Aureoumbra (882 OGs), low P for Aureococcus (983 OGs), and low light for Pelagomonas (838 OGs) and Pelagococcus (101 OGs; Figure 4). There was no significant response to low P for Aureoumbra or Pelagococcus (Figure 4). The largest number of OGs with significantly increased relative abundance under low N occurred in Aureoumbra with 155 OGs (18%) and Pelagomonas with 132 OGs (46%) under low P, and 213 OGs in low light (Figure 4) while the largest number of OGs with a significant decrease in relative abundance varied among species; low N for Aureoumbra (727 OGs, 82%), low P for Aureococcus (910 OGs, 93%), and low light for Pelagomonas (625 OGs, 75%; Figure 4). For all four pelagophytes, there was a significant correlation between the relative decrease in growth rate compared to the control in each treatment and the percentage of OGs that had significantly decreased abundance in that treatment (Supplementary Figure S4).
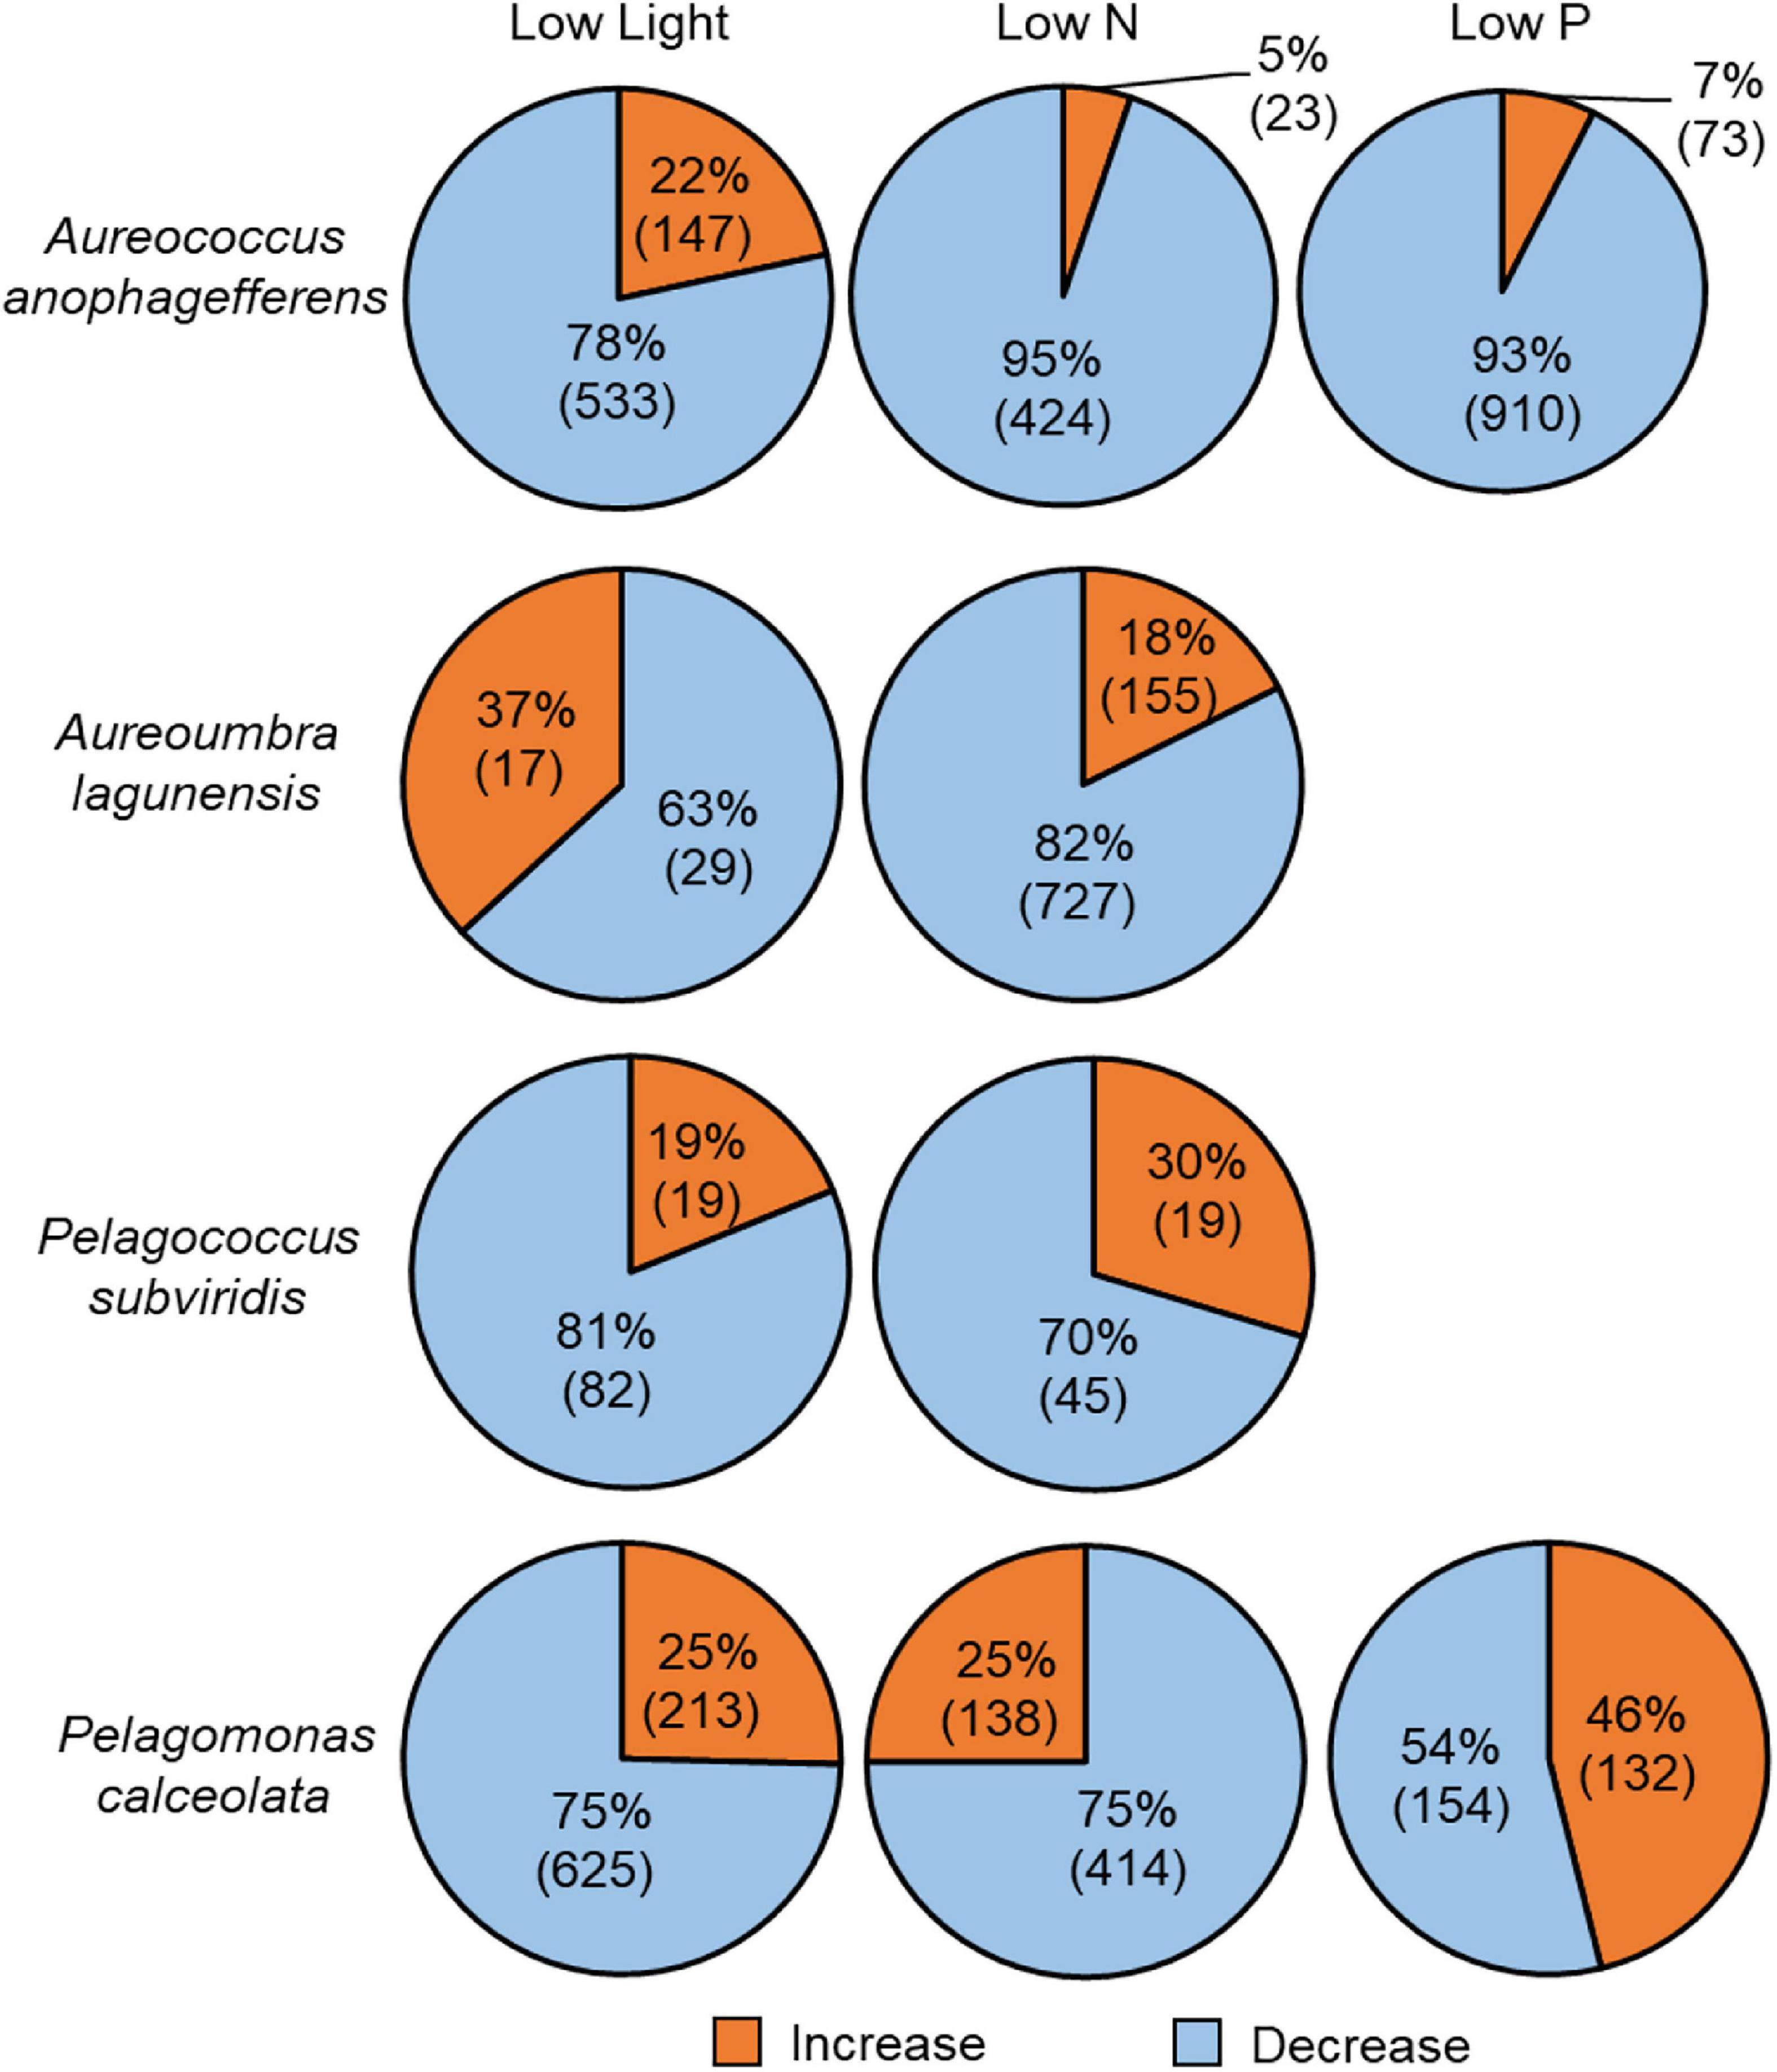
Figure 4. Proportion of all differentially abundant OGs relative to control in each species across treatments and number in parenthesis indicates the number of differentially abundant OGs. Blue denotes significant decreases in relative abundance and orange denotes significant increases in relative abundance. No differentially abundant OGs were detected in the low P treatment for Aureoumbra lagunensis or Pelagococcus subviridis.
While most of the KEGG-annotated and differentially abundant OGs were from core and shared OGs (3,655 OGs), the fraction of the differentially abundant total core/shared KEGG-annotated OGs differed by species; 83% for Aureococcus (1,755 OGs) and Pelagococcus (137 OGs), 77% for Pelagomonas (1,295 OGs), and 50% for Aureoumbra (468 OGs; Figure 5A). The fraction of unique KEGG-annotated OGs among the KEGG-annotated and differentially abundant OGs also differed by species; 50% for Aureoumbra (460 OGs), 23% for Pelagomonas (381 OGs), and 17% for Aureococcus (355 OGs) and Pelagococcus (28 OGs; Figure 5A). The number of KEGG-annotated differentially abundant OGs per treatment mostly ranged from 59 to 187 in Aureococcus, Aureoumbra, and Pelagomonas, with an overall smaller response observed in low-light Aureoumbra and both low-light and low N Pelagococcus (13 – 16; Figure 5B). Like patterns observed when considering all OGs, the treatment eliciting the largest number of KEGG-annotated differentially abundant OGs was low N for Aureoumbra (163), low P for Aureococcus (102), and low light for the open ocean pelagophytes, Pelagomonas (187) and Pelagococcus (16) (Figure 5B). Across species, a larger proportion of the differentially abundant OGs were attributed to energy metabolism, genetic information processing, carbohydrate and lipid metabolism, and transport systems (Figure 5B). The remaining KEGG-annotated OGs were dominated by six KEGG modules; genetic information processing (18%), energy metabolism (18%), carbohydrate and lipid metabolism (17%), nucleotide and amino acid metabolism (16%), transport system (15%) and cellular processes (14%) (Figure 5B).
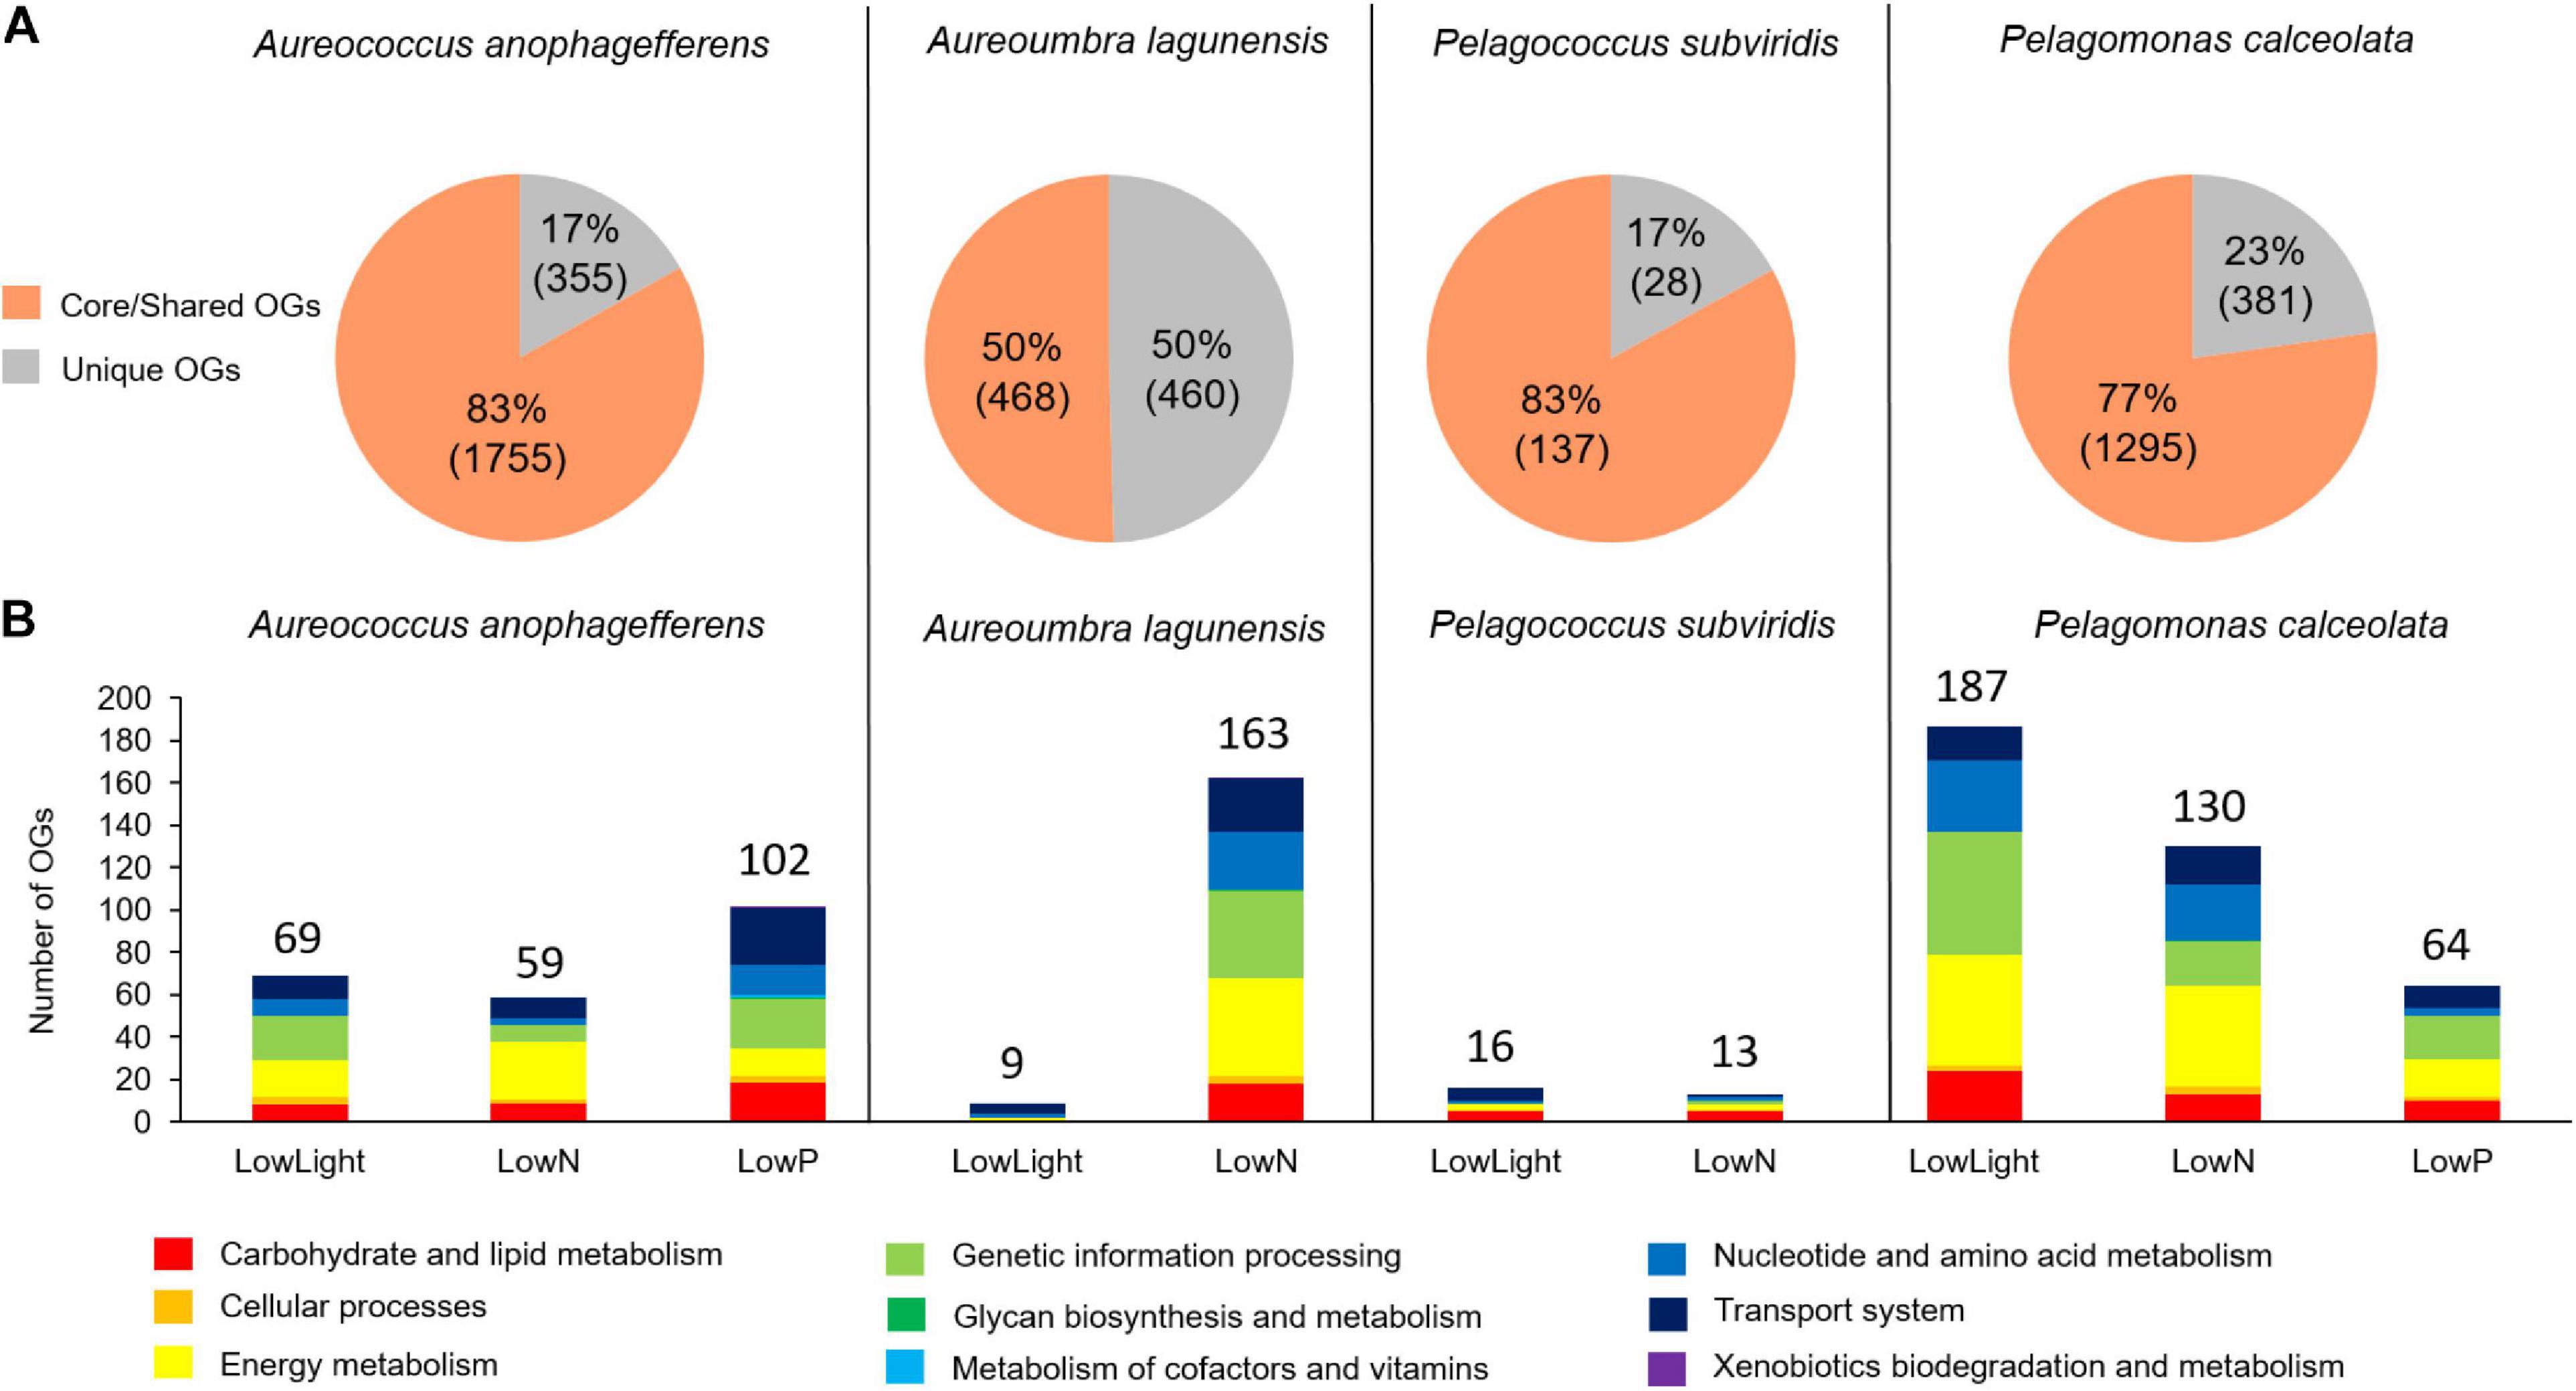
Figure 5. KEGG pathways of differentially abundant OGs from each species. (A) Proportion of core/shared and unique KEGG annotated and differentially abundant OGs, (B) KEGG modules that were annotated based on KEGG database and were differentially abundant among pelagophytes in response to three treatments.
Differentially Abundant OGs Related to Major Pathways
Differentially abundant OGs related to N metabolism included OGs encoding amino acid metabolism and N-relevant transporters as well as OGs associated with cleavage of organic N compounds (Figure 6A). Under N stress, OGs encoding arginase, cathepsin, urease, aspartate aminotransferase, aminotransferase, and an aminohexanoate cleavage enzyme all significantly increased in abundance in Pelagomonas (Figure 6A). Other pelagophytes had far fewer differentially abundant OGs associated with N stress, although an OG encoding urease increased in Aureoumbra and a second OG encoding aminotransferase had decreased relative abundance in Pelagomonas. Under low P, OGs related to inorganic pyrophosphatase were significantly increased in abundance in Aureococcus and Pelagomonas. Aureococcus also had OGs encoding phosphate transporters that were significantly increased in abundance as well as an alkaline phosphatase OG that was significantly decreased in abundance (Figure 6B).
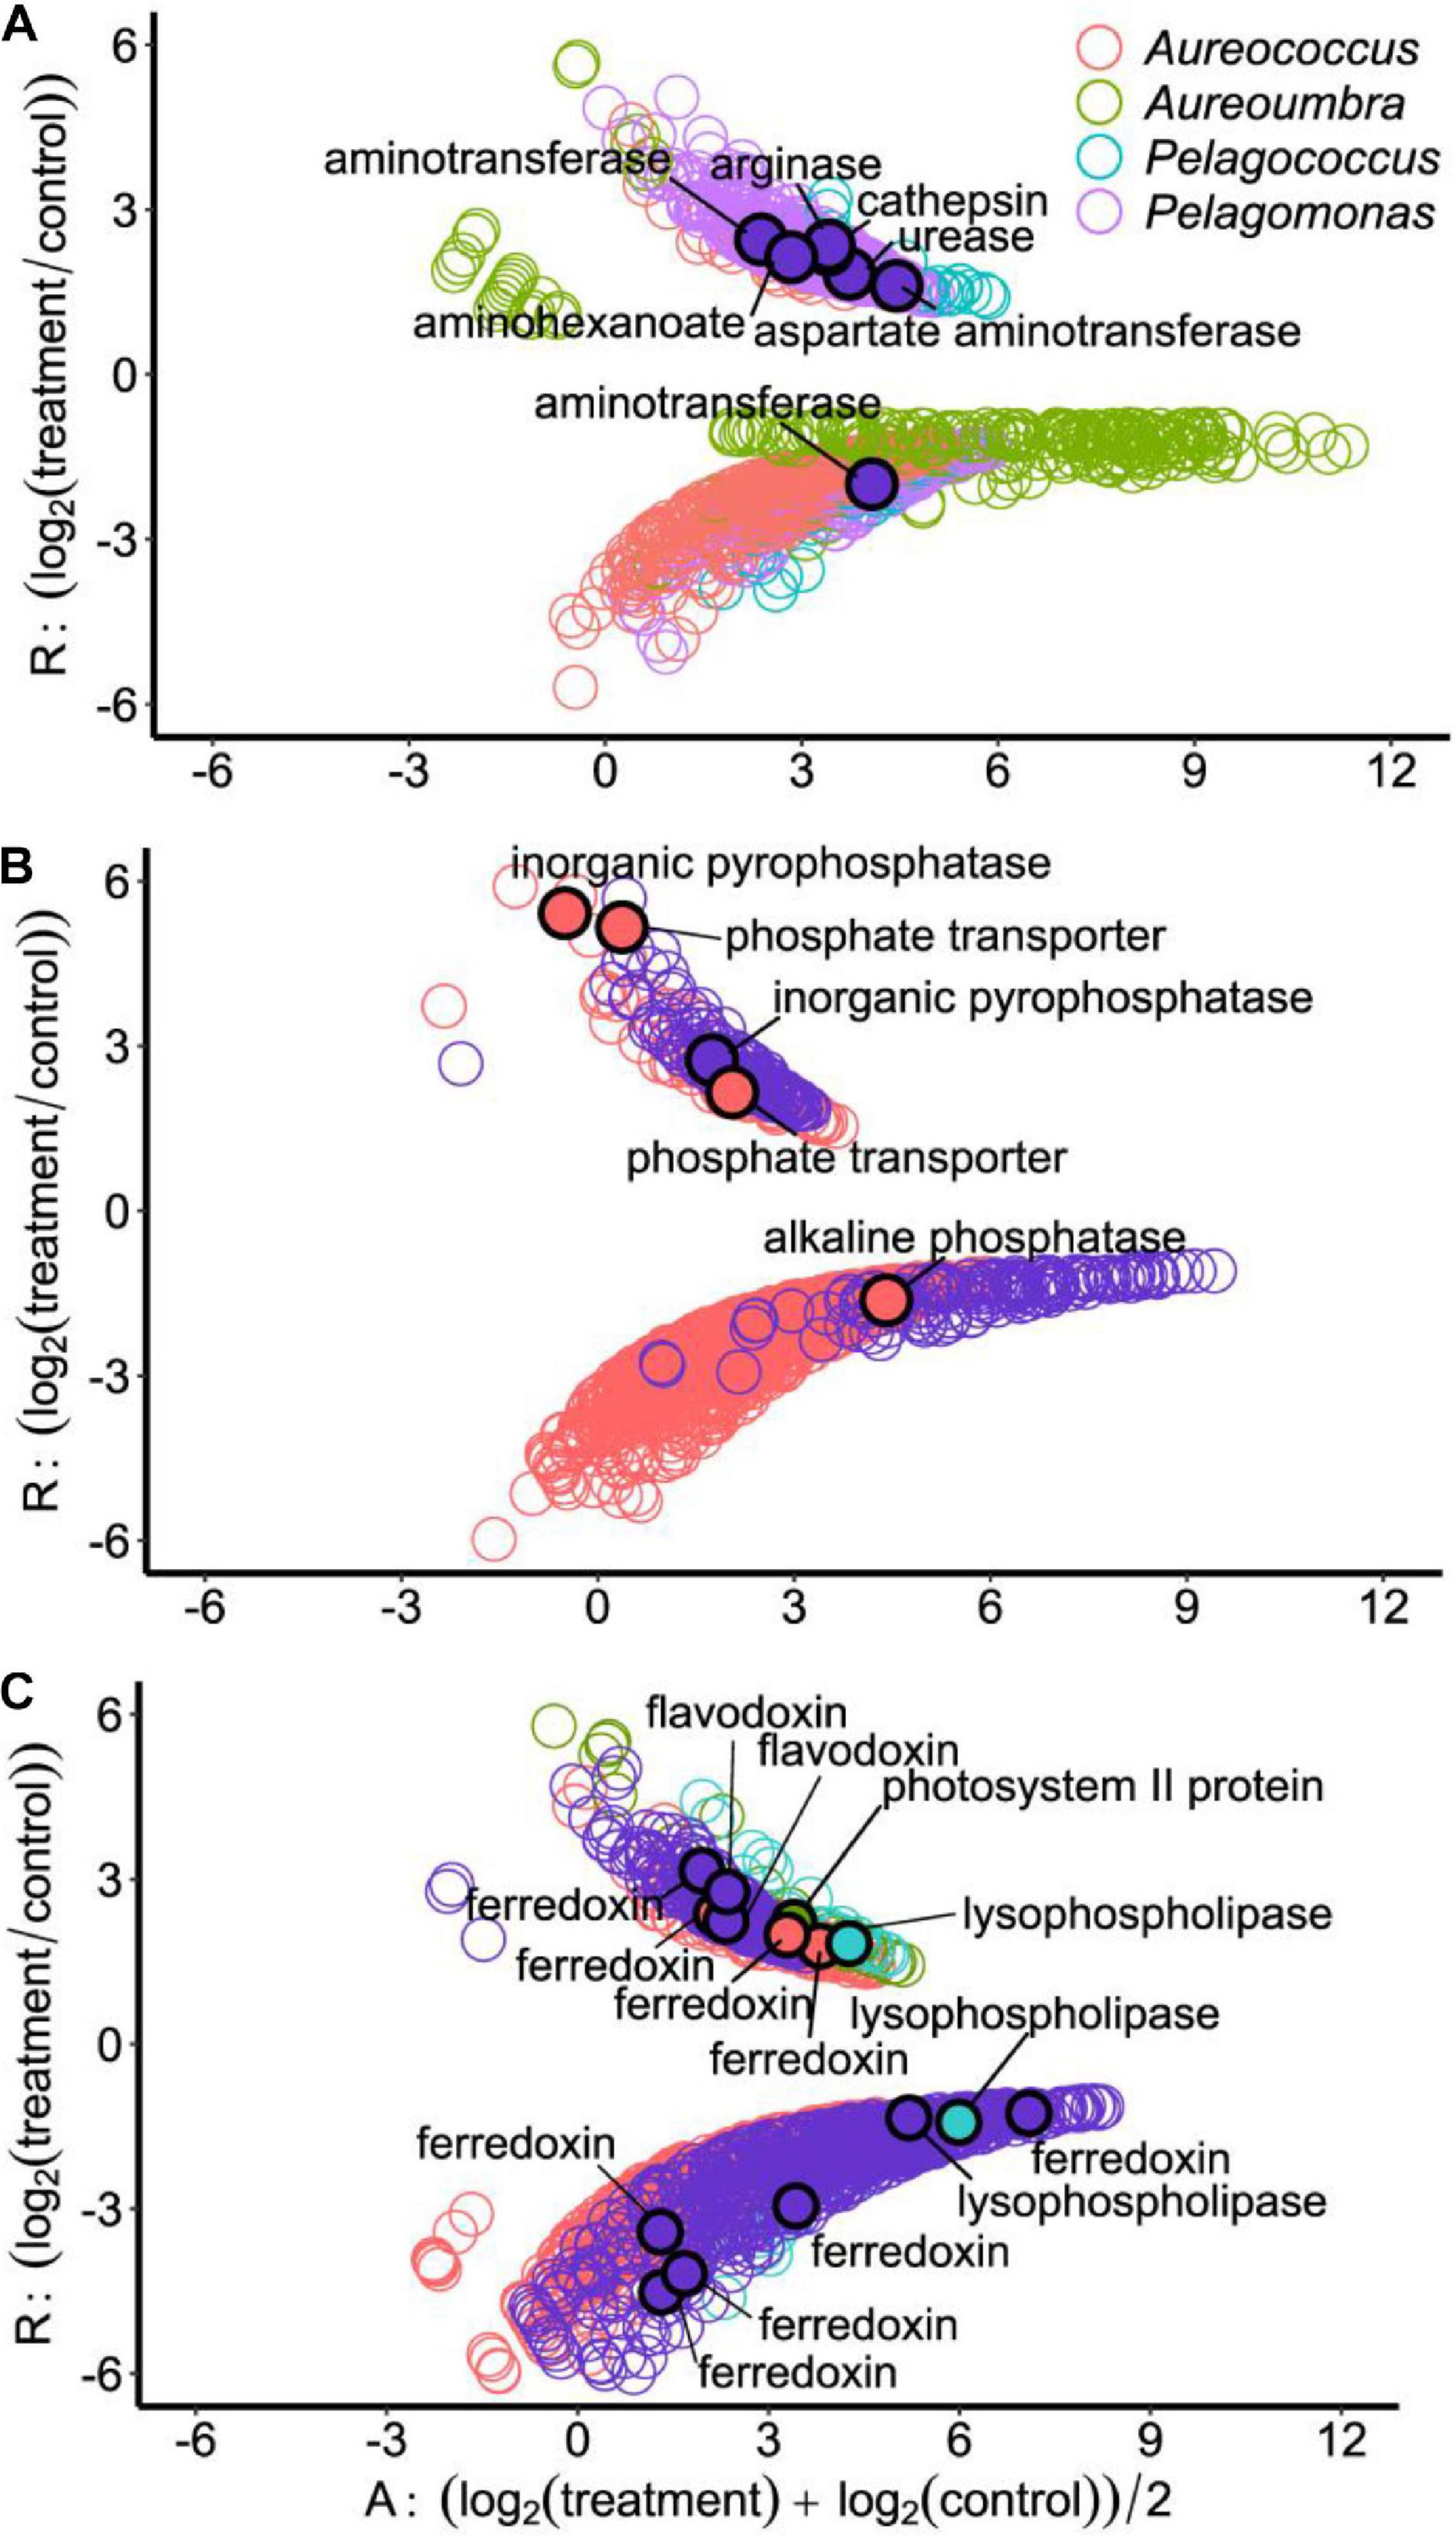
Figure 6. Ratio-Average (RA) plots of OGs among four pelagophytes in response to different treatments: (A) Low N, (B) Low P, and (C) Low light treatment. Each circle represents a differentially abundant OG and filled circles with black border represent differentially abundant OGs that are described in the text.
Low light was the treatment which elicited the largest number of differentially abundant OGs in Pelagomonas. Under low light, Pelagomonas had a flavodoxin OG with significantly increased relative abundance, five ferredoxin OGs with significantly lower relative abundance, and one ferredoxin OG with significantly higher relative abundance (Figure 6C). In contrast, Aureococcus had three ferredoxin OGs with higher relative abundance under low light (Figure 6C). The relative abundance of OGs encoding two lysophospholipases with one increased and another decreased under low light conditions for Pelagococcus as well as one decreased for Pelagomonas (Figure 6C). Lastly, an OG encoding a photosystem II protein had increased in abundance Aureoumbra in response to light stress (Figure 6C).
All treatments elicited a transcriptomic response in genes encoding selenocysteine-containing proteins, except for Pelagococcus (Figure 7). Methyltransferase OGs were a primary component of the differentially abundant selenocysteine-related OGs with a total number of 26 OGs that both decreased (18 OGs) and increased (8 OGs) in relative abundance across all treatments (Figure 7). OGs encoding thioredoxins also largely decreased in all treatments for all pelagophytes except Aureococcus and Pelagomonas (Figure 7). Lastly, OGs encoding glutaredoxin were observed to significantly increase and decrease in relative abundance for Pelagomonas and Aureoumbra (Figure 7).
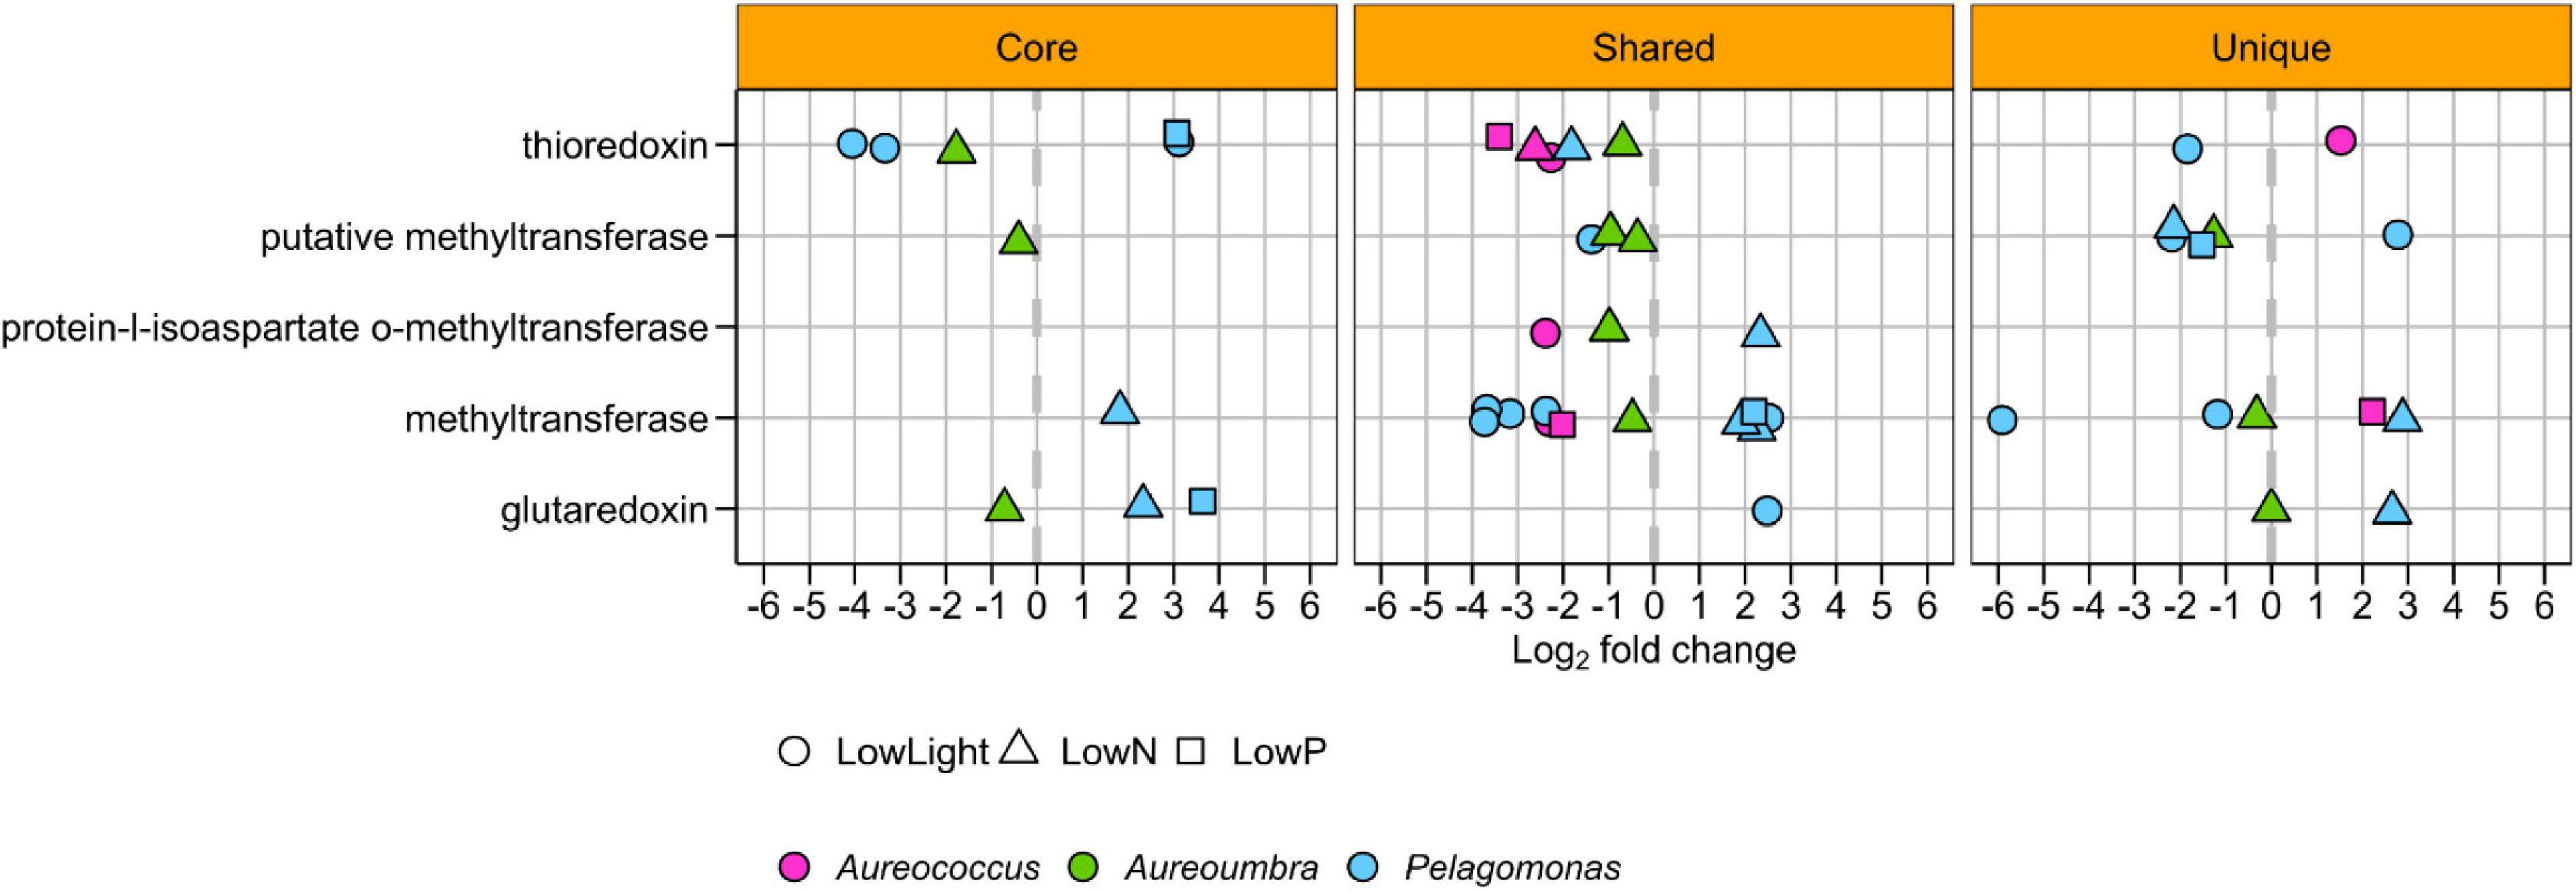
Figure 7. Significantly differentially abundant selenoprotein OGs among four pelagophytes across treatments relative to the control.
Various types of OGs encoding transporters were differentially abundant in all four pelagophytes with the largest responses in Aureococcus (48 OGs) and Pelagomonas (43 OGs), with the majority exhibiting significantly decreased relative abundance (44 OGs for Aureococcus and 26 OGs for Pelagomonas) across treatments (Figure 8). OGs encoding phosphate transporters were found to be responsive in Aureococcus at low P with significant increased relative abundance (Figures 6, 8). Aureococcus also had more OGs encoding ion and metal transporters with significantly increased relative abundance than other pelagophytes (Figure 8). A complete list of annotations for OGs and contigs can be found in Supplementary Table S4 and a list of differentially abundant OGs and their relevant information can be found in Supplementary Table S1.
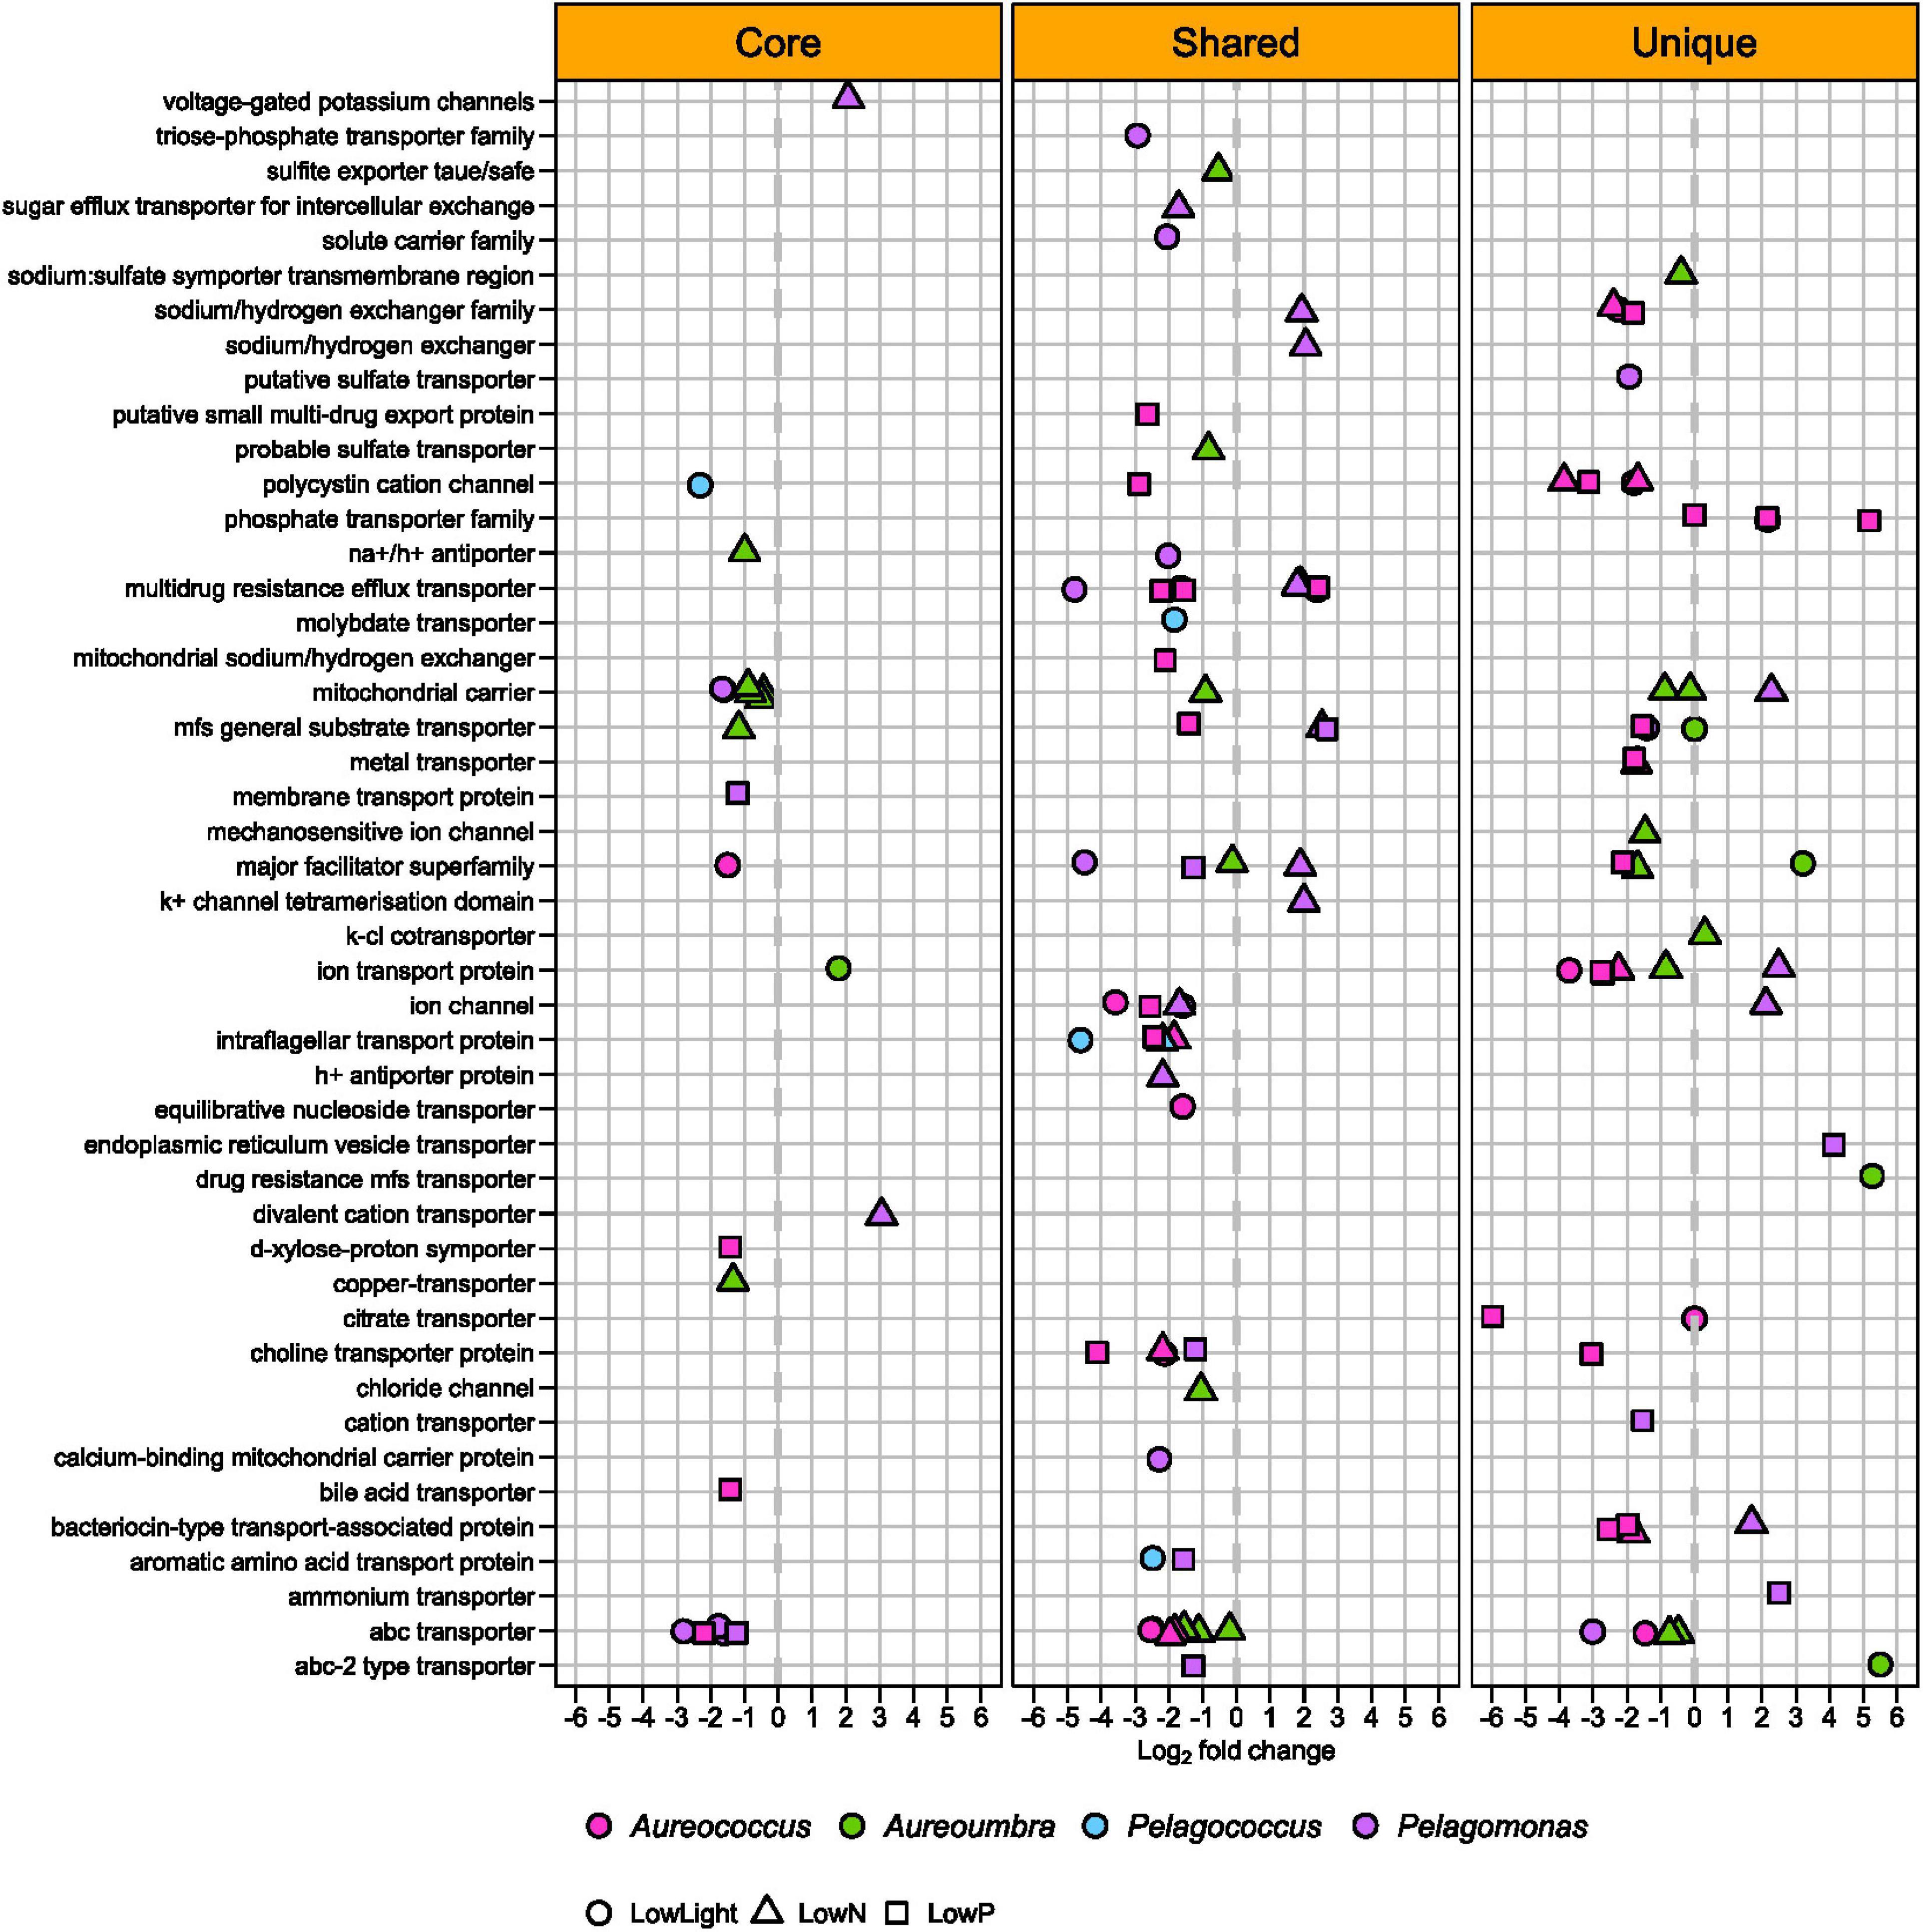
Figure 8. Differentially abundant OGs associated with transport among four pelagophytes across treatments relative to the control.
Discussion
In this study, transcriptional profiles were compared for four pelagophytes –Aureococcus, Aureoumbra, Pelagococcus, and Pelagomonas under low nutrient (N, P) and low light conditions that are commonly found in the ecosystems where they thrive and compete with other phytoplankton. The comparative analysis of transcriptomes provided insight regarding functional traits that may be essential for pelagophytes in such conditions. Changing abundances of transcripts representing light-related, N-related, P-related, selenocysteine-related, and transport were a common response among pelagophytes under similar conditions, indicating these gene sets may be associated with pathways that permit pelagophytes to persist and, in some cases, dominate marine ecosystems.
Core and Shared Significantly Abundant OGs in Pelagophytes
Orthologous proteins have been used to assess functional traits shared among multiple phytoplankton strains (Alexander et al., 2020) or species (Bender et al., 2014; Di Dato et al., 2015; Simmons et al., 2016; Harke et al., 2017). In this study, two-thirds of KEGG-assigned, differentially abundant OGs were core (present in all species) or shared (present in two or three species) among all pelagophytes suggesting similar pathway-level responses to nutrient and light stress (Figure 5A). Shared responses were also observed across these conditions for Aureococcus strains (Frischkorn et al., 2014). Of the four species considered, Aureococcus and Pelagomonas had the largest number of KEGG-assigned differentially abundant OGs, perhaps reflecting a broader response by these organisms to resource stress and their close phylogenetic relationship (Deyoe et al., 1995; Worden et al., 2012). Additionally, the intensity of some responses is also reflective of the intensity of resource stress within experimental treatments. While cell harvests were timed to occur when growth rates were slowed and physiological measurements were indicative of a resource stress response, the relative degree of stress differed among species examined and may have influenced the number and intensity of OG responses in each species. Lastly, in some cases, responses could be jointly attributed to minor variation in growth stage. While control cultures were always in exponential growth, some nutrient treatments were nearing or entering stationary phase (e.g., Pelagococcus), and slowed growth was associated with fewer differentially abundant OGs (Supplementary Figure S4).
Of note, the total number of OGs (21,560) for Aureococcus in this study was nearly twice the number of genes (11,520) reported for its genome (Gobler et al., 2011). The transcriptomes presented here are from a different strain (CCMP1850) than that of the sequenced genome (CCMP1984) which may account for some differences; however, prior efforts mapping transcriptome contigs to the Aureococcus genome revealed that some of these contigs map to the same gene, suggesting presence of isoforms, mRNA fragments, or assembly errors (Li and Jiang, 2012; Frischkorn et al., 2014). Further, Aureococcus was recently shown to be diploid which could influence transcriptome assembly (Huff et al., 2016). Finally, recent sequencing efforts using Nanopore sequencing technology for multiple strains of Aureococcus, including the strain studies here suggest Aureococcus has ∼25,000 predicted genes (John Archibald, Dalhousie University; pers. comm.), a number highly similar to the number of predicted OGs by the current study (21,560).
Differentially Abundant OGs Associated With Low N
In coastal ecosystems, the pelagophytes Aureococcus and Aureoumbra are able to proliferate when DIN levels are low by utilizing DON (Gobler et al., 2004, 2013a). Measurement of 15N uptake rates per cell using sorting flow cytometry revealed that Aureococcus assimilates urea faster than co-occurring picoplankton (Kang et al., 2017). Further, the whole genome study of Aureococcus identified more genes associated with organic N metabolism compared to other phytoplankton (Gobler et al., 2011) and a proteomic study of Aureoumbra highlighted the potential utilization of regenerated, extracellular, organic nutrients (Sun et al., 2012). Responses to low N in the current study for these two species were less clear despite strong overall transcriptional and physiological responses to N stress. For example, only one Aureoumbra urease ortholog was significantly decreased in relative abundance under low N (Supplementary Table S4) while no response was observed in Aureococcus among shared OGs. In prior studies with Aureococcus, this species displayed both increased and decreased transcription of urea transporters under N stress (Berg et al., 2008; Wurch et al., 2011b; Dong et al., 2014). This is either due to differing limiting conditions between studies, variations in growth stage relative to resource stress, or the conservative nature of ASC in identifying significant response as has been documented in other studies (Frischkorn et al., 2014; Harke et al., 2017).
With regards to the open ocean species, under low N conditions while Pelagococcus was lack of the significantly abundant transcripts associated with low N, Pelagomonas displayed a significantly increased abundance of transcripts for genes related to the cleavage of organic N compounds, suggesting that increased expression of these enzymes may be a survival strategy of Pelagomonas under low N conditions. Pelagomonas is commonly found in oligotrophic open oceans and is highly abundant at DCM (Simon et al., 1994; Andersen et al., 1996), especially at the deeper depth within the DCM (Latasa et al., 2017). In the DCM of the eastern North Pacific subtropical ocean, Pelagomonas is estimated to be responsible for most of the nitrate assimilation, expressing genes for nitrate transporters, carbamoyl-phosphate synthase, and a ferredoxin-dependent glutamate synthase in support of this process (Dupont et al., 2014). However, in low nitrate surface waters (Johnson et al., 2010), the transcriptional profile of Pelagomonas shifts to predominantly stress proteins and chaperones, suggesting nutrient stress (Dupont et al., 2014). The ability of Pelagomonas to catabolize DON compounds under DIN-limited conditions, as evidenced here by increased abundance of cathepsin, urease, and arginase transcripts (involved in the breakdown of proteins and the urea cycle), could allow this species to compete with co-existing picoplankton such as Prochlorococcus, which is known to assimilate DON at a high rate in open ocean ecosystems (Zubkov et al., 2003) where bacterially mediated nutrient regeneration exceeds nitrate production (Azam et al., 1994). We hypothesize that Pelagomonas may vertically partition its physiological strategies with cells in low nitrate surface waters using DON and those within the DCM using nitrate. The ability to exploit organic N sources, such as that observed here in Pelagomonas, is consistent with modeling studies where enhanced nutrient recycling, in part, supports picoplankton growth in a warmer ocean (Flombaum et al., 2020).
Differentially Abundant OGs Associated With Low P
While phytoplankton in the open ocean are usually considered N-limited, phosphate is present at only nanomolar concentrations in surface oligotrophic oceans (Martiny et al., 2019), forcing many microbes to rely on DOP for growth (Dyhrman et al., 2007). In contrast to the open ocean, DIP and DOP are relatively copious in shallow coastal waters due to fluxes from sediments (Boynton and Kemp, 1985; Sundby et al., 1992), rapid regeneration in the water column (Benitez-Nelson, 2000) and/or input from riverine discharge (Hellweger et al., 2016). However, previous studies have shown that in some cases brown tides can be P-limited and may significantly reduce DOP levels as the bloom peaks in biomass (Gobler et al., 2004; Wurch et al., 2019). Laboratory growth experiments (Muhlstein and Villareal, 2007) as well as genomic and transcriptomic analyses (Gobler et al., 2011; Wurch et al., 2011b; Frischkorn et al., 2014) have suggested that Aureococcus possesses the ability to utilize P from a variety of organic compounds. As such, both coastal and open ocean pelagophytes could experience P stress in situ. Aureococcus has a robust response to P-stress with the induction of genes and proteins related to phosphate transport, the metabolism or DOP and arsenate detoxification in both culture and field populations (Wurch et al., 2011b, 2019; Frischkorn et al., 2014). Further, genes involved P uptake and metabolism such as pyrophosphatase and phosphate transporters had increased relative abundance in Pelagomonas populations in the DCM relative to surface waters of the eastern North Pacific subtropical ocean (Dupont et al., 2014). Consistent with this literature, Aureococcus and Pelagomonas transcriptomes were characterized by altered transcript abundance of phosphate transporter, inorganic pyrophosphatases and or arsenate detoxification OGs. One Aureococcus phosphate transporter OG showed decreased relative abundance in low P while two others increased (Supplementary Table S4). The affinities of these differentially abundant phosphate transporters in Aureococcus may be varied, as differences in the expression of phosphate transporters have been described previously in the proteomic response of Aureococcus to P deficiency (Wurch et al., 2011a) and in studies of other marine phytoplankton (Chung et al., 2013; Monier et al., 2012) and higher plants (Mitsukawa et al., 1997). Additionally, the Aureococcus phosphate transporter OGs contained a single contig in each OG, suggesting that multiple OGs encoding phosphate transporters in Aureococcus more likely represent different types of transporters than copies of the same phosphate transporter, consistent with genomic observations (CCMP1984, Gobler et al., 2011).
Pyrophosphatases hydrolyze inorganic pyrophosphate to produce two molecules of phosphate (Chiou and Lin, 2011). In higher plants, high expression of inorganic pyrophosphatase genes is observed under P-deficient conditions (Hernández-Domíguez et al., 2012). Both coastal and open ocean pelagophytes (i.e., Aureococcus and Pelagomonas) displayed increased abundance of OGs encoding inorganic pyrophosphatase under low P (and for Pelagomonas also under low N; Supplementary Table S4), suggesting the use of intracellularly recycled phosphate originating from pyrophosphate may be a common molecular response that allows pelagophytes to survive extended periods of low P. Finally, Pelagomonas displayed an increased abundance of an arsenite methyltransferase OG under low P (Supplementary Table S4). Since inorganic phosphate transporters cannot discriminate between phosphate and arsenate, phytoplankton have been shown to accumulate high levels of arsenate when P is limited (Budd and Craig, 1981; Hellweger et al., 2003; Silver and Phung, 2005). Phytoplankton often reduce arsenate to arsenite intracellularly and use arsenite methyltransferase to make dimethylarsinite, which has lower cellular toxicity than arsenate or arsenite (Hellweger et al., 2003). The P modulation of transcripts for an arsenite translocating ATPase was previously reported in both Aureococcus culture and field populations (Wurch et al., 2019), consistent with the P modulation of arsenate detoxification in pelagophytes.
In contrast to Aureococcus and Pelagomonas, transcriptional responses to low P in Aureoumbra and Pelagococcus were muted. The P-stress in Aureoumbra and Pelagococcus might not have been sufficient enough to induce significant differences expression of all genes involved in P stress compared to replete cultures. Aureoumbra has an extremely high N:P ratio (> 100) and forms blooms within high salinity, low P lagoon, suggesting that Aureoumbra has a high tolerance to P-limitation (Liu et al., 2001). Unlike other pelagophytes, physiological characteristics of Pelagococcus have been rarely investigated but given the responses here, it is assumed that Pelagococcus is also has a high tolerance to P-limitation.
Differentially Abundant OGs Associated With Photosynthesis and Lipid Metabolism
While all experimental conditions altered the expression of OGs related to lipid metabolism (e.g., lysophospholipase) and photosynthesis (e.g., flavodoxin and ferredoxin) in the four pelagophytes (Supplementary Table S4), only the low light condition had significantly increased expression of these OGs: lysophospholipase in Pelagococcus, ferredoxin in Aureococcus, and ferredoxin and flavodoxin in Pelagomonas. Lysophospholipases are located in cell membranes and cleave lysophospholipids to liberate fatty acids that are then metabolized or used in membrane restructuring (Pride et al., 2013). For most of these pelagophytes, the OGs decreased in abundance when growth rate was limited, but Pelagococcus showed an increase in expression of one lysophospholipase OG under low light suggesting this pelagophyte may more actively rearrange and recycle cell membranes compared to other pelagophytes in response to low light conditions. While the biogeographic distribution of Pelagococcus is poorly described, like Pelagomonas, this alga may also specialize at the DCM (Dupont et al., 2014) where acclimation to low light may be an important survival strategy.
Ferredoxin delivers electrons generated via photosynthesis to metabolic processes (Hase et al., 2006) and can be replaced with the isofunctional flavodoxin which, unlike ferredoxin, does not require iron (Fe) as a co-factor (Sancho, 2006). Low light induced an increase in the number of transcripts for OGs encoding ferredoxin in Aureococcus whereas Pelagomonas displayed a significant increase in abundance for flavodoxin OGs and significant decreases in abundance for 5 of 6 ferredoxin OGs. Pelagomonas also showed increased abundance of flavodoxin in low N and low P, along with changes in ferredoxin transcript levels in low N (Supplementary Table S4). Iron (Fe) is typically more limited in the open ocean (albeit particularly in surface waters) than coastal waters (Boyd and Ellwood, 2010). Increased abundance of enzymes associated with photosynthesis during low light adaptation, including ferredoxin, creates a large Fe demand (Hase et al., 2006). As Aureococcus commonly occurs in coastal waters and therefore is exposed to high levels of Fe (Gobler et al., 2002), it may never be Fe-limited, and thus likely relies exclusively on ferredoxin for photosynthesis. The decline in both flavodoxin and ferredoxin OGs in low N for Aureoumbra suggests a different response in this organism, perhaps a general decline in photosynthesis as indicated by a decline in photosystem II protein-coding gene transcripts in low N (Supplementary Table S4). In contrast, Pelagomonas, whose pelagic habitats are low in Fe, may increase the abundance of flavodoxin under low light to assist its dominance in the DCM while coping with the potential co-stress of Fe and light.
Differentially Abundant OGs Associated With the Selenoproteome
Selenium is an essential trace element, being incorporated into selenocysteine (Sec) proteins during translation, including the oxidoreductases formate dehydrogenase H, glutathione peroxidase, methionine sulfoxide reductase, and thioredoxin (Kim et al., 2015). Selenocystein-related proteins are often involved in regulating cellular redox homeostasis (Stadtman, 1996; Lobanov et al., 2009), playing this role in all three domains of life (Hawkes and Alkan, 2010). Aureococcus possesses the largest and the most diverse selenoproteome identified to date (Gobler et al., 2013b) and many selenocysteine-related OGs were differentially abundant by all of the pelagophytes except for Pelagococcus during this study (Figure 7). While all pelagophytes, except for Pelagococcus, had thioredoxin OGs which decreased in relative abundance under resource-stressed conditions, Aureococcus and Pelagomonas also had thioredoxin OGs which increased in relative abundance under low light and low P and decreased in low N (Figure 7), potentially indicating these proteins were important for combating cellular stress under these conditions (Stadtman, 1996; Lobanov et al., 2009). While the regulation and role of the selenoproteome in these pelagophytes requires additional study to fully resolve, here we highlight transcripts that were responsive to light and nutrients, thus highlighting targets for further work.
Differentially Abundant OGs Associated With Ion Transport
While OGs coding for various types of transporters were significantly increased or decreased in relative abundance in all four pelagophytes under all three stresses, the largest response was found in Aureococcus (48 OGs out of 106 OGs), which displayed decreased relative abundance in transcripts for many transporters (42 OGs out of 106 OGs) in all treatments. Aureococcus is known to possess more genes coding for molybdenum, copper, and nickel-containing enzymes and other metal and ion transporters compared to competing algae, a trait permitting Aureococcus to access abundant metals in coastal environments to form high biomass blooms (Gobler et al., 2011). The lowered relative transcript abundance of all of these transporters in Aureococcus in all treatments is likely related to their slowed growth and thus lowered requirement for metals and ions as well as the need to allocate energy to other, more vital cellular processes. In contrast, the open ocean alga, Pelagomonas, had a more balanced change in transporters with increased relative abundance in transcripts for 17 OGs and decreased relative abundance in transcripts for 26 OGs, perhaps reflecting a switch from low to high affinity transporters that permit persistence in a low resource environment (Levy et al., 2011).
Conclusion
In summary, nutrient and light stress triggered significant changes in abundance patterns for OGs encoding genes associated with energy and lipid metabolism among four pelagophytes. Specific OGs that were differentially abundant under low N, low P, and low light included genes associated with cleavage of organic N compounds, intracellular P recycling, lipid hydrolysis, electron transport, and redox homeostasis. Collectively, this study reveals core, shared and unique aspects of both the coastal pelagophyte and the open ocean pelagophyte transcriptomes and how they are uniquely modified in response to stress. Moving forward, these transcriptomes will serve as a critical reference database for further evaluating how pelagophytes thrive in such a diversity of environments.
Data Availability Statement
The datasets presented in this study can be found in online repositories. The names of the repository/repositories and accession number(s) can be found in the article/Supplementary Material.
Author Contributions
CG, MH, and DB contributed to conception and design of the study. MH performed the experiments. YK and MH organized the database and performed the statistical analysis. YK, MH, and DB developed and refined methods. CG and YK wrote the first draft of the manuscript. All authors contributed to manuscript preparation, read, and approved the submitted version.
Funding
This project was made possible by a sequencing grant from the Gordon and Betty Moore Foundation’s Marine Microbial Eukaryote Transcriptome Sequencing Project (MMETSP). The effort was further supported by NOAA’s ECOHAB program grants NA15NOS4780199 (SD), NA09NOA4780206 (SD and CG), and NA15NOS4780183 (CG).
Conflict of Interest
The authors declare that the research was conducted in the absence of any commercial or financial relationships that could be construed as a potential conflict of interest.
Acknowledgments
As a part of the Marine Microbial Eukaryote Transcriptome Sequencing Project (MMETSP), samples were sequenced, assembled, and annotated with the BPA2.0 pipeline at the National Center for Genome Resources (NCGR) with support from the Gordon and Betty Moore Foundation. We thank Eric Gann for critical review.
Supplementary Material
The Supplementary Material for this article can be found online at: https://www.frontiersin.org/articles/10.3389/fmars.2021.636699/full#supplementary-material
Supplementary Figure 1 | The number of OGs that have single contigs or multiple contigs present within the total OGs.
Supplementary Figure 2 | BUSCO analysis comparison of four pelagophyte transcriptomes for quantitative assessment of assemblies. (A) Completeness of four pelagophytes transcriptomes (Total). (B) Completeness of core OGs. Complete indicates contigs when contig lengths are within standard deviations of BUSCO groups mean length, fragmented indicates contigs when contigs are only partially recovered, and missing indicates contigs when contigs are not recovered.
Supplementary Figure 3 | Principal component analysis (PCA) of OGs. AaLl, Aureococcus anophagefferens in low light; AaLn, Aureococcus anophagefferens in low N; AaLp, Aureococcus anophagefferens in low P; AlLl, Aureoumbra lagunensis in low light; AlLn, Aureoumbra lagunensis in low N; AlLp, Aureoumbra lagunensis in low P; PsLl, Pelagococcus subviridis in low light; PsLn, Pelagococcus subviridis in low N; PsLp, Pelagococcus subviridis in low P; PcLl, Pelagomonas calceolata in low light; PcLl, Pelagomonas calceolata in low N; PcLp, Pelagomonas calceolata in low P.
Supplementary Figure 4 | Regression plot depicting the significant relationship (p < 0.01) between the relative difference in growth rate for each treatment relative to the control and the percentage of OG with decreased abundance in each treatment for Aureococcus anophagefferens (Aa), Aureoumbra lagunensis (Al), Pelagococcus subviridis (Ps), and Pelagomonas calceolata (Pc).
Footnotes
- ^ http://data.imicrobe.us
- ^ http://genome.jp/tools/kaas/
- ^ https://de.iplantcollaborative.org/de/
- ^ http://busco.ezlab.org/
- ^ http://www.rstudio.com/
References
Alexander, H., Jenkins, B. D., Rynearson, T. A., and Dyhrman, S. T. (2015). Metatranscriptome analyses indicate resource partitioning between diatoms in the field. Proc. Natl. Acad. Sci. U.S.A. 112, E2182– E2190.
Alexander, H., Rouco, M., Haley, S. T., and Dyhrman, S. T. (2020). Transcriptional response of Emiliania huxleyi under changing nutrient environments in the North Pacific Subtropical Gyre. Environ. Microbiol. 22, 1847–1860. doi: 10.1111/1462-2920.14942
Altschul, S. F., Gish, W., Miller, W., Myers, E. W., and Lipman, D. J. (1990). Basic local alignment search tool. J. Mol. Biol. 215, 403–410.
Andersen, R. A., Bidigare, R. R., Keller, M. D., and Latasa, M. (1996). A comparison of HPLC pigment signatures and electron microscopic observations for oligotrophic waters of the North Atlantic and Pacific Oceans. Deep-Sea Res. Pt Ii 43, 517–537. doi: 10.1016/0967-0645(95)00095-x
Azam, F., Smith, D., Steward, G., and Hagström, Å (1994). Bacteria-organic matter coupling and its significance for oceanic carbon cycling. Microb. Ecol. 28, 167–179. doi: 10.1007/bf00166806
Bateman, A., Coin, L., Durbin, R., Finn, R. D., Hollich, V., Griffiths-Jones, S., et al. (2004). The Pfam protein families database. Nucleic Acids Res. 32, D138–D141.
Bender, S. J., Durkin, C. A., Berthiaume, C. T., Morales, R. L., and Armbrust, E. V. (2014). Transcriptional responses of three model diatoms to nitrate limitation of growth. Front. Mar. Sci. 1:3. doi: 10.3389/fmars.2014.00003
Benitez-Nelson, C. R. (2000). The biogeochemical cycling of phosphorus in marine systems. Earth-Sci. Rev. 51, 109–135. doi: 10.1016/s0012-8252(00)00018-0
Berg, G. M., Shrager, J., Glockner, G., Arrigo, K. R., and Grossman, A. R. (2008). Understanding nitrogen limitation in Aureococcus anophagefferens (Pelagophyceae) through cDNA and qRT-PCR analysis. J. Phycol. 44, 1235–1249. doi: 10.1111/j.1529-8817.2008.00571.x
Boyd, P., and Ellwood, M. (2010). The biogeochemical cycle of iron in the ocean. Nat. Geosci. 3, 675–682. doi: 10.1038/ngeo964
Boynton, W., and Kemp, W. M. (1985). Nutrient regeneration and oxygen consumption by sediments along an estuarine salinity gradient. Mar. Ecol. Prog. Ser. 23, 45–55. doi: 10.3354/meps023045
Budd, K., and Craig, S. R. (1981). Resistance to arsenate toxicity in the blue-green alga Synechococcus leopoliensis. Can. J. Bot. 59, 1518–1521. doi: 10.1139/b81-207
Chiou, T.-J., and Lin, S.-I. (2011). Signaling network in sensing phosphate availability in plants. Annu. Rev. Plant Biol. 62, 185–206. doi: 10.1146/annurev-arplant-042110-103849
Chung, C. C., Hwang, S. P. L., and Chang, J. (2003). Identification of a high-affinity phosphate transporter gene in a prasinophyte alga, Tetraselmis chuii, and its expression under nutrient limitation Appl. Environ. Microbiol. 69: 754-759
Cullen, J. J. (1982). The deep chlorophyll maximum: comparing vertical profiles of chlorophyll a. Can. J. Fish. Aquat. Sci. 39, 791–803. doi: 10.1139/f82-108
Cullen, J. J. (2015). Subsurface chlorophyll maximum layers: enduring enigma or mystery solved? Annu. Rev. Mar. Sci. 7, 207–239. doi: 10.1146/annurev-marine-010213-135111
Cuvelier, M. L., Allen, A. E., Monier, A., McCrow, J. P., Messié, M., Tringe, S. G., et al. (2010). Targeted metagenomics and ecology of globally important uncultured eukaryotic phytoplankton. Proc. Natl. Acad. Sci. U.S.A. 107, 14679–14684. doi: 10.1073/pnas.1001665107
Deyoe, H. R., Chan, A. M., and Suttle, C. A. (1995). Phylogeny of Aureococcus anophagefferens and a morphologically similar bloom-forming alga from Texas as determined by 18s ribosomal RNA sequence analysis. J. Phycol. 31, 413–418. doi: 10.1111/j.0022-3646.1995.00413.x
Di Dato, V., Musacchia, F., Petrosino, G., Patil, S., Montresor, M., Sanges, R., et al. (2015). Transcriptome sequencing of three Pseudo-nitzschia species reveals comparable gene sets and the presence of Nitric Oxide Synthase genes in diatoms. Sci. Rep. 5:12329.
Dimier, C., Brunet, C., Geider, R., and Raven, J. (2009). Growth and photoregulation dynamics of the picoeukaryote Pelagomonas calceolata in fluctuating light. Limnol. Oceanogr. 54, 823–836. doi: 10.4319/lo.2009.54.3.0823
Dong, H. P., Huang, K. X., Wang, H. L., Lu, S. H., Cen, J. Y., and Dong, Y. L. (2014). Understanding strategy of nitrate and urea assimilation in a Chinese strain of Aureococcus anophagefferens through RNA-seq analysis. PLoS One 9:e111069. doi: 10.1371/journal.pone.0111069
Dupont, C. L., McCrow, J. P., Valas, R., Moustafa, A., Walworth, N., Goodenough, U., et al. (2014). Genomes and gene expression across light and productivity gradients in eastern subtropical Pacific microbial communities. ISME J. 9, 1076–1092. doi: 10.1038/ismej.2014.198
Dyhrman, S. T., Ammerman, J. W., and Van Mooy, B. A. (2007). Microbes and the marine phosphorus cycle. Oceanography 20, 110–116. doi: 10.5670/oceanog.2007.54
Dyhrman, S. T., Jenkins, B. D., Rynearson, T. A., Saito, M. A., Mercier, M. L., Alexander, H., et al. (2012). The transcriptome and proteome of the diatom Thalassiosira pseudonana reveal a diverse phosphorus stress response. PLoS One 7:e33768. doi: 10.1371/journal.pone.0033768
Flombaum, P., Wang, W.-L., Primeau, F. W., and Martiny, A. C. (2020). Global picophytoplankton niche partitioning predicts overall positive response to ocean warming. Nat. Geosci. 13, 116–120. doi: 10.1038/s41561-019-0524-2
Frischkorn, K. R., Harke, M. J., Gobler, C. J., and Dyhrman, S. T. (2014). De novo assembly of Aureococcus anophagefferens transcriptomes reveals diverse responses to the low nutrient and low light conditions present during blooms. Front. Microbiol. 5:375. doi: 10.3389/fmicb.2014.00375
Gann, E. R., Gainer, P. J., Reynolds, T. B., and Wilhelm, S. W. (2020a). Influence of light on the infection of Aureococcus anophagefferens CCMP 1984 by a “giant virus”. PLoS One 15:e0226758. doi: 10.1371/journal.pone.0226758
Gann, E. R., Hughes, B. J., Reynolds, T. B., and Wilhelm, S. W. (2020b). Internal nitrogen pools shape the infection of Aureococcus anophagefferens CCMP 1984 by a giant virus. Front. Microbiol. 11:492.
Gobler, C. J., Berry, D. L., Dyhrman, S. T., Wilhelm, S. W., Salamov, A., Lobanov, A. V., et al. (2011). Niche of harmful alga Aureococcus anophagefferens revealed through ecogenomics. Proc. Natl. Acad. Sci. U.S.A. 108, 4352–4357.
Gobler, C. J., Boneillo, G. E., Debenham, C. J., and Caron, D. A. (2004). Nutrient limitation, organic matter cycling, and plankton dynamics during an Aureococcus anophagefferens bloom. Aquat. Microb. Ecol. 35, 31–43. doi: 10.3354/ame035031
Gobler, C. J., Donat, J. R., Consolvo, J. A., and Sañudo-Wilhelmy, S. A. (2002). Physicochemical speciation of iron during coastal algal blooms. Mar. Chem. 77, 71–89. doi: 10.1016/s0304-4203(01)00076-7
Gobler, C. J., Koch, F., Kang, Y., Berry, D. L., Tang, Y. Z., Lasi, M., et al. (2013a). Expansion of harmful brown tides caused by the pelagophyte, Aureoumbra lagunensis DeYoe et Stockwell, to the US East Coast. Harmful Algae 27, 29–41. doi: 10.1016/j.hal.2013.04.004
Gobler, C. J., Lobanov, A. V., Tang, Y. Z., Turanov, A. A., Zhang, Y., Doblin, M., et al. (2013b). The central role of selenium in the biochemistry and ecology of the harmful pelagophyte, Aureococcus anophagefferens. ISME J. 7, 1333–1343. doi: 10.1038/ismej.2013.25
Gobler, C. J., and Sunda, W. G. (2012). Ecosystem disruptive algal blooms of the brown tide species, Aureococcus anophagefferens and Aureoumbra lagunensis. Harmful Algae 14, 36–45. doi: 10.1016/j.hal.2011.10.013
Gough, J., Karplus, K., Hughey, R., and Chothia, C. (2001). Assignment of homology to genome sequences using a library of hidden Markov models that represent all proteins of known structure. J. Mol. Biol. 313, 903–919. doi: 10.1006/jmbi.2001.5080
Haft, D. H., Loftus, B. J., Richardson, D. L., Yang, F., Eisen, J. A., Paulsen, I. T., et al. (2001). TIGRFAMs: a protein family resource for the functional identification of proteins. Nucleic Acids Res. 29, 41–43. doi: 10.1093/nar/29.1.41
Harke, M. J., Davis, T. W., Watson, S. B., and Gobler, C. J. (2015). Nutrient-controlled niche differentiation of western Lake Erie cyanobacterial populations revealed via metatranscriptomic surveys. Environ. Sci. Technol. 50, 604–615. doi: 10.1021/acs.est.5b03931
Harke, M. J., and Gobler, C. J. (2013). Global transcriptional responses of the toxic cyanobacterium, Microcystis aeruginosa, to nitrogen stress, phosphorus stress, and growth on organic matter. PLoS One 8:e69834. doi: 10.1371/journal.pone.0069834
Harke, M. J., Juhl, A. R., Haley, S. T., Alexander, H., and Dyhrman, S. T. (2017). Conserved transcriptional responses to nutrient stress in bloom-forming algae. Front. Microbiol. 8:1279. doi: 10.3389/fmicb.2017.01279
Hase, T., Schürmann, P., and Knaff, D. B. (2006). “The interaction of ferredoxin with ferredoxin-dependent enzymes,” in Photosystem I, ed. J. H. Golbeck (Dordrecht: Springer), 477–498. doi: 10.1007/978-1-4020-4256-0_28
Hawkes, W. C., and Alkan, Z. (2010). Regulation of redox signaling by selenoproteins. Biol. Trace Elem. Res. 134, 235–251. doi: 10.1007/s12011-010-8656-7
Hellweger, F. L., Clegg, R. J., Clark, J. R., Plugge, C. M., and Kreft, J.-U. (2016). Advancing microbial sciences by individual-based modelling. Nat. Rev. Micro 14, 461–471. doi: 10.1038/nrmicro.2016.62
Hellweger, F. L., Farley, K. J., Lall, U., and Di Toro, D. M. (2003). Greedy algae reduce arsenate. Limnol. Oceanogr. 48, 2275–2288. doi: 10.4319/lo.2003.48.6.2275
Hernández-Domíguez, E. E., Valencia-Turcotte, L. G., and Rodríguez-Sotres, R. (2012). Changes in expression of soluble inorganic pyrophosphatases of Phaseolus vulgaris under phosphate starvation. Plant Sci. 187, 39–48. doi: 10.1016/j.plantsci.2012.01.009
Hoppe, H. (1983). Significance of exoenzymatic activities in the ecology of brackish water-measurements by means of methylumbelliferyl-substrates. Mar. Ecol. Prog. Ser. 11, 299–308. doi: 10.3354/meps011299
Huang, X., and Madan, A. (1999). CAP3: a DNA sequence assembly program. Genome Res. 9, 868–877. doi: 10.1101/gr.9.9.868
Huff, J. T., Zilberman, D., and Roy, S. W. (2016). Mechanism for DNA transposons to generate introns on genomic scales. Nature 538:533. doi: 10.1038/nature20110
Iseli, C., Jongeneel, C. V., and Bucher, P. (1999). ESTScan: a program for detecting, evaluating, and reconstructing potential coding regions in EST sequences. ISMB 99, 138–148.
John, D. E., Wang, Z. H. A., Liu, X. W., Byrne, R. H., Corredor, J. E., Lopez, J. M., et al. (2007). Phytoplankton carbon fixation gene (RuBisCO) transcripts and air-sea CO2 flux in the Mississippi River plume. ISME J. 1, 517–531. doi: 10.1038/ismej.2007.70
Johnson, K. S., Riser, S. C., and Karl, D. M. (2010). Nitrate supply from deep to near-surface waters of the North Pacific subtropical gyre. Nature 465, 1062–1065. doi: 10.1038/nature09170
Kanehisa, M., Goto, S., Hattori, M., Aoki-Kinoshita, K. F., Itoh, M., Kawashima, S., et al. (2006). From genomics to chemical genomics: new developments in KEGG. Nucleic Acids Res. 34, D354–D357.
Kang, Y., Kudela, R. M., and Gobler, C. J. (2017). Quantifying nitrogen assimilation rates of individual phytoplankton species and plankton groups during harmful algal blooms via sorting flow cytometry. Limnol. Oceanogr. Methods 15, 706–721. doi: 10.1002/lom3.10193
Keeling, P. J., Burki, F., Wilcox, H. M., Allam, B., Allen, E. E., and Amaral-Zettler, L. A. (2014). The marine microbial eukaryote transcriptome sequencing project (MMETSP): illuminating the functional diversity of eukaryotic life in the oceans through transcriptome sequencing. PLoS Biol. 12:e1001889.
Kim, M. J., Lee, B. C., Hwang, K. Y., Gladyshev, V. N., and Kim, H. Y. (2015). Selenium utilization in thioredoxin and catalytic advantage provided by selenocysteine. Biochem. Biophys. Res. Commun. 461, 648–652. doi: 10.1016/j.bbrc.2015.04.082
Konotchick, T., Dupont, C. L., Valas, R. E., Badger, J. H., and Allen, A. E. (2013). Transcriptomic analysis of metabolic function in the giant kelp, Macrocystis pyrifera, across depth and season. New Phytol. 198, 398–407. doi: 10.1111/nph.12160
Kopf, M., Klähn, S., Scholz, I., Hess, W. R., and Voß, B. (2015). Variations in the non-coding transcriptome as a driver of inter-strain divergence and physiological adaptation in bacteria. Sci. Rep. 5, 1–12.
Latasa, M., Cabello, A. M., Morán, X. A. G., Massana, R., and Scharek, R. (2017). Distribution of phytoplankton groups within the deep chlorophyll maximum. Limnol. Oceanogr. 62, 665–685. doi: 10.1002/lno.10452
Levy, S., Kafri, M., Carmi, M., and Barkai, N. (2011). The competitive advantage of a dual-transporter system. Science 334, 1408–1412. doi: 10.1126/science.1207154
Lewin, J., Norris, R. E., Jeffrey, S. W., and Pearson, B. E. (1977). An aberrant Chrysophycean alga Pelagococcus subviridis Gen. Nov. Et Sp. Nov. from the North Pacific ocean. J. Phycol. 13, 259–266. doi: 10.1111/j.1529-8817.1977.tb02925.x
Li, B., and Dewey, C. N. (2011). RSEM: accurate transcript quantification from RNA-Seq data with or without a reference genome. BMC Bioinformatics 12:323. doi: 10.1186/1471-2105-12-323
Li, B., Karl, D. M., Letelier, R. M., Bidigare, R. R., and Church, M. J. (2013). Variability of chromophytic phytoplankton in the North Pacific Subtropical Gyre. Deep Sea Res. Part II Top. Stud. Oceanogr. 93, 84–95. doi: 10.1016/j.dsr2.2013.03.007
Li, H., and Durbin, R. (2009). Fast and accurate short read alignment with Burrows–Wheeler transform. Bioinformatics 25, 1754–1760. doi: 10.1093/bioinformatics/btp324
Li, L., Stoeckert, C. J., and Roos, D. S. (2003). OrthoMCL: identification of ortholog groups for eukaryotic genomes. Genome Res. 13, 2178–2189. doi: 10.1101/gr.1224503
Li, W., and Godzik, A. (2006). Cd-hit: a fast program for clustering and comparing large sets of protein or nucleotide sequences. Bioinformatics 22, 1658–1659. doi: 10.1093/bioinformatics/btl158
Li, W., and Jiang, T. (2012). Transcriptome assembly and isoform expression level estimation from biased RNA-Seq reads. Bioinformatics 28, 2914–2921. doi: 10.1093/bioinformatics/bts559
Lin, S., Cheng, S., Song, B., Zhong, X., Lin, X., and Li, W. (2015). The Symbiodinium kawagutii genome illuminates dinoflagellate gene expression and coral symbiosis. Science 350, 691–694. doi: 10.1126/science.aad0408
Liu, H. B., Laws, E. A., Villareal, T. A., and Buskey, E. J. (2001). Nutrient-limited growth of Aureoumbra lagunensis (Pelagophyceae), with implications for its capability to outgrow other phytoplankton species in phosphate-limited environments. J. Phycol. 37, 500–508. doi: 10.1046/j.1529-8817.2001.037004500.x
Lobanov, A. V., Hatfield, D. L., and Gladyshev, V. N. (2009). Eukaryotic selenoproteins and selenoproteomes. Biochim. Biophys. Acta (BBA) Gen. Subj. 1790, 1424–1428. doi: 10.1016/j.bbagen.2009.05.014
Marchetti, A., Schruth, D. M., Durkin, C. A., Parker, M. S., Kodner, R. B., Berthiaume, C. T., et al. (2012). Comparative metatranscriptomics identifies molecular bases for the physiological responses of phytoplankton to varying iron availability. Proc. Natl. Acad. Sci. U.S.A. 109, E317–E325.
Martiny, A. C., Lomas, M. W., Fu, W. W., Boyd, P. W., Chen, Y. L. L., Cutter, G. A., et al. (2019). Biogeochemical controls of surface ocean phosphate. Sci. Adv. 5:eaax0341. doi: 10.1126/sciadv.aax0341
Mitsukawa, N., Okumura, S., Shirano, Y., Sato, S., Kato, T., Harashima, S., et al. (1997). Overexpression of an Arabidopsis thaliana high-affinity phosphate transporter gene in tobacco cultured cells enhances cell growth under phosphate-limited conditions. Proc. Natl. Acad. Sci. U.S.A. 94, 7098–7102. doi: 10.1073/pnas.94.13.7098
Mock, T., Daines, S. J., Geider, R., Collins, S., Metodiev, M., Millar, A. J., et al. (2016). Bridging the gap between omics and earth system science to better understand how environmental change impacts marine microbes. Global Change Biol. 22, 61–75. doi: 10.1111/gcb.12983
Monier, A., Welsh, R. M., Gentemann, C., Weinstock, G., Sodergren, E., Armbrust, E. V., et al. (2012). Phosphate transporters in marine phytoplankton and their viruses: cross-domain commonalities in viral-host gene exchanges. Environ. Microbiol. 14, 162–176. doi: 10.1111/j.1462-2920.2011.02576.x
Muhlstein, H. I., and Villareal, T. A. (2007). Organic and inorganic nutrient effects on growth rate-irradiance relationships in the Texas brown-tide alga Aureoumbra lagunensis (Pelagophyceae). J. Phycol. 43, 1223–1226. doi: 10.1111/j.1529-8817.2007.00412.x
Oliver, S. L., Lenards, A. J., Barthelson, R. A., Merchant, N., and McKay, S. J. (2013). Using the iPlant collaborative discovery environment. Curr. Protoc. Bioinform. Chapter 1:Unit1.22.
Palenik, B., Brahamsha, B., Larimer, F. W., Land, M. L., Hauser, L., Chain, P., et al. (2003). The genome of a motile marine Synechococcus. Nature 424, 1037–1042. doi: 10.1038/nature01943
Parkhill, J. P., Maillet, G., and Cullen, J. J. (2001). Fluorescence-based maximal quantum yield for PSII as a diagnostic of nutrient stress. J. Phycol. 37, 517–529. doi: 10.1046/j.1529-8817.2001.037004517.x
Pride, A. C., Herrera, C. M., Guan, Z., Giles, D. K., and Trent, M. S. (2013). The outer surface lipoprotein VolA mediates utilization of exogenous lipids by Vibrio cholerae. mBio 4:e00305-13.
Sancho, J. (2006). Flavodoxins: sequence, folding, binding, function and beyond. Cell. Mol. Life Sci. 63, 855–864. doi: 10.1007/s00018-005-5514-4
Silver, S., and Phung, L. T. (2005). Genes and enzymes involved in bacterial oxidation and reduction of inorganic arsenic. Appl. Environ. Microbiol. 71, 599–608. doi: 10.1128/aem.71.2.599-608.2005
Simão, F. A., Waterhouse, R. M., Ioannidis, P., Kriventseva, E. V., and Zdobnov, E. M. (2015). BUSCO: assessing genome assembly and annotation completeness with single-copy orthologs. Bioinformatics 31, 3210–3212. doi: 10.1093/bioinformatics/btv351
Simmons, M. P., Sudek, S., Monier, A., Limardo, A. J., Jimenez, V., Perle, C. R., et al. (2016). Abundance and biogeography of picoprasinophyte ecotypes and other phytoplankton in the Eastern North Pacific Ocean. Appl. Environ. Microbiol. 82, 1693–1705. doi: 10.1128/aem.02730-15
Simon, N., Barlow, R. G., Marie, D., Partensky, F., and Vaulot, D. (1994). Characterization of oceanic photosynthetic picoeukaryotes by flow cytometry. J. Phycol. 30, 922–935. doi: 10.1111/j.0022-3646.1994.00922.x
Simpson, J. T., and Durbin, R. (2012). Efficient de novo assembly of large genomes using compressed data structures. Genome Res. 22, 549–556. doi: 10.1101/gr.126953.111
Simpson, J. T., Wong, K., Jackman, S. D., Schein, J. E., Jones, S. J., and Birol, I. (2009). ABySS: a parallel assembler for short read sequence data. Genome Res. 19, 1117–1123. doi: 10.1101/gr.089532.108
Stein, L. D. (2008). Towards a cyberinfrastructure for the biological sciences: progress, visions and challenges. Nat. Rev. Genet. 9, 678–688. doi: 10.1038/nrg2414
Sun, M. M., Sun, J., Qiu, J. W., Jing, H. M., and Liu, H. B. (2012). Characterization of the proteomic profiles of the brown tide alga Aureoumbra lagunensis under phosphate- and nitrogen-limiting conditions and of its phosphate limitation-specific protein with alkaline phosphatase activity. Appl. Environ. Microbiol. 78, 2025–2033. doi: 10.1128/aem.05755-11
Sundby, B., Gobeil, C., Silverberg, N., and Alfonso, M. (1992). The phosphorus cycle in coastal marine sediments. Limnol. Oceanogr. 37, 1129–1145. doi: 10.4319/lo.1992.37.6.1129
Tang, Y., and Gobler, C. (2009). Characterization of the toxicity of Cochlodinium polykrikoides isolates from Northeast US estuaries to finfish and shellfish. Harmful Algae 8, 454–462. doi: 10.1016/j.hal.2008.10.001
Vesk, M., and Jeffrey, S. W. (1987). Ultrastructure and pigments of 2 strains of the picoplanktonic alga Pelagococcus subviridis (Chrysophyceae). J. Phycol. 23, 322–336. doi: 10.1111/j.1529-8817.1987.tb04141.x
Worden, A. Z., Janouskovec, J., McRose, D., Engman, A., Welsh, R. M., Malfatti, S., et al. (2012). Global distribution of a wild alga revealed by targeted metagenomics. Curr. Biol. 22, R675–R677.
Wu, Z. J., Jenkins, B. D., Rynearson, T. A., Dyhrman, S. T., Saito, M. A., Mercier, M., et al. (2010). Empirical bayes analysis of sequencing-based transcriptional profiling without replicates. BMC Bioinformatics 11:564. doi: 10.1186/1471-2105-11-564
Wurch, L., Alexander, H., Frischkorn, K. R., Haley, S., Gobler, C., and Dyhrman, S. (2019). Transcriptional shifts highlight the role of nutrients in harmful brown tide dynamics. Front. Microbiol. 10:136.
Wurch, L. L., Bertrand, E. M., Saito, M. A., Van Mooy, B. A. S., and Dyhrman, S. T. (2011a). Proteome changes driven by phosphorus deficiency and recovery in the brown tide-forming alga Aureococcus anophagefferens. PLoS One 6:e28949. doi: 10.1371/journal.pone.0028949
Wurch, L. L., Gobler, C. J., and Dyhrman, S. T. (2013). Expression of a xanthine and phosphate transporter in cultures and field populations of the harmful alga Aureococcus anophagefferens: tracking nutritional deficiency during brown tides. Environ. Microbiol. 16, 2444–2457. doi: 10.1111/1462-2920.12374
Wurch, L. L., Haley, S. T., Orchard, E. D., Gobler, C. J., and Dyhrman, S. T. (2011b). Nutrient-regulated transcriptional responses in the brown tide-forming alga Aureococcus anophagefferens. Environ. Microbiol. 13, 468–481. doi: 10.1111/j.1462-2920.2010.02351.x
Yoon, Y. H. (2016). Bio-environmental characteristics of the Uljin marine ranching area (UMRA), East Seas of Korea. I. Spatio-Temporal distributions of phytoplankton community. J. Korean Soc. Mar. Environ. Energy 19:37. doi: 10.7846/jkosmee.2016.19.1.37
Zhang, Z., and Wood, W. I. (2003). A profile hidden Markov model for signal peptides generated by HMMER. Bioinformatics 19, 307–308. doi: 10.1093/bioinformatics/19.2.307
Zubkov, M. V., Fuchs, B. M., Tarran, G. A., Burkill, P. H., and Amann, R. (2003). High rate of uptake of organic nitrogen compounds by Prochlorococcus cyanobacteria as a key to their dominance in oligotrophic oceanic waters. Appl. Environ. Microbiol. 69, 1299–1304. doi: 10.1128/aem.69.2.1299-1304.2003
Keywords: comparative transcriptomes, pelagophytes, nutrient limitation, light limitation, Aureococcus anophagefferens, Aureoumbra lagunensis, Pelagococcus subviridis, Pelagomonas calceolata
Citation: Kang Y, Harke MJ, Berry DL, Collier JL, Wilhelm SW, Dyhrman ST and Gobler CJ (2021) Transcriptomic Responses of Four Pelagophytes to Nutrient (N, P) and Light Stress. Front. Mar. Sci. 8:636699. doi: 10.3389/fmars.2021.636699
Received: 01 December 2020; Accepted: 19 February 2021;
Published: 17 March 2021.
Edited by:
Haiwei Luo, The Chinese University of Hong Kong, ChinaReviewed by:
Linjian Ou, Jinan University, ChinaHongpo Dong, East China Normal University, China
Dajun Qiu, South China Sea Institute of Oceanology (CAS), China
Copyright © 2021 Kang, Harke, Berry, Collier, Wilhelm, Dyhrman and Gobler. This is an open-access article distributed under the terms of the Creative Commons Attribution License (CC BY). The use, distribution or reproduction in other forums is permitted, provided the original author(s) and the copyright owner(s) are credited and that the original publication in this journal is cited, in accordance with accepted academic practice. No use, distribution or reproduction is permitted which does not comply with these terms.
*Correspondence: Christopher J. Gobler, Y2hyaXN0b3BoZXIuZ29ibGVyQHN0b255YnJvb2suZWR1
†Present address: Yoonja Kang, Chonnam National University, Yeosu, South Korea; Matthew J. Harke, Gloucester Marine Genomics Institute, Gloucester, MA, United States