 Xinping Hu
 Hongming Yao
 Cory J. Staryk
 Melissa R. McCutcheon
 Michael S. Wetz
 Lily Walker
- 1Department of Physical and Environmental Sciences, Texas A&M University – Corpus Christi, Corpus Christi, TX, United States
- 2Harte Research Institute for Gulf of Mexico Studies, Texas A&M University – Corpus Christi, Corpus Christi, TX, United States
A Corrigendum on
Disparate Responses of Carbonate System in Two Adjacent Subtropical Estuaries to the Influence of Hurricane Harvey – A Case Study
by Hu, X., Yao, H., Staryk, C. J., McCutcheon, M. R., Wetz, M. S., and Walker, L. (2020). Front. Mar. Sci. 7:26. doi: 10.3389/fmars.2020.00026
In the original article, there was a mistake in Figure 5 as published. This is due to an incorrect formulation of gas transfer velocity in the flux calculations. The corrected Figure 5 appears below.
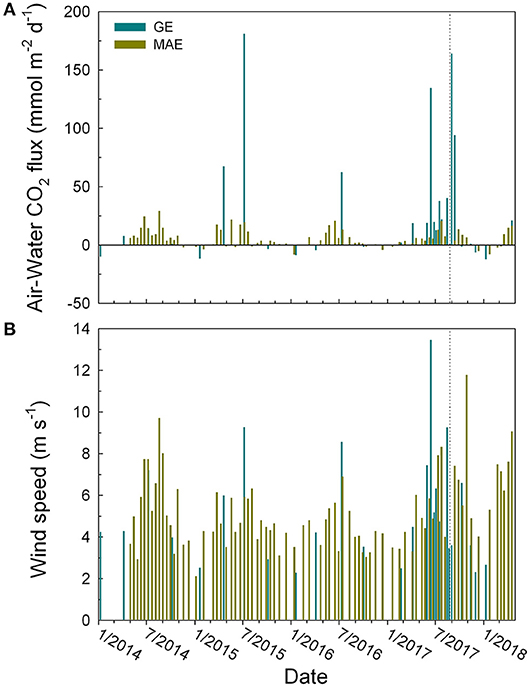
Figure 5. Temporal distributions of (A) air–water CO2 flux (unit mmol m−2 d−1) and (B) daily wind speed on the sampling days in GE (dark green) and MAE (dark yellow). The dotted lines represent the date (August 25, 2017) on which Hurricane Harvey made landfall.
In the original article, there were errors. The errors were caused by an incorrect formulation of gas transfer velocity in the flux calculations; hence all the flux values need to be corrected.
A correction has been made to Results, CO2 partial pressure, Normalized pCO2, and Air-Water CO2 flux, paragraph 3:
As defined in Eq. (1), CO2 flux is a function of wind speed (gas transfer) and air-water pCO2 gradient. Contrary to the pCO2 values (Figure 4A), the post-Harvey maximum pCO2 in GE did not translate into the highest CO2 efflux in our study period (164 ± 122 mmol m−2 d−1 on Sept 1, 2017). Instead, the highest calculated CO2 efflux occurred in mid-2015 (181 ± 100 mmol m−2 d−1 on July 8, 2015) (Figure 5A), and the wind speed 9.3 m s−1 on the 2015 observation date was much higher than the post-Harvey date (3.6 m s−1) (Figure 5B). In comparison, MAE did not exhibit significant changes in CO2 flux before and after the hurricane (Figure 5A).
A correction has been made to Discussion, Air-water CO2 flux, paragraph 2-5:
Compared to these east coast studies, we did not have data during Harvey except the single bottom water monitoring station (Walker et al. ms in prep.). However, the post-Harvey CO2 flux in GE increased from the pre-hurricane near neutral levels (−0.2 ± 5.0 mmol m−2 d−1) to 164 ± 122 mmol m−2 d−1 on September 1 and then 94 ± 161 mmol m−2 d−1 on September 13, both were greater than or similar to post-storm CO2 flux observed in the east coast estuaries (Crosswell et al., 2014; Van Dam et al., 2018). In comparison, post-Harvey CO2 flux in MAE (4 ± 3 mmol m−2 d−1) was much lower but on par with those values obtained from those east coast estuaries. The reason for such distinct difference in CO2 flux may be explained by the different extents of nutrient pollution that these estuaries experience (see below).
In fact, despite that observed pCO2 (hence water-air pCO2 gradient) was the largest in GE after Harvey, water-to-air CO2 flux was not the highest at that time (Figure 5A). The difference mainly stemmed from the higher gas transfer velocity in 7.8 m d−1 (at wind speed 9.3 m s−1) on the sampling day in mid-2015 vs. 1.9 m d−1 (at wind speed 3.6 m s−1) after Harvey.
Overall, water-to-air CO2 flux during the 1-month period after Harvey (August 27-Septemebr 26, 2017) was estimated to be 1.6 × 10⁹ mol. Integrating the 2017 flux values to the whole year the CO2 efflux in GE in 2017 was 4.7 × 10⁹ mol. Therefore, this 1-month period accounted for ~35% annual CO2 emission in that year, and this estimate should represent a lower limit because CO2 flux could have been higher during the storm due to much higher gas transfer velocity and potential sediment resuspension in this shallow estuary. In comparison, much sparser measurements in 2015 and 2016 suggested that the flood-induced CO2 emission accounted for 78 and 132% of annual values, respectively. Note all calculated CO2 efflux values were negative in 2016 except that from the flooding period that year. Considering the limited observations in these 2 years and that both river discharge and wind speed both played an important role in controlling CO2 flux, these two estimates thus probably had high uncertainties.
CO2 flux in MAE during the 2015 and 2016 flooding periods reached as much as 21–22 mmol m−2 d−1, much greater than that from the post-Harvey value. Furthermore, the latter flux from August 26 to September 25 (6.6 × 10⁷ mol) was not only much smaller than the GE values, but also appeared not extraordinary in the integrated annual CO2 flux (close to monthly mean of 5.0 × 10⁷ mol), although again the CO2 flux during the storm is unknown so this value can only be considered as a conservative estimate.
The authors apologize for this error and state that this does not change the scientific conclusions of the article in any way. The original article has been updated.
References
Crosswell, J. R., Wetz, M. S., Hales, B., and Paerl, H. W. (2014). Extensive CO2 emissions from shallow coastal waters during passage of Hurricane Irene (August 2011) over the Mid-Atlantic Coast of the U.S.A. Limnol. Oceanogr. 59, 1651–1665. doi: 10.4319/lo.2014.59.5.1651
Keywords: estuary, carbon cycle, CO2 flux, Hurricane Harvey, Gulf of Mexico
Citation: Hu X, Yao H, Staryk CJ, McCutcheon MR, Wetz MS and Walker L (2021) Corrigendum: Disparate Responses of Carbonate System in Two Adjacent Subtropical Estuaries to the Influence of Hurricane Harvey – A Case Study. Front. Mar. Sci. 8:647961. doi: 10.3389/fmars.2021.647961
Received: 30 December 2020; Accepted: 11 January 2021;
Published: 25 January 2021.
Approved by:
Hans Paerl, The University of North Carolina at Chapel Hill, United StatesCopyright © 2021 Hu, Yao, Staryk, McCutcheon, Wetz and Walker. This is an open-access article distributed under the terms of the Creative Commons Attribution License (CC BY). The use, distribution or reproduction in other forums is permitted, provided the original author(s) and the copyright owner(s) are credited and that the original publication in this journal is cited, in accordance with accepted academic practice. No use, distribution or reproduction is permitted which does not comply with these terms.
*Correspondence: Xinping Hu, eGlucGluZy5odUB0YW11Y2MuZWR1