 Mingming Liu1,2,3†
 Mingli Lin1†Xiaoming Tang1,2
 Lijun Dong1†
 Peijun Zhang1†David Lusseau3,4†
 Songhai Li1,5*†
- 1Marine Mammal and Marine Bioacoustics Laboratory, Institute of Deep-Sea Science and Engineering, Chinese Academy of Sciences, Sanya, China
- 2University of Chinese Academy of Sciences, Beijing, China
- 3School of Biological Sciences, University of Aberdeen, Aberdeen, United Kingdom
- 4National Institute of Aquatic Resources, Technical University of Denmark, Lyngby, Denmark
- 5Tropical Marine Science Institute, National University of Singapore, Singapore, Singapore
Observer-based counts and photo-identification are two well-established methods with an extensive use in cetacean studies. Using these two methods, group size has been widely reported, especially for small dolphins. Both methods may come with potential errors in estimating the group size, yet there is still a lack of comparison between both methods over a broad range of group size. Particularly, biogeographical variances in group size estimates were often mixed with methodological variances, making it difficult to compare estimates from different geographic regions. Here, group size estimates of a small, shallow-water, and near-shore delphinid species, Indo-Pacific humpback dolphins (Sousa chinensis), were simultaneously sampled using observer-based counts and photo-identification at three regions in the northern South China Sea. Data showed that dolphin group size from two methods were highly variable and associated with sampling regions. Generalized linear mixed models (GLMMs) indicated that dolphin group size significantly differed among regions. Statistical examinations further demonstrated dolphin group size could be affected by a complex combination of methodological and biogeographical variances. A common hurdle to examine potential factors influencing the estimation process is the inability to know the true group size at each sample. Therefore, other methods that could generate comparable estimates to represent true group size are warranted in future studies. To conclude, our findings present a better understanding of methodological and biogeographical variances in group size estimates of humpback dolphins, and help yield more robust abundance and density estimation for these vulnerable animals.
Introduction
Groups are a fundamental unit of gregarious animal species (Casari and Tagliapietra, 2018). Thus, the estimation of group size is crucial for research in animal ecology and behavior (Peña and Nöldeke, 2018; Kappeler, 2019). For example, in standard distance sampling protocols, a reliable estimate of animal abundance is highly dependent on whether group size of detected animals could be estimated as accurately as possible (Buckland et al., 1993; Barlow et al., 1998). Group size is also a prominent trait to indicate social characteristics for a wide range of animal taxa (Parrish and Edelstein-Keshet, 1999; Kappeler et al., 2019). However, it is difficult to generate accurate group size estimates for wild animals, since the estimation process may be affected by diverse factors (Walsh et al., 2009; Clement et al., 2017).
A fundamental approach to estimate group size of free-ranging dolphins is on-site counts by observers from vessels (Mann, 1999). However, dolphins are highly mobile, spend prolonged periods underwater, and are partially visible from the sea surface, all of which pose substantial difficulties to estimate group size (Gerrodette et al., 2002). Furthermore, social dynamics may differ among dolphin species (Gowans et al., 2007), which can greatly affect the estimation process of group size. Consequently, group size estimates from observer counts are often variable, especially for extremely large groups (referred to as “schools” in some studies), with non-trivial between-observer variance as well as within-observer between sample variance (Erwin, 1982; Gerrodette and Perrin, 1991; Bouveroux et al., 2018). Although observers’ experience can be improved through training and practice, it is still hard to remove potential bias from observer-based counts (Gerrodette and Perrin, 1991; Clement et al., 2017), and the bias may increase with the group size (Gerrodette et al., 2019).
The photo-identification technique can be available in estimating the group size of those naturally marked cetacean species (Würsig and Würsig, 1977). Many delphinid species have distinctive natural markings on/around the dorsal fin, which allows the identification of individuals from photographs and further provides a mechanism for estimating their group size (Urian et al., 2015; Pawley et al., 2018). However, the use of photo-identification may bring potential errors due to misidentification. Dolphin group size may be underestimated, because no guarantee can ensure that all marked individuals present within an encounter could be captured, and some individuals, particularly younger ones, are often poorly marked or unmarked (Hupman et al., 2018; Wickman et al., 2021). Furthermore, photo-identification cannot always generate accurate group size estimates, as some dolphin species have poor nick/notch markings for matching the left and right sides of the same individuals (Auger-Méthé et al., 2010; Hupman et al., 2018).
In dolphin societies, group size, social structures, and dynamics differ among species, which is known as interspecific variability of sociality (Gygax, 2002b; Gowans et al., 2007). Additionally, a specific dolphin species can build different sizes of groups at various spatial and temporal scales (Gygax, 2002a; Liu et al., 2021a,b), which is so-called biogeographical or inter-population variability of sociality (Liu et al., 2021c). Although both observer-based counts and photo-identification have been widely applied in dolphin sociality studies, little attention, if anything at all, has been paid to compare the performance of these two methods in estimating group size. Intraspecific variability in dolphin group size is often confusing, since variances from methodology and biogeography were mixed in many studies, leading to substantial difficulties in comparing the estimates from different systems (Gygax, 2002a,b; Liu et al., 2020b, 2021c).
Thus far, it is well known that both observer-based counts and photo-identification might come with potential errors in estimating dolphin group size. However, scant is known at which bias in group size estimates might occur and how these methods have potential influences. A common hurdle to examine potential factors influencing the estimation process is the inability to know the true group size at each sample (Walsh et al., 2009; Hamilton et al., 2018). Moreover, the potential bias and variance in group size estimates might be of species specificity, and thus bias correction factors estimated in different ocean basins and for different species cannot guarantee to apply for all studies.
The Indo-Pacific humpback dolphins (Sousa chinensis Osbeck, 1765), hereafter referred to as “humpback dolphins,” are small delphinid species inhabiting shallow and near-shore waters of the eastern Indian and western Pacific Oceans (Jefferson and Smith, 2016; Li, 2020). Group size estimates have been widely reported for this species across many known populations, and all studies have used either observer-based counts (Chen et al., 2010; Wang et al., 2015) or photo-identification (Chen et al., 2016; Wang et al., 2016). Humpback dolphins are often observed or photographically captured in groups with variable sizes (Würsig et al., 2016), from a single animal to small groups (mostly about ten or fewer), and sometimes to large aggregations (several tens or low hundred; Parsons, 2004; Liu et al., 2021c). Reducing errors in estimating group size is crucial to density and abundance estimate for this species (Marsh and Sinclair, 1989; Chen et al., 2010), but there is no a good grasp of how well traditional estimation methods (i.e., observer-based counts, and photo-identification) applied to this species.
In this study, observer-based counts and photo-identification were simultaneously used to sample group size estimates of three geographically isolated humpback dolphin populations in the northern South China Sea. Both methodological and biogeographical variances in group size estimates of humpback dolphins were assessed. This study aims (1) to better understand the bias and variance in group size estimates of humpback dolphins and (2) to reveal the intra- and inter-population variability in group size of this species.
Materials and Methods
Sampling Regions
Three areas along the northern coast of the South China Sea were selected as sampling regions: the waters southwest off Hainan Island (SWH; Li et al., 2016; Liu et al., 2020b), Sanniang Bay (SNB; Chen et al., 2016; Wu et al., 2017; Peng et al., 2020), and Leizhou Bay, China (LZB; Xu et al., 2012, 2015; Liu et al., 2021a,b; Figures 1A,B). All these regions have been well known to support critical habitats with resident humpback dolphins. In this manuscript, sampling regions were always depicted in the order of SWH, SNB, and LZB, unless otherwise stated. Based on line-transect sampling design, boat-based surveys were performed in each sampling region by evenly-spaced zigzag transects (Buckland et al., 1993; Dawson et al., 2008). Given that humpback dolphins strongly preferred inhabiting shallow and near-shore waters (Jefferson and Smith, 2016), similar fishing or speed boats (∼7-15 m in length) were used to investigate the waters at depth ≤30 m and offshore ≤20 km. Boat-based surveys were only conducted under satisfactory visual conditions (no rain/fog) and sea states (≤4 on the Beaufort scale; Li et al., 2016; Liu et al., 2020a,b, 2021a).
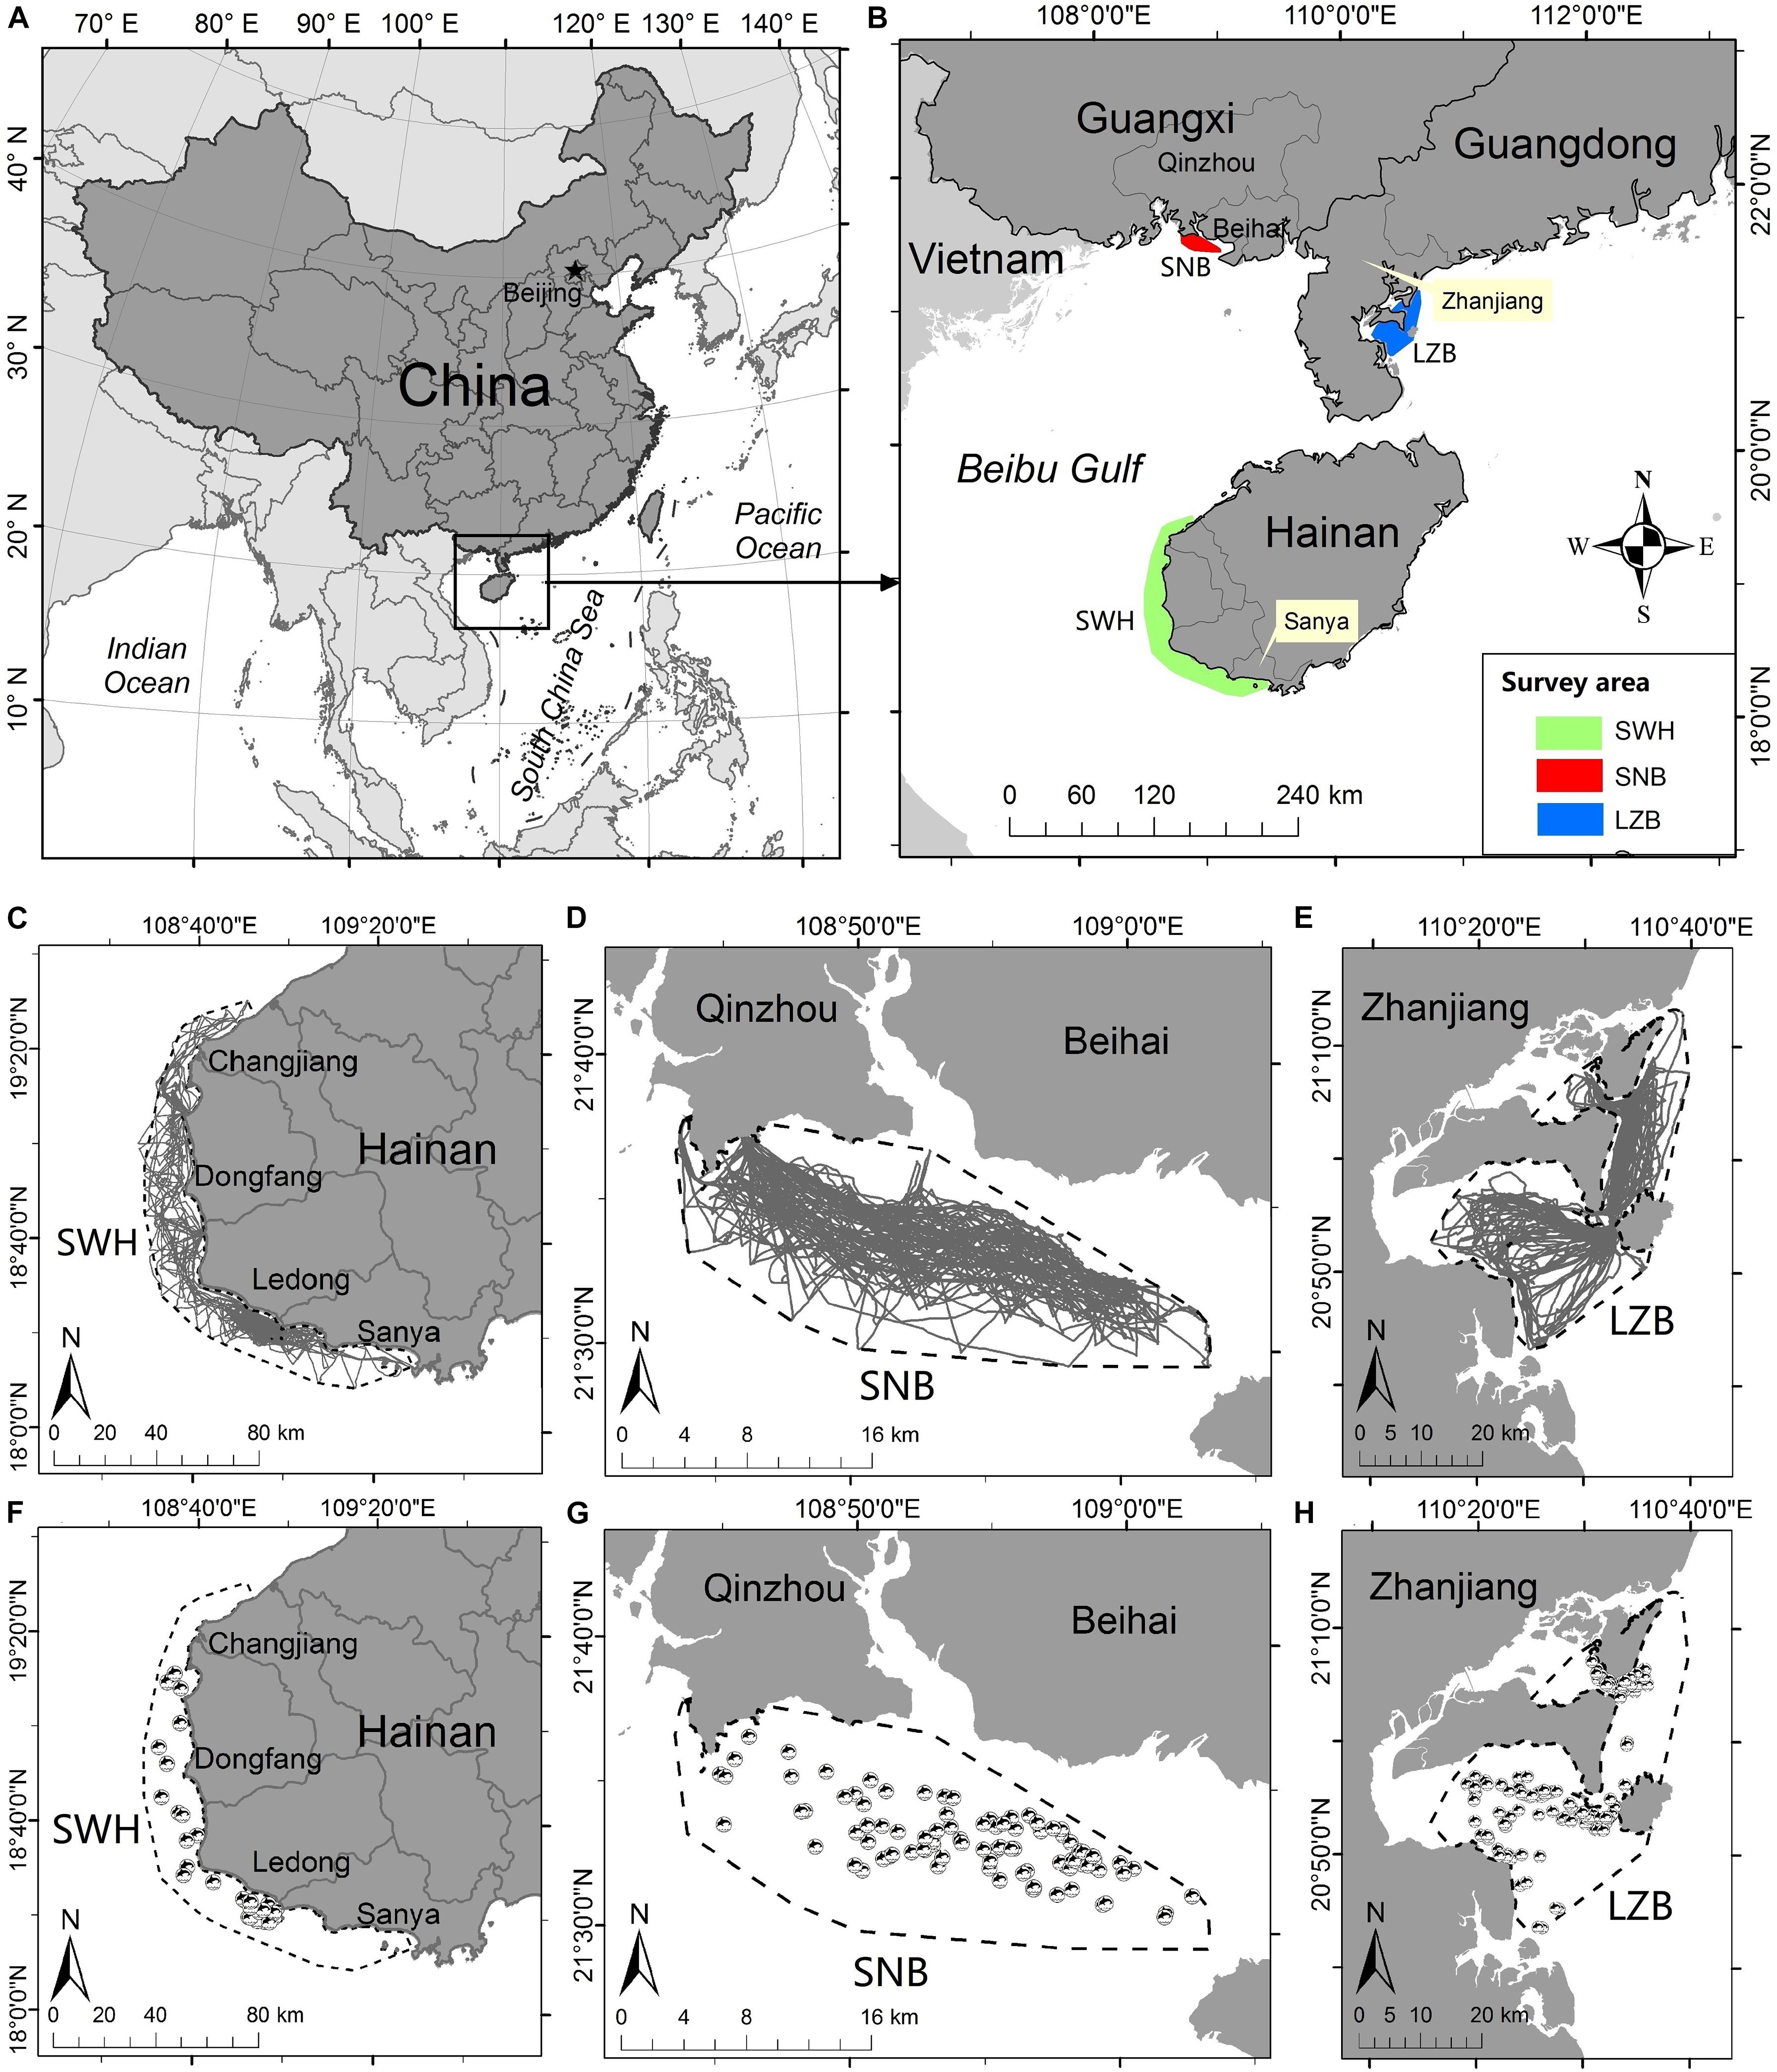
Figure 1. Map of the study area: (A) the northern section of South China Sea, and (B) three sampling regions, i.e., the waters southwest off Hainan Island (SWH), Sanniang Bay (SNB), and Leizhou Bay (LZB). (C-E) Boat-based survey routes and (F-H) sighting locations of Indo-Pacific humpback dolphins (Sousa chinensis) achieved in each sampling region.
Observer-Based Counts
During the boat-based surveys, a minimum of two trained observers visually scanned 180° of the sea surface to search humpback dolphins, with naked eyes and/or 7 × 50 binoculars (Li et al., 2016; Liu et al., 2020a,b, 2021a). All observers were experienced with basic knowledge on humpback dolphin behavior, and had received observation training over than 30 days at sea prior to this study. To keep consistency, two primary observers were maintained throughout the survey period and across different sampling regions. Within an encounter, one primary observer would count the number of dolphins and the other would take photos (Liu et al., 2021b). In this study, the term “group” was referred to any aggregation of humpback dolphins (including solitary individual) in the observers’ effective field of view, generally either socially (i.e., engaged in similar behaviors) or spatially associated (e.g., within 200 m of each other; Karczmarski, 1999; Jefferson, 2000). Once a group was encountered, the group was approached at a slow sailing speed (<8 km/h) and kept an appropriate distance (10–50 m) behind or off to the side of the group. To ensure the impendence of each group sample, our data collection procedures referred to the protocols described by Kinzey et al. (2000).
For each group, multiple counts were repeated several times to estimate the group size whenever possible (Karczmarski, 1999; Jefferson, 2000). Typically, the group size was recorded in the form of minimum/maximum/best counts on the standardized datasheet (e.g. 5/10/7; Kinzey et al., 2000). Sometimes, only one individual or a pair of individuals were observed, the group size was thus recorded as absolute best values (1 or 2). In some other cases, only a low estimate (e.g., ≥10) was possible to be recorded as a best count. Besides, the group size might also be recorded in the form of a range (e.g., 10-20), thus the best count was averaged by the upper and lower limits (e.g., 15 was average by 10 and 20). For the further analysis, only the best counts were used to indicate observer-based counts, i.e., Gobserver (Gerrodette et al., 2002).
Photo-Identification
Once a group was encountered, high-quality digital photos were taken, using a Canon 7D Mark II camera (Canon, Tokyo, Japan) fitted with 100-400 mm lens and an Olympus EM-1 camera (Olympus, Fujifilm, Japan) with 150- or 300-mm lens (1.5 × amplifier). Whenever possible, both the right and left lateral sides of dolphin dorsal fins would be photographed (Tang et al., 2021). For each group, a scoring system was used to assess all original photos based on the visibility, size, focus, direction, and contrast (Liu et al., 2020b; Tang et al., 2021). Each of the five aspects accounted for 20 at most, and the total scores range from 20 to 100 on a 100-point scale. All original photos were classified into three classes: poor <60, 60 ≤good < 80, and excellent ≥80 (Fearnbach et al., 2012). Only qualified photos (i.e., good, and excellent) were used for establishing the photo-identification dataset. Dolphin individuals were manually identified according to natural or non-natural markings on/around their dorsal fin. Several identifiable features like nicks, notches, pigmentation, and/or permanent scars, were included for identification and cross-matching (Wang et al., 2015; Methion and López, 2018). Whenever possible, body color, dorsal fin shape, nicks, notches, and sometimes permanent scars would be used to match two lateral sides of an individual (López et al., 2018; Liu et al., 2020b).
In this study, three classes of individual distinctiveness were defined: highly distinctive (D1), medium distinctive (D2), and non-distinctive (D3) (Friday et al., 2000; Zanardo et al., 2016). For each group, the marked individuals included D1 and D2 individuals, while the unmarked individuals only consisted of D3 individuals. All dolphin groups were classified into three types: almost all captured (AAC), not all captured (NAC), or all not captured (ANC). Group size estimates were only generated for AAC or NAC groups while excluding ANC because of no available photos. A group was considered as AAC when Gobserver was ≤10 individuals, indicating that all or almost all individuals were captured in the group (Tyne et al., 2014; Hupman et al., 2018). A threshold, i.e., 10 was selected because humpback dolphins were often observed in small groups with ≤10 individuals (Parsons, 2004; Würsig et al., 2016; Liu et al., 2021c). For AC groups, we calculated the photo-identification group size Gphoto by counting the number of D1, D2, and D3 individuals present. We defined a group with Gobserver > 10 individuals as NAC group. For NAC groups, the photo-identification group size Gphoto were estimated as using the formula:
where n(marked,i) is number of marked individuals in the group i. The mark rate (θ) was calculated from the proportion of randomly selected photos that contained identifiable dolphins (Williams et al., 1993; López et al., 2018). Among given randomly selected photos, N(marked + unmarked, i) and N(marked,i) is number of photos with marked and unmarked individuals, number of photos with marked individuals (Tyne et al., 2014; Hupman et al., 2018).
Data Analysis
Using the ArcGIS 10.1 (ESRI, Redlands, CA, United States), all boat-based survey routes and sighting locations of humpback dolphin achieved in each sampling region were mapped. A matrix heatmap was illustrated to show the number of boat-based survey days and humpback dolphin sightings per month from 2013 to 2019 in three survey regions. Frequency histograms were illustrated to display group size patterns obtained from various methods in different regions (Bouveroux et al., 2018; Liu et al., 2021b). The skewness, kurtosis, and median value of group size data were calculated for each subset (Doane and Seward, 2011). For paired group size estimates, all groups were presented in a scatter plot to illustrate the ratio of Gobserver to Gphoto (i.e., Robserver/photo) on a log-log scale with 1:1 reference line (Scott et al., 1985).
Generalized linear mixed models (GLMMs) were built to examine variances in group size of humpback dolphins, including fixed and random effects. In this study, the fixed effects were predicted by method (Gobserver or Gphoto) and region (SWH, SNB, or LZB), and the random effects by year (2013–2019) and season (spring: March–May, summer: June–August; autumn: September–November; or winter: December–February; Liu et al., 2021b). In the R 4.0.5 (R Development Core Team, 2021), the package “lme4” was used (Bates et al., 2015) to construct GLMMs with a Poisson family and logit link function (Vargas-Fonseca et al., 2018; Dorning and Harris, 2019). According to Akaike’s Information Criterion (AIC), the GLMMs were simplified sequentially to remove non-significant fixed and random effects. Once a significant effect was found, Post hoc Scheffe tests or Wilcoxon paired tests were used to compare mean values of estimated group size in different levels.
Based on relevant published literature (Zhou et al., 2007; Chen et al., 2009; Xu et al., 2012, 2015; Wang et al., 2013; Li et al., 2016; Liu et al., 2020a, b, 2021a; Peng et al., 2020), mean or median values of humpback dolphins previously collected in the sampling region were extracted from previous studies. Then, non-parametric one sample sign tests were used to compare the group size estimates in each sampling region collected from the present study and from the previous studies. All statistical analyses were conducted in the R 4.0.5, with a defined significance level of p < 0.05. All descriptive statistics were shown as mean ± SD, unless otherwise stated.
Results
From 2013 to 2019, a total of 231, 58, and 101 surveys were carried out in the SWH, SNB, and LZB, respectively (Figure 2). In these three waters, boat-based surveys covered a survey area of 3,319, 329, and 939 km2, respectively (Figures 1C–E). In total, 1,540, 299, and 714 h of survey effort (6.67, 5.16, and 7.07 h per survey day on average) were achieved, resulting in 15,548, 4,246, and 6,089 km of survey distance in each survey area. During these boat-based surveys, 47, 136, and 143 humpback dolphin groups were encountered (Figures 1F–H). The encounter rate (i.e., number of groups per 100 km) was 0.30, 3.20, and 2.35, respectively (Table 1). In each survey region, observer-based counts (Gobserver) were recorded for 45, 117, and 139 dolphin groups, respectively (Figure 2). In addition, 11,354 (32.8% out of 34,615), 11,056 (42.4% out of 26,076), and 15,779 (34.5% out of 45,739) qualified photos were available for the photo-identification in each region (Table 1). The process of photo-identification generated group size estimates (Gphoto)for 30, 123, and 113 dolphin groups in the SWH, SNB, and LZB, respectively (Table 1).
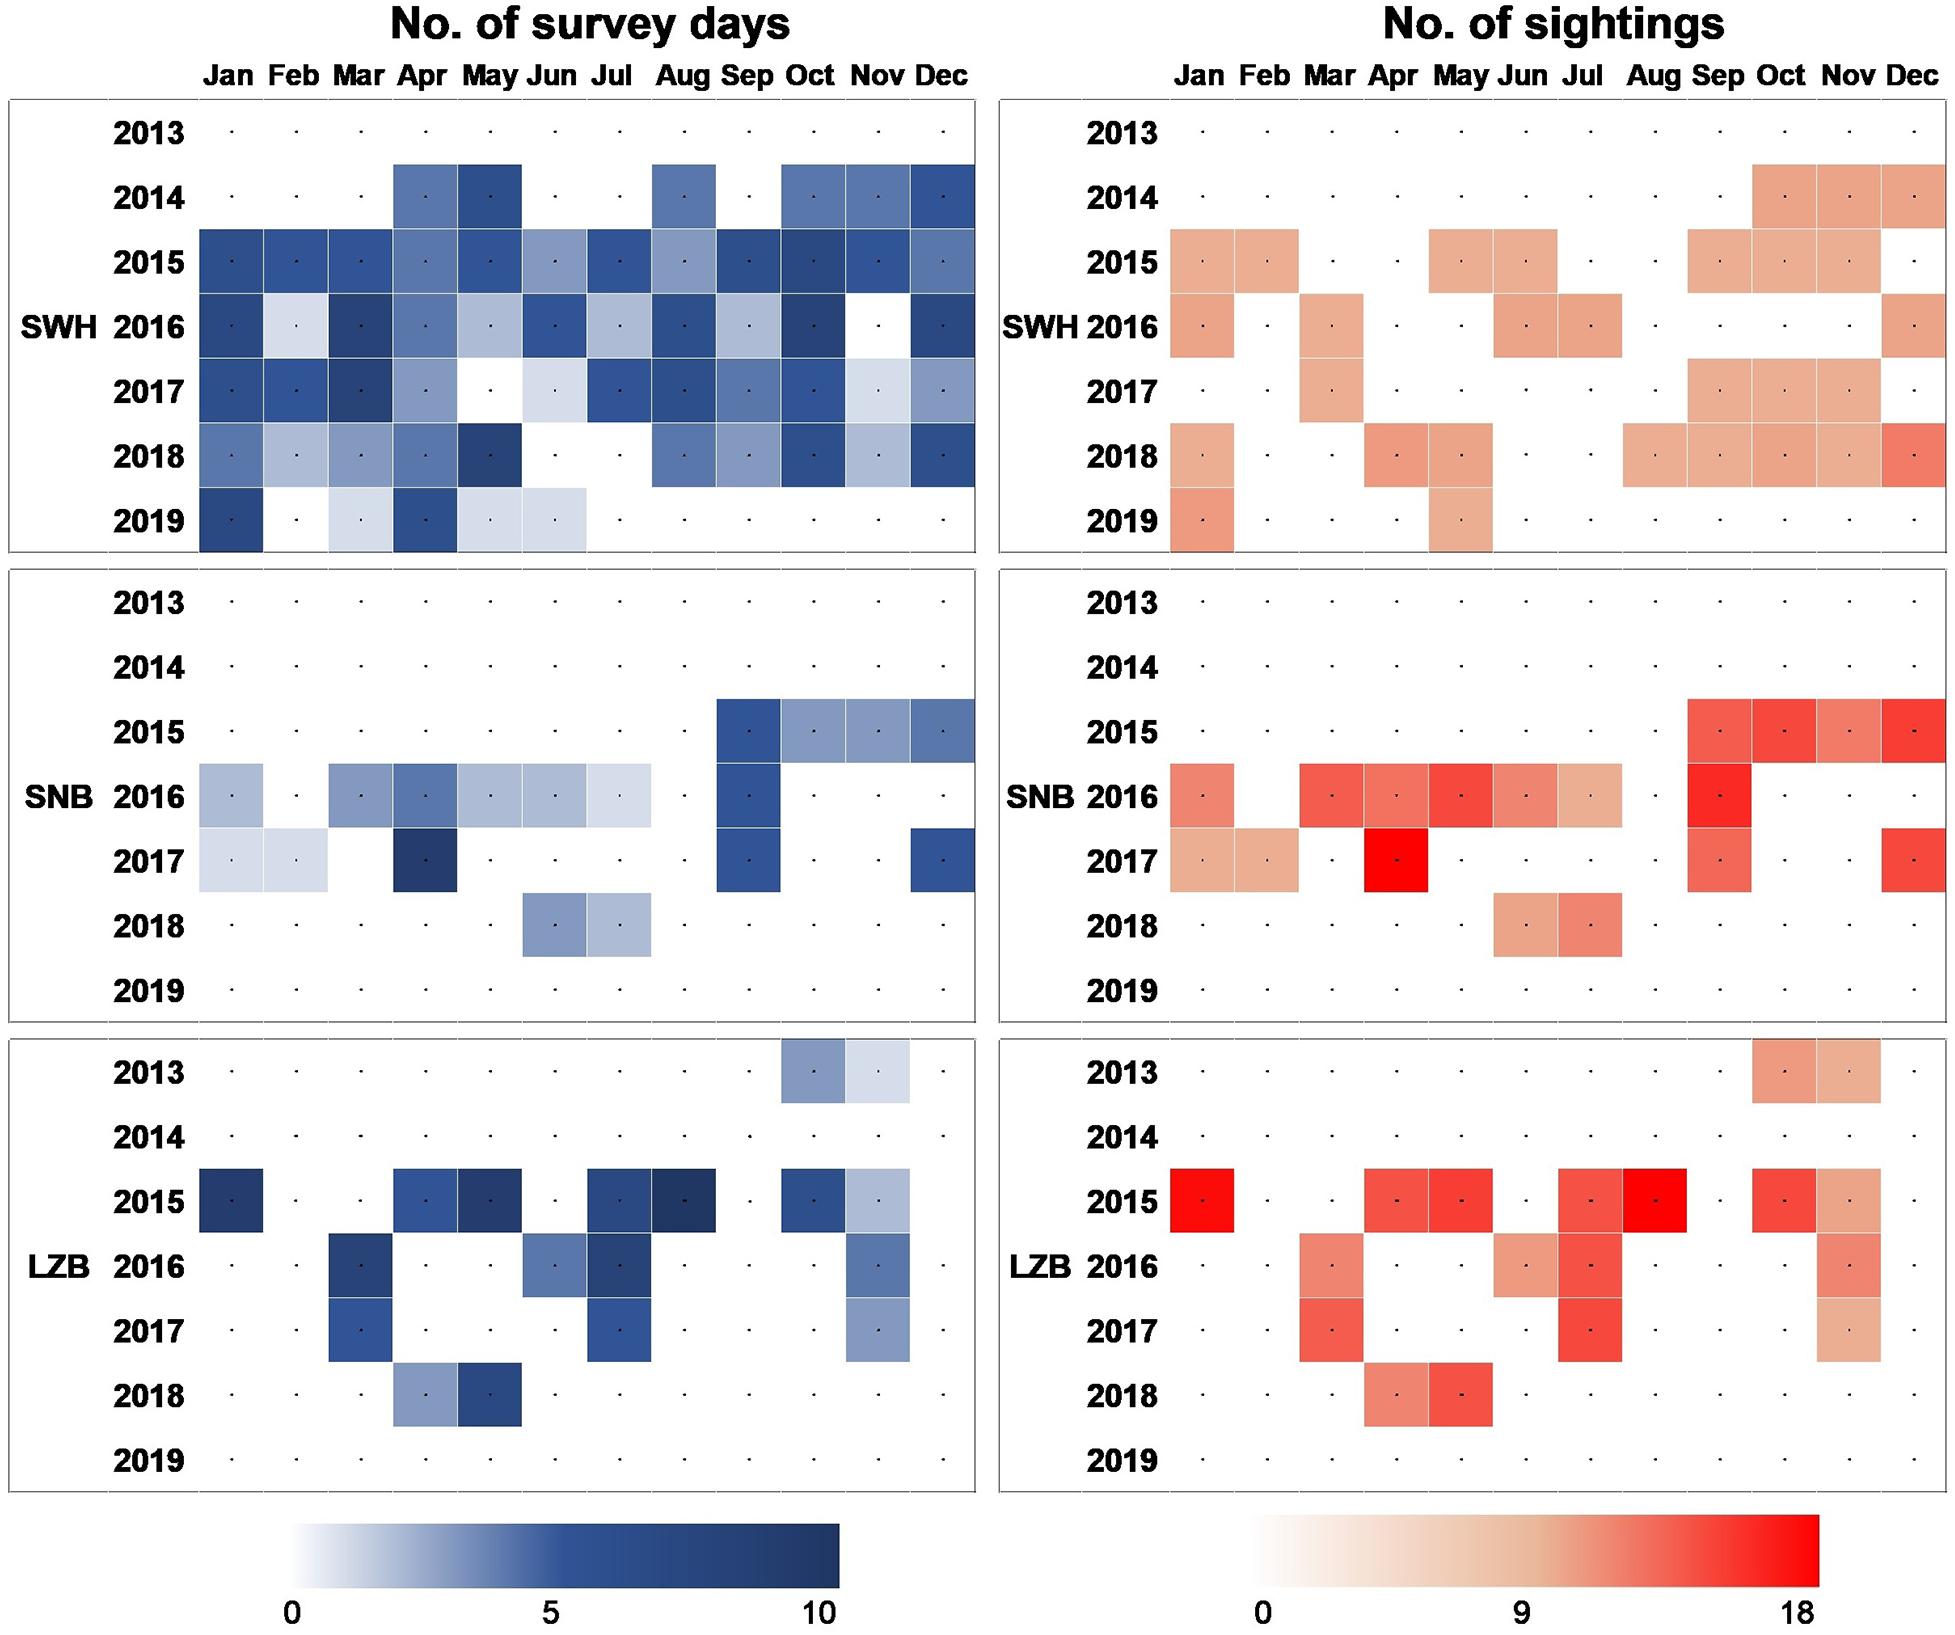
Figure 2. A colorful matrix plot to show number of survey days and humpback dolphin sightings per month from 2013 to 2019 in three survey areas: SWH, SNB, and LZB.
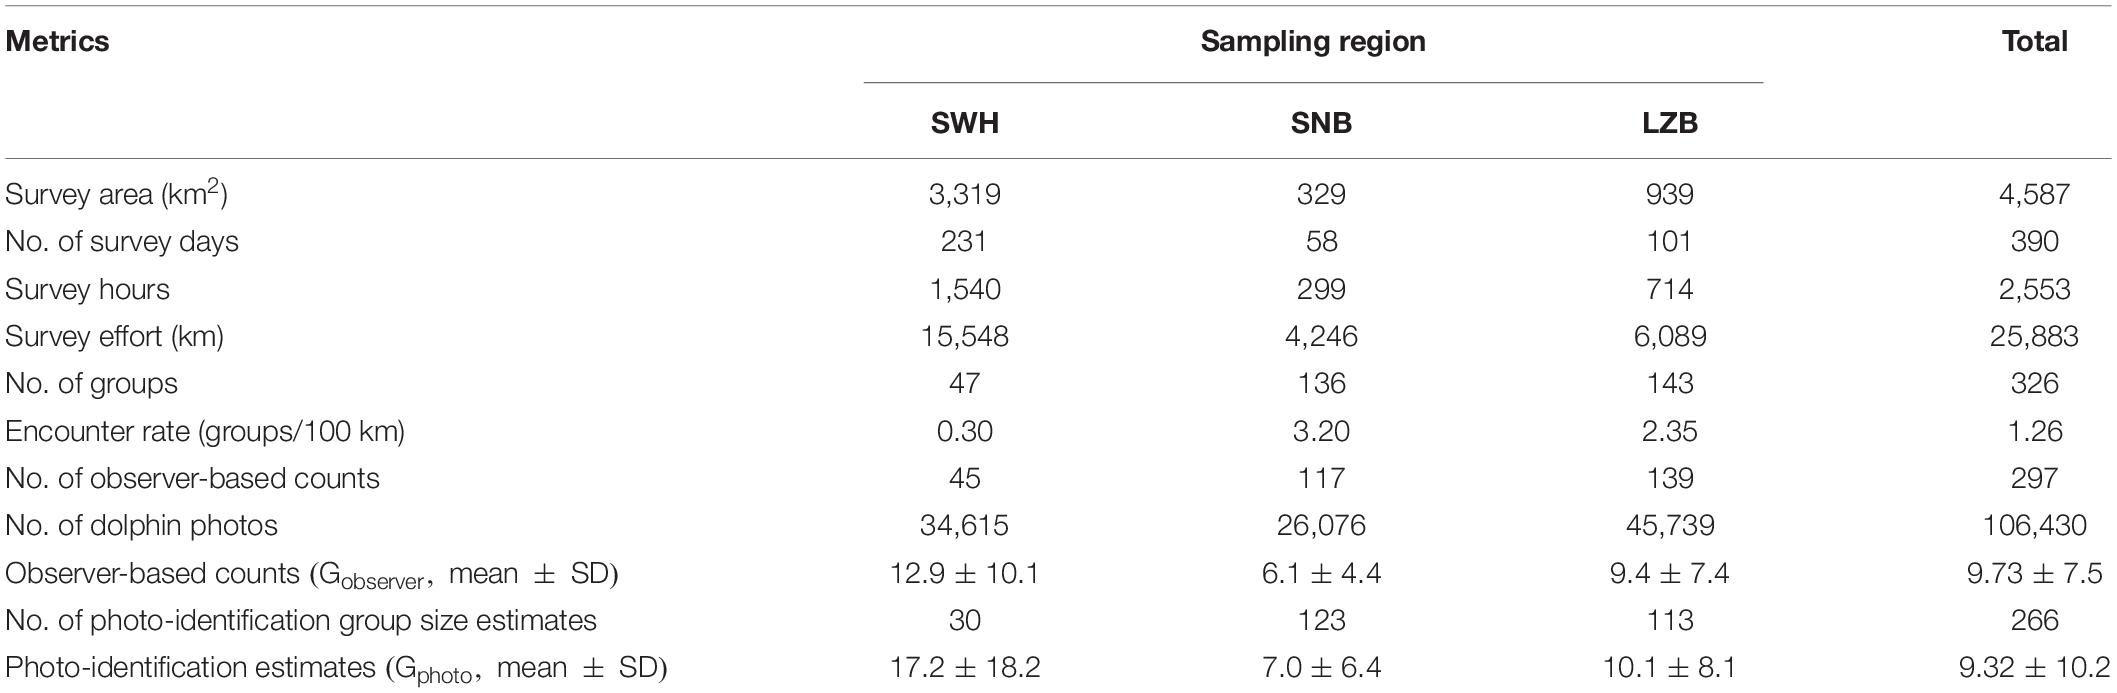
Table 1. Summary of survey information on Indo-Pacific humpback dolphins (Sousa chinensis) in the waters southwest off Hainan Island (SWH), Sanniang Bay (SNB), and Leizhou Bay (LZB).
Histograms of group size estimates were skewed with a long tail to the right (Figures 3A–F), since most groups (80-90% of the total observation) consisted of fewer than 20 members and only a few groups (<5%) were large with >30 members. The skewness and kurtosis of histograms varied between estimation methods, and also differed among sampling regions (Figures 3A–F). The median values of Gobserver were 10, 5, and 9 in the SWH, SNB, and LZB, respectively. The median values of Gphoto were 12, 5, and 8 in each sampling region (Figures 3A–F). The scatter plot of Robserver/photo i.e., the ratio of Gobserver to Gphoto, showed that values of Robserver/photo were randomly distributed on and near the 1:1 line (Figure 4).
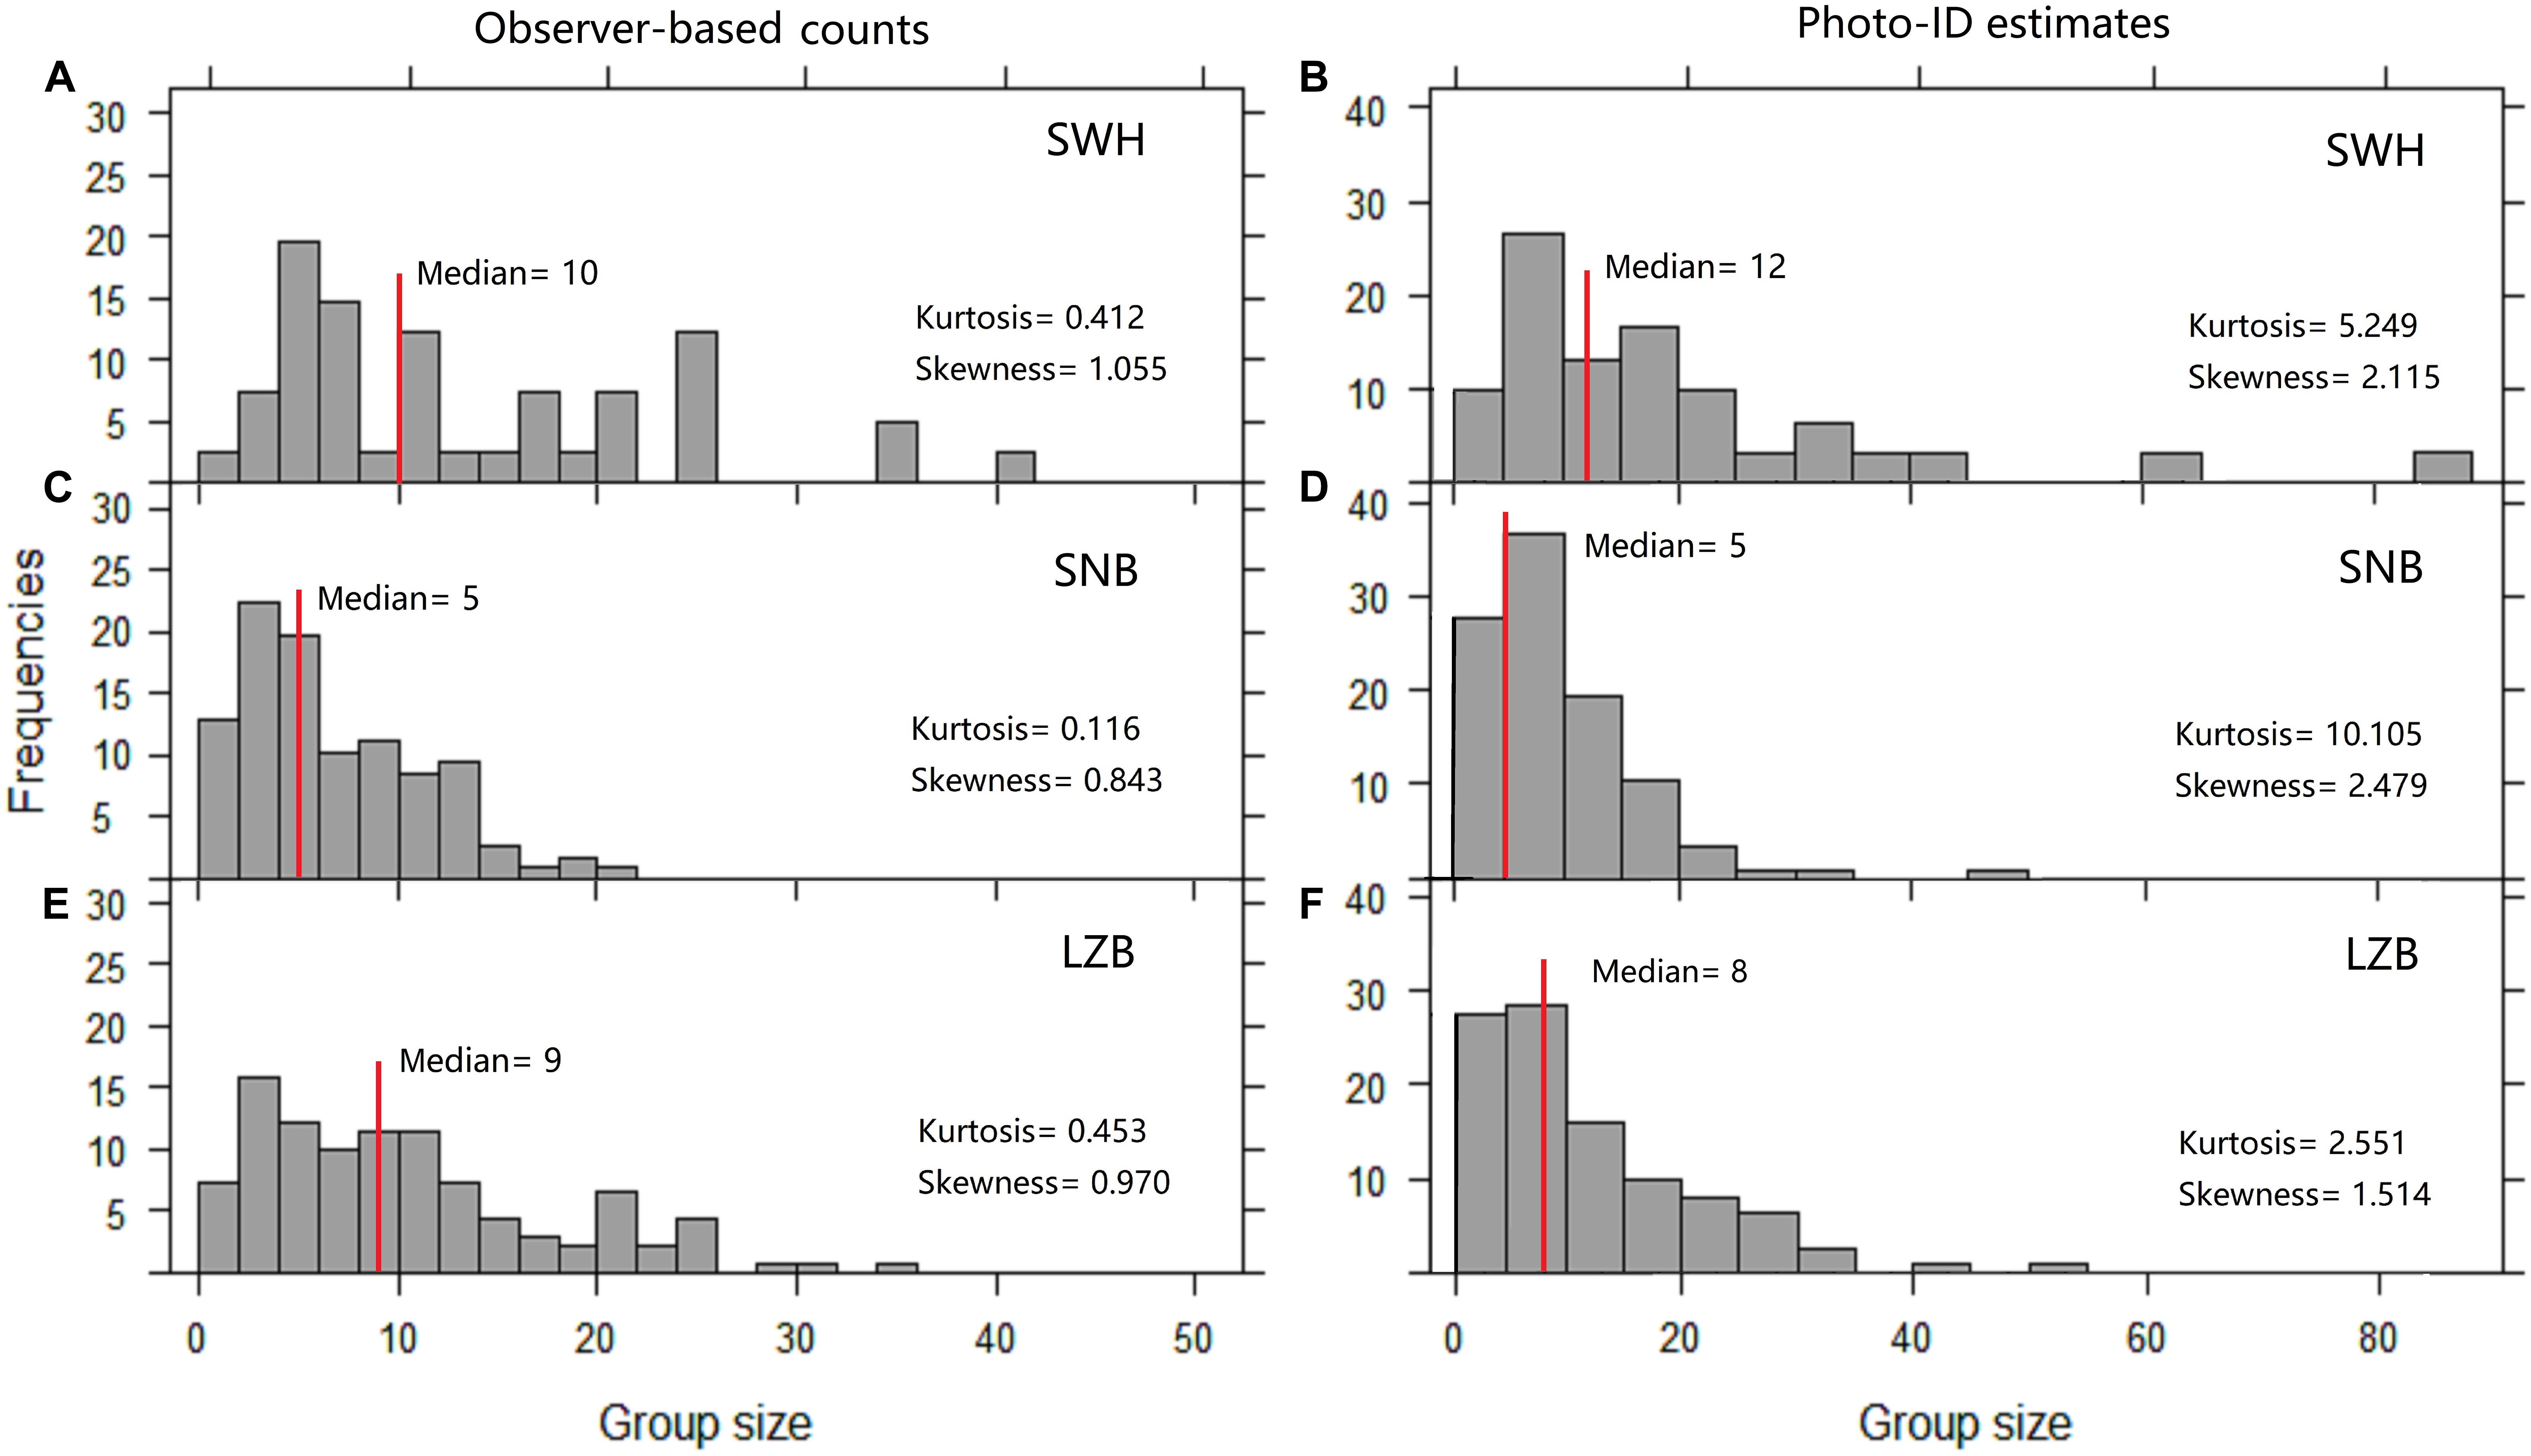
Figure 3. Frequency histograms of humpback dolphin group size in the (A,B) SWH, (C,D) SNB, and (E,F) LZB.Gobserver: observer-based counts, Gphoto: photo-identification estimates.
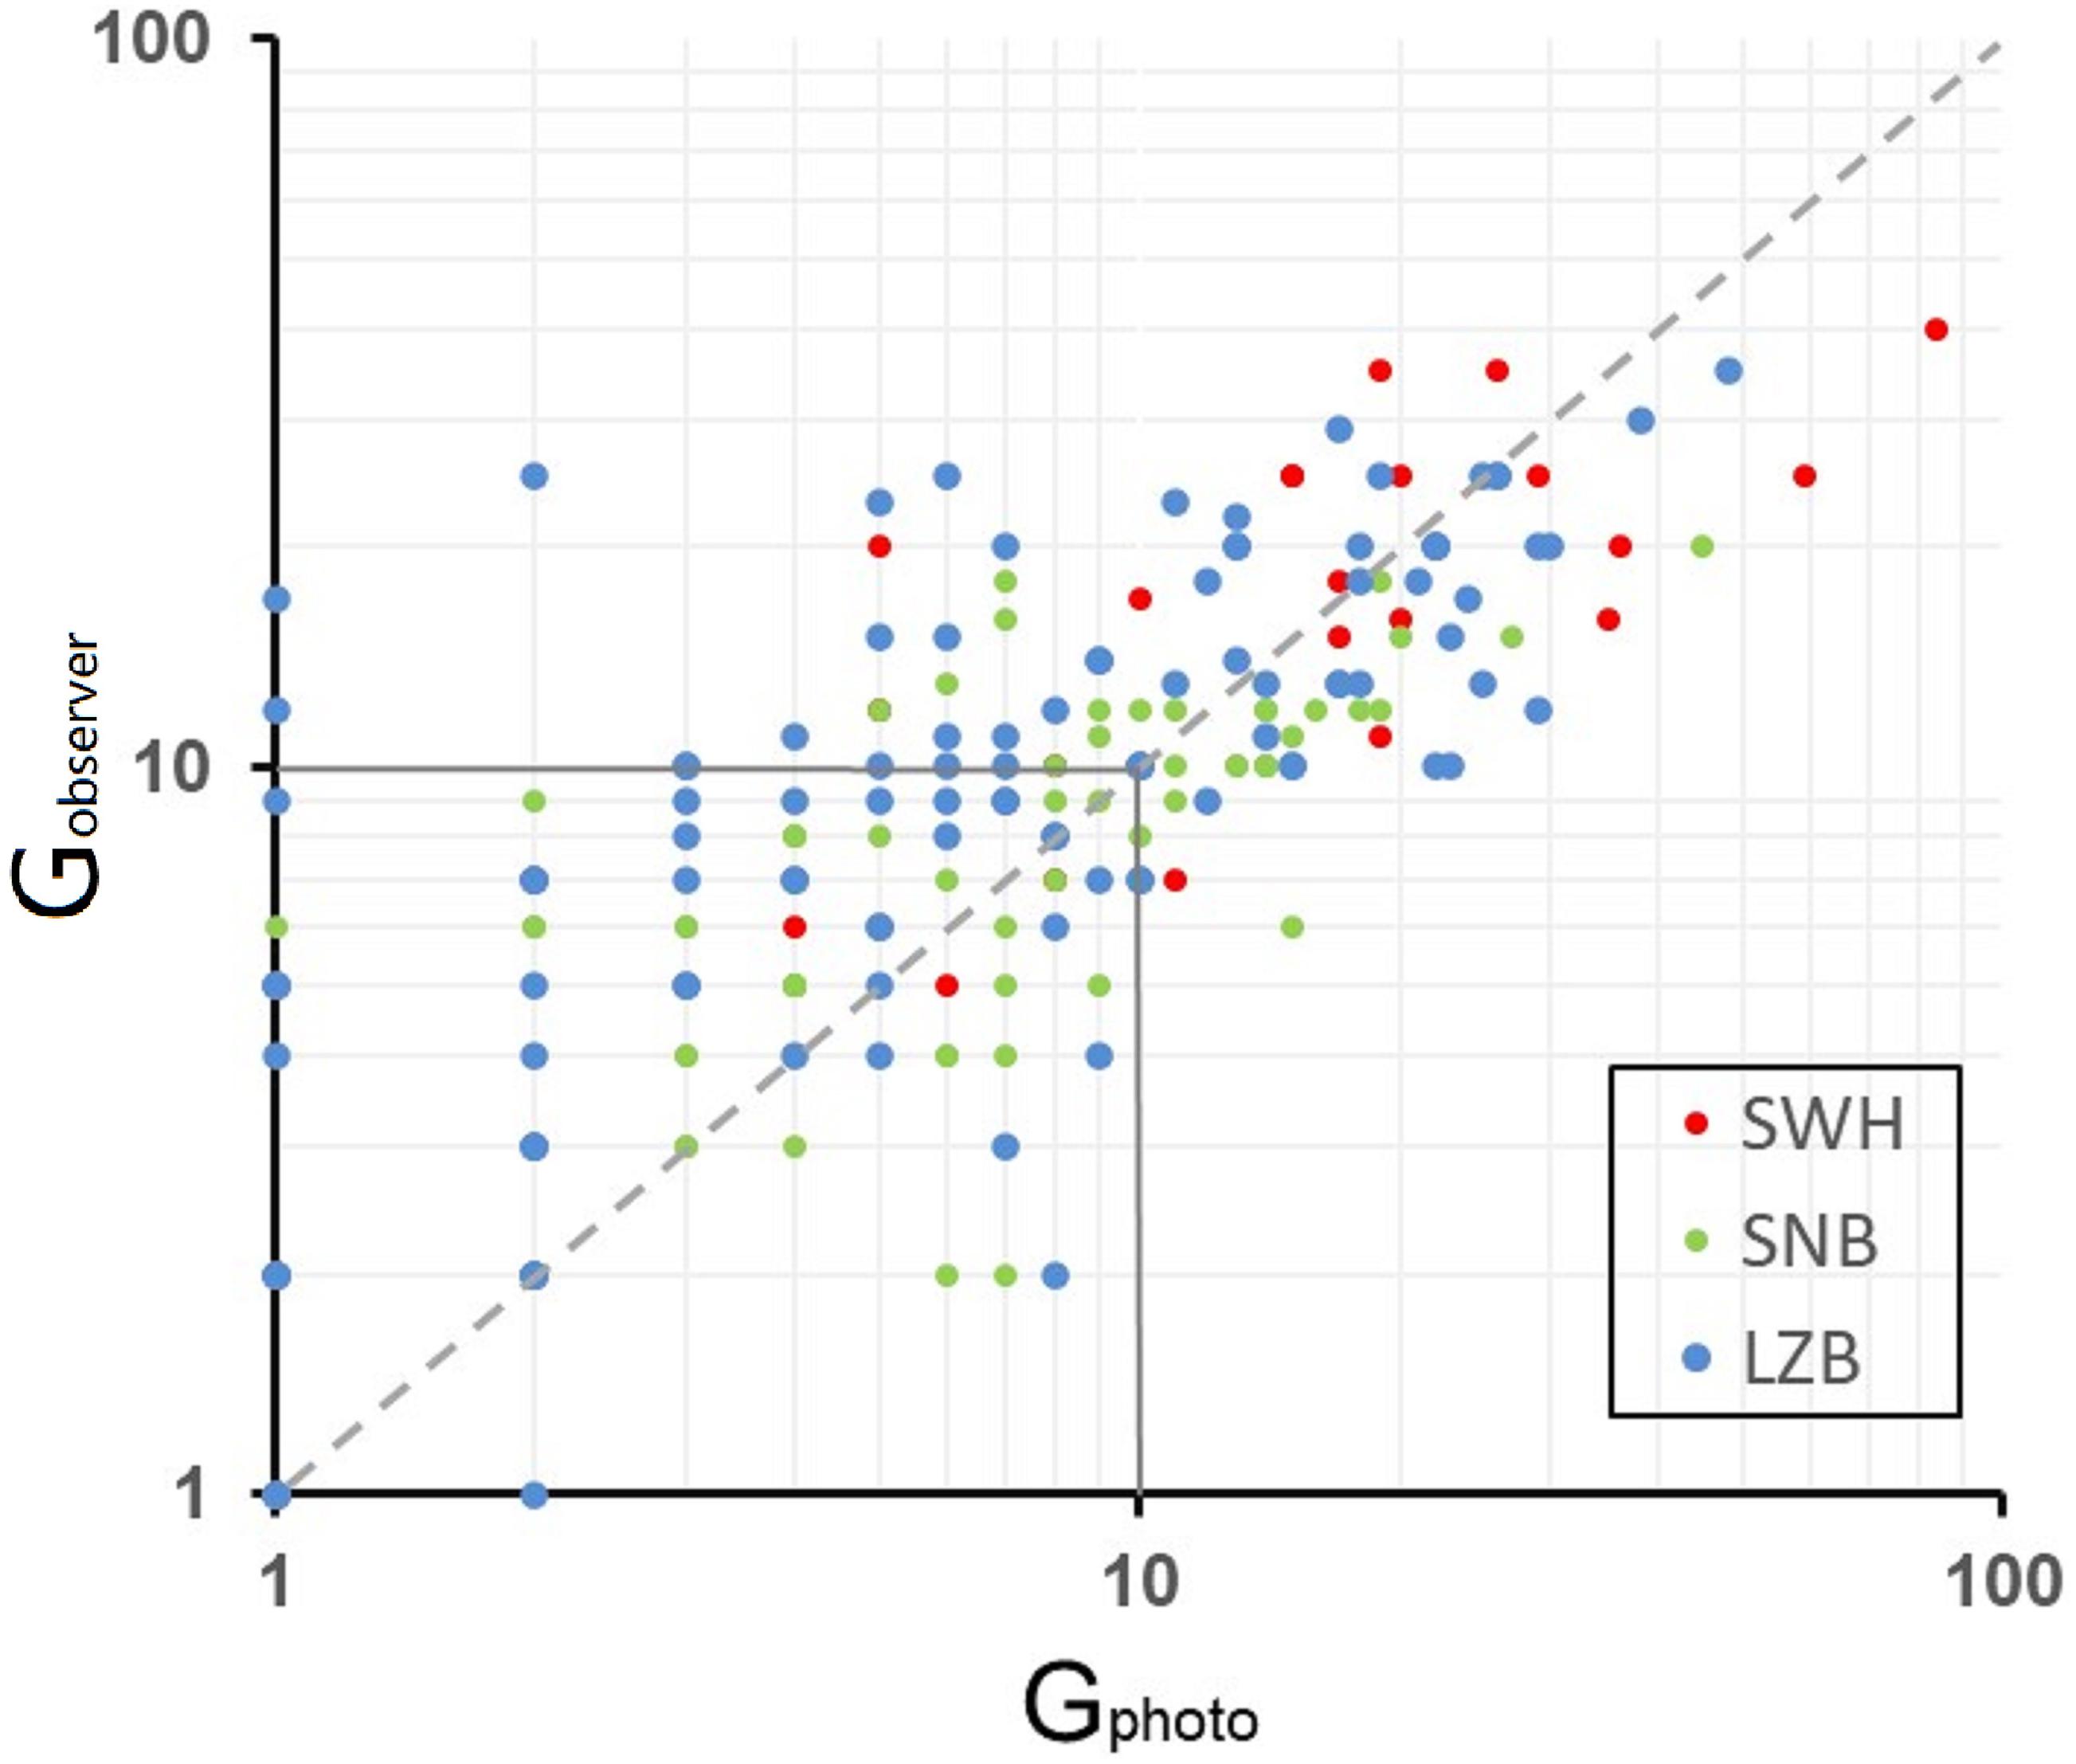
Figure 4. Robserver/photo of humpback dolphin group size on a log-log scale: observer-based counts (Gobserver) against photo-identification estimates (Gphoto). The grey dash line is the 1:1 line.
The GLMM indicated that variances in dolphin group size were primarily affected by sampling region (p < 0.001) and interaction of region × method (p = 0.035; Table 2). In addition, the interaction of year × season had a significant random effect on influencing dolphin group size (p < 0.001). The interaction of method × year × season had a significant mixed effect on influencing dolphin group size (p = 0.022). Post-hoc Scheffe tests showed that Gobserver in the SWH were significantly larger than Gobserver in the SNB (p < 0.001), or LZB (p < 0.001), while Gobserver in the SNB were smaller than Gobserver in the LZB (p < 0.001; Figure 5). Gphoto in the SWH were significantly larger than Gphoto in the SNB (p < 0.001), or LZB (p = 0.009), but Gphoto in the SNB were not statistically different from Gphoto in the LZB (p = 0.129; Figure 5). Wilcoxon paired comparisons indicated that group size in the SWH (p = 0.023) and LZB (p = 0.038) varied between two estimation methods, but group size in the SNB (p = 0.177) did not vary between methods.
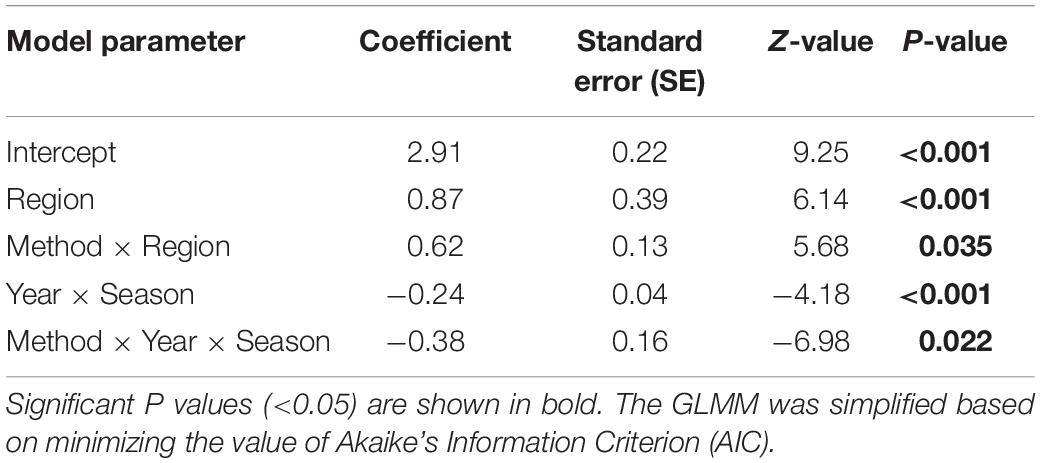
Table 2. A Poisson generalized linear mixed model (GLMM) investigating the fixed effects of method (observer-based counts and photo-identification) and region (SWH, SNB, and LZB), the random effects of survey year (2013-2019) and season (spring, summer, autumn, and winter), and the mixed effects of their interactions on group size of humpback dolphins.
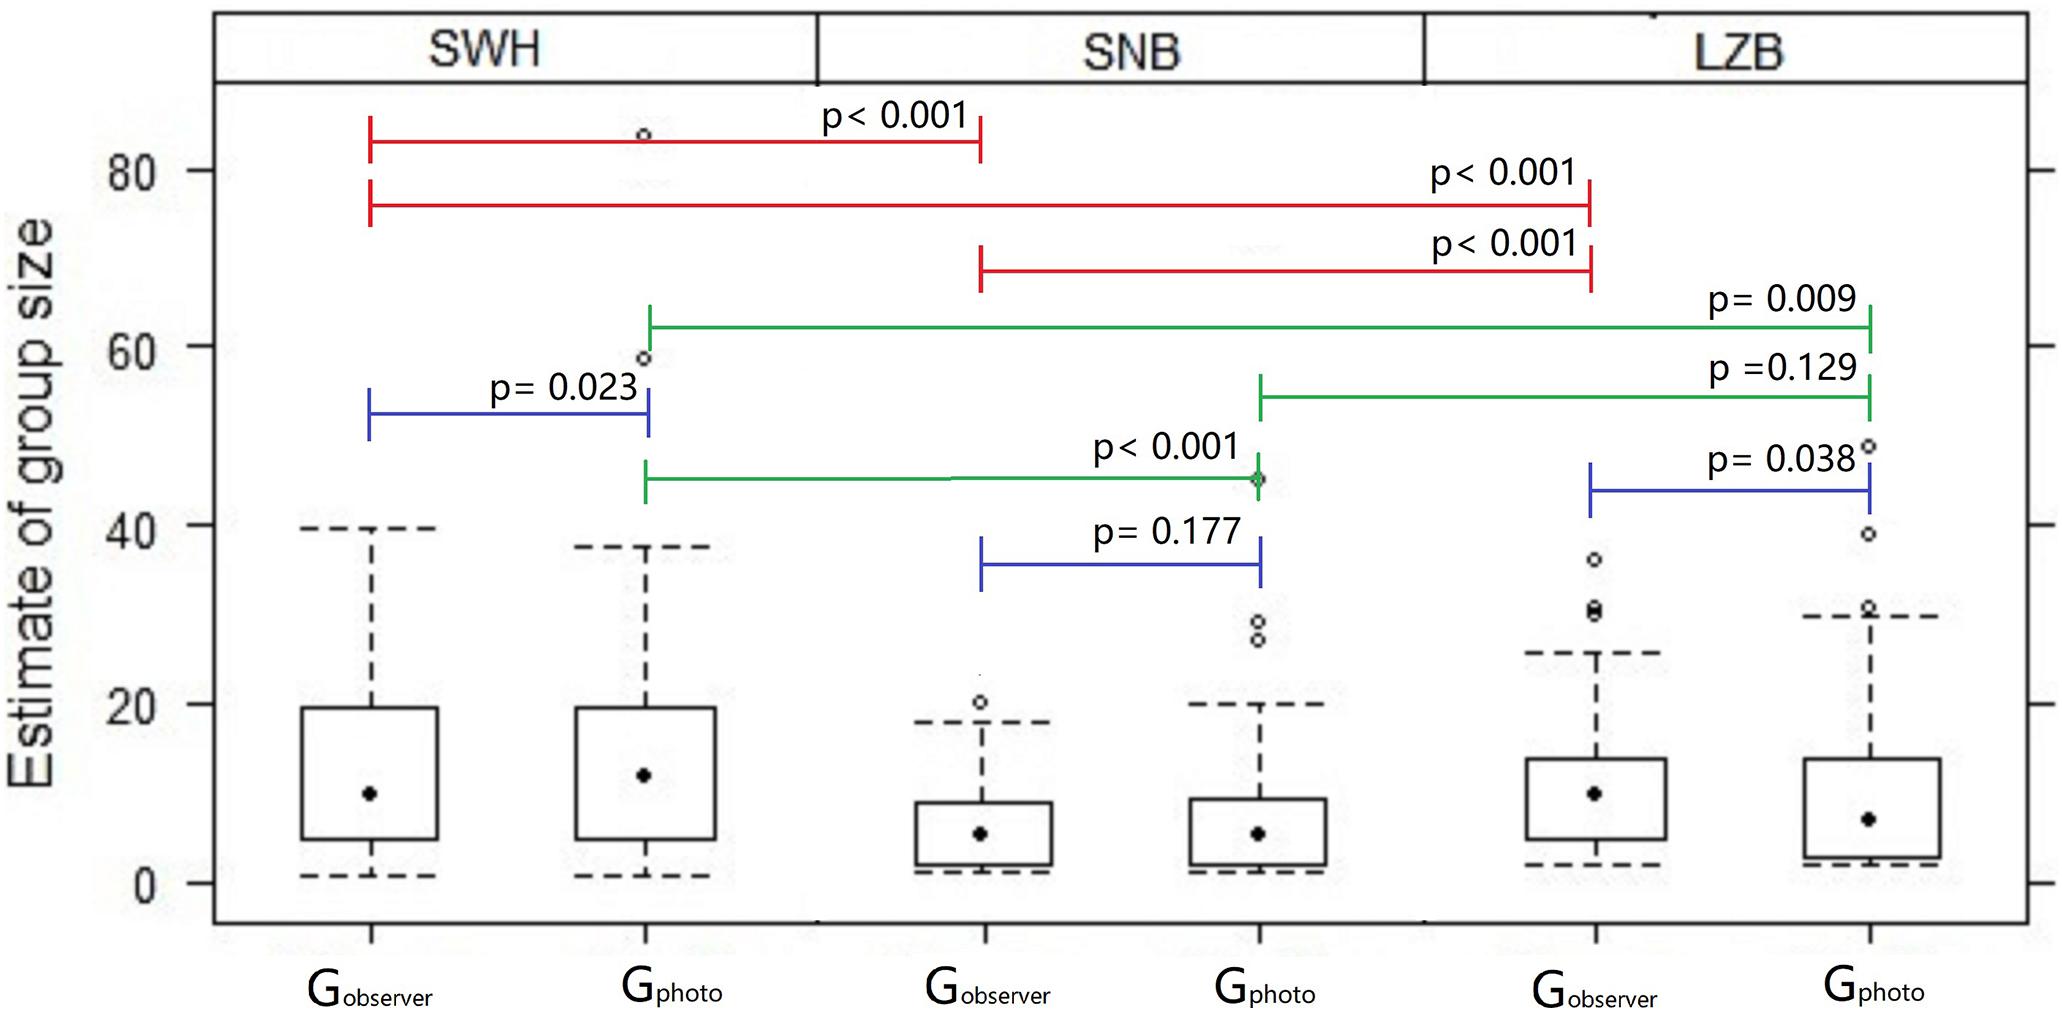
Figure 5. Boxplot of humpback dolphin group size obtained from observer-based counts (Gobserver) and photo-identification estimates (Gphoto) in the SWH, SNB, and LZB. The median (black dots), lower (25%) and upper (75%) quartiles, and outlier values (black circles) are illustrated. P-values were indicated for the paired comparisons of group size between methods and geographic comparisons of group size between regions, with a significance level of <0.05.
In total, 10 relevant publications were obtained with documenting group size estimates of humpback dolphins in the SWH (n = 2), SNB (n = 3), and LZB (n = 5; Table 3). In the SWH, statistical comparisons indicated significant differences between Gobserver or Gphoto in this study and the mean group size estimated from Li et al. (2016): Gobserver vs. 21.6 (p = 0.036), Gphoto vs. 21.6 (p = 0.004). In the SNB, there was no significant differences between Gobserver or Gphoto in this study and the mean group size of 6.39 (Peng et al., 2020) or 5.63 (Chen et al., 2009): Gobserver vs. 6.39 (p = 0.141), Gphoto vs. 6.39 (p = 0.062), Gobserver vs. 5.63 (p = 0.922), and Gphoto vs. 5.63 (p = 0.378). In the LZB, no significant differences were detected between Gobserver or Gphoto in this study and the median group size of 8 estimated from Zhou et al. (2007) or the mean group size of 8.12 estimated from Xu et al. (2015): Gobserver vs. 8.12 (p = 0.087), Gphoto vs. 8.12 (p = 0.057), Gobserver vs. 8 (p = 0.159), Gphoto vs. 8 (p = 0.088). However, significant differences were detected between our data and the mean or median group size of estimated from Xu et al. (2012, 2015): Gobserver vs. 7 (p = 0.013), Gphoto vs. 7 (p = 0.043), Gobserver vs. 7.5 (p = 0.013), Gobserver vs. 6 (p < 0.001), Gphoto vs. 7.5 (p = 0.045), and Gphoto vs. 6 (p = 0.036).
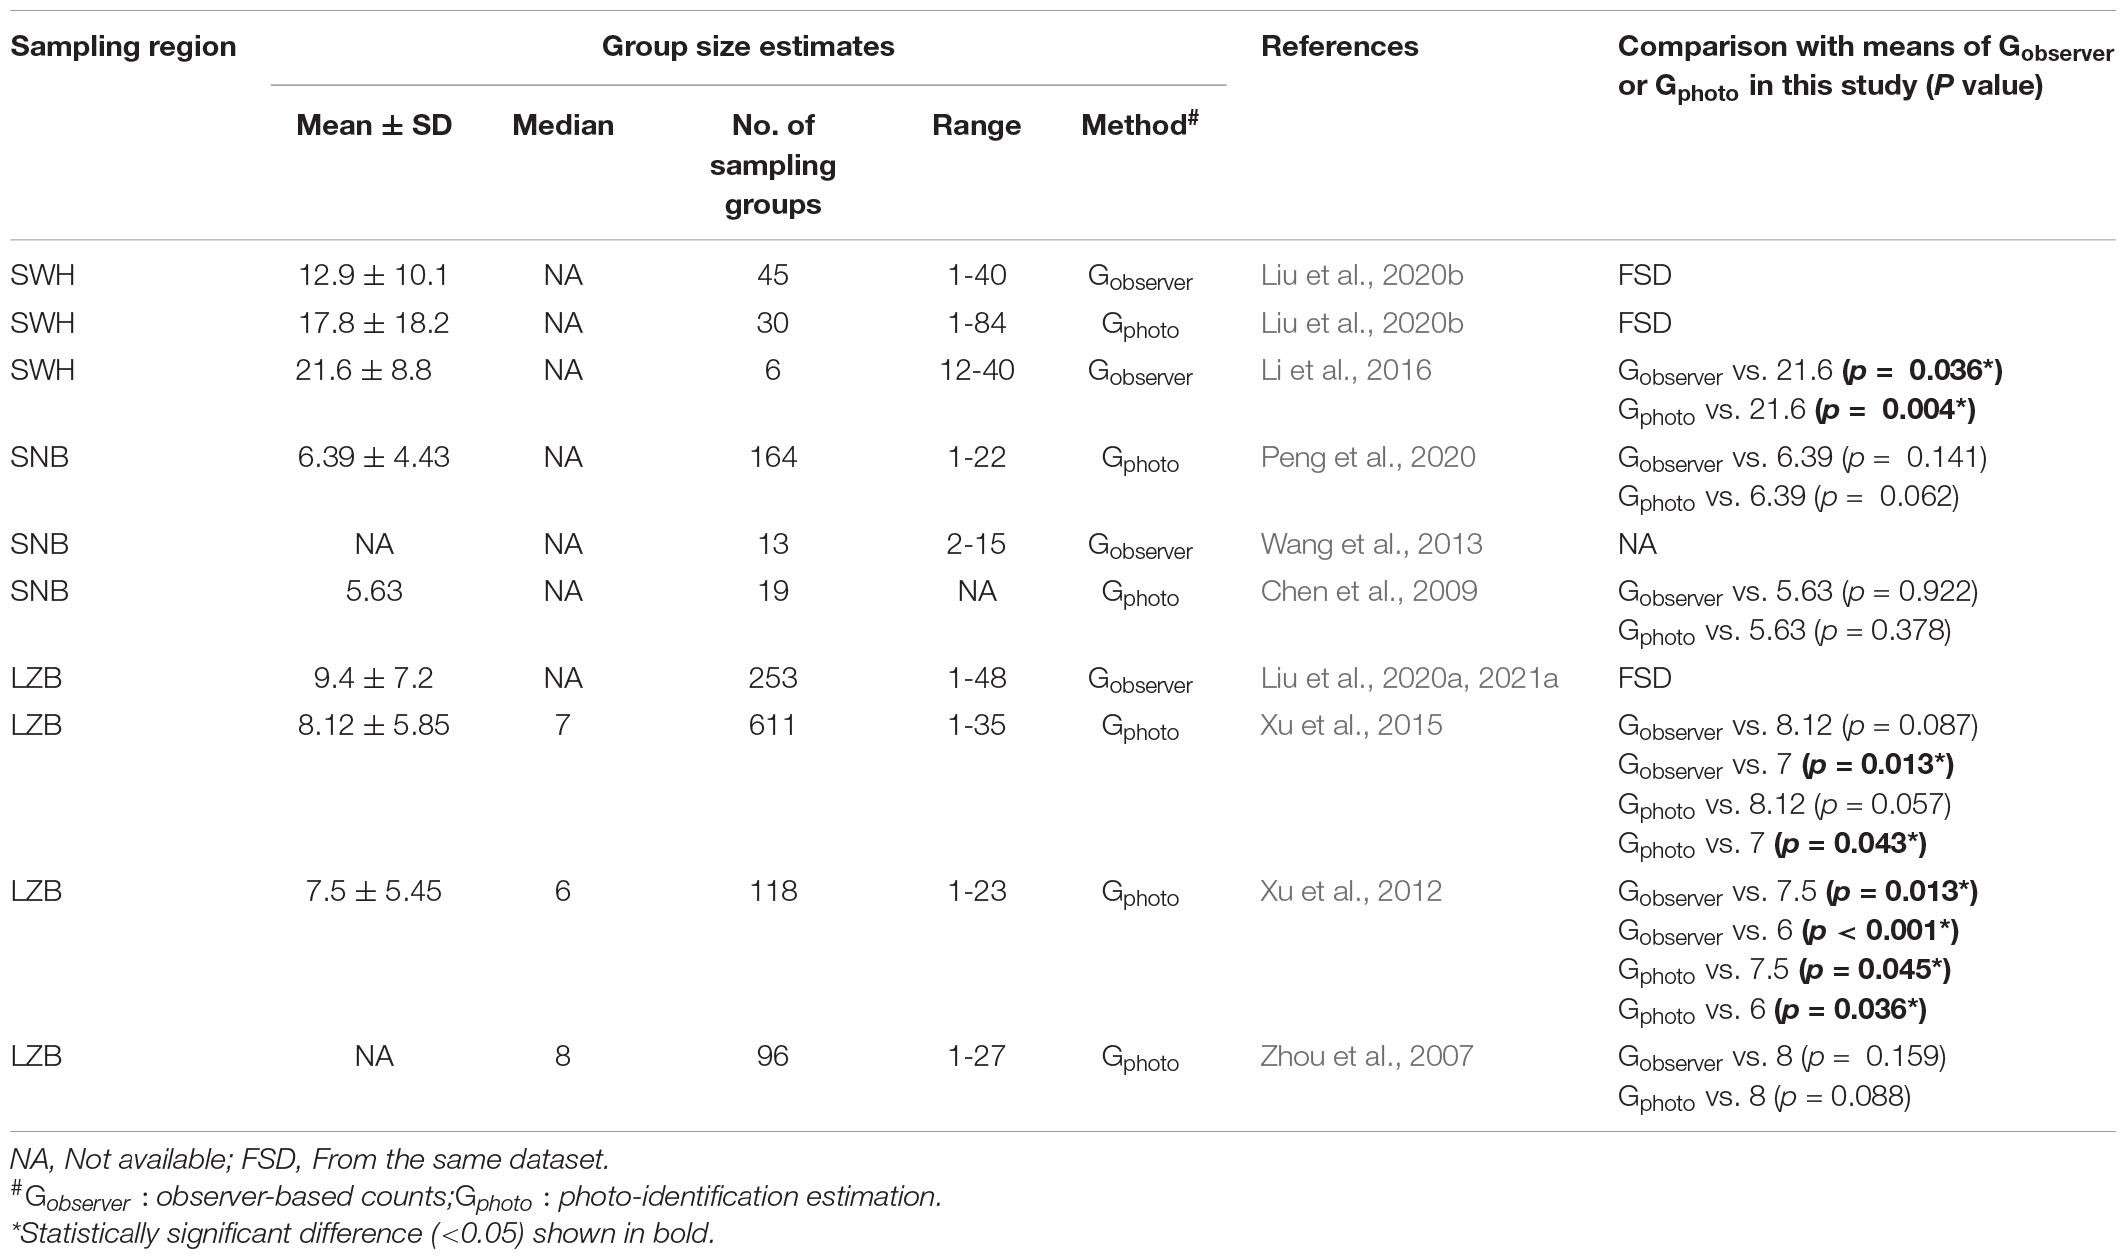
Table 3. Comparisons of humpback dolphin group size obtained from different studies in three sampling regions, i.e., SWH, SNB, and LZB.
Discussion
In this study, several key findings were obtained. First, this study clearly illustrated that traditional estimation methods, i.e., observer-based counts and photo-identification could generate variable group size estimates for humpback dolphins. Second, this study demonstrated that group size of humpback dolphins was significantly different among three sampling regions. Third, methodological variances in dolphin group size were found in some sampling regions, revealed by statistical comparisons between data in this study and in previous studies. These findings are beneficial to the use of different methods in estimating group size for humpback dolphins, and help clarify potential methodological and biogeographical variances in group size estimates.
This study made the first attempt to sample comparable group size of humpback dolphins from different geographic regions by using two methods simultaneously. Our data clearly revealed that dolphin group size across three sampling regions, no matter from observer-based counts or photo-identification, were highly variable, typically including single individual, small pairs, and rarely middle-to-large aggregations of several tens (Parsons, 2004; Würsig et al., 2016; Liu et al., 2021c). Notably, small groups with ≤10 members were the most frequently encountered (80-90%), while only a small proportion (<5%) were large groups with >30 members. Such grouping pattern (i.e., living in small groups) has been considered a general social strategy of near-shore delphinid species inhabiting shallow and/or estuarine waters (Gygax, 2002a, b; Gowans et al., 2007), where the availability of prey is often predictable in space and time. Additionally, near-shore dolphins might prefer hosting small groups due to relatively low predation pressure compared with oceanic species (Bouveroux et al., 2018; Liu et al., 2021c).
This study confirmed that the inter-population variability of humpback dolphin group size was primarily explained by biogeographical differences. Dolphin group size manifested skewed distribution patterns with only a few groups much larger than the median, but the skewness and kurtosis of histograms varied among regions and between methods. This finding suggested possible biogeographical and methodological variances in group size estimates of humpback dolphins, which was further demonstrated by the GLMM and statistical comparisons. The GLMM indicated that variances in group size of humpback dolphins were primarily explained by the sampling region. Besides humpback dolphins, several other delphinid species, such as bottlenose dolphins Tursiops spp. (Connor, 2000; Bouveroux et al., 2018), Guiana dolphins Sotalia guianensis (Moura et al., 2019), and some river dolphins Inia geoffrensis and Sotalia fluviatilis (Gomez-Salazar et al., 2012), have been found to form different sizes of groups in various geographic habitats. Such inter-population variability in dolphin group size might reflect the adaptations of dolphin populations to different ecological constraints in fine-scale environments (Gygax, 2002a, b; Gowans et al., 2007; Peña and Nöldeke, 2018).
This study revealed that both inter- and intra-population variability of humpback dolphin group size might be influenced by different methods. Using either observer-based counts or photo-identification, group size data have been previously documented in the SWH (Li et al., 2016), SNB (Chen et al., 2009; Wang et al., 2013; Peng et al., 2020), LZB (Zhou et al., 2007; Xu et al., 2012, 2015), and elsewhere (Parsons, 2004; Würsig et al., 2016; Liu et al., 2021c). However, previous studies rarely provided comparable estimates that were simultaneously collected with these two methods, making it hard to compare estimates achieved in different study systems. Statistical comparisons between different studies clearly showed that the use of observer-based counts or photo-identification might result in complex variances in group size estimates of humpback dolphins (Liu et al., 2020b, 2021c). Furthermore, dolphin group size might also be influenced by sample size (Gerrodette et al., 2019; Liu et al., 2020b), survey period (Koper et al., 2016), observer experience (Boyd et al., 2019), and/or the process of photo-identification (Auger-Méthé et al., 2010; Hupman et al., 2018) to varying degrees.
Both experienced observers and photo-identification might give underestimated, overestimated, or unbiased group size for humpback dolphins, while the potential bias and variance in Gobserver and Gphoto became unpredictable as the true group size was unknown for each sample (Scott et al., 1985; Gerrodette et al., 2002). Although primary observers in this study were experienced, there was still a high risk of underestimating group size due to various factors including visual conditions (i.e., sea state, sun glare; Barlow et al., 1998), dolphin behaviors (aerial behavior, underwater foraging, or boat-avoiding; Walsh et al., 2009), observers’ perception (Erwin, 1982; Binda et al., 2011), and group dispersal (Clement et al., 2017; Hamilton et al., 2018).
Humpback dolphins typically have higher mark rates than other cetacean species (Pawley et al., 2018), and within an encounter, most often, all photographically captured individuals can be identified at least temporarily (i.e., within the encounter) including young individuals sometimes (Liu et al., 2020b; Tang et al., 2021). Photo-identification is less likely to overestimate group size for a given group, since each individual is often identified by comparable markings, unless repeated counts or mismatch between two lateral sides happen (Stevick et al., 2001; Urian et al., 2015). Thus, the comparisons between Gobserver and Gphoto in this study is a classic problem, in which there is a relatively accurate method, i.e., photo-identification to obtain conservative measurements (Scott et al., 1985; Gerrodette and Perrin, 1991), while another method, i.e., observer-based counts, to generate measurements without knowing the potential bias and variance (Gerrodette et al., 2002, 2019).
Across all three sampling regions, photo-identification, i.e., Gphoto appeared to generate larger values of mean group size than observer-based counts, i.e., Gobserver, suggesting a high risk of underestimation of Gobserver. This finding was consistent with previous studies: even experienced observers still tend to underestimate dolphin group size (Scott et al., 1985), and such trend increased with the group size (Gerrodette et al., 2019). However, photo-identification could not always give larger values of median group size. This was mainly because that the mean group size could be enlarged by rare large groups (Gerrodette et al., 2002, 2019), while the median group size was less likely affected by large values (Doane and Seward, 2011; Meropi et al., 2018). For example, large groups with up to 84 members have been identified through photo-identification in the SWH (Liu et al., 2020b), which greatly contributed to enlarge the mean group size 17.2, but would not influence the median group size 12.
The Indo-Pacific humpback dolphin is currently listed as a “Vulnerable” (VU) species by the Red List of International Union for Conservation of Nature (Jefferson et al., 2017), with an inferred decrease in abundance but no global abundance estimates (Jefferson and Smith, 2016; Li, 2020). The findings in this study are essential to yield more accurate abundance and density estimation for this species. Nevertheless, the true size of dolphin group in the wild is often uncertain, no matter in this study or in previous studies. Consequently, the potential bias and variance in dolphin group size estimated from observer-based counts or photo-identification could not be removed. The main challenge is to compare these traditional methods with a third one on that could better represent the true group size (Boyd et al., 2019). Therefore, other methods, such as drones-based aerial photographic counts (Hartman et al., 2020; Giles et al., 2021) and acoustic estimation (Van Parijs et al., 2002; Wang et al., 2005), are warranted to be employed in future research for a wider comparison and calibration.
Data Availability Statement
The raw data supporting the conclusion of this article will be made available by the authors, without undue reservation.
Ethics Statement
This animal study was reviewed and approved by the Chinese Academy of Sciences under an Ethics Statement with the number of IDSSE-SYLL-MMMBL-01.
Author Contributions
MLiu, MLin, XT, LD, and PZ: data collection. MLiu, MLin, and XT: photographic catalogue establishment. MLiu: formal analysis and writing—original draft. SL, ML, and MLiu: funding acquisition. MLiu, MLin, DL, and SL: methodology. MLin, DL, and SL: writing—review and editing. All authors contributed to the article and approved the submitted version.
Funding
National Natural Science Foundation of China (Nos. 41406182, 41306169, and 41422604; Funding to SL and MLin), Biodiversity Investigation, Observation and Assessment Program of Ministry of Ecology and Environment of China (No. 2019–2023; Funding to SL), Ocean Park Conservation Foundation of Hong Kong (MM02-1516, AW02-1920; Funding to SL and MLin), and UK-China Newton Fund Placement from China Scholarship Council and British Council (Funding to MLiu).
Conflict of Interest
The authors declare that the research was conducted in the absence of any commercial or financial relationships that could be construed as a potential conflict of interest.
Publisher’s Note
All claims expressed in this article are solely those of the authors and do not necessarily represent those of their affiliated organizations, or those of the publisher, the editors and the reviewers. Any product that may be evaluated in this article, or claim that may be made by its manufacturer, is not guaranteed or endorsed by the publisher.
Acknowledgments
We are grateful to all the colleagues and students of the Marine Mammal and Marine Bioacoustics Laboratory. Great thanks to Xiao Xu, Mingzhong Liu, Jianchen Dong, Kuan Li, and Francesco Caruso for their assistance and participation in the field work. Much appreciated to the handling editor and two reviewers for their constructive comments and helpful suggestions.
References
Auger-Méthé, M., Marcoux, M., and Whitehead, H. (2010). Nicks and notches of the dorsal ridge: promising mark types for the photo-identification of narwhals. Mar. Mamm. Sci. 26, 663–678.
Barlow, J., Gerrodette, T., and Perryman, W. (1998). Calibrating group size estimates for cetaceans seen on ship surveys. Southwest Fisheries Science Center, National Marine Fisheries Service. Administr. Rep. LJ 1998, 98–11.
Bates, D., Mächler, M., Bolker, B., and Walker, S. (2015). Fitting linear mixed-effects models using lme4. J. Stat. Software 67, 1–48. doi: 10.18637/jss.v067.i01
Binda, P., Morrone, M. C., Ross, J., and Burr, D. C. (2011). Underestimation of perceived number at the time of saccades. Vision Res. 51, 34–42. doi: 10.1016/j.visres.2010.09.028
Bouveroux, T. N., Caputo, M., Froneman, P. W., and Plön, S. (2018). Largest reported groups for the Indo-Pacific bottlenose dolphin (Tursiops aduncus) found in Algoa Bay, South Africa: Trends and potential drivers. Mar. Mamm. Sci. 34, 645–665. doi: 10.1111/mms.12471
Boyd, C., Hobbs, R. C., Punt, A. E., Shelden, K. E., Sims, C. L., and Wade, P. R. (2019). Bayesian estimation of group sizes for a coastal cetacean using aerial survey data. Mar. Mamm. Sci. 35, 1322–1346. doi: 10.1111/mms.12592
Buckland, S. T., Anderson, D. R., Burnham, K. P., and Laake, J. L. (1993). Distance sampling: estimating abundance of biological populations. London: Chapman and Hall.
Casari, M., and Tagliapietra, C. (2018). Group size in social-ecological systems. Proc. Natl. Acad. Sci. 115, 2728–2733. doi: 10.1073/pnas.1713496115
Chen, B., Xu, X., Jefferson, T. A., Olson, P. A., Qin, Q., Zhang, H., et al. (2016). Conservation status of the Indo-Pacific humpback dolphin (Sousa chinensis) in the northern Beibu Gulf, China. Adv. Mar. Biol. 73, 119–139. doi: 10.1016/bs.amb.2015.10.001
Chen, B., Zheng, D., Yang, G., Xu, X., and Zhou, K. (2009). Distribution and conservation of the Indo-Pacific humpback dolphin in China. Integr. Zool. 4, 240–247. doi: 10.1111/j.1749-4877.2009.00160.x
Chen, T., Hung, S., Qiu, Y., Jia, X., and Jefferson, T. A. (2010). Distribution, abundance, and individual movements of Indo-Pacific humpback dolphins (Sousa chinensis) in the Pearl River Estuary, China. Mammalia 74, 117–126.
Clement, M. J., Converse, S. J., and Royle, J. A. (2017). Accounting for imperfect detection of groups and individuals when estimating abundance. Ecol. Evol. 7, 7304–7310. doi: 10.1002/ece3.3284
Connor, R. C. (2000). “Group living in whales and dolphins,” in Cetacean Societies: Field Studies of Dolphins and Whales, eds J. Mann, R. C. Connor, P. L. Tyack, and H. Whitehead (Chicago: University of Chicago Press), 199–218.
Dawson, S., Wade, P., Slooten, E., and Barlow, J. (2008). Design and field methods for sighting surveys of cetaceans in coastal and riverine habitats. Mamm. Rev. 38, 19–49. doi: 10.1111/j.1365-2907.2008.00119.x
Doane, D. P., and Seward, L. E. (2011). Measuring skewness: a forgotten statistic? J. Stat. Educ. 19:2.
Dorning, J., and Harris, S. (2019). Quantifying group size in the red fox: impacts of definition, season and intrusion by non-residents. J. Zool. 308, 37–46. doi: 10.1111/jzo.12650
Erwin, R. M. (1982). Observer variability in estimating numbers: an experiment. J. Field Ornithol. 53, 159–167.
Fearnbach, H., Durban, J., Parsons, K., and Claridge, D. (2012). Photographic mark-recapture analysis of local dynamics within an open population of dolphins. Ecol. Applicat. 22, 1689–1700. doi: 10.1890/12-0021.1
Friday, N., Smith, T. D., Stevick, P. T., and Allen, J. (2000). Measurement of photographic quality and individual distinctiveness for the photographic identification of humpback whales, Megaptera novaeangliae. Mar. Mamm. Sci. 16, 355–374. doi: 10.1111/j.1748-7692.2000.tb00930.x
Gerrodette, T., and Perrin, C. (1991). Calibration of shipboard estimates of dolphin school size from aerial photographs. Southwest Fisheries Science Center, National Marine Fisheries Service. Administr. Rep. LJ 1991, 91–36.
Gerrodette, T., Perryman, W., and Barlow, J. (2002). Calibrating group size estimates of dolphins in the eastern tropical Pacific Ocean. Administr. Rep. LJ 2002, 02–08.
Gerrodette, T., Perryman, W. L., and Oedekoven, C. S. (2019). Accuracy and precision of dolphin group size estimates. Mar. Mamm. Sci. 35, 22–39. doi: 10.1111/mms.12506
Giles, A. B., Butcher, P. A., Colefax, A. P., Pagendam, D. E., Mayjor, M., and Kelaher, B. P. (2021). Responses of bottlenose dolphins (Tursiops spp.) to small drones. Aquat. Conserv. 31, 677–684. doi: 10.1002/aqc.3440
Gomez-Salazar, C., Trujillo, F., and Whitehead, H. (2012). Ecological factors influencing group sizes of river dolphins (Inia geoffrensis and Sotalia fluviatilis). Mar. Mamm. Sci. 28, E124–E142.
Gowans, S., Würsig, B., and Karczmarski, L. (2007). The social structure and strategies of delphinids: predictions based on an ecological framework. Adv. Mar. Biol. 53, 195–294. doi: 10.1016/s0065-2881(07)53003-8
Gygax, L. (2002b). Evolution of group size in the superfamily Delphinoidea (Delphinidae, Phocoenidae and Monodontidae): a quantitative comparative analysis. Mamm. Rev. 32, 295–314. doi: 10.1046/j.1365-2907.2002.00114.x
Gygax, L. (2002a). Evolution of group size in the dolphins and porpoises: interspecific consistency of intraspecific patterns. Behav. Ecol. 13, 583–590. doi: 10.1093/beheco/13.5.583
Hamilton, O. N., Kincaid, S. E., Constantine, R., Kozmian-Ledward, L., Walker, C. G., and Fewster, R. M. (2018). Accounting for uncertainty in duplicate identification and group size judgements in mark-recapture distance sampling. Methods Ecol. Evol. 9, 354–362. doi: 10.1111/2041-210x.12895
Hartman, K., van der Harst, P., and Vilela, R. (2020). Continuous focal group follows operated by a drone enable analysis of the relation between sociality and position in a group of male Risso’s dolphins (Grampus griseus). Front. Mar. Sci. 7:283. doi: 10.3389/fmars.2020.00283
Hupman, K., Stockin, K. A., Pollock, K., Pawley, M. D., Dwyer, S. L., Lea, C., et al. (2018). Challenges of implementing mark-recapture studies on poorly marked gregarious delphinids. PLoS One 13:e0198167. doi: 10.1371/journal.pone.0198167
Jefferson, T. A. (2000). Population biology of the Indo-Pacific hump-backed dolphin in Hong Kong waters. Wildlife Monogr. 2000, 1–65.
Jefferson, T. A., and Smith, B. D. (2016). Re-assessment of the conservation status of the Indo-Pacific humpback dolphin (Sousa chinensis) using the IUCN Red List Criteria. Adv. Mar. Biol. 73, 1–26. doi: 10.1016/bs.amb.2015.04.002
Jefferson, T. A., Smith, B. D., Braulik, G. T., and Perrin, W. (2017). Sousa chinensis (errata version published in 2018). The IUCN Red List of Threatened Species 2017: e.T82031425A123794774. Available online at: https://dx.doi.org/10.2305/IUCN.UK.2017-3.RLTS.T82031425A50372332.en (accessed date on 1 March 2021).
Kappeler, P. M., Clutton-Brock, T., Shultz, S., and Lukas, D. (2019). Social complexity: patterns, processes, and evolution. Behav. Ecol. Sociobiol. 73, 1–6.
Karczmarski, L. (1999). Group dynamics of humpback dolphins (Sousa chinensis) in the Algoa Bay region, South Africa. J. Zool. 249, 283–293. doi: 10.1111/j.1469-7998.1999.tb00765.x
Kinzey, D., Olson, P., and Gerrodette, T. (2000). Marine mammal data collection procedures on research ship line-transect surveys by the Southwest Fisheries Science Center. SWFSC Administr. Rep. LJ 2000, 00–08.
Koper, R. P., Karczmarski, L., du Preez, D., and Plön, S. (2016). Sixteen years later: Occurrence, group size, and habitat use of humpback dolphins (Sousa plumbea) in Algoa Bay, South Africa. Mar. Mamm. Sci. 32, 490–507. doi: 10.1111/mms.12279
Li, S., Lin, M., Xu, X., Xing, L., Zhang, P., Gozlan, R. E., et al. (2016). First record of the Indo-Pacific humpback dolphins (Sousa chinensis) southwest of Hainan Island, China. Mar. Biodiv. Rec. 9:3. doi: 10.1186/s41200-016-0005-x
Liu, M., Bejder, L., Lin, M., Zhang, P., Dong, L., and Li, S. (2020a). Determining spatial use of the world’s second largest humpback dolphin population: Implications for place-based conservation and management. Aquat. Conserv. 30, 364–374. doi: 10.1002/aqc.3253
Liu, M., Lin, M., Dong, L., Xue, T., Zhang, P., Tang, X., et al. (2020b). Group sizes of Indo-Pacific humpback dolphins in waters Southwest of Hainan Island, China: Insights into rare records of large groups. Aquat. Mamm. 46, 259–266. doi: 10.1578/AM.46.3.2020.259
Liu, M., Lin, M., Dong, L., Zhang, P., and Li, S. (2021a). Spatiotemporal variations in fine-scale habitat use of the world’s second largest population of humpback dolphins. J. Mamm. 102, 384–395. doi: 10.1093/jmammal/gyab001
Liu, M., Lin, M., Lusseau, D., and Li, S. (2021b). Intra-Population variability in group size of Indo-Pacific humpback dolphins (Sousa chinensis). Front. Mar. Sci. 8:671568. doi: 10.3389/fmars.2021.671568
Liu, M., Lin, M., Lusseau, D., and Li, S. (2021c). The biogeography of group sizes in humpback dolphins (Sousa spp.). Integr. Zool. 16, 527–537. doi: 10.1111/1749-4877.12542
López, B. D., Grandcourt, E., Methion, S., Das, H., Bugla, I., Al Hameli, M., et al. (2018). The distribution, abundance and group dynamics of Indian Ocean humpback dolphins (Sousa plumbea) in the Emirate of Abu Dhabi (UAE). J. Mar. Biol. Assoc. U K 98, 1119–1127. doi: 10.1017/S0025315417001205
Mann, J. (1999). Behavioral sampling methods for cetaceans: a review and critique. Mar. Mamm. Sci. 15, 102–122. doi: 10.1111/j.1748-7692.1999.tb00784.x
Marsh, H., and Sinclair, D. F. (1989). Correcting for visibility bias in strip transect aerial surveys of aquatic fauna. J. Wildlife Manag. 1989, 1017–1024.
Meropi, P., Bikos, C., and George, Z. (2018). Outlier detection in skewed data. Simulat. Model. Pract. Theory 87, 191–209. doi: 10.1016/j.simpat.2018.05.010
Methion, S., and López, B. D. (2018). Abundance and demographic parameters of bottlenose dolphins in a highly affected coastal ecosystem. Mar. Freshw. Res. 69, 1355–1364. doi: 10.1071/MF17346
Moura, J. F., Pivari, D., and Pagliani, B. (2019). Environmental factors related to group size and habitat use of Guiana dolphins from São Marcos Bay, Amazon Coast. Trop. Ecol. 60, 426–432. doi: 10.1007/s42965-019-00041-0
Parrish, J. K., and Edelstein-Keshet, L. (1999). Complexity, pattern, and evolutionary trade-offs in animal aggregation. Science 284, 99–101. doi: 10.1126/science.284.5411.99
Parsons, E. (2004). The behavior and ecology of the Indo-Pacific humpback dolphin (Sousa chinensis). Aquat. Mamm. 30, 38–55. doi: 10.1578/AM.30.1.2004.38
Pawley, M. D. M., Hupman, K. E., Stockin, K. A., and Gilman, A. (2018). Examining the viability of dorsal fin pigmentation for individual identification of poorly-marked delphinids. Sci. Rep. 8, 1–12. doi: 10.1038/s41598-018-30842-7
Peña, J., and Nöldeke, G. (2018). Group size effects in social evolution. J. Theor. Biol. 457, 211–220. doi: 10.1016/j.jtbi.2018.08.004
Peng, C., Wu, H., Wang, X., Zhu, Q., Jefferson, T. A., Wang, C. C., et al. (2020). Abundance and residency dynamics of the Indo-Pacific humpback dolphin, Sousa chinensis, in the Dafengjiang River Estuary, China. Mar. Mamm. Sci. 36, 623–637. doi: 10.1111/mms.12663
R Development Core Team (2021). R: A Language and Environment for Statistical Computing. Vienna: R Foundation for Statistical Computing. Available online at: http://www.R-project.org/
Scott, M. D., Perryman, W. L., and Clark, W. G. (1985). The use of aerial photographs for estimating school sizes of cetaceans. Inter-Am. Trop. Tuna Comm. Bull. 18, 381–419.
Stevick, P. T., Palsbøll, P. J., Smith, T. D., Bravington, M. V., and Hammond, P. S. (2001). Errors in identification using natural markings: rates, sources, and effects on capture recapture estimates of abundance. Can. J. Fish. Aquat. Sci. 58, 1861–1870. doi: 10.1139/f01-131
Tang, X., Lin, W., Karczmarski, L., Lin, M., Chan, S. C., Liu, M., et al. (2021). Photo-identification comparison of four Indo-Pacific humpback dolphin populations off southeast China. Integr. Zool. 16, 586–593. doi: 10.1111/1749-4877.12537
Tyne, J. A., Pollock, K. H., Johnston, D. W., and Bejder, L. (2014). Abundance and survival rates of the Hawai’i Island associated spinner dolphin (Stenella longirostris) stock. PLoS One 9:E86132. doi: 10.1371/journal.pone.0086132
Urian, K., Gorgone, A., Read, A., Balmer, B., Wells, R. S., Berggren, P., et al. (2015). Recommendations for photo-identification methods used in capture-recapture models with cetaceans. Mar. Mamm. Sci. 31, 298–321. doi: 10.1111/mms.12141
Van Parijs, S. M., Smith, J., and Corkeron, P. J. (2002). Using calls to estimate the abundance of inshore dolphins: a case study with Pacific humpback dolphins Sousa chinensis. J. Appl. Ecol. 39, 853–864. doi: 10.1046/j.1365-2664.2002.00756.x
Vargas-Fonseca, O. A., Kirkman, S. P., Conry, D., Rishworth, G. M., Cockcroft, V., and Pistorius, P. A. (2018). Distribution and habitat use of Indo-Pacific bottlenose dolphins Tursiops aduncus along the south coast of South Africa. Afr. J. Mar. Sci. 40, 439–450. doi: 10.2989/1814232X.2018.1547221
Walsh, D. P., Page, C. F., Campa, H. E. III, Winterstein, S. R., and Beyer, D. E. Jr. (2009). Incorporating estimates of group size in sightability models for wildlife. J. Wildlife Manag. 73, 136–143. doi: 10.2193/2008-054
Wang, K., Wang, D., Akamatsu, T., Li, S., and Xiao, J. (2005). A passive acoustic monitoring method applied to observation and group size estimation of finless porpoises. J. Acoust. Soc. Am. 118, 1180–1185. doi: 10.1121/1.1945487
Wang, X., Wu, F., Turvey, S. T., Rosso, M., Tao, C., Ding, X., et al. (2015). Social organization and distribution patterns inform conservation management of a threatened Indo-Pacific humpback dolphin population. J. Mamm. 96, 964–971. doi: 10.1093/jmammal/gyv097
Wang, X., Wu, F., Turvey, S. T., Rosso, M., and Zhu, Q. (2016). Seasonal group characteristics and occurrence patterns of Indo-Pacific humpback dolphins (Sousa chinensis) in Xiamen Bay, Fujian Province, China. J. Mamm. 97, 1026–1032. doi: 10.1093/jmammal/gyw002
Wang, Z., Fang, L., Shi, W., Wang, K., and Wang, D. (2013). Whistle characteristics of free-ranging Indo-Pacific humpback dolphins (Sousa chinensis) in Sanniang Bay, China. J. Acoust. Soc. Am. 133, 2479–2489. doi: 10.1121/1.4794390
Wickman, L., Rayment, W., Slooten, E., and Dawson, S. M. (2021). Recommendations for estimating mark rate of cetaceans in photo-ID research: A critique of field sampling protocols and variance estimation. Mar. Mamm. Sci. 37, 328–343. doi: 10.1111/mms.12723
Williams, J. A., Dawson, S. M., and Slooten, E. (1993). The abundance and distribution of bottlenose dolphins (Tursiops truncatus) in Doubtful Sound, New Zealand. Can. J. Zool. 71, 2080–2088. doi: 10.1139/z93-293
Wu, H., Jefferson, T. A., Peng, C., Liao, Y., Huang, H., Lin, M., et al. (2017). Distribution and habitat characteristics of the Indo-Pacific humpback dolphin (Sousa chinensis) in the northern Beibu Gulf. China. Aquat. Mamm. 43:219. doi: 10.1578/AM.43.2.2017.219
Würsig, B., Parsons, E. C. M., Piwetz, S., and Porter, L. (2016). The behavioural ecology of Indo-Pacific humpback dolphins in Hong Kong. Adv. Mar. Biol. 73, 65–90. doi: 10.1016/bs.amb.2015.08.008
Würsig, B., and Würsig, M. (1977). The photographic determination of group size, composition, and stability of coastal porpoises (Tursiops truncatus). Science 198, 755–756. doi: 10.1126/science.198.4318.755
Xu, X., Song, J., Zhang, Z., Li, P., Yang, G., and Zhou, K. (2015). The world’s second largest population of humpback dolphins in the waters of Zhanjiang deserves the highest conservation priority. Sci. Rep. 5:8147. doi: 10.1038/srep08147
Xu, X., Zhang, Z., Ma, L., Li, P., Yang, G., and Zhou, K. (2012). Site fidelity and association patterns of Indo-Pacific humpback dolphins off the east coast of Zhanjiang, China. Acta Theriol. 57, 99–109. doi: 10.1007/s13364-011-0058-5
Zanardo, N., Parra, G. J., and Möller, L. M. (2016). Site fidelity, residency, and abundance of bottlenose dolphins (Tursiops sp.) in Adelaide’s coastal waters, South Australia. Mar. Mamm. Sci. 32, 1381–1401. doi: 10.1111/mms.12335
Keywords: humpback dolphins, group size, observer-based counts, photo-identification, methodology, biogeography
Citation: Liu M, Lin M, Tang X, Dong L, Zhang P, Lusseau D and Li S (2021) Group Size of Indo-Pacific Humpback Dolphins (Sousa chinensis): An Examination of Methodological and Biogeographical Variances. Front. Mar. Sci. 8:655595. doi: 10.3389/fmars.2021.655595
Received: 19 January 2021; Accepted: 24 August 2021;
Published: 17 September 2021.
Edited by:
Mourier Johann, Institut de Recherche Pour le Développement (IRD), FranceReviewed by:
Fábio Daura-Jorge, Federal University of Santa Catarina, BrazilBruno Díaz López, Bottlenose Dolphin Research Institute (BDRI), Spain
Copyright © 2021 Liu, Lin, Tang, Dong, Zhang, Lusseau and Li. This is an open-access article distributed under the terms of the Creative Commons Attribution License (CC BY). The use, distribution or reproduction in other forums is permitted, provided the original author(s) and the copyright owner(s) are credited and that the original publication in this journal is cited, in accordance with accepted academic practice. No use, distribution or reproduction is permitted which does not comply with these terms.
*Correspondence: Songhai Li, bGlzaEBpZHNzZS5hYy5jbg==
†ORCID: Mingming Liu, orcid.org/0000-0003-3802-1002; Mingli Lin, orcid.org/0000-0002-9182-0519; Lijun Dong, orcid.org/0000-0003-4303-5513; Peijun Zhang, orcid.org/0000-0002-7047-7133; David Lusseau, orcid.org/0000-0003-1245-3747; Songhai Li, orcid.org/0000-0003-4977-1722