 Lola M. Paradinas
 Neil A. James
 Brian Quinn3
 Andrew Dale
 Bhavani E. Narayanaswamy
- 1Scottish Marine Institute, Scottish Association for Marine Science (SAMS), Oban, United Kingdom
- 2Environmental Research Institute (ERI), North Highland College, University of the Highlands and Islands, Thurso, United Kingdom
- 3Aquaculture Health Laboratory, School of Health and Life Sciences, University of the West of Scotland, Paisley, United Kingdom
Microplastics (plastic particles ≤ 5 mm) have been studied extensively in coastal areas around the world in several habitats. Nevertheless, understanding and explaining the temporal and spatial occurrence and dynamics of microplastics is challenging. For the first time, three environmental variables were studied at six locations at the same time for each season over a year, along the North and West coasts of Scotland. Surface water was collected with a pole water sampler from the shore whilst beach sediment was sampled using glass jars, and mussels were the target organism collected. Concentrations of microplastics ranged from 0 to 6 ± 1.50 particles per l of surface water. In beach sediment, microplastics concentrations ranged from 0 to 0.37 ± 0.12 particles per g.dw, whilst for mussels it ranged from 0 to 23.81 particles per g.ww. This study was designed to determine the presence of microplastics as well as extend the temporal and geographical scales. We developed a simple, cost-effective and practical tool-kit to collect microplastics from the coastal environment and engaged the public in scientific research. The tool-kit was designed to take into account the latest recommendations for sampling each environmental substrate, whilst being practical for citizen scientists to use. This research demonstrates that using a semi-structured to structured project with a defined sampling approach including the participation of the public with local knowledge can be an effective way to monitor microplastics in the marine environment along the Scottish coastline. This approach, can be adapted to other projects monitoring microplastics to increase the use of citizen science in projects, allowing more studies to take place, more samples to be collected, and a greater understanding of the occurrence and the potential impact of microplastics in the environment.
Introduction
Plastics have become a worldwide pollutant with an estimated 19–23 million metric tons entering aquatic ecosystems globally each year (Borrelle et al., 2020). Plastics currently constitute ∼80% of the total litter found in the marine environment (Moore et al., 2002; Galgani et al., 2015). Borrelle et al. (2020) predicted an annual plastic emission of up to 53 million metric tons in 2030, based on the current decisions and waste strategies decided by governments. Due to the plastic presence observed from terrestrial (Zhu et al., 2019; Kumar et al., 2020; Sarker et al., 2020; Schell et al., 2020) to freshwater environments (Lassen et al., 2015; Kanhai et al., 2017; Li et al., 2020; Szymanska and Obolewski, 2020) as well as in a number of marine habitats including the deep sea to surface waters (Lusher et al., 2014; Thompson, 2015; Courtene-Jones et al., 2017; Jamieson et al., 2019); geologists have proposed the use of plastics as a marker for the Anthropocene era (Waters et al., 2016).
Frias and Nash (2019) have given a general definition for microplastics that are “any synthetic solid particle or polymeric matrix, with a regular or irregular shape and with a size ranging from 1 μm to 5 mm.” Microplastics can be classified as either primary or secondary plastics (Frias and Nash, 2019), with primary microplastics being intentionally-manufactured small pieces, whilst secondary microplastics are the result of fragmentation of larger pieces (Thompson and Napper, 2018). These particles continue to degrade over time due to physical, biological and chemical processes (Frias and Nash, 2019) and consequently, they may become available for ingestion to an increasingly wide range of marine organisms, which could result in physical/physiological disturbances (Auta et al., 2017; Avio et al., 2017). Microplastics vary in type, shape, color and chemical composition (Frias and Nash, 2019; Rochman et al., 2019).
Meijer et al. (2019) have estimated that 1,000 rivers are responsible for 80% of global annual emissions of plastics to the marine environment, ranging from 0.8 to 2.7 million metric tons per year. Thus the coastal zone is a clear interface between land (representing the main sources of plastic debris input) (Jambeck et al., 2015) and the oceans, where the majority of microplastics mix prior to dispersing to other habitats such as the deep sea (Courtene-Jones et al., 2017; Jamieson et al., 2019), sea ice (Kanhai et al., 2020; Kelly et al., 2020), the open ocean (Desforges et al., 2014; Gago et al., 2016; Frére, 2017), coastal areas (Blumenröder et al., 2017; Graca et al., 2017; Yu et al., 2018) or interacting with marine organisms (Cole, 2014; Rezania et al., 2018). Microplastics in sediments, water and fauna have been extensively studied globally over the past few years, and appear prevalent in these systems (Rezania et al., 2018). Increasing knowledge of the occurrence and dynamics of microplastics in the intertidal area is a key challenge that needs to be addressed by developing monitoring programs at a national scale (Zhang, 2017). It is essential to examine the fluctuating composition of plastic particles by specifically looking at temporal variations in several environmental variables (e.g., fauna, sediment, and water).
Citizen science is a powerful tool involving and engaging the public with scientists in research projects to help monitor environmental markers (Cohn, 2008; Wiggins and Crowston, 2011). The word “citizen” is used as part of “citizen science” meaning a member of the wider community (Eitzel et al., 2017). Welvaert and Caley (2016) explained that “citizen science” is generally, and commonly, understood to mean “the public participation in scientific research.” Citizen science based studies grew exponentially over the past few years contributing to several publications (McKinley et al., 2017). To allow projects to develop robust monitoring and be comparable, Kelling et al. (2019) suggested a studies’ classification based on clear and simple elements: structured, semi-structured and unstructured. All three groups have their advantages, however, a semi-structured project is considered to be a good mix between a flexible and attractive method for the public with a recorded observation process, clear scientific objectives as well as rigorous and well-defined data collection. This therefore allows for effective and valuable monitoring of microplastics along the coastline (Kelling et al., 2019).
Zettler et al. (2017), described citizen science as a resource to increase spatial coverage, enhance sample size, create big datasets, raise awareness and limit financial costs. Some initiatives have proven to be successful, e.g., International Pellet Watch (Zettler et al., 2017) engaging hundreds to thousands of volunteers in scientific studies. The inclusion of citizen science in research projects is undoubtedly facilitating the collection and analysis of a high quantity of samples, as well as enhancing the spatial and temporal breadth of areas studied (Hoellein et al., 2015; Jambeck and Johnsen, 2015; Zettler et al., 2017). Other projects focussing on plastic marine debris have also recommended using citizen science for monitoring and collection of data (Syakti et al., 2017). Trained volunteers and professional scientists’ data collection are comparable in terms of size composition of plastic debris and time efficiency of collection (Van der Velde et al., 2017). Nevertheless, concerns regarding the involvement of volunteers for microplastic studies include the quality control of data. However, the creation of simple, reliable and reproducible protocols should result in little sample contamination by the volunteer scientists (Hidalgo-Ruz and Thiel, 2013; Van der Velde et al., 2017; Barrows et al., 2018; Forrest et al., 2019). Forrest et al. (2019) demonstrated that citizen science provides numerous advantages including producing reliable results when studying microplastics in water samples, even if challenges were encountered such as choice of sampling point by volunteers, field blanks missing and limitation of the water volume collected. Bosker et al. (2017) also pointed out the powerful use of citizen scientists in the collection of microplastics data from beach sediment at a global scale by covering 42 beaches including sites in Europe through to the East coast of America. Lots et al. (2017), confirmed the benefit of collecting sediment samples at a European scale using volunteers by designing simple collection methods to investigate microplastic pollution.
Beach sediment has been collected to investigate the presence of microplastics in a plethora of studies, using a range of methods from direct sampling with forceps, volume-reduced sampling by sieving or using bulk sampling (Prata et al., 2019). Bulk samples seemed to include the broadest size range for microplastics compared to sieving (Brander et al., 2020). Blumenröder et al. (2017) suggested that the mechanical action of sieving would create artificially more microplastics leading to an inflation in the number recorded. Sieving would also potentially increase the risk of contamination from the personnel or the environment. It is also recommended to collect the top 5cm of beach sediment using five replicate samples where microplastics seemed to be more abundant (Brander et al., 2020). Marine surface waters collection could be achieved by reduction in situ using nets (i.e., neuston or manta), sieves or pumps. Those techniques would allow for large volumes of water to be analyzed thus, outputs should be more representative of the environment being sampled (Prata et al., 2019). However, these techniques require considerable means to deploy the equipment, i.e., a boat, or the need to transport pumps to several sites across hundreds of km, which is not practical for citizen science project. This is therefore perhaps not the best method to be employing when citizen scientists are involved. Nets can also clog easily causing a loss of particles collected (Prata et al., 2019). Alternative techniques such as the use of bulk samples (i.e., bottle and bucket) are preferred with regards to the feasibility of sampling by citizen scientists especially where large distances need to be covered as well as for reducing contamination (Prata et al., 2019). Although small volumes may not be accurate in representing the concentrations observed in the environment, Prata et al. (2020) indicated that low volumes allowed for the geographical and temporal range of a study to be greatly extended.
The current published marine plastic studies have only used citizen scientists to collect macroplastics or microplastics from a single environmental variable through different time scales, e.g., sediment (Hidalgo-Ruz and Thiel, 2013; Bosker et al., 2017; Lots et al., 2017; Nelms et al., 2017; Ambrose et al., 2019; Doyen et al., 2019; Carbery et al., 2020; Nel et al., 2020), water (Barrows et al., 2018; Forrest et al., 2019; Sanders and Brandes, 2020), or biota (Liboiron et al., 2016). Moreover, Blumenröder et al. (2017) highlighted that a lack of protocol standardization, combined with reduced numbers of quantitative spatial and temporal studies are an limitation for the study of microplastics in the environment. Marine Strategy Framework Directive (2013) provided recommendations described protocols to allow monitoring of marine litter and microlitter, in European seas. There is a requirement to develop and apply standardized methods to establish national microplastic database in European Member States (Marine Strategy Framework Directive, 2013).
This study presents a methodological approach that is both simple yet standardized based on the recommendations for the collection of microplastics in coastal seawater, intertidal sediment and wild blue mussels (Mytilus edulis). Sampling has been undertaken in different locations over a distance of ∼400 km at the same point in time, over a 12 months period to take into account seasonal variation. To enable this, citizen scientists followed the same protocols as the lead author for the collection the environmental samples to determine the concentration of microplastics in these three matrices and to contribute to the creation of a reliable database. Thus, interacting with volunteers, enabled a broader geographical region to be covered and allowed the sampling campaign to be repeated through time to include a temporal scale as recommended by Brander et al. (2020). This paper demonstrates the potential use of citizen science as a method to generate standardized data on the concentrations and temporal variation of microplastics found in three environmental matrices (water, sediment, and biota) along the North and West coasts of Scotland.
Materials and Methods
Study Area
Scotland has ∼18,000 km of coastline on the mainland alone with some areas inaccessible or not easily reached due to lack of infrastructure. To assess microplastics contamination along the West and North coasts of Scotland (Figure 1), samples were collected from six contrasting sites based on several parameters, hydrodynamic activity (i.e., annual mean wave power, annual mean significant wave height, wave exposure index), anthropogenic activity (i.e., population number and density) and the tidal range (i.e., mean spring tidal range) that defined the sites (Table 1). The general description of the sampling sites was based on the Marine Scotland, 2021 Maps National Marine Plan Interactive (NMPI) (Marine Scotland (2021) Maps NMPI part of Scotland’s environment).
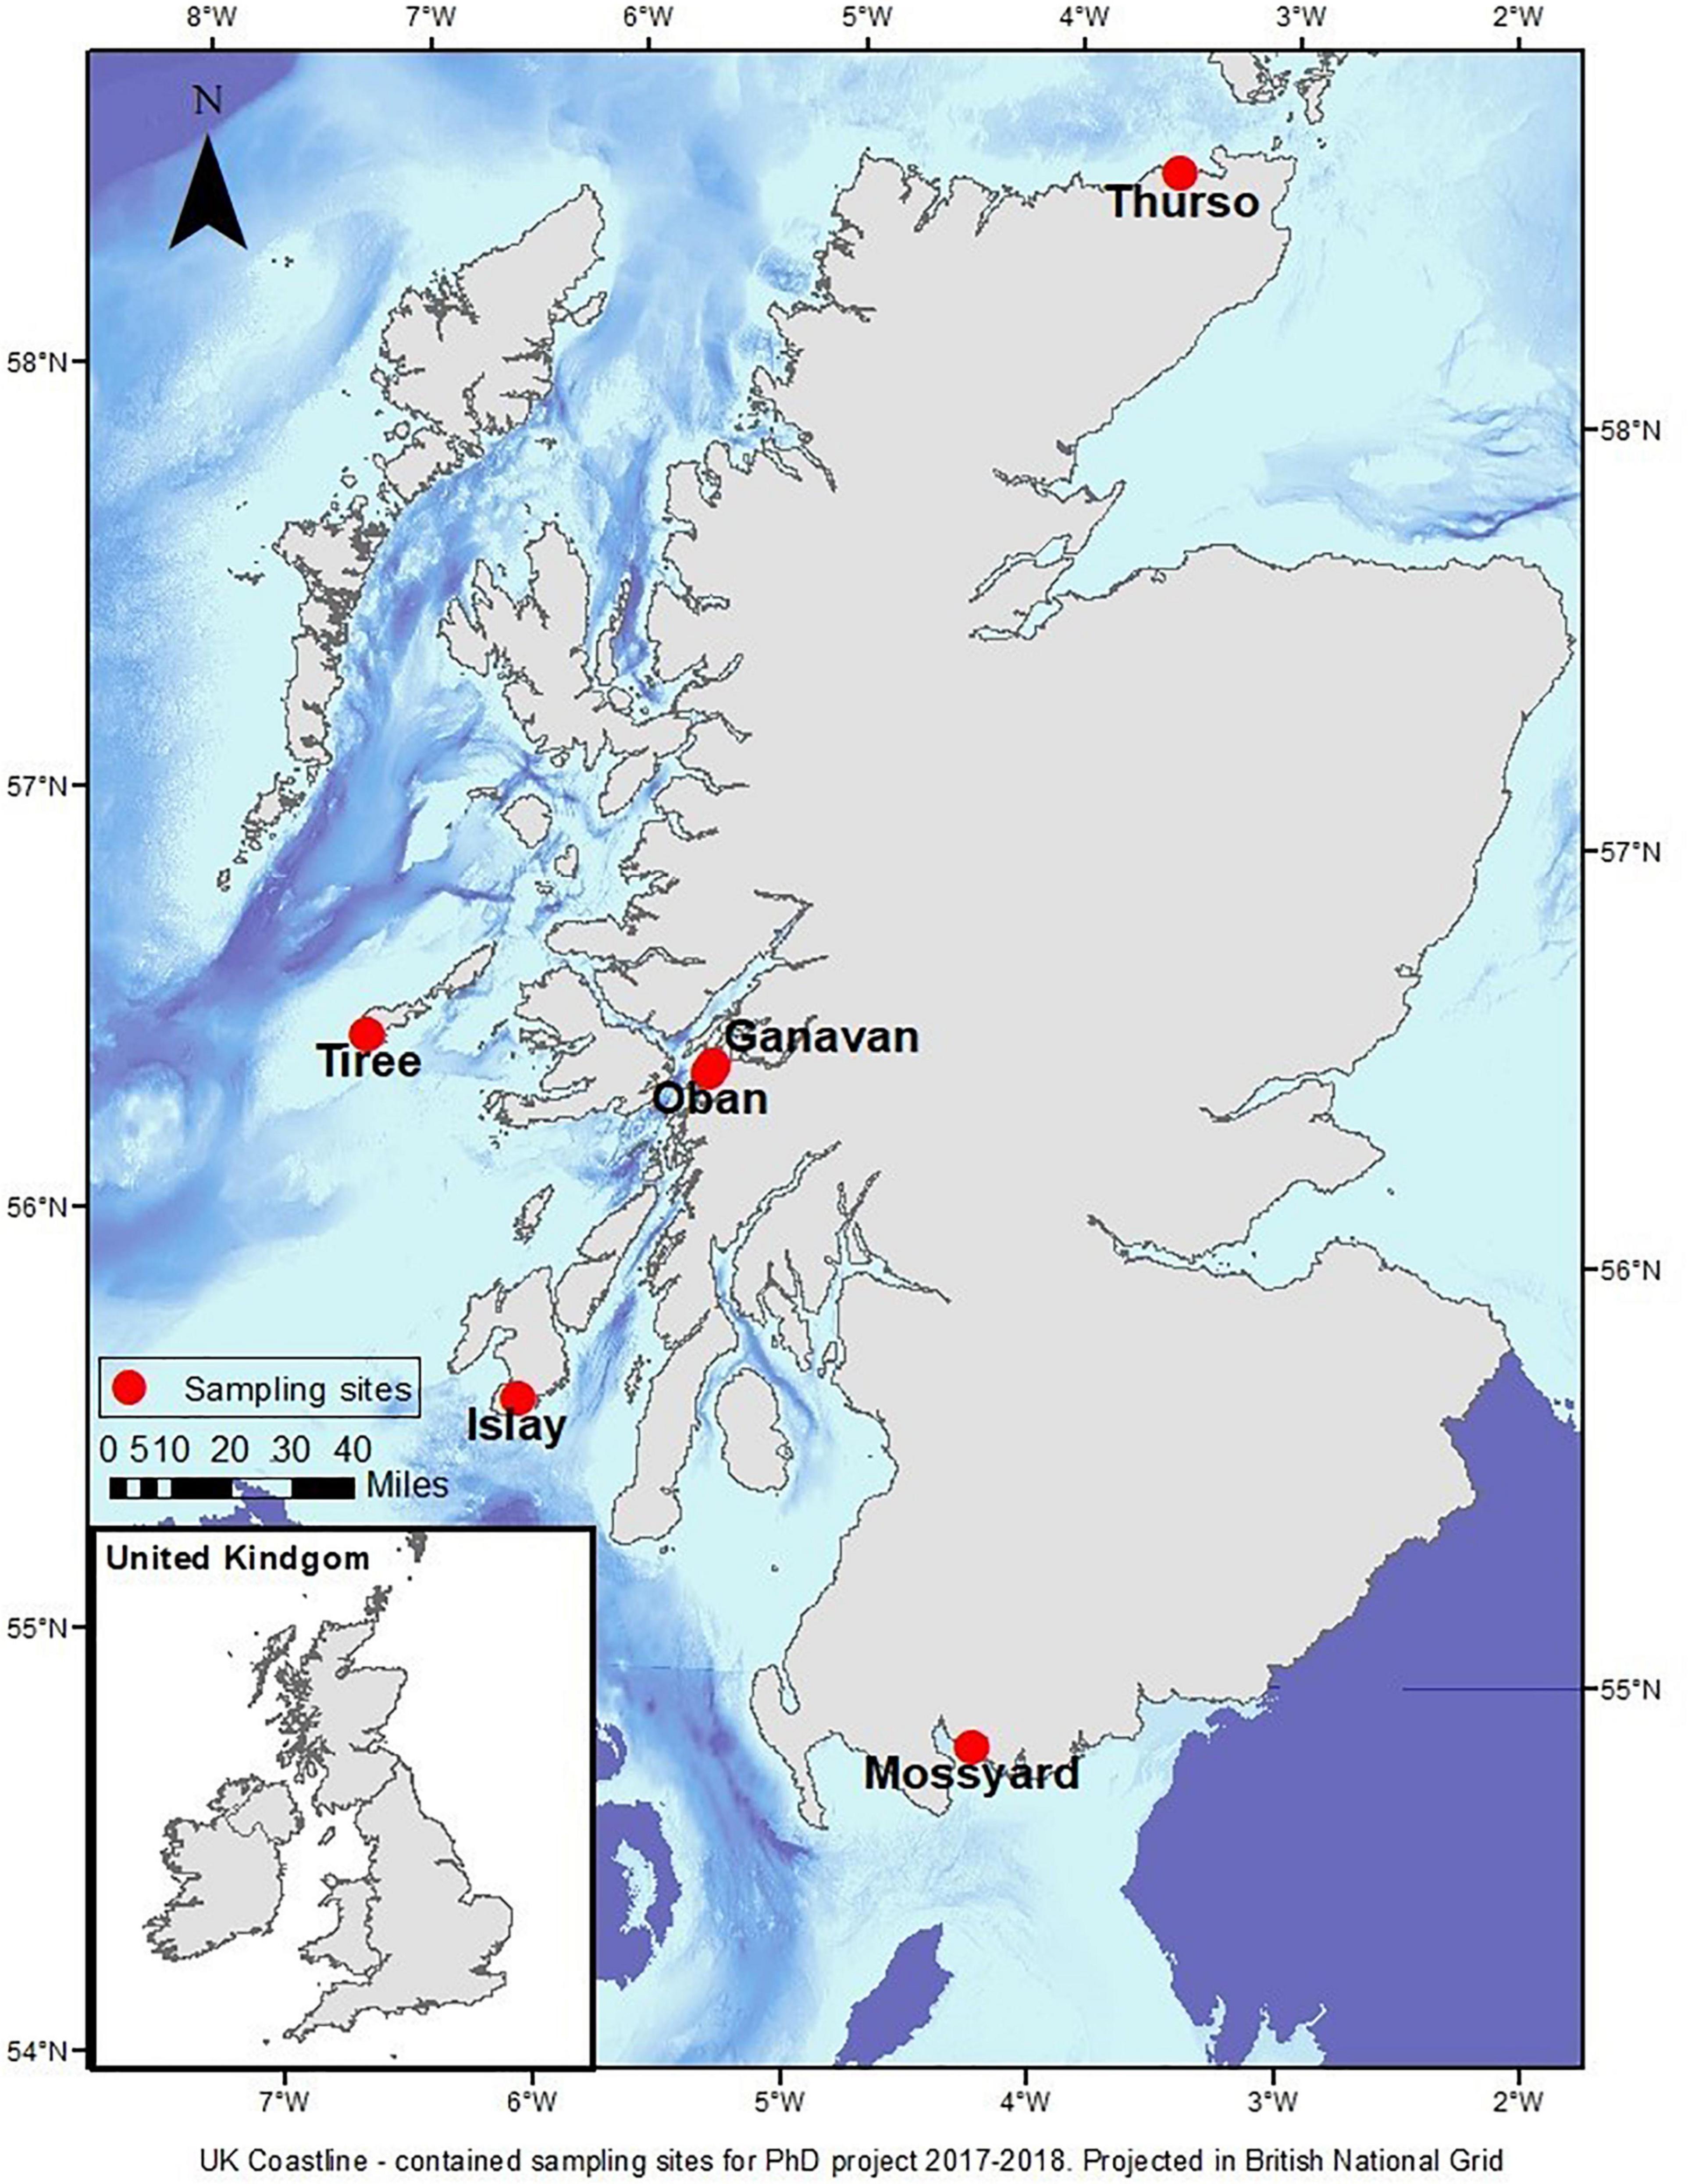
Figure 1. The six sampling sites around the West and North coasts of Scotland.

Table 1. Coordinates and general description of sampling locations based on the three main parameters of interest.
Citizen Science
To be able to cover this large region, citizen scientists were recruited based on their educational background, science knowledge, interest in the topic and field/monitoring experiences, through professional contacts via emails, combined with the Natural Environment Research Council (NERC) funded Capturing Our Coast (2016) [CoCoast; (Capturing Our Coast (2016): An innovation in marine citizen science)] citizen science project. The team of citizen scientists ranged from postgraduate students at UHI partner institutes, Islay Natural History Trust volunteers and those who had been directly involved in the CoCoast programme (10 participants in total).
The initial exchange with volunteers introduced them to the topic, type of locations needed and why additional help was required. Volunteers based at Thurso, Islay and Mossyard (Figure 1) were asked to identify suitable sampling locations, which combined selection criteria such as accessibility of the site, sandy beaches with rocks present, the presence of blue mussels, closeness to the volunteers’ home’s for safety reasons and transport time of samples. Volunteers’ local knowledge was invaluable in aiding site selection. Prior to any sampling being undertaken, the citizen scientists took site photographs, recorded GPS location data, provided detailed descriptions of proposed locations, along with information on the selection criteria. Sites were deemed acceptable once the research team and volunteers were happy that the locations fulfilled the requirements for the science to be valid. Simple protocols were designed and initially field tested by the research team. Non-scientific personnel were drafted in to review the protocol in the field so that issues could be addressed prior to sampling kits being posted to the volunteers. Additional information was also provided including sampling schemes, pictures and a video explaining the methodology, what clothing they should/should not wear (i.e., wellington boots, waterproof jacket and natural fabrics as much as possible to prevent contamination) as well as a reminder to work in pairs to meet health and safety protocols. Volunteers were required to read and accept SAMS’ risk assessment prior to any fieldwork commencing. Before each sampling event, a video-conference/telephone-call was organized between the lead author and each of the volunteers allowing for any questions/queries to be addressed. The lead author was also reachable by telephone during each sampling campaign in case any problems were encountered by the volunteers.
Sampling Kit
Sampling kits were designed to be simple tool-kits, easily used by all volunteers. The tool-kit consisted of a pole-water sampler, glass jars (15 of 7 ml), plastic bottles (5 of 500 ml), sealable plastic bags, filter paper already placed in Petri dishes, aluminum foil, deionised water (1l), electrical tape, water-resistant pencil, ice blocks (3) and a cool box (Figure 2). The water-sampler, bottles, bags and jars were rinsed and cleaned with deionised water and 70% ethanol prior to being sealed. The filter papers and Petri dishes were examined using a stereomicroscope 37.5× magnification prior to sealing with electrical tape to ensure no contamination. Bottles, bags and jars were partially labeled to facilitate the work in the field by the volunteers. All materials were stored in an insulated cool-box immediately after collection and during transport of samples to the laboratory, which allowed safe transportation of materials. The cool-box provided thermal insulation for the samples, resulting in slower development of organic matter, as well as a convenient way to transfer materials to and from the site. The volunteers were asked to take a knife (Swiss army type knife) prior to going into the field, to be able to remove the mussels from their substrate.
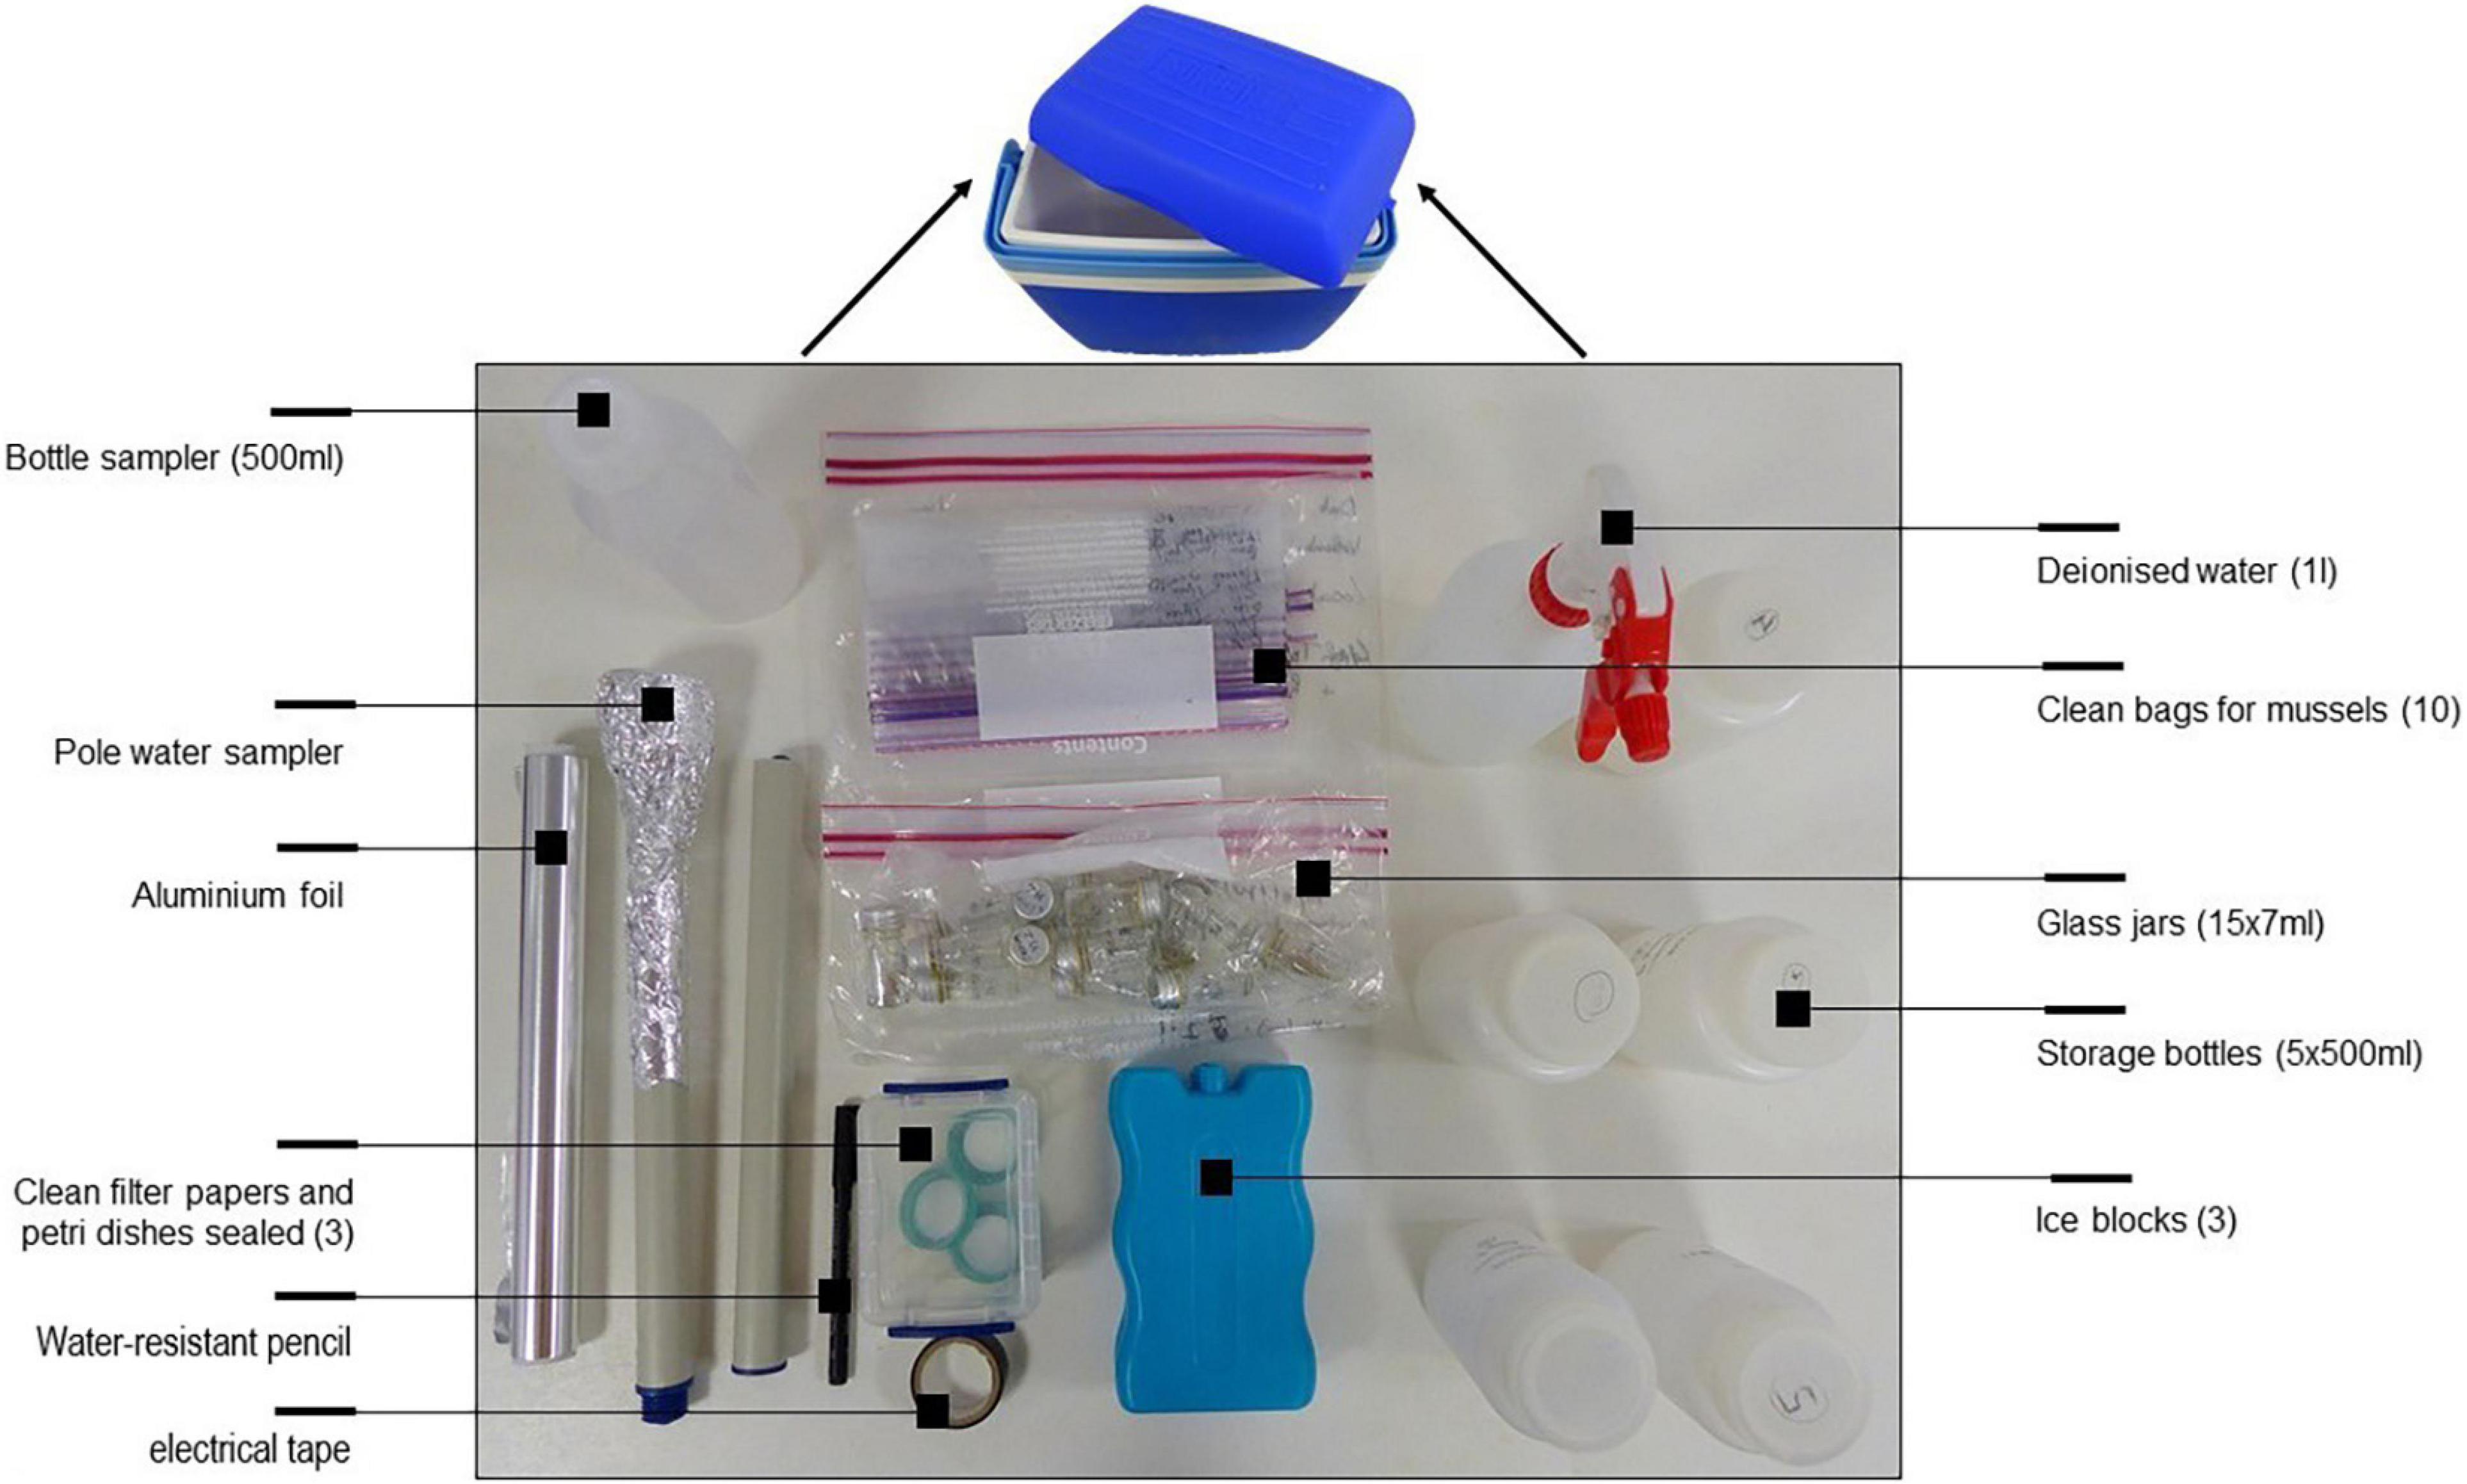
Figure 2. Sampling tool-kit compiled before sending the cool-box to citizen scientists.
Sampling Collection
At all six locations, intertidal sediment (i.e., sand), coastal water and benthic organisms (i.e., M. edulis) were collected four times during the year (every 13 weeks) i.e., April 2018, July 2018, October 2018, and January 2019, to investigate seasonal variability in microplastic abundances, polymer types and shapes. All the sites were sampled at the same time (e.g., over the same weekend) to avoid large weather and tidal disparities between locations.
Intertidal Sediment
The most recent high tide line was the focus of this study, to look at actual microplastic deposition rather than accumulation over time as suggested by Hidalgo-Ruz et al. (2012). Avoiding the springtide lines would allow the samples to be more representative of the actual microplastic accumulation (Blumenröder et al., 2017). The aim was to investigate the effect of the tide, hydrodynamic and anthropogenic activities on microplastic deposition on sandy beaches.
Three sampling points were randomly chosen using the website Random.org True Random Number Service (1998) and in this instance the points were 8, 12, and 21 m (Figure 3),taking into account the length of the six beaches, to allow a coverage of the microplastic variability in beach sediment. The top 5 cm of beach sediment was collected from five replicates at each sampling point using a 7 ml metal-capped bijou glass jar (Figure 4) as recommended by Brander et al. (2020). The five replicates were collected perpendicular to the wet high tide mark. A small petri dish with dampened filter paper (Whatman grade 1, 30 mm diameter) was left open next to the sampling point during the process to assess for any air contamination (Figure 4). A total of 15 samples were collected per location and per season. The collection method was adapted from Blumenröder et al. (2017).
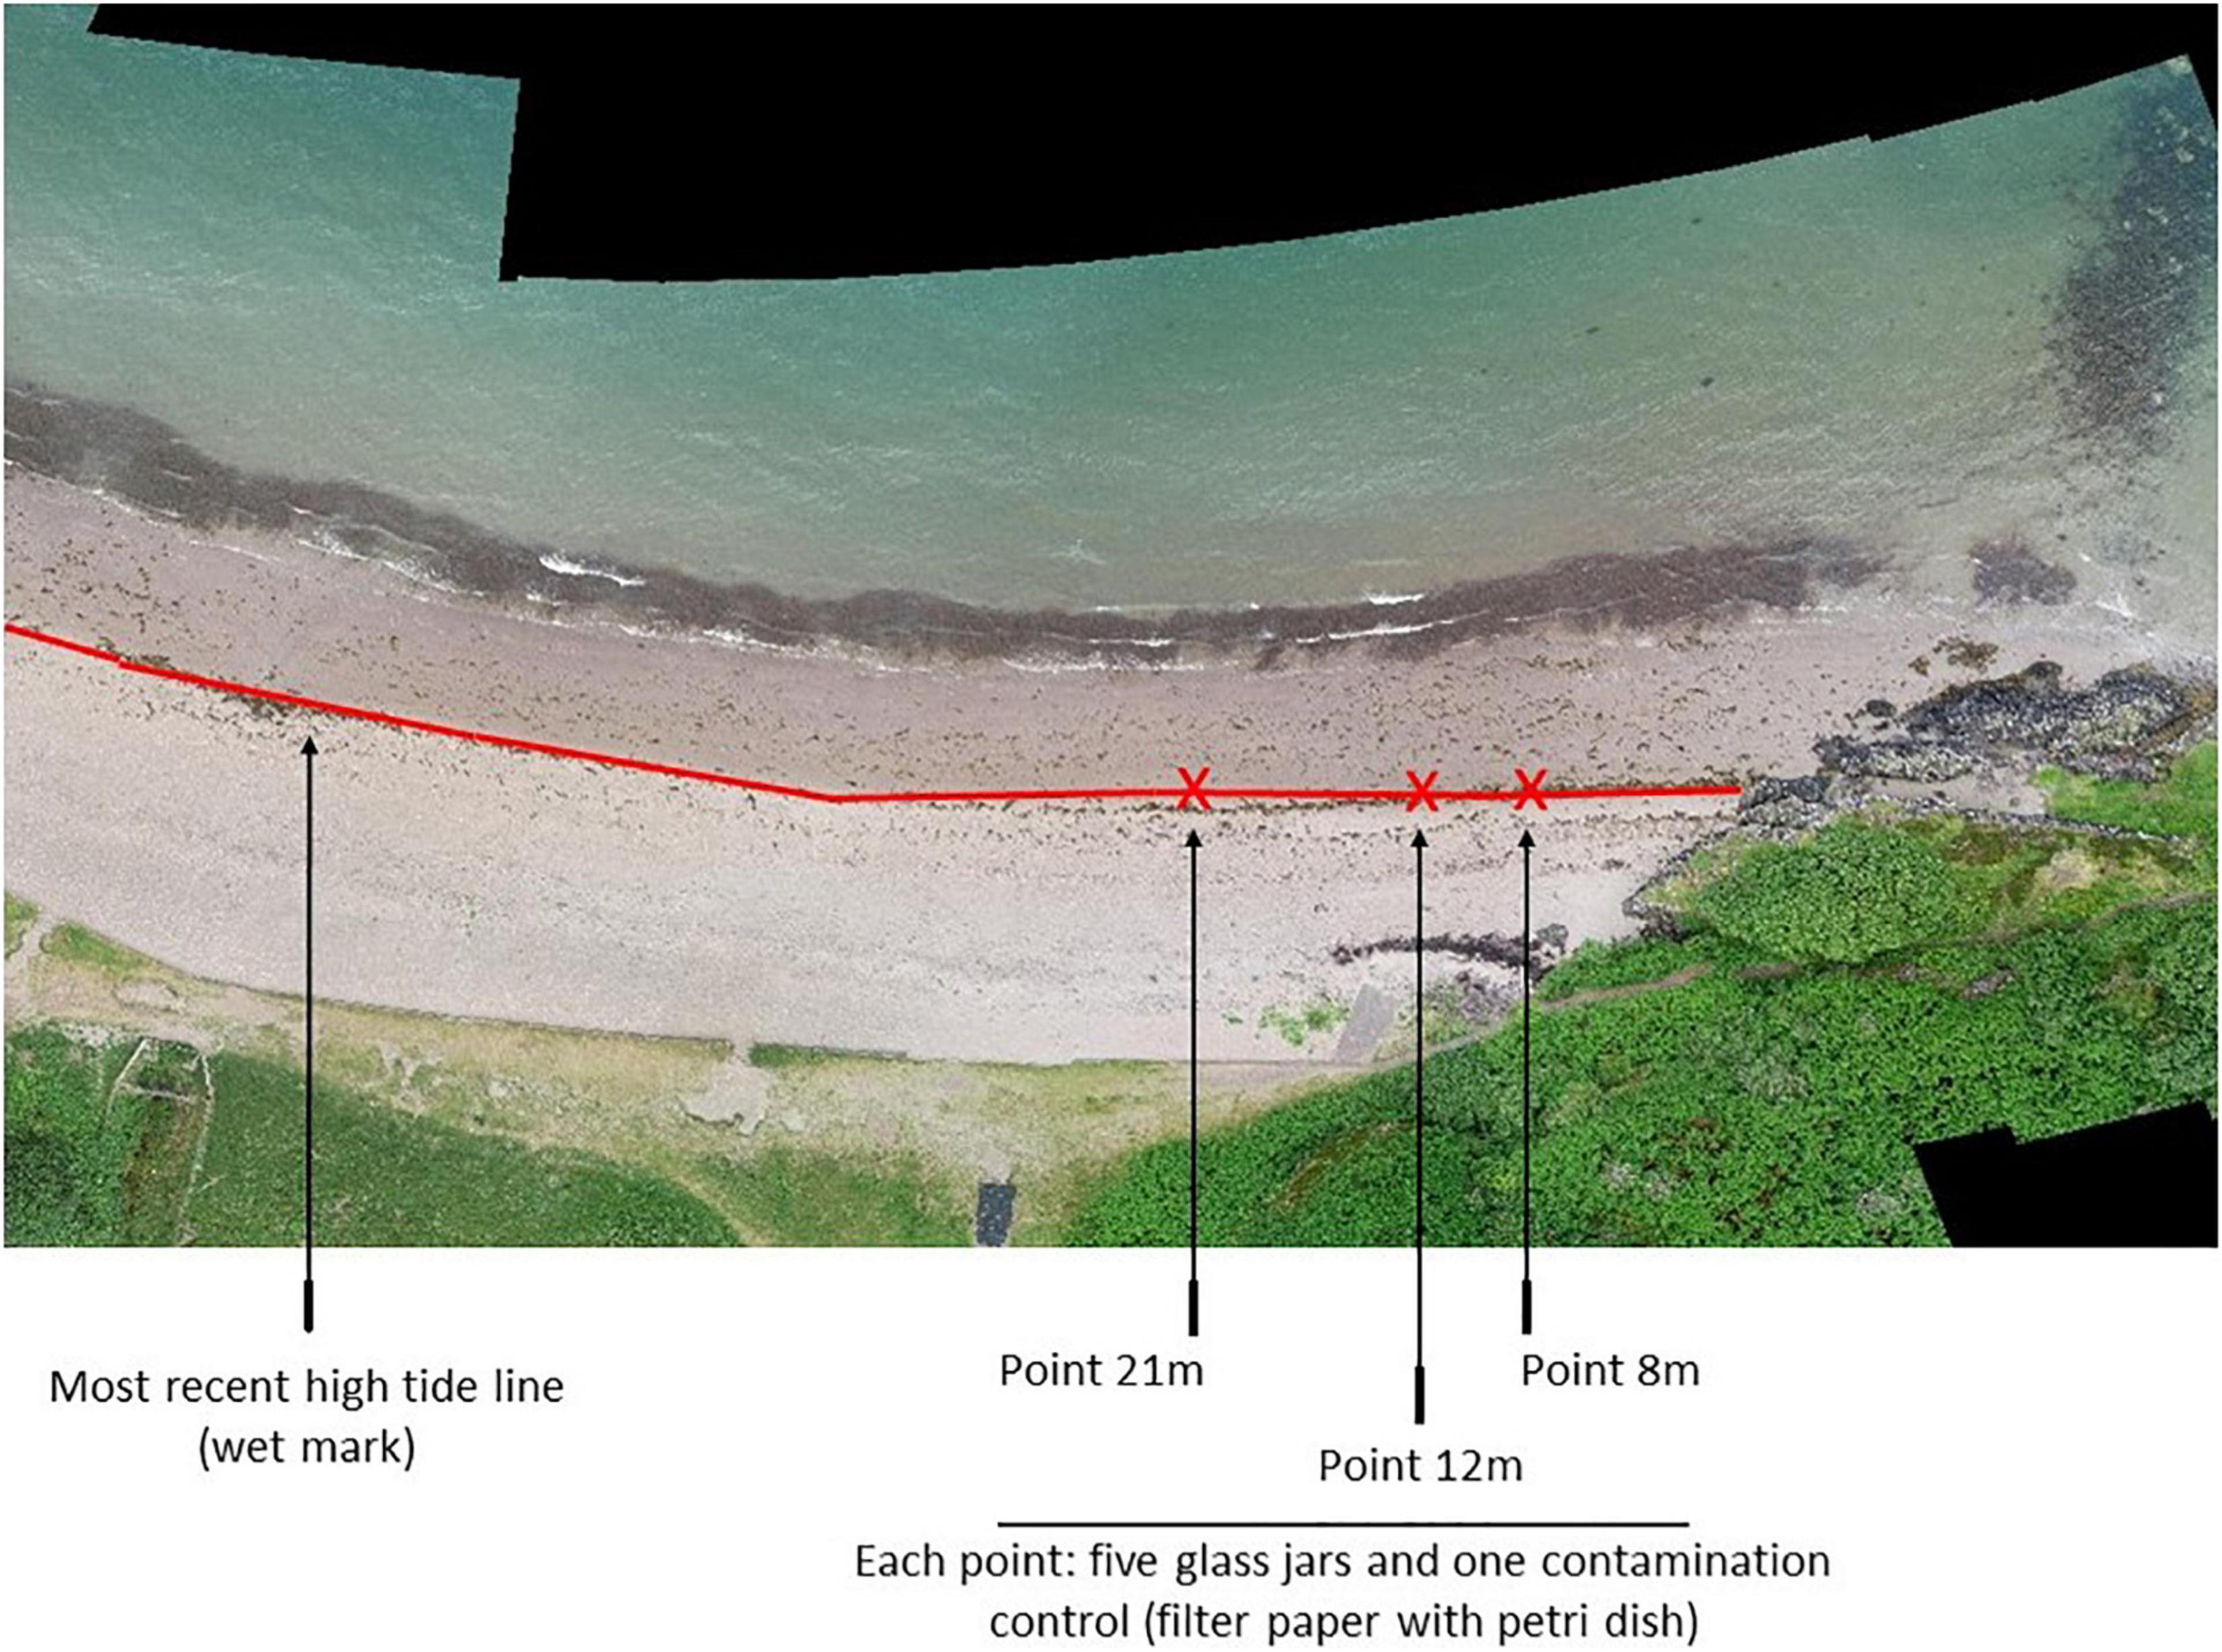
Figure 3. Collection of intertidal sediment at the most recent high tide line displaying the three points on Ganavan sands beach. The red line indicates the high tide line.
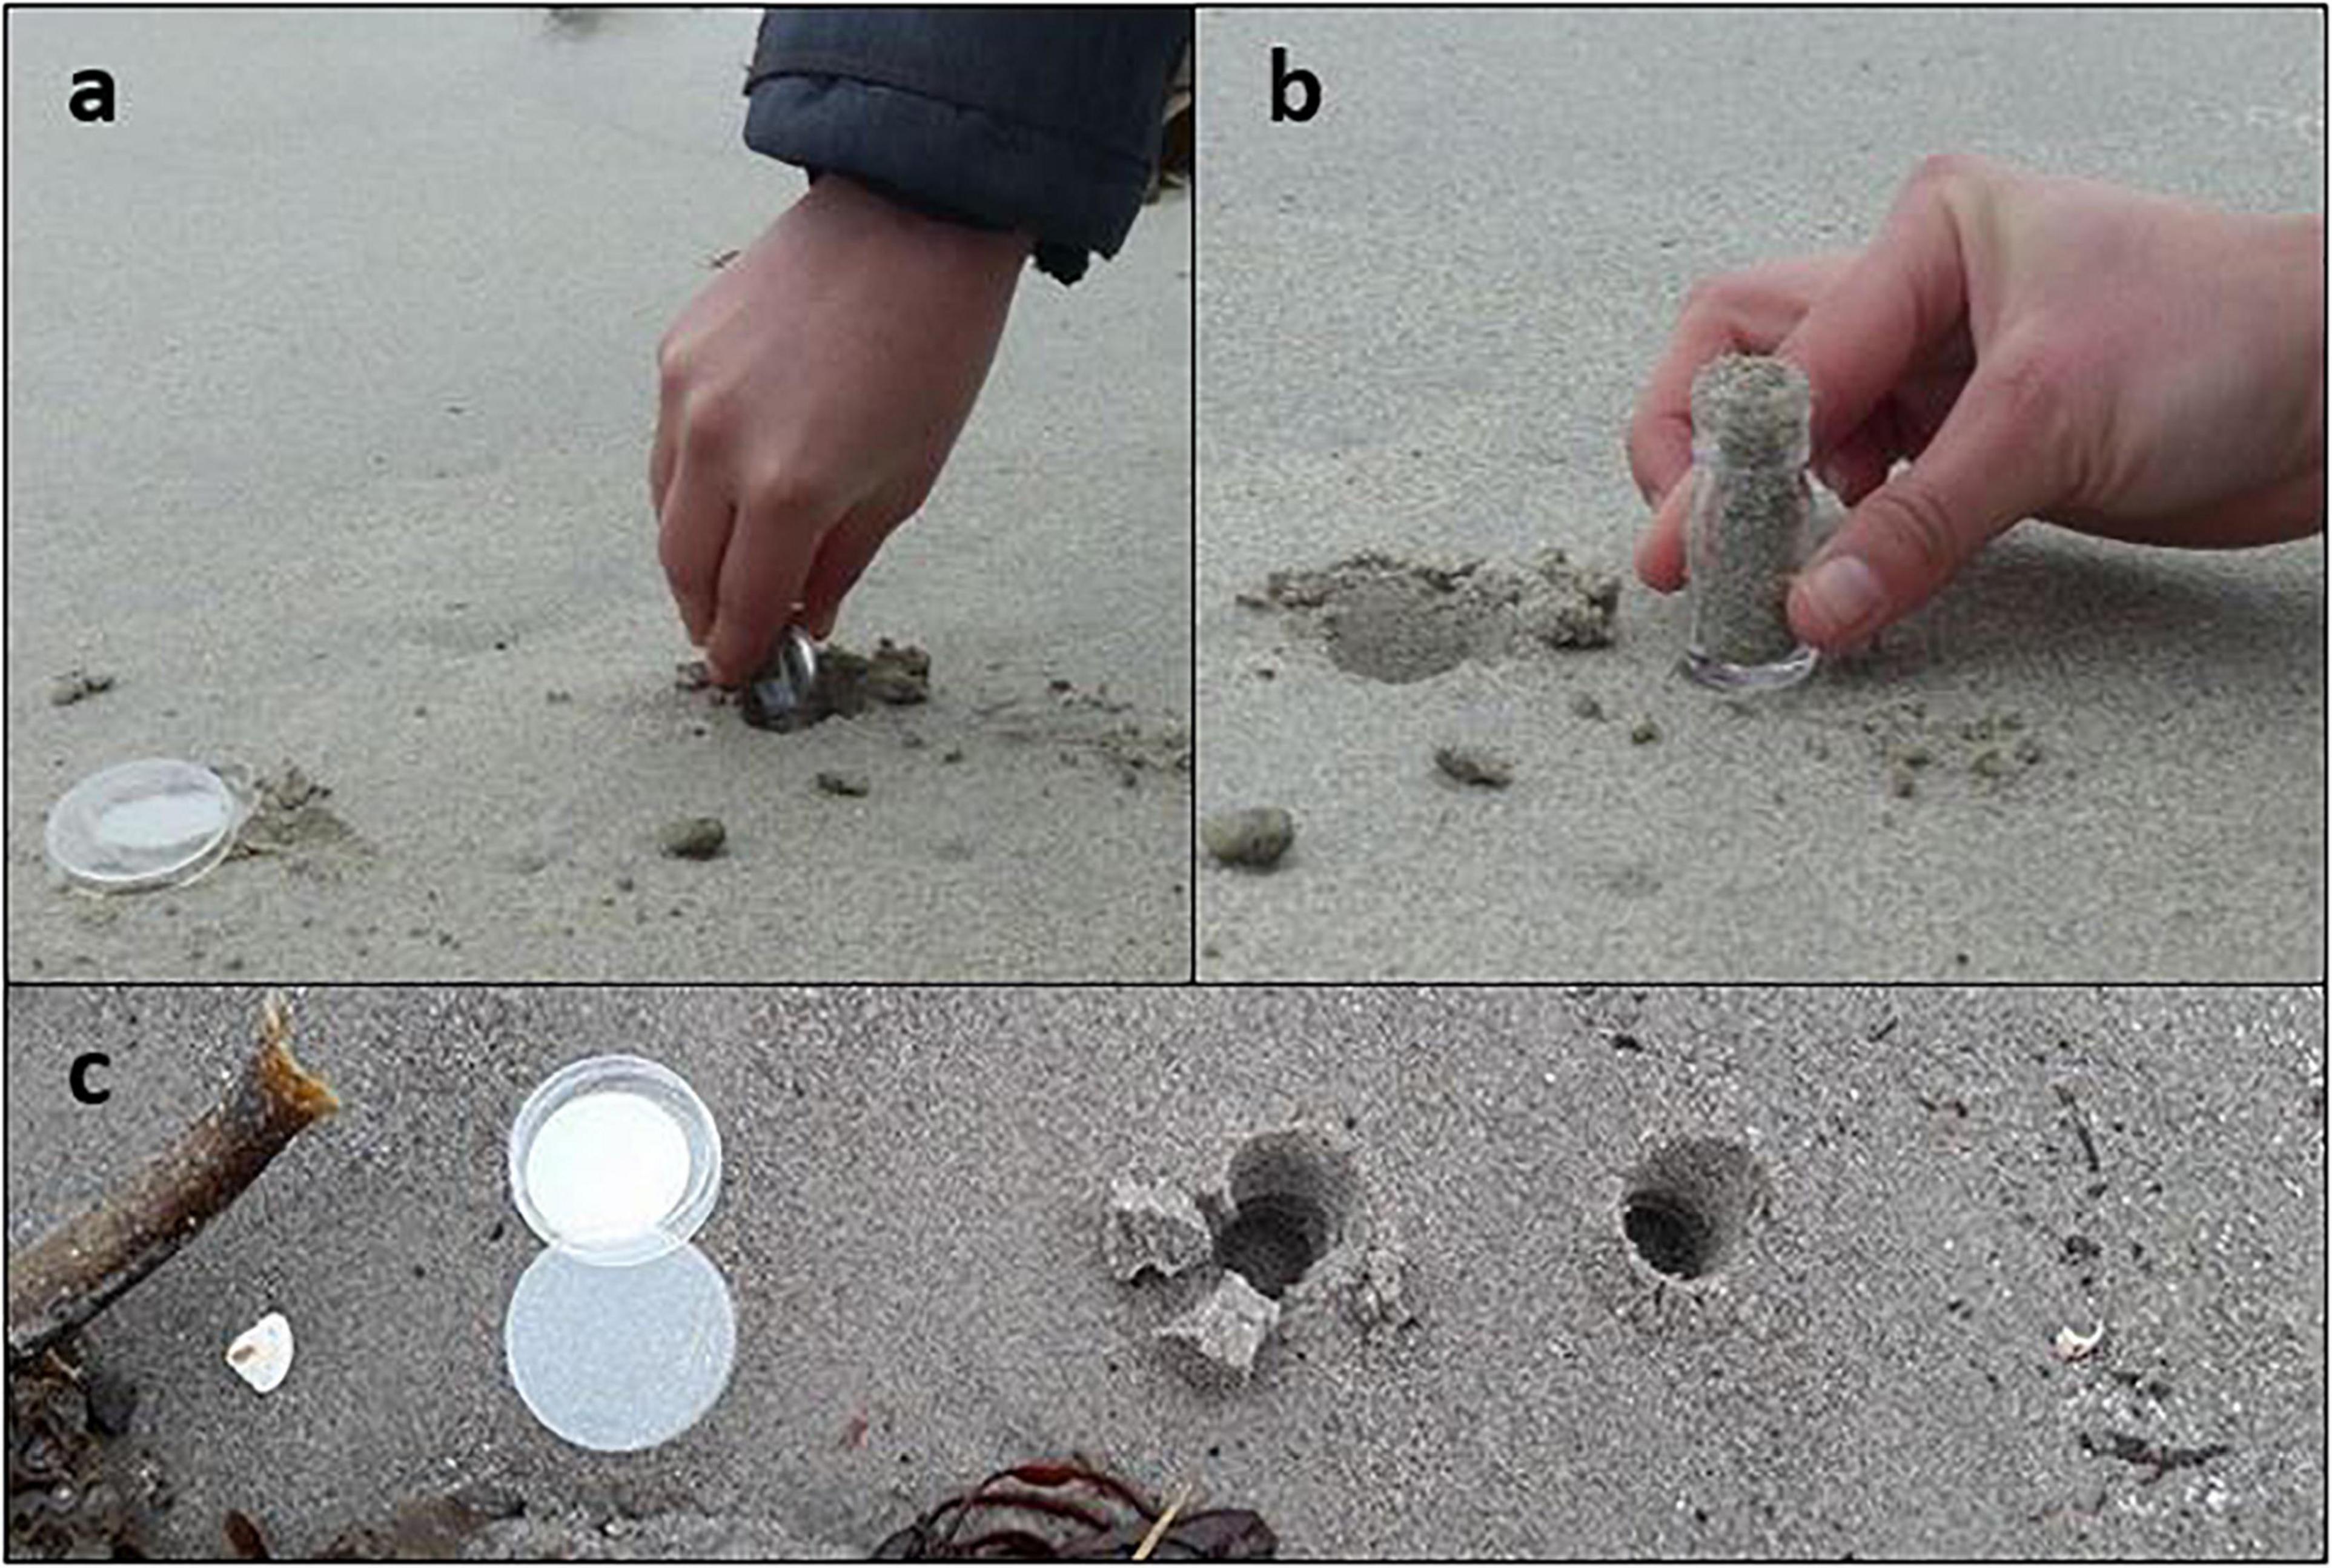
Figure 4. Demonstration of sediment collection using a glass bijou jar as a scoop (a,b) with a dampened filter paper (c) to assess air contamination during the sampling.
Surface Water
Coastal water was surveyed at the same site after the intertidal sediment had been collected. Surface water was sampled using a pole-water sampler and a sample bottle capable of holding 500 ml previously rinsed and cleaned with deionized water and 70% ethanol (Figure 5). After walking into the water to a depth of ∼30 cm to avoid, as much as possible, the mixing area of sand and coastal water, the water sampler was deployed to collect the surface water (i.e., top 15 cm). Five replicates of 500 ml were collected per site with a total of 2.5 l of water per location per season as suggested by Prata et al., 2020. The pole water sampler was wrapped in aluminum foil between collection of each sample to avoid air contamination. In addition, between each replicate, all material was rinsed with deionised water to avoid environmental contamination. The quantity of water collected was limited by the size of cool-box and the practicality of posting the samples back to the laboratory. Plastic bottles were preferred for sample collection compared to glass bottles in this study for safety and practical reasons (i.e., price and fragility).
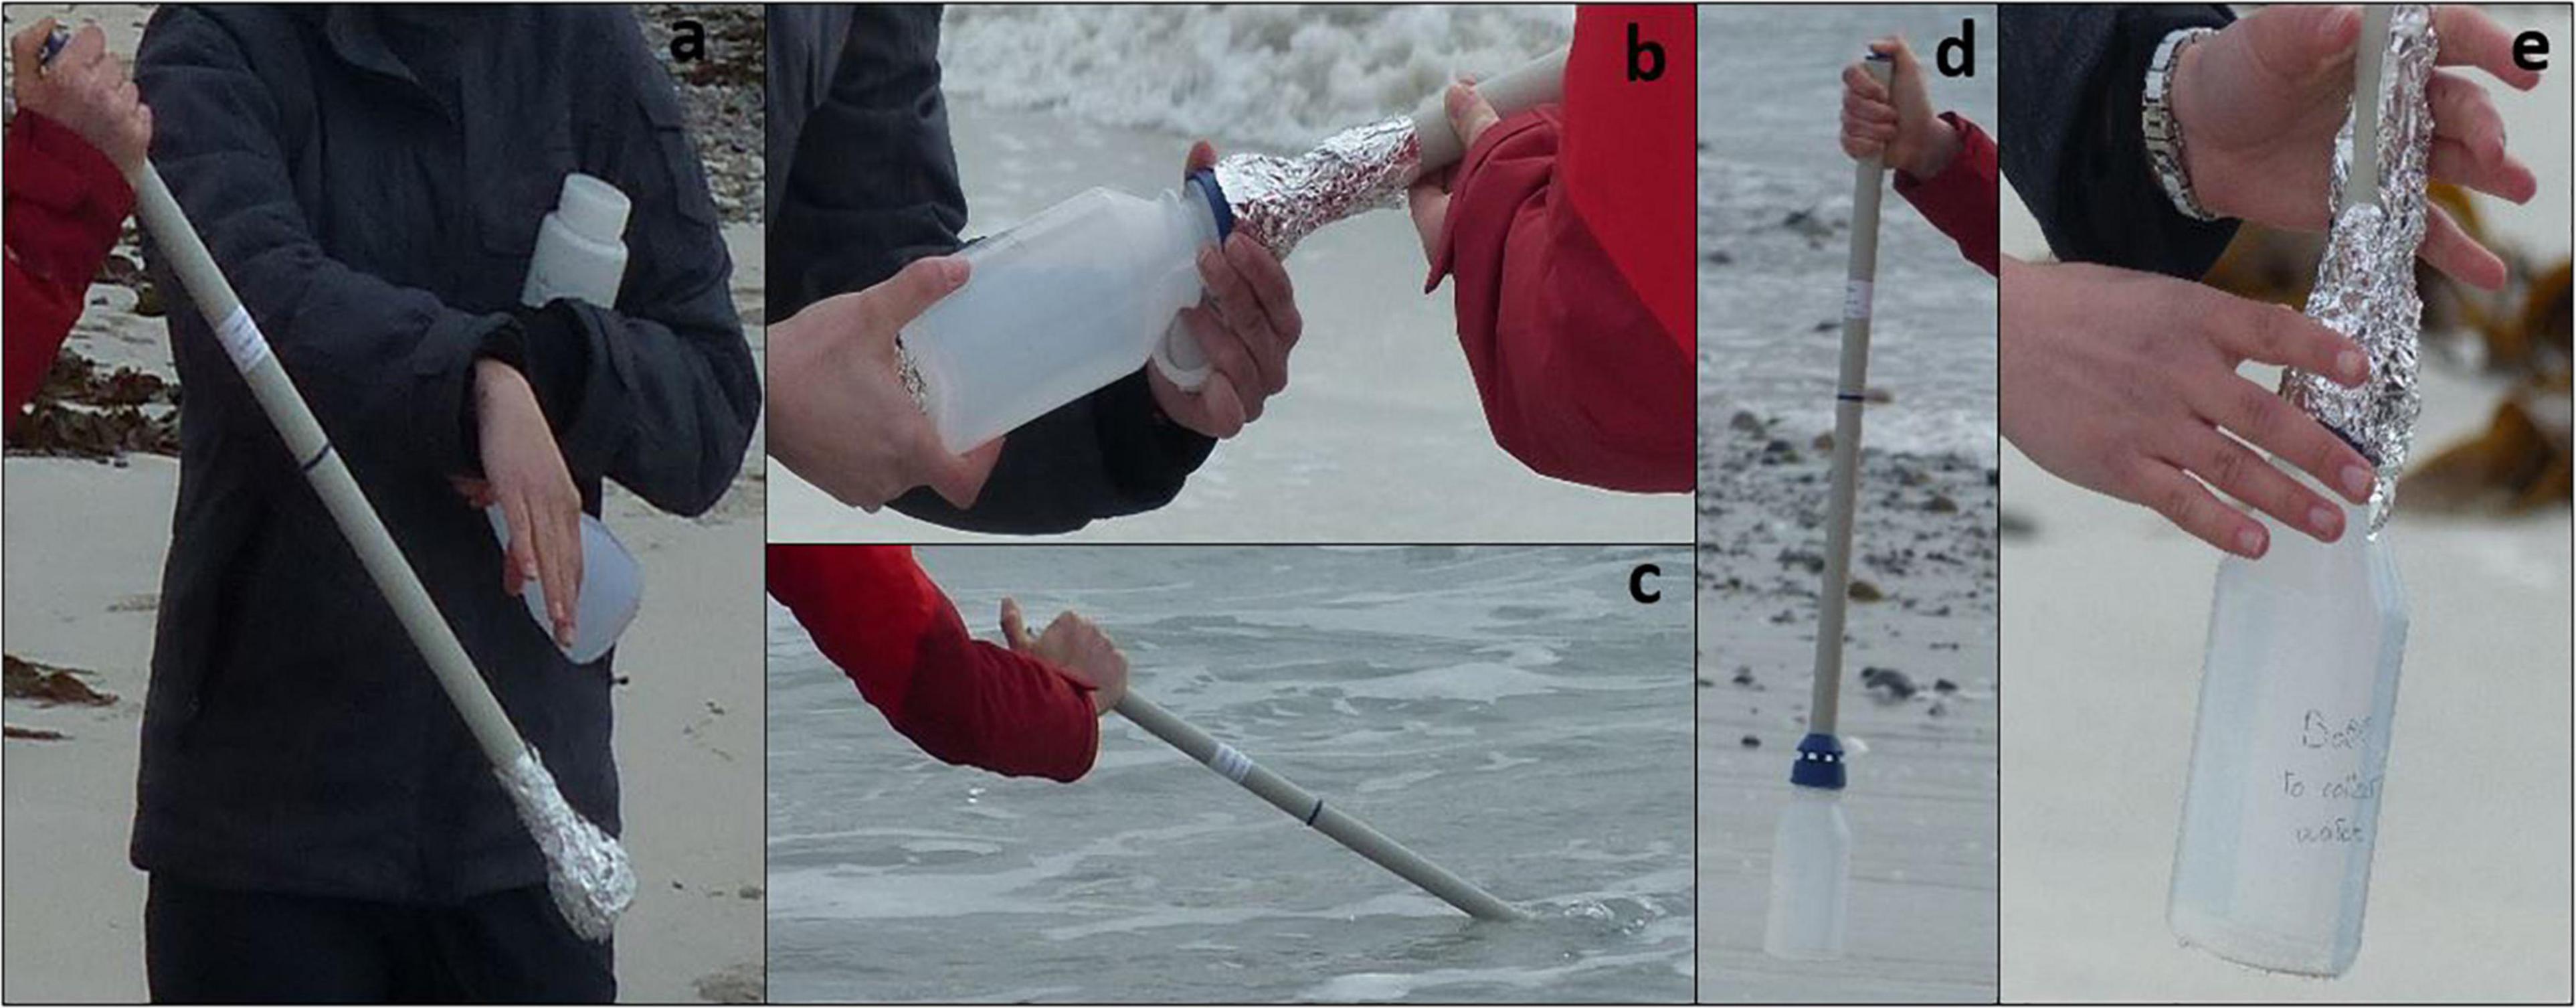
Figure 5. Collection of surface seawater with a pole-water sampler using aluminum foil to avoid air contamination, (a) pole-water sampler protected from the air with aluminum foil, (b) remove aluminum foil at the end of pole and screw the bottle sampler, (c) put pole in the water, release the button to collect water, (d) press the button to avoid air coming into contact with the seawater, (e) put aluminum foil around the apertures to prevent air contamination and release the button prior to transferring the water to the container.
Biota: Mytilus edulis
Blue mussels (M. edulis), are commonly observed along the shore in Scotland (Svåsand et al., 2007). Mytilus edulis were collected from the rocky shore directly adjacent to the sampled beach. Adults ranging in size from 2 to 5 cm were collected to facilitate the statistical comparison of results between locations. M. edulis were removed from the substrate using a knife rinsed with deionised water prior to being used and any encrusting organisms were detached from the shell of the mussel. Each individual was rinsed with deionised water to remove any potential contamination before being wrapped in aluminum foil and individually stored in a plastic bag. Ten replicates were collected for each site in each season.
Sample Storage
In the laboratory, water and sediment samples were stored in a fridge at 5°C for a few days or up to 6 months, respectively, until the extraction and filtration processes could take place, to decrease the development of organic matter in the samples. This step also facilitated the recovery of microplastics using oil. To ensure no loss of ingested microplastics from M. edulis, they were frozen (−20°C) to keep the shells closed until extraction.
Sample Processing
Intertidal Sediment
Glass jars were placed in a drying oven for 48 h at 50°C with a 140 μm metal mesh placed on top of them to reduce air contamination. Blank samples were run at the same time to assess potential airborne contamination in the oven. The sand contained in the glass jar was weighed individually to record the dry mass (g) of each sample. The sand from each glass jar was mixed with 3 ml of canola oil combined with 25 ml of deionised water and placed in a 250 ml conical flask [this method was adapted from Crichton et al. (2017) and Courtene-Jones (2019)]. The quantity of canola oil was adapted to the sand mass content of one glass jar (approximately 10 g) and sand grain size [less fine than Courtene-Jones et al. (2017)]. Following the extraction, a cleaning step was added using an ethanol (99%) 1:1 isopropanol (99%) solution to ensure that the oily layer adhering to the particles was completely removed. Using the ethanol–isopropanol solution resulted in successful analysis of the polymer type using a Fourier Transform Infrared spectrometer (FTIR) (Courtene-Jones, 2019). Each potential microplastic was stored on a separate gridded filter paper and labeled prior to FTIR analysis.
Surface Water
Water samples were filtered as soon as possible after the storage step using a Buchner funnel with filter paper (Whatman qualitative grade 4, 20–25 μm pore size), coupled to a vacuum pump. The bottle containing the water sample was rinsed three times with deionised water and then poured onto the same filter paper to ensure that all potential plastic pieces were recovered. The wet filter paper was stored and sealed in a glass petri dish and labeled prior to observation and analysis.
Biota: Wild Mussels
Prior to enzyme digestion, individual mussels were measured (length and width) using dial metal calipers to assess the size ranges within and between locations. Individual mussel flesh was placed onto a pre-weighed glass petri dishes to determine the flesh mass (i.e., wet mass in g). The flesh of each mussel was cut into five pieces, placed into a glass beaker and covered with aluminum foil. A 0.625% Trypsin solution (following the methodology of Courtene-Jones et al., 2016) was added to the mussel flesh (i.e., 25 ml per mussel). The beaker was put onto a hot plate (38–42°C) with a magnetic stirrer for 30 min, after which the contents were poured through a filter paper (Whatman qualitative grade 4, 20–25 μm pore size). After filtration, the beaker was rinsed three times with deionised water to recover all particles from the sample and this solution was also poured through the same filter paper. The filter paper was stored in a glass petri dish, sealed with electrical tape and labeled. These steps were repeated for each individual mussel.
Microplastic Identification and Characterization
Following quickly the filtration step, the filter papers (Whatman qualitative grade 4, 20–25 μm pore size) were visually inspected for microplastics using a dissecting microscope (WILD M5, 75×) and particles were transferred manually with tweezers (TAAB – High precision Stainless steel Anti-mag Type 3) to be stored on separate gridded filter paper and labeled. The particles were counted, photographed (Zeiss Stemi 2000-C microscope coupled with a Zeiss Axiocam camera), measured (i.e., ocular scale) and characterized by shape, color, length and polymer type. Each potential microplastic was scanned to confirm its polymer type using the FTIR in reflection and μATR collection mode (wavelength ranging from 4,000–600 per cm–1) of an Attenuated Total Reflection-Fourier Transform Infra-Red spectrometer (ATR-FTIR Thermo scientific Nicolet iN10 and iZ10, software Omnic Picta). Each final spectrum was the product of 16 co-added spectra with a spectral resolution of 8 cm–1. Spectra were compared with five inbuilt polymer libraries (Thermo Fisher) to aid identification and processed through the atmospheric suppression and baseline correction when necessary.
Contamination Control
A strict process was followed to avoid airborne contamination during the sampling campaigns and in the laboratory. In the field, volunteers wore natural fabrics when possible and collected samples whilst facing into the wind. The material was rinsed with deionised water and 70% ethanol if necessary and wrapped in aluminum foil. The environmental contamination in the field and the air contamination during laboratory work, were assessed with petri dishes and dampened filter paper (Whatman grade 1, 30 mm) left on the bench or near the collection point (Courtene-Jones et al., 2016). In the laboratory, a ‘clean room’ was allocated to study microplastics (Lusher et al., 2017), air vents were covered and the door remained closed during the experiment. Benches were cleaned with 70% ethanol three times prior to starting work (Murphy et al., 2016). Personnel wore natural fabrics and a 100% cotton lab coat; long hair was tied back and numbers were restricted in the laboratory. All apparatus were washed with deionised water and 70% ethanol prior to use, and materials were inspected under a dissecting microscope to ensure that they were free of any contamination (Lusher et al., 2017). Wherever possible the use of metal and glassware were preferentially chosen over plastic. These steps were repeated each day and for each extraction type. Procedural blanks were run for each protocol and taken into account in the results by subtracting the particles recorded from the database.
Results and Discussion
Scientists often have to make a choice between the representativeness and the precision of a sampling design to answer scientific questions. In this study, the sampling protocols for biota and sediment were adapted from Courtene-Jones et al. (2016), Blumenröder et al. (2017), and Crichton et al. (2017). This approach favored the accurate assessment of microplastic concentrations at several locations and the feasibility of sample transportation, over the collection of a high volumes of samples that can be difficult to process due to time limitations. The bulk technique to collect surface seawater from the shore using a pole sampler worked well, as 100% of bottles were filled to the top and sent back to the laboratory from all the six locations. All cool-boxes were received in the 48h after each campaign and there was no suggestion that volunteers had contaminated the samples after following the strict protocol as described in the method section. The order of magnitude of microplastics numbers within each site per seasons was very similar ranging between 0 and 6 particles per l between the different samples, which demonstrated no major contamination during the collection process (Table 2). The minimum and maximum concentrations registered in this study were 0 to 6 ± 1.50 microplastics per l, all sites and seasons combined. Li et al. (2018) have observed similar concentrations in coastal waters around the United Kingdom (UK) with a range of 1.5–6.7 items per l. However, McEachern (2018) recorded lower concentrations in surface waters in Florida, United States of America, compared to this study with an average of 0.94 particles per l for discrete samples, while in Korea the average concentration was 1.736 particle per l (Song et al., 2018). It seemed that the concentrations observed in this study are of the same order of magnitude as other studies around the world, meaning that the protocol put in place could be suitable for microplastics monitoring.
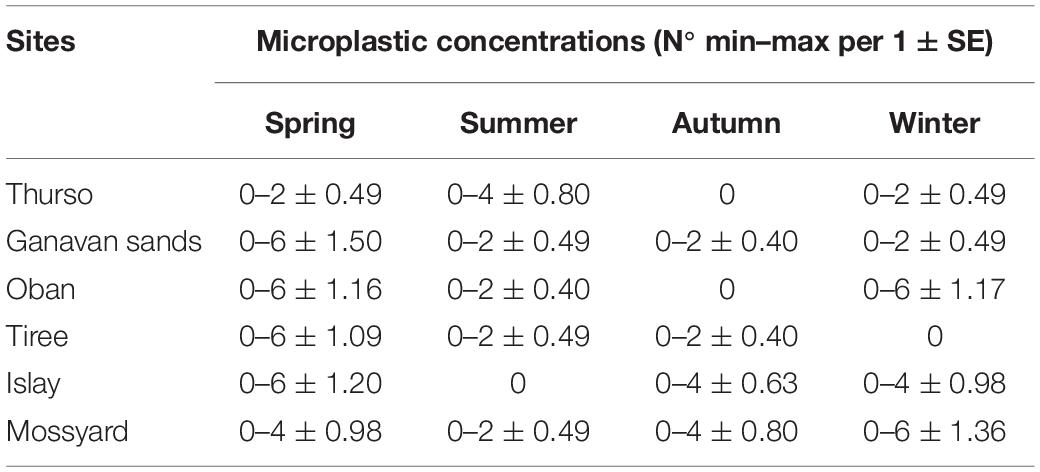
Table 2. Minimum and maximum of microplastic concentrations in seawater (number of particles per l) with the standard errors for each site and season.
However, a high standard error between replicates at each site over the year was obtained (Table 2) that may be the result of the relatively small volume of water (2.5 l) collected. It would not reflect the actual variability of microplastics in surface waters (Brander et al., 2020). Work undertaken by Barrows et al. (2018), demonstrated the difficulty of maintaining accuracy when collecting small volumes of water, especially when microplastic concentrations are already low (Barrows et al., 2018). The results for water samples did give representative values from the environment for small microplastics (Prata et al., 2020). Those relative values are useful for monitoring, understanding the potential impact of plastic particles and informing measures to reduce this pollution (Prata et al., 2020). Prata et al. (2020) collected surface waters with glass bottles of 1 l in four replicates and extracted subsamples volumes of 0.1, 0.25, 0.5, 1, and 2.5 l, to investigate the minimum volume required to detect the small microplastics considered the most abundant fraction in the environment. Taking into account the feasibility of collecting and processing, Prata et al. (2020) suggested that 0.5–1 l of filtered water would be recommended for future research. Their study concluded that the utilization of small volumes would allow for studies looking at the temporal and geographic scales of microplastic studies to be undertaken with readily available materials (Prata et al., 2020).
Nets could be considered as a mechanism for collecting microplastics from the water as they filter greater volumes of water but could underestimate the number of fibers sampled due to larger mesh sizes. It is also more time consuming to analyze the substantial quantity of particles due to the higher volume of water filtered, even if it was more representative of the environment (Prata et al., 2019). The nets would also be difficult to deploy in shallow water along the shore and would not recover the smaller microplastic sizes (Vermaire et al., 2017; Prata et al., 2019). Grabs are more versatile and easy to use by anyone thus more viable for citizen science studies despite the lower volume collected and the potential of over-estimation of microplastic concentrations due to contamination (Brander et al., 2020). The results of this study support the recommendation by Barrows et al. (2017, 2018) to investigate greater volumes of seawater to define a minimum volume of samples that would be representative of the environment using grabs or other collection techniques (Prata et al., 2019).
One alternative would be to use a pump to collect a greater volume of water and filter the surface water on-site prior to laboratory analysis (Lusher, 2015; Zhao et al., 2015). This technique would not only allow a greater quantity of water to be collected but would also allow easy transportation of samples (filters) to the laboratory and potentially avoid environmental contamination. However, pump systems are expensive to purchase and difficult to transport to different locations (Zhao et al., 2015). Also, using a pump system would require an energy supply for it, which is not practical for use in a citizen science project. Therefore, a balance needs to be maintained based on finances, practicality for collection, working with numerous volunteers and collecting water samples from multiple areas, versus water collection from limited sites. Brander et al. (2020) suggest a combination of grab and net techniques to analyze a wider quantity and range of plastic particles in seawater. For example, McEachern et al. (2019) combined discrete samples (i.e., 1 l per site using a Van Dorn sampler) and plankton tows (i.e., 330 μm net). No significant differences were observed in microplastic concentrations between stations or regions (McEachern et al., 2019), perhaps highlighting that the two techniques could give the same outputs.
The bulk sampling approach to collecting beach sediment worked, with 100% of the glass jars filled to the top, labeled correctly and sent back to the laboratory from all six locations. There was no evidence of volunteers indirectly contaminating the samples thanks to the air contamination assessment in the field with the dampened filter paper while collecting the sediment. The order of magnitude of microplastic concentrations within each site and season was similar ranging from 0 to 0.37 particles per g.dw between the different locations and seasons which seemed to reveal no major contamination during the process (Table 3). The standard errors were smaller compared to the water samples confirming that this technique was suitable to look at microplastics in the sediment (Table 3). In Table 3, the low number of microplastics recorded in samples could be justified by the lack of samples analyzed. Indeed, 20% of all samples collected were analyzed due to the closure of the laboratory as a result of the COVID-19 pandemic. It affected the processing steps of sediment samples. The concentrations recorded in beach sediment for this study were more important than the concentrations observed in Germany with 0.007 particles per g and 0.002 – 0.011 fibers per g (Stolte et al., 2015). Meyer (2015) highlighted similar amount of microplastic fibers in beach sediment in the North of Scotland with a range of 0.015–0.155 fibers per g, while Blumenröder et al. (2017) recorded a an higher amount of microplastics in beach sediment in Orkney, with 0.73 particles per g and 2.3 fibers per g. However, in China, the microplastic concentrations registered in beach sediment were very high compared to this study with a range of 5.04–8.72 particles per g (Qiu et al., 2015).
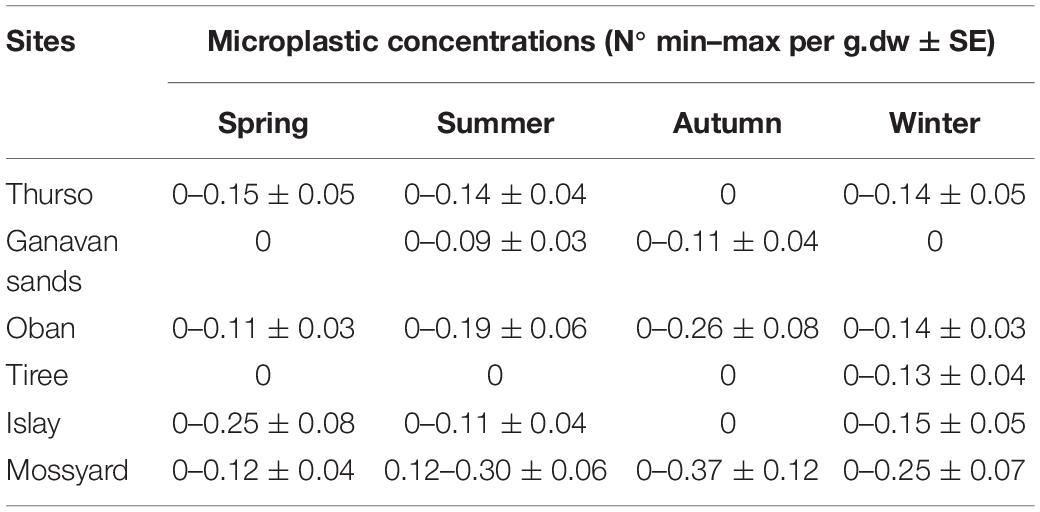
Table 3. Minimum and maximum concentrations of microplastics in sediment (number of particles per g of dry weight) with the standard errors for each site and season.
Bulk sampling produced the biggest range of size classes of microplastics reporting particles from 1 μm to 5 mm (Brander et al., 2020). This technique was chosen as it was a good method to recover all sizes of microplastics from an area never studied before. Moreover, as the bijou jars used to collect the sediment were not plastic and no sieving step was applied this allowed for a reduction in potential air contamination. Sieving could artificially create more microplastic particles due to mechanical action that would be avoided using bulk samples (Blumenröder et al., 2017). As a result of their smaller volumes compared to other techniques, bulk samples are more easily transported back to the laboratory. All the recommendations cited by Brander et al. (2020) have been respected such as collecting the first 5 cm of sediment, making a transect, a minimum of five replicates per point and approximately 10 samples per 100 m of beach.
When the volunteers collected biota such as wild mussels, all the mussels were cleaned from their byssus and barnacles attached to them and wrapped into aluminum foil to be stored separately in a cleaned plastic bag. No liquid coming out the mussels was visible when the cool-box arrived at the laboratory, which meant that the transport went well and no potential microplastics were lost. Again there was no concern raised that volunteers had contaminated the samples because some of the steps in the protocol were designed to clean and rinse the mussels prior to storage. In Table 4, the standard errors were low demonstrating that this technique was suitable to look at microplastics in mussel. In Table 4, the variability of concentrations of microplastics per g.ww could be explained by the physiology and the size of the organisms (Brander et al., 2020). The recommendations of Brander et al. (2020) have been respected such as collecting 10 individuals per site or area. Lastly, the volunteers respected the specific guidance provided regarding the collection of adult specimens where possible, with 97% being included between 2 and 5 cm in length as mentioned in the protocol. The concentrations observed in wild mussels all sites and seasons combined were ranging from 0 to 23.81 microplastics per g.ww for this study. These results seemed to be similar to the concentrations observed in Oban area, Scotland with a range of 1.05 to 4.44 per g.ww (Courtene-Jones, 2019). Catarino et al. (2018) have found similar level of microplastics in wild mussels around Scotland with an average of 3.0 ± 0.9 particles per g. Those concentrations matched the observations of microplastics in wild mussels in China with a range of 0.9–4.6 particles per g (Li et al., 2016), whereas the concentrations recorded in France were lower with an average of 0.23 ± 0.20 microplastics per g.ww (Phuong et al., 2017). Therefore, microplastic concentrations observed in wild mussels in this study seemed to be similar to other studies in Scotland and Europe, which means that the protocol could work for bigger citizen science project.
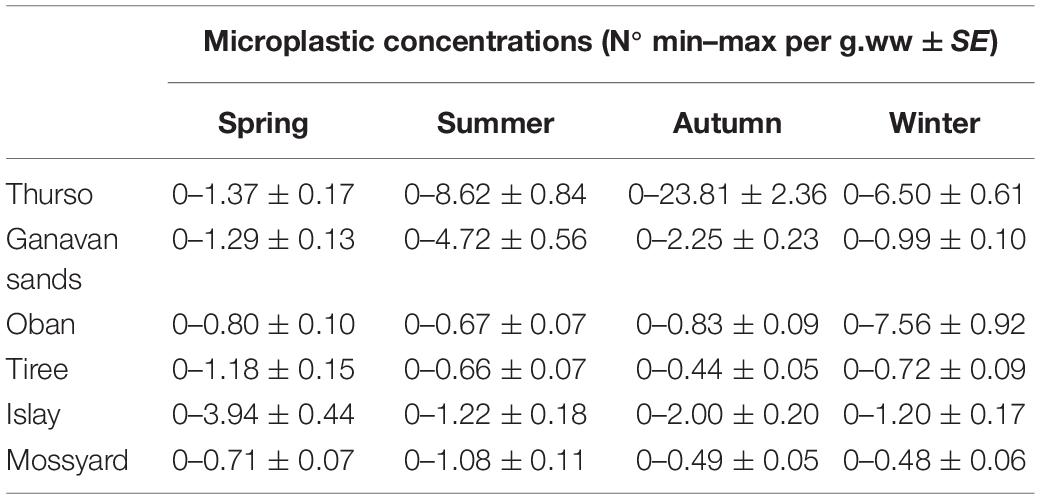
Table 4. Minimum and maximum concentrations of microplastics recorded per g of soft tissue wet weight with the standard errors for each site and season.
Citizen science can be a powerful research tool enhancing spatial and temporal coverage (Pocock et al., 2017), increasing access to sites and samples (Honorato-Zimmer et al., 2019), reducing financial project costs, raising awareness regarding research or conservation aims (Eaton et al., 2017) and providing opportunities for people to become involved in science projects (Cohn, 2008; Bonney et al., 2009; Bosker et al., 2017). Calculations were made for this study (Table 5) to confirm the extent to which volunteers helped reduce the financial costs, time and carbon footprint of the campaign. Table 5 demonstrates that for this study using citizen scientists (10) helped decrease the sampling time by 73%, lowered the carbon footprint by 65% and reduced the overall financial cost by 63% by using this new methodological development. Including more citizen science in research would, potentially, allow more studies to take place, and more samples to be collected. It could reduce the impact on the environment and support the movement toward more sustainable research.
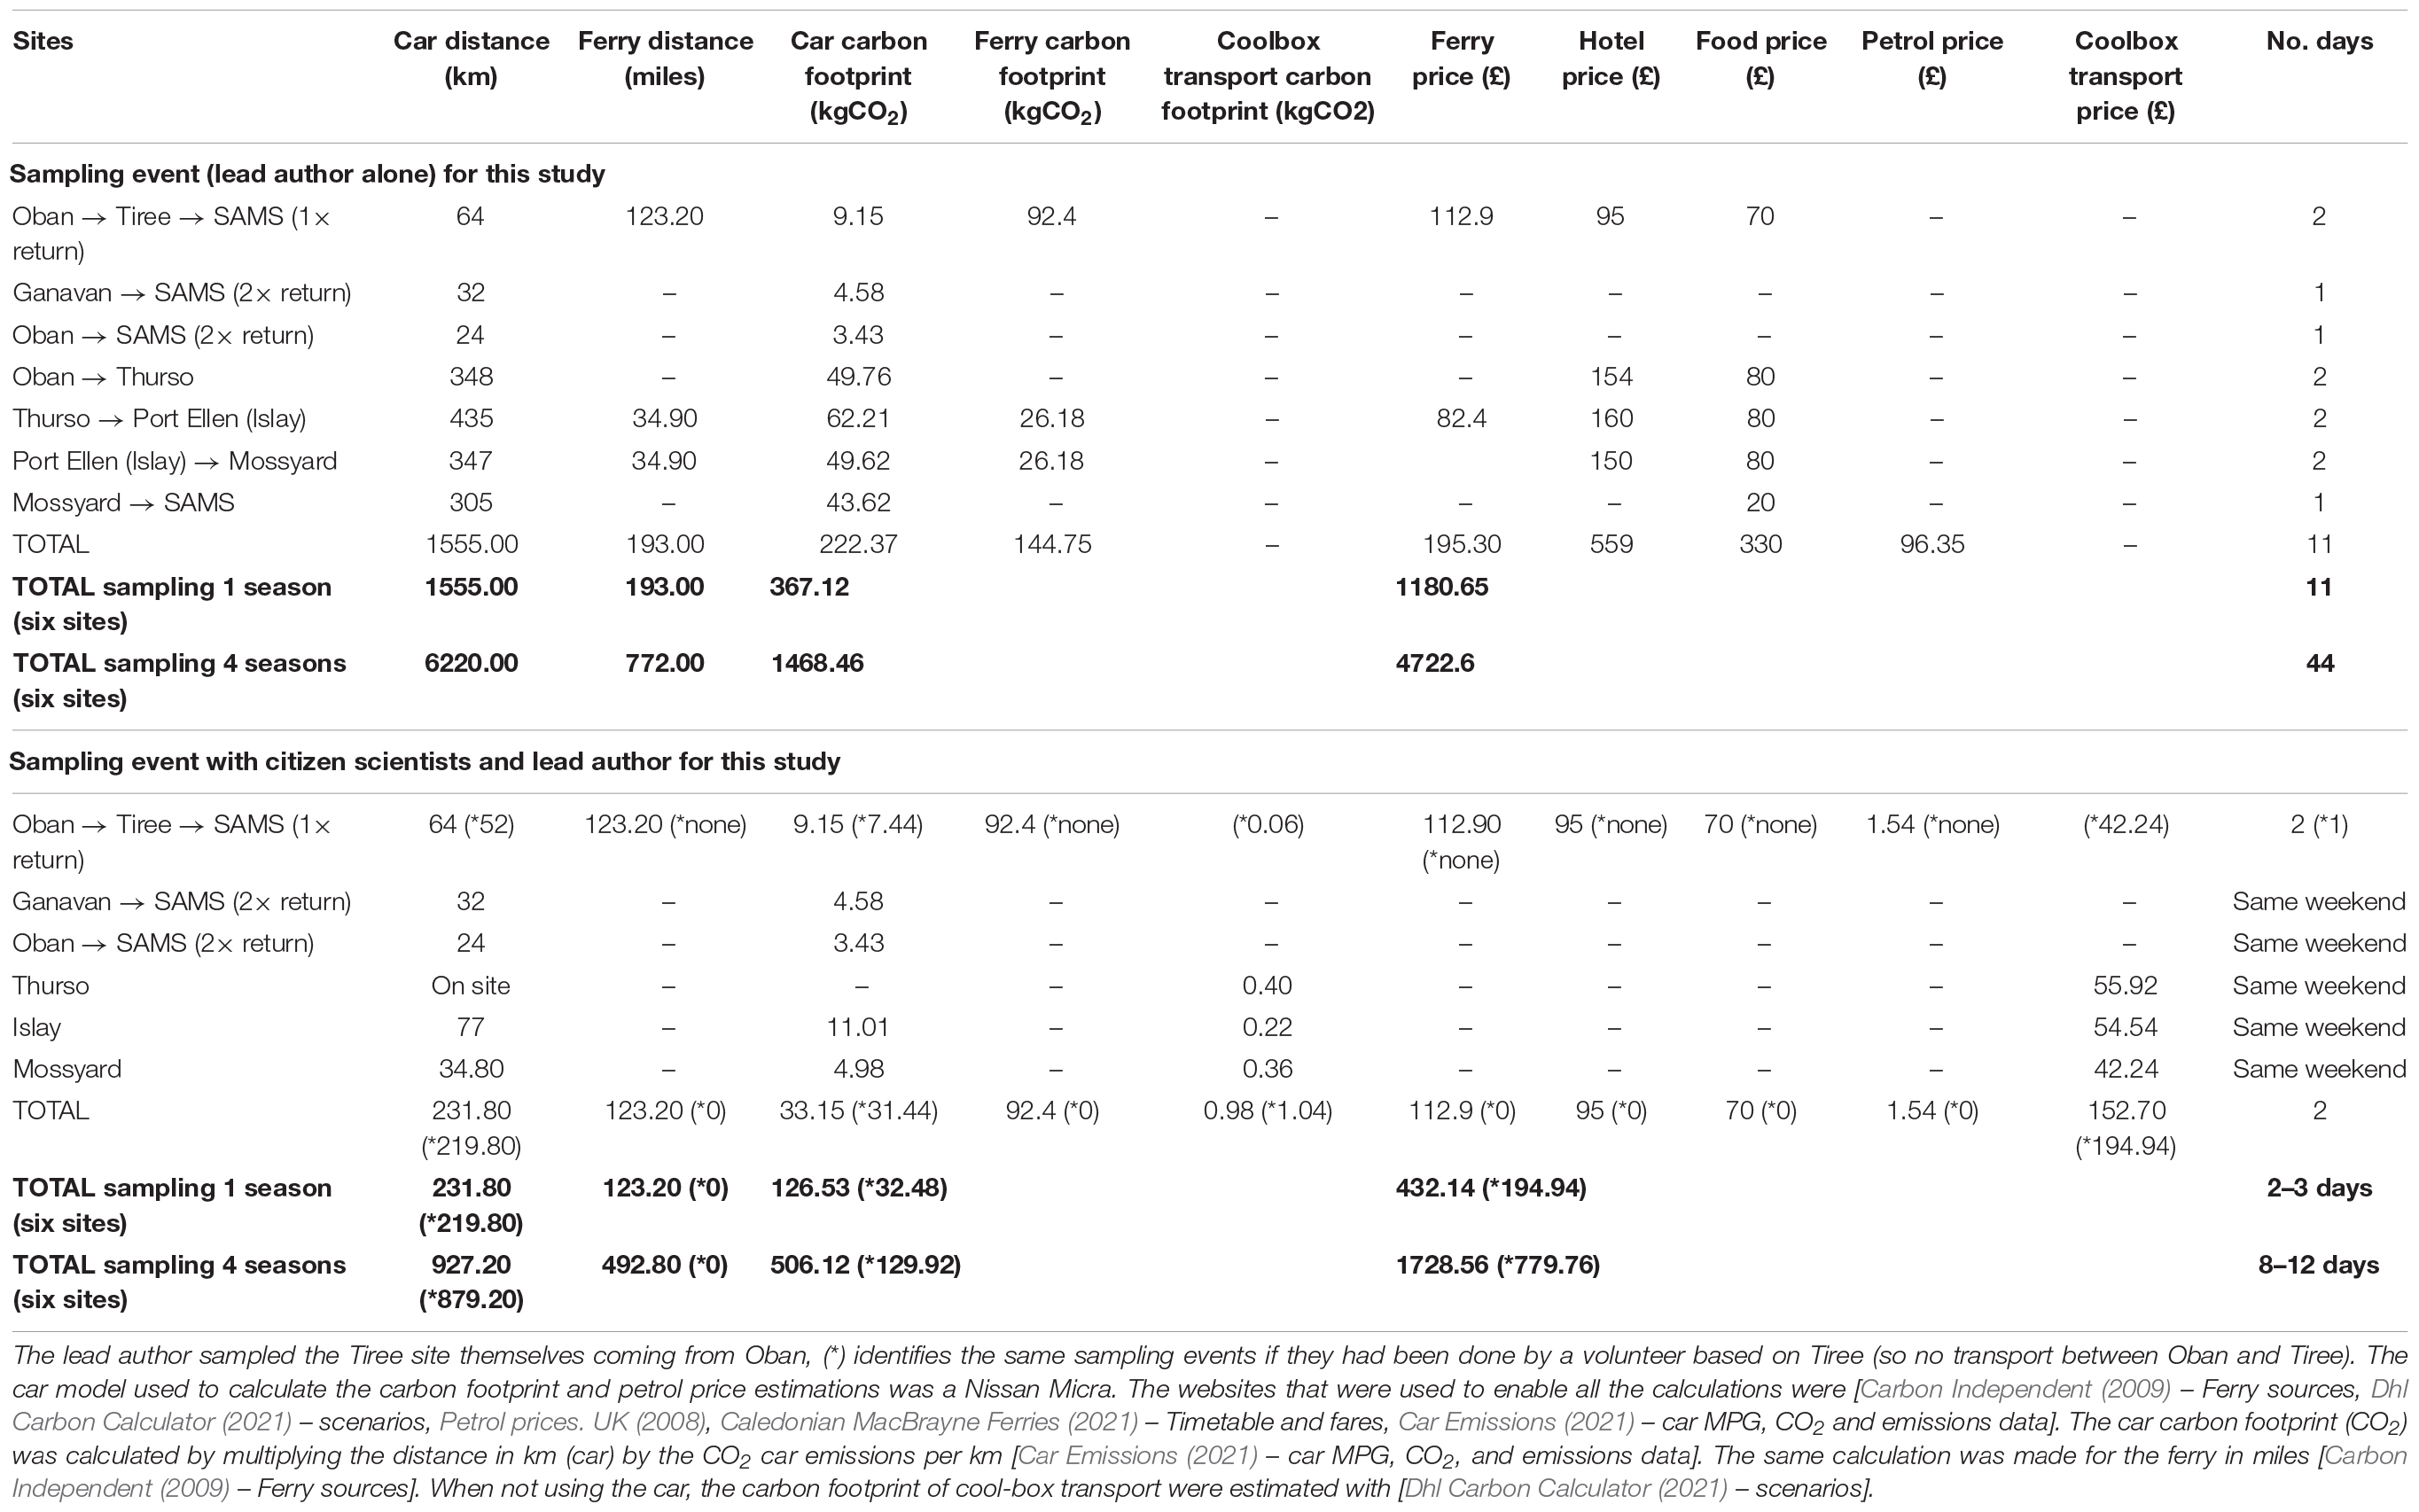
Table 5. Calculations of carbon footprint, time and expenses for this study sampling campaigns done by the lead author alone or combined with citizen scientists.
These results indicate that in order to create and develop a baseline monitoring for plastic pollution along the coastline, as well as for studies that want to cover large spatial and temporal scales, it is essential to have citizen scientists involved in the project. Based on the definition of citizen science projects by Kelling et al. (2019), this study would be classified in the semi-structured to structured categories due to its well-defined objectives, a rigorous protocol with open recruitment and recorded observations during sampling. This type of project has been recommended for the future due to the good collection of scientific values, enough bias control, but still able to attract a large number of volunteers (Kelling et al., 2019).
However, there are some drawbacks including difficulties in finding volunteers without a pre-established network, training and managing citizen scientists (which can be time-consuming), sampling accuracy, as well as ensuring quality control in the field and blanks for the assessment of environmental contamination (Forrest et al., 2019). In our particular study, based on feedback, all the volunteers had some previous field experience, a great engagement with the topic, and a precision and rigor in applying the methods. If this protocol was to be used again, it would be useful to include video or live training through different media platforms. The advantage of pre-recorded would be that the volunteers could go back and have another look at the file. Communicating positively with the public would potentially interest more volunteers, especially if it fits their beliefs and values (Domroese and Johnson, 2017).
Research teams planning to use citizen scientists in future programs would benefit from accessing larger networks, creating an online platform to facilitate the data collection from volunteers as well as to showcase the results to a wider audience, developing a promotional strategy which could recruit volunteers more efficiently and be less time consuming (Bayas et al., 2017; Barrows et al., 2018; Sanders and Brandes, 2020). Recording field site data is also important for future studies. This should include metadata such as wind speed, wind direction, wave height, wave strength, substrate type and weather forecast which can all provide useful information for the background understanding of samples (Herrera et al., 2018). Barrows et al. (2018) also suggested creating a smartphone application which could be used by volunteers to easily record all useful site information.
Assessing the temporal variation of microplastics along the coastline is one of the biggest challenges that coastal microplastic researchers face. However, a 1-year study may not be long enough to accurately assess the seasonal trends of abundance, or composition, of microplastics in the environment. Barrows et al. (2018) collected microplastics at multiple sites and found both a significant annual and seasonal difference when comparing samples from the same location over 2 years.
Heigl et al. (2019) suggested moving toward a global and general definition based on scientific standards, communication, collaboration and ethics of a citizen science project to ensure standardization and higher quality of studies as more and more research projects involve citizen scientists.
Conclusion
Concentrations of plastic in surface waters ranged from 0 to 6 microplastics per l depending on the sites and seasons. The concentration of microplastics in beach sediment fluctuated between 0 and 0.37 particles per g.dw for all sites and seasons combined, while in wild mussels the number of particles ranged from 0 to 23.81 per g.ww. From the results, the low volumes for water and sediment samples seemed to be a good compromise between the feasibility of the study and the approximation to the real concentration for small microplastics. Using low volumes combined with strict contamination process and good identification protocols allowed us to extend the temporal and geographical sampling of microplastics. The novel aspect of this study was the collection by citizen scientists of three different types of samples at several sites that spanned ∼400 km of coastline, fundamentally at the same time (i.e., the same weekend), several times a year in Scotland. We proposed and deployed a simple, cost-effective and practical collection method that facilitated microplastic sampling for several matrices to enhance the knowledge of microplastic distribution, fate and dynamics in the marine environment. The practical tool-kit was designed to be easy to use, small enough to be posted, and readily used and understood by non-scientific personnel. This technique could be adapted for projects in different environments and countries due to its simplicity, showing the feasibility of monitoring microplastics on a large spatial scale as well as on a temporal scale at low cost.
Data Availability Statement
The original contributions generated for this study are included in the article/supplementary material, further inquiries can be directed to the corresponding author.
Ethics Statement
The animal study was reviewed and approved by University of the Highlands and Islands.
Author Contributions
BN, NJ, BQ, and AD conceived the project aim. LP, BN, and AD designed the methodology. BN and NJ provided help finding citizen scientists. LP collected and obtained the samples. LP collected and obtained the samples, carried out the sample processing work and the analysis, and led the writing manuscript. All authors contributed critically to the drafts and gave final approval for publication.
Funding
This project was funded by the European Social Fund (ESF) scholarship in partnership with the Scottish Funding Council and the European Regional Development Fund Investing in a Smart, Sustainable and Inclusive Future.
Conflict of Interest
The authors declare that the research was conducted in the absence of any commercial or financial relationships that could be construed as a potential conflict of interest.
Acknowledgments
We would like to thank the volunteers who helped collect the samples specifically Huiyi Zhang and Anika Grosse (ERI-UHI), Jim and Pauline Logan (local Natural History Society), Emma Baker (Islay Nature Centre), Lesley Silcock (Islay), Alasdair O’Dell, Solene Giraudeau-Potel, Julie Rostan, Fatima Gianella, Elise Depauw, and Guy Trimby (SAMS-UHI), and Jessica Gianotti (Crùbag-SAMS). We would also like to thank Hannah Grist the CoCoast project officer who helped to recruit volunteers.
References
Ambrose, K. K., Box, C., Boxall, J., Brooks, A., Eriksen, M., Fabres, J., et al. (2019). Spatial trends and drivers of marine debris accumulation on shorelines in South Eleuthera, The Bahamas using citizen science. Mar. Poll. Bull. 142, 145–154. doi: 10.1016/j.marpolbul.2019.03.036
Auta, H. S., Emenike, C. U., and Fauziah, S. H. (2017). Distribution and importance of microplastics in the marine environment: a review of the sources, fate, effects, and potential solutions. Environ. Int. 102, 165–176. doi: 10.1016/j.envint.2017.02.013
Avio, C. G., Gorbi, S., and Regoli, F. (2017). Plastics and microplastics in the oceans: from emerging pollutants to emerged threat. Mar. Environ. Res. 128, 2–11. doi: 10.1016/j.marenvres.2016.05.0120141-1136/
Barrows, A. P., Christiansen, K. S., Bode, E. T., and Hoellein, T. J. (2018). A watershed-scale, citizen science approach to quantifying microplastic concentration in a mixed land-use river. Water Res. 147, 382–392. doi: 10.1016/j.watres.2018.10.0130043-1354
Barrows, A. P., Neumann, C. A., Berger, M. L., and Shaw, S. D. (2017). Grab vs. neuston tow net: a microplastic sampling performance comparison and possible advances in the field. Analy. Methods 9, 1446–1453. doi: 10.1039/c6ay02387h
Bayas, A. C., Ford, C. K., Lawes, J. A., and Buckley, M. J. (2017). A Citizen Science Platform for Long-Term Monitoring of Microplastic Pollution in Port Phillip Bay. Australia: Port Phillip EcoCentre.
Blumenröder, J., Sechet, P., Kakkonen, J., and Hartl, M. (2017). Microplastic contamination of intertidal sediments of Scapa Flow, Orkney: a first assessment. Mar. Poll. Bull. 124, 112–120. doi: 10.1016/j.marpolbul.2017.07.009
Bonney, R., Cooper, C. B., Dickinson, J., Kelling, S., Phillips, T., Rosenberg, K. V., et al. (2009). Citizen science: a developing tool for expanding science knowledge and scientific literacy. BioScience 59, 977–984. doi: 10.1525/bio.2009.59.11.9
Borrelle, S. B., Ringma, J., Law, K. L., Monnahan, C. C., Lebreton, L., McGivern, A., et al. (2020). Predicted growth in plastic waste exceeds efforts to mitigate plastic pollution. Science 369, 1515–1518. doi: 10.1126/science.aba3656
Bosker, T., Behrens, P., and Vijver, M. G. (2017). Determining global distribution of microplastics by combining citizen science and in-depth case studies. Integr. Environ. Assess. Manag. 13, 536–541. doi: 10.1002/ieam.1908
Brander, S. M., Renick, V. C., Foley, M. M., Steele, C., Woo, M., Lusher, A., et al. (2020). Sampling and Quality Assurance and Quality Control: a Guide for Scientists Investigating the Occurrence of Microplastics Across Matrices. Appl. Spectrosc. 74, 1099–1125. doi: 10.1177/0003702820945713
Caledonian MacBrayne Ferries (2021). Timetables and Fares. Available online at: https://www.calmac.co.uk/calmac-winter-timetables (accessed January, 2020).
Capturing Our Coast (2016). Capturing our Coast: An Innovation in Marine Citizen Science. Available online at: https://www.capturingourcoast.co.uk/ (accessed November, 2017).
Car Emissions (2021). Car MPG, CO2 and emissions data. Available online at: https://car-emissions.com/cars/model/Nissan/Micra. (accessed January, 2020).
Carbery, M., MacFarlane, G. R., O’Connor, W., Afrose, S., Taylor, H., and Palanisami, T. (2020). Baseline analysis of metal (loid) s on microplastics collected from the Australian shoreline using citizen science. Mar. Pollu Bull. 152:110914. doi: 10.1016/j.marpolbul.2020.110914
Carbon Independent (2009). Ferry sources. Available online at: https://www.carbonindependent.org/sources_ferry.htm (accessed January, 2020).
Catarino, A. I., Macchia, V., Sanderson, W. G., Thompson, R. C., and Henry, T. B. (2018). Low levels of microplastics (MP) in wild mussels indicate that MP ingestion by humans is minimal compared to exposure via household fibres fallout during a meal. Environ. Poll. 237, 675–684. doi: 10.1016/j.envpol.2018.02.069
Cohn, J. P. (2008). Citizen science: can volunteers do real research? BioScience 58, 192–197. doi: 10.1641/B580303
Cole, M. (2014). The impact of microplastics on zooplankton. United Kingdon: University of Exeter & Plymouth Marine Laboratory.
Courtene-Jones, W. (2019). Microplastic pollution in the deep sea ecosystem: a study from the Rockall Trough, North East Atlantic Ocean. Ph D. thesis, United Kingdom: UHI).
Courtene-Jones, W., Quinn, B., Gary, S. F., Mogg, A. O., and Narayanaswamy, B. E. (2017). Microplastic pollution identified in deep-sea water and ingested by benthic invertebrates in the Rockall Trough. North Atlantic Ocean. Environ. Poll. 231, 271–280. doi: 10.1016/j.envpol.2017.08.026
Courtene-Jones, W., Quinn, B., Murphy, F., Gary, S. F., and Narayanaswamy, B. E. (2016). Optimisation of enzymatic digestion and validation of specimen preservation methods for the analysis of ingested microplastics. Anal. Methods 9, 1437–1445. doi: 10.1039/c6ay02343f
Crichton, E. M., Noël, M., Gies, E. A., and Ross, P. S. (2017). A novel, density-independent and FTIR-compatible approach for the rapid extraction of microplastics from aquatic sediments. Anal. Methods 9, 1419–1428. doi: 10.1039/c6ay02733d
Desforges, J.-P. W., Galbraith, M., Dangerfield, N., and Ross, P. S. (2014). Widespread distribution of microplastics in subsurface seawater in the NE Pacific Ocean. Mar. Pollut. Bull. 79, 94–99. doi: 10.1016/j.marpolbul.2013.12.035
Dhl Carbon Calculator (2021). Scenarios. Available online at: https://www.dhl-carboncalculator.com/#/home (accessed January, 2020).
Domroese, M. C., and Johnson, E. A. (2017). Why watch bees? Motivations of citizen science volunteers in the Great Pollinator Project. Biol. Conserv. 208, 40–47. doi: 10.1016/j.biocon.2016.08.020
Doyen, P., Hermabessiere, L., Dehaut, A., Himber, C., Decodts, M., Degraeve, T., et al. (2019). Occurrence and identification of microplastics in beach sediments from the Hauts-de-France region. Environ. Sci. Poll. Res. 26, 28010–28021. doi: 10.1007/s11356-019-06027-8
Eaton, D. P., Keuroghlian, A., Maria, do Carmo, A. S., Desbiez, A. L., and Sada, D. W. (2017). Citizen scientists help unravel the nature of cattle impacts on native mammals and birds visiting fruiting trees in Brazil’s southern Pantanal. Biol. Conserv. 208, 29–39. doi: 10.1016/j.biocon.2016.09.010
Eitzel, M. V., Cappadonna, J. L., Santos-Lang, C., Duerr, R. E., Virapongse, A., West, S. E., et al. (2017). Citizen science terminology matters: exploring key terms. Citiz. sci. 2:1. doi: 10.5334/cstp.96
Forrest, S. A., Holman, L., Murphy, M., and Vermaire, J. C. (2019). Citizen science sampling programs as a technique for monitoring microplastic pollution: results, lessons learned and recommendations for working with volunteers for monitoring plastic pollution in freshwater ecosystems. Environ. Monitor. Assess. 191:172. doi: 10.1007/s10661-019-7297-3
Frére, L. (2017). Les microplastiques: une menace en rade de Brest?. France: Université de Bretagne occidentale.
Frias, J., and Nash, R. (2019). Microplastics: finding a consensus on the definition. Mar. Poll. Bull. 138, 145–147. doi: 10.1016/j.marpolbul.2018.11.022
Gago, J., Galgani, F., Maes, T., and Thompson, R. C. (2016). Microplastics in Seawater: recommendations from the Marine Strategy Framework Directive Implementation Process. Front. Mar. Sci. 3:219. doi: 10.3389/fmars.2016.00219
Galgani, F., Hanke, G., and Maes, T. (2015). “Global Distribution, Composition and Abundance of Marine Litter,” in Melanie Bergmann; Lars Gutow; Michael Klages, eds Marine Anthropogenic and Litter (Berlin: Springer). doi: 10.1007/978-3-319-16510-3_2
Graca, B., Szewc, K., Zakrzewska, D., Dolega, A., and Szczerbowska-Boruchowska, M. (2017). Sources and fate of microplastics in marine and beach sediments of the Southern Baltic Sea - a preliminary study. Environ. Sci. and Poll. Res. 24, 7650–7661. doi: 10.1007/s11356-017-8419-5
Heigl, F., Kieslinger, B. P. K. T., Uhlik, J., and Dörler, D. (2019). Opinion: toward an international definition of citizen science. Proc. Natl Acad. Sci. 116, 8089–8092. doi: 10.1073/pnas.1903393116
Herrera, A., Asensio, M., Martinez, I., Santana, A., Packard, T., and Gómez, M. (2018). Microplastic and tar pollution on three Canary Islands beaches: an annual study. Mar. Pollu. Bull. 129, 494–502. doi: 10.1016/j.marpolbul.2017.10.020
Hidalgo-Ruz, V., and Thiel, M. (2013). Distribution and abundance of small plastic debris on beaches in the SE Pacific (Chile): a study supported by a citizen science project. Mar. Environ. Res. 87, 12–18. doi: 10.1016/j.marenvres.2013.02.015
Hidalgo-Ruz, V., Gutow, L., Thompson, R. C., and Thiel, M. (2012). Microplastics in the marine environment: a review of the methods used for identification and quantification. Environ. Sci. Technol. 46, 3060–3075. doi: 10.1021/es2031505
Hoellein, T. J., Westhoven, M., Lyandres, O., and Cross, J. (2015). Abundance and environmental drivers of anthropogenic litter on 5 Lake Michigan beaches: a study facilitated by citizen science data collection. J. Great Lakes Res. 41, 78–86. doi: 10.1016/j.jglr.2014.12.0150380-1330
Honorato-Zimmer, D., Kruse, K., Knickmeier, K., Weinmann, A., Hinojosa, I. A., and Thiel, M. (2019). Inter-hemispherical shoreline surveys of anthropogenic marine debris-A binational citizen science project with schoolchildren. Mar. Poll. Bull. 138, 464–473. doi: 10.1016/j.marpolbul.2018.11.048
Jambeck, J. R., and Johnsen, K. (2015). Citizen-based litter and marine debris data collection and mapping. Comput. Sci. Eng. 17, 20–26. doi: 10.1109/MCSE.2015.67
Jambeck, J. R., Geyer, R., Wilcox, C., Siegler, T. R., Perryman, M., Andrady, A., et al. (2015). Plastic waste inputs from land into the ocean. Science 347, 768–771. doi: 10.1126/science.1260352
Jamieson, A., Brooks, L., Reid, W., Piertney, S., Narayanaswamy, B., and Linley, T. (2019). Microplastics and synthetic particles ingested by deep-sea amphipods in six of the deepest marine ecosystems on Earth. R. Soc. open sci. 6:180667. doi: 10.1098/rsos.180667
Kanhai, L. D. K., Gardfeldt, K., Krumpen, T., Thompson, R. C., and O’Connor, I. (2020). Microplastics in sea ice and seawater beneath ice floes from the Arctic ocean. Sci. Rep. 10, 1–11. doi: 10.1038/s41598-020-61948-6
Kanhai, L. D. K., Officer, R., Lyashevska, O., Thompson, R. C., and O’Connor, I. (2017). Microplastic abundance, distribution and composition along a latitudinal gradient in the Atlantic Ocean. Mar. Pollut. Bull. 115, 307–314. doi: 10.1016/j.marpolbul.2016.12.025
Kelling, S., Johnston, A., Bonn, A., Fink, D., Ruiz-Gutierrez, V., Bonney, R., et al. (2019). Using semistructured surveys to improve citizen science data for monitoring biodiversity. BioScience 69, 170–179. doi: 10.1093/biosci/biz010
Kelly, A., Lannuzel, D., Rodemann, T., Meiners, K., and Auman, H. (2020). Microplastic contamination in east Antarctic sea ice. Mar. Poll. Bull. 154:111130. doi: 10.1016/j.marpolbul.2020.111130
Kumar, M., Xiong, X., He, M., Tsang, D. C., Gupta, J., Khan, E., et al. (2020). Microplastics as pollutants in agricultural soils. Environ. Poll. 265:114980. doi: 10.1016/j.envpol.2020.114980
Lassen, C., Hansen, S. F., Magnusson, K., Norén, F., Bloch Hartmann, N. I., Jensen, P. R., et al. (2015). Microplastics: occurrence, effects and sources of releases to the environment in Denmark. Denmark: Danish Environmental Protection Agency. doi: 10.1016/j.envpol.2020.114980
Li, C., Busquets, R., and Campos, L. C. (2020). Assessment of microplastics in freshwater systems: a review. Sci. Total Environ. 707:135578. doi: 10.1016/j.scitotenv.2019.135578
Li, J., Green, C., Reynolds, A., Shi, H., and Rotchell, J. M. (2018). Microplastics in mussels sampled from coastal waters and supermarkets in the United Kingdom. Environ. Poll. 241, 35–44. doi: 10.1016/j.envpol.2018.05.038
Li, J., Qu, X., Su, L., Zhang, W., Yang, D., Kolandhasamy, P., et al. (2016). Microplastics in mussels along the coastal waters of China. Environ. Poll. 214, 177–184. doi: 10.1016/j.envpol.2016.04.012
Liboiron, M., Liboiron, F., Wells, E., Richárd, N., Zahara, A., Mather, C., et al. (2016). Low plastic ingestion rate in Atlantic cod (Gadus morhua) from Newfoundland destined for human consumption collected through citizen science methods. Mar. Poll. Bull. 113, 428–437. doi: 10.1016/j.marpolbul.2016.10.043
Lots, F. A., Behrens, P., Vijver, M. G., Horton, A. A., and Bosker, T. (2017). A large-scale investigation of microplastic contamination: abundance and characteristics of microplastics in European beach sediment. Mar. Poll. Bull. 123, 219–226. doi: 10.1016/j.marpolbul.2017.08.057
Lusher, A. L. (2015). Distribution and interactions of microplastics in the North Atlantic. Germany: Springer.
Lusher, A. L., Burke, A., O’Connor, I., and Officer, R. (2014). Microplastic pollution in the Northeast Atlantic Ocean: validated and opportunistic sampling. Mar. Poll. Bull. 88, 325–333. doi: 10.1016/j.marpolbul.2014.08.023
Lusher, A. L., Welden, N. A., Sobral, P., and Cole, M. (2017). Sampling, isolating and identifying microplastics ingested by fish and invertebrates. Anal. Methods 9, 1346–1360. doi: 10.1039/c6ay02415g
Marine Scotland (2021). Marine Scotland Maps NMPI part of Scotland’s Environment. Available online at: https://marinescotland.atkinsgeospatial.com/nmpi/ (accessed November, 2017).
Marine Strategy Framework Directive (2013). Guidance on Monitoring of Marine Litter in European Seas. Europe: Publications Office of the European Union.
McEachern, K., Alegria, H., Kalagher, A. L., Hansen, C., Morrison, S., and Hastings, D. (2019). Microplastics in tampa bay, Florida: abundance and variability in estuarine waters and sediments. Mar. Pollut. Bull. 148, 97–106. doi: 10.1016/j.marpolbul.2019.07.068
McEachern, L. K. (2018). Spatial and Temporal Levels of Microplastics in Tampa Bay Surface Waters. Florida: University of South Florida St. Petersburg.
McKinley, D. C., Miller-Rushing, A. J., Ballard, H. L., Bonney, R., Brown, H., and Cook-Patton, S. C. (2017). Citizen science can improve conservation science, natural resource management, and environmental protection. Biol. Conserv. 208, 15–28.
Meijer, L. J. J., van Emmerik, T., Lebreton, L., Schmidt, C., and van der Ent, R. (2019). Over 1000 rivers accountable for 80\% of global riverine plastic emissions into the ocean. Riverine Plastic Debris Transport. Lund Sweden: EGU General Assembly. doi: 10.31223/osf.io/zjgty
Meyer, F. (2015). Marine Microplastic Pollution Present on Northern Scottish and Orkney Island Beaches and its Affinity for Heavy Metals. Master’s thesis. London: Environmental Research Institute (ERI).
Moore, C. J., Moore, S. L., Weisberg, S. B., Lattin, G. L., and Zellers, A. F. (2002). A comparison of neustonic plastic and zooplankton abundance in southern California’s coastal waters. Mar. Poll. Bull. 44, 1035–1038. doi: 10.1016/S0025-326X(02)00150-9
Murphy, F., Ewins, C., Carbonnier, F., and Quinn, B. (2016). Wastewater treatment works (WwTW) as a source of microplastics in the aquatic environment. Environ. Sci. Technol. 50, 5800–5808. doi: 10.1021/acs.est.5b05416
Nel, H. A., Smith, G. H. S., Harmer, R., Sykes, R., Schneidewind, U., Lynch, I., et al. (2020). Citizen science reveals microplastic hotspots within tidal estuaries and the remote Scilly Islands. U. K.. Mar. Poll. Bull. 161:111776. doi: 10.1016/j.marpolbul.2020.111776
Nelms, S., Coombes, C., Foster, L., Galloway, T., Godley, B., Lindeque, P., et al. (2017). Marine anthropogenic litter on British beaches: a 10-year nationwide assessment using citizen science data. Sci. Total Environ. 579, 1399–1409. doi: 10.1016/j.scitotenv.2016.11.1370048-9697/
Petrol prices. UK (2008). Available online at: https://www.confused.com/on-the-road/petrol-prices (accessed January, 2020).
Phuong, N. N., Poirier, L., Pham, Q. T., Lagarde, F., and Zalouk-Vergnoux, A. (2017). Factors influencing the microplastic contamination of bivalves from the French Atlantic coast: location, season and/or mode of life? Mar. Poll. Bull. 129, 664–674. doi: 10.1016/j.marpolbul.2017.10.054
Pocock, M. J., Roy, H. E., Fox, R., Ellis, W. N., and Botham, M. (2017). Citizen science and invasive alien species: predicting the detection of the oak processionary moth Thaumetopoea processionea by moth recorders. Biol. Conserv. 208, 146–154. doi: 10.1016/j.biocon.2016.04.010
Prata, J. C., Da Costa, J. P., Duarte, A. C., and Rocha-Santos, T. (2019). Methods for sampling and detection of microplastics in water and sediment: a critical review. TrAC Trends Anal. Chem. 110, 150–159. doi: 10.1016/j.trac.2018.10.029
Prata, J. C., Manana, M. J., da Costa, J. P., Duarte, A. C., and Rocha-Santos, T. (2020). What Is the Minimum Volume of Sample to Find Small Microplastics: laboratory Experiments and Sampling of Aveiro Lagoon and Vouga River. Portugal. Water 12:1219. doi: 10.3390/w12051219
Qiu, Q., Peng, J., Yu, X., Chen, F., Wang, J., and Dong, F. (2015). Occurrence of microplastics in the coastal marine environment: first observation on sediment of China. Mar. Poll. Bull. 98, 274–280. doi: 10.1016/j.marpolbul.2015.07.028
Rezania, S., Park, J., Din, M. F. M., Taib, S. M., Talaiekhozani, A., Yadav, K. K., et al. (2018). Microplastics pollution in different aquatic environments and biota: a review of recent studies. Mar. Poll. Bull. 133, 191–208. doi: 10.1016/j.marpolbul.2018.05.022Received
Rochman, C. M., Brookson, C., Bikker, J., Djuric, N., Earn, A., Bucci, K., et al. (2019). Rethinking microplastics as a diverse contaminant suite. Environ. Toxicol. Chem. 38, 703–711. doi: 10.1002/etc.4371
Sanders, D., and Brandes, J. (2020). Helping the Public Understand the Microplastics Issue: integrating Citizen Science Techniques and Hands-On Education Experiences with Ongoing Microplastics Research. Curr. J. Mar. Edu. 34, 1–8. doi: 10.5334/cjme.53
Sarker, A., Deepo, D. M., Nandi, R., Rana, J., Islam, S., Rahman, S., et al. (2020). A review of microplastics pollution in the soil and terrestrial ecosystems: a global and Bangladesh perspective. Sci. Total Environ. 733:139296. doi: 10.1016/j.scitotenv.2020.139296
Schell, T., Rico, A., and Vighi, M. (2020). Occurrence, fate and fluxes of plastics and microplastics in terrestrial and freshwater ecosystems. Rev. Environ. Contam. Toxicol. 250, 1–43. doi: 10.1007/398_2019_40
Song, Y. K., Hong, S. H., Eo, S., Jang, Mi, Han, G. M., and Isobe, Atsuhiko, et al. (2018). Horizontal and Vertical Distribution of Microplastics in Korean Coastal Waters. Environ. Sci. Technol. 52, 12188–12197. doi: 10.1021/acs.est.8b04032
Stolte, A., Forster, S., Gerdts, G., and Schubert, H. (2015). Microplastic concentrations in beach sediments along the German Baltic coast. Mar. Poll. Bull. 99, 216–229. doi: 10.1016/j.marpolbul.2015.07.022
Svåsand, T., Crosetti, D., Garcia-Vázquez, E., and Verspoor, E. (2007). Genetic Impact of Aquaculture Activities on native populations. Genimpact final scientific report. (EU contract n. RICA-CT-2005-022802). URL: http://genimpact.imr.no/compendium
Syakti, A. D., Bouhroum, R., Hidayati, N. V., Koenawan, C. J., Boulkamh, A., Sulistyo, I., et al. (2017). Beach macro-litter monitoring and floating microplastic in a coastal area of Indonesia. Mar. Poll. Bull. 122, 217–225. doi: 10.1016/j.marpolbul.2017.06.046
Szymanska, M., and Obolewski, K. (2020). Microplastics as contaminants in freshwater environments: a multidisciplinary review. Ecohydrol. Hydrobiol. 20:2020. doi: 10.1016/j.ecohyd.2020.05.001
Thompson, R. C. (2015). “Microplastics in the Marine Environment: sources, Consequences and Solutions”, in Marine Anthropogenic Litter. ed. Melanie, B., Lars, G., Michael, K., (Springer: Germany). doi: 10.1007/978-3-319-16510-3_7.
Thompson, R. C., and Napper, I. E. (2018). Microplastics in the Environment. Plastics and the Environment. United Kingdom: Issues in Environmental Science and Technology. doi: 10.1039/9781788013314-00060
True Random Number Service (1998) Available online at: https://www.random.org/ (accessed November, 2017).
Van der Velde, T., Milton, D. A., Lawson, T., Wilcox, C., Lansdell, M., Davis, G., et al. (2017). Comparison of marine debris data collected by researchers and citizen scientists: is citizen science data worth the effort? Biol. Conserv. 208, 127–138. doi: 10.1016/j.biocon.2016.05.0250006-3207
Vermaire, J. C., Pomeroy, C., Herczegh, S. M., Haggart, O., and Murphy, M. (2017). Microplastic abundance and distribution in the open water and sediment of the Ottawa River. Canada, and its tributaries. Facets 2, 301–314. doi: 10.1139/facets-2016-0070
Waters, C. N., Zalasiewicz, J., Summerhayes, C., Barnosky, A. D., Poirier, C., Galuszka, A., et al. (2016). The Anthropocene is functionally and stratigraphically distinct from the Holocene. Science 351:aad2622. doi: 10.1126/science.aad2622
Welvaert, M., and Caley, P. (2016). Citizen surveillance for environmental monitoring: combining the efforts of citizen science and crowdsourcing in a quantitative data framework. Springerplus 5:1890. doi: 10.1186/s40064-016-3583-5
Wiggins, A., and Crowston, K. (2011). “From conservation to crowdsourcing: a typology of citizen science” in 44th Hawaii International Conference on System Sciences. (United states: IEEE). doi: 10.1109/HICSS.2011.207
Yu, X., Ladewig, S., Bao, S., Toline, C. A., Whitmire, S., and Chow, A. T. (2018). Occurrence and distribution of microplastics at selected coastal sites along the southeastern United States. Sci. Total Environ. 613–614, 298–305. doi: 10.1016/j.scitotenv.2017.09.100
Zettler, E., Takada, H., Monteleone, B., Mallos, N., Eriksen, M., and Amaral-Zettler, L. (2017). Incorporating citizen science to study plastics in the environment. Anal. Methods 9, 1392–1403. doi: 10.1039/c6ay02716d
Zhang, H. (2017). Transport of microplastics in coastal seas. Estuar. Coast. Shelf Sci. 199, 74–86. doi: 10.1016/j.ecss.2017.09.0320272-7714
Zhao, S., Zhu, L., and Li, D. (2015). Microplastic in three urban estuaries. China. Environ. Poll. 206, 597–604. doi: 10.1016/j.envpol.2015.08.027
Keywords: citizen science, microplastics, mussels, sampling, sediments, tool-kit, surface waters
Citation: Paradinas LM, James NA, Quinn B, Dale A and Narayanaswamy BE (2021) A New Collection Tool-Kit to Sample Microplastics From the Marine Environment (Sediment, Seawater, and Biota) Using Citizen Science. Front. Mar. Sci. 8:657709. doi: 10.3389/fmars.2021.657709
Received: 23 January 2021; Accepted: 05 May 2021;
Published: 04 June 2021.
Edited by:
Alex de Sherbinin, Columbia University, United StatesReviewed by:
Huang Wei, Second Institute of Oceanography, Ministry of Natural Resources, ChinaTieyu Wang, Shantou University, China
Copyright © 2021 Paradinas, James, Quinn, Dale and Narayanaswamy. This is an open-access article distributed under the terms of the Creative Commons Attribution License (CC BY). The use, distribution or reproduction in other forums is permitted, provided the original author(s) and the copyright owner(s) are credited and that the original publication in this journal is cited, in accordance with accepted academic practice. No use, distribution or reproduction is permitted which does not comply with these terms.
*Correspondence: Lola M. Paradinas, TG9sYS5QYXJhZGluYXNAc2Ftcy5hYy51aw==