Abstract
Plastic is the most abundant type of marine litter and it is found in all of the world’s oceans and seas, even in remote areas far from human activities. It is a major concern because plastics remain in the oceans for a long time. To address questions that are of great interest to the international community as it seeks to attend to the major sources of marine plastics in the ocean, we use particle tracking simulations to simulate the motions of mismanaged plastic waste and provide a quantitative global estimate of (1) where does the marine litter released into the ocean by a given country go and (2) where does the marine litter found on the coastline of a given country come from. The overall distribution of the modeled marine litter is in good agreement with the limited observations that we have at our disposal and our results illustrate how countries that are far apart are connected via a complex web of ocean pathways (see interactive website https://marinelitter.coaps.fsu.edu). The tables summarizing the statistics for all world countries are accessible from the supplemental information in .pdf or .csv formats.
Introduction
Plastic is the most abundant type of marine litter and its presence in the environment is a major concern because it remains in the oceans for a long time, affecting marine life and threatening human health (Landrigan et al., 2020). Steady growth in the amount of discarded solid waste since the 1950s combined with the slow degradation rate of many waste items are gradually increasing the amount of marine litter found at sea, on the seafloor, and along the coastal shores. Surveys and monitoring efforts have yet to show a consistent temporal trend everywhere (Galgani et al., 2021), but the distribution and accumulation have become an economic, environmental, human health, and aesthetic problem that presents a complex and multi-dimensional challenge. Marine litter results from human behavior, whether accidental or intentional. According to the United Nations Environment Programme (UNEP), eighty percent of the marine litter originates from land sources including waste released from dumpsites near the coast or river banks, the littering of beaches, tourism and recreational use on the coasts, fishing industry activities, and ship-breaking yards. The primary sea-based sources include abandoned, lost, or discarded fishing gear, shipping activities, as well as legal and illegal dumping. In the global context, understanding of marine litter as a persistent and growing problem has become clear. The United Nations Environment Assembly (UNEA) has recognized marine litter as one of its top priorities through four resolutions (from UNEA-1 in 2014, UNEA-2 in 2016, UNEA-3 in 2017, and UNEA-4 in 2019), specifically calling for actions to combat marine litter1.
Litter is found in all of the world’s oceans and seas, even in remote areas far from human activities (Tekman et al., 2017; Chiba et al., 2018). Thus, tracking the movement of plastic litter in the ocean is crucial. Ocean currents control the distribution and accumulation of floating marine debris, but observational data are very sparse and it is difficult to analyze and predict the movement of debris (van Sebille et al., 2020). Factors that determine the transport and fate of debris include its size and buoyancy. Marine plastics are classified as either macro, micro, or nano. A macro plastic is the largest of the three classifications and consists of plastic that can be easily seen with the naked eye. Examples include plastic bags, water bottles, and fishing nets. The next classification of plastic is micro plastics, which are generally considered to be one to five millimeters in length (Thompson et al., 2004). Primarily we see micro plastics in the form of plastic pellets, which are the building blocks of plastic. Secondary micro plastics are formed as macro plastics break down from exposure to sunlight, temperature, wave and salt. Micro plastics can easily be incorporated into the food chain, and, because of this, have become the main focus of environmental conversation. Finally, nano plastics are a byproduct of micro plastics as they degrade. They can be as small as 1 μm (micrometer) and, due to their extremely small size, it is possible for Nano plastics to enter the food chain. While there is much to be learned about nano plastics, it is known that they pose a significant threat to the environment and humankind (see Special issue on Nanoplastic, 2019).
In 2016, the global production of plastics was approximately 330 million metric tons (Mt; Plastics Europe, 2017) and that amount is estimated to double within the next 20 years (Lebreton and Andrady, 2019). Plastics are usually divided into three categories: plastics in use, post-consumer managed plastic waste, and mismanaged plastic waste (Geyer et al., 2017). Mismanaged plastic waste (MPW) is defined as plastic material littered, ill-disposed, or from uncontrolled landfills. Plastic debris enters the sea from the coastal environment through runoff, winds, and gravity (Jambeck et al., 2015) and via rivers (Lebreton et al., 2017). There are, however, few direct measurements of plastic entering the ocean and one has to rely on conceptual frameworks (Jambeck et al., 2015; Lebreton et al., 2017; Schmidt et al., 2017; Lebreton and Andrady, 2019) to compute, from the best available data, an order-of-magnitude estimate of the amount of MPW entering the world ocean. This lack of data on waste generation, characterization, collection, and disposal, especially outside of urban centers, leads to uncertainties (Jambeck et al., 2015).
Most of our understanding on the motion of floating marine debris comes from numerical simulations (Hardesty et al., 2017; van Sebille et al., 2020). Given the scarcity of observational data, numerical models can be used to simulate the motions of debris and test scenarios. In this paper, we use particle tracking simulations to address questions that are of tremendous interest to the United Nations and the international community as they seek to track, identify, and eventually attend to the major sources of marine plastics in the ocean. The questions we address in this paper are:
-
1.
Where does MPW released into the ocean by a given country go?
-
2.
Where does MPW found on the coastline of a given country come from?
The layout of this paper is as follows: In section “Methods”, we describe the numerical model, summarize the uncertainties associated with the marine litter sources, and introduce the seeding strategy, wind effects, parameterized unresolved processes, and decay scenarios. The results are presented in section “Results”. The last section provides a summary and discusses the limitations of the current model.
Methods
Model Description
The global framework we use to track marine litter is OceanParcels v2.1.5, which can create customizable particle tracking simulations using outputs from ocean circulation models. OceanParcels v2.1.5 is a state-of-the-art Lagrangian ocean analysis tool designed to combine (1) wide flexibility to model particles of different natures and (2) efficient implementation in accordance with modern computing infrastructure. The latest version includes a set of interpolation schemes that can read various types of discretized fields, from rectilinear to curvilinear grids in the horizontal direction, from z- to s- levels in the vertical and different variable distributions such as the Arakawa’s A-, B- and C- grids (Delandmeter and van Sebille, 2019).
The ocean circulation model outputs used in OceanParcels are from the GOFS3.1, a global ocean reanalysis based on the HYbrid Coordinate Ocean Model (HYCOM) and the Navy Coupled Ocean Data Assimilation (NCODA; Chassignet et al., 2009; Metzger et al., 2014). NCODA uses a three-dimensional (3D) variational scheme and assimilates available satellite altimeter observations, satellite, and in-situ sea surface temperature as well as in-situ vertical temperature and salinity profiles from Expendable Bathythermographs (XBTs), Argo floats, and moored buoys (Cummings and Smedstad, 2013). Surface information is projected downward into the water column using Improved Synthetic Ocean Profiles (Helber et al., 2013). The horizontal resolution and the frequency for the GOF3.1 outputs are 1/12° (8 km at the equator, 6 km at mid-latitudes) and 3-hourly, respectively. For details on the ocean circulation model validation, the reader is referred to Metzger et al. (2017).
Marine Litter Sources
Plastic debris in the ocean is usually assumed to be from land-based sources, although some studies have suggested that sea-based sources also play an important role (e.g., Bergmann et al., 2017; Lebreton et al., 2018). No matter the source, the primary challenge of modeling the global displacement of marine litter are the large uncertainties associated with the amount and location of mismanaged plastic waste (MPW) entering the ocean. In this paper, we consider only the land-based sources. In order to derive meaningful information from the numerical simulation and address the above questions, one needs to be able to seed the model with plastic waste entering the ocean that is representative of each country and have been computed in a consistent manner globally. At the present time, there are four studies that can provide a first-order estimate of the current global plastic waste input from land into the ocean: Jambeck et al. (2015), Lebreton et al. (2017), Schmidt et al. (2017), and Lebreton and Andrady (2019). However, these studies all differ in their estimates of MPW input into the ocean.
Starting with the earlier study by Jambeck et al. (2015) for the coastal environment, the authors estimated an annual input of plastic to the ocean by taking into account (1) the mass of the waste generated per capita annually, (2) the percentage of waste that is plastic, and (3) the percentage of waste that is mismanaged and thus has the potential to enter the ocean. The calculation is based on a 2010 World Bank dataset (Hoornweg and Bhada-Tata, 2012) on country-specific waste generation and management. Jambeck et al. (2015) estimated that ∼11% of the 2.5 billion metric tons (t) total solid waste generated by the 6.4 billion people living in 192 coastal countries (i.e., 275 million metric tons [Mt]) is plastic and, scaling by the population living within 50 km of the coast, they calculated that 99.5 Mt of plastic waste was generated in the coastal regions. Mismanaged waste is defined as material that is either littered or inadequately disposed of, meaning that it is not formally managed. This includes disposal in dumps or open, uncontrolled landfills, where waste is not fully contained. Mismanaged waste can eventually enter the ocean via inland waterways, wastewater outflows, and transport by wind or tides. Jambeck et al. (2015) estimated that, in 2010, 31.9 Mt were mismanaged and that between 4.8 and 12.7 Mt (15–40%) made it to the ocean (1.7–4.6% of the total plastic waste). Assuming no improvements to the waste management infrastructure, the cumulative quantity of plastic waste available to enter the marine environment from land was predicted to increase by an order of magnitude by 2025.
Plastics in the coastal areas usually enter the ocean via direct littering that is moved offshore by the wind and/or tidal currents. But plastics can also enter via rivers. Lebreton et al. (2017) estimated between 0.36 and 0.89 Mt per year enter via river transport in the coastal area (about 3−19% of the total MPW 4.8−12.7 Mt of Jambeck et al. (2015)). In addition, they estimate at least 0.8 to 1.5 Mt per year reach the oceans from inland areas via rivers. Schmidt et al. (2017) independently derived a total MPW carried in the global river system to the ocean of between.5 and 2.7 Mt, which supports the estimates of Lebreton et al. (2017), i.e., between 1.1 and 2.4 Mt. The spatial distribution of the Schmidt et al. (2017) data is qualitatively similar to those of Jambeck et al. (2015), but the fraction contributed by the larger rivers is considerably higher.
Finally, Lebreton and Andrady (2019) present projections of global MPW generation at ∼1 km resolution from 2015 to 2060. They estimate that between 60 and 99 Mt of MPW were produced globally in 2015 (see the 2015 annual distribution of MPWs from coastal regions in Figure 1A) and that this figure could triple by 2060. One of the main motivations for that study was to quantify the fraction of MPW generated in coastal areas against the fraction generated inland that may reach the oceans via rivers (see river distribution in Figure 1B). Following Jambeck et al.’s (2015) framework and using their fine-resolution global distribution of MPW, Lebreton and Andrady (2019) estimated a total of 20.5 Mt of MPW generated from the coastal population in 2010. This value converted to an annual global input of MPW to the ocean from the coastal regions to be between 3.1 and 8.2 Mt is slightly lower than the 4.8 to 12.7 Mt estimate of Jambeck et al. (2015). However, as stated earlier, estimating MPW associated with the population within a fixed distance from the coast (50 km, as in Jambeck et al. (2015)) does not take into account MPW generated inland and transported by rivers. Given the fine granularity of their data, Lebreton and Andrady (2019) were able to estimate that, for 2015, approximately 5% of MPW was discarded directly into small watersheds near the coastline, that 4% was discarded in proximity of the coastline in medium watersheds, and that the majority (91%) was discarded in large watersheds away from the coastline. Therefore, as shown by Lebreton et al. (2017) and Schmidt et al. (2017), the large rivers are a major source of plastic waste from inland to the ocean and should not be neglected.
FIGURE 1
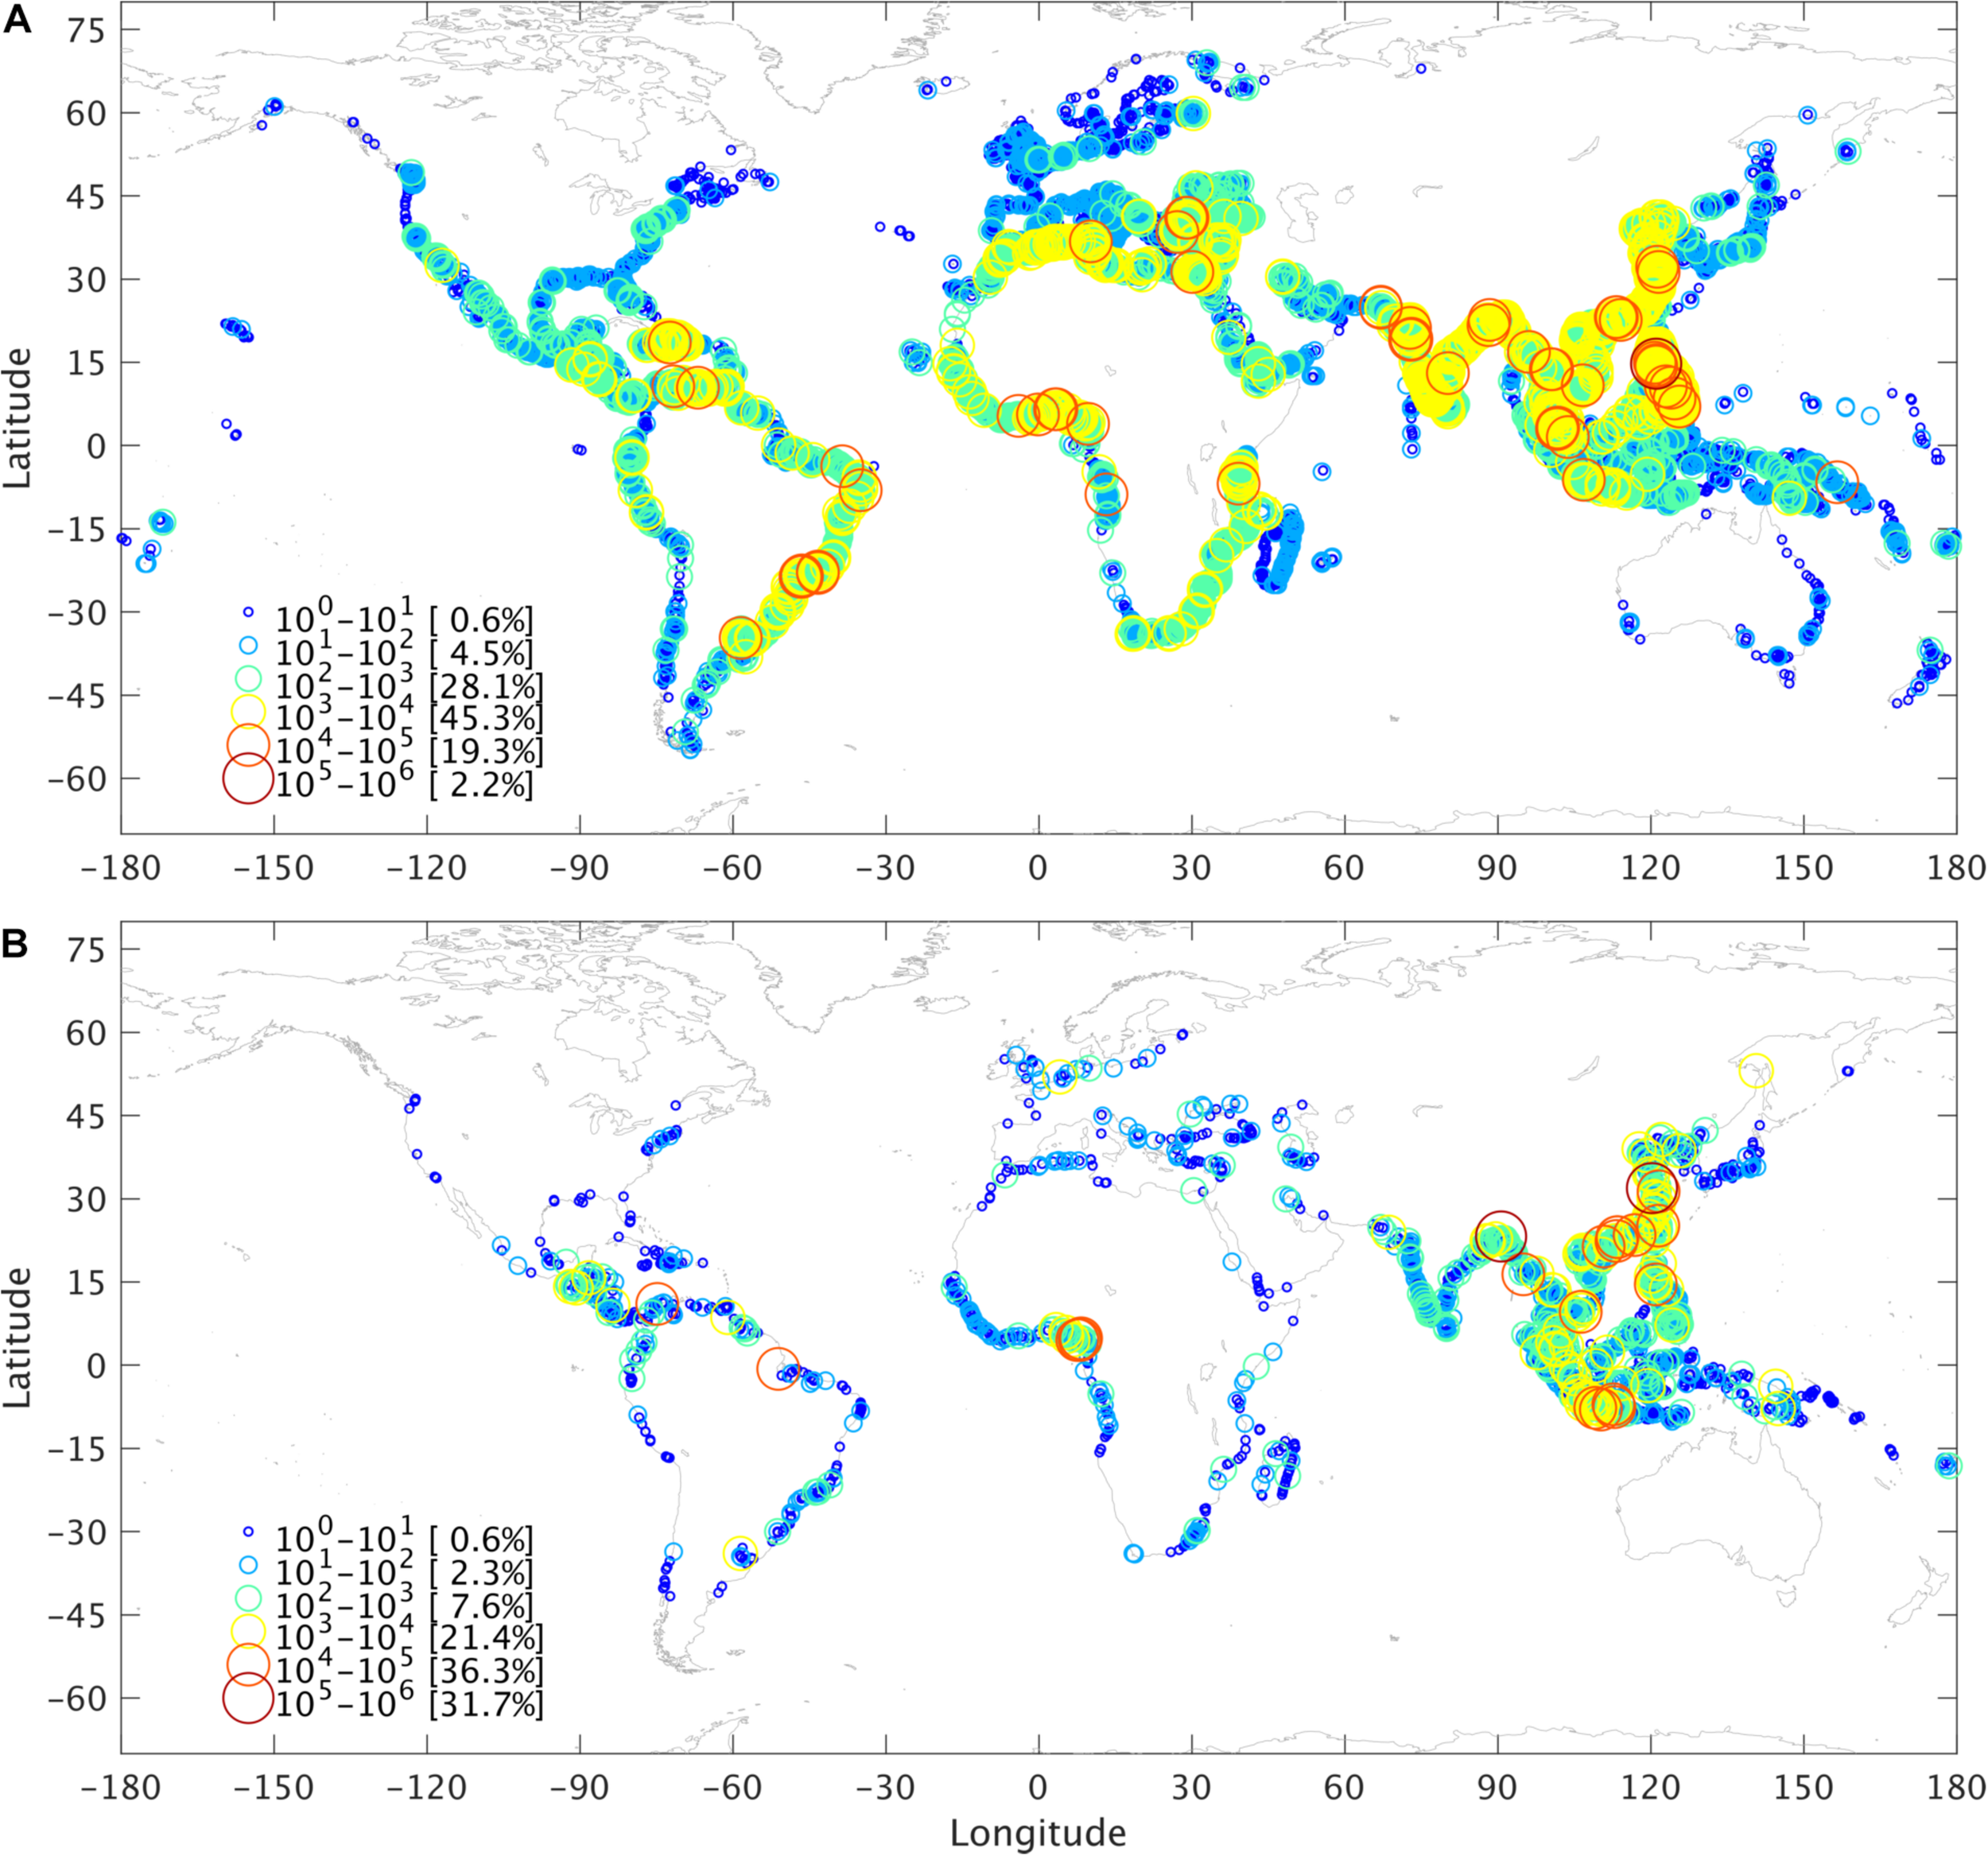
Distribution of the annual mismanaged plastic waste input from (A) the coastal regions (50 km from the coastline) based on Lebreton and Andrady (2019) and (B) the inland regions through rivers based on Lebreton et al. (2017). Blue to red circles with increasing size represent mismanaged plastic waste of different order of weights (in tons/year) and their percentage values with respect to the total (∼5.1 Million tons/year for the coastal regions and ∼1.4 Million tons/year for the inland regions).
In summary, while the four studies provide different estimates of MPW reaching the ocean, they are consistent. As indicated by Schmidt et al. (2017), this is not too surprising because they all start from the same waste database and use similar conceptual frameworks. There are, of course, large uncertainties associated with the numbers provided by the above studies, but they provide a globally consistent database that can be used to seed our model. For this study, we derived MPW inputs for the model using Lebreton and Andrady (2019) for the coastal regions (within 50 km from the coastline; Figure 1A; Lebreton et al. (2017) for the inland regions via rivers (Figure 1B). It is important to note that a large portion of the MPW (∼40% according to Andrady (2011)) that reach the ocean are denser than seawater and thus will sink to the ocean floor near the coast instead of being carried away by the surface currents and/or wind.
Seeding Strategy, Stokes Drift, Wind Drag, Random Walk, and Decay Scenarios
As laid out in section “Marine Litter Sources”, we divide the global MPW inputs in the world ocean into two categories: (1) direct input from coastal regions, defined as within 50 km of the coastline; and (2) indirect input from inland regions via rivers. For direct input (Figure 1A), we use MPW computed from the global database on a 30 × 30 arc seconds grid of Lebreton and Andrady (2019). The MPWs from within 50 km from the coastline are summed (in ton/year) on a 1/4°×1/4° grid and, as in Jambeck et al. (2015), we assume that only 25% of MPW enters the world ocean. We neglect contributions that are less than 10 tons/year (∼0.6% of the total direct MPW) and the number of particles that are released on each grid cell is as follows: one particle is released in each month for cells that have MPW in the 10-102 ton/year range, three particles each month for cells with 102-103 tons/year; 32 for 103-104 tons/year; 33 for 104-105 tons/year; 34 for 105−106 tons/year, etc. In total, we release 28,713 particles each month along the coastline representing the 5.1 million tons of MPW that enters the ocean per year. For the indirect input (Figure 1B), we use the midpoint estimates for the global river catchments assembled by Lebreton et al. (2017). As for the direct MPW input, we neglect contributions by rivers that are less than 10 ton/year (∼0.6% of total indirect MPW). In total, we release 3,587 particles each month at the river mouth, representing the 1.4 million tons of MPW that enters the ocean per year. More than two-thirds of MPW (in terms of weight) enters via 21 rivers, mostly from South and East Asia.
For a review of the physical oceanography associated with the transport of floating marine plastics and of all the processes that affect transport, the reader is referred to van Sebille et al. (2020). In short, the particles are moved around by ocean currents, surface wave induced Stokes drift, and wind drag. As described in section “Model Description”, the ocean surface currents used in this study are from GOFS3.1, a global ocean forecast system (Chassignet et al., 2009; Metzger et al., 2014) based on the HYbrid Coordinate Ocean Model (HYCOM) and the Navy Coupled Ocean Data Assimilation (NCODA). The Ekman transport resulting from the atmospheric forcing (Fleet Numerical Meteorology and Oceanography Center 3-hourly NAVY Global Environmental Model, NAVGEM) is included in the ocean surface currents. All simulations include a small random walk component with a uniform horizontal turbulent diffusion coefficient Kh = 1 m2s–1 representing unresolved turbulent motions in the ocean.
A full account of the Stokes drift, which is induced by surface gravity waves in the direction of wave propagation (see review by van den Bremer and Breivik (2018), for detail), would require an accurate wave model. However, the wave-induced Stokes drift can be assumed to act in the same direction of the wind (e.g., Kinsman, 1965; Kubota, 1994; Breivik et al., 2011) and the joint effect of wind and wave on a particle can be expressed as a single drag coefficient. Pereiro et al. (2018), using observed data from 23 drifters together with wind and ocean current data, suggested a wind drag coefficient that ranges from 0.5 to 1.2%. This is in agreement with Ardhuin et al. (2009), who estimated the magnitude of the wave-induced contribution by the Stokes drift to be ∼0.6−1.3% of the wind speed in the wind direction. The magnitude of the contribution does depend on the buoyancy ratio of the plastic object and the sea water, i.e., lighter objects correspond to higher coefficients (Chubarenko et al., 2016). Because detailed information on different types of MPW entering the global ocean is not available, this study adopts a drag coefficient of 1%, as in Kubota (1994), to represent the combined effect of wind and waves. All particles are advected with a fourth-order Runge-Kutta scheme using a one-hour time step.
One additional factor that needs to be taken into account when modeling MPW is the time it takes for plastics to break down into smaller pieces under the combined actions of waves and effects of sunlight. These micro or nano plastics end up either in suspension in the water column (e.g., Kukulka et al., 2012), sinking to the bottom (e.g., Thompson et al., 2004; Woodall et al., 2014; Barrett et al., 2020), ingested and entangled by marine organisms (e.g., Moore et al., 2001), or decomposed (Kimukai et al., 2020). To account for those complex processes that ultimately lead to the removal of the MPW from the sea surface (where the abundance of the MPW is observed and the movement of MPW is simulated), we apply a simple, hypothetical exponential decay function to the weight (mass)
in which t is time (in years), W(0) is the MPW weight released into the ocean, and t_0 represents an e-folding time scale. After experimentation and comparison to observations (see discussion in next section), we adopted an e-folding time scale of five years. This implies that 36.8% of the MPW weight would remain at the surface after five years (13.5% after 10 years).
Results
Following the seeding strategy for MPW described in section “Seeding Strategy, Stokes Drift, Wind Drag, Random Walk, and Decay Scenarios”, we release 32,300 particles (28,713 for coastal inputs and 3,587 for inland inputs via rivers) every month from 2010 to 2019 along the global coastline. These particles represent a total of 3.9 Mt of lighter-than-water MPW per year (3.0 Mt coastal and 0.9 Mt inland) released into the ocean. After release, using OceanParcels v2.1.5 (see section “Model Description”), the particles are advected by the ocean currents (with a small uniform random walk component to account for unresolved turbulent motions) and the joint effect of wind and wave (1% drag). All particles are integrated from the release point in 2010 to the end of 2019. The results presented in this section therefore correspond to a 10-year accumulation of MPW in the ocean. We first describe the MPW concentration at sea and on the beach, and then provide statistics for each country on MPW destinations and beached MPW sources.
Partition Between Beached Versus at Sea MPW
Here we consider a MPW particle to be “beached” if the sum of daily displacements in the last 30 days of the integration of a particle on the coast or inland is less than a constant threshold distance. Beaching only occurs in the model because of the wind and waves induced motions and random walk/diffusion. Figure 2 displays the number of particles in 1 × 1° grid boxes that are beached versus those that remain at sea at the end of the 2010-2019 accumulation period. Of the MPW released during 2010–2019, 75.4% end up beached (Figure 2A), whereas 25.5% of the MPW remains at sea (Figure 2B). This partition between beached and at sea MPW is not very sensitive to the individual year, except for 2019, during which the percentage of in-water MPW mass is higher (44%) because the integration is too short for some of the MPW particles to reach to the shore. Thus, the estimate of ∼3/4 of beached MPW and ∼1/4 remaining at sea is robust and is in reasonable agreement with the recent study of Chenillat et al. (2021). Not surprisingly, we find that the wind and waves induced motions are primarily responsible for the beaching (Dobler et al., 2019) and that the impact of the random walk/diffusion on beaching is quite small.
FIGURE 2
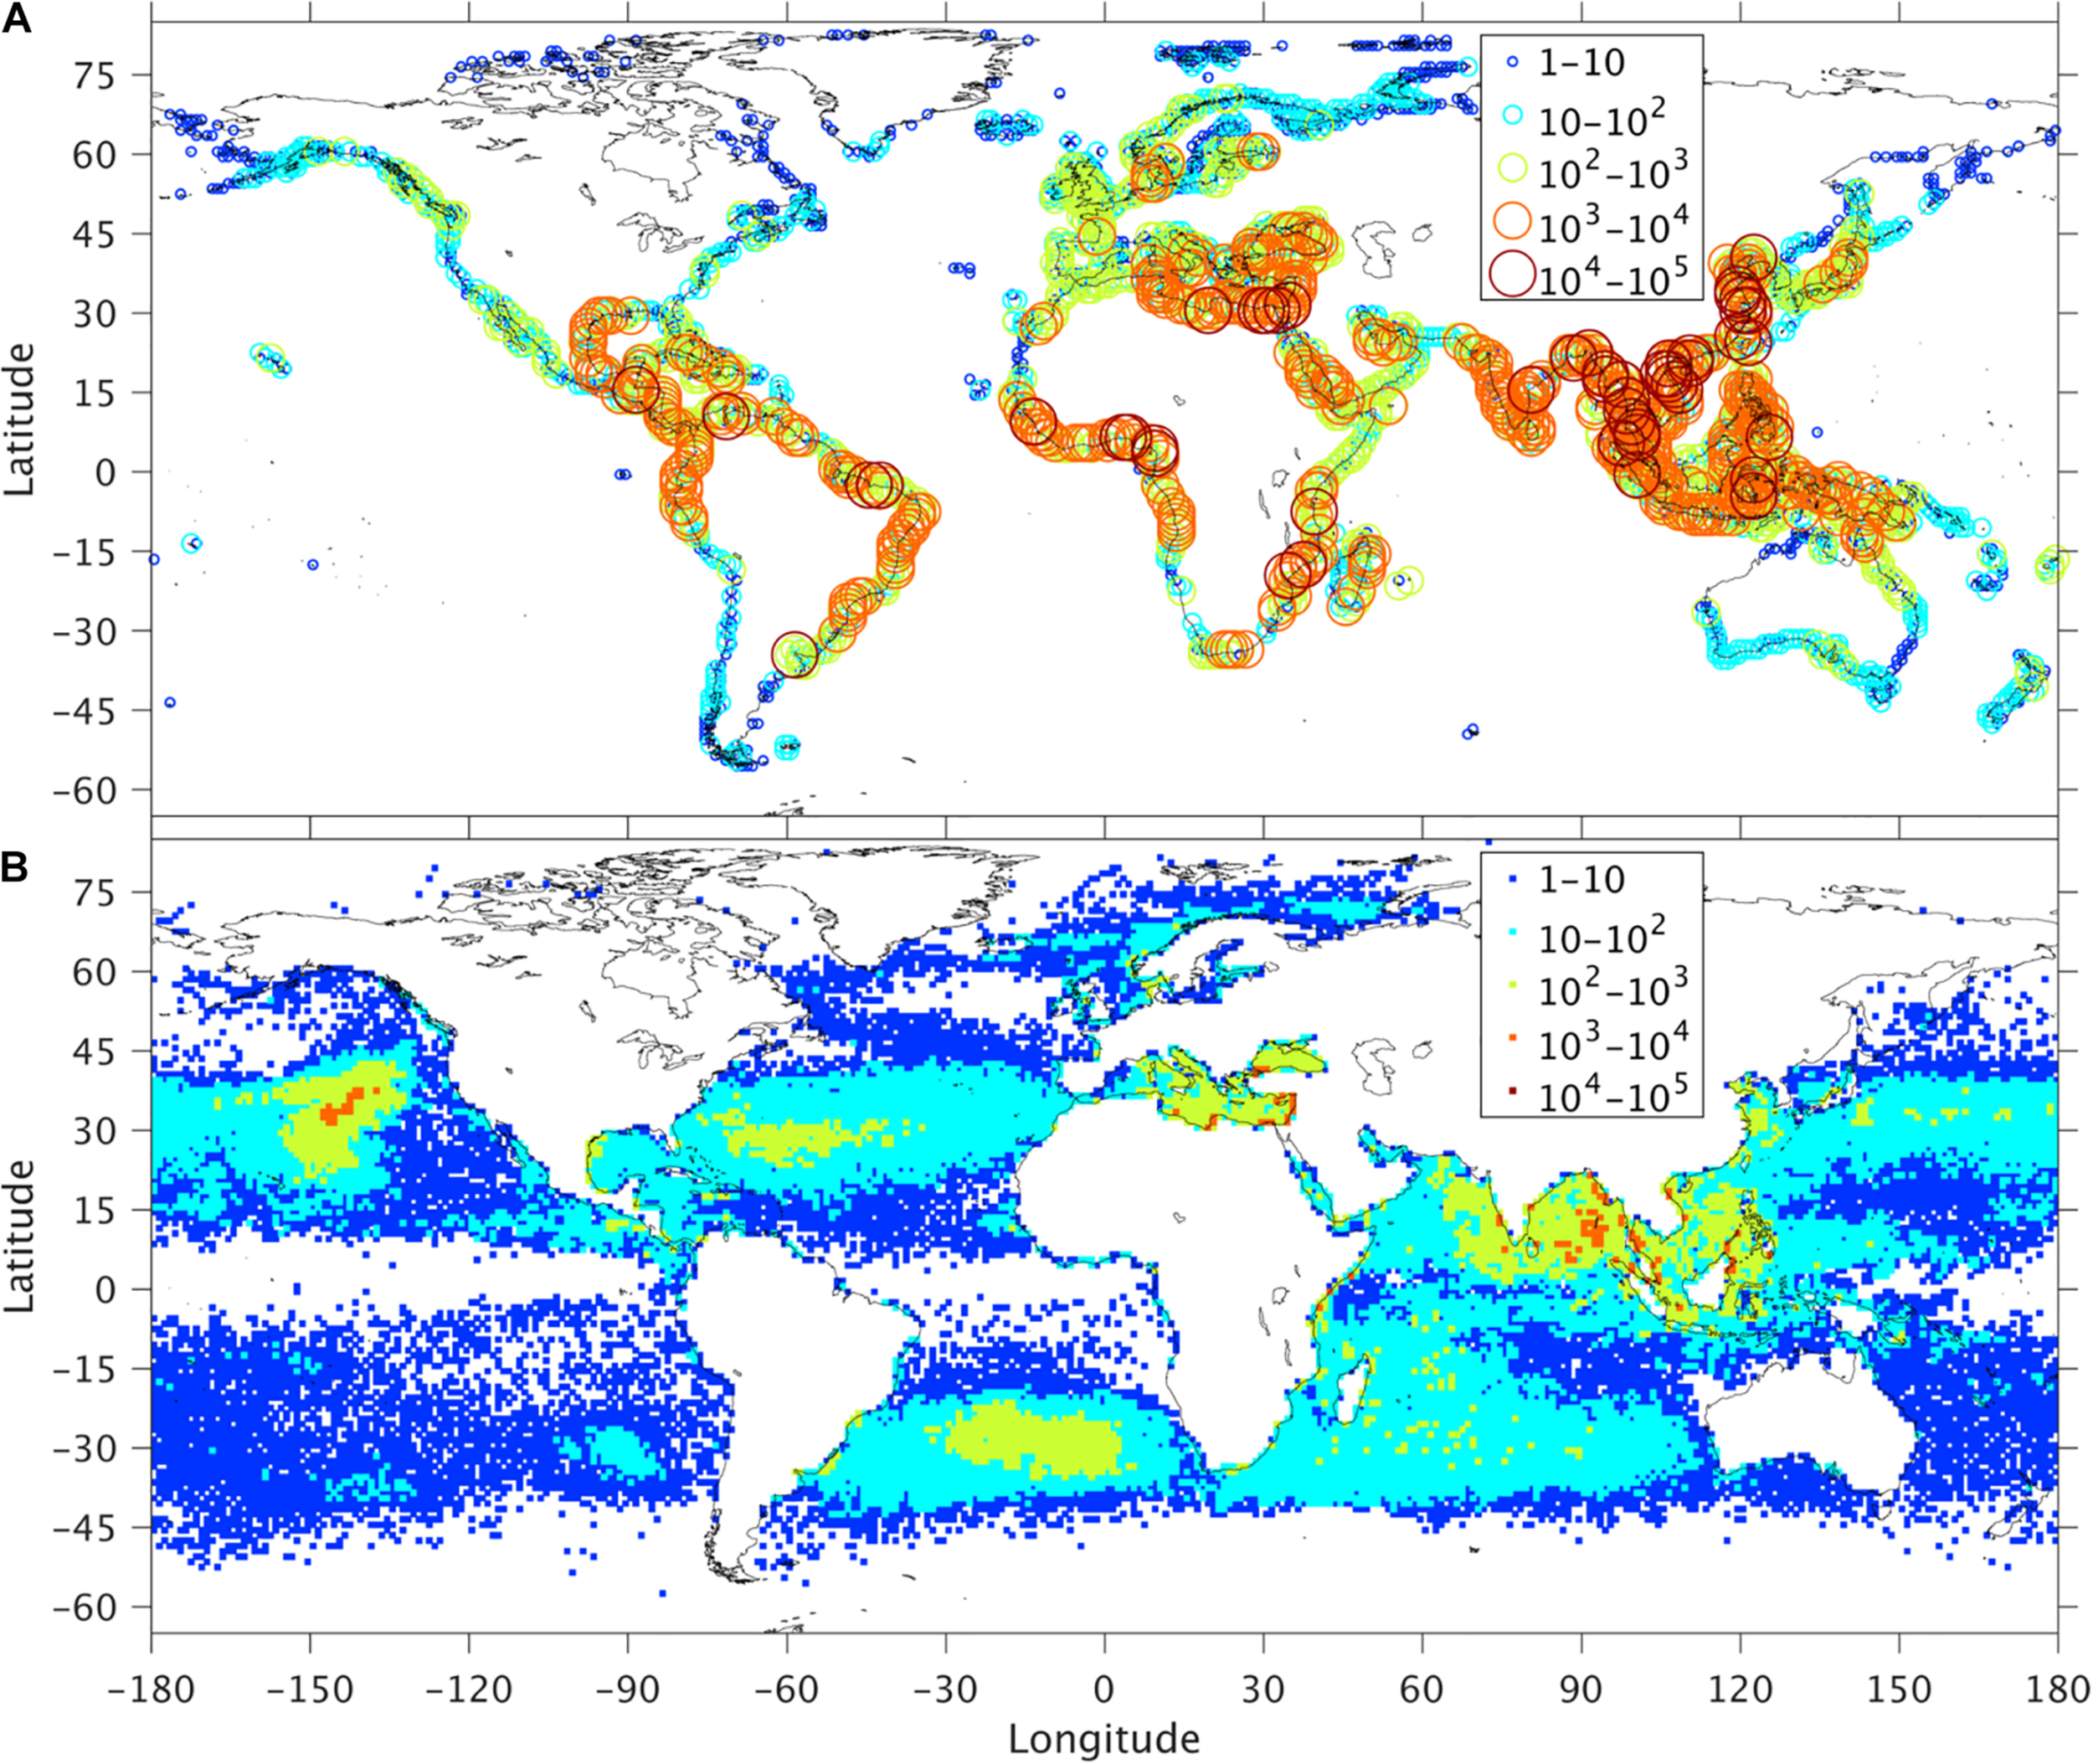
The number of modeled mismanaged plastic waste particles in 1 × 1° grid box accumulated in 10 years (2010–2019) that are beached (Panel A) and remain in the water (Panel B). Out of the total of 3,876,000 released particles, 2,821,752 end up on the beach during the 10-year integration.
The question then arises as to whether the amount of the modeled MPW remaining in the ocean is comparable to the observations. There are very few observations on MPW distribution in the open oceans and whatever data exists come with large uncertainties. Using data collected across the World Ocean, Cózar et al. (2014) provided a first-order estimate and found the highest concentration in the subtropical gyres of the Pacific and Atlantic Oceans in the range of 1-2.5 kg/km2. Lebreton et al. (2018) provided a more in-depth estimate of plastics concentration in the Great Pacific Garbage Patch (GPGP), which is located in the subtropical water between California and Hawaii, and characterized the MPW into micro (0.05−0.5 cm), meso (0.5−5 cm), macro (5−50 cm), and mega (>50 cm) plastics. They estimated that more than 75% of the MPW in the GPGP is in the form of macro and mega plastics larger than 5 cm, whereas micro plastics only accounted for ∼8%. The maximum plastic concentrations observed for micro, meso, macro, and mega plastics are 15, 47, 70, and 342 kg/km2, respectively, which is one to two orders higher than the highest concentration in Cózar et al. (2014).
Figure 3 displays the distribution of the modeled MPW concentration at the end of the 10-year accumulation. The general pattern (i.e., the high concentrations found in the subtropical regions of the North Pacific and the South Atlantic Oceans, as well as in the Mediterranean Seas) is consistent with Cózar et al. (2014, 2015) and Viatte et al. (2020). High concentrations of the modeled MPW are also found in the northern Indian Ocean and in the marginal seas that connect the Pacific and Indian Oceans. To our knowledge, there are no direct observations in these regions, but this should not come as a surprise given the fact that a majority of the MPW mass that enters the ocean is from the surrounding South and East Asian countries. Quantitatively, the highest modeled concentration of MPW in the GPGP is ∼500 kg/km2. This value is of the same order as the highest concentration reported in Lebreton et al. (2018), but uncertainties are large and our results are strongly dependent on the decay time scale chosen to represent MPW break down at sea. Figure 4 illustrates the impact of different decaying time scales on the accumulation of the MPW mass in the GPGP (defined as 25−41°N, 129-156°W, i.e., red box in Figure 3). In the absence of decay, MPW in the GPGP box would reach ∼1.4 million tons after 10 years. With the five-year decay time scale, it reaches a near steady state of ∼370 thousand tons or an average of 80 kg/km2.
FIGURE 3
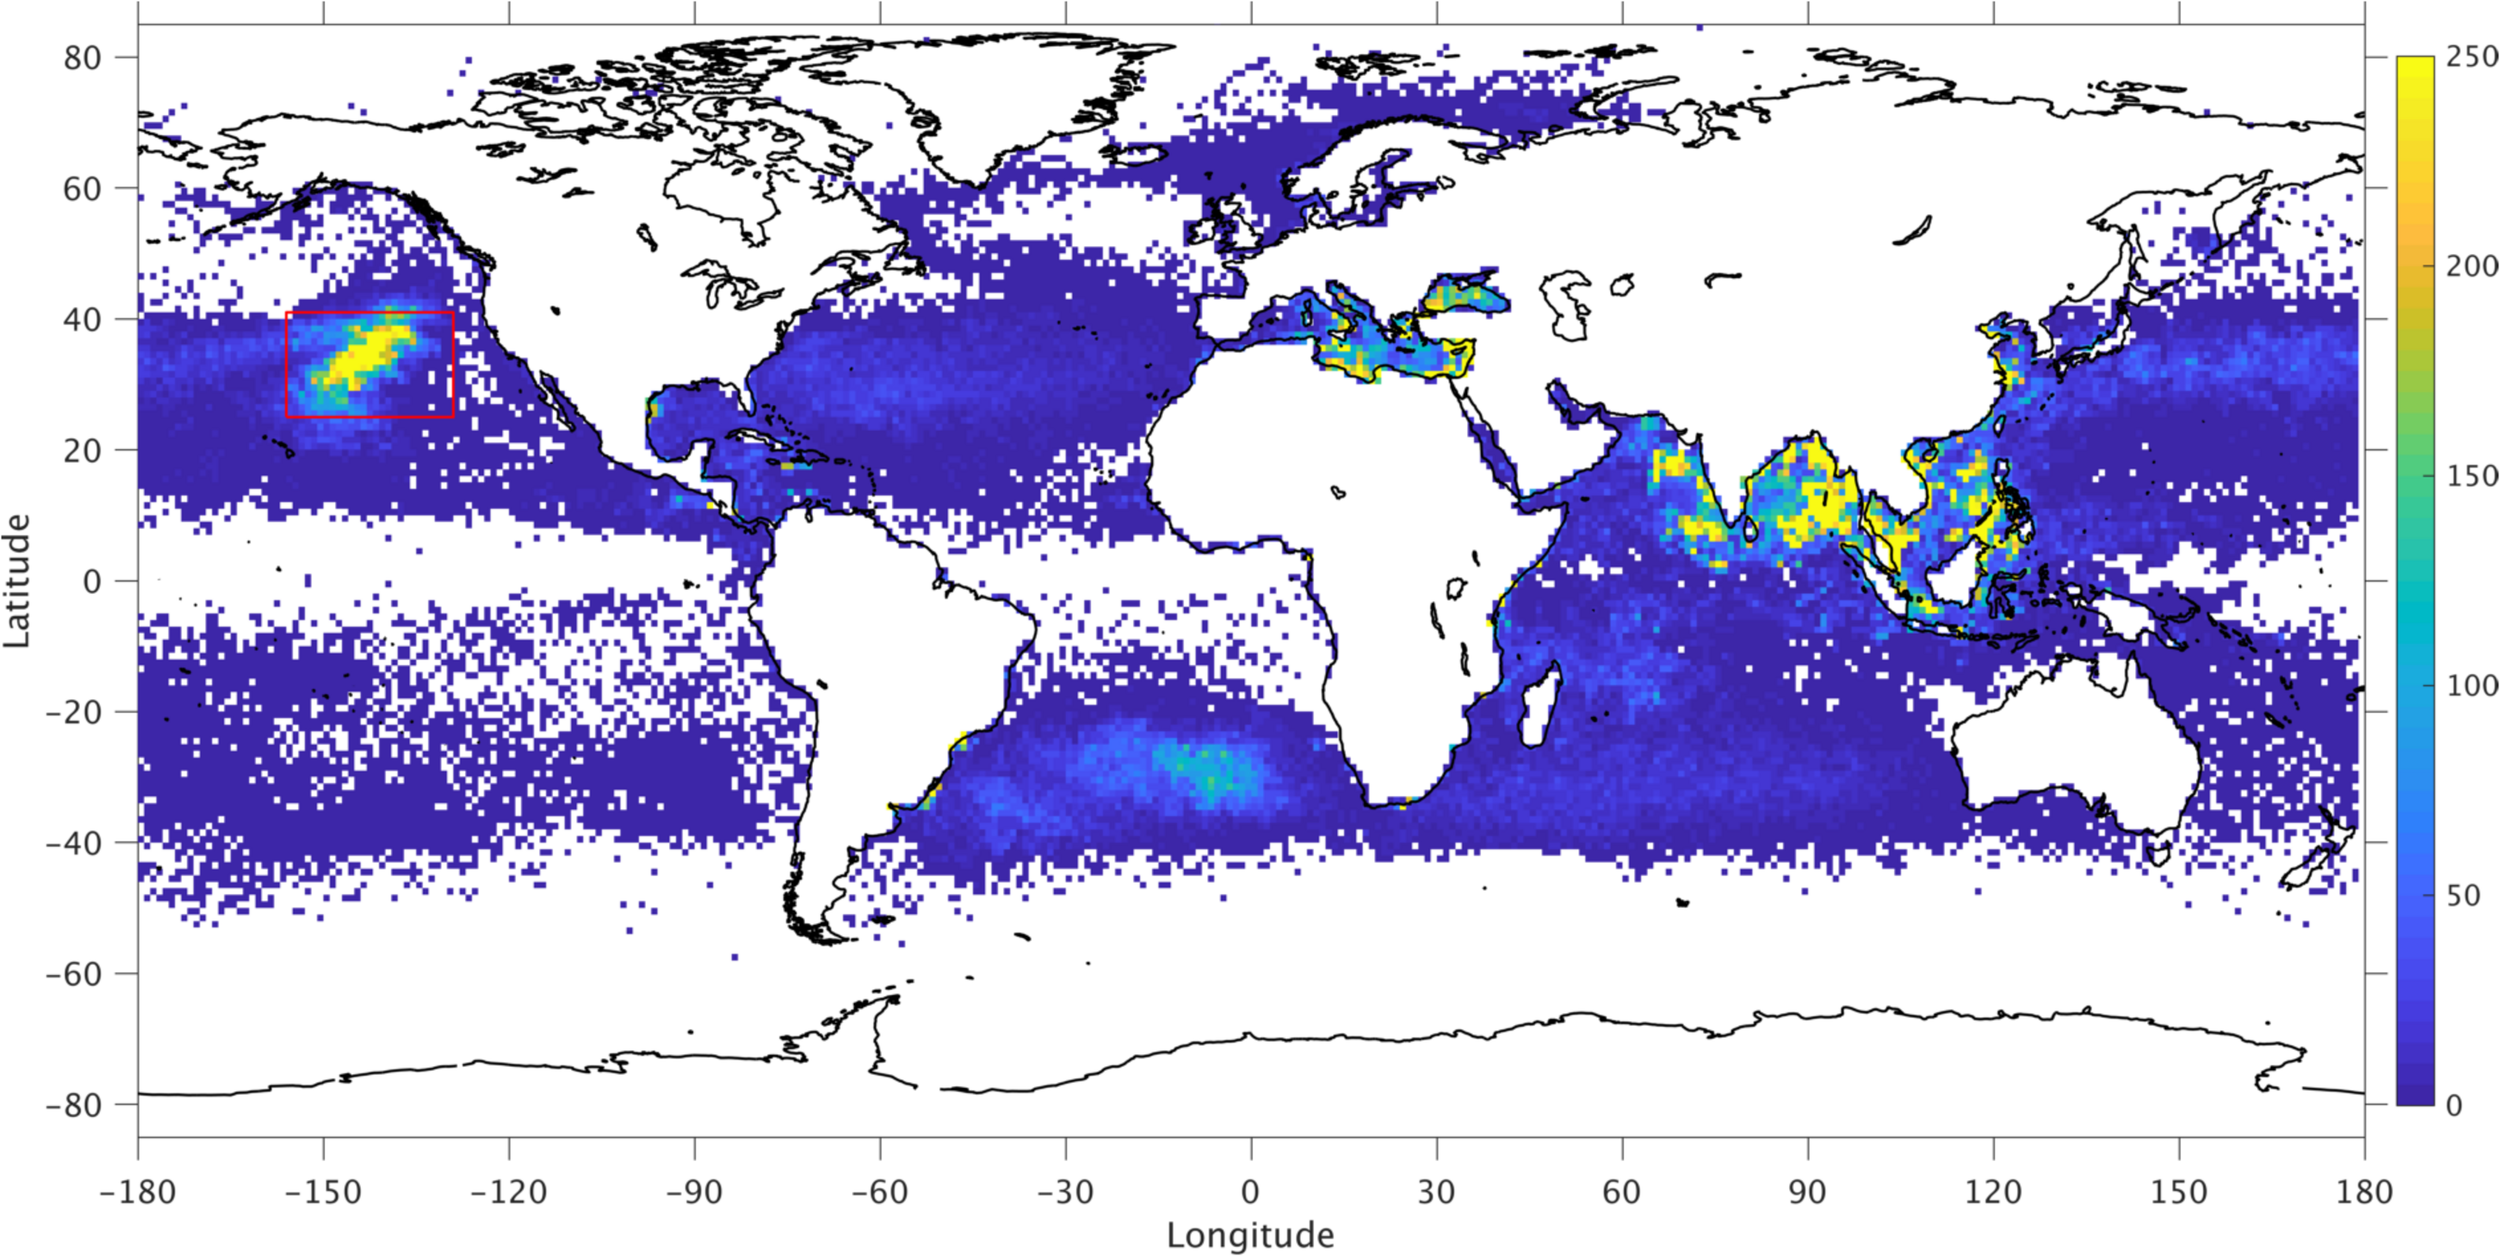
The modeled mismanaged plastic waste concentration (in kg/km2) showing 10-years of mismanaged plastic waste accumulation (2010 to 2019) at the end of the integration. The red box denotes the Great Pacific Garbage Patch (GPGP, 129-156°W, 25-41°N).
FIGURE 4
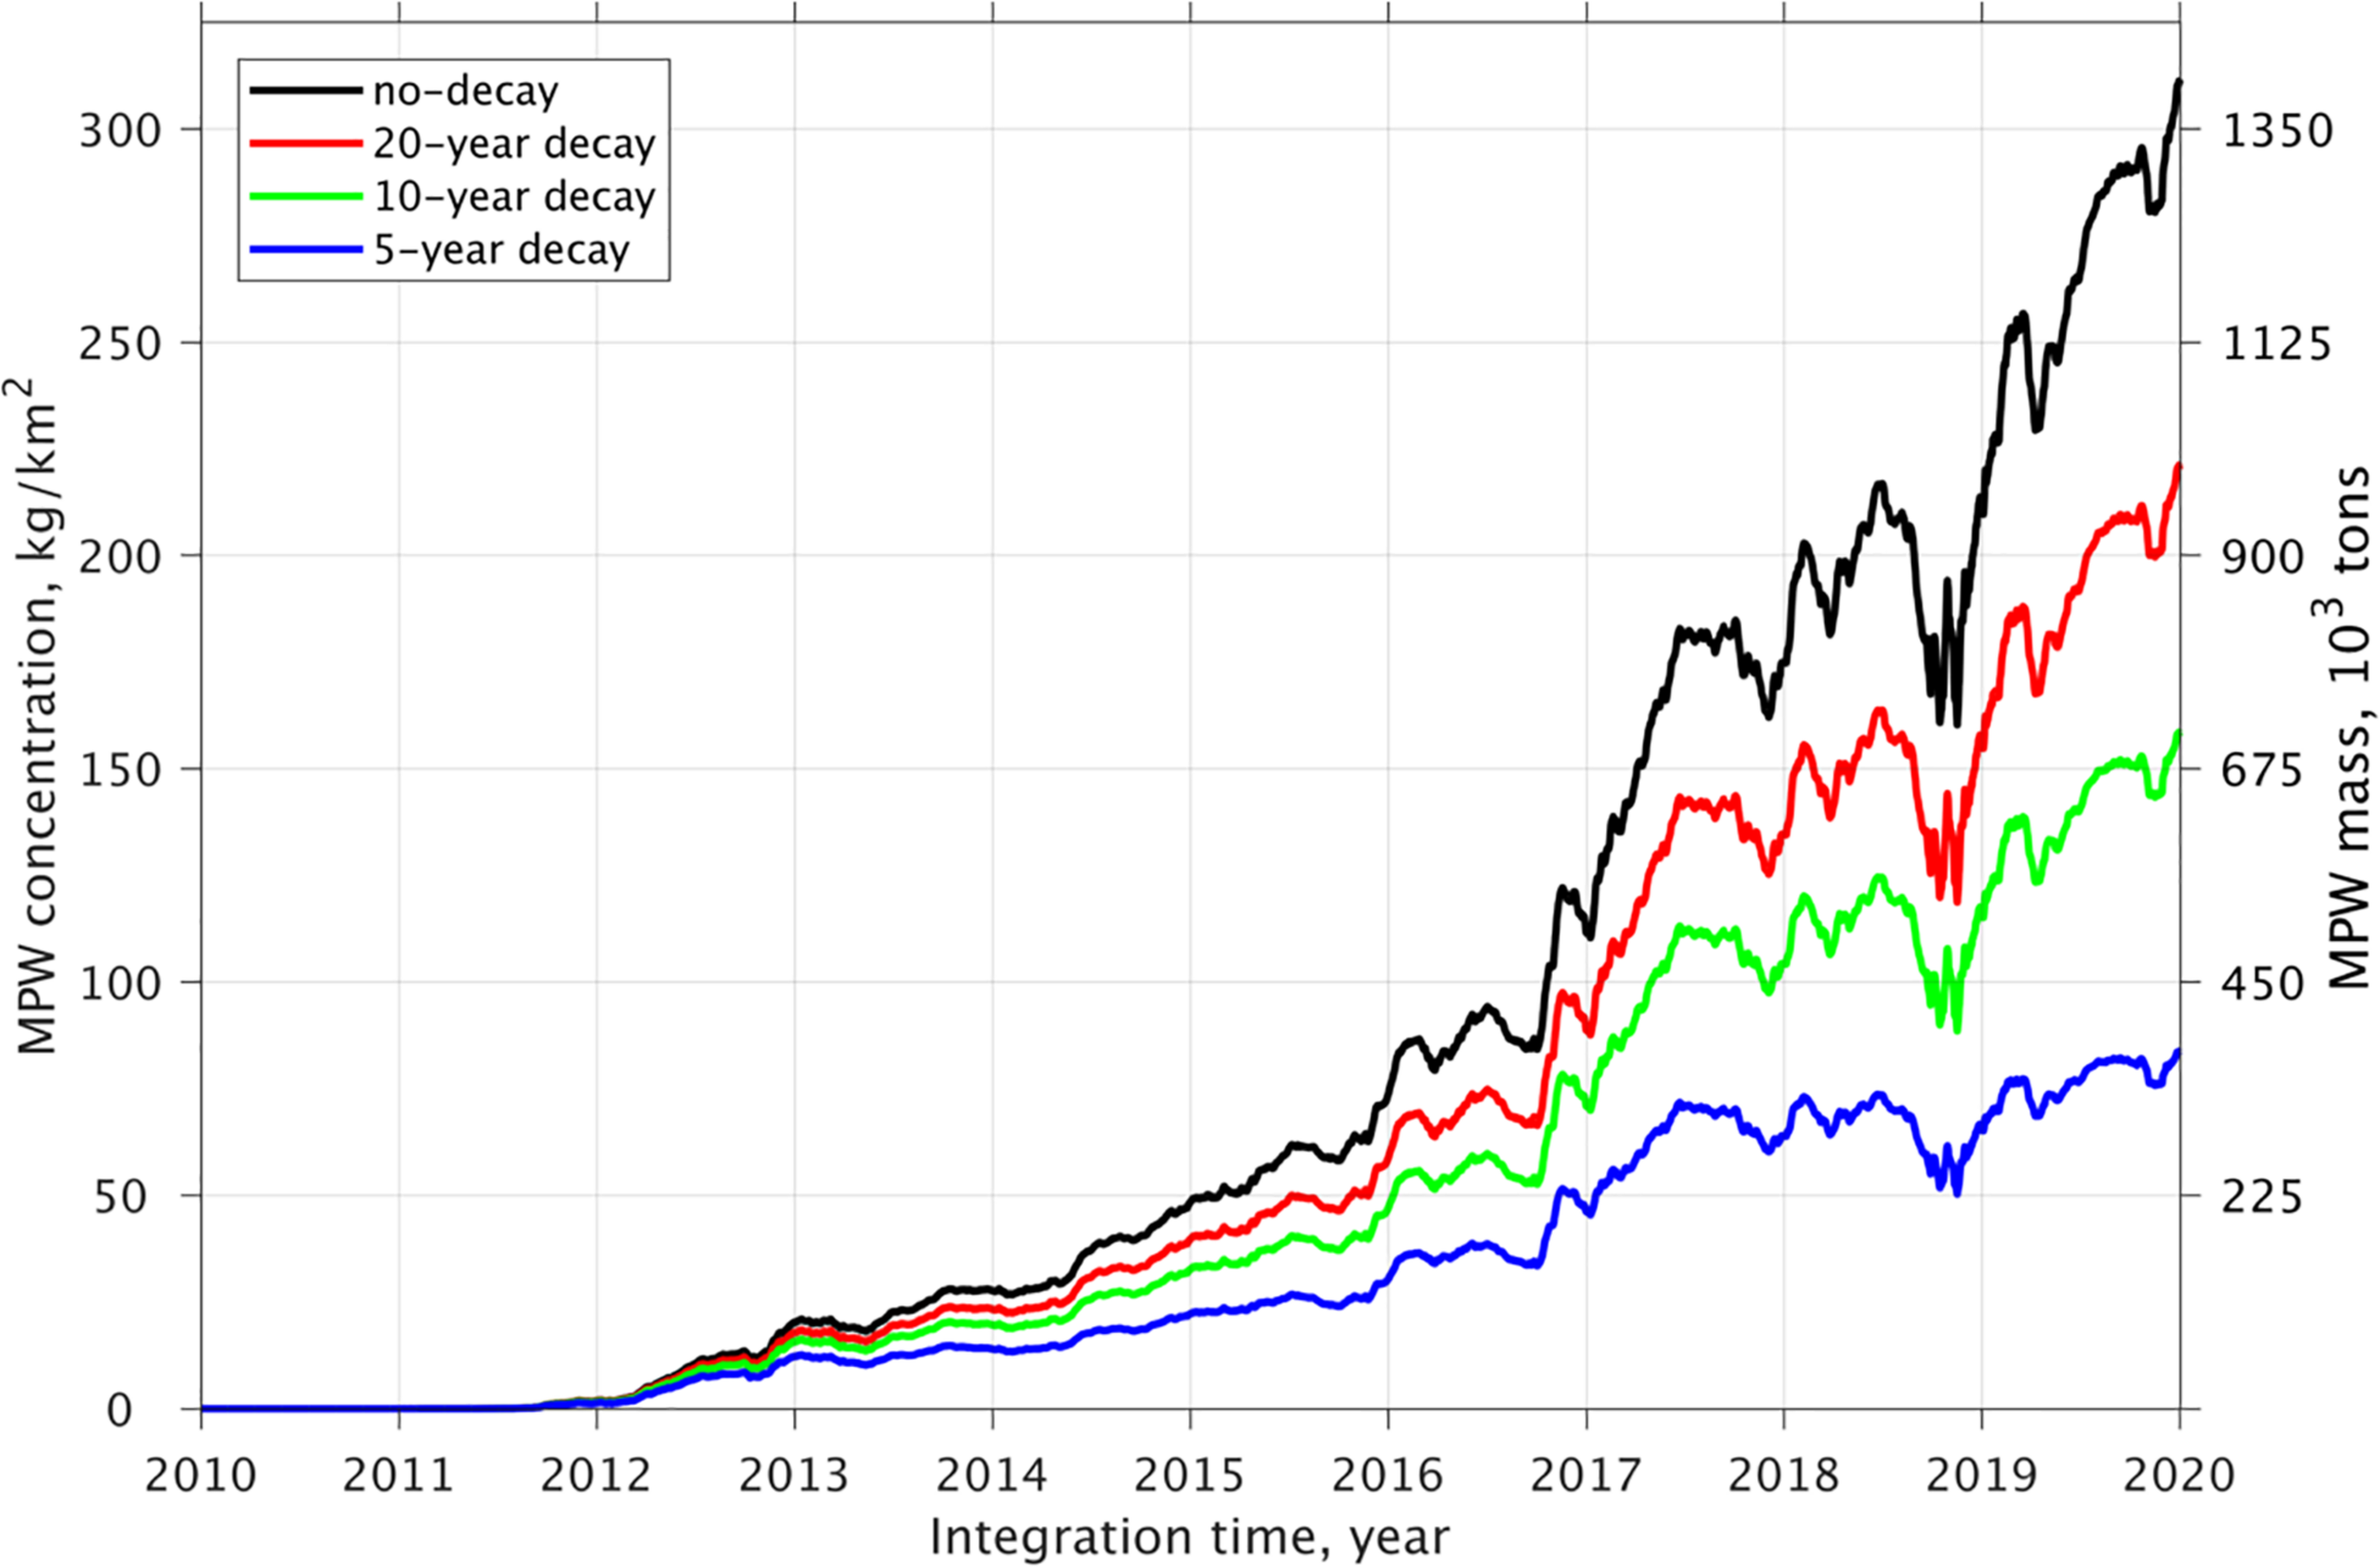
The accumulation of the modeled mismanaged plastic waste concentration or mass in the GPGP area (129-156°W, 25-41°N, red rectangle box in Figure 3) under different decaying scenarios.
Figure 3 represents only a snapshot the MPW concentration at the end of the 10-year accumulation in 2019 and it is important to note that, as reported by Maes et al. (2016), the distribution of MPW in the GPCP domain (outlined in red) varies greatly with changes in the ocean circulation and wind patterns. To illustrate how quickly this distribution can change in time, Figure 5 displays four snapshots of MPW concentration in the GPGP area at the end of March, June, September, and December 2019, respectively. In March, the GPCP patch is close to the continental United States. on the eastern side of the red box while six months later it is close to the western edge of the red box.
FIGURE 5
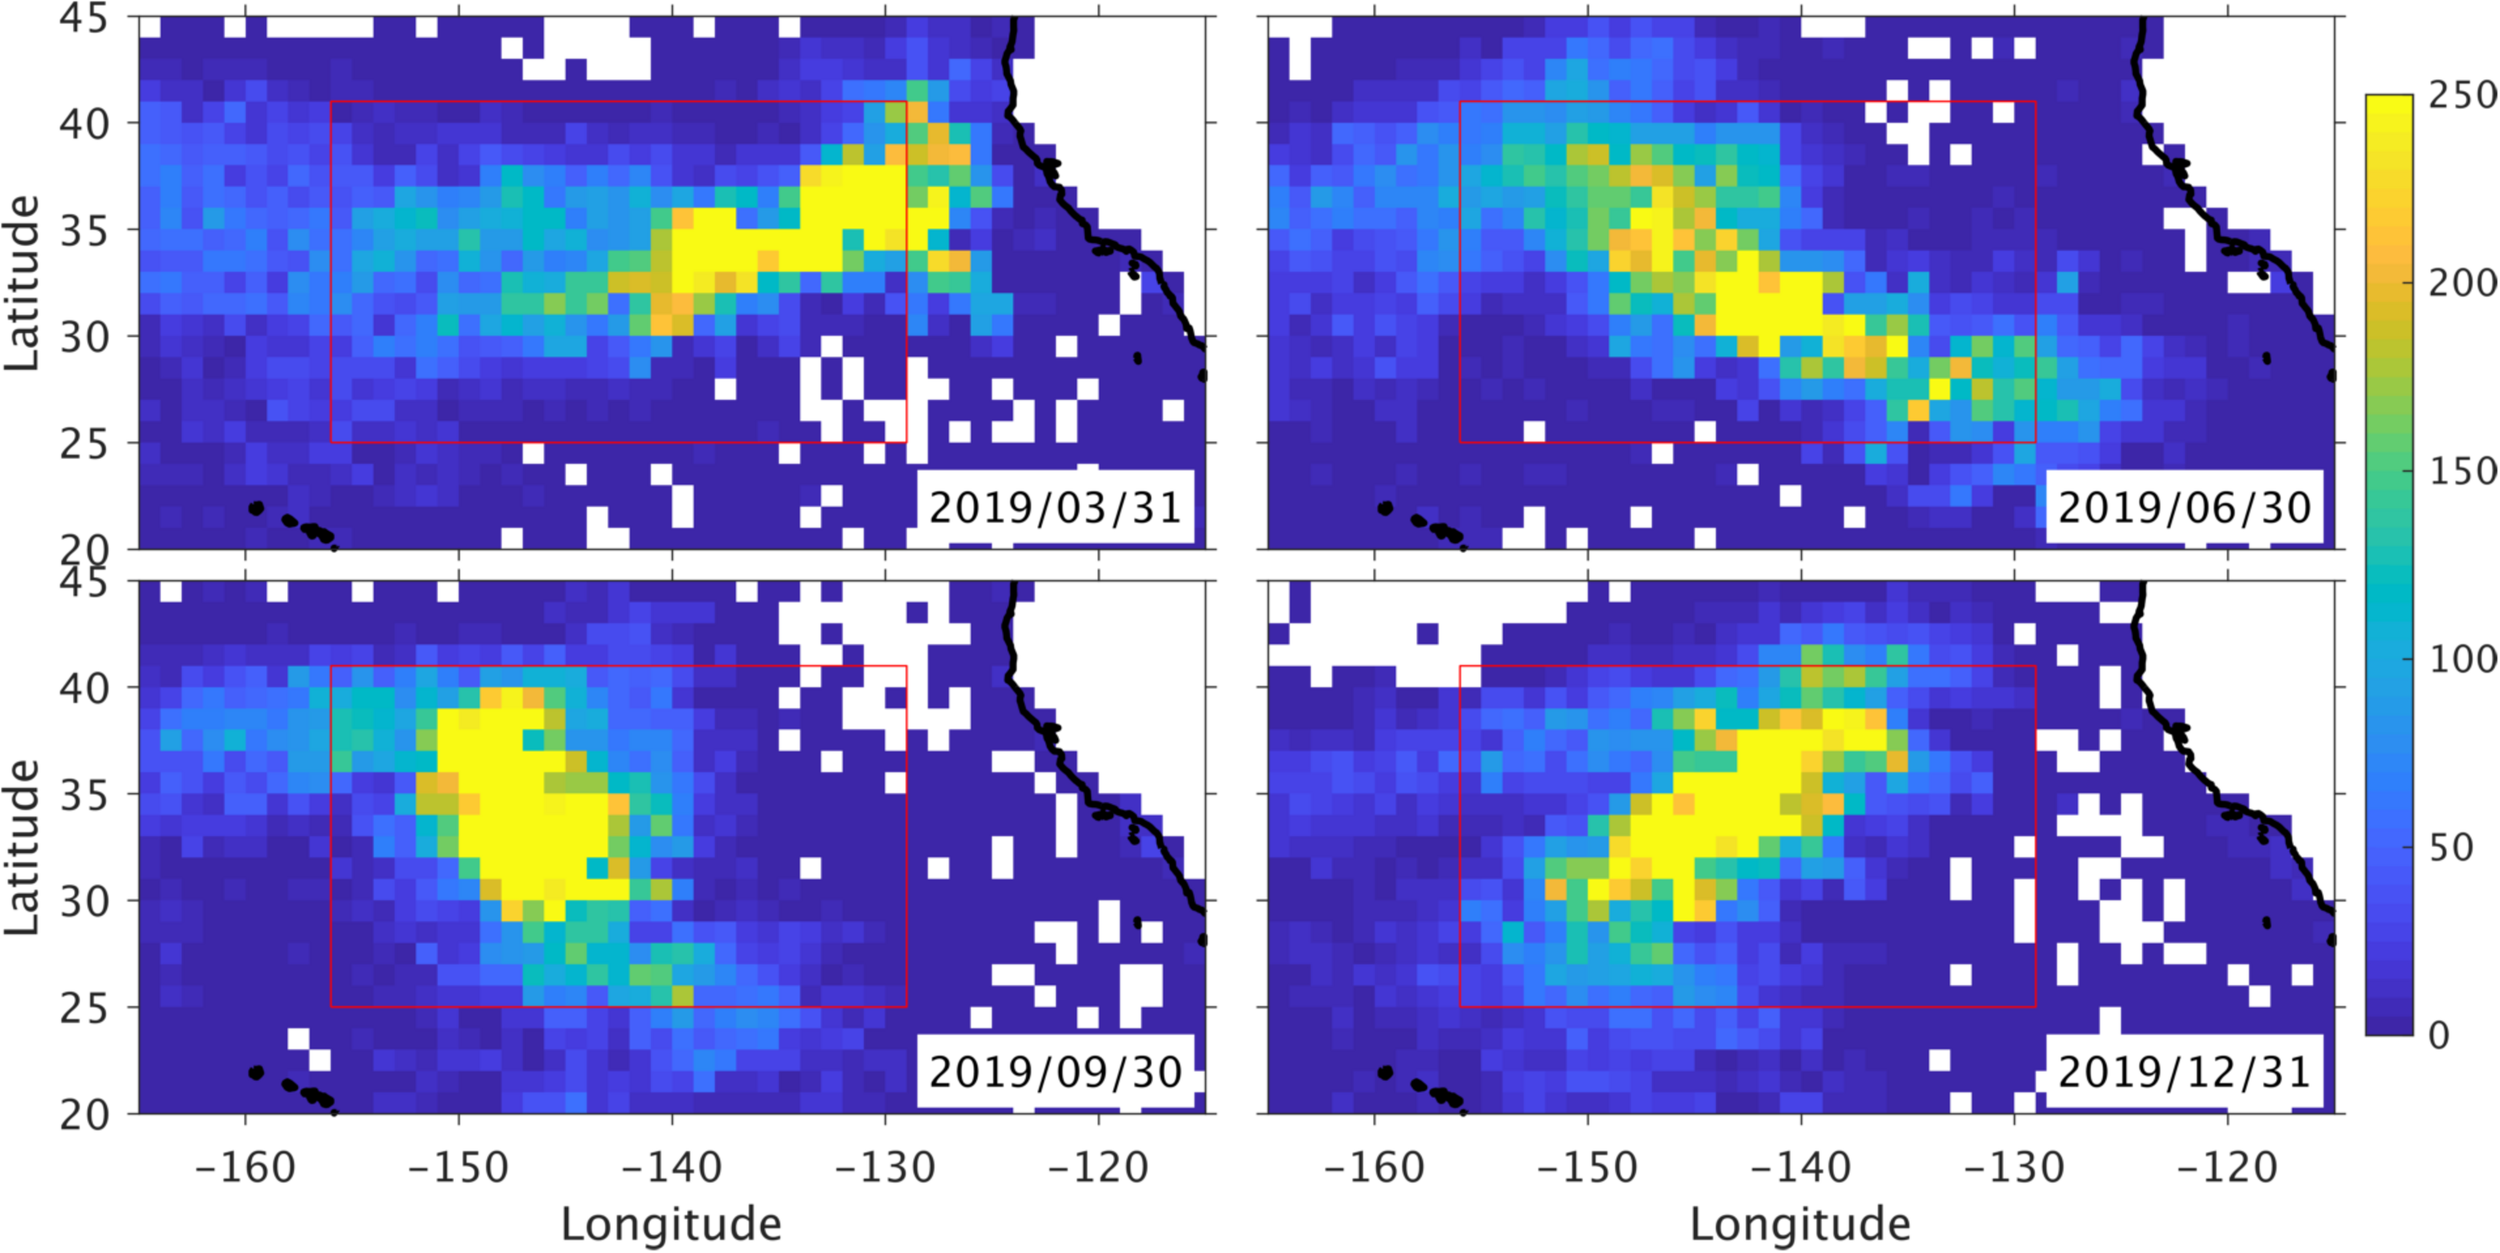
Snapshots of the modeled mismanaged plastic waste concentration (in kg/km2) near the GPGP area at the end of March, June, September, and December 2019.
Figure 6 displays the time-averaged MPW concentration for the last three years (2017–2019) with a five-year decay time scale, when the amount of MPW in the GPGP reached a quasi-steady state (Figure 4). The overall distribution is quite close to that seen in Figure 3 and agrees well with previously published modeling studies (e.g., van Sebille et al., 2012; Maes et al., 2018; Lebreton et al., 2018; Viatte et al., 2020). The averaged mass of MPW in the GPGP box is ∼300 thousand tons, which is only slightly lower than the 370 thousand tons present at the end of 2019 (Figure 4). This corresponds to an average concentration of 65 kg/km2, which is a little bit higher than the 50 kg/km2 estimated by Lebreton et al. (2018).
FIGURE 6
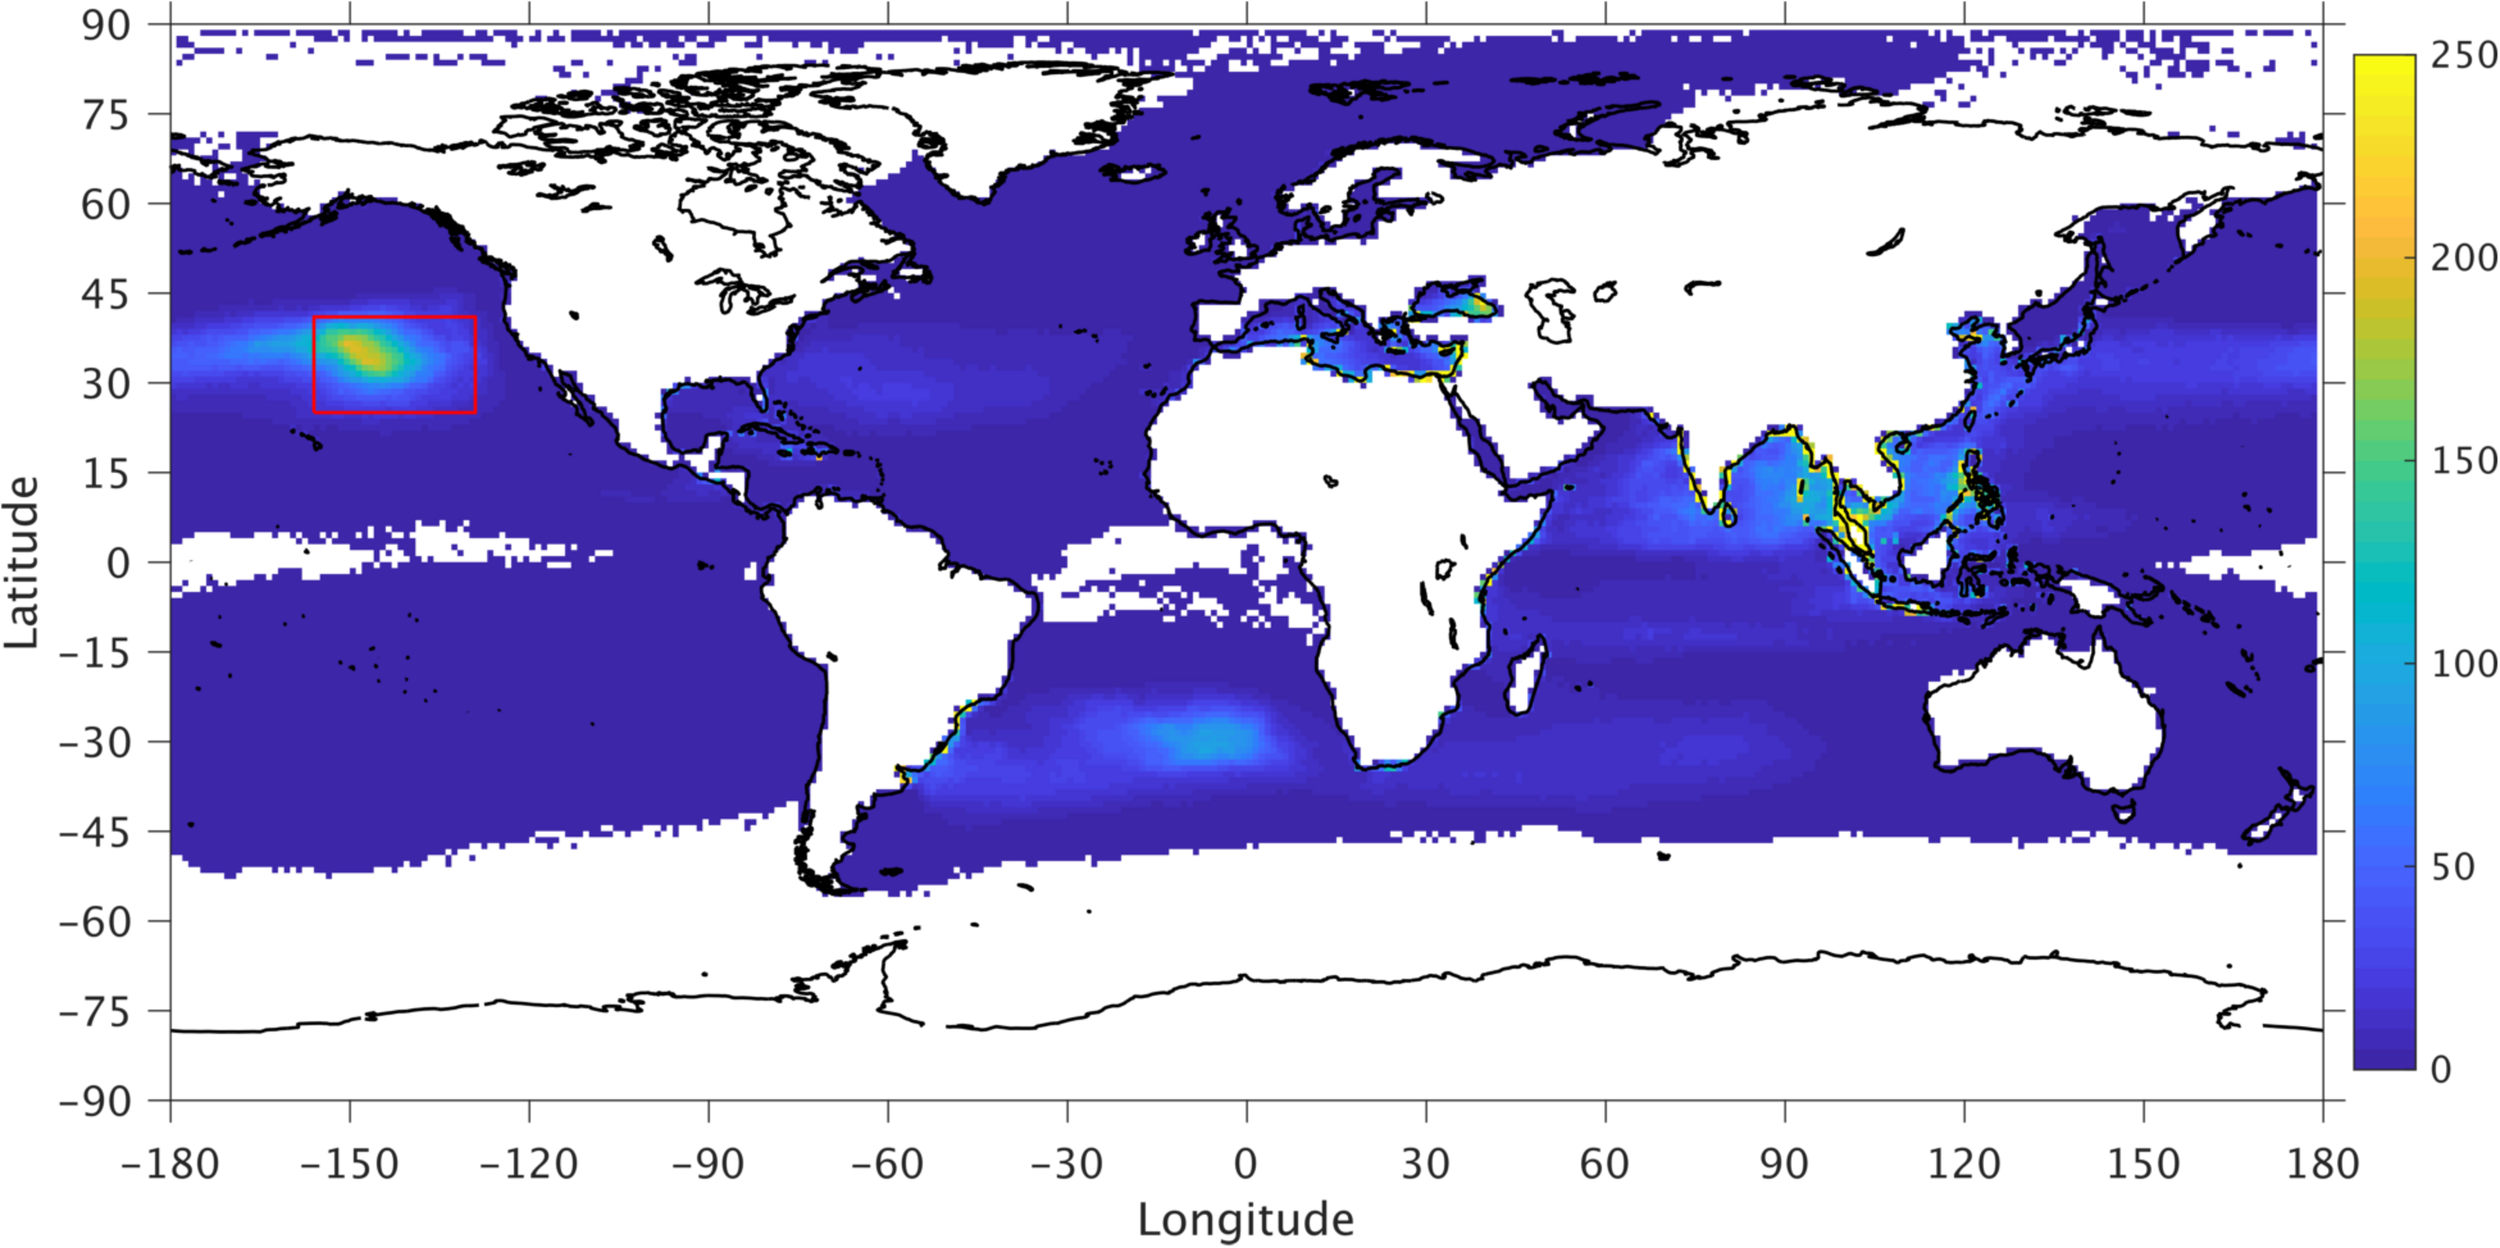
Similar to Figure 3, but for the time-averaged modeled mismanaged plastic waste concentration (in kg/km2) from 2017 to 2019.
Destination and Origin of the MPW for an Individual Country
In section “Partition Between Beached Versus at Sea MPW”, we showed that modeled MPW concentration in the open ocean is comparable to observational estimates. In this section, we use the model to address the questions raised in the introduction: (1) where does MPW released into the ocean by a given country go and (2) where does MPW found on the coastline of a given country come from. Because observational data were collected on its beaches (Ryan, 2020), which can be used to validate the model, we use Kenya as an example in this section. The statistics for all world countries on MPW destinations and beached MPW sources are provided in the supplement to this article.
The time-averaged concentration of all MPW that originated from Kenya during the 2010−2019 period is displayed in Figure 7. The figure is divided into two panels, Figure 7A shows the averaged concentration for those particles that remained at sea at the end of 2019, while Figure 7B shows the averaged concentration for those particles that ended up on the beach (major countries outlined in red) at the end of 2019. The distribution in these two figures is quite similar, which implies that most particles follow a similar pathway: first, they flow northeastward into the Arabian Sea and subsequently into the Bay of Bengal, depending on the monsoon currents in the north Indian Ocean, and then eastward following the Equatorial Counter Current (e.g., Shankar et al., 2002; Tomczak and Godfrey, 2003). One small difference between the two panels is that some MPW that remains in the ocean is trapped in the subtropical gyre of the South Indian Ocean or escapes into the South Atlantic Ocean via the Agulhas current and associated eddies.
FIGURE 7
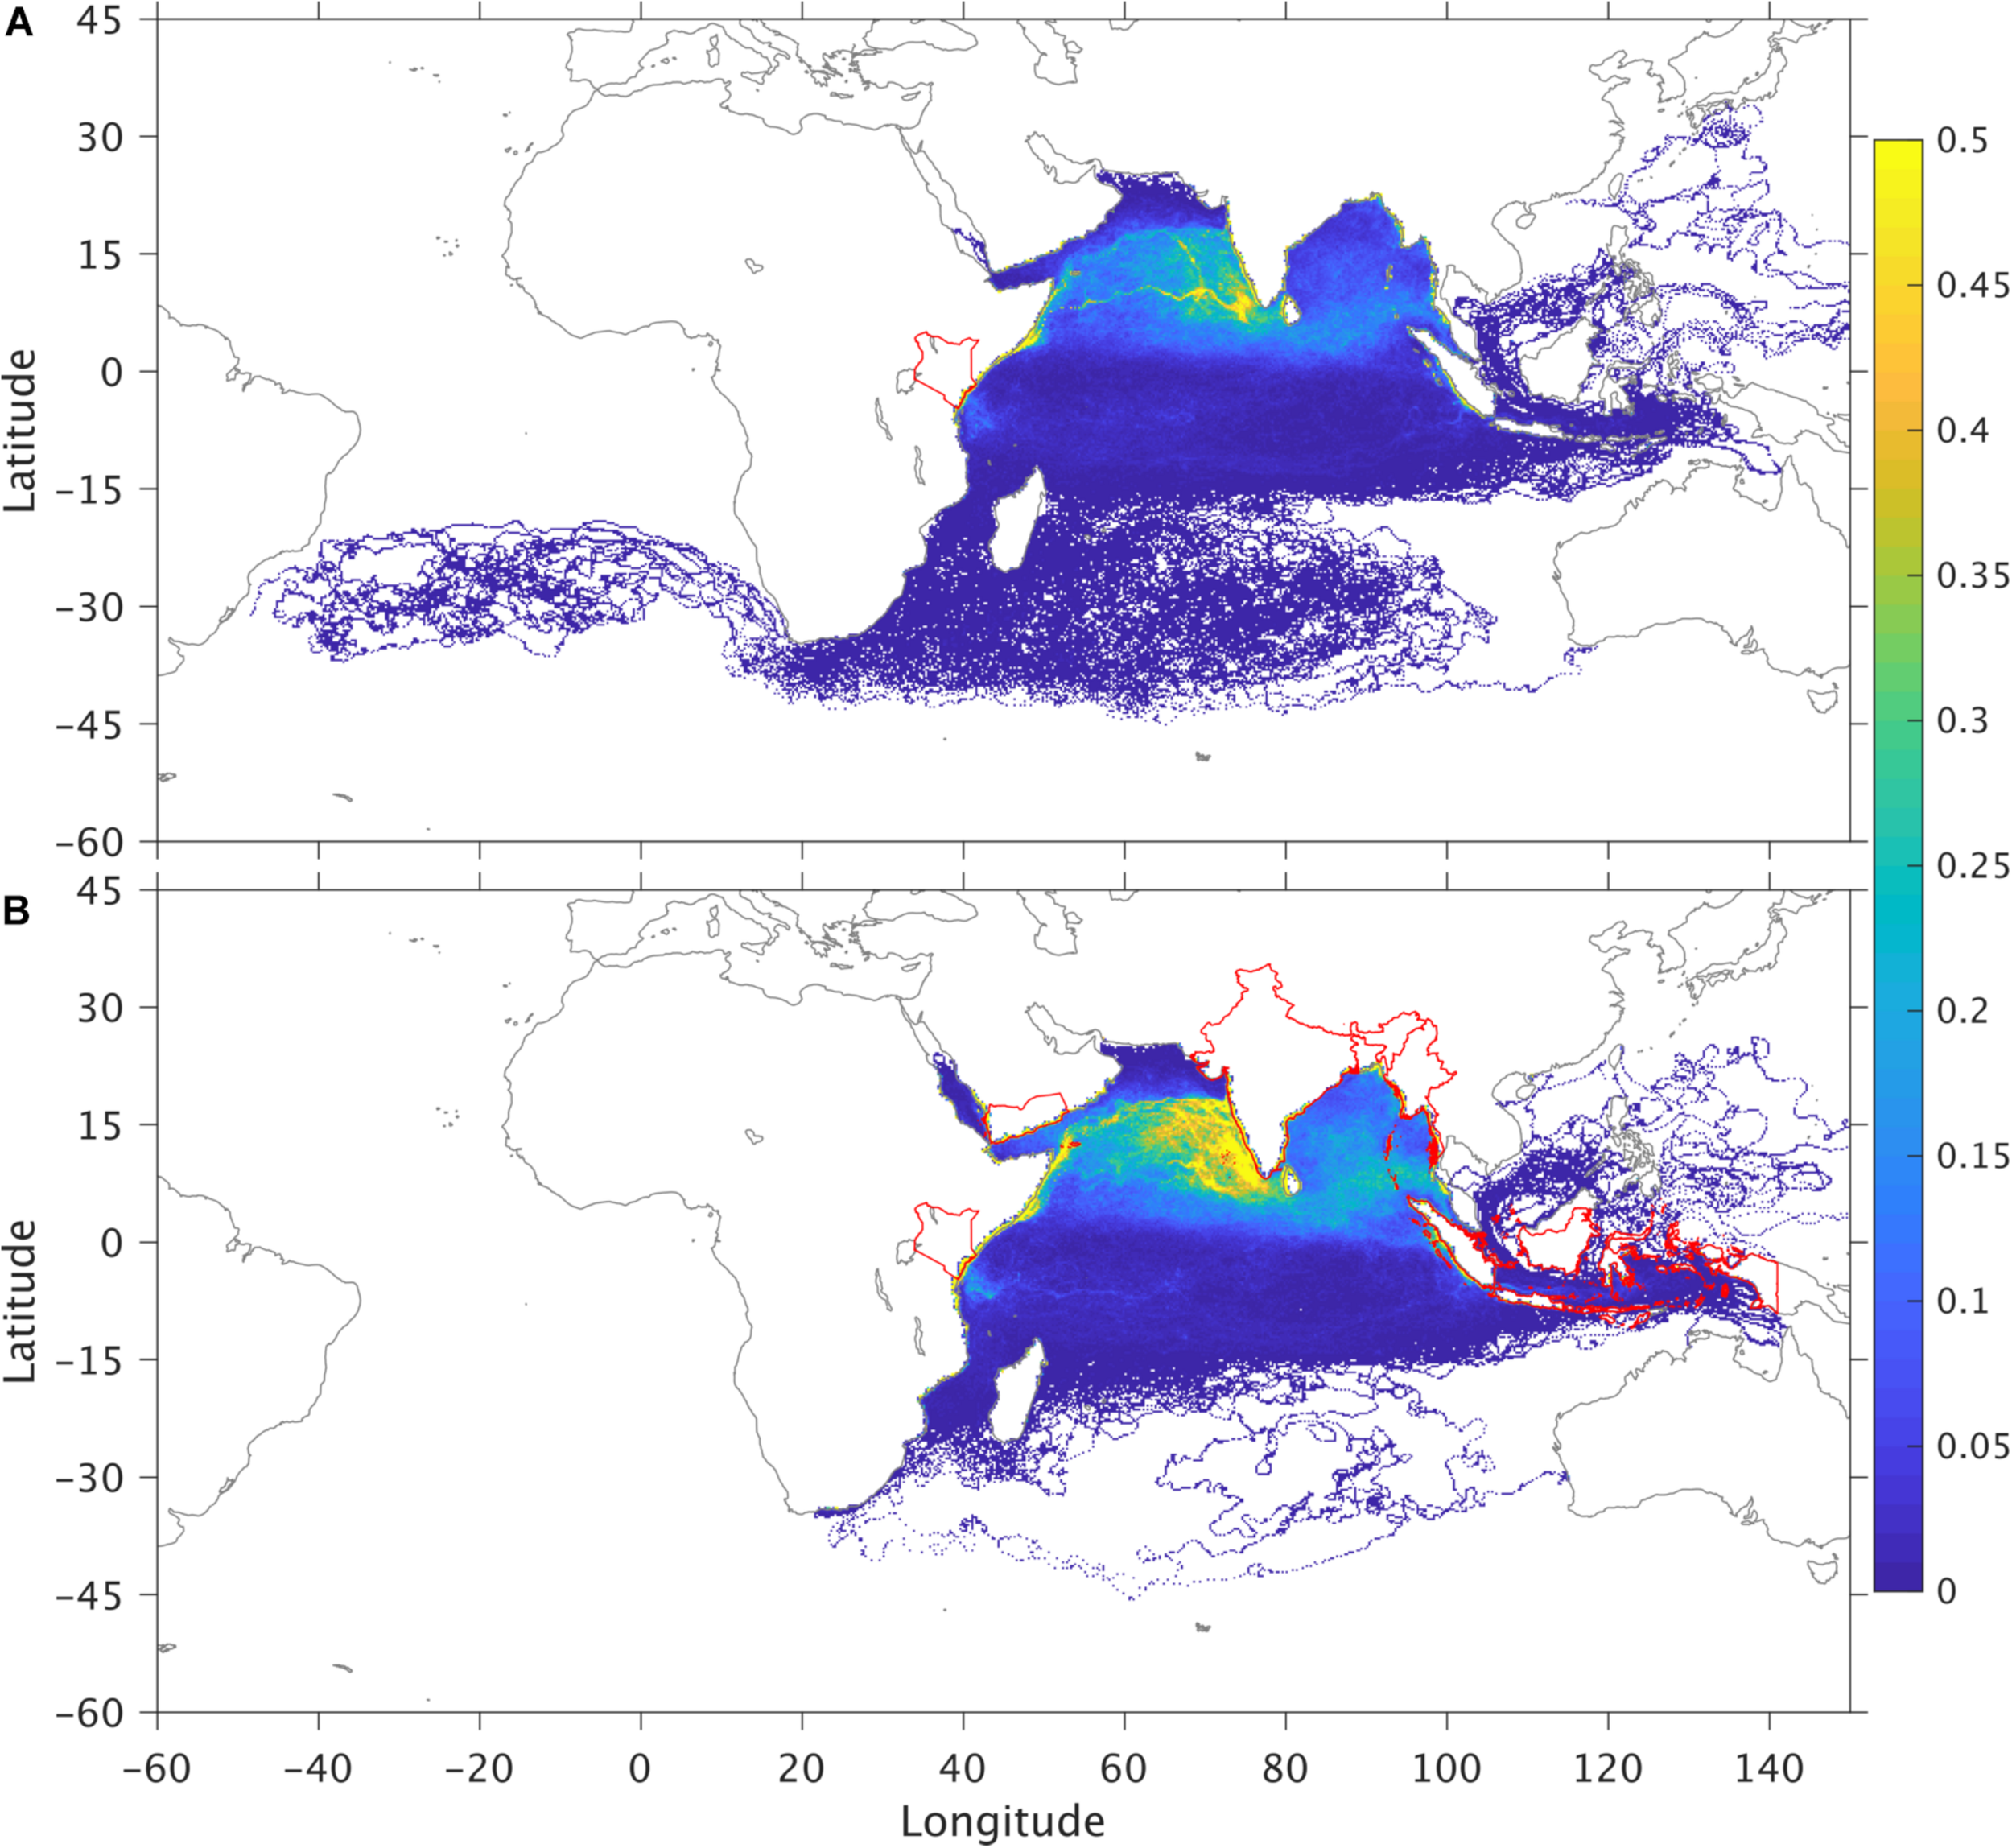
Time-averaged concentration (in kg/km2) of the mismanaged plastic waste that are released from Kenya and that remains in the ocean (Panel A) or is beached on another country’s coast (Panel B) at the end of the 2019. Red lines outline the border of Kenya in Panel A and the border of the five countries (Table 1) that received the most MPW from Kenya (Kenya, India, Indonesia, Myanmar, and Yemen) in Panel B.
Overall, Kenya contributed a total of 58,991 tons of MPW into the ocean for the 2010−2019 period, of which 40% (23,596 tons) are considered denser than the seawater and therefore sinks toward the ocean floor near the coast. The remaining 60% or 35,395 tons are considered lighter than seawater and thus are carried by the ocean surface currents and wind. Of the 35,395 tons of lighter than seawater MPW, 20,234 tons (34.3% of the original 58,991 tons) vanishes due to decomposition (the decay process). Table 1 summarizes the destination of the remaining 15,161 tons of MPW originating from Kenya: roughly half (52.4%) ends up on the beaches of 26 countries (with only 12 of these countries receiving more than 100 tons) while the rest remains at sea, primarily in the north Indian Ocean. The majority of these recipient countries (outlined in red in Figure 7) are in the northeastern Indian Ocean (India, Indonesia, Myanmar), but some are neighboring countries in Africa (Yemen, Somalia). This distribution is consistent with the surface circulation of the Indian Ocean and slightly over 50% of the MPW originating from Kenya is either carried back on their beaches (14%) or transported to neighboring countries. By contrast, others countries, such as South Africa or Japan, can have up to 80% of their MPW swept to the ocean interior by strong western boundary currents such as the Agulhas Current or the Kuroshio (see Supplementary Material).
TABLE 1
| MPW tons [Percentage] | Destination |
| 7,223 [47.6] | Ocean |
| 7,941 [52.4] | Beached to the following countries* |
| 2,154 [14.2] | Kenya |
| 1,399 [9.2] | India |
| 1,180 [7.8] | Indonesia |
| 703 [4.6] | Myanmar |
| 666 [4.4] | Yemen |
| 441 [2.9] | Somalia |
| 336 [2.2] | Sri Lanka |
| 217 [1.4] | Bangladesh |
| 175 [1.2] | Saudi Arabia |
| 138 [0.9] | Mozambique |
| 130 [0.9] | Thailand |
| 129 [0.9] | Tanzania |
| 91 [0.6] | Oman |
| 53 [0.4] | Madagascar |
Destination of the modeled MPW that are released from Kenya at the end of the 2010−2019 accumulation.
Note that Kenya is estimated to contribute a total of 58,991 tons MPW into the ocean in this period and only about 1/4 (15,164 tons) is consider here (the rest sinks to the bottom and/or vanishes due to the decay process). *12 additional countries that received less than 50 tons MPW (0.4%) are not listed: Sudan, Malaysia, Djibouti, Eritrea, South Africa, Philippines, Timor-Leste, China, Australia, Vietnam, Taiwan, and Iran.
In the same fashion that MPW from Kenya ends up in other countries, Kenya receives its share of MPW from other countries (i.e., interconnectivity – see see https://marinelitter.coaps.fsu.edu and Appendix for a visualization). Figure 8 displays the time-averaged MPW concentration (in kg/km2) for the MPW that eventually beach on the Kenyan coast. High-concentrations of MPW are primarily found near Indonesia and in a latitudinal band around 10°S that spans from Indonesia to Tanzania that is associated with the westward-flowing South Equatorial Current. While it is not surprising that most of the MPW that reaches Kenya comes from surrounding countries in the Indian Ocean, some of the beached MPW can originate from as far as South and Central America (i.e., Brazil, Uruguay, Argentina, Peru, Mexico, Guatemala, and Panama) over a period of less than 10 years.
FIGURE 8
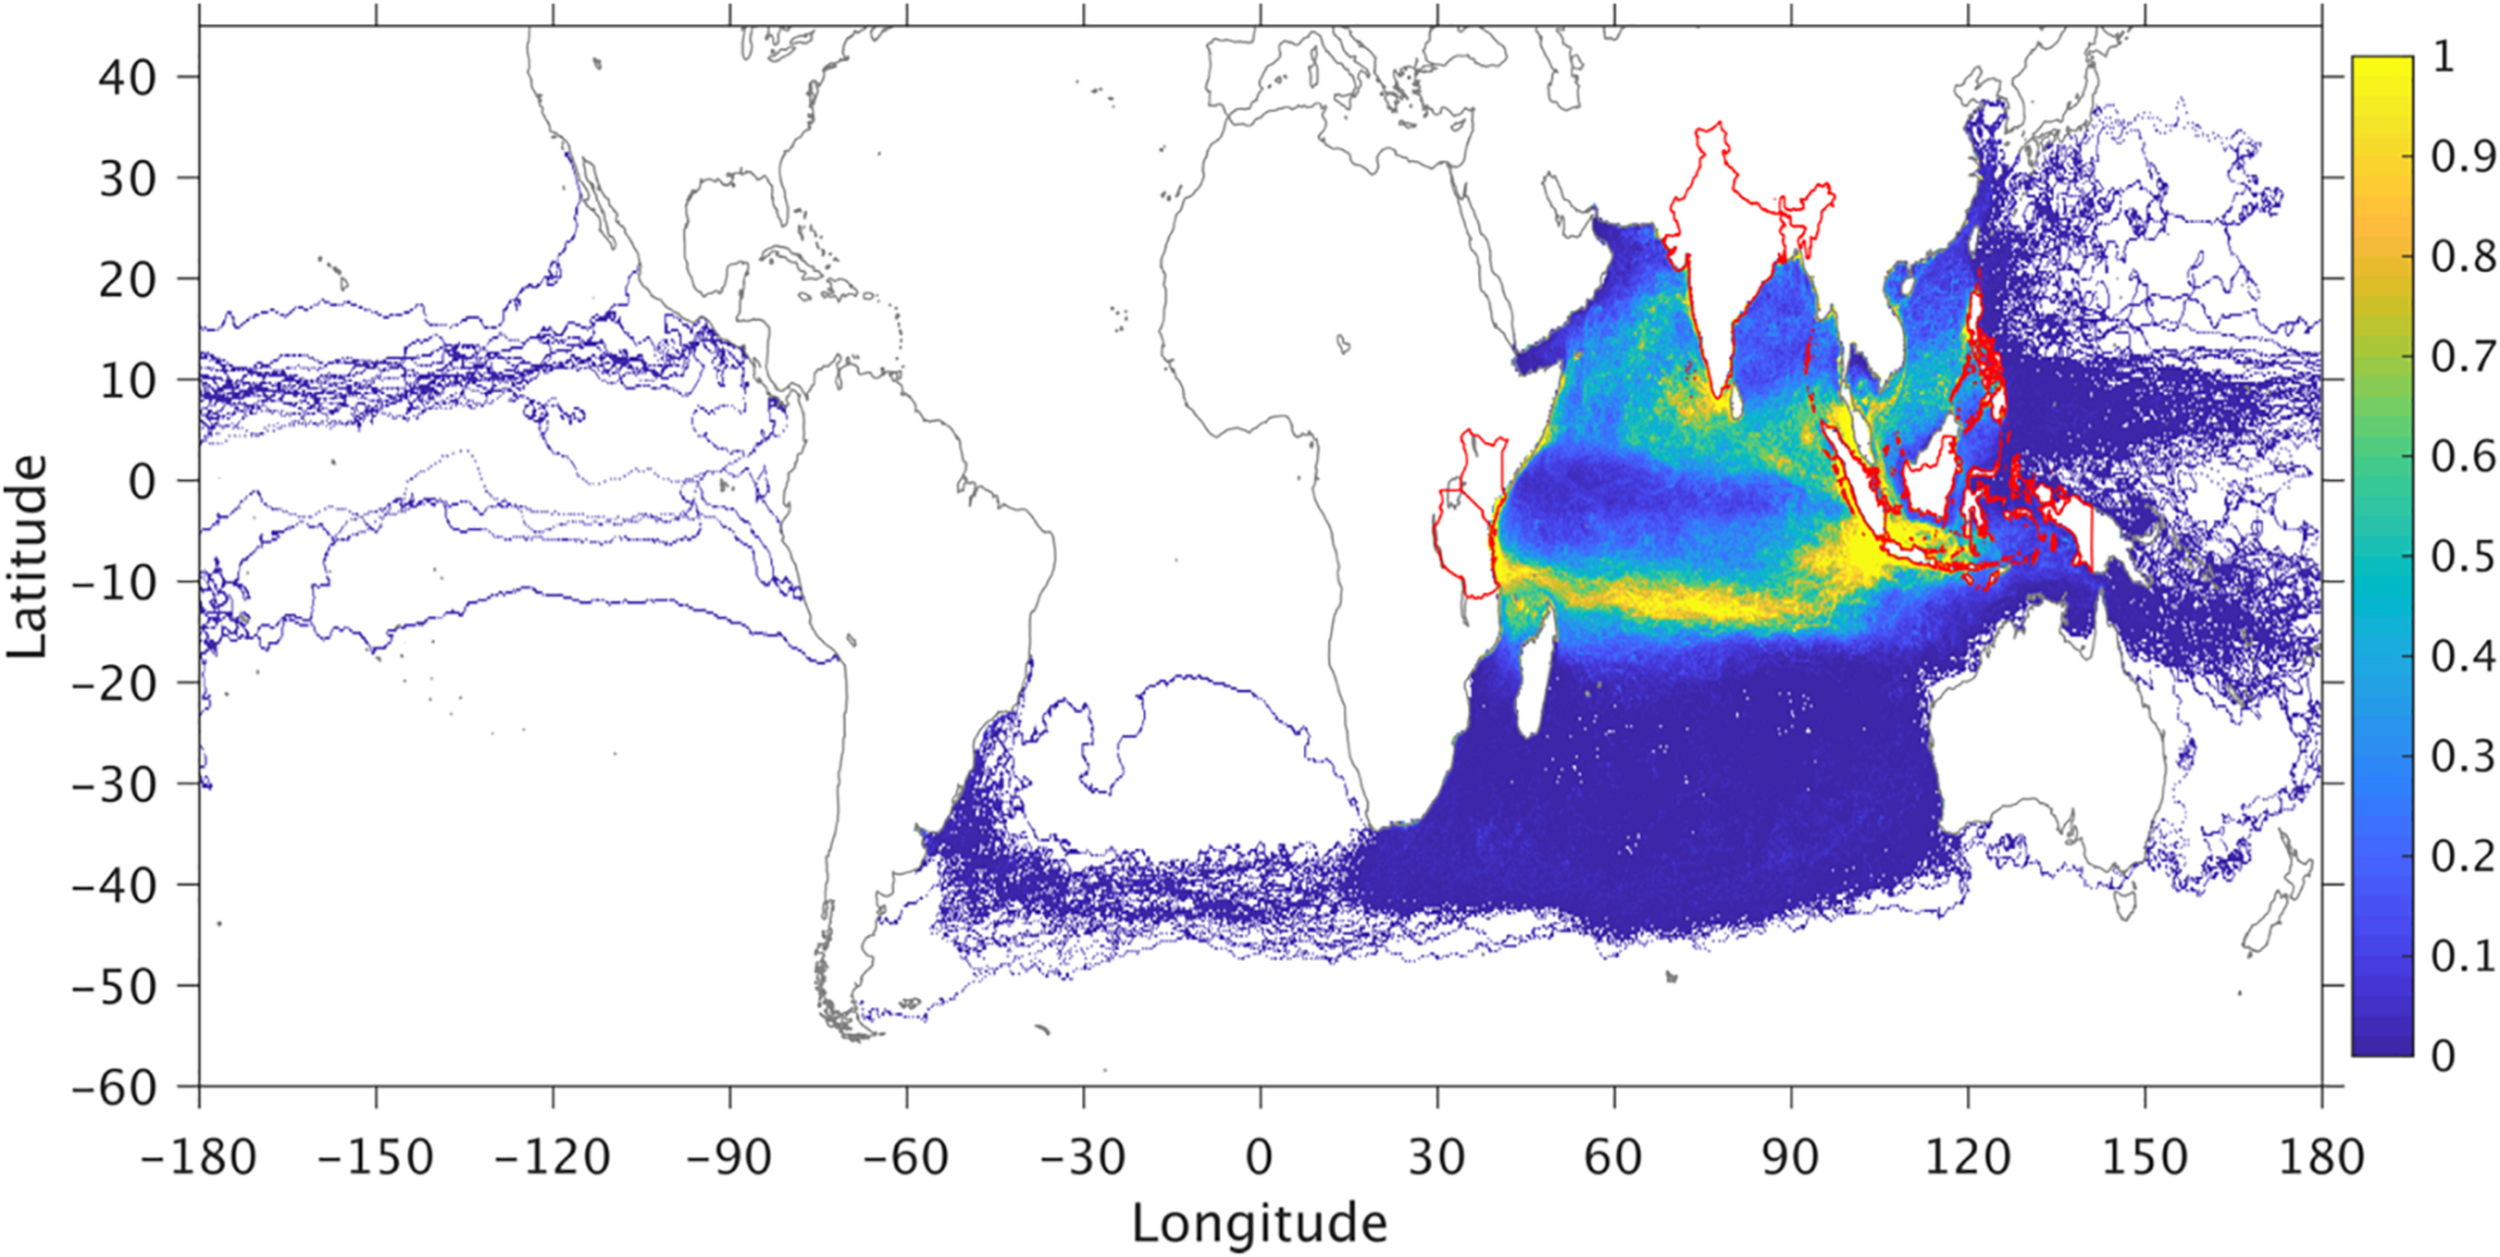
Time-averaged model mismanaged plastic waste concentration (in kg/km2) in the ocean in 2010-2019 for the MPW that are beached on the Kenyan coast by the end of 2019. Red lines outline the border of the five countries that contribute the most mismanaged plastic waste to Kenya (Tanzania, Indonesia, India, Philippines, and Kenya; see Table 2).
Quantitatively, the model shows that, in ten years, a total of 48,304 tons of MPW from 46 countries (Table 2) reached the Kenyan coast (with 19 countries contributing at least 50 tons). The southern neighbor Tanzania contributed the most (38% of the total), which is consistent with MPW being advected by the northward-flowing current along the Tanzanian and Kenyan coasts (Semba et al., 2019). Three southern Asian countries (Indonesian, India, and the Philippines) together contribute 43.5%. These MPW are first carried to the eastern part of the equatorial Indian Ocean, through the Indonesian Throughflow (ITF, Gordon et al., 1997; Metzger et al., 2010) or the Monsoon Current in the North Indian Ocean, before being carried to the Tanzanian/Kenyan coasts via the westward-flowing South Equatorial Current.
TABLE 2
| MPW tons [percentage] | Origin* | number of bottles** | Origin |
| 18,300 [37.9] | Tanzania | 1,227 | Kenya |
| 12,640 [26.2] | Indonesia | 98 | Tanzania |
| 5,209 [10.8] | India | 86 | Indonesia |
| 3,160 [6.5] | Philippines | 42 | United Arab Emirates |
| 2,154 [4.5] | Kenya | 27 | China |
| 1,507 [3.1] | Malaysia | 16 | India |
| 1,370 [2.8] | Comoros | 15 | Malaysia |
| 743 [1.5] | Vietnam | 14 | Mayotte |
| 519 [1.1] | China | 13 | Madagascar |
| 515 [1.1] | Sri Lanka | 9 | Comoros |
| 418 [0.9] | Mozambique | 8 | Thailand |
| 375 [0.8] | Myanmar | 5 | Vietnam |
| 277 [0.6] | Thailand | ||
| 204 [0.4] | Bangladesh | ||
| 196 [0.4] | Pakistan | ||
| 155 [0.3] | Timor-Leste | ||
| 144 [0.3] | South Africa | ||
| 115 [0.2] | Somalia | ||
| 51 [0.1] | Madagascar |
Origin of the modeled MPW found along the Kenyan coast, a total of 48,304 tons, along with the list of country/origin of the bottles that were found during the National Marine Litter Data Collection Training in August 13–22, 2019 (Ryan, 2020).
*27 countries contributed less than 50 tons MPW (0.1%) are not listed: Yemen, Taiwan, Solomon Islands, Brazil, Papua New Guinea, Uruguay, Australia, Djibouti, Peru, Argentina, Mexico, Maldives, Vanuatu, Brunei, Guatemala, Oman, Seychelles, Fiji, Mauritius, Japan, El Salvador, Panama, Iran, Eritrea, Samoa, Palau, and Micronesia. **(many) countries with less than five bottles are not listed.
Because in-situ data are difficult to collect, not much exists that can be used to validate the model. It is already challenging to quantify the amount of plastics found on beaches (often remote), let alone to provide further reliable information on its origin. The reason Kenya was chosen as the example here is that data collected in Kenya during the National Marine Litter Data Collection Training in August 13−22, 2019 (Ryan, 2020) are available, which can provide some perspective of the model results. That data collection team found a total of 1,819 plastic bottles on Kenyan beaches during the 10-day training period with about two-thirds (1,227) determined to be of local origin and from Kenya. For those identified as coming from outside of Kenya, the two countries that contribute the most ocean MPW to Kenya in our global model (Tanzania and Indonesia) are also the top two countries in the bottle counts (Table 2). Other countries, such as China, India, and Malaysia, are also among the key contributors in both the (bottle counts) data and the modeled MPW. Clearly, such a comparison is limited, but a reasonable agreement exists between the model and the observations. Overall, MPW found on the Kenyan coast has two major origins: (1) East African countries, its southern neighbor Tanzania in particular, and (2) South Asian countries (and the islands in the western Indian Ocean on the path of the South Equatorial Current).
Summary
In summary, using worldwide estimates of MPW provided by Lebreton et al. (2017) and Lebreton and Andrady (2019), we are able to provide a quantitative global estimate of (1) where does MPW released into the ocean by a given country go and (2) where does MPW found on the coastline of a given country come from. Tables summarizing the statistics for all world countries can be accessed from the supplemental information in .pdf or .csv formats. Our results illustrate how countries that are far apart are connected via a complex web of ocean pathways and we find that the overall distribution of the modeled MPW is in good agreement with the limited observations that we have at our disposal and with previous studies. However, observations of MPW that can be used to validate the model are extremely scarce and it is difficult, not only to quantify the amount of plastic found on beaches (often remote), but also to have any information on its origin. As shown in section “Results”, the numerical results are consistent with data collected in Kenya during the National Marine Litter Data Collection Training (Ryan, 2020), but we would need many more measurements of this kind from many countries to have a more accurate estimate of the origin of MPW found on the coastline. This is further complicated by the fact that a lot of MPW released in the ocean by a country do not necessarily originate from that country. Law et al. (2020) estimates that more than half of all plastics collected for recycling in the U.S. are shipped abroad and that 88% (∼1 million metric tons) of the exported plastic went to countries that struggle to effectively manage, recycle, or dispose of plastics.
This modeling study has limitations in that it does not fully take into account the life cycle of the plastic at sea (approximated using a five-year decay time scale), nor does it take into account the size of the litter (macro to nano) and differences in windage. There are also uncertainties associated with ocean currents and the winds used to move the MPW in the ocean. Nonetheless, it does provide first-order numbers that can be used by governments, non-profit organizations, and the general public to redirect or reinforce actions to reduce the amount of marine litter. This is especially important since a recent publication by Borrelle et al. (2020) estimates that in the next 10 years the plastic waste that enters into waterways and ultimately the oceans could reach 22 million tons and possibly as much as 58 million tons a year. And, this estimation takes into account the thousands of commitments made by the government and the industry to reduce plastic pollution.
Statements
Data availability statement
The original contributions presented in the study are included in the article Supplementary Material, further inquiries can be directed to the corresponding author.
Author contributions
EC initiated and coordinated the study. XX configured the simulations and performed the analysis. OZ-R ran the OceanParcels simulations and developed the web interface. All the authors participated in the interpretation of the results and in the writing of the manuscript.
Funding
The work was supported by the United Nations Environment Program (UNEP) small scale funding agreements SSFA/2019/1345 and SSFA/2020/2665.
Acknowledgments
The authors would like to thank Jillian Campbell and Heidi Savelli-Soderberg for their input, and Tracy Ippolito for proofreading the manuscript.
Conflict of interest
The authors declare that the research was conducted in the absence of any commercial or financial relationships that could be construed as a potential conflict of interest.
Supplementary material
The Supplementary Material for this article can be found online at: https://www.frontiersin.org/articles/10.3389/fmars.2021.667591/full#supplementary-material
Footnotes
References
1
Andrady A. L. (2011). Microplastics in the marine environment.Mar. Pollut. Bull.621596–1605. 10.1016/j.marpolbul.2011.05.030
2
Ardhuin F. Chapron B. Collard F. (2009). Observation of swell dissipation across oceans.Geophys. Res. Lett.36:L06607. 10.1029/2008GL037030
3
Barrett J. Chase Z. Zhang J. Holl M. M. B. Willis K. Williams A. et al (2020). Microplastic pollution in deep-sea sediments from the great Australian Bight.Front. Mar. Sci.7:576170. 10.3389/fmars.2020.576170
4
Bergmann M. Tekman M. Gutow L. (2017). Sea change for plastic pollution.Nature544:297. 10.1038/544297a
5
Borrelle S. B. Ringma J. Law K. L. Monnahan C. C. Lebreton L. McGivern A. et al (2020). Predicted growth in plastic waste exceeds efforts to mitigate plastic pollution.Science181515–1518. 10.1126/science.aba3656
6
Breivik Ø Allen A. A. Maisondieu C. Roth J. C. (2011). Wind-induced drift of objects at sea: the leeway field method.Appl. Ocean Res.33100–109. 10.1016/j.apor.2011.01.005
7
Chassignet E. P. Hurlburt H. E. Metzger E. J. Smedstad O. M. Cummings J. Halliwell G. R. et al (2009). U.S. GODAE: global ocean prediction with the hybrid coordinate ocean model (HYCOM).Oceanography2264–75. 10.5670/oceanog.2009.39
8
Chenillat F. Huck T. Maes C. Grima N. Blanke B. (2021). Fate of floating plastic debris released along the coasts in a global ocean model.Mar. Pollut. Bull.165:112116. 10.1016/j.marpolbul.2021.112116
9
Chiba S. Saito H. Fletcher R. Yogi T. Kayo M. Miyagi S. et al (2018). Human footprint in the abyss: 30 year records of deep-sea plastic debris.Mar. Policy96204–212. 10.1016/j.marpol.2018.03.022
10
Chubarenko I. Bagaev A. Zobkov M. Esiukova E. (2016). On some physical and dynamical properties of microplastic particles in marine environment.Mar. Pollut. Bull.108105–112. 10.1016/j.marpolbul.2016.04.048
11
Cózar A. Echevarría F. González-Gordillo J. I. Irigoien X. Úbeda B. Hernández-León S. et al (2014). Plastic debris in the open ocean.Proc. Natl. Acad. Sci.U.S.A.11110239–10244. 10.1073/pnas.1314705111
12
Cózar A. Sanz-Martín M. Martí E. González-Gordillo J. I. Ubeda B. Gálvez J. Á, et al. (2015). Plastic accumulation in the Mediterranean Sea.PLoS One10:e0121762. 10.1371/journal.pone.0121762
13
Cummings J. A. Smedstad O. M. (2013). “Chapter 13: variational data assimilation for the global ocean,” in Data Assimilation for Atmospheric, Oceanic and Hydrologic Applications, Vol. II, edsParkS.XuL. (Berlin: Springer), 303–343. 10.1007/978-3-642-35088-7_13
14
Delandmeter P. van Sebille E. (2019). The Parcels v2.0 Lagrangian framework: new field interpolation schemes.Geosci. Model Dev.123571–3584. 10.5194/gmd-12-3571-2019
15
Dobler D. Huck T. Maes C. Grima N. Blanke B. Martinez E. et al (2019). Large impact of Stokes drift on the fate of surface floating debris in the South Indian Basin.Mar. Pollut. Bull.148202–209. 10.1016/j.marpolbul.2019.07.057
16
Galgani F. Brien A. S. Weis J. Ioakeimidis C. Schuyler Q. Makarenko I. et al (2021). Are litter, plastic and microplastic quantities increasing in the ocean?Micropl. Nanopl.1:2. 10.1186/s43591-020-00002-8
17
Geyer R. Jambeck J. Law K. L. (2017). Production, use, and fate of all plastics ever made.Sci. Adv.3:e1700782. 10.1126/sciadv.1700782
18
Gordon A. L. Ma S. Olson D. B. Hacker P. Ffield A. Talley L. D. et al (1997). Advection and diffusion of Indonesian through flow water within the Indian ocean south equatorial current.Geophys. Res. Lett.242573–2576. 10.1029/97gl01061
19
Hardesty B. D. Lawson T. J. van der Velde T. Lansdell M. Wilcox C. (2017). Estimating quantities and sources of marine debris at a continental scale.Front. Ecol. Environ.15:18–25. 10.1002/fee.1447
20
Helber R. W. Townsend T. L. Barron C. N. Dastugue J. M. Carnes M. R. (2013). Validation Test Report for the Improved Synthetic Ocean Profile (ISOP) System, Part I: Synthetic Profile Methods and Algorithm.NRL Memo. Report, NRL/MR/7320—13-9364. Hancock, MS: Stennis Space Center.
21
Hoornweg D. Bhada-Tata P. (2012). What a Waste: a Global Review of Solid Waste Management.Urban development series; knowledge Papers No. 15. Washington, DC: World Bank.
22
Jambeck J. R. Geyer R. Wilcox C. Siegler T. R. Perryman M. Andrady A. L. et al (2015). Plastic waste inputs from land into the ocean.Science347768–771. 10.1126/science.1260352
23
Kimukai H. Yoichi K. Koushirou K. Masaki O. Kazunori Y. Toshihiko H. et al (2020). Low temperature decomposition of polystyrene.Appl. Sci.10:5100. 10.3390/app10155100
24
Kinsman B. (1965). Wind Waves.Upper Saddle River, NJ: Prentice-Hall, 660.
25
Kubota M. (1994). A mechanism for the accumulation of floating marine debris north of Hawaii.J Phys. Oceanogr.241059–1064. 10.1175/1520-0485(1994)024<1059:amftao>2.0.co;2
26
Kukulka T. Proskurowski G. Morét-Ferguson S. Meyer D. W. Law K. L. (2012). The effect of wind mixing on the vertical distribution of buoyant plastic debris.Geophys. Res. Lett.39:L07601. 10.1029/2012GL051116
27
Landrigan P. J. Stegeman J. J. Fleming L. E. Allemand D. Anderson D. M. Backer L. C. et al (2020). Human health and ocean pollution.Ann. Glob. Health86:151. 10.5334/aogh.2831
28
Law K. L. Starr N. Siegler T. R. Jambeck J. R. Mallos N. J. Leonard G. H. (2020). The United States’ contribution of plastic waste to land and ocean.Sci. Adv.6:eabd0288. 10.1126/sciadv.abd0288
29
Lebreton L. Andrady A. (2019). Future scenarios of global plastic waste generation and disposal.Palgrave Commun.5:6. 10.1057/s41599-018-0212-7
30
Lebreton L. Slat B. Ferrari F. Sainte-Rose B. Aitken J. Marthouse R. et al (2018). Evidence that the Great Pacific Garbage Patch is rapidly accumulating plastic.Sci. Rep.8:4666. 10.1038/s41598-018-22939-w
31
Lebreton L. van der Zwet J. Damsteeg J. W. Slat B. Andrady A. Reisser J. (2017). River plastic emissions to the world’s oceans.Nat. Commun.8:15611. 10.1038/ncomms15611
32
Maes C. Blanke B. Martinez E. (2016). Origin and fate of surface drift in the oceanic convergence zones of the eastern Pacific.Geophys. Res. Lett.433398–3405. 10.1002/2016gl068217
33
Maes C. Grima N. Blanke B. Martinez E. Paviet-Salomon T. Huck T. (2018). A surface “superconvergence” pathway connecting the South Indian Ocean to the subtropical South Pacific gyre.Geophys. Res. Lett.451915–1922. 10.1002/2017GL076366
34
Metzger E. Helber R. W. Hogan P. J. Posey P. G. Thoppil P. G. Townsend T. L. et al (2017). Global Ocean Forecast System 3.1 validation test.Technical Report. NRL/MR/7320–17-9722. Hancock, MS: Stennis Space Center, 61.
35
Metzger E. J. Hurlburt H. E. Xu X. Gordon A. L. Sprintall J. Susanto R. D. et al (2010). Simulated and observed circulation in the Indonesian Seas: 1/12° global HYCOM and the INSTANT observations.Dyn. Atmos. Oceans50275–300. 10.1016/j.dynatmoce.2010.04.002
36
Metzger E. J. Smedstad O. M. Thoppil P. G. Hurlburt H. E. Cummings J. A. Wallcraft A. J. et al (2014). US Navy operational global ocean and Arctic ice prediction systems.Oceanography2732–43. 10.5670/oceanog.2014.66
37
Moore C. J. Moore S. L. Leecaster M. K. Weisberg S. B. (2001). A comparison of plastic and plankton in the North Pacific Central Gyre.Mar. Pollut. Bull.421297–1300. 10.1016/S0025-326X(01)00114-X
38
Pereiro P. Carlos Souto C. Gago J. (2018). Calibration of a marine floating litter transport model.J. Oper. Oceanogr.11125–133. 10.1080/1755876X.2018.1470892
39
Plastics Europe (2017). Available online at: https://www.plasticseurope.org/en/resources/publications/274-plastics-facts-2017(accessed April 6, 2021).
40
Ryan P. G. (2020). Land or sea? What bottles tell us about the origins of beach litter in Kenya.Waste Manag.11649–57. 10.1016/j.wasman.2020.07.044
41
Schmidt C. Krauth T. Wagner S. (2017). Export of plastic debris by rivers into the sea.Environ. Sci. Technol.5112246–12253. 10.1021/acs.est.7b02368
42
Semba M. Lumpkin R. Kimirei I. Shaghude Y. Nyandwi N. (2019). Seasonal and spatial variation of surface current in the Pemba Channel, Tanzania.PLoS One14:e0210303. 10.1371/journal.pone.0210303
43
Shankar D. Vinayashandran P. N. Unnikrishnan A. S. (2002). The monsoon currents in the north Indian Ocean.Prog. Oceanogr.5263–120. 10.1016/s0079-6611(02)00024-1
44
Special issue on Nanoplastic (2019). Nanoplastic should be better understood.Nat. Nanotechnol.14:299. 10.1038/s41565-019-0437-7
45
Tekman M. B. Krumpen T. Bergmann M. (2017). Marine litter on deep Arctic seafloor continues to increase and spreads to the North at the HAUSGARTEN observatory.Deep Sea Res. Part I Oceanogr. Res. Pap.12088–99. 10.1016/j.dsr.2016.12.011
46
Thompson R. C. Olsen Y. Mitchell R. P. Davis A. Rowland S. J. John A. W. G. et al (2004). Lost at sea: where is all the plastic?Science304838–838. 10.1126/science.1094559
47
Tomczak M. Godfrey J. S. (2003). Regional Oceanography: an Introduction, 2nd Edn. New Delhi: Daya Publishing House.
48
van den Bremer T. S. Breivik Ø (2018). Stokes drift.Phil. Trans. R. Soc. A376:20170104. 10.1098/rsta.2017.0104
49
van Sebille E. Aliani S. Law K. L. Maximenko N. Alsina J. M. Bagaev A. et al (2020). The physical oceanography of the transport of floating marine debris.Env. Res. Lett.15:023003. 10.1088/1748-9326/ab6d7d
50
van Sebille E. England M. H. Froyland G. (2012). Origin, dynamics and evolution of ocean garbage patches from observed surface drifters.Environ. Res. Lett.7:044040. 10.1088/1748-9326/7/4/044040
51
Viatte C. Clerbaux C. Maes C. Daniel P. Garello R. Safieddine S. et al (2020). Air pollution and sea pollution seen from space.Surv. Geophys.411583–1609. 10.1007/s10712-020-09599-0
52
Woodall L. C. Sanchez-Vidal A. Canals M. Paterson G. L. J. Coppock R. Sleight V. et al (2014). The deep sea is a major sink for microplastic debris.R. Soc. Open Sci.1:8. 10.1098/rsos.140317
Appendix: Web Interface
A user-friendly website was developed (https://marinelitter.coaps.fsu.edu/) to present the model results in a dynamic and efficient manner. Twelve five-year monthly releases of MPW are displayed with dynamic animations of streamlines that show the marine litter path through time. The color palettes in the map vary by continent, and the specific color for each country is proportional to the total amount of litter generated. Figure 9 shows a screenshot of this interface and the colors assigned to the continents and their corresponding countries. The web interface also provides information about individual statistics for each country, which includes the tons of litter generated each year, the percentage of marine litter that stay in the oceans, and the amount of litter that ends up on the beach. Each country’s statistics are provided as bar plots, and the raw data can be downloaded from the website in several file formats (.pdf, .csv, and .json). Figure 10 shows an example of the ocean litter statistics for the United States. For an efficient display of the marine litter paths, only a subset of the total simulated particles is shown for each monthly release (half for desktop applications and one forth for mobile browsers), accounting for up to 14 million particle locations in each five-year animation. Finally, the interface empowers the user with multiple animation and cosmetic controls to quickly identify the marine debris pathways through time.
FIGURE 9
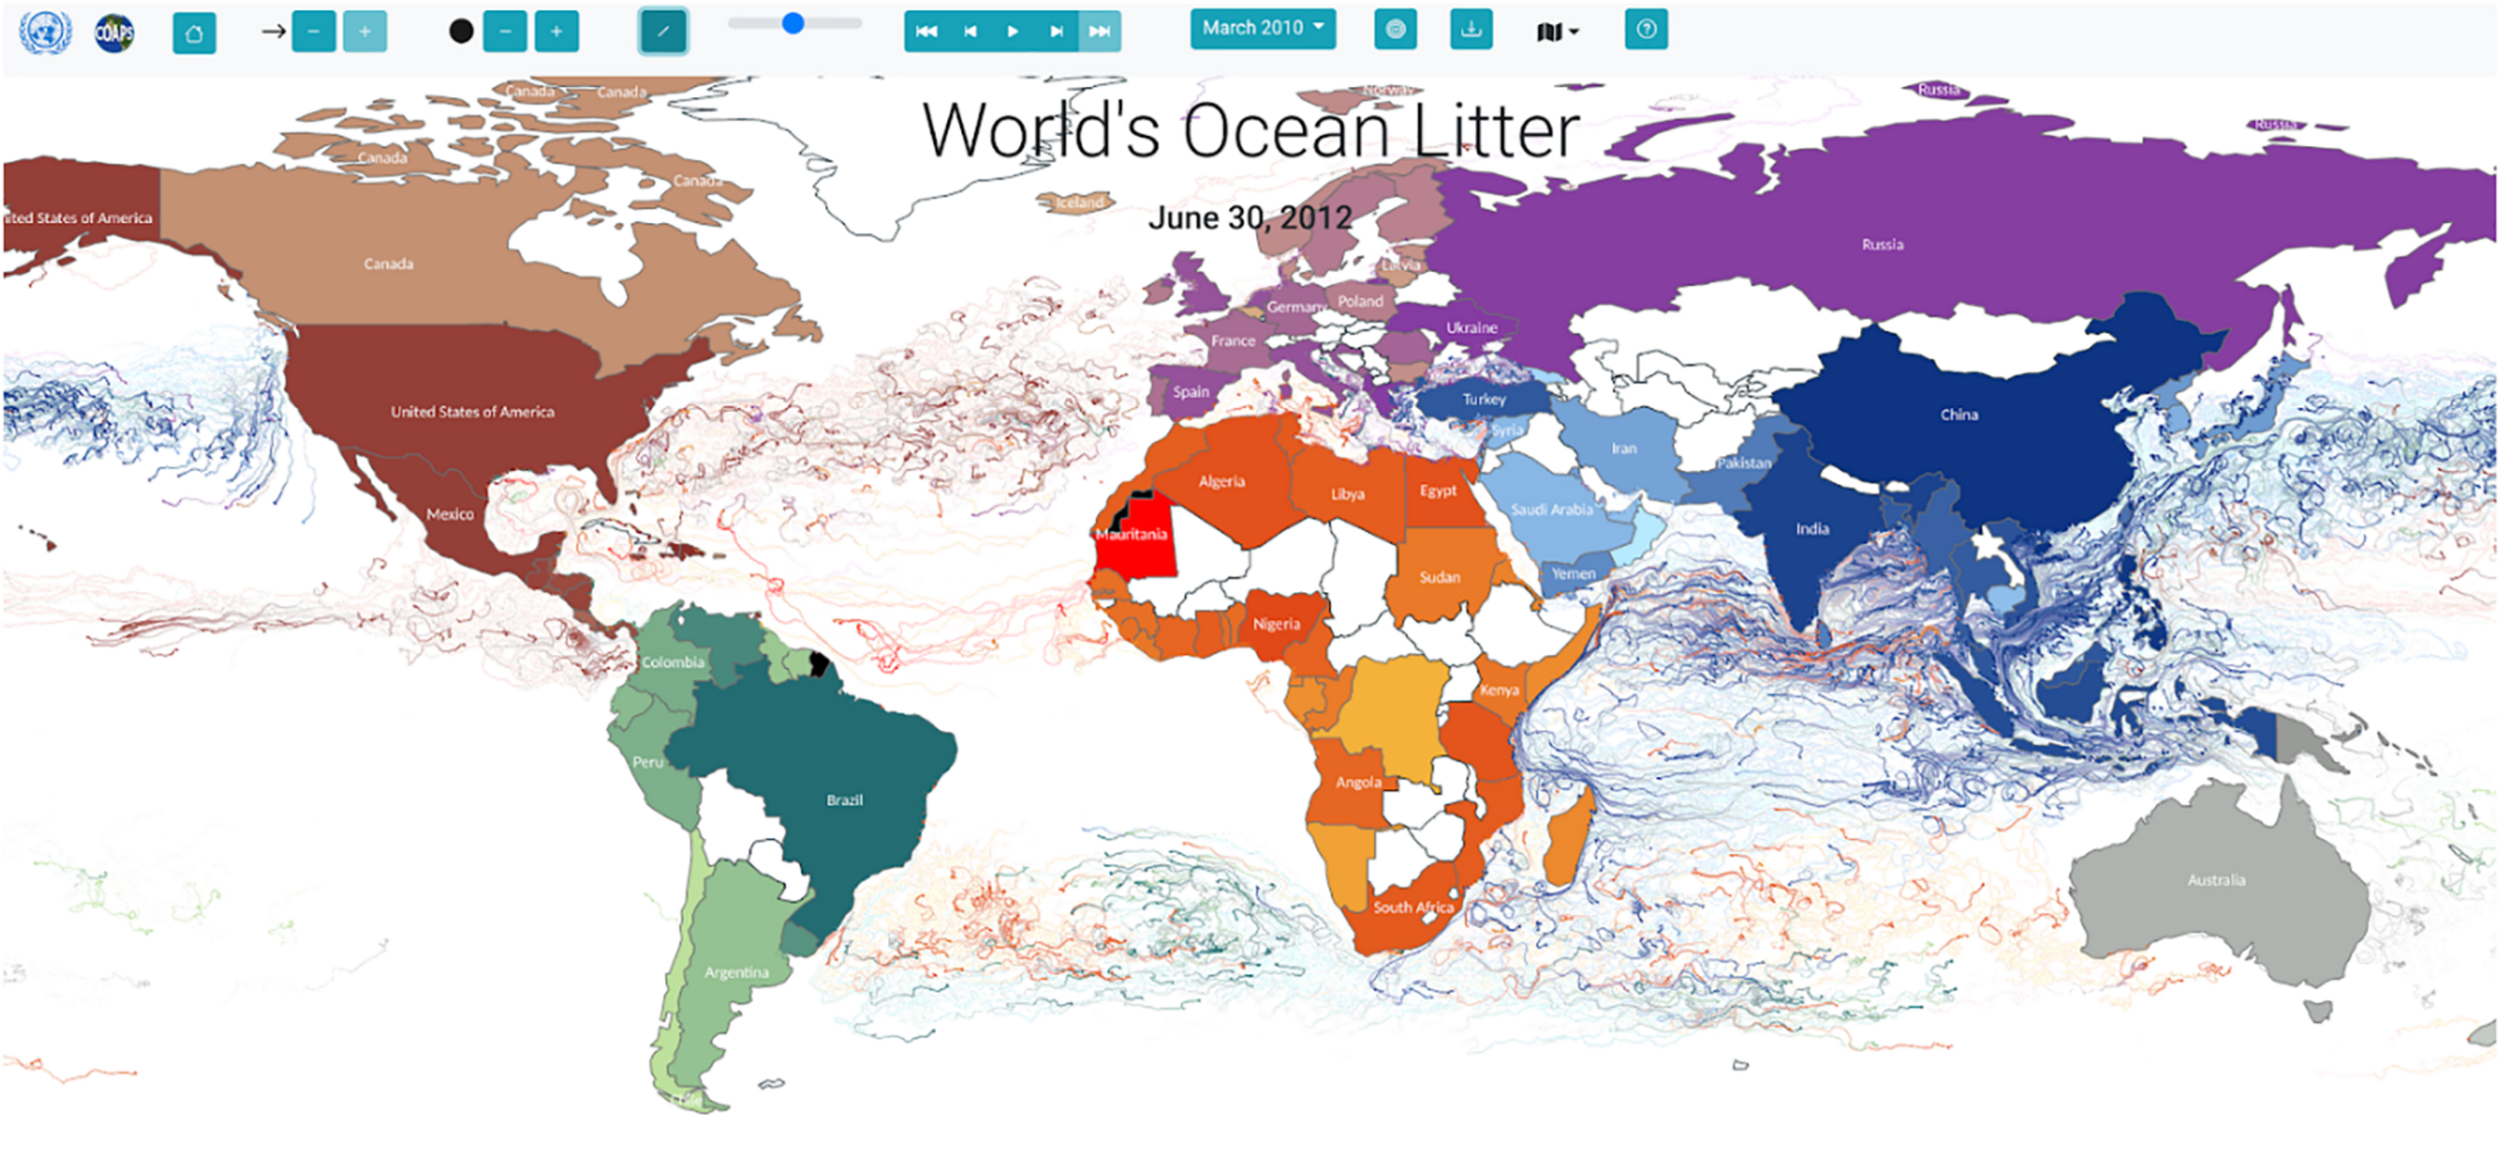
Example of the web interface generated to display global litter paths per country.
FIGURE 10
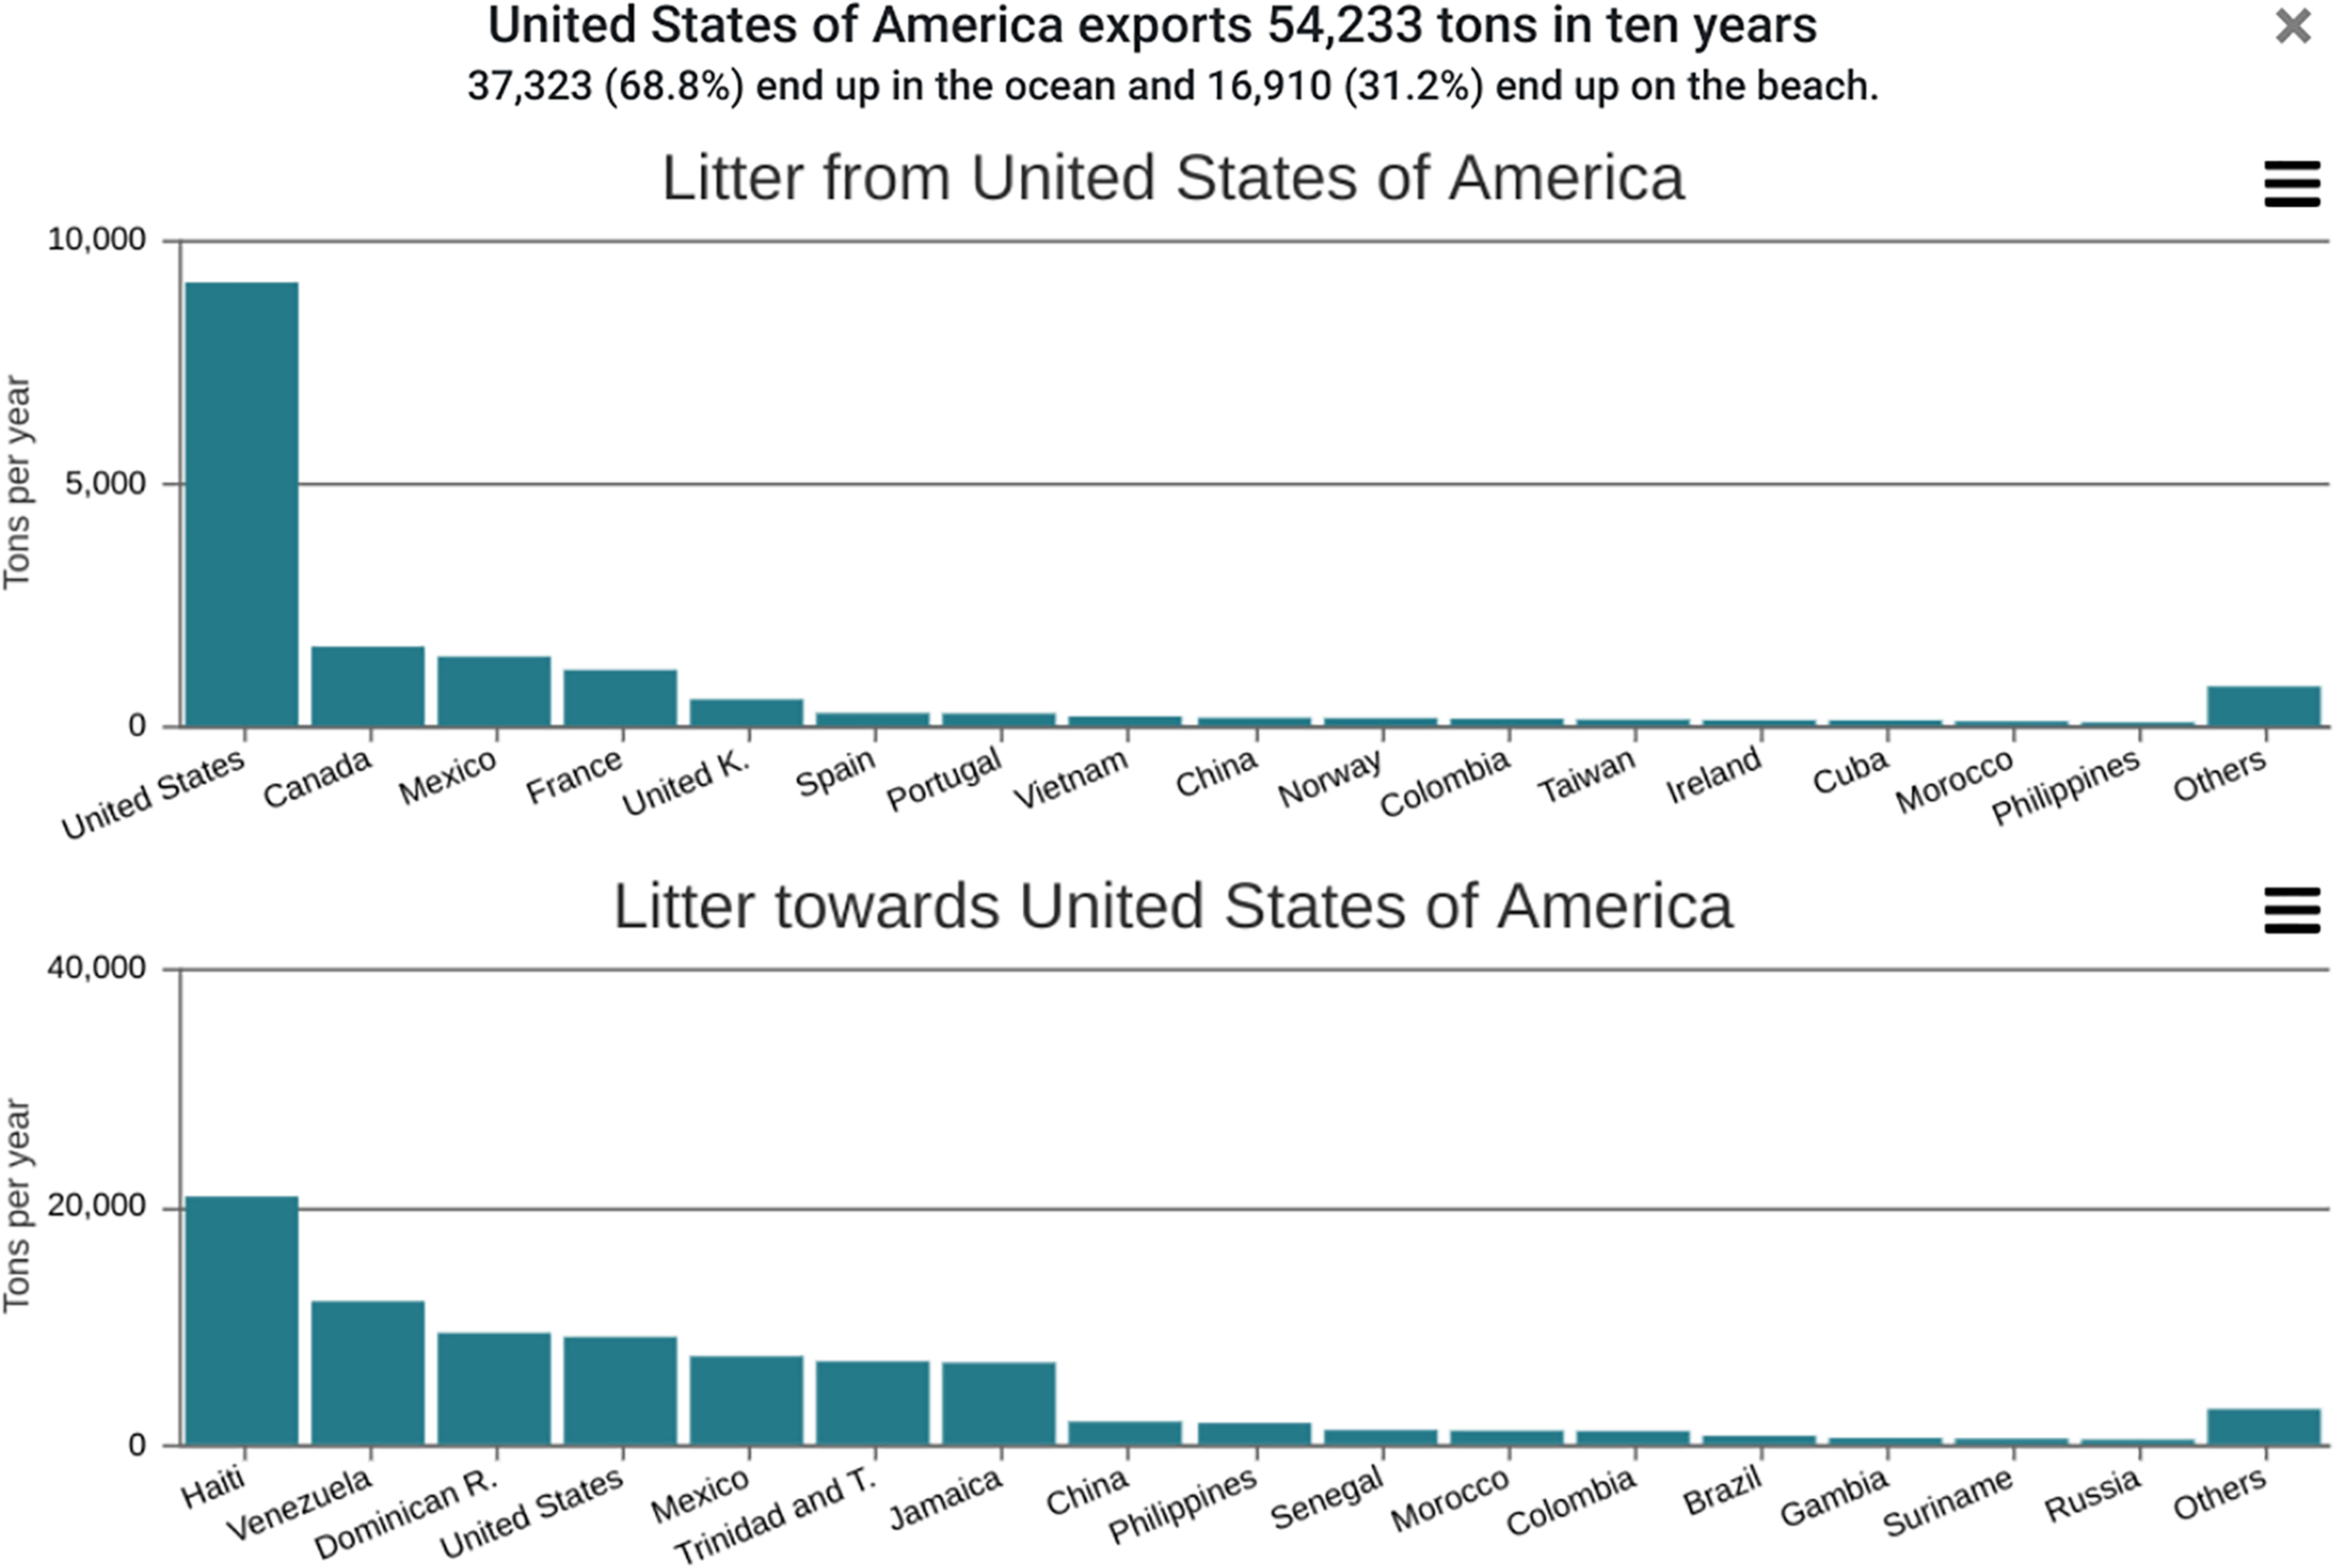
Ocean litter statistics for the United States, as shown on the web interface.
Summary
Keywords
marine litter, plastic, tracking, numerical model, global ocean
Citation
Chassignet EP, Xu X and Zavala-Romero O (2021) Tracking Marine Litter With a Global Ocean Model: Where Does It Go? Where Does It Come From?. Front. Mar. Sci. 8:667591. doi: 10.3389/fmars.2021.667591
Received
13 February 2021
Accepted
29 March 2021
Published
23 April 2021
Volume
8 - 2021
Edited by
Juan José Alava, University of British Columbia, Canada
Reviewed by
André Ricardo Araújo Lima, Center for Marine and Environmental Sciences (MARE), Portugal; Claudia Wekerle, Alfred Wegener Institute Helmholtz Centre for Polar and Marine Research (AWI), Germany
Updates
Copyright
© 2021 Chassignet, Xu and Zavala-Romero.
This is an open-access article distributed under the terms of the Creative Commons Attribution License (CC BY). The use, distribution or reproduction in other forums is permitted, provided the original author(s) and the copyright owner(s) are credited and that the original publication in this journal is cited, in accordance with accepted academic practice. No use, distribution or reproduction is permitted which does not comply with these terms.
*Correspondence: Eric P. Chassignet, echassignet@fsu.edu
This article was submitted to Marine Pollution, a section of the journal Frontiers in Marine Science
Disclaimer
All claims expressed in this article are solely those of the authors and do not necessarily represent those of their affiliated organizations, or those of the publisher, the editors and the reviewers. Any product that may be evaluated in this article or claim that may be made by its manufacturer is not guaranteed or endorsed by the publisher.