 Edgar O. Guzmán-Urieta
 Eric Jordán-Dahlgren
- 1Unidad Académica de Sistemas Arrecifales, Instituto de Ciencias del Mar y Limnología, Universidad Nacional Autónoma de México, Puerto Morelos, México
- 2Posgrado en Ciencias del Mar y Limnología, Universidad Nacional Autónoma de México, México City, México
We analyzed the spatial distribution patterns of a white syndrome (WS) outbreak affecting Pseudodiploria strigosa colonies in the northern Mexican Caribbean during 2018–2019. The purpose of the study was to describe the outbreak progression in a single species and determine if this WS incidence is related to the nearest diseased neighbor distance. Two separated sites with different P. strigosa colonial densities (Bocana: 0.08 col/m2; Picudas: 0.2 col/m2) were selected in similar habitats of the same reef complex. P. strigosa colonies within the survey sites were mapped, and their status was recorded (healthy, diseased, or dead) in sequential surveys until colonies died or the study terminated (306 days). Spatial distribution modes were assessed using Ripley’s K function. The spatial colony distribution was random in one site (Bocana) and clustered in the other (Picudas). However, the WS disease incidence per survey was randomly distributed in both sites throughout the observation period of the outbreak, suggesting that WS transmission at small spatial scales was independent of the colony distribution pattern and from the nearest diseased colonies. Survival probability since WS onset in surveyed colonies was different: 0% at Bocana and 14% at Picudas by April 2019. But, eventually, all diseased colonies died in both sites. WS outbreak timing was different at the two sites: Initial prevalence 8% at the Bocana site vs. 44% at Picudas site. Distribution of time to disease onset shown multimodality, with modes varying from 17 to 184 days and wide main modes amplitude suggest a highly variable resistance to the WS. Disease incidence was not abated during winter surveys. Differences between sites in the WS disease outbreak distribution and progression suggest that colony condition, environmental quality, and perhaps several transmission events played an essential role in the complex outbreak dynamics at the local spatial scale of our study.
Introduction
In recent years outbreaks of a lethal white syndrome (WS) affecting many species in several Caribbean reefs have been reported. The nature, timing, and regional spread of the outbreak in the Caribbean region (AGRRA, 2019), strongly suggest a similar outbreak in the NE Mexican Caribbean (Álvarez-Filip et al., 2019) as well as that previously reported for Florida (Precht et al., 2016). In recent publications, these outbreaks have been named “stony coral tissue loss disease” (SCTLD; FKNMS (Florida Keys National Marine Sanctuary), 2018), although in our surveys signs also correspond to the white plague type II (WP-II) description (Richardson et al., 1998). The spreading spatial patterns have suggested a primary infectious causal agent and diminishing tissue loss rates in affected colonies treated with antibiotics reinforce the idea that a bacterial infection is involved in SCTDL syndrome development (Neely et al., 2020). Nevertheless, so far, although several putative bacterial agents have been proposed (Aeby et al., 2019; Meyer et al., 2019; Paul et al., 2019; Iwanowicz et al., 2020; Thomé et al., 2021) no causality has been demonstrated, only association, which is not evidenced enough (Hill, 1965; Evans, 1976). Moreover, given the above, it seems that opportunistic pathogens may play a confusing role to the extent that Aeby et al. (2019) consider that not just bacteria, but viruses or even protozoa may play a causal role in the SCTLD. In contrast, Landsberg et al. (2020), ponder the possibility that there may be no infectious agent in the primary etiology of the SCTLD.
Disease transmission of infectious diseases may occur by direct contact between diseased and susceptible organisms or by indirect transmission by vector-borne (mechanical or biological) and in the case of the marine environment by water-borne transmission (Shore and Caldwell, 2019). In one host one parasite system, the diseased triad (host, pathogen, and environment) can be equally applied to disease transmission, instead of the classic one pathogen–one host point of view (Antonovics, 2017). And a more complex panorama arises for disease transmission in highly diverse ecological systems, more so if subject to continuous environmental change (Webster et al., 2017; Brooks and Boeger, 2019). It is considered that a primary infection outbreak tends to show a spatial dependence in diseased corals (Muller and van Woesik, 2012; Thrusfield, 2016). However, Jolles et al. (2002) argue that a clustered distribution of diseased colonies follows a random one and is determined by direct colony contact, a secondary transmission process. Zvuloni et al. (2009) found a clustered distribution of Black Band disease affected colonies at very small spatial scales in dense multispecies coral assemblages. In contrast, Sharp et al. (2020) report no clustered distribution for SCTLD in multispecies assemblages at relatively small scales in Florida, whereas, Muller et al. (2020) report significant clustering at different large spatial scales for SCTLD, also along the Florida reef tract. Webster et al. (2017) point out that in complex ecosystems many simultaneous transmission modes may coexist, further confounding spatial patterns interpretation.
However, our present insight into outbreak transmission patterns in the reef environment is based on multispecies coral assemblages that may not adequately describe the single species response. To improve our understanding of the spatial spread of this WS outbreak at the species level, we studied the temporal incidence variation along with the outbreak in two populations of the highly susceptible scleractinian coral Pseudodiploria strigosa (Precht et al., 2016; Álvarez-Filip et al., 2019; Landsberg et al., 2020) in northern Mexican Caribbean reefs. To characterize the incidence patterns we analyze the WS incidence spatial distribution patterns at several intervals during the outbreak to find out to what extent colony proximity was a determining factor in the spatial distribution incidence patterns of this WS in P. strigosa. We also contrast survival probabilities and the temporal patterns of apparently healthy colonies to become diseased among the relatively nearby two study sites, to further describe the dynamics of the outbreak.
We decided to maintain the hypernym of WS for this outbreak because: (a) the uncertainty of identifying a coral disease simply by visual signs in the field (Work and Aeby, 2006; Thrusfield, 2016); (b) that many “old” Caribbean coral diseases, such as the plagues as originally described are still extant; and (c) that in our surveys we observed both SCTLD and WP-II specific disease signs (SCTLD: tissue sloughing and multifocal lesions. WP-II: basal initiation and unifocal rapid in-colony spread).
Materials and Methods
Study Site
The study was conducted in two back reef zone sites of Puerto Morelos Reef in the northeastern Yucatan peninsula, Mexico: Picudas (20°53′02′′N and 86°50′54′′W) and Bocana (20°52′29′′N and 86°51′06′′W (Figure 1). At these sites P. strigosa colonies were abundant and the WS outbreak was beginning. Both sites were deployed in back reef coral grounds behind the reef crest, over a flat calcareous pavement 4–5 m deep and nearby reef inlets, a distance of 1,200 m separates the two sites. Picudas site has a denser and more diverse reef biota assemblage and the local wave regime is more pronounced due to a lower reef crest and nearby a wide reef opening; the site is rarely visited. Bocana site is at the lagoon-ward end of an active channel through which reef lagoon waters are flushed out to the sea, and is well protected by a shallower reef crest. It is a favorite site both by snorkelers and scuba divers.
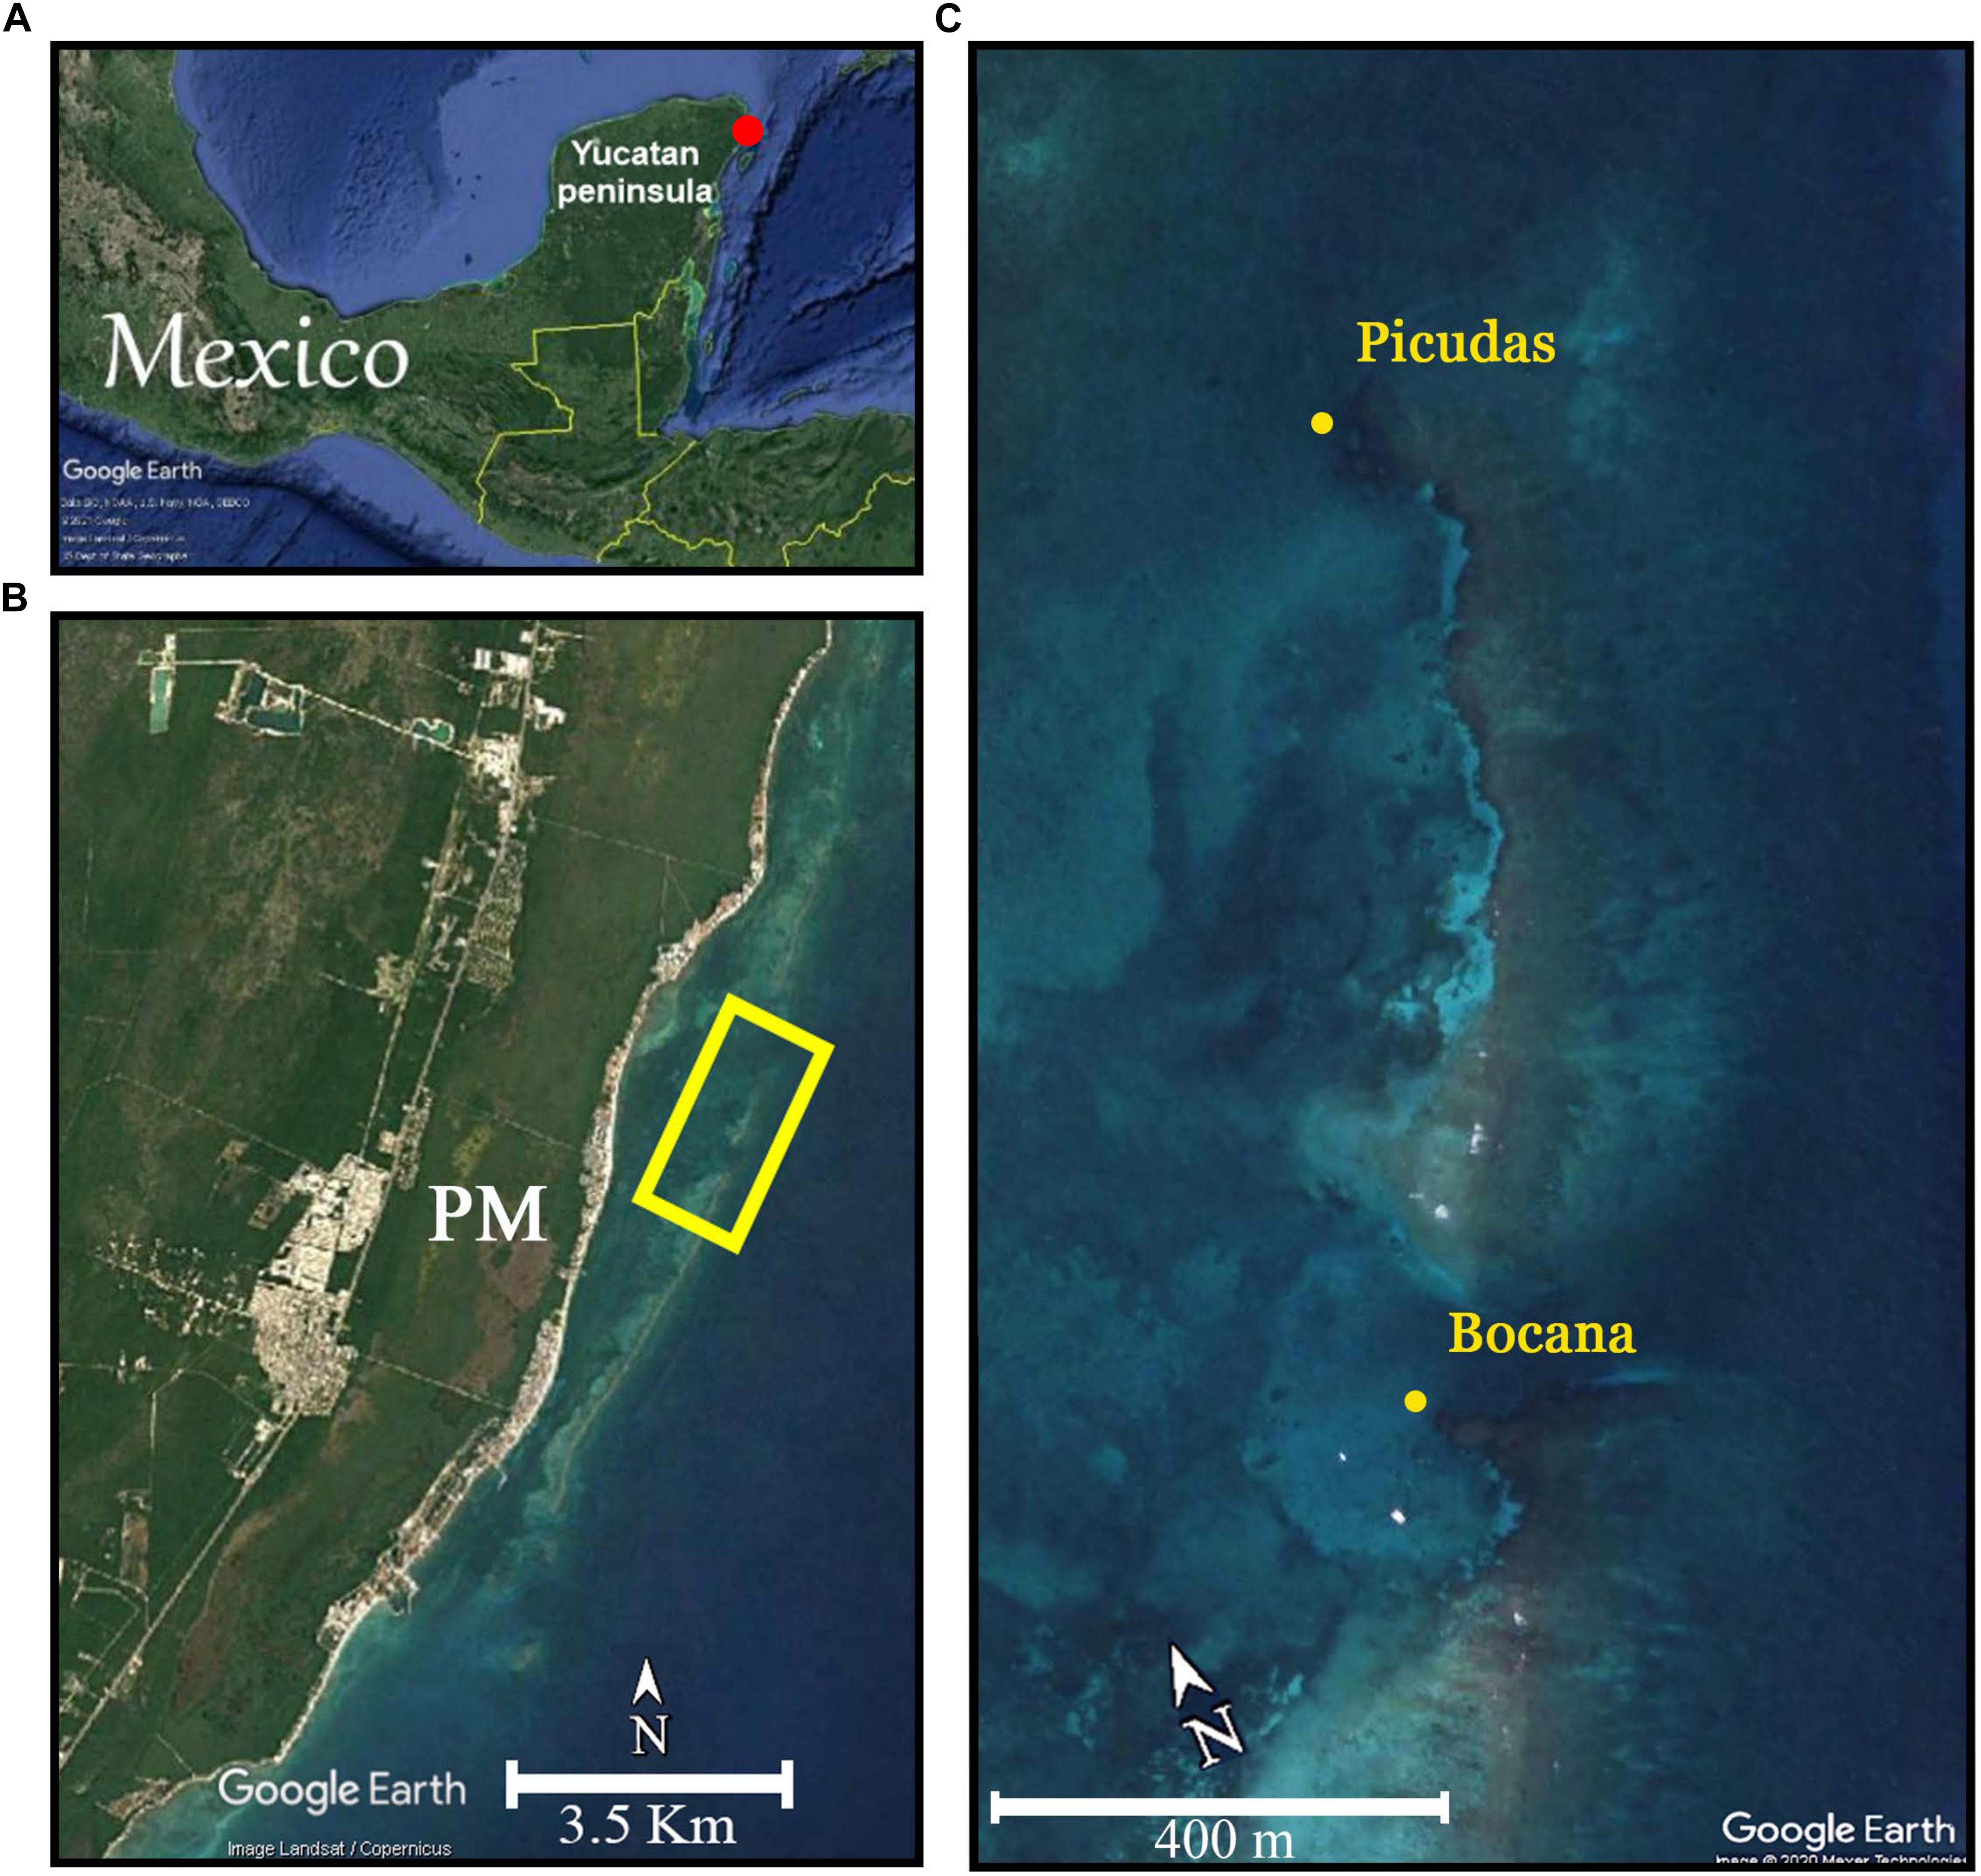
Figure 1. (A) The red point shows the location of the area zone in the Mexican Caribbean. (B) Puerto Morelos reef off the coast of the Puerto Morelos town (PM) and reef area of study sites deployment (yellow square). (C) Location of Bocana and Picudas study sites.
Colony Mapping
Colonies at both sites were mapped following standard topographic procedures, but underwater. The spatial position of each P. strigosa colony was obtained by estimating the distance and bearing of each colony from one or more fixed central points. Bearings to each colony were measured with an alidade table (0.25 degrees precision), oriented to the magnetic north with a compass, and anchored to prevent its movement. A stretched measuring tape running from the alidade center to the same colony provides distances. Conversion to Cartesian coordinates was carried out by trigonometry, and also plotted in an X/Y plane to allow spatial visualization. The extension of the study area at each site was determined by underwater horizontal visibility when mapping, axes in the order of 15 m, and thus surveyed areas were similar: Bocana 453 m2 (Figure 2A), and Picudas 435 m2 (Figure 3A).
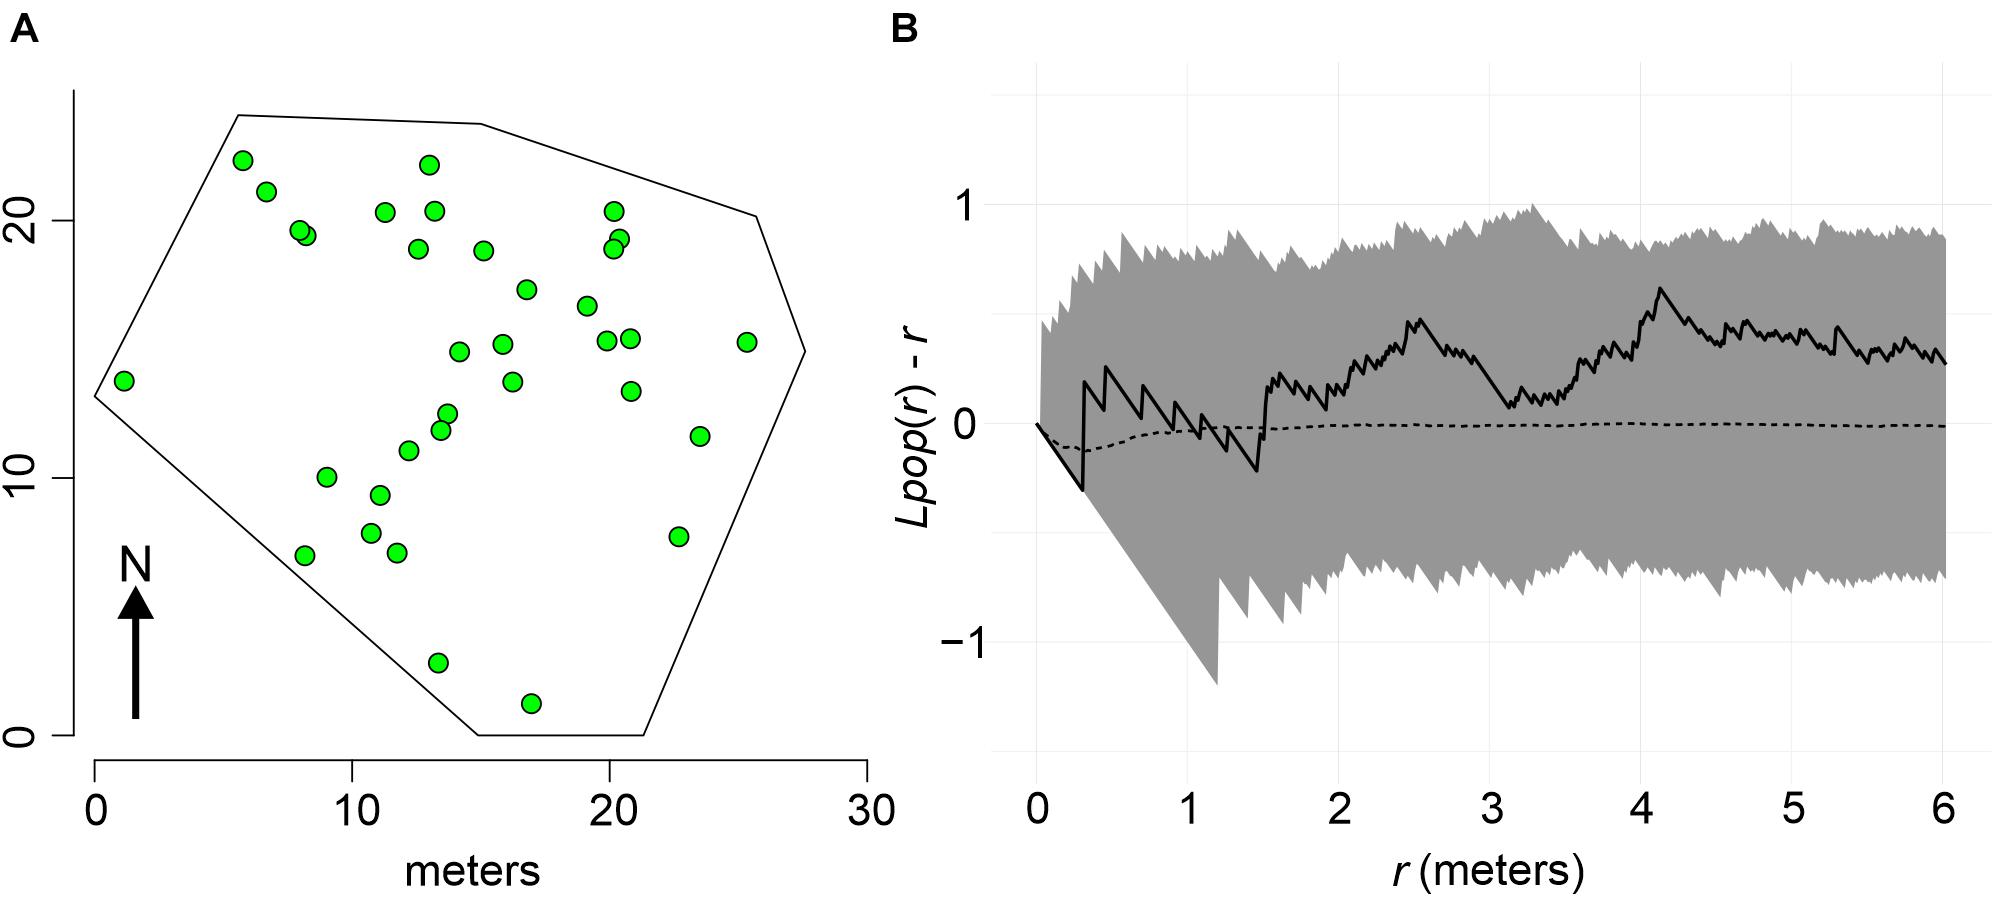
Figure 2. (A) Spatial distribution of P. strigosa colonies at the Bocana site. (B) Random spatial pattern of P. strigosa colonies as indicated by Besag’s transformation plot of Ripleys K of colony pattern distribution. The spatial pattern of the sample (solid line) falls within the 95% confidence envelope (shaded area) of a complete spatial random pattern (dotted line).
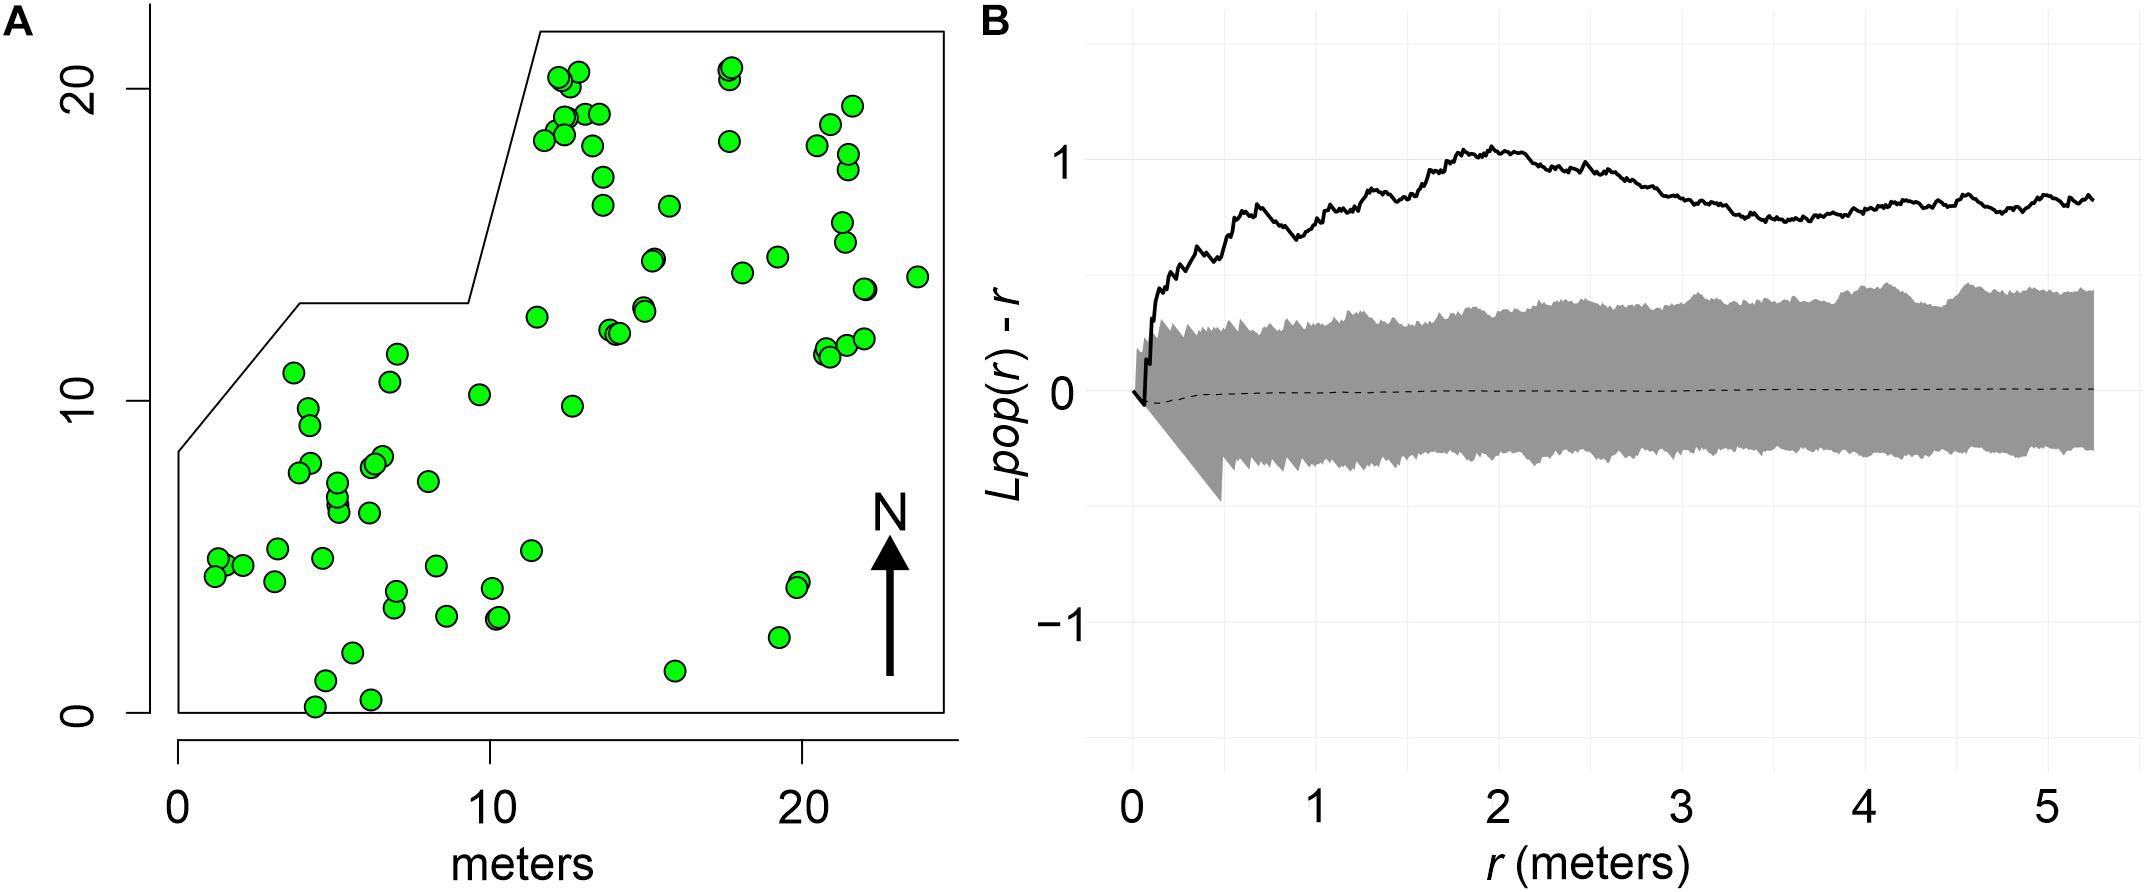
Figure 3. (A) Spatial distribution of P. strigosa colonies at the Picudas site. (B) Clustered spatial pattern of P. strigosa colonies as indicated by Besag’s transformation plot of Ripleys K of colony pattern distribution. The spatial pattern of the sample (solid line) falls outside the 95% confidence envelope (shaded area) of a complete spatial random pattern (dotted line).
The monitoring of P. strigosa colonies began in August 2018. Successive surveys were carried out with an irregular frequency (biweekly to monthly), until April 2019 in Bocana and June 2019 in Picudas, comprising the duration of the outbreak at each site. On each survey, the condition of each colony was recorded as healthy (apparently healthy), diseased (showing WS signs), or dead. All colonies were photographed at each survey to record the signs present and the relative progression of the disease.
Spatial Distribution Analysis
The spatial distribution patterns of P. strigosa colonies at each site, and later the spatial incidence distribution (newly diseased colonies) per survey were calculated using Ripley’s K function (Ripley, 1977). Ripley’s K function computes the expected number of colonies within an increasing radius from an arbitrary colony (Bivand et al., 2013; Baddeley et al., 2016). It is a cumulative function quantifying the type of spatial pattern (clustered, disperse, and random) along the spatial dimensions of the surveyed area. K(r) was calculated as:
where A is the study area, n is the number of colonies in this area, dij is the distance between two colonies i and j. The variable indicator Ir(dij) takes the value of 1 if the distance among points i and j is less than r and 0 otherwise; Wij is introduced to avoid bias due to border effects, as it weights the points in function to their distance to the border. For easier visualization, we normalize K(r) with Besag’s L(r) transformation (Besag, 1977). We use the theoretical L-function for the homogeneous Poisson point process (complete spatial randomness, CSR) as a benchmark that separates spatial clustering from spatial regularity (Baddeley et al., 2016); If a value of = 0, the observed pattern is random, positive values indicates clustering and negative values indicates overdispersion.
To find whether the spatial patterns of colonies (Figures 2B, 3B) were significantly different from a random distribution we applied a CSR test based on Monte Carlo procedures (Myllymäki et al., 2017). Then was compared with a 95% confidence global envelope of null distribution and if L(r) falls into the envelope the spatial pattern is completely random with 95% of confidence (p < 0.05).
In spatial epidemiology, the distribution pattern of a disease is known as a “marked” pattern because it is the result of two processes: one is determined by the spatial distribution of colonies of the study population and the second is determined by the spatial distribution of the status labeled colonies (diseased, healthy, or dead; Bivand et al., 2013; Baddeley et al., 2016). To test for colony spatial pattern dependence among newly diseased colonies we applied a random labeling (RL) test, to each survey on both sites. The null hypothesis is that the label of each colony is randomly allocated, regardless of other points. H0 was evaluated through the D(r) statistic which calculates the difference of the newly diseased colonies per site per survey (Ldis(r)) and the surveyed population at each site (Lpop(r)): D(r)=Ldis(r)-Lpop(r). If H0 is true, then D(r) = 0. Significant deviations were evaluated through a 95% confidence global envelope for null distribution constructed from random permutations of the labels of the complete data. If D(r) falls into the envelope the null is accepted, implying that newly diseased colonies are randomly distributed among the P. strigosa studied population at each site. The hypothesis is rejected when a value falls out of the confidence envelope. Positive significant values (above envelope) suggest that new colonies with WS signs are more likely to be found close to diseased colonies than would be expected if randomly allocated: a clustered distribution of newly diseased colonies. Negative values (under envelope) indicate that cases are more likely to be found close to a colony without WS signs than would expect under RL (Diggle and Chetwynd, 1991; Baddeley et al., 2016).
Survival and Time to Disease Onset Analysis
Colony condition status was obtained at intervals, not daily, thus it is known that disease or death onset for a given colony occurred within a given interval, but the date is unknown. Colony time to WS signs appearance or death once diseased (time to event) was calculated for each survey, as the number of days that each colony remains in a given condition (healthy, diseased, or dead). The sum of the colony-days per interval without change in colony condition, plus half the preceding interval length when condition change, provided the total colony-days for a colony in a given condition. This procedure assigns a midpoint to the number of colony-days uncertainty within that interval (actuarial method in survival analyses; Benichou and Palta, 2005). This type of data is common in epidemiological studies and several statistical techniques have been developed to analyze it (Fay and Shaw, 2010). To estimate the survival probabilities, we apply a non-parametric maximum likelihood estimator (NPMLE) for the distribution of the censored data, to generalize the Kaplan–Meir survival estimates for interval-censored data (Fay, 2020). Then the time to an event (disease, death) addresses the estimated probability at each survival interval, which is an average probability that takes into account censored data.
The temporal distribution of colonies to develop WS signs at each site was analyzed utilizing empirical cumulative distributions and kernel density estimators (KDE). Comparisons among sites were performed with Kolmogorov–Smirnov bootstrapped tests designed for discrete data with ties, given that the original KS test requires continuous data (Sekhon, 2011). Observing that the distribution of time to disease onset at each site was not uniform or unimodal, a multimodal analysis was carried out (R multimode package, Ameijeiras-Alonso et al., 2021). Potential modes were identified with KDE curves generated with the standard nrd0 and plug-in bandwidths (Sheather and Jones, 1991) for each site. The magnitude of each local maxima displayed by the KDE plot was considered to decide the number of apparently relevant modes. This number was the required input to obtain the critical bandwidth value of the KD’s as to identify the number and location of numerically valid modes.
All analyses were carried using R (R Core Team, 2019). Survival probabilities were estimated with interval package (Fay, 2020); CSR and RL tests, and L(r) plots were made with the packages spatstat (Baddeley et al., 2018) and GET (Myllymäki et al., 2017; Myllymäki and Mrkvicka, 2020). For uniformity tests (uniftest package, Melnik and Pusev, 2015), bootstrapped KS comparisons (matching package, Sekhon, 2011) and for modal analysis (multimode package, Ameijeiras-Alonso et al., 2021).
Results
Outbreak Development
While both reef study sites had a similar survey area (≈440 m2), P. strigosa colony density at Picudas site was more than twice that of Bocana (0.20 cols/m2 vs. 0.08 cols/m2). Notwithstanding, at the beginning of the study WS prevalence at Picudas site was 8.5%, much lower than at Bocana: 44%. At the first survey some colonies were already dead probably attributable to the WS outbreak as recolonization of the denuded skeleton was at its initial stages and there were no other evident causes of death. Coincidental with the initial prevalence levels registered at each site, recent colony mortality was lower in Picudas than in Bocana (three and seven dead colonies, respectively).
The survival probability of colonies since the onset of WS signs was different among sites. For the Bocana site average colony survival probability since WS signs onset was 20% at the K–M estimated interval starting around day 158 (by end of January 2019; Figure 4) and close to 0% around day 214 (April 2019). At Picudas site average colony survival probability since WS signs onset was 14% at the K–M estimated survival interval starting around day 172 (by mid January, 2019) and 13% at the interval starting around day 225 (beginning of April 25). As shown by the proportion of healthy colonies surviving till the end of the study in Figure 5. While the changes in the slope of both K–M curves are relatively different, there was no significant difference in the Kaplan–Meir survival curves among sites (asymptotic log-rank two-sample test: Z = 0.7506, p-value = 0.46), most likely because both slopes approach zero survival. As modeled, all diseased colonies eventually died. Furthermore, no recovery of a diseased colony was registered at either site.
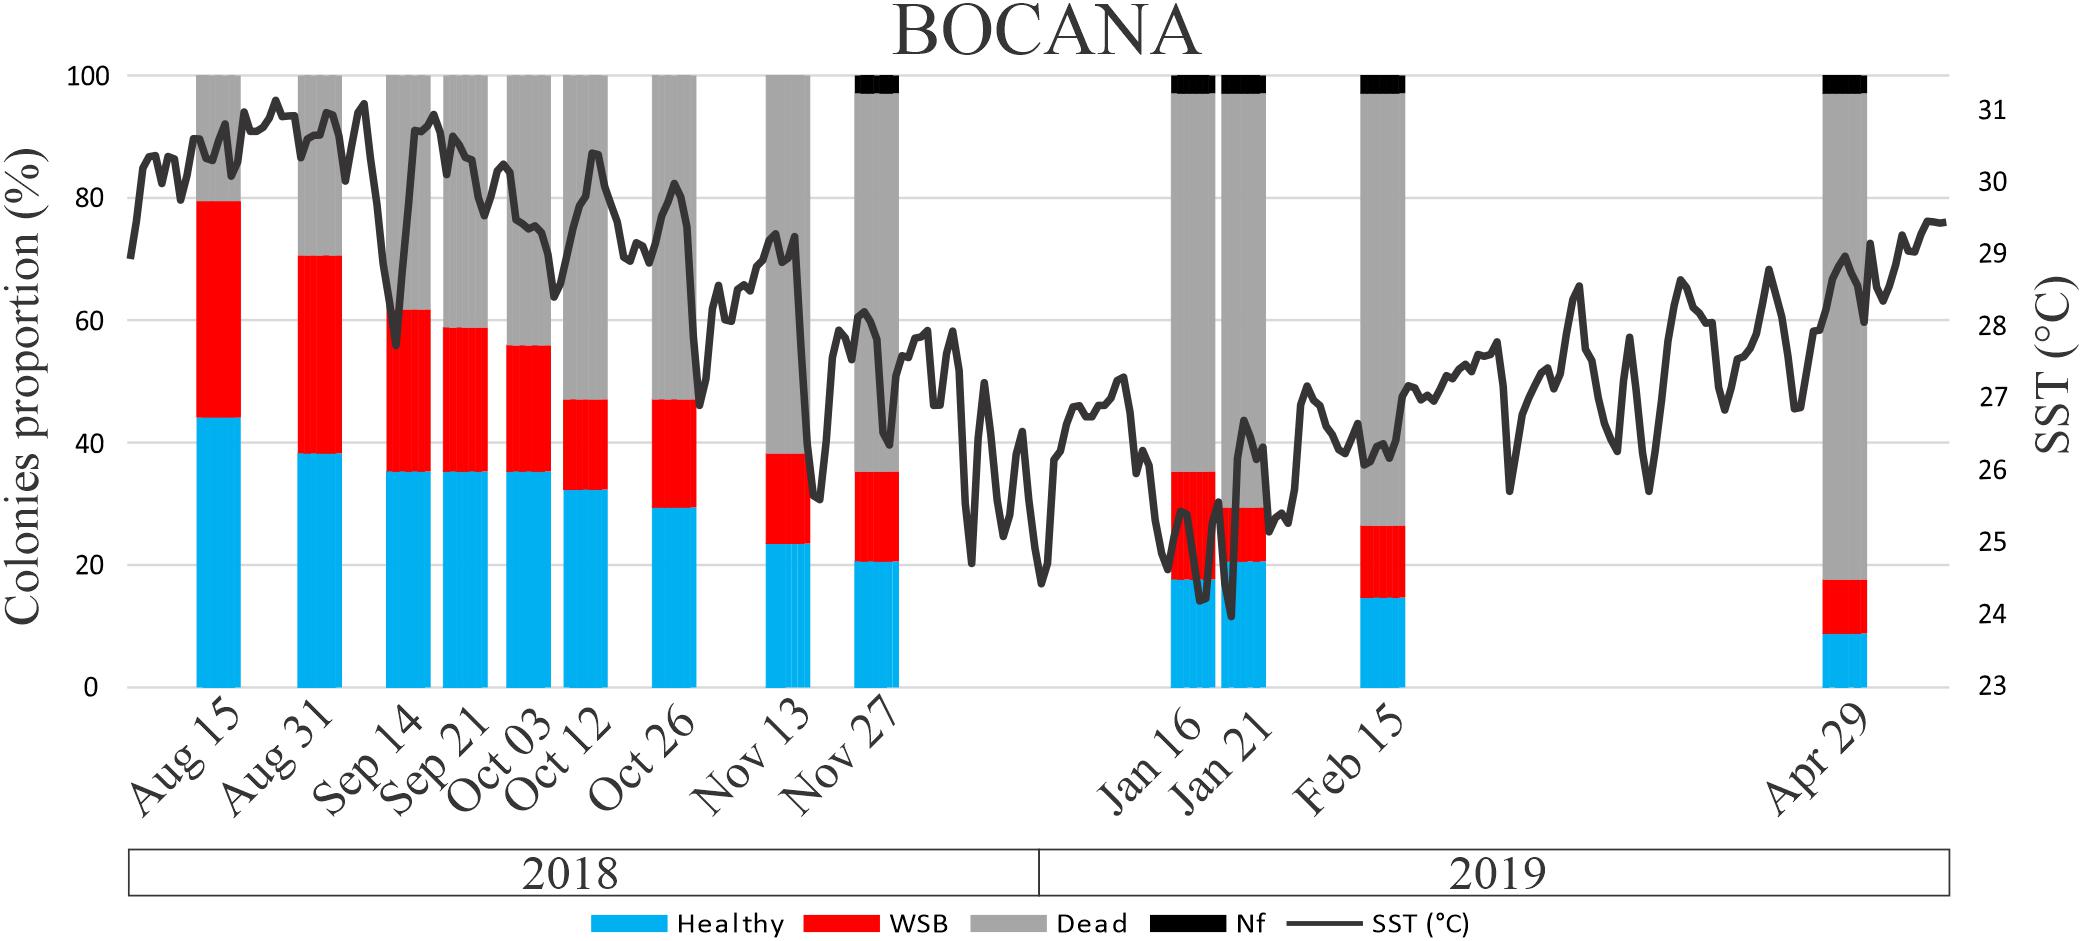
Figure 4. Percentage of colony condition status through time of P. strigosa colonies at Bocana site. Nf is missing colonies. A continuous dark line indicates daily mean sea surface temperature (SST, °C) at Puerto Morelos reef.
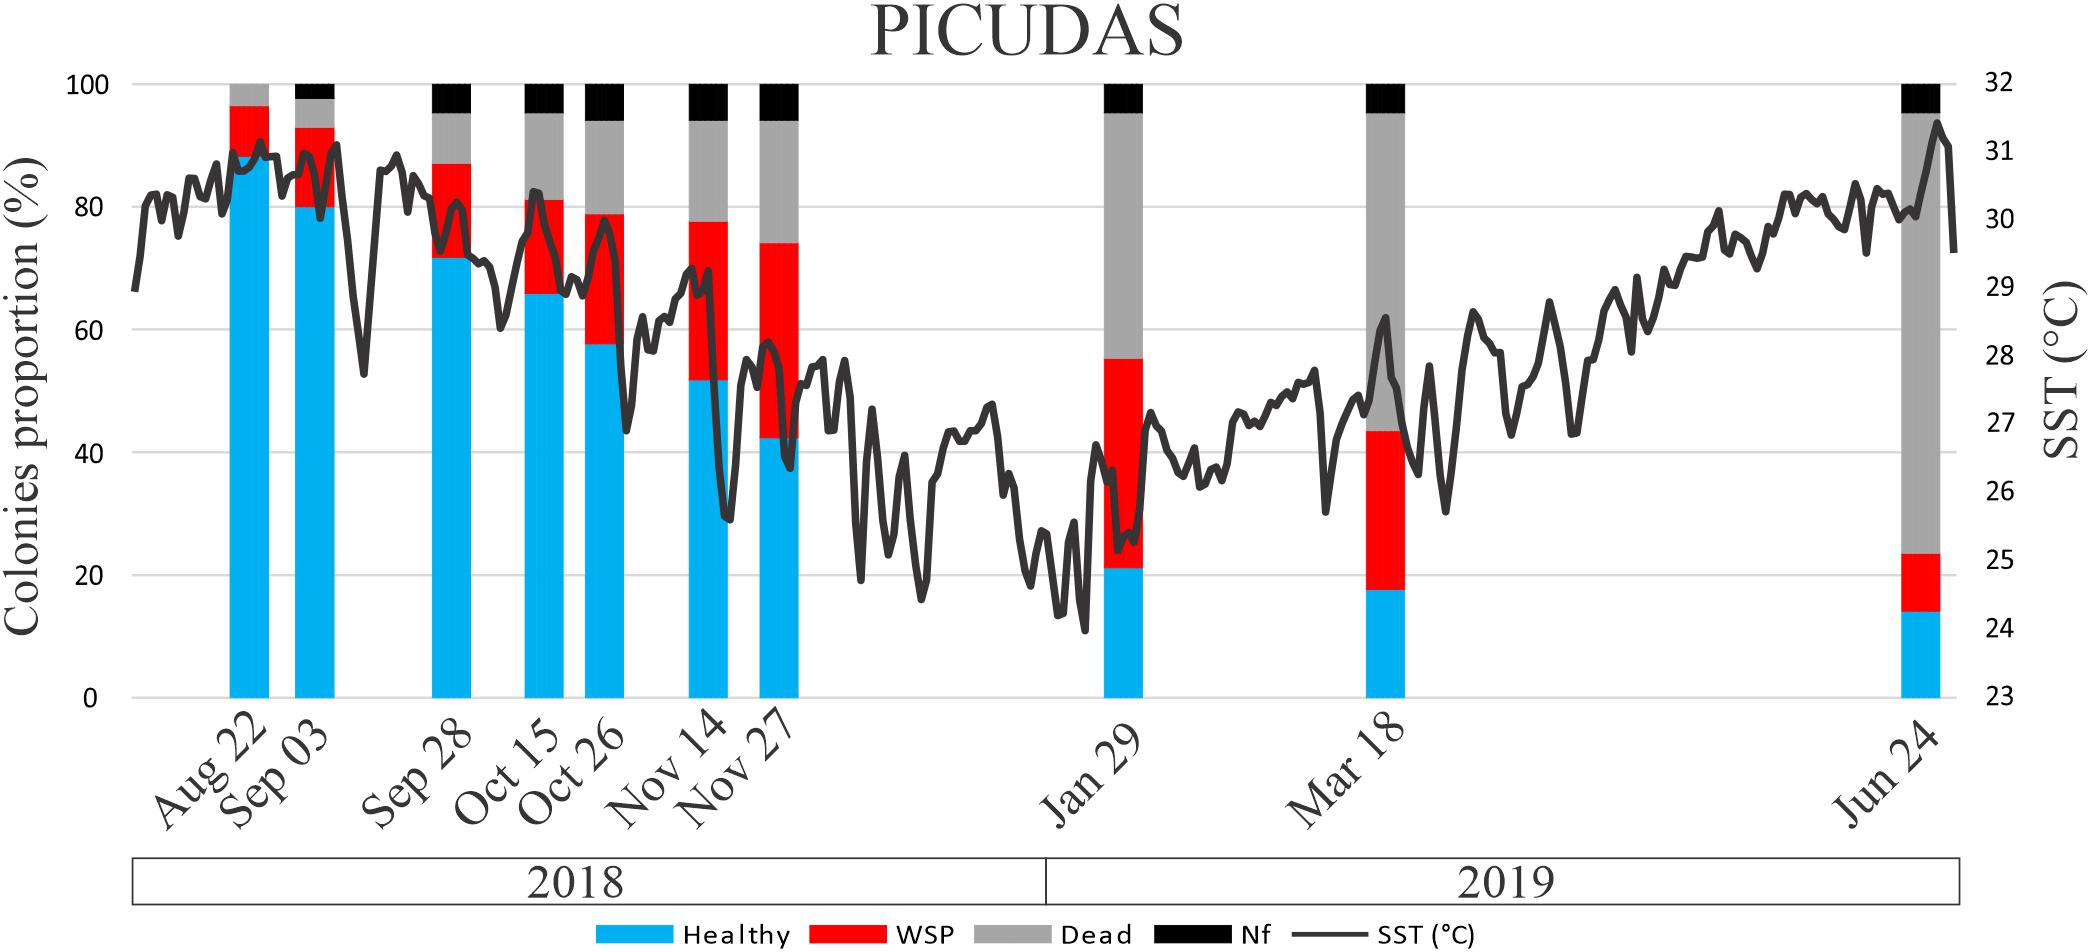
Figure 5. Percentage of colony condition status through time of P. strigosa colonies at Picudas site. Nf is missing colonies. A continuous dark line indicates daily mean sea surface temperature (SST, °C) at Puerto Morelos reef.
The time to disease onset data distribution at each site showed no continuous or regular pattern. Assuming the possibility of constant development of disease signs amongst survey intervals a Neyman–Barton uniform distribution test (Melnik and Pusev, 2015) was applied. Both data sets showed no uniformity (p < 0.00), indicate non-constant signs of development at either site. A Kolmogorov–Smirnov bootstrapped test to allow for discrete data and presence of ties, suggests that empirical cumulative distribution indeed of both sites are marginally different (p = 0.048) in terms of absolute maximum distance among the corresponding functions. However, analyzing the site date using KDEs, it was apparent that time to disease onset patterns was different among sites (Figure 6).
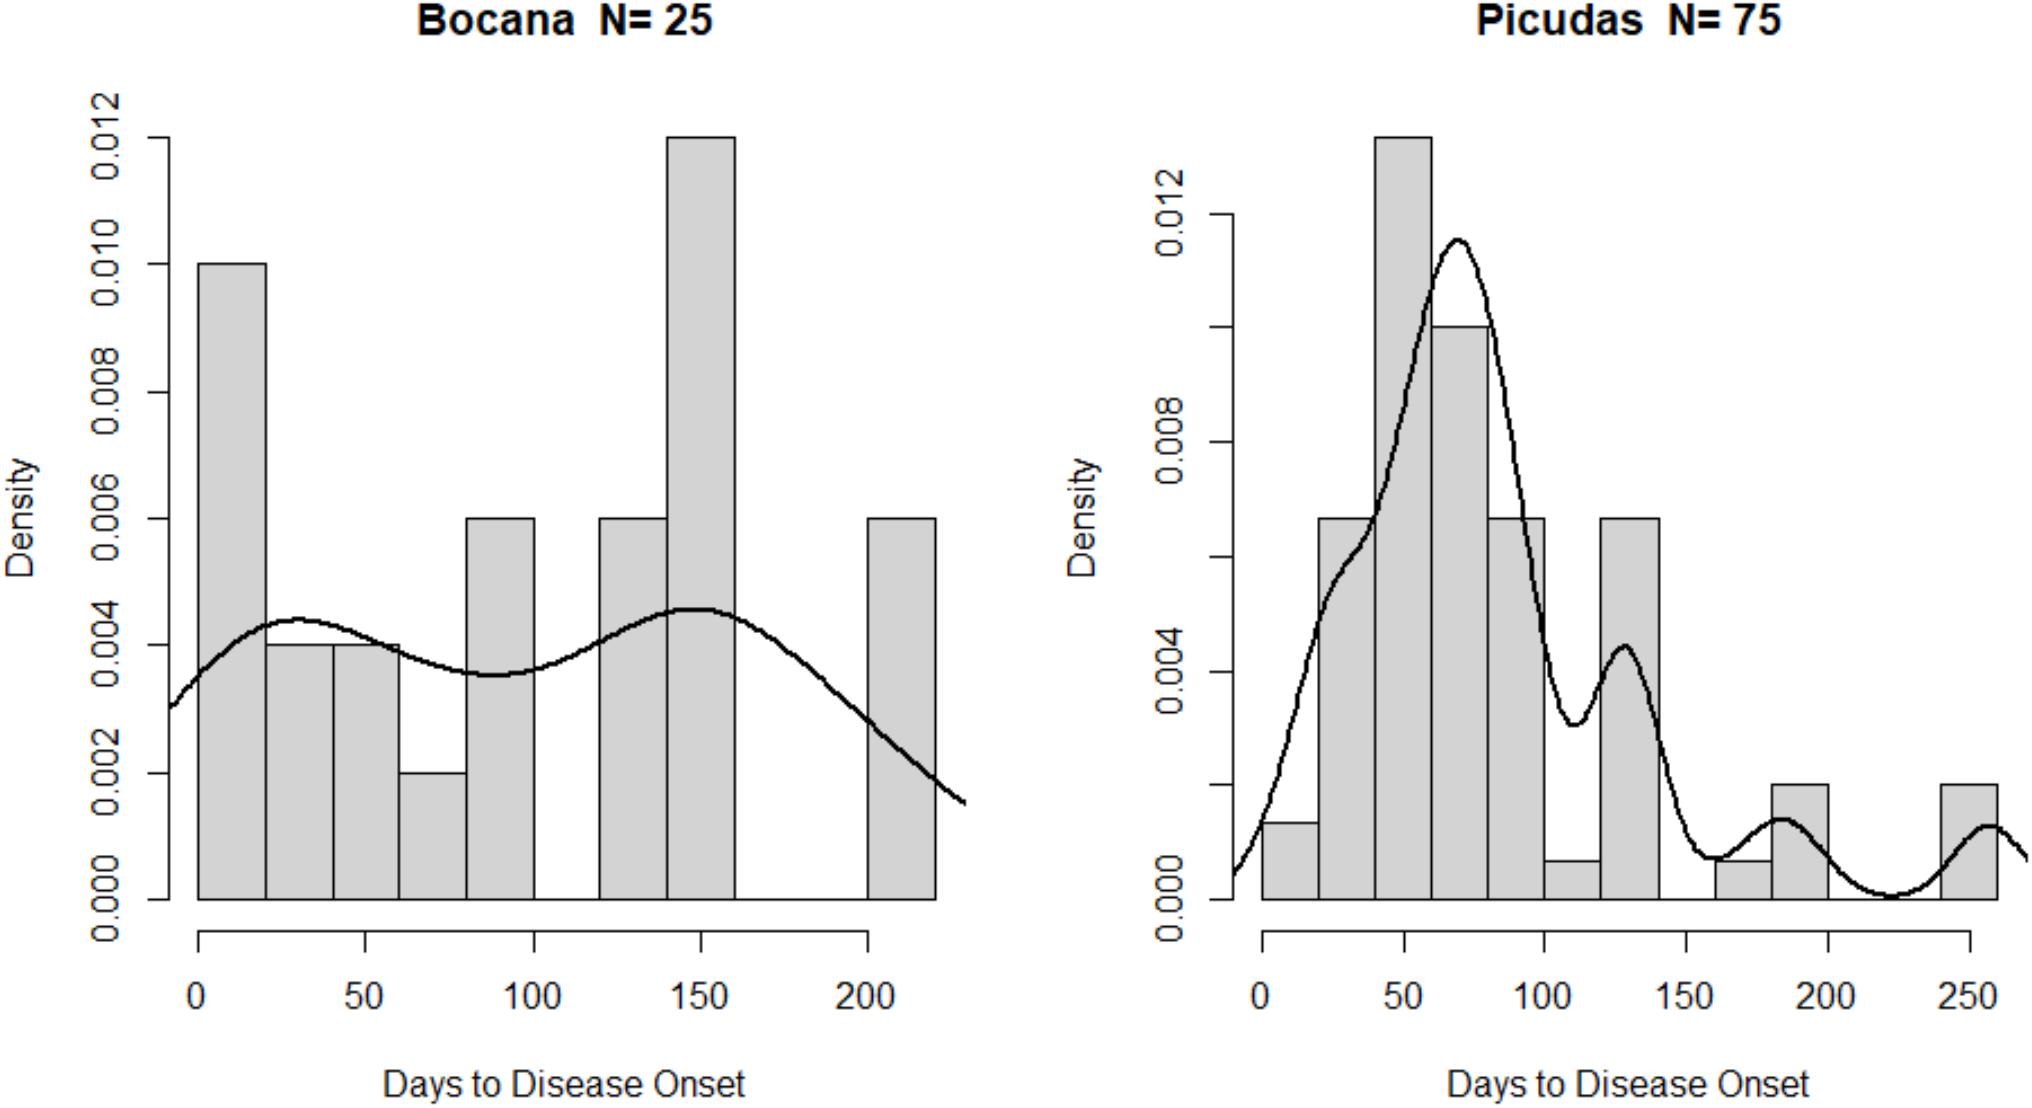
Figure 6. Kernel density estimators (solid black line) show the multimodal distribution of time to white sign onset data. Histogram with 10 breaks to simulate data distribution for the 10 months of the study.
While Picudas KDE strongly suggests multimodality, Bocana site data suggest a relatively week bimodality. Testing for unimodality in the underlying density by bootstrapping, it was found that both sites had multimodal distributions (Bocana: p = 0.014; Picudas: p = 0.002). After selecting the appropriate critical bandwidth (Bocana: 19.5757; Picudas: 16.2998), the number and location of local maxima were found to be two for Bocana (modes at 17 and 151 days from study initiation), and three for Picudas (modes at 70, 129, and 184 days). The amplitude of the main modes is quite large suggesting that colony resistance is rather variable at both sites. Aside from the variable colony resistance, other striking findings are the lag in disease outbreak among sites and the discontinuous time to disease onset per survey (as opposed to constant or progressively decreasing trends), as shown by multimodality in the distribution of time to disease data. More so, as different multimodal patterns exist between the sites.
Spatial and Temporal Patterns of the WS Outbreak
No colonies were in direct contact at the Bocana site, but at the Picudas site, there were seven pairs. In six of these pairs, the two colonies appeared healthy at the first survey. The healthy-healthy initial pairs eventually developed signs in one of the colonies and later in the other, except for one couple remaining healthy until the end of the study. In no instance, both colonies in a pair developed WS signs within the same survey (Table 1). The mean time for the apparently healthy colony of a pair to become diseased was 44 days. This period was significantly shorter than that among independent colonies (mean = 83.4 days; Welch t test = t: 3.59, p = 0.006).
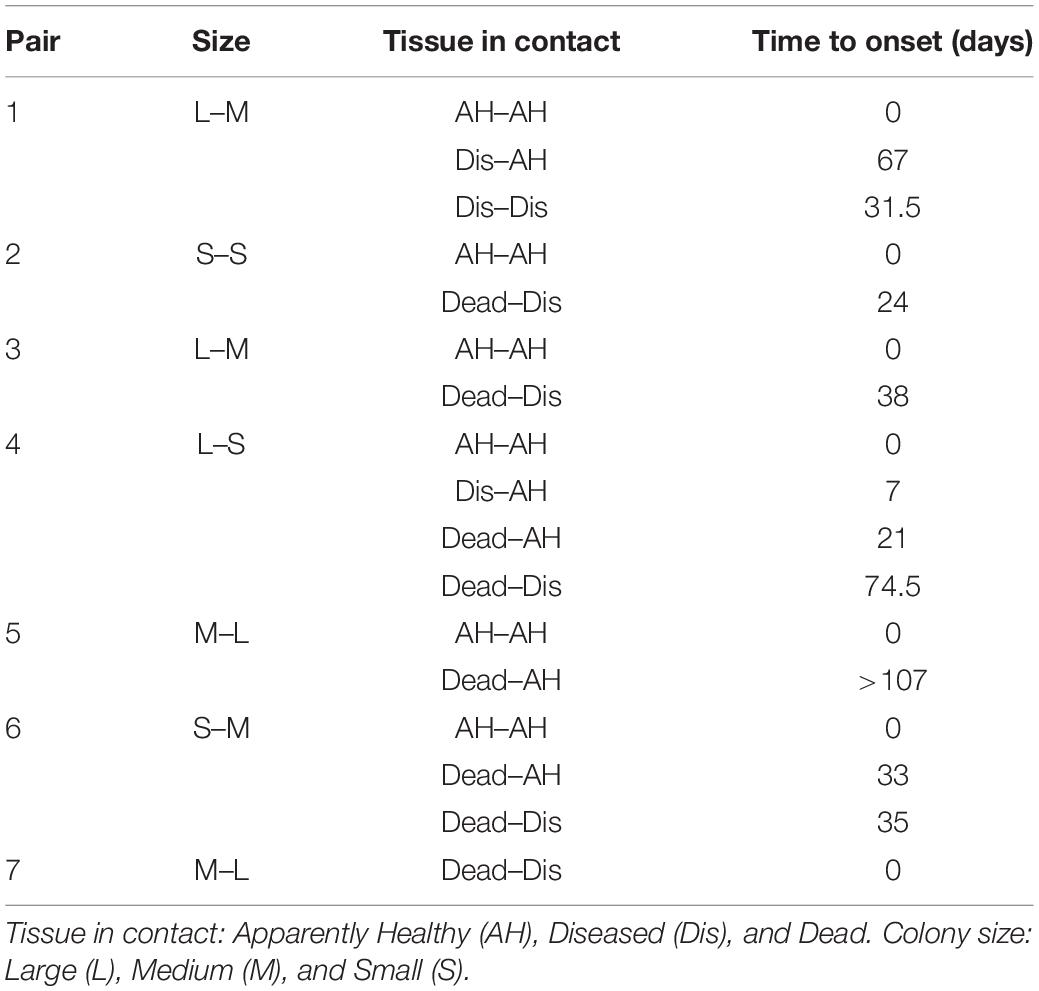
Table 1. Development of colony condition through time for the contact colony pairs at Picudas site.
The spatial distribution pattern of P. strigosa colonies surveyed at the Bocana site was random all along the distance scale of the Bessag’s–Ripley’s K diagram (1–6 m; CSR test p = 0.53, Figure 2B), whereas at the Picudas site the colony distribution were clustered all along the distance scale (1–5 m; CSR test p = 0.001, Figure 3B). The incidence distribution patterns per survey were adjusted because although in both study sites newly diseased colonies were registered at every survey, in several instances less than 15 newly diseased colonies were registered per survey. Performing Ripley’s K analysis with less than 15 data, result in biased results due to insufficient sample size to estimate the variance adequately (Baddeley et al., 2016, 2018). To obtain a sufficient sample size, survey data of successive samplings were pooled until 15 data points were obtained. Pooling data sets are commonly applied to K function analyses (Baddeley et al., 2016). For instance, Muller and van Woesik (2012) combined spatial data, we pooled time data. For the Bocana site, two sets of pooled newly diseased colonies were constructed, for the periods of August–September 2018 and October 2018–April 2019. These periods coincide with the hottest and coldest seasons. At Picudas site, we obtained six adequate (≥15 data points each) periods for the spatial analysis: August 22–October 15, October 26, November 14, and November 27 of 2018, January 29, and March 18–June 24 of 2019. With these data sets, we obtained L(r) functions of newly diseased colonies (Supplementary Figures 1, 2 for Bocana and Picudas sites, respectively), and compute the difference between incidence and population patterns at each site (Ldis(r) – Lpop(r)), to test the RL hypothesis (Figures 7A,B, 8A–F for Bocana and Picudas sites, respectively). The tests show that the WS incidence per period analyzed was randomly distributed except in two cases: the second period at the Bocana site (October 2018–April 2019) indicating an overdispersed pattern, marginally significant at larger distance scales (4.5–6 m, RL test p = 0.05, Figure 7B), perhaps due to a space increase between diseased colonies and scarce healthy colonies. The second exception is for the summer survey at Picudas site (August–September 2018) where incidence distribution shows a marginally significant clustering at 2.5–4.5 m (RL test p = 0.05, Figure 8A) when the abundance of apparently healthy colonies was still high.
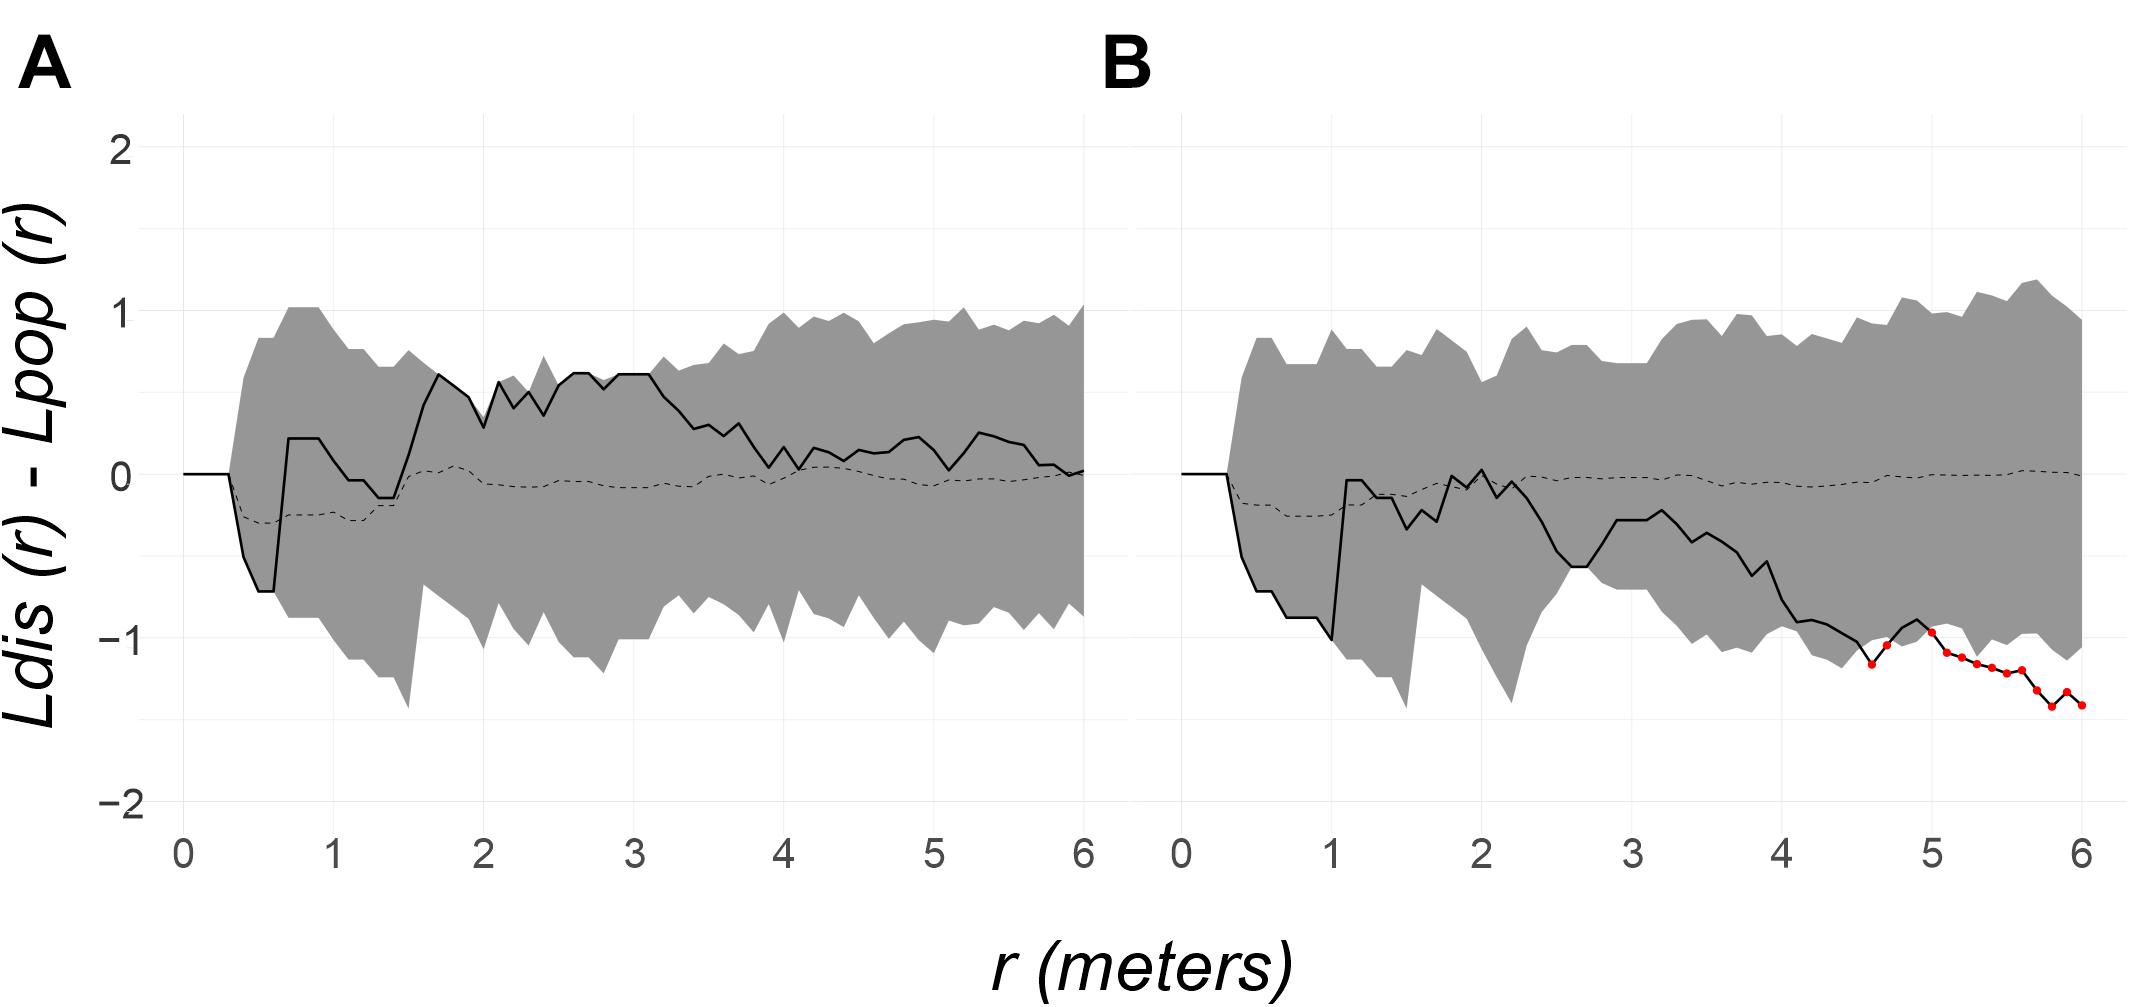
Figure 7. Random labeling test for the newly diseased colonies in the two Bocana analyzed periods: (A) Aug to Sep of 2018. The spatial pattern of the survey sample is random (solid line is within the 95% shaded confidence envelope and p = 0.45) and (B) Oct of 2018 to Apr of 2019. The spatial pattern is overdispersed at 4.5–6 m distance scale [pattern is under the envelope (red dots marking it) and p = 0.05].
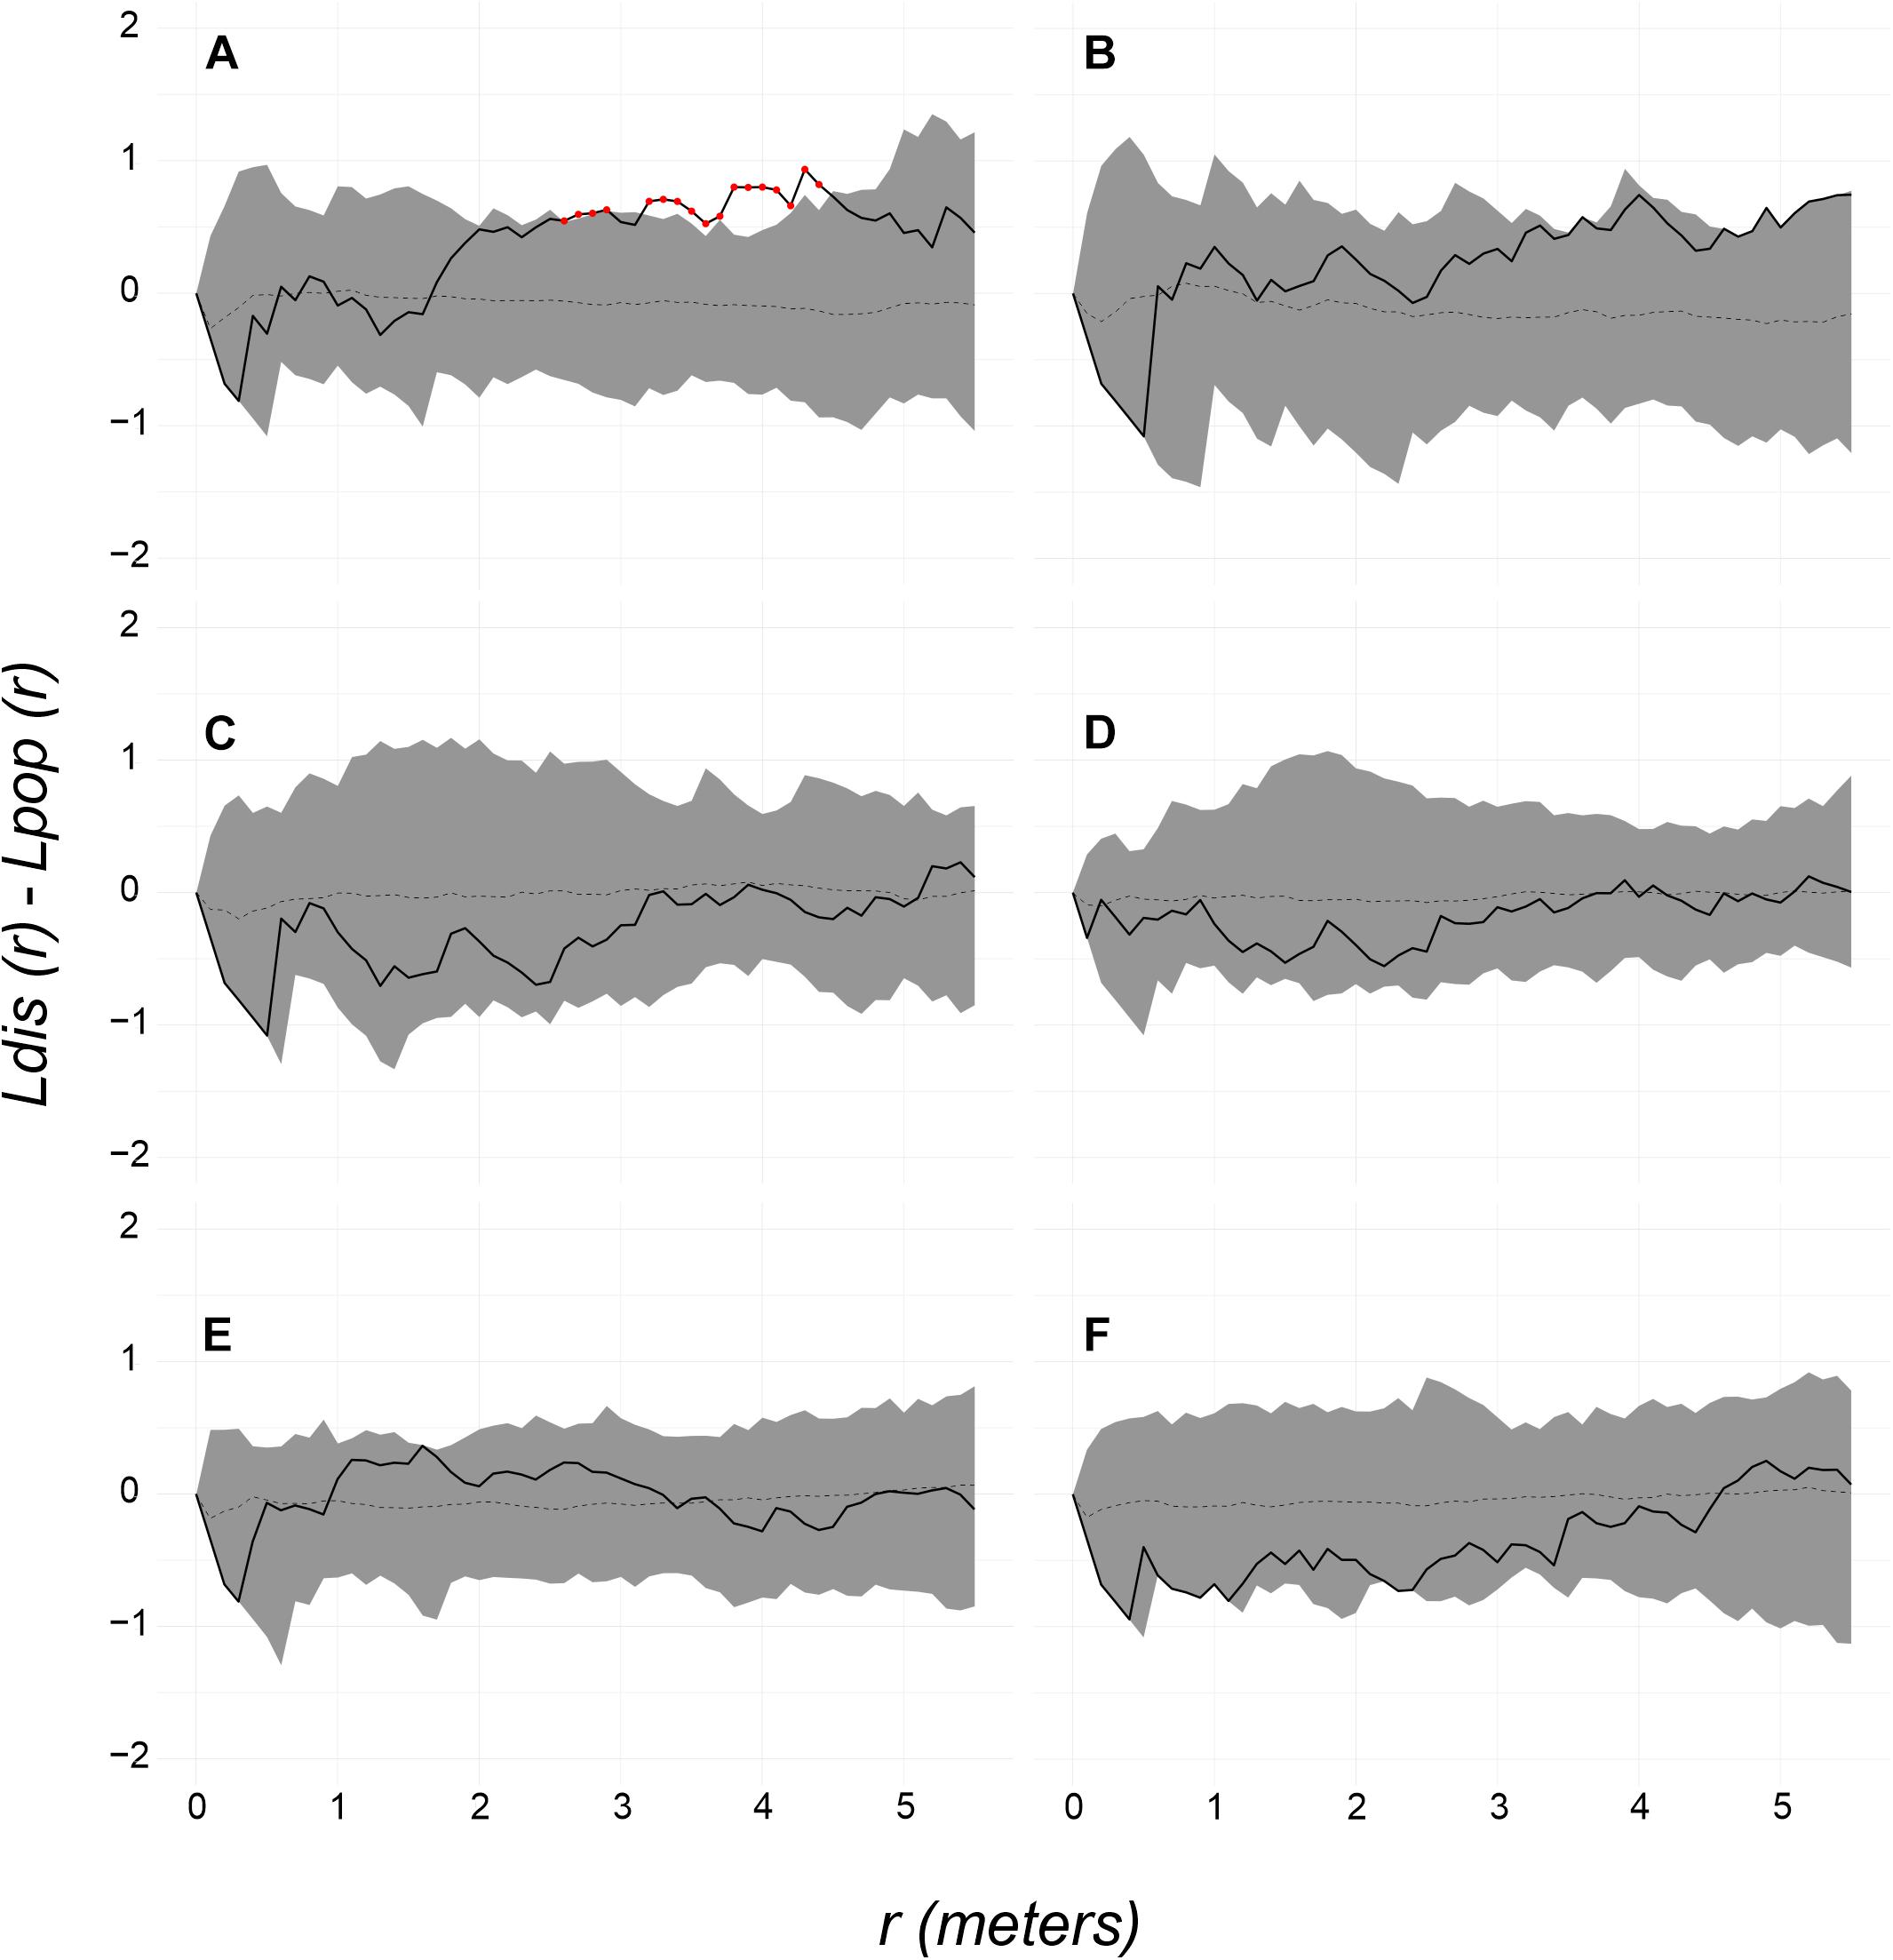
Figure 8. Random labeling test for the newly diseased colonies at Picudas site: (A) Aug 22 to Oct 15, (B) Oct 26, (C) Nov 14, and (D) Nov 27 of 2018, (E) Jan 29, and (F) March 18 to June 24 of 2019. In most tests, the spatial pattern of the survey sample is random (solid line is within the 95% shaded confidence envelope and p = 0.45). Exceptions in A at 2.5–4.5 m scale where the pattern was significantly clustered (pattern above the confidence envelope and p = 0.05).
Discussion
A remarkable finding of this study was the different dynamics in the WS outbreak in P. strigosa surveyed populations of the study sites, notwithstanding the two sites are relatively close to each other and in similar environmental settings. Although site surveys started within a week of each other the initially recorded WS prevalence at the Bocana site (44%) was five times greater than at Picudas sites (8.5%), even though P. strigosa colony density at Picudas was more than twice the one at Bocana. This first finding shows that the WS outbreak started at Picudas site, about the same time that our survey started, but earlier at the Bocana site and/or that P. strigosa colonies at Bocana site were more susceptible to the WS. If the outbreak should have occurred simultaneously at both sites it would have resulted in relatively similar survival probabilities, if not lower at Picudas, due to its higher colony density; unless P. strigosa colonies resistance to the WS in Picudas was higher than at Bocana.
A possible outbreak starting time for the Bocana site can be roughly estimated by finding the median time to disease onset, since our observations started, and subtracting that period from our initial survey dates. A median time of apparently healthy colonies to become diseased of 74 days was obtained (pooling data from both sites), with a bootstrapped 95% confidence interval of 60–90 days. The 2–3 months range comprised by the confidence interval roughly corresponds with the probable time frame of the outbreak in the northern Mexican Caribbean as reported by Álvarez-Filip et al. (2019). On the other hand, the median time to disease onset in Bocana colonies since observations started was of 97 days, suggesting that the outbreak developed earlier at that site.
The WS outbreak progression in terms of time to disease onset in apparently healthy colonies was not constant or progressively decreasing at neither site. Trends that may be expected by continuous successful transmission and decreasing host abundance, respectively, if nearest neighbor distances were important. Instead, a multimodal distribution of time to disease onset data was found for both sites, implying a wavy frequency in the WS sign’s appearance. Furthermore, the modal location for each site was different for Bocana (modes at 17 and 151 days from study initiation), and three for Picudas (modes at 70, 129, and 184 days). While at Bocana both modes had a similar percentage of the data (Figure 6), in Picudas the first mode at 70 days has the most of data, and the other two were quite smaller and with similar values. The wavy frequency in the time to disease onset data, suggests different events of successful transmission whereas the large amplitude of the main modes is probably related to large variability in colony resistance to the WS. In this late case, amplitudes of main modes at both sites are similarly wide and in that sense at both sites colony resistance is variable. As the outbreak in our study sites progressed, many colonies died, and live colony density was greatly reduced, thus increasing average nearest neighbor distances, and still, the WS incidence continued unabated, even in colder winter months.
Incidence spatial patterns of the WS outbreak, throughout the study, don’t reflect the surveyed population spatial patterns. Also, a transition of incidence spatial patterns was observed, indicating that the dynamics of this WS outbreak are complex even at small spatial scales. The initial Picudas incidence patterns showed clustering suggesting a nearest neighbor relation in the transmission of the disease; and if so, probably driven by the relatively high colony density at the site. Later surveys, however, showed a transition to random distribution patterns, although many apparently healthy colonies remained in the surveyed area. On the other hand, at the Bocana site the incidence distribution pattern was random in the summer period, but in the winter period transition toward an overdispersed pattern; probably an effect of a reduced population of susceptible colonies in the study area. Jolles et al. (2002) reported that Aspergillosis in the sea fan Gorgonia ventalina had different distribution patterns as the outbreak developed. At low prevalence levels the distribution pattern of diseased colonies was random, but a transition to clustered distribution at high prevalence levels; due to direct contact after the initial long-distance water-borne driven outbreak. An apparent lack of colony density dependence for the spread of coral diseases has also been documented in Florida reefs for outbreaks of WP-II (Richardson et al., 1998), of a WS (Precht et al., 2016; Rippe et al., 2019), and SCTDL (Sharp et al., 2020). In our study, lack of spatial dependence seems to extend to very small spatial scales as no simultaneous (not observed in the same survey) disease WS signs development were observed in colonies that grew in direct contact. Nevertheless, although few colony pairs were registered, the shorter period of the apparently healthy colony to become diseased in diseased-healthy pairs suggests that direct contact enhances colony susceptibility to this WS. More so, as there were no cases where a WS lesion appeared in the contact area of a colony pair.
On the other hand, given the density independence of the incidence events, multimodal distributions may be related to periodic transport events of the causal agent or necessary additional factors to trigger the WS disease (Sokolow, 2009) at the spatial scale of the study areas. It may also imply different transmission events and mechanisms for this WS outbreak (Shore and Caldwell, 2019). Precht et al. (2016) infer that the WS they observed in Florida was water-borne transmitted due to the low density of coral colonies. Muller et al. (2020) shared this point of view after assessing the rates of spread of SCTLD in the Florida reef tract. Dobbelaere et al. (2020), modeling the SCTLD in the Florida reef tract, consider that the disease is likely to be transported by currents as a neutrally buoyant material. Zvuloni et al. (2009) claimed that even at very short-inter colony distances and high colony densities waterborne transmission of a Black Band disease was the main mechanism for a clustered distribution of diseased colonies, in the absence of biological vectors. If there is a primary agent of the disease and is waterborne transported (Precht et al., 2016; Dobbelaere et al., 2020; Muller et al., 2020) given the short distance between our sites (1,200 m) and high water connectivity in the study area, probably the WS outbreak should have started more or less simultaneously at both study sites.
Clemens and Brandt (2015) reported that white plagues are transmitted effectively by Coralliophilia abbreviata, a corallivorous snail, and also through water even when filtered. Williams and Miller (2005) reported that white band disease in Acropora cervicornis was transmitted both by direct colony contact and also by C. abbreviate. In the present study, we observed the fireworm Hermodice carunculata, feeding on tissue remnants of the WS lesion of a P. strigosa colony at Picudas site in one of the surveys; but not on the adjacent, apparently healthy coral tissue (Figure 9). There were no sightings of fireworms or other coral predators such as C. abbreviata feeding on healthy P. strigosa colonies. Noonan and Childress (2020) report active biological vectoring for SCTLD by butterflyfishes in Florida, the first biological vector report to our knowledge. Passive biological vectors had also been suggested, as the macroalgae Halimeda opuntia (Nugues et al., 2004) or sediment biofilm (Richardson, 1996). These reports point out the possibility of several co-occurring transmission mechanisms (Clemens and Brandt, 2015), during the disease outbreak in our study sites. And the observed particular outcomes may have depended on minor variations in local conditions and colony stress history, as well on the epigenetics of both hosts and potential primary and secondary pathogens present through the outbreak (Webster et al., 2017; Zaneveld et al., 2017).
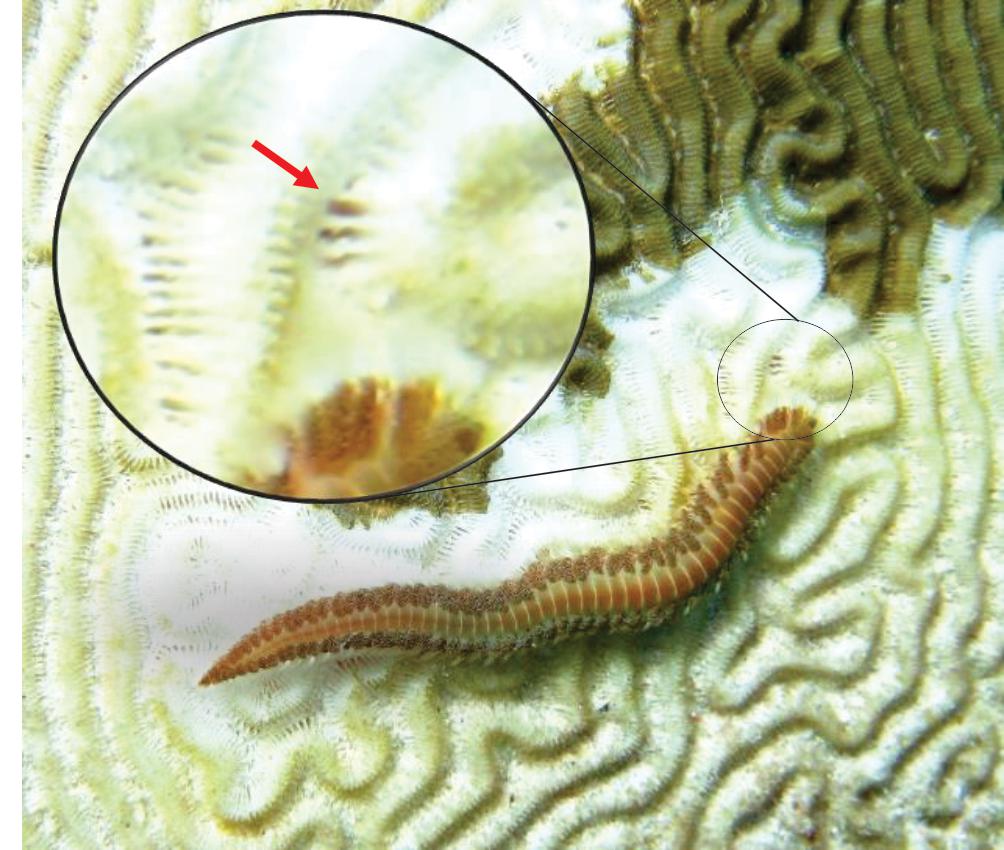
Figure 9. Fireworm H. carunculata, apparently consuming the death tissue of P. strigosa. A red arrow in the magnified area shows remaining tissue between skeletal septa. Picture of March 2019.
The importance of changing ecosystems effects in coral disease etiology has been stressed by many authors, from the ecological (i.e., Hoegh-Guldberg, 1999; Sokolow, 2009; Bruno et al., 2019) to the microbiological context (i.e., Lesser et al., 2007; Zaneveld et al., 2016; Webster et al., 2017; Brooks and Boeger, 2019; Vega-Thurber et al., 2020). Models were the role of opportunistic pathogens, and stress-driven reduced host resistance should perhaps be the norm, rather than the exception (Lesser et al., 2007). Such interactions are likely to result in greater susceptibility to disease as a result of unbalanced coral microbiomes (Zaneveld et al., 2017), leading both to host depressed immune response and reduce overall performance (Harvell et al., 2007). In addition, environmental degradation can lead to the emergence of new strains of presently purported pathogens or even new ones (Ellner et al., 2007; Vega-Thurber et al., 2009). For instance, all colonies in our study sites developed the WS but at different times and with varying survival periods, strongly suggest that individual colony condition played a role in susceptibility to the disease and its progression within a colony. But also opens the possibility that different diseases are co-occurring in the WS outbreak. If Landsberg et al. (2020) consideration that there may be no primary infectious etiology in the SCTLD holds, then multiple secondary bacterial pathogens associated with the SCTLD (Aeby et al., 2019; Meyer et al., 2019; Paul et al., 2019; Iwanowicz et al., 2020; Landsberg et al., 2020) and for a more general WS as well (Thomé et al., 2021), may play an important role in these diseases development. As it is well known that external stressors may compromise host immunity (Harvell et al., 2007; Glasl et al., 2016) and/or produce an imbalance in the structure and diversity of the coral microbiome, contributing to the proliferation of opportunistic pathogens (Lesser et al., 2007; Muller and van Woesik, 2012; Woodley et al., 2016; Sweet and Bulling, 2017; Meyer et al., 2019).
Two main drivers of coral diseases so far considered are increased seawater temperatures and poor water quality, both individually and synergistically (Wang et al., 2018). Coral diseases seem to bear a positive relationship with high seawater temperatures, but not with low seawater temperatures (Jones et al., 2004; Bruno and Selig, 2007; Zvuloni et al., 2009; Heron et al., 2010; Beeden et al., 2012; Ruiz-Moreno et al., 2012). However, at our sites, despite the decrease of apparently healthy colonies, the proportion of newly diseased colonies per interval between summer and winter surveys showed no significant difference. Thomé et al. (2021) observed that WS lesion progression was not hinder during winter at Picudas site and Álvarez-Filip et al. (2019) observed newly WS diseased colonies in relatively nearby Cozumel Island in winter. If this WS causality is water-borne, the winter strong north winds may contribute to this density-independent pattern by transporting fomites (Dobbelaere et al., 2020) resulting in waves of effective local transmissions; despite the lower seawater temperatures.
Global and regional stressful factors further confound local factors’ relevance, for instance, Precht et al. (2016), considered that a previous thermal bleaching event was of importance in triggering a WS Florida outbreak, a posteriori identify as SCTLD (Landsberg et al., 2020). At our sites, no previous strong bleaching occurred but a potential stressful factor affecting these reefs could be the Sargassum spp. brown tides (Van Tussenbroek et al., 2017). The decomposition of thousands of tons of these algae on the shore deteriorates water quality, increases nutrient input reduces transparency, pH, and oxygen levels, and increases ammonia, phosphorus, and concentration of toxic metals (Van Tussenbroek et al., 2017; Rodríguez-Martínez et al., 2020). These brown tides were associated with the mortality of seagrass beds and fauna (Van Tussenbroek et al., 2017; Rodríguez-Martínez et al., 2019). However, the potential effects of brown tides and drifting Sargasso mats, are coastal broad, and is difficult to imagine a differential effect at the small spatial scale of our study sites. The same holds regarding the relatively low coastal waters quality, pre-Sargasso events, in the Puerto Morelos coastal waters due to explosive coastal development and inadequate water treatment practices (Carruthers et al., 2005; Hernández-Terrones et al., 2011; Van Tussenbroek et al., 2017; Rodríguez-Martínez et al., 2020).
The difference in direct anthropogenic effects between both sites is on the level of recreational activities. Bocana site receives many snorkelers and scuba divers, whereas the Picudas site is rarely visited. The risks of coral reef tourism-related activities for coral biota are well known (Lamb et al., 2014; Zaneveld et al., 2016; Spalding et al., 2017) but are difficult to demonstrate. For instance, some level of stressful effects from snorkeling and scuba diving on the Bocana coral assemblages may be suspected, but directly linking it to the particular WS outbreak dynamics by association is no demonstration.
We have described in detail the dynamics of the outbreak events at our study sites and shown differences in the dynamics of this WS outbreak at the study sites including a lag in disease outbreak, discontinuous events of the time to disease onset, lack of colony density dependence for the spread of the WS, unhampered incidence in winter months and extremely high morbidity. All indications of a complex and powerful phenomenon, even at the small spatial scales of this study. However, explaining the observed patterns is pending. In this context, further investigations with not-so-aggressive diseases may provide a better natural model to understand the processes behind such complex patterns. Meanwhile, we must recognize that these recent outbreaks are but a continuation of the lethal coral epizootics that had decimated Caribbean reefs, during the last 40 years. And doing so, as has been proposed in many other works, preserving a good environmental quality at the local reef scale may effectively contribute to reducing the susceptibility of corals to WS, but also any other extant or future diseases.
Data Availability Statement
The original contributions presented in the study are included in the article/Supplementary Material, further inquiries can be directed to the corresponding author.
Author Contributions
EG-U performed the samplings, analyzed the data, prepared the figures and tables, authored, reviewed the drafts of the manuscript, and approved the final draft. EJ-D conceived, designed and performed the samplings, analyzed the data, authored, or reviewed drafts of the manuscript, and approved the final draft. Both authors contributed to the article and approved the submitted version.
Funding
This work was internally supported by the ICML-UNAM. There was no additional external funding received for this study. The funders had no role in study design, data collection and analysis, decision to publish, or preparation of the manuscript.
Conflict of Interest
The authors declare that the research was conducted in the absence of any commercial or financial relationships that could be construed as a potential conflict of interest.
Publisher’s Note
All claims expressed in this article are solely those of the authors and do not necessarily represent those of their affiliated organizations, or those of the publisher, the editors and the reviewers. Any product that may be evaluated in this article, or claim that may be made by its manufacturer, is not guaranteed or endorsed by the publisher.
Acknowledgments
We are grateful to the ICMyL and UNAM for providing financial and logistic support to EJ-D; the CONACyT for a scholarship for EG-U; J. Rivera Ortega and R. Rodríguez Martínez for their support in monitoring and samples collection; the Meteorological and Oceanographic Monitoring Academic Service of Puerto Morelos for SST data; and F. Negrete for boat and diving support. We specially thank the two reviewers whose comments greatly improved the quality and scope of this work. Part of the content of this work appears in EG-U’s master’s thesis (Guzmán-Urieta, 2020).
Supplementary Material
The Supplementary Material for this article can be found online at: https://www.frontiersin.org/articles/10.3389/fmars.2021.669171/full#supplementary-material
References
Aeby, G. S., Ushijima, B., Campbell, J. E., Jones, S., Williams, G. J., Meyer, J. L., et al. (2019). Pathogenesis of a tissue loss disease affecting multiple species of corals along the florida reef tract. Front. Mar. Sci. 6:678. doi: 10.3389/fmars.2019.00678
AGRRA (2019). Coral Disease Outbreak. Stony Coral Tissue Loss Disease. Available online at: http://www.agrra.org/coral-disease-outbreak/ (accessed January 2020).
Álvarez-Filip, L., Estrada-Saldívar, N., Pérez-Cervantes, E., Molina-Hernández, A., and Gonzalez-Barrios, F. J. (2019). A rapid spread of the stony coral tissue loss disease outbreak in the Mexican Caribbean. PeerJ 7:e8069. doi: 10.7717/peerj.8069
Ameijeiras-Alonso, J., Crujeiras, R. M., and Rodríguez-Casal, A. (2021). multimode: an R package for mode assessment. J. Stat. Softw. 97, 1–32. doi: 10.18637/jss.v097.i09
Antonovics, J. (2017). Transmission dynamics: critical questions and challenges. Phil. Trans. R. Soc. B 372:20160087. doi: 10.1098/rstb.2016.0087
Baddeley, A., Rubak, E., and Turner, R. (2016). Spatial Point Patterns Methodology and Applications with R. Boca Raton, FL: CRC Press.
Baddeley, A., Turner, R., and Rubak, E. (2018). Spatial Point Pattern Analysis, Model-Fitting, Simulation, Test: Package ‘spatstat’. Available online at: http://www.spatstat.org (accessed October 2018).
Beeden, R., Maynard, J. A., Marshal, P. A., Heron, S. F., and Willis, B. L. (2012). A framework for responding to coral disease outbreaks that facilitates adaptive management. Environ. Manag. 49, 1–13. doi: 10.1007/s00267-011-9770-9
Benichou, J., and Palta, M. (2005). “Rates, risks, measures of association and impact,” in Handbook of Epidemiology, eds W. W. Ahrens and I. Pigeot (Berlin: Spinger-Verlag), 89–156. doi: 10.1007/3-540-26577-5_3
Bivand, R. S., Pebesma, E., and Gómez-Rubio, V. (2013). Applied Spatial Data Analysis with R, 2nd Edn. New York, NY: Springer.
Brooks, D. R., and Boeger, W. A. (2019). Climate change and emerging infectious diseases: evolutionary complexity in action. Curr. Opin. Syst. Biol. 13, 75–81. doi: 10.1016/j.coisb.2018.11.001
Bruno, J. F., Côté, I. M., and Toth, L. T. (2019). Climate change, coral loss, and the curious case of the parrotfish paradigm: why don’t marine protected areas improve reef resilience? Annu. Rev. Mar. Sci. 11, 307–334. doi: 10.1146/annurev-marine-010318-095300
Bruno, J. F., and Selig, E. R. (2007). Regional decline of coral cover in the Indo-Pacific: timing, extent, and subregional comparisons. PLoS One 2:e711. doi: 10.1371/journal.pone.0000711
Carruthers, T. J. B., van Tussenbroek, B. I., and Dennison, W. C. (2005). Influence of submarine springs and wastewater on nutrient dynamics of Caribbean seagrass meadows. Estuar. Coast. Shelf Sci. 64, 191–199. doi: 10.1016/j.ecss.2005.01.015
Clemens, E., and Brandt, M. E. (2015). Multiple mechanisms of transmission of the Caribbean coral disease white plague. Coral Reefs 34, 1179–1188. doi: 10.1007/s00338-015-1327-6
Diggle, P. J., and Chetwynd, A. G. (1991). Second-order analysis of spatial clustering for inhomogeneous populations. Biometrics 47, 1155–1163. doi: 10.2307/2532668
Dobbelaere, T., Muller, E. M., Gramer, L. J., Holstein, D. M., and Hanert, E. (2020). Coupled epidemio-hydrodynamic modeling to understand the spread of a deadly coral disease in Florida. Front. Mar. Sci. 7:591881. doi: 10.3389/fmars.2020.591881
Ellner, S. P., Jones, L. E., Mydlarz, L. D., and Harvell, C. D. (2007). Within-host disease ecology in the sea fan gorgonia ventalina: modeling the spatial immunodynamics of a coral-pathogen interaction. Am. Nat. 170, 143–161.
Evans, S. A. (1976). Causation and disease: the henle-koch postulates revisited. Yale J. Biol. Med. 49, 175–195.
Fay, M. P. (2020). Package ‘interval’. Weighted Logrank Tests and NPMLE for Interval Censored Data. Available online at: https://cran.r-project.org/web/packages/interval/interval.pdf (accessed April 2021).
Fay, M. P., and Shaw, P. A. (2010). Exact and asymptotic weighted logrank tests for interval censored data: the interval package. J. Stat. Softw. 36:i02.
FKNMS (Florida Keys National Marine Sanctuary) (2018). Florida Reef Track Coral Disease Outbreak. Case Definition: Stony Coral Tissue Loss Disease (SCTLD). Available online at: https://nmsfloridakeys.blob.core.windows.net/floridakeys-prod/media/docs/20181002-stony-coral-tissue-loss-disease-case-definition.pdf (accessed October 2, 2018).
Glasl, B., Herndl, G. J., and Frade, P. R. (2016). The microbiome of coral surface mucus has a key role in mediating holobiont health and survival upon disturbance. ISME J. 10, 2280–2292. doi: 10.1038/ismej.2016.9
Guzmán-Urieta, E. O. (2020). Patrones Espaciales de un Síndrome Blanco en el Coral Pseudodiploria Strigosa del Arrecife de Puerto Morelos, Quintana Roo. Ph. D. thesis. Mexico City: Universidad Nacional Autónoma de México.
Harvell, C. D., Jordan-Dahlgren, E., Merkel, S., Rosenberg, E., Raymundo, L., Garriet, S., et al. (2007). Coral disease, environmental drivers, and the balance between coral and microbial associates. Oceanography 20, 172–195. doi: 10.5670/oceanog.2007.91
Hernández-Terrones, L., Rebolledo-Vieyra, M., Merino-Ibarra, M., Soto, M., Le-Cossec, A., and Monroy-Ríos, E. (2011). Groundwater pollution in a karstic region (NE Yucatan): baseline nutrient content and flux to coastal ecosystems. Water Air Soil Pollut. 218, 517–528. doi: 10.1007/s11270-010-0664-x
Heron, S. F., Willis, B. L., Skirving, W. J., Eakin, M. C., Page, C. A., and Miller, I. R. (2010). Summer hot snaps and winter conditions: modeling white syndrome outbreaks on great barrier reef corals. PLoS One 5:e12210. doi: 10.1371/journal.pone.0012210
Hill, A. B. (1965). The environment and disease: association or causation? Proc. R. Soc. Med. 58, 295–300. doi: 10.1177/003591576505800503
Hoegh-Guldberg, O. (1999). Climate change, coral bleaching and the future of the world’s coral reefs. Mar. Freshwater Res. 50, 839–866.
Iwanowicz, D. D., Schill, W. B., Woodley, C. M., Bruckner, A., Neely, K., and Briggs, K. M. (2020). Exploring the stony coral tissue loss disease bacterial pathobiome. Preprint bioRxiv [Preprint]. doi: 10.1101/2020.05.27.120469
Jolles, A. E., Sulivan, P., Alker, A. P., and Harvell, D. (2002). Disease transmission of aspergillosis in sea fans: inferring process from spatial pattern. Ecology 83, 2373–2378. doi: 10.1890/0012-9658(2002)083[2373:dtoais]2.0.co;2
Jones, R. J., Bowyer, J., Hoegh-Guldberg, O., and Blackall, L. (2004). Dynamics of a temperature-related coral disease outbreak. Mar. Ecol. Prog. Ser. 281, 63–77. doi: 10.3354/meps281063
Lamb, J. B., True, D. J., Piromvaragorn, S., and Willis, B. L. (2014). Scuba diving damage and intensity of tourist activities increases coral disease prevalence. Biol. Conserv. 178, 88–96. doi: 10.1016/j.biocon.2014.06.027
Landsberg, J. H., Kiryu, Y., Peters, E. C., Wilson, P. W., Perry, N., Waters, Y., et al. (2020). Stony coral tissue loss disease in florida is associated with disruption of host–zooxanthellae physiology. Front. Mar. Sci. 7:576013. doi: 10.3389/fmars.2020.576013
Lesser, M. P., Bythell, J. C., Gates, R. D., Johnstone, R. W., and Hoegh-Guldberg, O. (2007). Are infectious diseases really killing corals? Alternative interpretations of the experimental and ecological data. J. Exp. Mar. Biol. Ecol. 346, 36–44. doi: 10.1016/j.jembe.2007.02.015
Meyer, J. L., Castellanos-Gell, J., Aeby, G. S., Häse, C. C., Ushijima, B., and Paul, V. J. (2019). Microbial community shifts associated with the ongoing stony coral tissue loss disease outbreak on the florida reef track. Front. Microbiol. 10:2244. doi: 10.3389/fmicb.2019.02244
Muller, E. M., Sartor, C., Alcaraz, N. I., and van Woesik, R. (2020). Spatial epidemiology of the stony-coral-tissue-loss disease in Florida. Front. Mar. Sci. 7:163. doi: 10.3389/fmars.2020.00163
Muller, E. M., and van Woesik, R. (2012). Caribbean coral diseases: primary transmission or secondary infection? Glob. Chang. Biol. 18, 3529–3535. doi: 10.1111/gcb.12019
Myllymäki, M., and Mrkvicka, T. (2020). GET: global envelopes in R. Preprint arXiv [Preprint]. arXiv:1911.06583 [stat.ME],Google Scholar
Myllymäki, M., Mrkvicka, T., Grabarnik, P., Seijo, H., and Hahn, U. (2017). Global envelope test for spatial processes. J. R. Stat. Soc. B 79, 381–404. doi: 10.1111/rssb.12172
Neely, K. L., Macaulay, K. A., Hower, E. K., and Dobler, M. A. (2020). Effectiveness of topical antibiotics in treating corals affected by stony coral tissue loss disease. PeerJ 8:e9289. doi: 10.7717/peerj.9289
Noonan, K. R., and Childress, M. J. (2020). Association of butterflyfishes and stony coral tissue loss disease in the Florida Keys. Coral Reefs 39, 1581–1590. doi: 10.1007/s00338-020-01986-8
Nugues, M., Smith, G., van Hooidonk, R., Seabra, M. I., and Bak, R. P. M. (2004). Algal contact as a trigger for coral disease. Ecol. Lett. 7, 919–923. doi: 10.1111/j.1461-0248.2004.00651.x
Paul, V. J., Ushijima, B., and Aeby, G. (2019). Studies of the Ecology and Microbiology of Florida’s Coral Tissue Loss Diseases. Miami, FL: Florida DEP, 1–33.
Precht, W. F., Gintert, B. E., Robbart, M. L., Fura, R., and van Woesik, R. (2016). Unprecedented disease-related coral mortality in southeastern Florida. Sci. Rep. 6:31374. doi: 10.1038/srep31374
R Core Team (2019). R: A Language and Environment for Statistical Computing. Vienna: R Foundation for Statistical Computing.
Richardson, L. (1996). Motility patterns of Phormidium corallyticum and Beggiatoa spp. associated with black band disease of corals. Microb. Ecol. 32, 323–335.
Richardson, L. L., Goldberg, W. M., Kuta, K. G., Aronson, R. B., Smith, G. W., and Ritchie, K. B. (1998). Florida’s mystery coral-killer identified. Nature 392, 557–558. doi: 10.1038/33302
Rippe, J. P., Kriefall, N. G., Davies, S. W., and Castillo, K. D. (2019). Differential disease incidence and mortality of inner and outer reef corals of the upper Florida Keys in association with a white syndrome outbreak. Bull. Mar. Sci. 95, 305–316. doi: 10.5343/bms.2018.0034
Rodríguez-Martínez, R. E., Medina-Valmaseda, A. E., Blanchon, P., Monroy-Velázquez, L. V., Almazán-Becerril, A., Delgado-Pech, B., et al. (2019). Faunal mortality associated with massive beaching and decomposition of pelagic Sargassum. Mar. Pollut. Bull. 146, 201–205. doi: 10.1016/j.marpolbul.2019.06.015
Rodríguez-Martínez, R. E., Roy, P. D., Torrescano-Valle, N., Cabanillas-Terán, N., Carrillo-Domínguez, S., Collado-Vides, L., et al. (2020). Element concentrations in pelagic Sargassum along the Mexican Caribbean coast in 2018-2019. PeerJ 8:e8667. doi: 10.7717/peerj.8667
Ruiz-Moreno, D., Willis, B. L., Page, A. C., Weil, E., Cróquer, A., Vargas-Ángel, B., et al. (2012). Global coral disease prevalence associated with sea temperature anomalies and local factors. Dis. Aquat. Org. 100, 249–261. doi: 10.3354/dao02488
Sekhon, J. S. (2011). Multivariate and propensity score matching software with automated balance optimization: the matching package for R. J. Stat. Softw. 42, 1–52.
Sharp, W. C., Shea, C. P., Maxwell, K. E., Muller, E. M., and Hunt, J. H. (2020). Evaluating the small-scale epidemiology of the stony-coral-tissue-loss-disease in the middle Florida Keys. PLoS One 15:e0241871. doi: 10.1371/journal.pone.0241871
Sheather, S. J., and Jones, M. C. (1991). A reliable data-based bandwidth selection method for kernel density estimation. J. R. Stat. Soc. B. 53, 683–690.
Shore, A., and Caldwell, J. M. (2019). Modes of coral disease transmission: how do diseases spread between individuals and among populations? Mar. Biol. 166:45. doi: 10.1007/s00227-019-3490-8
Sokolow, S. (2009). Effects of a changing climate on the dynamics of coral infectious disease: a review of the evidence. Dis. Aquat. Organ. 87, 5–18. doi: 10.3354/dao02099
Spalding, M. D., Burke, L., Wood, S. A., and Ashpole, J. (2017). Mapping the global value and distribution of coral reef tourism. Mar. Policy 82, 104–113. doi: 10.1016/j.marpol.2017.05.014
Sweet, M. J., and Bulling, M. T. (2017). On the importance of the microbiome and pathobiome in coral health and disease. Front. Mar. Sci. 4:9. doi: 10.3389/fmars.2017.00009
Thomé, P. E., Rivera-Ortega, J., Rodríguez-Villalobos, J. C., Cerqueda-García, D., Guzmán-Urieta, E. O., García-Maldonado, J. Q., et al. (2021). Local dynamics of a white syndrome outbreak and changes in the microbial community structure associated with colonies of the scleractinian brain coral Pseudodiploria strigosa. PeerJ 9:e10695. doi: 10.7717/peerj.10695
Thrusfield, M. (2016). “Epidemiology,” in Diseases of Coral, eds C. M. Woodley, C. A. Downs, A. W. Bruckner, J. W. Porter, and S. B. Galloway (Hoboken, NJ: John Wiley & Sons, Inc), 28–51.
Van Tussenbroek, B. I., Hernández-Arana, H. A., Rodríguez-Martínez, R. E., Espinoza-Avalos, J., Canizales-Flores, H. M., González-Godoy, C. E., et al. (2017). Severe impacts of brown tides caused by Sargassum spp. on nearshore Caribbean seagrass communities. Mar. Pollut. Bull. 122, 272–281. doi: 10.1016/j.marpolbul.2017.06.057
Vega-Thurber, R., Mydlarz, L. D., Brandt, M., Harvell, D., Weil, E., Raymundo, L., et al. (2020). Deciphering coral disease dynamics: integrating host, microbiome, and the changing environment. Front. Ecol. Evol. 8:575927. doi: 10.3389/fevo.2020.575927
Vega-Thurber, R., Willner-Hall, D., Rodríguez-Mueller, B., Desnues, C., Edwards, R. A., Angly, F., et al. (2009). Metagenomic analysis of stressed coral holobionts. Environ. Microbiol. 11, 2148–2163. doi: 10.1111/j.1462-2920.2009.01935.x
Wang, L., Shantz, A. A., Payet, J. P., Sharpton, T. J., Foster, A., Burkepile, D. E., et al. (2018). Corals and their microbiomes are differentially affected by exposure to elevated nutrients and a natural thermal anomaly. Front. Mar. Sci. 5:101. doi: 10.3389/fmars.2018.00101
Webster, J. P., Borlase, A., and Rudge, J. W. (2017). Who acquires infection from whom and how? Disentangling multi-host and multi-mode transmission dynamics in the ‘elimination’ era. Phil. Trans. R. Soc. B 372:20160091. doi: 10.1098/rstb.2016.0091
Williams, D. E., and Miller, M. W. (2005). Coral disease outbreak: pattern, prevalence and transmission in Acropora cervicornis. Mar. Ecol. Prog. Ser. 301, 119–128. doi: 10.3354/meps301119
Woodley, C. M., Downs, C. A., Bruckner, A. W., Porter, J. W., and Galloway, S. B. (2016). Diseases of Coral. Hoboken, NJ: John Wiley & Sons Inc.
Work, T. M., and Aeby, G. S. (2006). Systematically describing gross lesions in corals. Dis. Aquat. Org. 70, 155–160. doi: 10.3354/dao070155
Zaneveld, J., McMinds, R., and Vega Thurber, R. (2017). Stress and stability: applying the Anna Karenina principle to animal microbiomes. Nat. Microbiol. 2:17121. doi: 10.1038/nmicrobiol.2017.121
Zaneveld, J. R., Burkepile, D. E., Shantz, A. A., Pritchard, C. E., McMinds, R., Payet, J. P., et al. (2016). Overfishing and nutrient pollution interact with temperature to disrupt coral reefs down to microbial scales. Nat. Commun. 7:11833. doi: 10.1038/ncomms11833
Keywords: SCTLD, white plague, coral disease, incidence, transmission
Citation: Guzmán-Urieta EO and Jordán-Dahlgren E (2021) Spatial Patterns of a Lethal White Syndrome Outbreak in Pseudodiploria strigosa. Front. Mar. Sci. 8:669171. doi: 10.3389/fmars.2021.669171
Received: 18 February 2021; Accepted: 03 August 2021;
Published: 03 September 2021.
Edited by:
William F. Precht, Dial Cordy and Associates, Inc., United StatesReviewed by:
Greta Smith Aeby, Qatar University, QatarBrian Keith Walker, Nova Southeastern University, United States
Copyright © 2021 Guzmán-Urieta and Jordán-Dahlgren. This is an open-access article distributed under the terms of the Creative Commons Attribution License (CC BY). The use, distribution or reproduction in other forums is permitted, provided the original author(s) and the copyright owner(s) are credited and that the original publication in this journal is cited, in accordance with accepted academic practice. No use, distribution or reproduction is permitted which does not comply with these terms.
*Correspondence: Edgar O. Guzmán-Urieta, ZWRvbWd1em1hbkBvdXRsb29rLmNvbQ==