 Wei-Jen Lin
 Ming-Chih Chiu
 Chiao-Wen Lin
 Hsing-Juh Lin
- 1Department of Life Sciences, National Chung Hsing University, Taichung, Taiwan
- 2Innovation and Development Center of Sustainable Agriculture, National Chung Hsing University, Taichung, Taiwan
The contribution of unvegetated tidal flats to global net primary production is comparable to that of some vegetated coastal habitats. However, compared to carbon flux regulating factors in vegetated habitats, those in unvegetated tidal flats are not well understood, particularly in terms of their cause-effect relationships. Maximum gross primary production (GPPm), net primary production (NPP) and total respiration (TR) during emersion at noon when the irradiance level was at the saturation level for photosynthesis in nine unvegetated tidal flats across the Taiwan Strait in tropical and subtropical regions were determined in winter and summer from 2011 to 2016 to examine the direct and indirect relationships between sediment characteristics and carbon fluxes by using structural equation models (SEM). Most of the GPPm and NPP values were higher in winter than in summer. Conversely, the TR values were higher in summer than in winter. The NPP values at some sites shifted to negative values in summer, indicating the sites were carbon sources. The values of GPPm, TR and NPP for the tidal flats all increased significantly with increasing sediment mud content. The SEM results showed that the sediment mud content directly increased GPPm or indirectly increased GPPm via a compositional shift in benthic microalgae. The sediment mud content also directly increased TR or indirectly increased TR via increased organic matter content. The contribution of benthic microalgal and macrofaunal biomass to TR was relatively minor. This result suggests that primary production was stimulated mainly by the organic matter content rather than by increased microalgal biomass. With the integrated SEM framework, our results showed mechanistic evidence of how sediment mud content acted as a critical factor regulating carbon fluxes in unvegetated tidal flats.
Introduction
Unvegetated tidal flats (hereafter tidal flats) are the area inundated between the high- and low-tide waterlines, including sandy and muddy sediments (Murray et al., 2012). Tidal flats encompass a large proportion of the coastal zone. The global area of tidal flats has been estimated at 127,921 km2, with most being distributed in Asia (44% of total; Murray et al., 2019). The estimated global area of tidal flats is only 16% of that of seagrass beds but is comparable to that of mangroves and 2.3 times that of salt marshes (Davidson and Finlayson, 2019). Although the daily rate of net primary production (NPP) in tidal flats is at most 20% of that of vegetated coastal habitats, the global NPP of tidal flats (11.04 Tg C yr–1), obtained by multiplying the NPP by the global area, might reach approximately 50% of that of salt marshes (Lin et al., 2020). The carbon stock of tidal flats (78.07 Tg C) is nearly four times higher than that of vegetated habitats (20.53 Tg C) along the coast of China (Chen et al., 2020). Currently, anthropogenic activities, such as land development (Koh and Khim, 2014; Chen et al., 2016), oil spills (Junoy et al., 2005; Lee and Lin, 2013; Yu et al., 2013) and heavy metal pollution (Rahman and Ishiga, 2012; Zhang et al., 2013), tend to occur in tidal flats.
Benthic microalgae, also known as microphytobenthos, are generally the major primary producers in tidal flats throughout the year (McIntyre et al., 1996; Underwood and Kromkamp, 1999). These microalgae can contribute up to 65% of the combined production of phytoplankton and benthic microalgae in shallow-water ecosystems (McMinn et al., 2005; Sarker et al., 2009). This production can provide food sources for not only local benthic systems but also nearby pelagic systems. Over 30% of benthic microalgae may be resuspended by the turbulence of tidal currents and wind-generated waves (De Jonge and Van Beuselom, 1992), part of which is exported to nearby coastal ecosystems by tidal currents and further subsidizes secondary production through the outwelling of benthic microalgae (Guarini et al., 2008; Yoshino et al., 2012; Savelli et al., 2019).
The production of benthic microalgae in tidal flats is frequently higher in tropical regions than in temperate regions (Cahoon, 1999). In temperate regions, tidal flats might be either small carbon sinks or carbon sources during emersion (Brotas and Catarino, 1995; Migné et al., 2004; Hubas and Davoult, 2006; Spilmont et al., 2006; Otani and Endo, 2019). In subtropical regions, tidal flats act as carbon sinks during emersion (Lee et al., 2011). Lin et al. (2020) demonstrated a clear latitudinal gradient in winter from 20°N to 40°N in which primary production and respiration in tidal flats during emersion decreased by up to 104% toward higher latitudes, but no clear trend was detected across the latitudinal gradient in summer. It appears that the contribution of NPP from tidal flats to the coastal carbon flux was greater in tropical and subtropical regions than in temperate regions (Lin et al., 2020). Along the latitudinal gradient, sediment temperature is a main factor that regulates carbon fluxes in tidal flats (Lin et al., 2020). The authors also indicated that sediment features might be more prominent in regulating carbon fluxes in tidal flats at a local scale. However, both direct and indirect relationships between sediment characteristics and carbon fluxes in tidal flats are rarely emphasized simultaneously.
There is still no comprehensive quantitative analysis addressing the network of relationships between sediment characteristics and carbon fluxes from benthic microalgae. Some studies have reported no clear relationship between sediment characteristics and the production of benthic microalgae (Davis and Mclntire, 1983; Hubas et al., 2006). Others have suggested a negative relationship between sediment mud content and benthic production (Billerbeck et al., 2007; Lee et al., 2011). However, some studies have noted that benthic production was higher in sediments with higher mud content (Colijn and de Jonge, 1984; Hubas et al., 2007; Davoult et al., 2009; Migné et al., 2016; Haro et al., 2020). This inconsistency might be due to different study scales. Most studies have measured only one tidal flat with a limited number of sampling sites; few studies, however, have measured different tidal flats representing a gradient of sediment characteristics. For example, Pratt et al. (2014) compiled data on gross primary production (GPP) and sediment oxygen consumption from nine intertidal flats on the North Island of New Zealand and found that both processes decreased with increases in sediment mud content. However, the range of sediment mud content was between 0 and 30%. It is uncertain whether benthic metabolism would respond in the same way to sediment with mud content > 30%. In this study, because primary production of benthic microalgae mostly occurs on the surface of tidal flats during daytime emersion (Lee et al., 2011), we determined the carbon dioxide (CO2) fluxes in nine tidal flats during emersion in tropical and subtropical regions along a larger gradient of sediment mud content, between 0 and 90% in summer and winter, respectively. It was hypothesized that the CO2 fluxes in tidal flats would decrease with increasing sediment mud content. We further explored multiple hypotheses about the direct and indirect relationships between CO2 fluxes in tidal flats and sediment characteristics by using structural equation models (SEM).
Materials and Methods
Sampling Sites
Nine tidal flats in tropical and subtropical regions across the Taiwan Strait (22.48°N∼26.15°N) were chosen as our sampling sites in this study. Five of the sites were in the eastern Taiwan Strait, and four of the sites were located in the western Taiwan Strait (Figure 1 and Table 1). Measurements at each site were conducted separately in summer and in winter. Due to labor constraints and financial difficulties, all the measurements were not necessarily conducted in the same year. The air temperature ranges from 11.2 to 20.0°C in winter and from 27.1 to 30.0°C in summer. The annual precipitation ranges from 908 to 1735 mm. The climate data in the studied years were derived from the local weather station at each sampling site and obtained from the Observation Data Inquiry System of the Central Weather Bureau, Taiwan1.
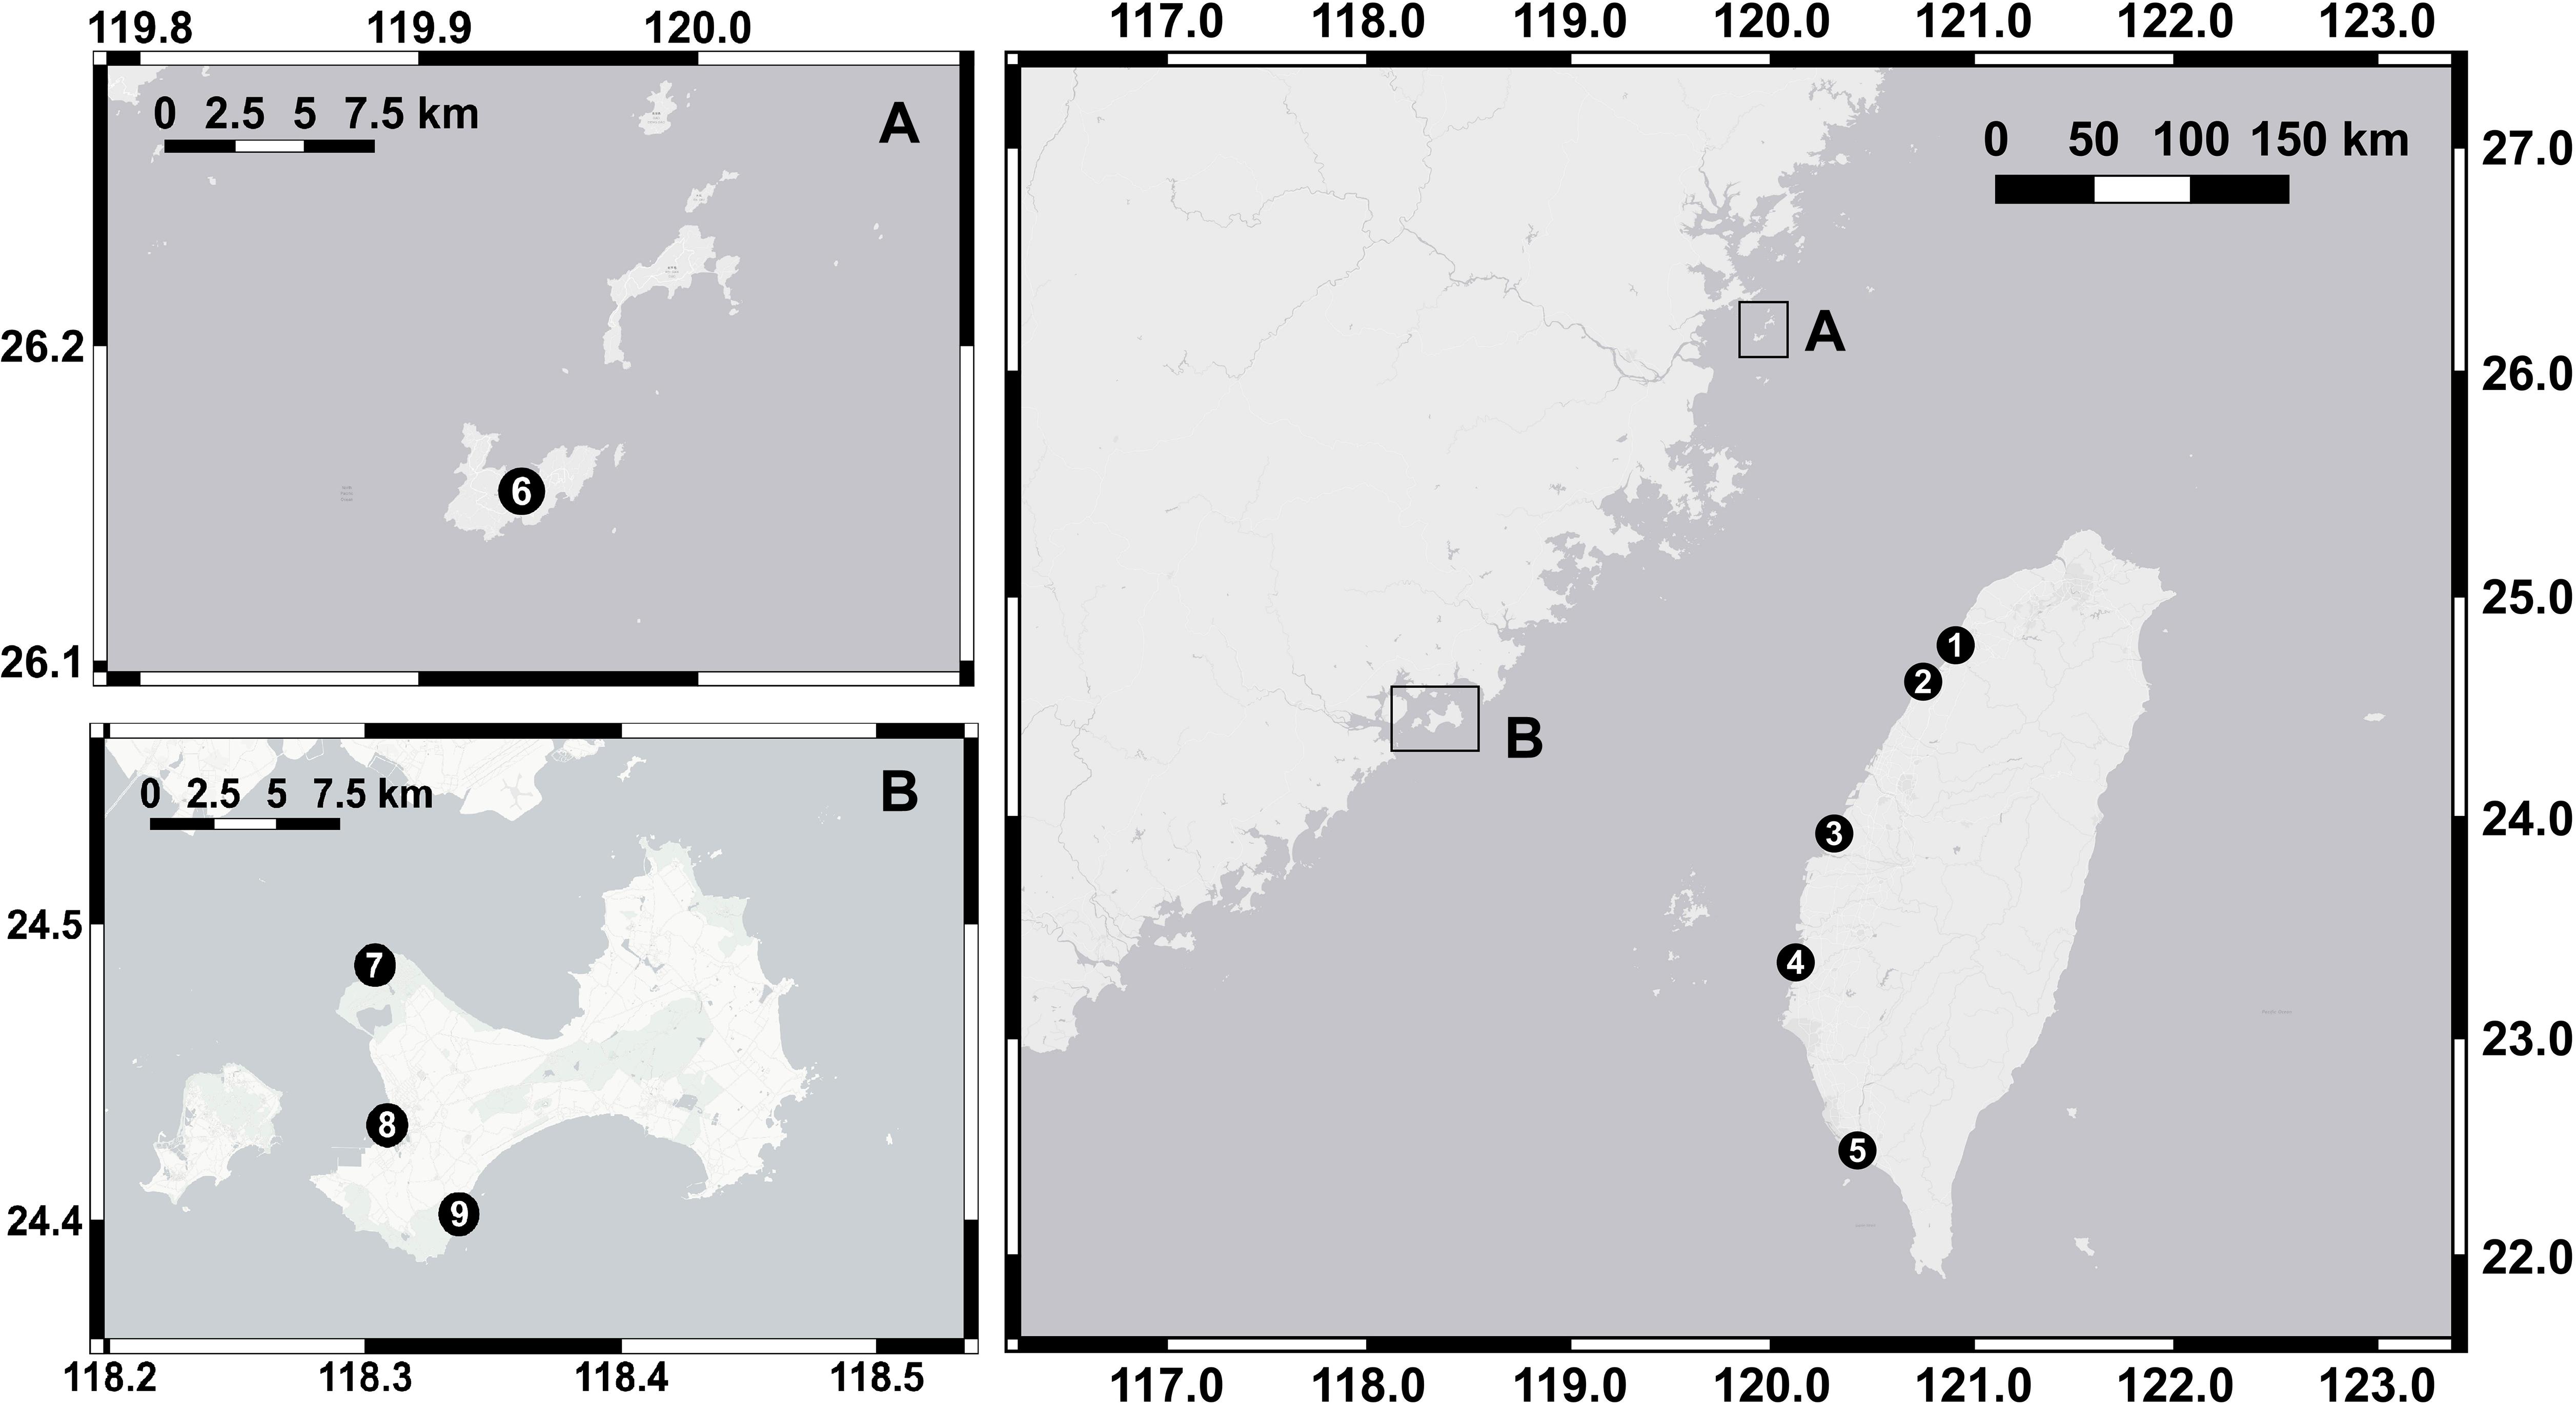
Figure 1. Sampling locations in the nine tidal flats. Five sites were located in the eastern Taiwan Strait, and four sites were in the western Taiwan Strait (A,B). The location numbers and names are given in Table 1.
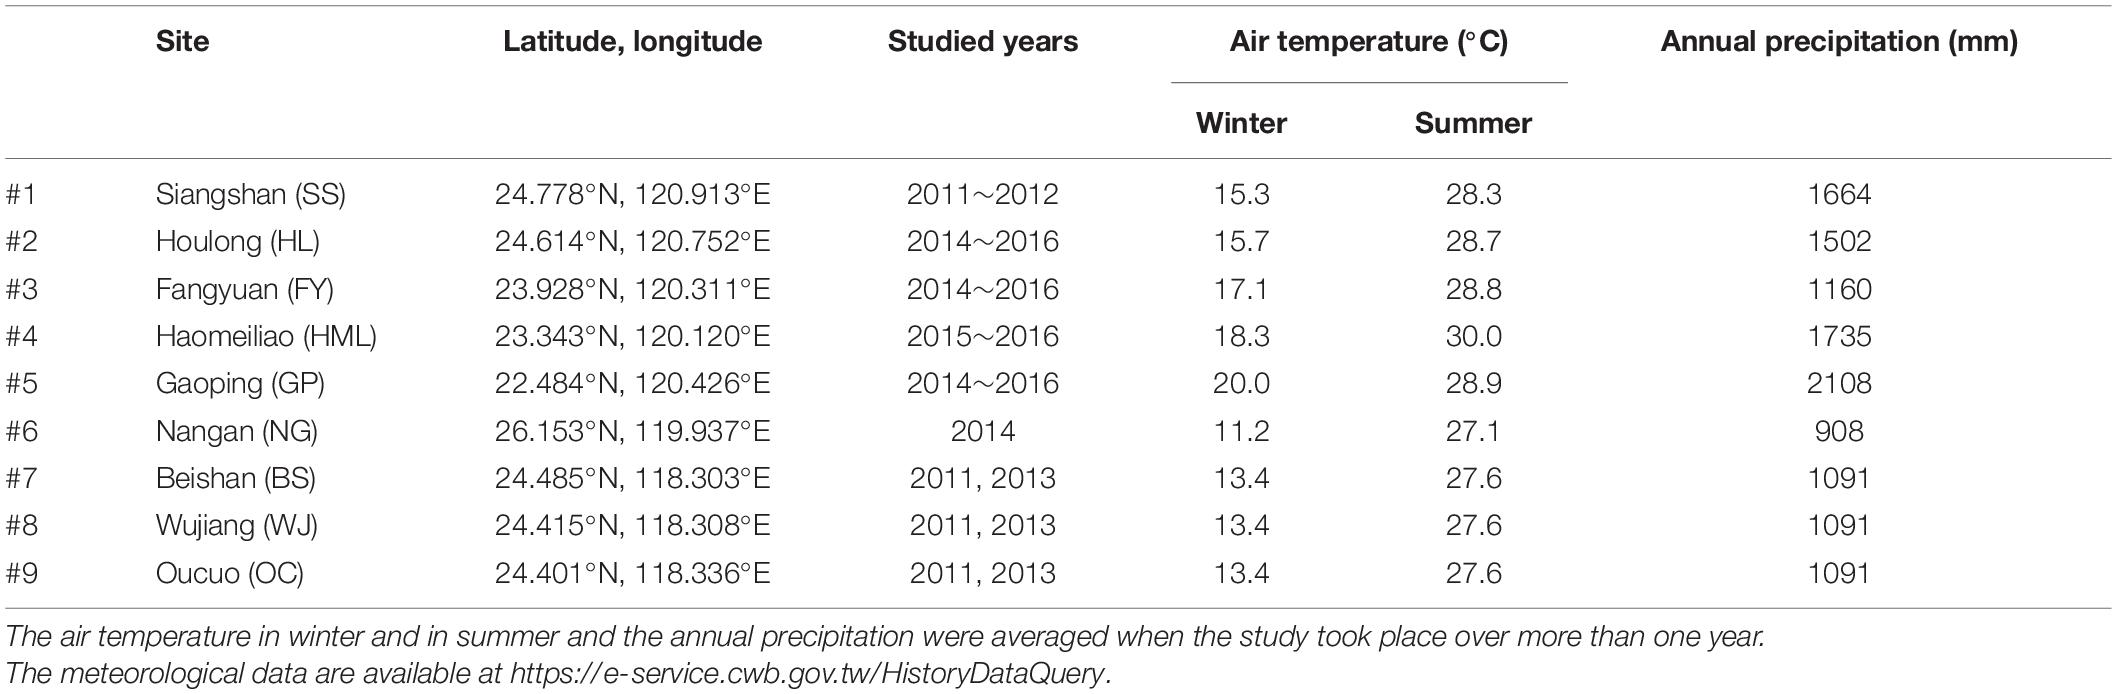
Table 1. Locations, study years, and meteorological conditions in the tidal flats.
Carbon Flux Measurements
The carbon fluxes in the tidal flats were measured during emersion at each sampling site by the benthic closed-chamber method. This method, which was originally developed by Migné et al. (2002) and modified by Lee et al. (2011), was used to measure CO2 fluxes from the sediment through the photosynthesis of benthic microalgae and through autotrophic and heterotrophic respiration (i.e., total respiration) within the chamber. Measurements were conducted in situ on sunny days under ambient light conditions at noon (10:00 to 14:00) because the irradiance level was at the saturation level for photosynthesis. The respiration in subtropical tidal flats during nighttime was 50% lower than that during daytime (Lee et al., 2011). However, the main purpose of this study was to examine the relationships between sediment characteristics and carbon fluxes rather than quantifying daily production in the tidal flats. Since the CO2 fluxes might be affected by tides (Spilmont et al., 2007), emersions during spring tides were selected as the measurement times at all sampling sites to enable cross-site comparisons.
During emersion, a benthic chamber, composed of a semicircular transparent acrylic dome on the top and a stainless steel ring (30 cm in diameter and 16 cm in height) at the bottom, were pushed into the sediment of tidal flats to a depth of 10 cm. The chamber encompassed 10.6 L of air over a sediment area of 0.071 m2 within the dome. To make the chamber airtight, gas leakage was always excluded prior to each measurement. CO2 fluxes between the sediment and the air were monitored by an infrared CO2 gas analyzer (LI-820, LI-COR, Lincoln, NE, United States) and recorded by a data logger (LI-1400, LI-COR) with a 30 s logging frequency for 10 min before the environmental conditions (i.e., air pressure, temperature, and humidity) obviously increased within the chamber compared to outside conditions. The CO2 fluxes (in mg C m–2 h–1) were calculated by the slope of the linear regression line between CO2 concentration (ppm) and recorded frequency (30 s), assuming a molar volume of 24.5 L mol–1 at normal temperature (25°C) and pressure (1 atm) (NTP)and a molar mass of 12 g C mol–1 CO2. To avoid any potential perturbation during initial measurements, only CO2 fluxes during the last 8 min were regressed against time. The linear regressions were acceptable when the determination coefficient was >0.80. Photosynthetically active radiation (PAR, 400–700 nm, in μmol quanta m–2 s–1) and sediment temperature were recorded simultaneously outside the chamber with a quantum sensor (LI-190SA, LI-COR) and a temperature sensor (LI-1400-101, LI-COR) with the same data logger listed above.
On each measurement, three to five benthic chambers were used. These benthic chambers were placed on the sediment approximately 5 m apart to eliminate any potential interactions between the sediment samples. We performed the measurements on separate days to collect sufficient replicates in each season for each site (Table 2). Prior to each measurement, the CO2 gas analyzers were calibrated with CO2-free gas and 500 ppm CO2. The accuracy of the CO2 gas analyzer was <2.5% of the measurement.
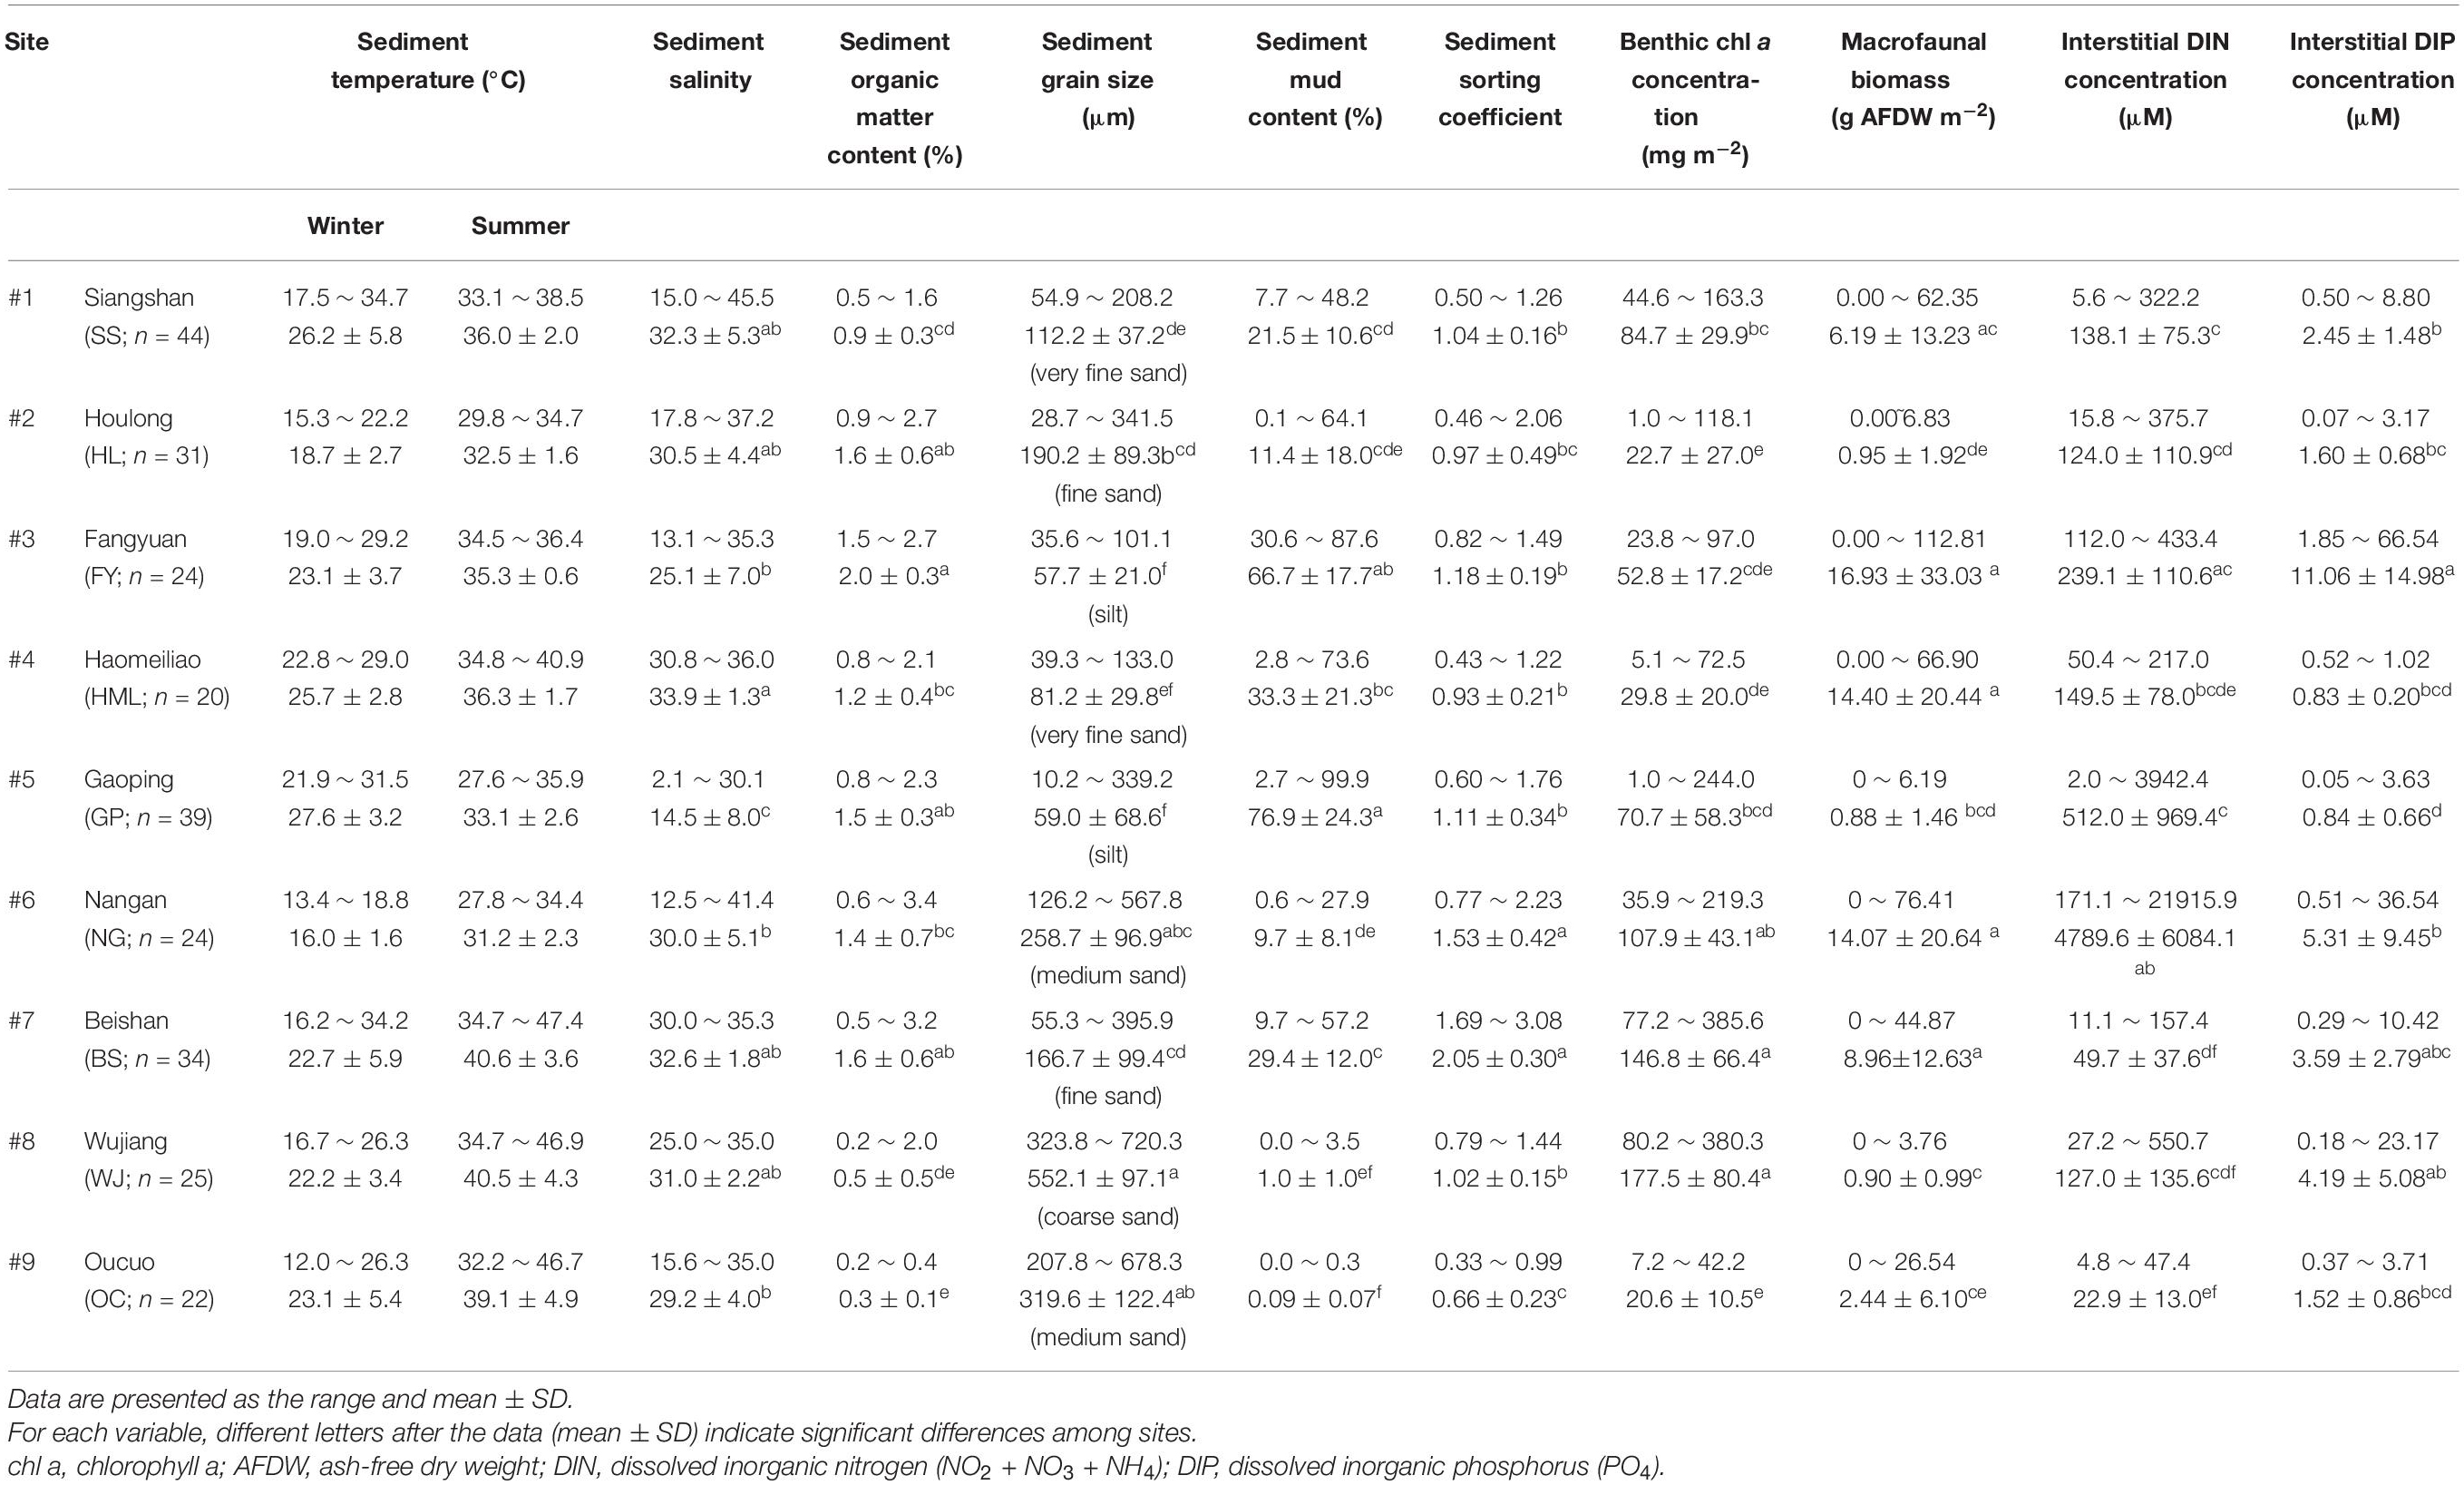
Table 2. Sediment characteristics of the tidal flats.
The measurements under ambient light conditions allowed us to estimate the NPP, and the measurements performed in the dark (100% shading) allowed the estimation of total respiration (TR). The GPP describes the total uptake of CO2 by a tidal flat, which was calculated by adding the NPP to the TR as shown in Equation (1).
whenever the sum of NPP and TR was negative, the tidal flat showed heterotrophic conditions; the GPP was then assumed to be zero. Measurements were considered outliers and excluded for further analysis when they fell outside the interquartile range (i.e., between Q1 – 1.5 × IQR and Q3 + 1.5 × IQR, where Q1 is the first quartile, Q3 is the third quartile, and IQR is the difference between Q1 and Q3, Lin et al., 2020). At each site in each season, at least 10 random and non-repeating replicates of CO2 flux measurements were obtained.
At each site for each measurement, the chambers were exposed in situ to a series of five different irradiances (0, 30, 50, 70, and 100% shading) by covering the chambers with screens with different meshes or an opaque fabric to determine the CO2 flux as a function of the incident irradiance (i.e., P-I curve) on the sediment. This P-I curve can be described by the equation of Jassby and Platt (1976):
where GPPm is the maximum GPP (in mg C m–2 h–1) in the absence of photoinhibition under optimal irradiance, α is the initial slope of the P-I curve, and E is the irradiance measured as PAR (in μmol quanta m–2 s–1). P-I curves were drawn in Sigmaplot (version 12.5; Systat Software Inc., San Jose, CA, United States) for non-linear regression fitting, and the results were acceptable when the fit was significant (p < 0.05) and the determination coefficient was larger than 0.80 (Supplementary Figure 1).
Environmental and Biological Variables
After each CO2 flux measurement, the top 5 cm of the sediment inside each chamber was sampled by a cutoff syringe with a 2.6 cm inner diameter for sediment characterization and interstitial nutrient analyses. The sediment grain size, sorting coefficient, and mud content were determined by the standard wet-sieved method (Bale and Kenny, 2005) and the modified pipette method (Hsieh and Chang, 1991). Fine materials, such as clay and silt, referred to as mud (grain size < 63 μm). The sediment organic matter content was measured by the loss-on-ignition method (Bale and Kenny, 2005). Sediment interstitial water from the top 5 cm layer was collected, filtered through Whatman GF/C glass fiber filters, stored at 4°C, and then brought to the laboratory for nutrient analysis. A spectrophotometer (U-5100, Hitachi, Tokyo, Japan) was used for the determination of nitrite (Bendschneider and Robinson, 1952), nitrate (Jenkins and Medsker, 1964), ammonia (Pai et al., 2001), and phosphate (Murphy and Riley, 1962). The salinity of the interstitial water was measured by a portable conductivity meter (ProfiLine Cond 3310, WTW, Weilheim, Germany).
After each CO2 flux measurement, the biomasses of benthic microalgae and macrofauna inside the chamber were also determined. The top 1 cm of the sediment, where most benthic microalgae are located (Cadée and Hegeman, 1974), was sampled by a cutoff syringe with a 1 cm inner diameter (six replicates for each chamber). The sediment samples were then frozen until they were brought to the laboratory. The chlorophyll a, b, and c concentrations were measured by the acetone method (Jeffrey and Humphrey, 1975). While the chlorophyll a concentration can be a proxy for the total biomass of benthic microalgae, the chlorophyll b and c concentrations indicate the biomass of green algae and diatoms in tidal flats, respectively (Golterman, 1975). For collecting macrofauna, the top 10 cm of the sediment was sampled by a stainless steel ring corer with a 10 cm inner diameter (one sample for each chamber). The sediment samples were then strained with a 0.5 mm sieve and preserved in 70% ethanol in the field. After being brought back to the laboratory, the macrofauna samples were sorted, counted and weighed by oven-drying (60°C) to a constant weight and then combusted at 500°C for 4 h to determine the ash-free dry weight (AFDW).
Data Analysis
Since our data failed in the normality test and did not meet the assumptions for a one-way ANOVA, the Kruskal–Wallis test was used to examine whether the sediment characteristics differed among the nine study sites. When significant differences (p < 0.05) were detected, Dunn’s multiple comparisons test was further used to determine which means differed.
Structural equation models (SEM) were used to assess the hypothesized direct and indirect effects of sediment characteristics and the biomasses of benthic microalgae and macrofauna on the primary production and respiration of the tidal flats. To answer such fundamental questions, we needed a mechanistic understanding of the relationships among the potential factors and their relative importance. By testing multivariate hypotheses and considering the direct and indirect effects of multiple interacting variables, SEM is a multivariate technique suitable to test networks of causal models (Eisenhauer et al., 2015).
Since sediment mud content is closely related to other sediment characteristics, such as grain size, organic matter content, sorting coefficient and interstitial nutrient content, sediment mud content was used as the proxy for the sediment characteristics in the conceptual SEM (Figure 2).
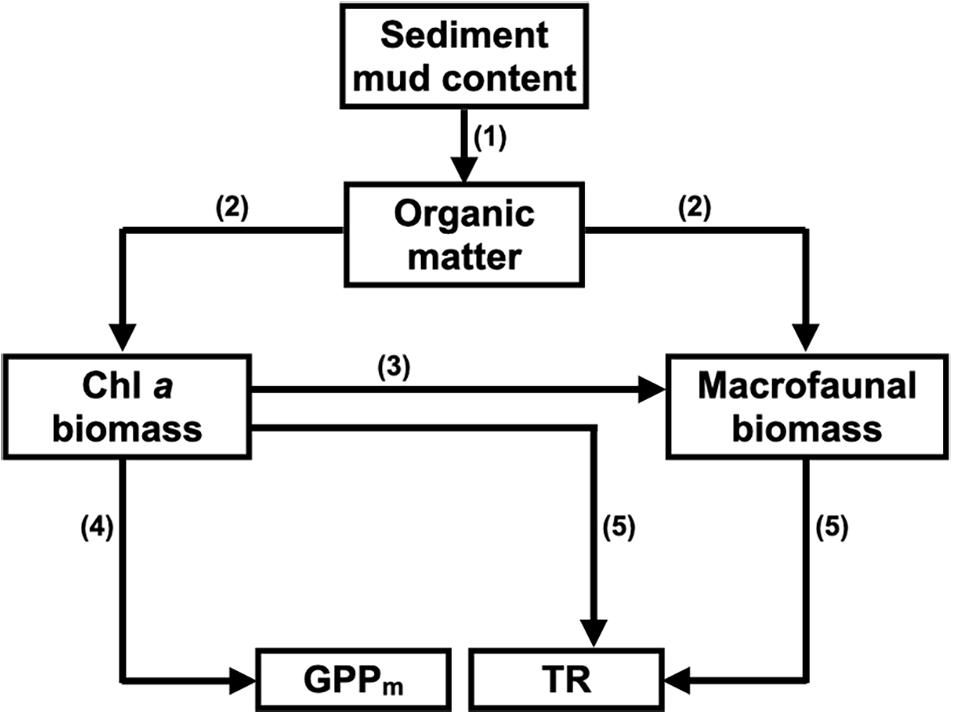
Figure 2. Conceptual structural equation model (SEM) depicting how sediment mud content affects benthic microalgal biomass and macrofaunal biomass and how both of these factors control maximum gross primary production (GPPm) and total respiration (TR) in tidal flats. (1) Fine-grained sediments (e.g., mud) provide more binding sites for organic matter flocculation than coarse-grained sediments (e.g., sand); (2) Sediment organic matter is the food sources for benthic microalgae and macrofauna; (3) Macrofauna feed on benthic microalgae in the sediment; (4) Benthic microalgae contribute most of the GPP in the sediment; (5) Both benthic microalgae and macrofauna contribute to the TR in the sediment.
Since sediment characteristics can also affect the composition of benthic microalgae, an alternative conceptual SEM was constructed to assess the potential effects of benthic microalgal composition on the CO2 fluxes in the tidal flats. We used a composite variable that represented a combination of the chlorophyll a, b, and c concentrations to replace the chlorophyll a concentration (the total biomass of benthic microalgae) only for SEM analysis. The composite variable originated from the total combined influence of the measured variables (Grace and Bollen, 2008) and was the sum of all variables involved, depending on the different weights the variables were expected to have. The weights of each variable were derived from the coefficients of the multiple regression of GPPm with the chlorophyll a, b, and c concentrations of benthic microalgae.
Piecewise SEM was used to test the validity of the conceptual models (Lefcheck, 2016); this approach allowed the fitting of generalized linear mixed models with a hierarchical design (Figure 2). We used Shipley’s test of direct separation (d-test) to assess the overall fit of the models. The model was acceptable when the p-value of the chi-square test of Fisher’s C statistic was higher than the significance level (p > 0.05). Fisher’s C test was related to all the unspecified paths of the conceptual models. When one or more of these unspecified paths presented significant importance, the model did not have a good fit, as the p-value of the chi-square test of Fisher’s C statistic was lower than 0.05. Therefore, these missing paths included required information and needed to be added to the conceptual model. We fitted our conceptual model as a generalized linear model with a Tweedie distribution (Tweedie, 1984) because our data were distributed from zero to positive values. The piecewise SEM was performed by using the ‘psem’ function from the R package ‘piecewiseSEM’ (Lefcheck, 2016). The standardized path coefficients were determined using the bootstrap method from the R package ‘semEff’ (Murphy, 2020). All above statistical analyses were performed with the statistical software R version 4.0.4 (R Core Team, 2021).
Results
Sediment Granulometry
Based on the grain size data, the sediments at the nine tidal flats were classified into five categories: coarse sand (#8 WJ), medium sand (#6 NG, #9 OC), fine sand (#2 HL, #7 BS), very fine sand (#1 SS, #4 HML) and silt (#3 FY, #5 GP) sediment. The median grain size averaged between 57.7 and 552.1 μm, and the mud content averaged from 0.1 to 76.9% (Table 2). The increases in sediment mud content were also concomitant with changes in the sorting coefficient and the interstitial dissolved inorganic nitrogen (DIN) concentration (Table 3).
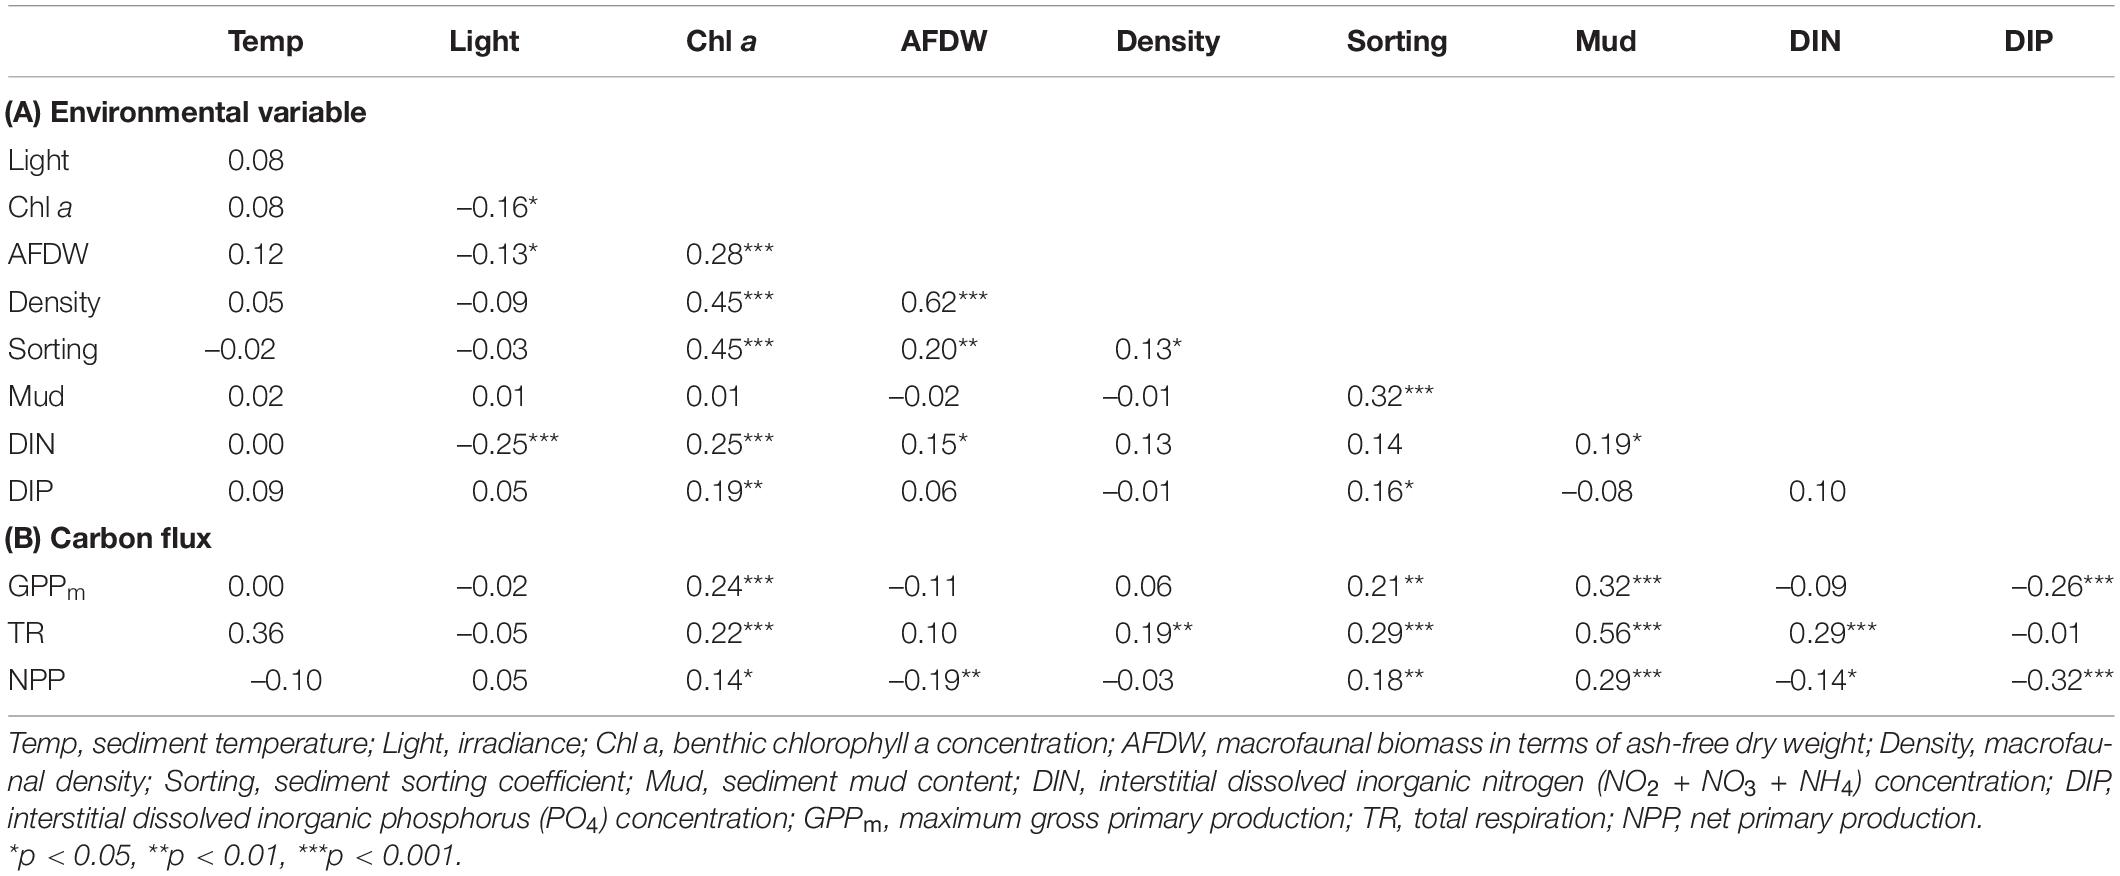
Table 3. Spearman rank correlation coefficients between (A) environmental variables and (B) environmental variables and carbon fluxes in the tidal flats.
Benthic Microalgal and Macrofaunal Biomass
The benthic chlorophyll a concentration ranged from 12.5 to 221.3 mg m–2, with an average concentration of 78.8 mg m–2 for all the samples analyzed (Figure 3A). Of the sites, #8 WJ in summer (221.3 ± 96.2 mg m–2) and #7 BS in winter (168.8 ± 77.4 mg m–2) had the highest observed benthic chlorophyll a concentrations. The lowest values of the benthic chlorophyll a concentration were observed at #9 OC in both summer and winter (28.8 ± 8.9 mg m–2, 12.5 ± 2.9 mg m–2).
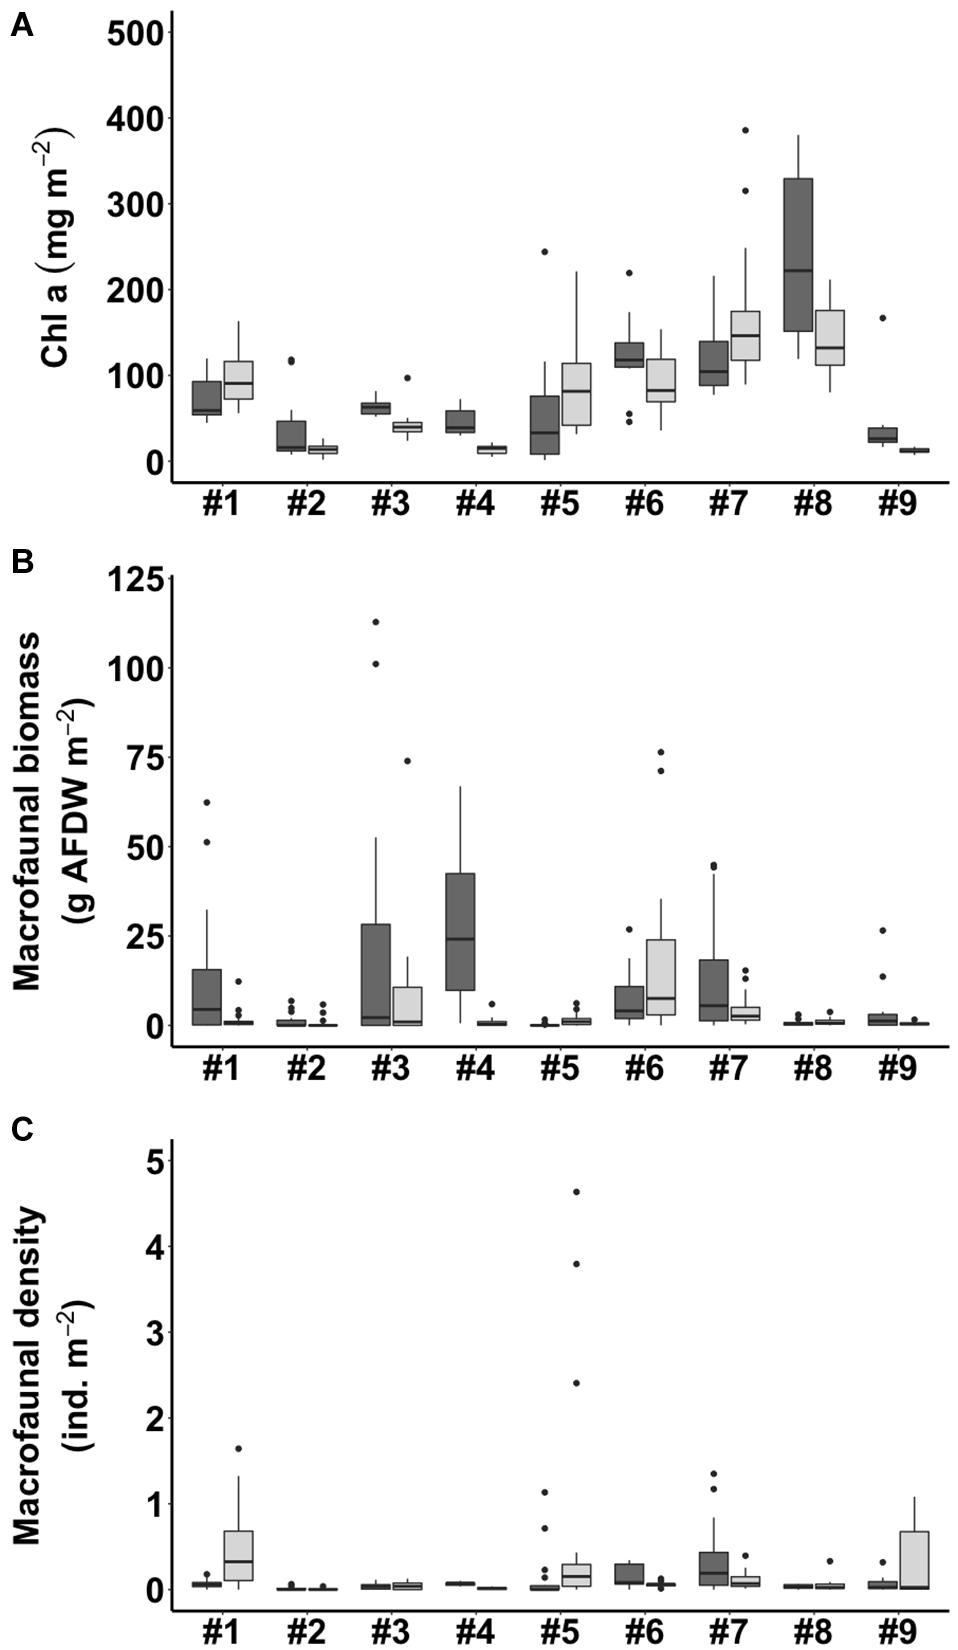
Figure 3. Benthic chlorophyll a concentration (A), macrofaunal biomass (B), and macrofaunal density (C) in summer (shown in dark gray) and winter (shown in light gray) in the tidal flats. The site numbers are listed in Table 1.
The macrofauna in the top 10 cm of the sediment of the tidal flats were mainly bivalves, decapods, gastropods, amphipods, and polychetes (Supplementary Table 1). The macrofaunal biomass in terms of ash-free dry weight (g AFDW m–2) varied among the nine study sites, ranging from 0.1 to 28.6 g AFDW m–2. The macrofaunal biomass showed the highest values at #4 HML (27.7 ± 22.0 g AFDW m–2) in summer and at #6 NG (20.4 ± 27.0 g AFDW m–2) in winter but the lowest values at #5 GP (0.1 ± 0.3 g AFDW m–2) in summer and at #9 OC (0.5 ± 0.5 g AFDW m–2) in winter (Figure 3B). The macrofaunal density also varied among the nine study sites, ranging from 0.01 to 0.63 ind. m–2. The highest values of macrofaunal density appeared at #7 BS (0.34 ± 0.40 ind. m–2) in summer and at #1 SS (0.48 ± 0.41 ind. m–2) in winter, while the lowest values appeared at #2 HL (0.01 ± 0.02, 0.01 ± 0.01 ind. m–2) in both summer and winter (Figure 3C).
Benthic Carbon Dioxide Fluxes
During emersion, GPPm showed a clear seasonal pattern with higher values in winter and lower values in summer at most of the study sites except for #8 WJ and #9 OC (Figure 4A). Of the sites, #5 GP had the highest values of GPPm in both summer and winter (76.5 ± 21.2 and 89.7 ± 41.7 mg C m–2 h–1, respectively). The lowest values of GPPm were observed at #3 FY in summer (1.2 ± 1.1 mg C m–2 h–1) and at #9 OC in winter (4.4 ± 3.5 mg C m–2 h–1). GPPm was positively correlated with benthic chlorophyll a concentration, sorting coefficient and mud content but negatively correlated with interstitial dissolved inorganic phosphorus (DIP) concentration (Table 3).
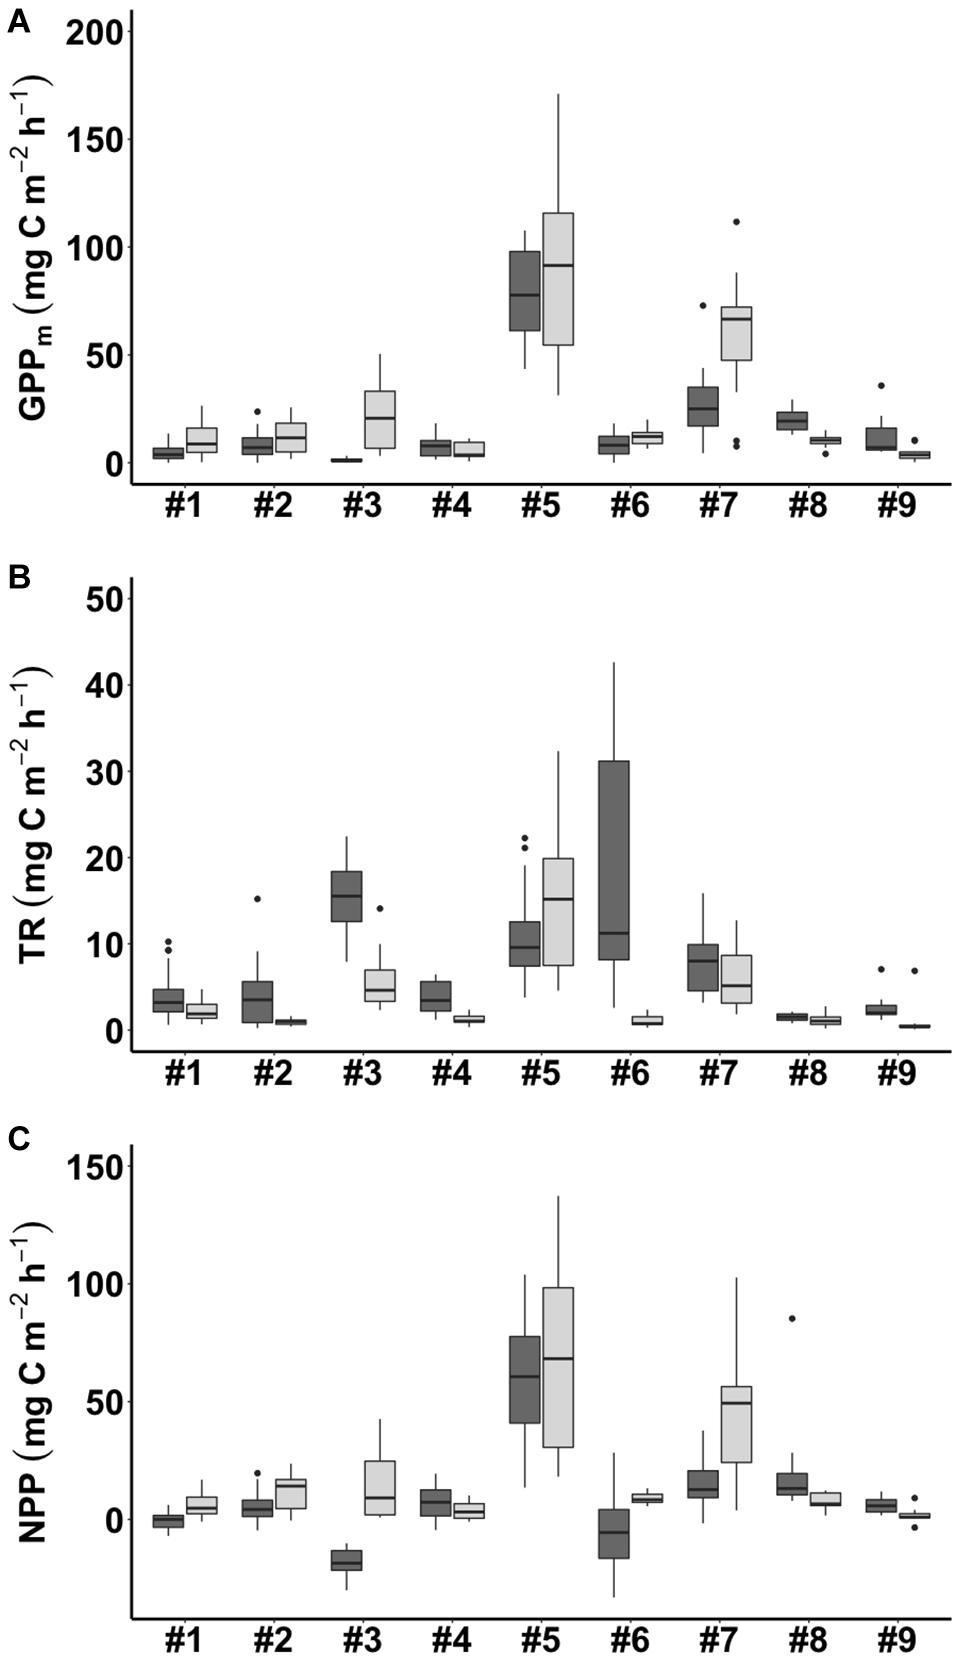
Figure 4. Carbon flux (A: GPPm = maximum gross primary production; B: TR = total respiration; C: NPP = net primary production) in summer (shown in dark gray) and winter (shown in light gray) in the tidal flats during emersion. The site numbers are listed in Table 1.
Total respiration (TR) had an opposite seasonal pattern to that of GPPm at most of the study sites, with higher values in summer and lower values in winter except at #5 GP (Figure 4B). The highest values of TR occurred at #6 NG in summer (17.5 ± 14.2 mg C m–2 h–1) and at #5 GP in winter (15.3 ± 7.5 mg C m–2 h–1). The lowest values of TR occurred at #8 WJ in summer (1.5 ± 0.4 mg C m–2 h–1) and #2 HL in winter (1.0 ± 0.4 mg C m–2 h–1). TR was positively correlated with benthic chlorophyll a concentration, sorting coefficient, mud content, and interstitial DIN concentration (Table 3).
The seasonal pattern of NPP was similar to that of GPPm (Figure 4C). The highest values of NPP appeared at #5 GP in both summer and winter (59.1 ± 26.2 and 68.1 ± 37.0 mg C m–2 h–1, respectively). The lowest values of NPP appeared at #3 FY in summer (–17.9 ± 6.4 mg C m–2 h–1) and at #9 OC in winter (1.8 ± 3.2 mg C m–2 h–1). Notably, the NPP values for the tidal flats at #1 SS, #3 FY, and #6 NG during emersion shifted to negative values in summer, indicating that these sites functioned as carbon sources. The NPP values were positively correlated with benthic chlorophyll a concentration, macrofaunal biomass, sorting coefficient and mud content but negatively correlated with interstitial DIN and DIP concentrations.
All values of GPPm, TR and NPP for the tidal flats during emersion increased significantly with increasing sediment mud content (Figure 5). Significant linear increases in GPPm (y = 0.586x + 5.574, r2 = 0.386, p < 0.01) and NPP (y = 0.398x + 3.201, r2 = 0.251, p = 0.034) were apparent when the sediment mud content ranged from 0 to 90%. However, there was high variability in the muddier sediments (Figures 5A,C). The TR (y = 0.126x + 2.212, r2 = 0.400, p < 0.01) curve was similar to the curves of GPPm and NPP (Figure 5B).
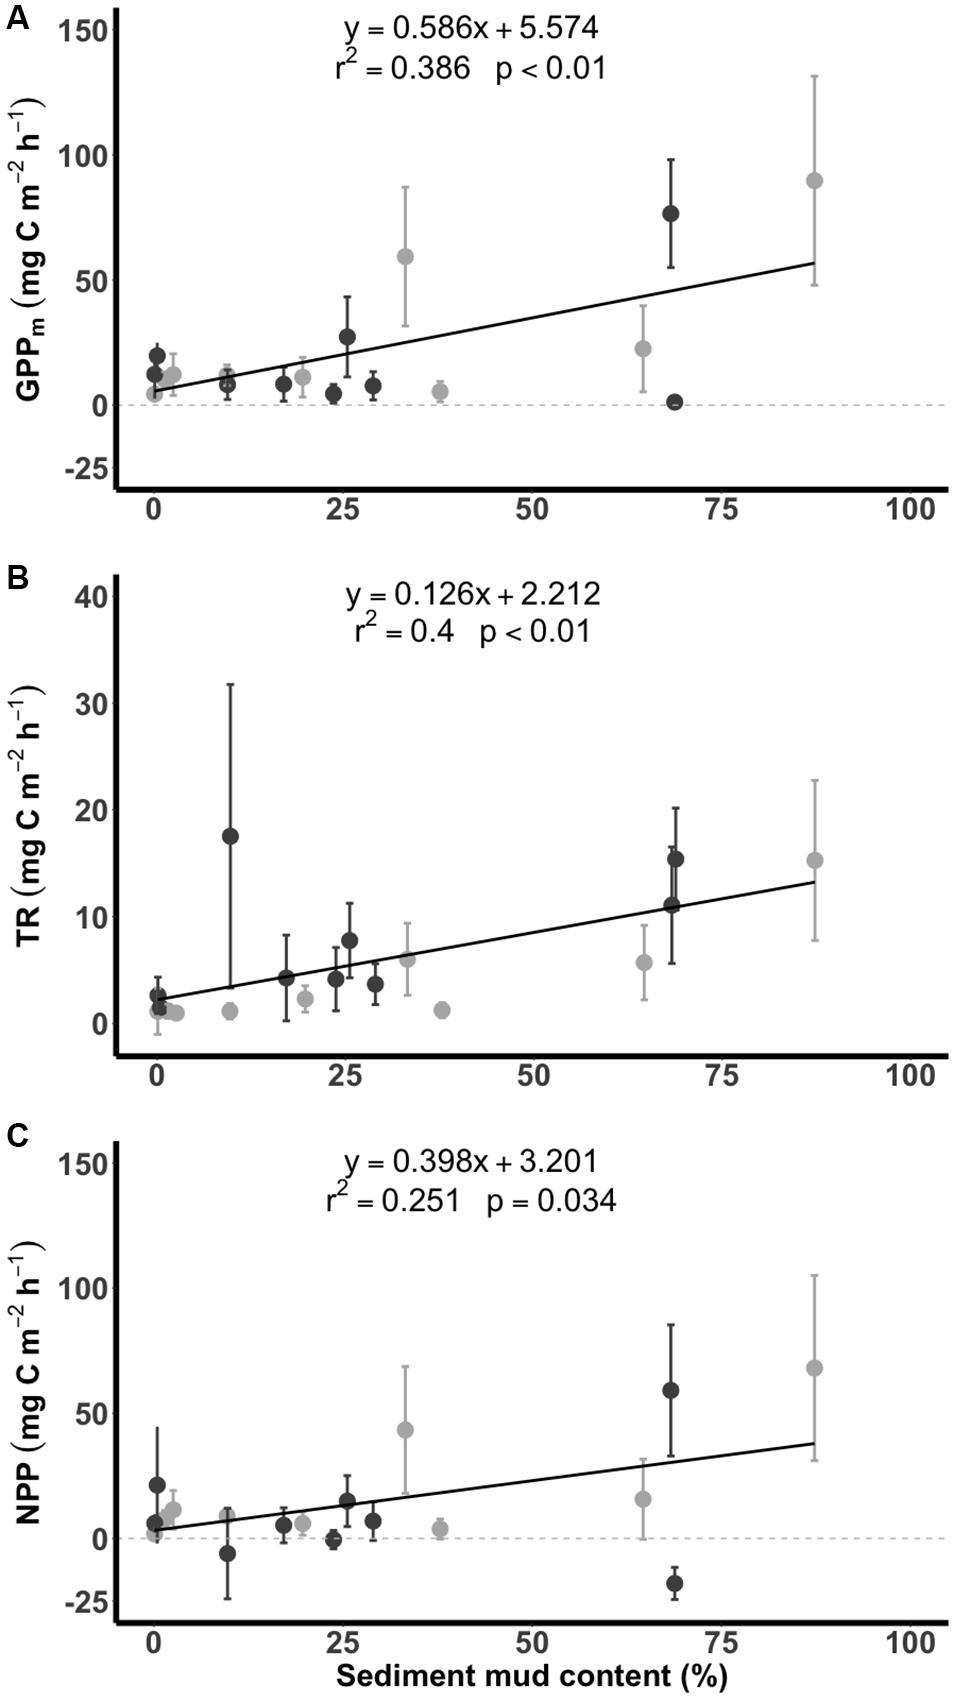
Figure 5. Relationships between carbon flux (A: GPPm, maximum gross primary production; B: TR, total respiration; C: NPP, net primary production) and sediment mud content in the tidal flats. The dark gray points indicate measurements taken in summer, and the light gray points indicate measurements taken in winter. Data are presented as the mean ± SD.
SEM Models
Based on the resulting correlations (Table 3), the piecewise SEM fit the observed data well (Fisher’s C statistic = 8.95, p = 0.062) and revealed that the sediment mud content affected primary production and respiration in tidal flats both directly and indirectly (Figure 6A). The sediment mud content directly increased the organic matter content [0.436, 95% confidence interval (CI): 0.356–0.504, p < 0.001]. The sediment mud content also directly increased GPPm (0.233, 95% CI: 0.154–0.368, p < 0.001) but had an indirect, weak and negative effect on GPPm via benthic microalgal biomass (–0.180 × 0.117). The sediment mud content also showed a direct and positive effect on TR (0.273, 95% CI: 0.119–0.389, p < 0.001) and indirectly increased TR (0.436 × 0.175) via the organic matter content. Benthic microalgal biomass showed a direct and positive effect on TR. However, there was no direct or indirect effect on TR via benthic macrofaunal biomass.
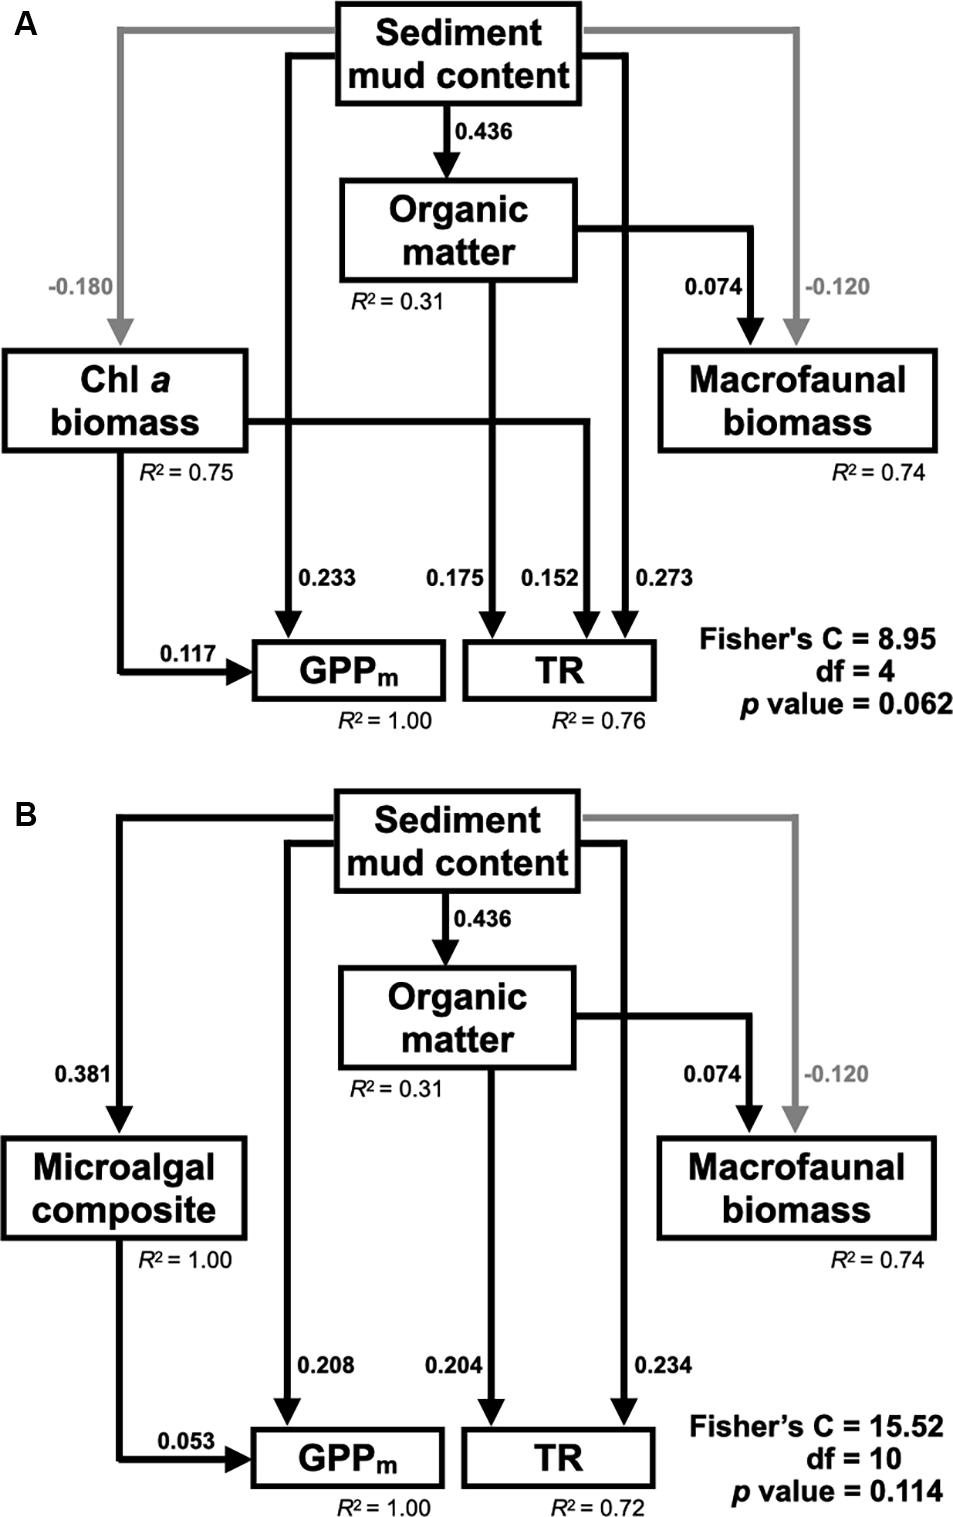
Figure 6. (A) Final piecewise structural equation model (SEM) (Fisher’s C statistic = 8.95, df = 4, P = 0.062) depicting the direct and indirect effects of sediment mud content on GPPm and TR through benthic microalgal biomass and macrofaunal biomass in tidal flats. (B) Final piecewise structural equation model (SEM) (Fisher’s C statistic = 15.52, df = 10, P = 0.114) depicting the direct and indirect effects of sediment mud content on GPPm and TR through benthic microalgal composition and macrofaunal biomass in the tidal flats. Only significant paths are depicted. Black lines represent positive paths, and gray lines represent negative paths. The standardized coefficients of significant paths and the conditional R2 values of the response variables are shown.
The alternative SEM replaced with microalgal composition (Figure 6B) also fit the observed data well (Fisher’s C = 15.52, p = 0.114). The pathways by which sediment mud content influenced TR remained unchanged. In addition to a direct effect on GPPm (0.208, 95% CI: 0.124–0.347, p < 0.001), the sediment mud content showed an indirect effect on GPPm (0.381 × 0.053) via a compositional shift in benthic microalgae.
Discussion
Despite the spatial variation in the sediment characteristics, the CO2 fluxes in the tidal flats during emersion in the tropical and subtropical regions increased with increasing sediment mud content. Our results showed clear positive linear gradients in GPPm, TR, and NPP from sandy to muddy sediments (Figure 5). The SEM further revealed the possible causal pathways by which sediment mud content directly increased GPPm or indirectly increased GPPm via a benthic microalgal compositional shift (Figure 6). The SEM also revealed that sediment mud content directly increased TR or indirectly increased TR via organic matter content (Figure 6). With the integrated SEM framework, our results showed mechanistic evidence of how sediment mud content acted as a critical factor regulating carbon fluxes in tidal flats.
Despite the critical role of sediment mud content in regulating carbon fluxes, prior studies showed inconsistent relationships between benthic chlorophyll a concentration and sediment mud content. Both Cahoon et al. (1999) and Cahoon and Safi (2002) reported negative relationships between the proportion of very fine sediments and benthic microalgal biomass in tidal flats in the US and on the North Island of New Zealand. However, both Lee et al. (2011) and Pratt et al. (2015) showed an opposite trend, i.e., that benthic microalgal biomass was positively correlated with sediment mud content. In this study, there was no significant correlation between the benthic chlorophyll a concentration and sediment mud content. In fact, the benthic chlorophyll a concentration was higher in the sandy sediments at the NG, BS, and WJ sites than at the other sites; in addition, the sediments of these three sites were categorized as medium, fine and coarse sand, respectively. The median grain size at these sampling sites ranged from 166.7 to 552.1 μm, and all the mud content values were lower than 30%. The SEM showed that in comparison to the muddy sediments, the sandy sediments supported more microalgal biomass in the tidal flats.
The greater microalgal biomass in the sandy sediments than in the muddy sediments can be attributed to the thicker photic zone in the sandy sediments. The photic zone in muddy sediments is shallow (<600 μm; Cartaxana et al., 2011, 2006), and benthic microalgae are required to move up and down with diurnal and tidal cycles to maintain photosynthesis. In comparison to algal cells at deeper depths, algal cells that must remain near the sediment surface might be more susceptible to resuspension by tides and waves and epifaunal grazing. However, the photic depth can extend to 3 mm in sandy sediments (Cartaxana et al., 2006, 2011). Since light can penetrate deeper into coarse sediments, benthic microalgae can be distributed more evenly throughout the thicker photic layer. The other possibility for this outcome is that the composition of benthic microalgae in the muddy sediments was different from that in the sandy sediments (Du et al., 2009). In muddy sediments, the benthic microalgal community is generally dominated by epipelic benthic diatoms that exhibit endogenous vertical migratory rhythms coupled with diurnal and tidal cycles (Consalvey et al., 2004; Haubois et al., 2005). They often aggregate as a dense and highly productive biofilm at the surface of sediment during low tide in the daytime (Cartaxana et al., 2011). In sandy sediments, the benthic microalgae community composition is generally dominated by epipsammic benthic diatoms that attach to sand particles across the deeper photic layer and do not exhibit migratory patterns (Consalvey et al., 2004). The algal cells near the sediment surface might also be more susceptible than algal cells at deeper depths to grazing by macrofauna. Other factors, such as interstitial space volume, grazing pressure, nutrient fluxes, and light penetration, may confound the relationship between benthic microalgal biomass and sediment granulometry; any combination of these factors might lead to lower or higher benthic microalgal biomass in tidal flats, which might mask the relationship with sediment mud content.
Hydrodynamics might also affect the response of benthic microalgal biomass to sandy sediments. Dalu et al. (2020) conducted a microcosm experiment and found that the benthic chlorophyll a concentration was the highest in sediments with coarser particle sizes ranging from 125 to 500 μm, which was comparable to our results. However, the sediment grain sizes at #2 HL and #9 OC both fell into this range, but the chlorophyll a concentration at these sites was low (Table 2). Compared with those at the #6 NG and #7 BS sites, significantly lower sediment sorting coefficients at #2 HL and #9 OC were also observed. The sediment sorting coefficient was used to assess the distribution of the grain sizes in sediments. Well-sorted sediment indicates that the distribution of grain sizes is even; these sediments might be fully winnowed by waves and tidal currents. Contrary to muddy sediment, where benthic microalgae normally form dense biofilms embedded within a matrix comprised of carbon exudates (commonly known as EPS) that protect them from erosion, such high-energy forces can resuspend or remove not only small particles but also benthic microalgal cells inhabiting the sandy sediment.
Sediment mud content can also influence the density of macrofauna in tidal flats. Pratt et al. (2014) studied nine estuaries on the North Island of New Zealand and found that the densities of a suspension feeder (Austrovenus stutchburyi) and a deposit feeder (Macomona liliana) decreased significantly with increasing sediment mud content, although the gradient of the mud content ranged only between 0 and 30%. Other studies have indicated that the effects of sediment mud content on macrofaunal abundance were species-dependent (Thrush et al., 2003; Ellis et al., 2006; Anderson, 2008). For example, the relationships between the density of polychetes and sediment mud content can be classified into three types: an increasing curve (Scolecolepides benhami), a decreasing curve (Aonides oxycephala) and a Gaussian response curve (Heteromastus filiformis; Thrush et al., 2003). In this study, benthic macrofaunal biomass was high either in muddy sediments (FY and HML) or in sandy sediments (NG) and did not show a significant correlation with sediment mud content (Table 3). The macrofaunal community mainly contained bivalves, decapods, gastropods, amphipods, and polychetes, which might have masked the individual response of each taxon to the sediment mud content. However, the SEM showed that in total, in comparison to the muddy sediments, the sandy sediments supported more macrofaunal biomass in the tidal flats.
The primary production (GPPm and NPP) was higher in winter than in summer at most of the studied sites except at #8 WJ and #9 OC, while the total respiration (TR) in the tidal flats was higher in summer than in winter at most of the studied sites except at #5 GP. Temperature has been reported to be a major driver of the seasonal variation in the CO2 fluxes in subtropical tidal flats (Lee et al., 2011). Higher temperatures generally stimulate metabolic processes and photosynthesis rates. Lin et al. (2020) further indicated that the effects of temperature on the CO2 fluxes in tidal flats were non-linear, showing a quadratic relationship with an optimal temperature at which the CO2 fluxes were highest. In this study, the sediment temperatures in summer ranged from 31.2°C to 40.6°C, which far exceeded the optimal temperatures (28.7°C for GPPm, 26.6°C for NPP; Lin et al., 2020) for primary production. Higher temperatures might also result in photoinhibition in benthic microalgae (Laviale et al., 2015). These temperatures can explain the decreases in GPPm and NPP in summer. In contrast, the sediment temperature in winter ranged from 16.0°C to 27.6°C, which was within the range of optimal temperatures (45°C; Lin et al., 2020) for benthic respiration in tidal flats. This scenario might be the reason that the TR in the tidal flats still increased in summer at most of the study sites.
Hydrodynamics may affect the primary production and respiration in tidal flats during immersion in different ways. Wind- or tide-induced disturbances may increase water turbidity in tidal flats. Increased water turbidity can decrease light availability on the sediment and then reduce the photosynthesis of benthic microalgae (Migné et al., 2009). Drylie et al. (2018) measured GPP in three unvegetated sandflats in Kaipara Harbour, New Zealand and found that the submerged GPP was significantly lower than the emerged GPP due to light limitation. However, respiration was generally higher under immersed condition than under emerged condition due to the elevated activity of infauna during inundation (Migné et al., 2009). Lee et al. (2011) further demonstrated that turbid water increased respiration during immersion in subtropical tidal flats. It is clear that the CO2 fluxes in tidal flats located in the shallow waters along the coast of marginal seas are prone to disturbances caused by wind or tide.
In the SEM, the direct effect of the sediment mud content on GPPm was stronger than the indirect effect via benthic chlorophyll a content. This result suggests that in comparison to microalgal biomass, the sediment mud content had a more direct influence on GPPm. Compared to those in sandy sediments, the reduced interstitial volumes in muddy sediments might have allowed more water retention among grain particles (Watermann et al., 1999; Lee et al., 2011), which might have resulted in the accumulation of regenerated nutrients and organic matter that stimulated the growth of benthic microalgae in the sediments (Ehrenhauss et al., 2004). However, in the alternative SEM replaced with the composition of benthic microalgae, there was a weak and indirect effect of sediment mud content on GPPm via the composition shift of benthic microalgae. In this study, the chlorophyll c concentration as a proxy of diatom biomass in the tidal flats decreased with increasing sediment mud content (y = –0.188x + 12.478, r2 = 0.189, p < 0.001), whereas the chlorophyll b concentration as a proxy of green algal biomass remained unchanged. Sediment granulometry has been reported to shift the composition of the benthic microalgal community in tidal flats (Underwood and Barnett, 2006). Some epipelic diatoms with large and long valves occur in finer sediments, whereas small species of diatoms inhabit coarser sediments (Du et al., 2009). In western Taiwan, Shiu (2009) found that the density of benthic diatoms with larger biovolumes was negatively correlated with sediment grain size. Although the biomass of diatoms decreased in muddy sediments, the diatom community may have shifted to diatoms with large biovolumes. Since diatoms with large biovolumes generally have higher photosynthetic rates (Taguchi, 1976; Geider et al., 1986), the GPPm is expected to increase with increasing mud content in the sediments.
The SEM showed a significant indirect effect of sediment mud content on TR via organic matter content. However, the contribution of benthic microalgal and macrofaunal biomass to TR was relatively minor. This result is not surprising because in comparison to macrofauna and meiofauna, the bacterial community in tidal flats generally plays a more vital role in benthic respiration and contributes much more to the total respiration (Piepenburg et al., 1995; Hubas et al., 2006). Bacterial respiration can account for 67–88% of the annual benthic respiration in shallow waters (Piepenburg et al., 1995; Hubas et al., 2007). Moreover, the dynamics of bacterial communities are strongly regulated by granulometry (Hubas et al., 2006). Our results further suggest that the sediment mud content influenced the TR in the tidal flats not by increasing the biomasses of benthic microalgae and macrofauna but by influencing the metabolism of the bacterial community.
Conclusion
In the nine studied tidal flats in tropical and subtropical regions during emersion at noon, GPPm and NPP had higher values in winter than in summer due to the sediment temperature in summer deviating from the optimal temperature. In contrast, TR had higher values in summer than in winter because the sediment temperature in summer was still within the optimal temperature range. All the values of GPPm, TR, and NPP increased significantly with increasing sediment mud content. The SEM further showed mechanistic evidence of how sediment mud content can be a critical factor regulating carbon fluxes in tidal flats. The sediment mud content directly increased GPPm or indirectly increased GPPm via a compositional shift in benthic microalgae. The sediment mud content also directly increased TR or indirectly increased TR via increased organic matter content. Considering the large proportion of unvegetated tidal flats in coastal zones, any anthropogenic activity or natural forcing that eventually leads to a change in sediment mud content will likely substantially change the carbon sequestration capacity in those coastal ecosystems.
Data Availability Statement
The original contributions presented in the study are included in the article/Supplementary Material, further inquiries can be directed to the corresponding author/s.
Author Contributions
W-JL and H-JL conceived the ideas and designed the study. W-JL carried out the field work and sampling quantification. W-JL, C-WL, M-CC, and H-JL contributed to the data analysis and interpretation. W-JL and H-JL drafted the manuscript. All authors read and approved the final manuscript.
Funding
This work was funded by (1) Kinmen National Park Headquarters, Ministry of Interior, Taiwan and (2) the “Innovation and Development Center of Sustainable Agriculture” project administered by the “Featured Areas Research Center program” within the framework of Taiwanese Ministry of Education’s “Higher Education Sprout Project.”
Conflict of Interest
The authors declare that the research was conducted in the absence of any commercial or financial relationships that could be construed as a potential conflict of interest.
Supplementary Material
The Supplementary Material for this article can be found online at: https://www.frontiersin.org/articles/10.3389/fmars.2021.670180/full#supplementary-material
Supplementary Figure 1 | Photosynthesis-irradiance (P-I) curves during emersion in summer and winter in the tidal flats. Different symbols represent different samplings in each season at each site. P-I curves with determination coefficients larger than 0.80 are shown. No P-I curve at FY in summer is shown because the GPP values under different light irradiances were zero.
Supplementary Table 1 | Density of each group of macrofauna in the tidal flats. Data are presented as the range and mean ± SD. Zero represents no occurrence of each taxon in the tidal flats. Only samplings with macrofauna were averaged.
Supplementary Table 2 | CO2 fluxes (in mg C m–2 h–1) measured in the tidal flats. Data are presented as the range, mean ± SD and 95% confidence interval.
Footnotes
References
Anderson, M. J. (2008). Animal-sediment relationships re-visited: characterising species’ distributions along an environmental gradient using canonical analysis and quantile regression splines. J. Exp. Mar. Bio. Ecol. 366, 16–27. doi: 10.1016/j.jembe.2008.07.006
Bale, A. J., and Kenny, A. J. (2005). “Sediment analysis and seabed characterisation,” in Methods for the Study of Marine Benthos, eds A. Eleftheriou and A. McIntyre (Hoboken, NJ: Blackwell Science Ltd), 43–86. doi: 10.1002/9780470995129.ch2
Bendschneider, K., and Robinson, R. J. (1952). A new spectrophotometric method for the determination of nitrite in sea water. J. Mar. Res. 11, 87–96.
Billerbeck, M., Røy, H., Bosselmann, K., and Huettel, M. (2007). Benthic photosynthesis in submerged Wadden Sea intertidal flats. Estuar. Coast. Shelf Sci. 71, 704–716. doi: 10.1016/j.ecss.2006.09.019
Brotas, V., and Catarino, F. (1995). Microphytobenthos primary production of Tagus estuary intertidal flats (Portugal). Netherlands J. Aquat. Ecol. 29, 333–339. doi: 10.1007/BF02084232
Cadée, G. C., and Hegeman, J. (1974). Primary production of the benthic microflora living on tidal flats in the dutch wadden sea. Netherlands J. Sea Res. 8, 260–291. doi: 10.1016/0077-7579(74)90020-9
Cahoon, L. (1999). The role of benthic microalgae in neritic ecosystems. Oceanogr. Mar. Biol. an Annu. Rev. 37, 47–86.
Cahoon, L. B., Nearhoof, J. E., and Tilton, C. L. (1999). Sediment grain size effect on benthic microalgal biomass in shallow aquatic ecosystems. Estuaries 22, 735–741. doi: 10.2307/1353106
Cahoon, L. B., and Safi, K. A. (2002). Distribution and biomass of benthic microalgae in Manukau Harbour, New Zealand. New Zeal. J. Mar. Freshw. Res. 36, 257–266. doi: 10.1080/00288330.2002.9517084
Cartaxana, P., Mendes, C. R., Van Leeuwe, M. A., and Brotas, V. (2006). Comparative study on microphytobenthic pigments of muddy and sandy intertidal sediments of the Tagus estuary. Estuar. Coast. Shelf Sci. 66, 225–230. doi: 10.1016/j.ecss.2005.08.011
Cartaxana, P., Ruivo, M., Hubas, C., Davidson, I., Serôdio, J., and Jesus, B. (2011). Physiological versus behavioral photoprotection in intertidal epipelic and epipsammic benthic diatom communities. J. Exp. Mar. Bio. Ecol. 405, 120–127. doi: 10.1016/j.jembe.2011.05.027
Chen, J., Wang, D., Li, Y., Yu, Z., Chen, S., Hou, X., et al. (2020). The carbon stock and sequestration rate in tidal flats from coastal China. Glob. Biogeochem. Cycles 34:e2020GB006772. doi: 10.1029/2020GB006772
Chen, Y., Dong, J., Xiao, X., Zhang, M., Tian, B., Zhou, Y., et al. (2016). Land claim and loss of tidal flats in the Yangtze Estuary. Sci. Rep. 6:24018. doi: 10.1038/srep24018
Colijn, F., and de Jonge, V. (1984). Primary production of microphytobenthos in the Ems-Dollard Estuary. Mar. Ecol. Prog. Ser. 14, 185–196. doi: 10.3354/meps014185
Consalvey, M., Paterson, D. M., and Underwood, G. J. C. (2004). The ups and downs of life in a benthic biofilm: migration of benthic diatoms. Diatom Res. 19, 181–202. doi: 10.1080/0269249X.2004.9705870
Dalu, T., Cuthbert, R. N., Chavalala, T. L., Froneman, P. W., and Wasserman, R. J. (2020). Assessing sediment particle-size effects on benthic algal colonisation and total carbohydrate production. Sci. Total Environ. 710:136348. doi: 10.1016/j.scitotenv.2019.136348
Davidson, N. C., and Finlayson, C. M. (2019). Updating global coastal wetland areas presented in Davidson and Finlayson (2018). Mar. Freshw. Res. 70, 1195–1200. doi: 10.1071/MF19010
Davis, M., and Mclntire, C. (1983). Effects of physical gradients on the production dynamics of sediment-associated algae. Mar. Ecol. Prog. Ser. 13, 103–114. doi: 10.3354/meps013103
Davoult, D., Migné, A., Créach, A., Gévaert, F., Hubas, C., Spilmont, N., et al. (2009). Spatio-temporal variability of intertidal benthic primary production and respiration in the western part of the Mont Saint-Michel Bay (Western English Channel, France). Hydrobiologia 620, 163–172. doi: 10.1007/s10750-008-9626-3
De Jonge, V. N., and Van Beuselom, J. E. E. (1992). Contribution of resuspended microphytobenthos to total phytoplankton in the EMS estuary and its possible role for grazers. Netherlands J. Sea Res. 30, 91–105. doi: 10.1016/0077-7579(92)90049-K
Drylie, T. P., Lohrer, A. M., Needham, H. R., Bulmer, R. H., and Pilditch, C. A. (2018). Benthic primary production in emerged intertidal habitats provides resilience to high water column turbidity. J. Sea Res. 142, 101–112. doi: 10.1016/j.seares.2018.09.015
Du, G. Y., Son, M., Yun, M., An, S., and Chung, I. K. (2009). Microphytobenthic biomass and species composition in intertidal flats of the Nakdong River estuary, Korea. Estuar. Coast. Shelf Sci. 82, 663–672. doi: 10.1016/j.ecss.2009.03.004
Ehrenhauss, S., Witte, U., Janssen, F., and Huettel, M. (2004). Decomposition of diatoms and nutrient dynamics in permeable North Sea sediments. Cont. Shelf Res. 24, 721–737. doi: 10.1016/j.csr.2004.01.002
Eisenhauer, N., Bowker, M. A., Grace, J. B., and Powell, J. R. (2015). From patterns to causal understanding: structural equation modeling (SEM) in soil ecology. Pedobiologia 58, 65–72. doi: 10.1016/j.pedobi.2015.03.002
Ellis, J., Ysebaert, T., Hume, T., Norkko, A., Bult, T., Herman, P., et al. (2006). Predicting macrofaunal species distributions in estuarine gradients using logistic regression and classification systems. Mar. Ecol. Prog. Ser. 316, 69–83. doi: 10.3354/meps316069
Geider, R., Piatt, T., and Raven, J. (1986). Size dependence of growth and photosynthesis in diatoms: a synthesis. Mar. Ecol. Prog. Ser. 30, 93–104. doi: 10.3354/meps030093
Golterman, H. L. (ed.) (1975). “Algae and their pigments,” in Physiological Limnology: An Approach to the Physiology of Lake Ecosystems, (Amsterdam: Elsevier Scientific Publishing Company), 233–247.
Grace, J. B., and Bollen, K. A. (2008). Representing general theoretical concepts in structural equation models: the role of composite variables. Environ. Ecol. Stat. 15, 191–213. doi: 10.1007/s10651-007-0047-7
Guarini, J.-M., Chauvaud, L., and Coston-Guarini, J. (2008). Can the intertidal benthic microalgal primary production account for the “Missing Carbon Sink”? J. Oceanogr. Res. Data 1, 13–19. doi: 10.3354/meps071013
Haro, S., Lara, M., Laiz, I., González, C. J., Bohórquez, J., Garcia-Robledo, E., et al. (2020). Microbenthic net metabolism along intertidal gradients (Cadiz Bay, SW Spain): spatio-temporal patterns and environmental factors. Front. Mar. Sci. 7:39. doi: 10.3389/fmars.2020.00039
Haubois, A. G., Sylvestre, F., Guarini, J. M., Richard, P., and Blanchard, G. F. (2005). Spatio-temporal structure of the epipelic diatom assemblage from an intertidal mudflat in Marennes-Oléron Bay, France. Estuar. Coast. Shelf Sci. 64, 385–394. doi: 10.1016/j.ecss.2005.03.004
Hsieh, H. L., and Chang, K. H. (1991). Habitat characteristics and occurrence of the spionid Pseudopolydora sp on the tube-caps of the onuphid Diopatra bilobata (Polychaeta: Spionidae Onuphidae). Bull. Inst. Zool. Acad. Sin. 30, 331–339.
Hubas, C., and Davoult, D. (2006). Does seasonal proliferation of Enteromorpha sp. affect the annual benthic metabolism of a small macrotidal estuary? (Roscoff Aber Bay, France). Estuar. Coast. Shelf Sci. 70, 287–296. doi: 10.1016/j.ecss.2006.06.019
Hubas, C., Davoult, D., Cariou, T., and Artigas, L. F. (2006). Factors controlling benthic metabolism during low tide along a granulometric gradient in an intertidal bay (Roscoff Aber Bay, France). Mar. Ecol. Prog. Ser. 316, 53–68. doi: 10.3354/meps316053
Hubas, C., Lamy, D., Artigas, L. F., and Davoult, D. (2007). Seasonal variability of intertidal bacterial metabolism and growth efficiency in an exposed sandy beach during low tide. Mar. Biol. 151, 41–52. doi: 10.1007/s00227-006-0446-6
Jassby, A. D., and Platt, T. (1976). Mathematical formulation of the relationship between photosynthesis and light for phytoplankton. Limnol. Oceanogr. 21, 540–547. doi: 10.4319/lo.1976.21.4.0540
Jeffrey, S. W., and Humphrey, G. F. (1975). New spectrophotometric equations for determining chlorophylls a, b, c1 and c2 in higher plants, algae and natural phytoplankton. Biochem. Physiol. Pflanz. 167, 191–194. doi: 10.1016/S0015-3796(17)30778-3
Jenkins, D., and Medsker, L. L. (1964). Brucine method for determination of nitrate in ocean, estuarine, and fresh waters. Anal. Chem. 36, 610–612. doi: 10.1021/ac60209a016
Junoy, J., Castellanos, C., Viéitez, J. M., De La Huz, M. R., and Lastra, M. (2005). The macroinfauna of the Galician sandy beaches (NW Spain) affected by the Prestige oil-spill. Mar. Pollut. Bull. 50, 526–536. doi: 10.1016/j.marpolbul.2004.11.044
Koh, C. H., and Khim, J. S. (2014). The Korean tidal flat of the Yellow Sea: physical setting, ecosystem and management. Ocean Coast. Manag. 102, 398–414. doi: 10.1016/j.ocecoaman.2014.07.008
Laviale, M., Barnett, A., Ezequiel, J., Lepetit, B., Frankenbach, S., Méléder, V., et al. (2015). Response of intertidal benthic microalgal biofilms to a coupled light-temperature stress: evidence for latitudinal adaptation along the Atlantic coast of Southern Europe. Environ. Microbiol. 17, 3662–3677. doi: 10.1111/1462-2920.12728
Lee, L.-H., Hsieh, L.-Y., and Lin, H.-J. (2011). In situ production and respiration of the benthic community during emersion on subtropical intertidal sandflats. Mar. Ecol. Prog. Ser. 441, 33–47. doi: 10.3354/meps09362
Lee, L.-H., and Lin, H.-J. (2013). Effects of an oil spill on benthic community production and respiration on subtropical intertidal sandflats. Mar. Pollut. Bull. 73, 291–299. doi: 10.1016/j.marpolbul.2013.05.006
Lefcheck, J. S. (2016). piecewiseSEM: piecewise structural equation modelling in r for ecology, evolution, and systematics. Methods Ecol. Evol. 7, 573–579. doi: 10.1111/2041-210X.12512
Lin, W.-J., Wu, J., and Lin, H.-J. (2020). Contribution of unvegetated tidal flats to coastal carbon flux. Glob. Chang. Biol. 26, 3443–3454. doi: 10.1111/gcb.15107
McIntyre, H. L., Geider, R. J., and Miller, D. C. (1996). Microphytobenthos: the ecological role of the “Secret Garden” of unvegetated, shallow-water marine habitats. I. Disribution, abundance and primary production. Estuaries 19, 185–201.
McMinn, A., Hirawake, T., Hamaoka, T., Hattori, H., and Fukuchi, M. (2005). Contribution of benthic microalgae to ice covered coastal ecosystems in northern Hokkaido, Japan. J. Mar. Biol. Assoc. U.K. 85, 283–289. doi: 10.1017/S0025315405011173h
Migné, A., Davoult, D., Spilmont, N., Menu, D., Boucher, G., Gattuso, J. P., et al. (2002). A closed-chamber CO2-flux method for estimating intertidal primary production and respiration under emersed conditions. Mar. Biol. 140, 865–869. doi: 10.1007/s00227-001-0741-1
Migné, A., Davoult, D., Spilmont, N., Ouisse, V., and Boucher, G. (2016). Spatial and temporal variability of CO2 fluxes at the sediment-air interface in a tidal flat of a temperate lagoon (Arcachon Bay, France). J. Sea Res. 109, 13–19. doi: 10.1016/j.seares.2016.01.003
Migné, A., Spilmont, N., Boucher, G., Denis, L., Hubas, C., Janquin, M. A., et al. (2009). Annual budget of benthic production in Mont Saint-Michel Bay considering cloudiness, microphytobenthos migration, and variability of respiration rates with tidal conditions. Cont. Shelf Res. 29, 2280–2285. doi: 10.1016/j.csr.2009.09.004
Migné, A., Spilmont, N., and Davoult, D. (2004). In situ measurements of benthic primary production during emersion: seasonal variations and annual production in the Bay of Somme (eastern English Channel, France). Cont. Shelf Res. 24, 1437–1449. doi: 10.1016/j.csr.2004.06.002
Murphy, J., and Riley, J. P. (1962). A modified single solution method for the determination of phosphate in natural waters. Anal. Chim. Acta 27, 31–36. doi: 10.1057/9781137461131
Murphy, M. (2020). semEff: Automatic Calculation of Effects for Piecewise Structural Equation Models Version 0.5.0.
Murray, N. J., Phinn, S. R., Clemens, R. S., Roelfsema, C. M., and Fuller, R. A. (2012). Continental scale mapping of tidal flats across east Asia using the landsat archive. Remote Sens. 4, 3417–3426. doi: 10.3390/rs4113417
Murray, N. J., Phinn, S. R., DeWitt, M., Ferrari, R., Johnston, R., Lyons, M. B., et al. (2019). The global distribution and trajectory of tidal flats. Nature 565, 222–225. doi: 10.1038/s41586-018-0805-8
Otani, S., and Endo, T. (2019). “Blue carbon in shallow coastal ecosystems,” in Blue Carbon in Shallow Coastal Ecosystems, eds T. Kuwae and M. Hori (Singapore: Springer), 223–250.
Pai, S.-C., Tsau, Y.-J., and Yang, T.-I. (2001). pH and buffering capacity problems involved in the determination of ammonia in saline water using the indophenol blue spectrophotometric method. Anal. Chim. Acta 434, 209–216. doi: 10.1016/S0003-2670(01)00851-0
Piepenburg, D., Blackburn, T. H., vonDorrien, C. F., Gutt, J., Hall, P. O., Hulth, S., et al. (1995). Partitioning of benthic community respiration in the Arctic (northwestern Barents Sea). Mar. Ecol. Prog. Ser. 118, 199–214. doi: 10.3354/meps118199
Pratt, D. R., Lohrer, A. M., Pilditch, C. A., and Thrush, S. F. (2014). Changes in ecosystem function across sedimentary gradients in estuaries. Ecosystems 17, 182–194. doi: 10.1007/s10021-013-9716-6
Pratt, D. R., Pilditch, C. A., Lohrer, A. M., Thrush, S. F., and Kraan, C. (2015). Spatial distributions of grazing activity and microphytobenthos reveal scale-dependent relationships across a sedimentary gradient. Estuaries Coasts 38, 722–734. doi: 10.1007/s12237-014-9857-7
R Core Team (2021). R: A Language and Environment for Statistical Computing. Vienna: R Foundation for Statistical Computing.
Rahman, M. A., and Ishiga, H. (2012). Trace metal concentrations in tidal flat coastal sediments, Yamaguchi Prefecture, southwest Japan. Environ. Monit. Assess. 184, 5755–5771. doi: 10.1007/s10661-011-2379-x
Sarker, J., Yamamoto, T., and Hashimoto, T. (2009). Contribution of benthic microalgae to the whole water algal biomass and primary production in Suo Nada, the Seto Inland Sea, Japan. J. Oceanogr. 65, 311–323. doi: 10.1007/s10872-009-0029-5
Savelli, R., Bertin, X., Orvain, F., Gernez, P., Dale, A., Coulombier, T., et al. (2019). Impact of chronic and massive resuspension mechanisms on the microphytobenthos dynamics in a temperate intertidal mudflat. J. Geophys. Res. Biogeosciences 124, 3752–3777. doi: 10.1029/2019JG005369
Shiu, J.-W. (2009). Spatio-Temporal Changes in Biomass and Abundance of Benthic Diatoms in the Kaomei Wetland. Taichung: National Chung Hsing University.
Spilmont, N., Davoult, D., and Migné, A. (2006). Benthic primary production during emersion: in situ measurements and potential primary production in the Seine Estuary (English Channel, France). Mar. Pollut. Bull. 53, 49–55. doi: 10.1016/j.marpolbul.2005.09.016
Spilmont, N., Migné, A., Seuront, L., and Davoult, D. (2007). Short-term variability of intertidal benthic community production during emersion and the implication in annual budget calculation. Mar. Ecol. Prog. Ser. 333, 95–101. doi: 10.3354/meps333095
Taguchi, S. (1976). Relationship between photosynthesis and cell size of marine diatoms. J. Phycol. 12, 185–189. doi: 10.1111/j.1529-8817.1976.tb00499.x
Thrush, S. F., Hewitt, J. E., Norkko, A., Nicholls, P. E., Funnell, G. A., and Ellis, J. I. (2003). Habitat change in estuaries: predicting broad-scale responses of intertidal macrofauna to sediment mud content. Mar. Ecol. Prog. Ser. 263, 101–112. doi: 10.3354/meps263101
Tweedie, M. C. K. (1984). “An index which distinguishes between some important exponential families,” in Statistics: Applications and New Directions. Proceedings of the Indian Statistical Institute Golden Jubilee International Conference, eds J. K. Ghosh and J. Roy (Calcutta: Indian Statistical Institute), 579–604.
Underwood, G. J. C., and Barnett, M. (2006). “What determines species composition in microphytobenthic biofilms?,” in Functioning of Microphytobenthos In Estuaries, eds J. Kromkamp, J. F. C. de Brouwer, G. F. Blanchard, R. M. Forster, and V. Créach (Amsterdam: Royal Netherlands Academy of Arts and Sciences), 121–138.
Underwood, G. J. G., and Kromkamp, J. (1999). Primary production by phytoplankton and microphytobenthos in estuaries. Adv. Ecol. Res. 29, 93–153. doi: 10.1016/s0065-2504(08)60192-0
Watermann, F., Hillebrand, H., Gerdes, G., Krumbein, W. E., and Sommet, U. (1999). Competition between benthic cyanobacteria and diatoms as influenced by different grain sizes and temperatures. Mar. Ecol. Prog. Ser. 187, 77–87. doi: 10.3354/meps187077
Yoshino, K., Tsugeki, N. K., Amano, Y., Hayami, Y., Hamaoka, H., and Omori, K. (2012). Intertidal bare mudflats subsidize subtidal production through outwelling of benthic microalgae. Estuar. Coast. Shelf Sci. 109, 138–143. doi: 10.1016/j.ecss.2012.05.021
Yu, O. H., Lee, H. G., Shim, W. J., Kim, M., and Park, H. S. (2013). Initial impacts of the Hebei Spirit oil spill on the sandy beach macrobenthic community west coast of Korea. Mar. Pollut. Bull. 70, 189–196. doi: 10.1016/j.marpolbul.2013.02.035
Keywords: benthic metabolism, gross primary production, net primary production, respiration, microphytobenthos, structural equation model
Citation: Lin W-J, Chiu M-C, Lin C-W and Lin H-J (2021) Effects of Sediment Characteristics on Carbon Dioxide Fluxes Based on Interacting Factors in Unvegetated Tidal Flats. Front. Mar. Sci. 8:670180. doi: 10.3389/fmars.2021.670180
Received: 20 February 2021; Accepted: 19 April 2021;
Published: 17 May 2021.
Edited by:
Wen-Chen Chou, National Taiwan Ocean University, TaiwanReviewed by:
Dominique Davoult, Sorbonne Université, FranceWei-Jen Huang, National Sun Yat-sen University, Taiwan
Copyright © 2021 Lin, Chiu, Lin and Lin. This is an open-access article distributed under the terms of the Creative Commons Attribution License (CC BY). The use, distribution or reproduction in other forums is permitted, provided the original author(s) and the copyright owner(s) are credited and that the original publication in this journal is cited, in accordance with accepted academic practice. No use, distribution or reproduction is permitted which does not comply with these terms.
*Correspondence: Hsing-Juh Lin, aGpsaW5AZHJhZ29uLm5jaHUuZWR1LnR3