 Sarah Magozzi1,2*
 Simon R. Thorrold3
 Leah Houghton3
 Victoria A. Bendall4Stuart Hetherington4
 Gonzalo Mucientes5,6
 Lisa J. Natanson7
 Nuno Queiroz5Miguel N. Santos8,9
 Clive N. Trueman1
- 1School of Ocean and Earth Science, University of Southampton, Southampton, United Kingdom
- 2Department of Integrative Marine Ecology, Stazione Zoologica Anton Dohrn, Fano Marine Centre, Fano, Italy
- 3Department of Biology, Woods Hole Oceanographic Institution, Woods Hole, MA, United States
- 4Cefas Laboratory, Lowestoft, United Kingdom
- 5Centro de Investigação em Biodiversidade e Recursos Genéticos, Rede de Investigação em Biodiversidade e Biologia Evolutiva, Universidade do Porto, Porto, Portugal
- 6Instituto de Investigacións Mariñas, Consejo Superior de Investigaciones Científicas (IIM-CSIC), Vigo, Spain
- 7Northeast Fisheries Science Center, National Oceanic and Atmospheric Administration, Narragansett, RI, United States
- 8Instituto Português do Mar e da Atmosfera, Olhão, Portugal
- 9Secretariat of the International Commission for Conservation of Atlantic Tunas, Madrid, Spain
Variations in stable carbon and nitrogen isotope compositions in incremental tissues of pelagic sharks can be used to infer aspects of their spatial and trophic ecology across life-histories. Interpretations from bulk tissue isotopic compositions are complicated, however, because multiple processes influence these values, including variations in primary producer isotope ratios and consumer diets and physiological processing of metabolites. Here we challenge inferences about shark tropho-spatial ecology drawn from bulk tissue isotope data using data for amino acids. Stable isotope compositions of individual amino acids can partition the isotopic variance in bulk tissue into components associated with primary production on the one hand, and diet and physiology on the other. The carbon framework of essential amino acids (EAAs) can be synthesised de novo only by plants, fungi and bacteria and must be acquired by consumers through the diet. Consequently, the carbon isotopic composition of EAAs in consumers reflects that of primary producers in the location of feeding, whereas that of non-essential amino acids (non-EAAs) is additionally influenced by trophic fractionation and isotope dynamics of metabolic processing. We determined isotope chronologies from vertebrae of individual blue sharks and porbeagles from the North Atlantic. We measured carbon and nitrogen isotope compositions in bulk collagen and carbon isotope compositions of amino acids. Despite variability among individuals, common ontogenetic patterns in bulk isotope compositions were seen in both species. However, while life-history movement inferences from bulk analyses for blue sharks were supported by carbon isotope data from essential amino acids, inferences for porbeagles were not, implying that the observed trends in bulk protein isotope compositions in porbeagles have a trophic or physiological explanation, or are suprious effects. We explored variations in carbon isotope compositions of non-essential amino acids, searching for systematic variations that might imply ontogenetic changes in physiological processing, but patterns were highly variable and did not explain variance in bulk protein δ13C values. Isotopic effects associated with metabolite processing may overwhelm spatial influences that are weak or inconsistently developed in bulk tissue isotope values, but interpreting mechanisms underpinning isotopic variation in patterns in non-essential amino acids remains challenging.
Introduction
Pelagic shark populations have declined regionally by >90% in the past 20 years, largely as a result of overfishing and bycatch (Worm et al., 2013), while the global abundance of oceanic sharks has declined by 70% since 1970 (Pacoureau et al., 2021). The vulnerability of sharks to marine-capture fisheries depends on individual movements and the presence of movement traits across individuals, populations, or species that may suggest a shared vulnerability (Queiroz et al., 2016, 2019; Vandeperre et al., 2016; Coelho et al., 2020). Effective management of the remaining shark populations requires a thorough understanding of their spatial ecology (Costa et al., 2012; Briscoe et al., 2016). Movements of pelagic sharks are, however, difficult to monitor or reconstruct, particularly throughout ontogeny (Graham et al., 2010; Trueman et al., 2012; McMahon et al., 2013). While physical tags have revolutionized our understanding of space use by pelagic fishes, they rarely report over the life-time of a tagged individual, and juvenile animals may be too small to support satellite-linked pop-up tags. Consequently, knowledge of juvenile movements, and connections between juvenile and adult habitats, remain poorly understood for many pelagic shark species.
Stable isotope analysis (SIA) of animal tissues has become a routine tool used in ocean ecology to reconstruct animal movements (e.g., Best and Schell, 1996; Cherel et al., 2009; Carlisle et al., 2015; Bird et al., 2018) and changes in diet and trophic level (e.g., MacNeill et al., 2005; Estrada et al., 2006; Newsome et al., 2009; Pethybridge et al., 2018; Lorrain et al., 2020) (for reviews see Post, 2002; Graham et al., 2010; Boecklen et al., 2011; McMahon et al., 2013; Trueman and St John Glew, 2019). Because the isotopic composition of primary producers varies across space and time (McMahon et al., 2013; Schmittner and Somes, 2016; Magozzi et al., 2017), animal movements can, in theory, be reconstructed retrospectively by relating variation in tissue isotopic composition to variability in isotopic baselines (McMahon et al., 2013; Trueman and St John Glew, 2019). Sequential analysis of tissues that retain a chronological record in the form of periodically deposited increments or growth bands, including shark vertebrae, may further provide movement (and trophic) information throughout life of individuals (Hobson, 1999; Newsome et al., 2010; Trueman et al., 2012; e.g., Estrada et al., 2006; Carlisle et al., 2015).
The underlying premise of the isotope tracer method is that the isotopic composition of animal tissue reflects that of primary producers at the base of the foodweb, overlain by a relatively predictable trophic offset (DeNiro and Epstein, 1978, 1981). However, this premise is a simplification of a complex suite of interacting ecological and biochemical factors. Variance in isotopic compositions from bulk tissue analyses can reflect mixed effects from variation in isotopic compositions of primary producers (baseline effects; Schmittner and Somes, 2016; Magozzi et al., 2017), changes in diet and trophic level (trophic effects), and variation in metabolic routing of dietary macronutrients to tissue synthesis (physiological effects; Trueman et al., 2005; Newsome et al., 2014; Wang et al., 2019). Interactions among these isotope effects significantly complicate the interpretation of bulk tissue isotope data alone to infer movements, diet or trophic level changes (e.g., Newsome et al., 2010; Trueman et al., 2012; e.g., Popp et al., 2007). SIA of specific structural compounds within tissues, such as individual amino acids, has been increasingly employed in animal movement (McMahon et al., 2011a,b; Seminoff et al., 2012) and trophic (Chikaraishi et al., 2009, 2014; Lorrain et al., 2009) studies to reduce uncertainty in estimates of change in location, diet and trophic level and nutrient source (e.g., Larsen et al., 2013; McCarthy et al., 2013; McMahon et al., 2015a).
A number of amino acids critical for life functions can only be synthesized de novo by some plants, fungi and bacteria. These essential amino acids are subsequently transferred unaltered through foodwebs (Hare et al., 1991; Reeds, 2000; Jim et al., 2006; McMahon et al., 2010). Consequently, the carbon isotope composition of essential amino acids (δ13CEAA) in consumer tissues retains the isotopic composition fixed during biosynthesis by primary producers (Jim et al., 2006; Popp et al., 2007; McMahon et al., 2010; Wang et al., 2019). Differences in δ13CEAA values among consumers reflect variations in the isotopic compositions of primary production at the time and place of biosynthesis and can therefore be used to infer movement across spatio-temporal isotope gradients (Schmittner and Somes, 2016; Magozzi et al., 2017) and/or variations in the relative contribution of foodwebs fueled by different carbon sources (e.g., Larsen et al., 2009, 2013). Non-essential amino acids can either be routed directly from dietary sources to tissue or synthesized de novo by using metabolites derived from ingested nutrients (McMahon et al., 2010, 2015b; Newsome et al., 2011; Berg et al., 2015). Carbon isotopes are fractionated during biomolecule degradation and synthesis (Hayes, 2001; Howland et al., 2003; Jim et al., 2006), therefore variability in δ13C values of non-essential amino acids (δ13Cnon–EAA) can reflect trophic and physiological effects superimposed on any baseline effects.
Non-essential amino acids can be synthesized from dietary intermediates, whether protein, lipids or carbohydrates (Berg et al., 2015). Marine pelagic predators draw energy and nutrients largely from protein and lipid sources with relatively little energy drawn from carbohydrates (Wang et al., 2019). Lipids are energy dense nutrient sources, and fish nutrition balances protein and lipid (energy) sources (Bowyer et al., 2013). Protein and energy requirements and availability vary in time and space, therefore the proportion of metabolites assimilated from protein compared to lipid precursor molecules is likely to vary considerably in time, space and among individuals depending on their nutritional status. Lipids are typically depleted in 13C relative to protein, therefore the degree to which a particular amino acid is synthesized from lipid compared to protein dietary precursors should be reflected in its 13C content (Wolf et al., 2015; Wang et al., 2018). Controlled-feeding experiments on salmon (Wang et al., 2019) and a study with mammals (Newsome et al., 2014; Wolf et al., 2015) have shown that the δ13C values of glycolytic amino acids are highly sensitive to the lipid content of diets and lipid utilization for amino acid synthesis whereas values of Krebs cycle amino acids are not (see also Leigh et al., 2018; Wang et al., 2018; Whiteman et al., 2018). These results imply that, where diets contain no carbohydrates, glycolytic amino acids (e.g., glycine, serine, and alanine) are synthesized from glycogen predominantly contributed from the metabolism of fatty acids, whereas amino acids whose synthesis is associated with the Krebs cycle (e.g., glutamic acid, aspartic acid, and proline) draw on carbon provided by processing of both protein and lipid sources (Choy et al., 2010; Fernandes et al., 2012; Newsome et al., 2014). Variability in δ13C values of glycolytic vs. Krebs cycle amino acids may therefore reflect changes in macronutrient contents of diets and/or shifts in the metabolic allocation of macronutrients for tissue synthesis. However, how carnivorous fish use dietary intermediates to synthesize amino acids is still poorly understood and may ultimately depend on their digestive physiology and nutritional requirements (e.g., Leigh et al., 2018; Whiteman et al., 2018).
The combination of essential and non-essential amino acids, the isotopic compositions of which are influenced differently by contrasting mechanisms, therefore offers an opportunity to differentiate among alternative variables contributing to variance in bulk tissue isotope values. The potential for identifying variations in animal nutrient physiology from variations in δ13Cnon–EAA values is particularly attractive but a coherent framework to interpret variability in δ13Cnon–EAA data remains elusive. In this study, we present stable carbon (δ13C) and nitrogen (δ15N) isotope chronologies of bulk cartilage collagen from sequential vertebral samples for individual blue sharks (Prionace glauca, Linnaeus 1758) and porbeagles (Lamna nasus, Bonnaterre 1788) caught across the North Atlantic. In parallel, we present comparable carbon isotope chronologies of individual essential and non-essential amino acids from the same sharks. We quantified variation in δ13C values of bulk collagen and individual amino acids at multiple levels (between species, among areas and individuals and within-individuals) and tested for common, broad ontogenetic isotope patterns across individual blue sharks and porbeagles. We contrasted patterns in δ13C values of bulk protein and essential amino acids to disentangle baseline from trophic effects on bulk tissue δ13C values and test whether observed ontogenetic trends can be best interpreted in terms of movement or diet and trophic level change. Given the small number of individuals examined (nine blue sharks and six porbeagles), we clearly did not aim here to draw inferences about the ecology for species or populations. We argue that, if ontogenetic patterns in bulk protein δ13C values are matched by variability in δ13C values of essential amino acids, then at least a component of variance in the bulk protein signal must be associated with movement (in time and/or space) across isotopically distinct baselines. By contrast, if trends in bulk protein δ13C values are solely associated with a shift in diet or trophic position, they should not be apparent in the δ13C values of essential amino acids (and should match trends in bulk δ15N values). We also investigated patterns in δ13C values of non-essential amino acids, particularly isotopic spacing between glycolytic and Krebs cycle amino acids, to explore whether systematic variations in nutrient physiology could be encoded in the bulk or amino acid isotope values.
Materials and Methods
Sample Description
Vertebral samples were collected from nine blue sharks and six porbeagles caught across the North Atlantic. Three blue sharks were captured in offshore waters south of Canary Islands (eastern blue sharks), three in the mid-Atlantic Ridge area northwest of the Azores (central blue sharks), and three in oceanic waters between Cape Hatteras and the Gulf of Maine (western blue sharks; Figure 1). Blue sharks were bycaught by pelagic longlines targeting swordfish, tunas and sharks, by research and commercial fishing vessels using pelagic longlines or during shark fishing tournaments using rods and reels. Two porbeagles were bycaught on the continental shelf in the Celtic Sea during commercial gillnet fishery targeting gadiform fish and retained under dispensation as part of a fishery bycatch study (eastern porbeagles; Ellis and Bendall, 2015; Ellis et al., 2015). One porbeagle was bycaught by a fisherman near the Faroe Islands and donated to research. Three porbeagles were caught between Massachusetts and Grand Banks (off southern Newfoundland) by commercial vessels using pelagic longlines (western porbeagles; Figure 1; for metadata see Table 1).
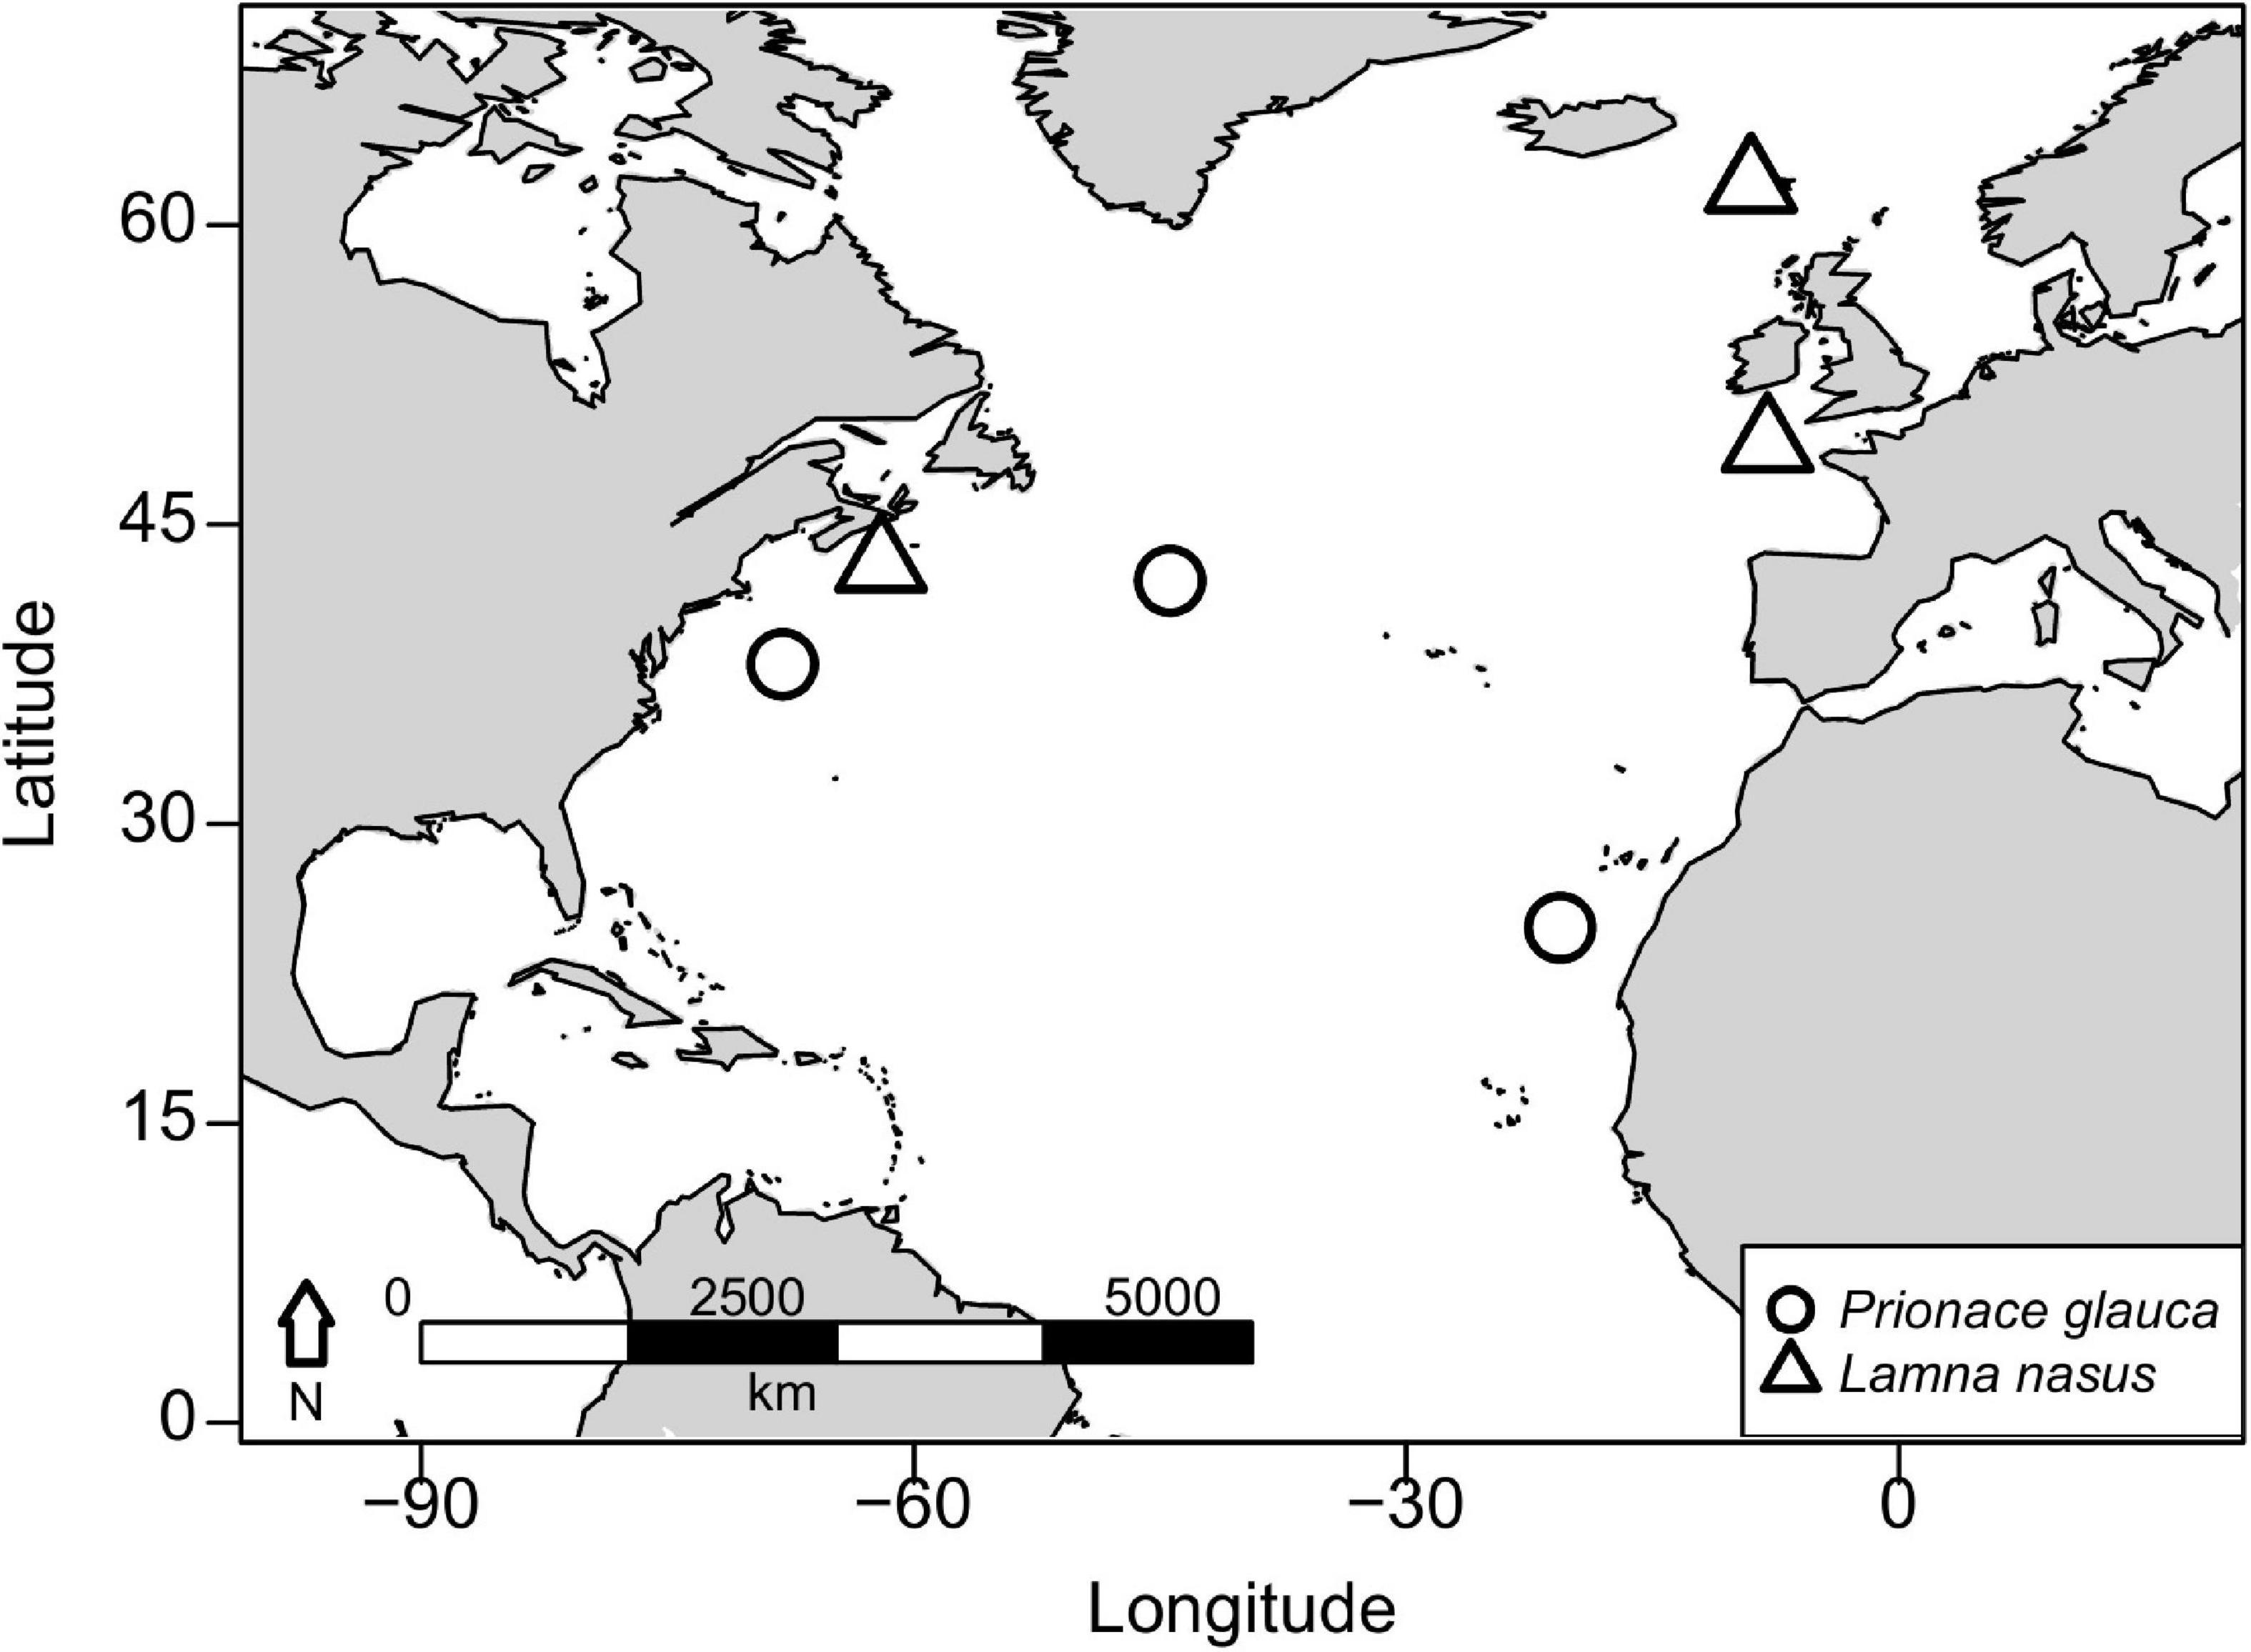
Figure 1. Capture areas for blue sharks (Prionace glauca) and porbeagles (Lamna nasus) in the North Atlantic.
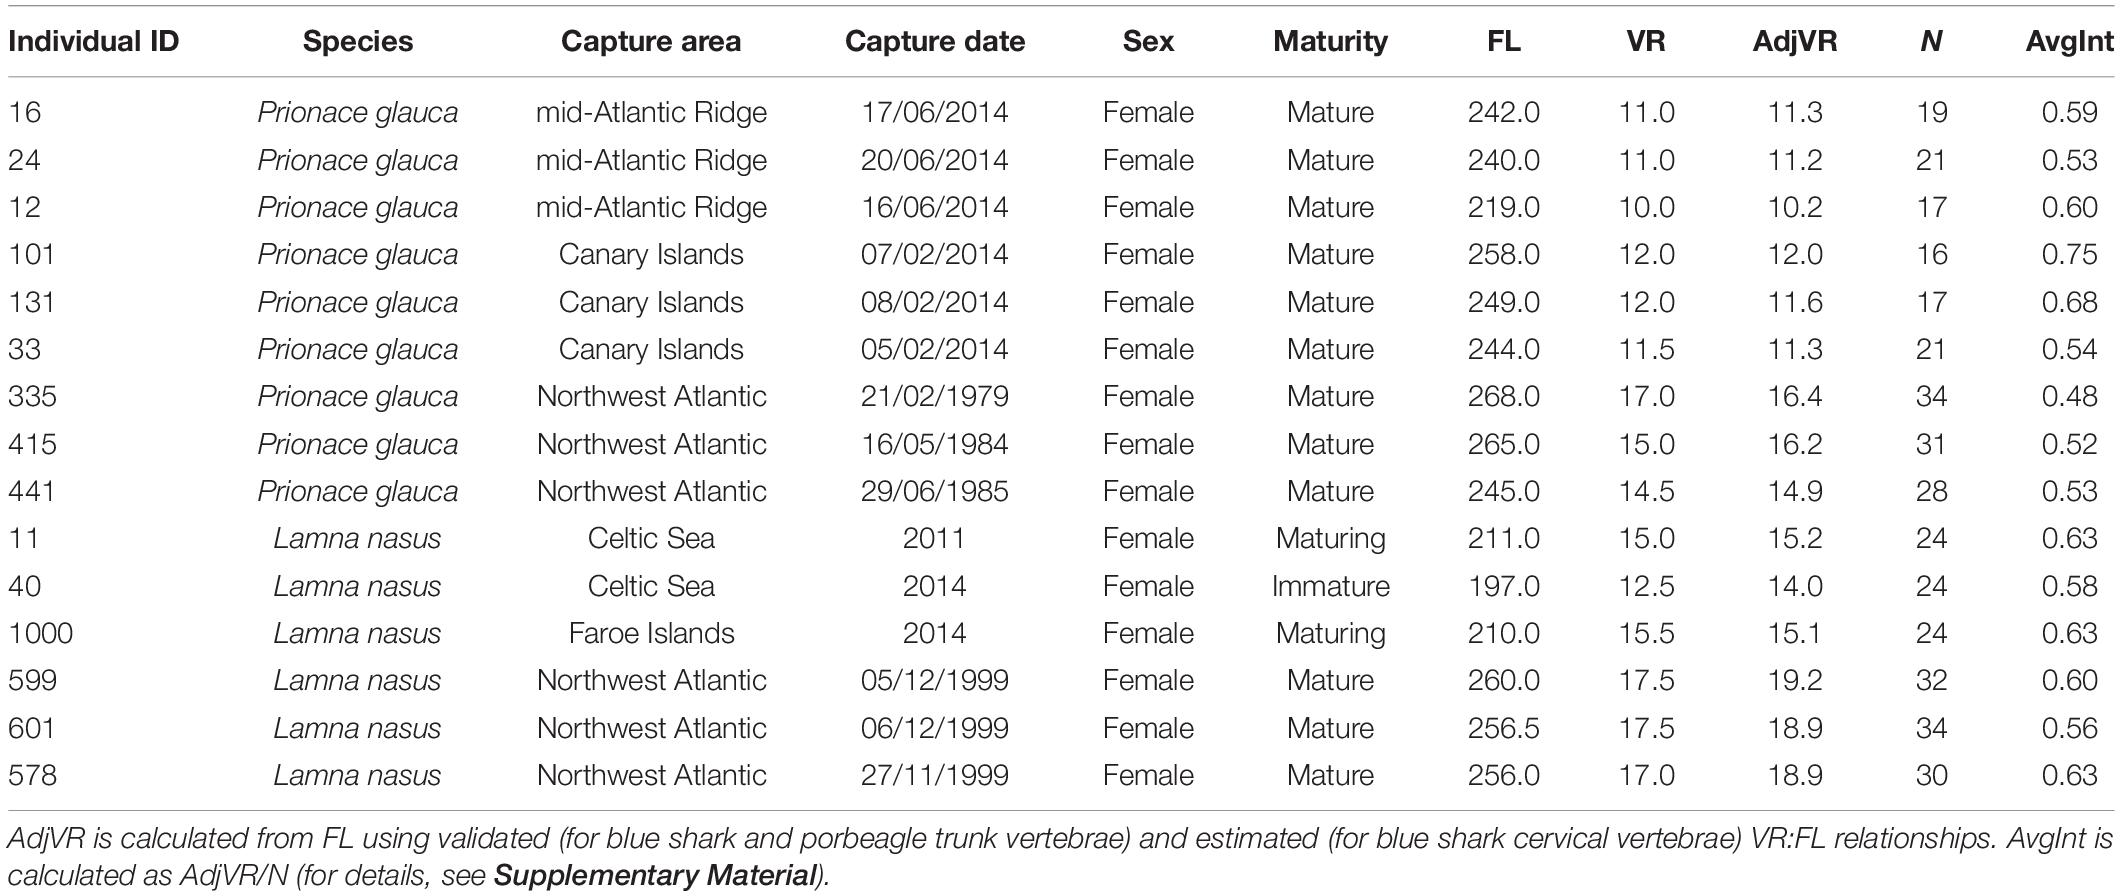
Table 1. Metadata for individual blue sharks (Prionace glauca) and porbeagles (Lamna nasus) analyzed for stable isotopes, including individual ID, species, capture area, capture date or year, sex, maturity stage, fork length (FL, cm), vertebral radius (measured: VR, mm; adjusted VR: AdjVR, mm), number of samples collected for each vertebra (N), and (achieved) average interval between adjacent samples (AvgInt, mm).
Sample Preparation for Bulk Tissue Analysis
Trunk vertebrae were excised from above the branchial chamber in porbeagles and western blue sharks, and vertebrae were removed posterior to the skull in central and eastern blue sharks. All vertebrae were immediately frozen after dissection. Vertebral centra were then defrosted, physically cleaned of excess muscle and connective tissue and air-dried for 3–10 days, depending on dimensions (Kim and Koch, 2012). A 6 mm section was cut from each centrum using a low-speed diamond-bladed Isomet® saw. This section was divided in two halves: a thinner (5–5.4 mm) section was cut from one half and used for bulk tissue isotope analysis, the other half was used for amino acid analysis. Approximately equidistant samples (mean ± SD interval between adjacent samples among vertebrae: 0.59 ± 0.07 mm; Table 1) were collected along the vertebral radius by manually cutting the thinner half section with a scalpel. Equidistant samples were chosen over sampling growth bands, as growth bands can be difficult to identify, particularly in blue sharks (Magozzi personal observation), and are compressed toward the vertebral edge due to reduced growth/accretion rates with age (Natanson et al., 2002; Skomal and Natanson, 2003), which makes it hard to sample each single growth band and obtain sufficient material for isotopic analysis. For this reason, the temporal resolution of isotope chronologies from equidistant samples was higher (e.g., <1 year) closer to the vertebral centrum and lower toward the edge (e.g., a few years) but sufficient to depict isotopic variation at ecologically relevant time-scales for all specimens and life-history stages.
Vertebral samples were decalcified by exposure to 2 ml of 1 M HCl for 48 h to remove any potential influence of 13C-enriched bioapatite on the δ13C values of bulk cartilage collagen (Hussey et al., 2012; Kim and Koch, 2012; Christiansen et al., 2014; see also Tuross et al., 1988). During treatment samples were kept at a constant temperature of 4°C to reduce decalcification rates and prevent collagen dissolution and damage. Samples were then washed five times with 2 ml of Milli-Q water, frozen and freeze-dried.
Samples weighing <0.5 mg (i.e., the minimum weight required for dual carbon and nitrogen isotope analysis of bulk protein) were combined to the lighter adjacent sample(s) until the combined weight exceeded 0.5 mg. Due to the typical bowtie shape of vertebral sections, more samples generally required to be combined closer to the centrum or even further along the radius in portions of the vertebra characterized by large water or air content. Thus, the combination of samples often resulted in decreased temporal resolution at the core. Single or combined samples with a weight of >1.5 mg were powdered and ∼1.25 mg of material was randomly selected for analysis. Blue shark samples were analyzed at full resolution (i.e., all adjacent samples), porbeagle samples at half resolution (i.e., one every other sample) for distances along the vertebral radius <7 mm and at full resolution afterward. This choice was made to minimize analytical costs, whilst also achieving a sufficient temporal resolution throughout ontogeny in the two species. Evidence from satellite-tagging studies indicates that, while juvenile blue sharks may undergo extensive latitudinal movements (Queiroz et al., 2010; Vandeperre et al., 2014), porbeagles tend to remain on the shelf until they conduct an ontogenetic habitat shift toward offshore waters with the onset of maturity (Biais et al., 2017) and are therefore unlikely to express large isotopic variation during early life-history stages. The vertebral radius at maturity is estimated to be ∼15 mm in porbeagles from age at maturity equal to 13 years (Natanson et al., 2002); a value of 7 mm was selected here as a more conservative cutoff to account for approximations in the sampled interval.
Sample Preparation for Compound-Specific Analysis
The procedures for sample preparation for amino acid isotope analysis were similar to those for bulk tissue analysis except that the half section used for this analysis was 6 mm thick and more adjacent samples required to be combined at the core and along the vertebral radius, as the minimum weight for compound-specific analysis is 4 mg (prior to hydrolysis and derivatization; Houghton personal communication). Vertebral samples were analyzed at full resolution for central and eastern blue sharks, at half resolution for all other specimens to minimize analytical costs. Thus, the temporal resolution of amino acid analysis was generally lower than for bulk tissue analysis but sufficient to identify breakpoints in amino acid isotope chronologies.
For compound-specific analysis, samples were initially acid-hydrolyzed (after combining adjacent samples) in 1 ml 6 N HCl at 110°C (temperature range: 105–115°C) for 20 h to liberate single amino acids from protein. Vials were tightly closed during hydrolysis to prevent sample and acid evaporation. After hydrolysis, samples were dried with a gentle stream of N2 at 60°C (temperature range: 55–65°C) for 30–60 min, depending on sample weight and excess HCl volume. Samples were then dissolved in 100 μl 0.1 N HCl and preserved at 4°C until derivatization.
A total of 50 μl of the sample+HCl solution were derivatized by adding 35 μl of methanol, 30 μl of pyridine, and 15 μl of methyl chloroformate (MCF); after additions, the mixture was vortexed for 30 s. Amino acid-MCF derivates were separated from the reaction mixture by adding a volume of chloroform that depended on sample original weight: 50 μl for 4–10 mg, 75 μl for 11–22 mg, and 100 μl for >23 mg. After chloroform addition, the mixture was vortexed for another 30 s. At this stage the reaction mixture was stratified and the organic layer of amino acid-MFC derivates was separated from the aqueous layer using electrophoresis pipette tips and used for analysis.
Bulk Tissue Isotope Analysis
Carbon and nitrogen isotopic compositions of bulk cartilage collagen were measured using a PDZ Europa ANCA-GSL elemental analyzer interfaced to a PDZ Europa 20–20 isotope ratio mass spectrometer (Sercon Ltd., Cheshire, United Kingdom) at the UC Davis Stable Isotope Facility. Samples from Northeast Atlantic porbeagles were transported to the United States accompanied by a CITES Export Permit (No. 529713/01). All samples were analyzed in duplicate. Analytical quality-control was assessed through repeated measurement of laboratory-internal reference materials (nylon, glutamic acid, and USGS-41; for details see Magozzi, 2017), which were in turn calibrated to international reference materials. Nylon was used as a drift reference to correct for variation over the course of a run, glutamic acid to calculate the elemental totals and apply a linear correction to the isotope values. The isotope values were then scaled to two reference materials of known isotopic compositions: nylon and USGS-41. Precision was calculated as the standard deviation of isotope values for bovine liver NIST 1577 across runs (i.e., for the time period over which the samples were analyzed), accuracy as the difference between the mean isotope value for bovine liver and its accepted value. Precision was 0.03‰ for δ13C values and 0.10‰ for δ15N values, accuracy 0.01‰ for δ13C values and 0.06‰ for δ15N values. Final δ13C and δ15N values were expressed relative to the international reference materials V-PDB (Vienna PeeDee Belemnite) and Air, respectively. The raw ratio (R) of the heavy (13C, 15N) to the light (12C, 14N) isotope in a sample was converted to a δ-value expressed in ‰ using Eq. (1):
where X is the heavier isotope. Rstandard refers to the raw ratio of an internationally accepted reference gas for the analyzed isotope.
Compound-Specific Isotope Analysis
Derivatized samples were analyzed with gas chromatography-combustion-isotope ratio monitoring mass spectrometry (GC-C-irm-MS) at the Woods Hole Oceanographic Institution. Samples were dissolved in dichloromethane (DCM) and injected on column in splitless mode at 260°C and separated on an Agilent VF-23ms column (length: 30 m, inner diameter: 0.25 mm, film thickness: 0.25 μm; Agilent Technologies, Wilmington, DE, United States) in an Agilent 689N Gas Chromatograph (GC). Sample concentrations were adjusted to achieve a minimum of 2 V output for all amino acids. Gas chromatography conditions were set to optimize peak separation and shape as follows: initial temperature 80°C held for 1 min; ramped to 260°C at 6°C min– 1; held for 3 min. The separated amino acid peaks were combusted online in a Finnigan GC-C continuous flow interface at 930°C and then measured as CO2 on a Thermo Finnigan Mat 253 irm-MS (Agilent Technologies 689N GC). Standardization of runs was achieved using intermittent pulses of a CO2 reference gas of known isotopic composition. All samples were run in duplicate. Carbon isotopic compositions were recovered for the essential amino acids: valine, isoleucine, leucine, threonine, and phenylalanine; and for the non-essential amino acids: alanine, glycine, proline, aspartic acid, and glutamic acid. A typical chromatogram from the analysis of carbon isotope ratios in amino acid-MCF derivates is displayed in Supplementary Figure 2. Values of δ13C for threonine showed poor chromatography and inconsistencies among replicates, therefore were omitted from data analysis.
Two internal lab reference materials (AA1 and AA2) were created with single amino acids with known δ13C values. Additionally, 20 mg of lyophilized muscle from Atlantic cod (Gadus morhua, Linnaeus 1758) were acid-hydrolyzed and re-dissolved in 100 μl 0.1 N HCl and 50 μl of the solution used as reference material. All reference materials were concurrently derivatized with the samples and dissolved in 100 μl chloroform. Derivatization correction factors were determined for each amino acid based on known δ13C values of the amino acids in the reference materials prior to derivatization, and applied to each sample to adjust for the introduction of exogenous carbon and kinetic fractionation from derivatization. As no international reference materials are currently available for the analysis of carbon isotope ratios in individual amino acids and no large inter-laboratory calibration has yet come up with consensus δ13C values, mean values across three laboratories (i.e., the Fish Ecology Laboratory, the Marine Biological Laboratory, and the UC Davis Stable Isotope Facility; Supplementary Table 1) were used. Reference materials were interspersed among samples and analyzed 4–6 times. Precision was determined as the standard deviation of the δ13C values for each amino acid in the cod standard during the time period of sample analysis. Precision was 0.31‰ for valine, 0.34‰ for isoleucine, 0.40‰ for leucine, 0.30‰ for threonine, 0.26‰ for phenylalanine, 0.13‰ for alanine, 0.30‰ for glycine, 0.32‰ for proline, 0.40‰ for aspartic acid, 0.22‰ for glutamic acid.
Data Analysis
To account for differential vertebral growth rates throughout ontogeny, linear distance of samples along the vertebral radius was converted to age using validated (for blue shark and porbeagle trunk vertebrae; Natanson et al., 2002; Skomal and Natanson, 2003) and estimated (for blue shark cervical vertebrae; this study) vertebral width:body size relationships and validated body size:age (Von Bertalanffy) growth curves for blue sharks (Skomal and Natanson, 2003) and porbeagles (Natanson et al., 2002; for details on age estimation see Supplementary Material). Clearly, due to reduced growth/accretion rates with age, the same sampled interval corresponded to “less years” integrated at smaller distances along the vertebral radius, “more years” integrated at larger distances along the radius. Thus, conversion of sample distance to age accounted for time-series expansion closer to the vertebral centrum and time-series compression toward the edge. Differences in growth and longevity between blue sharks and porbeagles were accounted for by parameters in vertebral width:body size relationships and Von Bertalanffy growth curves. Age at birth was 0 years and age at maturity was 5 and 13 years in blue sharks and porbeagles, respectively (Natanson et al., 2002; Skomal and Natanson, 2003); these values were used as cutoffs to distinguish between pre-birth, juvenile and adult life-history stages when examining isotope chronologies. Sample age is not displayed in plots for pre-birth samples, as Von Bertalanffy growth curves are not applicable to estimate age during the pre-birth stage. Age classes were determined for each species by subsetting the maximum age range across individuals by 1 year-intervals, and samples were assigned to their age classes based on their estimated age. Age classes were sufficiently small to allow the identification of relatively continuous ontogenetic patterns across individuals.
Principal component analysis (PCA) was applied to the δ13C values of essential and non-essential amino acids to reduce the data to two dimensions (PC1 and PC2) explaining the majority of variance in δ13C values of amino acids. For non-essential amino acids, spacing (i.e., difference) in δ13C values was calculated between independent pairs of glycolytic (lipid-derived) and Krebs cycle (lipid+protein-derived) amino acids (glycine and alanine compared to glutamic acid and proline, respectively) and explored as a potential indicator for shifts in macronutrient contents of diets and/or changes in metabolic routing of macronutrients to amino acid synthesis (Wolf et al., 2015; Wang et al., 2018, 2019).
In order to test for common isotope patterns across individual blue sharks and porbeagles, the values of each variable (i.e., bulk protein δ13C and δ15N values, PC1 scores for δ13C values of essential and non-essential amino acids and spacing in δ13C values between glycolytic and Krebs cycle amino acids) in each sample were normalized to the individual mean (life history-normalization) to emphasize within-individual variation in ontogenetic profiles, whilst reducing among-individual differences. Ontogenetic patterns in life history-normalized δ13C and δ15N values of bulk protein and differences between species and among areas and individuals were tested with generalized additive mixed models (GAMMs). Estimated sample age was added as a smoother, species and area as parametric fixed effects and individuals as a random effect (Pinheiro and Bates, 2000; Zuur et al., 2014). Model fits were calculated for full models and optimal models were selected with Akaike Information Criteria (AIC; Zuur et al., 2014). Generalized additive mixed models were fitted using the mgcv R package (Wood, 2006) and all analysis were performed using R v.4.0.2 (R Core Team, 2019).
Results
Bulk Protein
Bulk protein δ13C values ranged between -16.73 and -13.95‰ (mean ± SD: -15.13 ± 0.65‰) in blue sharks and between -15.80 and -13.71‰ (mean ± SD: -14.55 ± 0.38‰) in porbeagles. Values of δ15N varied between 9.09 and 14.14‰ (mean ± SD: 11.47 ± 1.11‰) in blue sharks and between 9.42 and 16.29‰ (mean ± SD: 12.84 ± 1.47‰) in porbeagles. The δ15N range in porbeagles was, however, strongly influenced by 15N-enriched subadult and adult samples from Northwest Atlantic individuals.
Despite high among-individual variability in individual isotopic profiles (Supplementary Figure 4), we identified common, broad ontogenetic patterns in life history-normalized δ13C and δ15N values (δ13Cn, δ15Nn) of bulk protein across individuals of each species (Figure 2). Ontogenetic patterns in δ13Cn and δ15Nn values were non-linear (smoother ‘estimated sample age’: p-value = 2⋅10–16, Fδ^13C = 26.46; Fδ^15N = 26.29) and differed significantly between species (maximum p-value = 0.006, F = 7.62; Supplementary Tables 2, 3). In blue sharks, δ13Cn values increased progressively during juvenile and early adult growth, reaching a relatively steady state in the adult life stage (Figure 2A). Values of δ15Nn increased during juvenile growth and decreased in adult stages (Figure 2B). Both δ13Cn and δ15Nn values were higher in the pre-birth stage and decreased around birth (δ15Nn values to a lesser extent; Figures 2A,B). Pre-birth δ13Cn values were highest across life-history and comparable to adult levels, whereas pre-birth δ15Nn values were higher than late adult levels. Among-individual variances in both δ13Cn and δ15Nn values were relatively high but constant across life-history and lower than in porbeagles (Figures 2A,B).
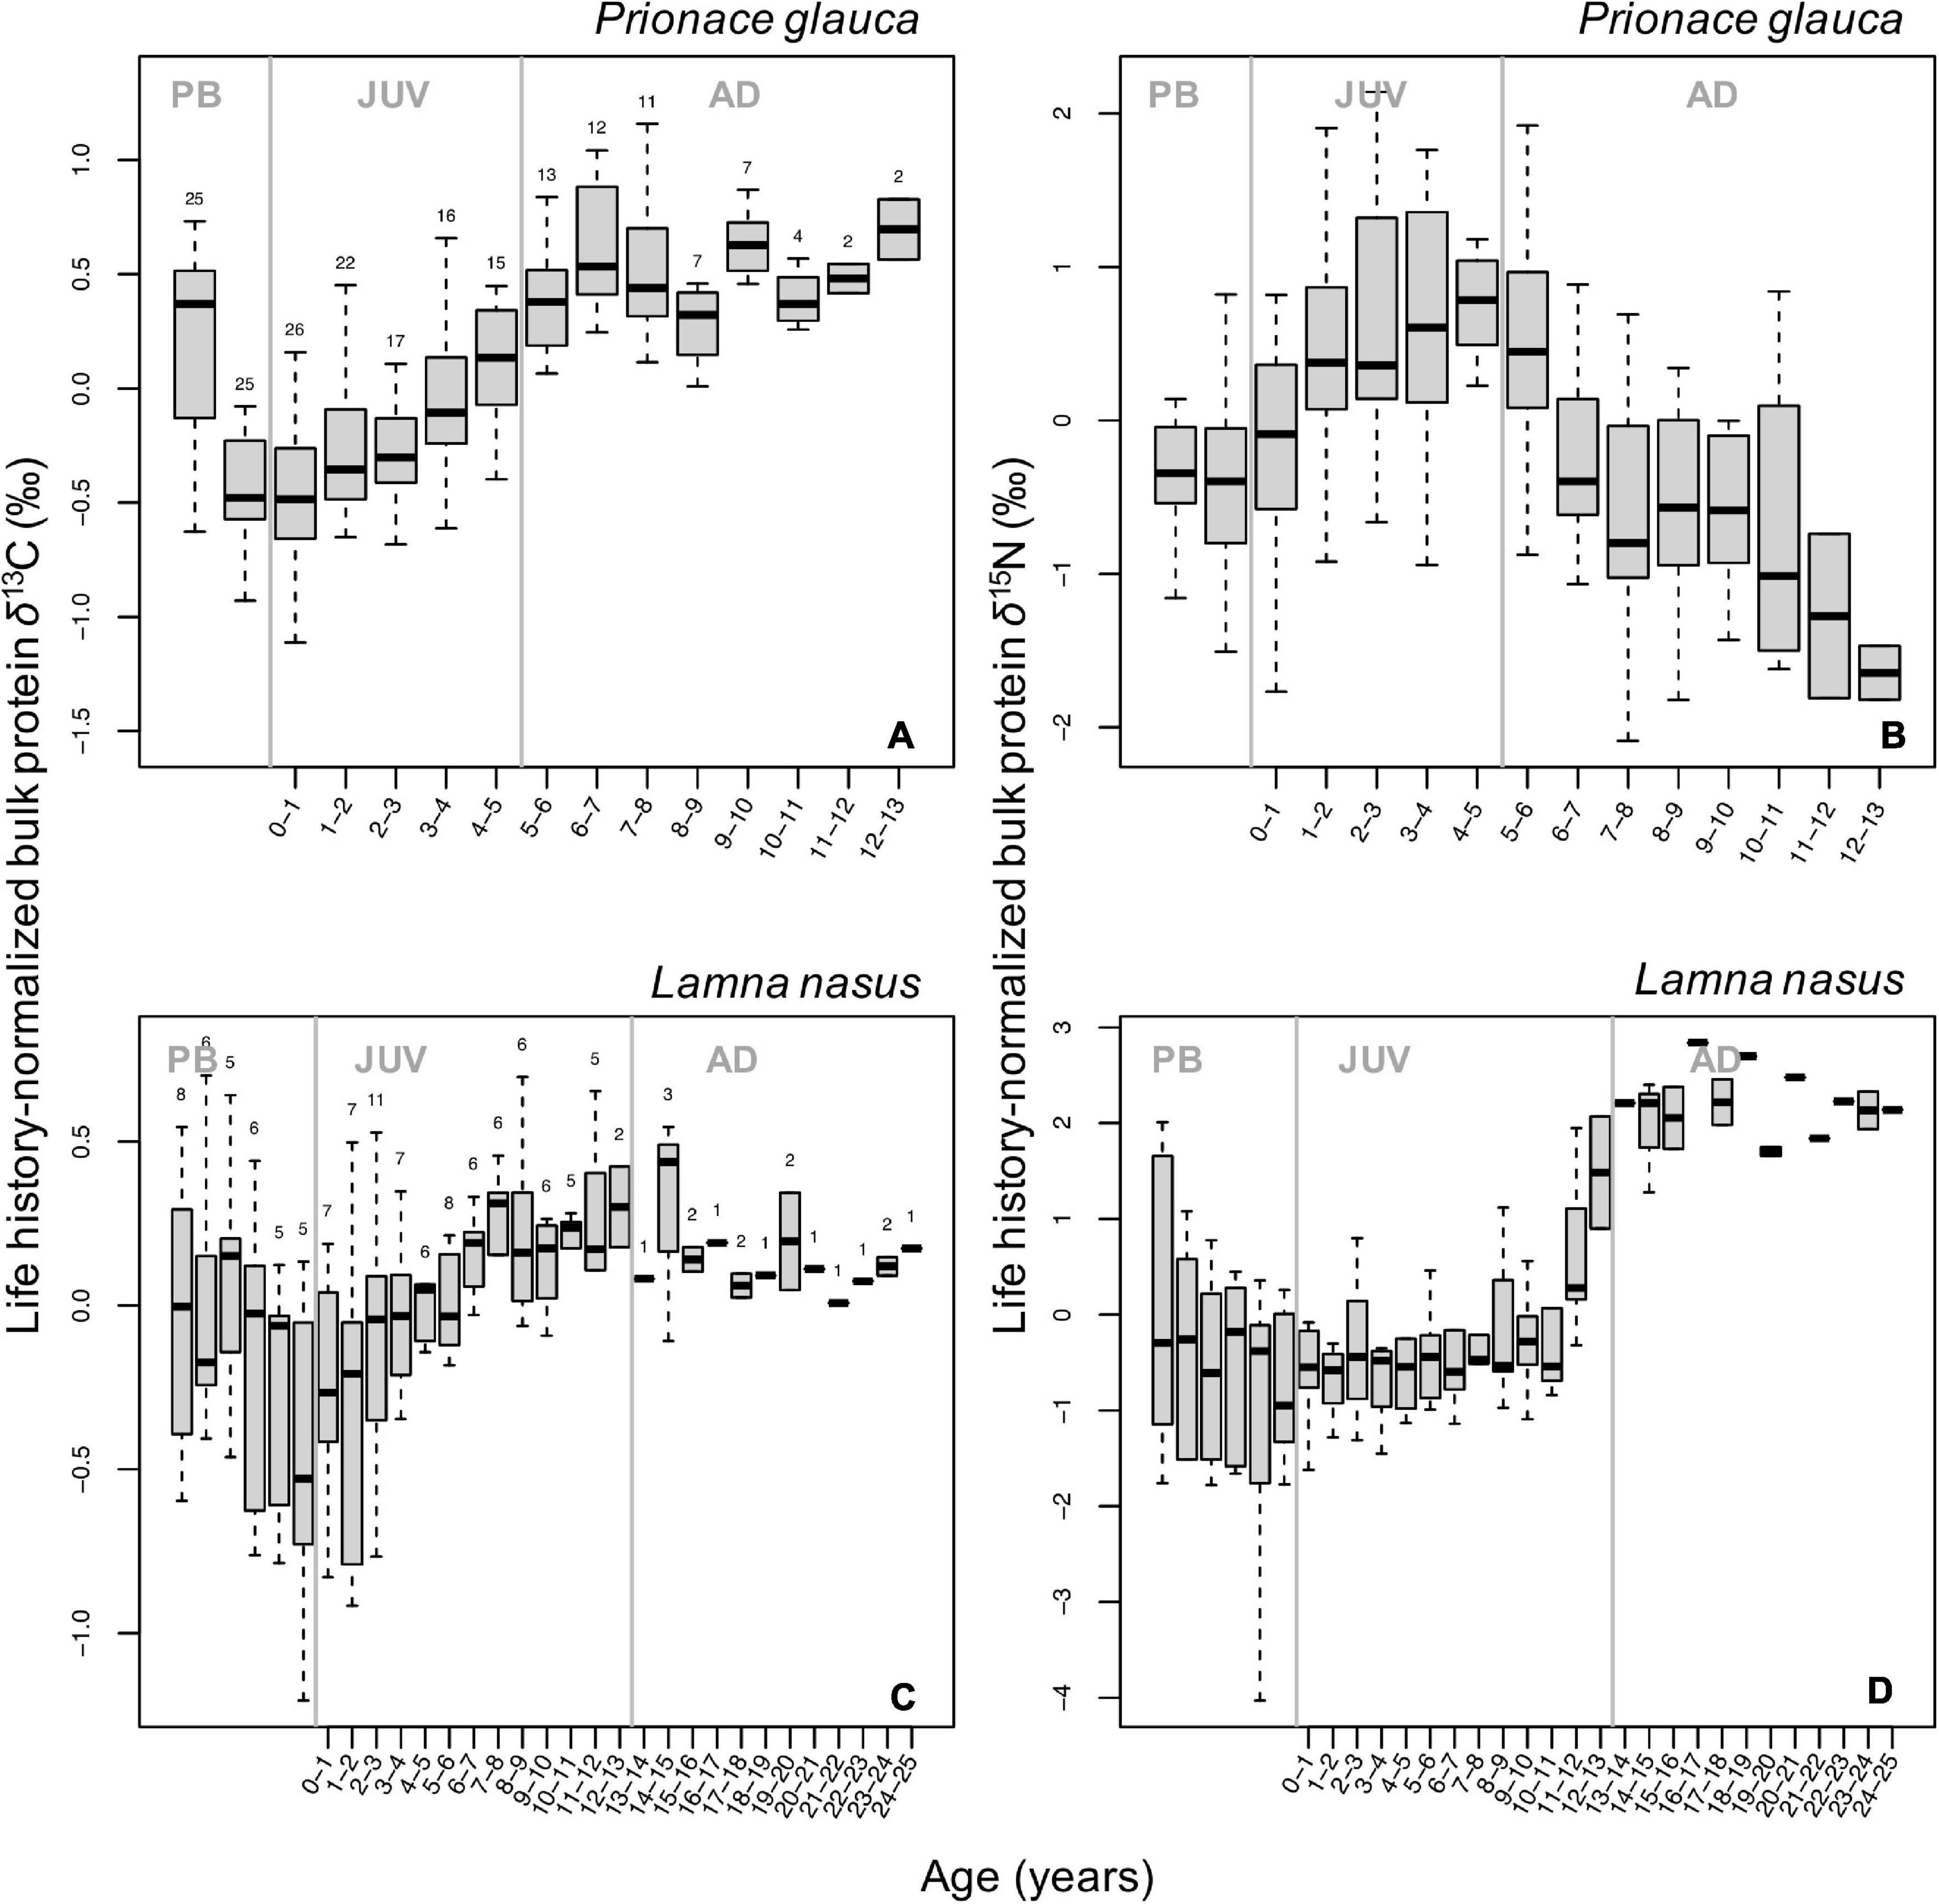
Figure 2. Boxplots of life-history normalized δ13C (A,C) and δ15N (B,D) values of bulk protein by age class in blue sharks (A,B) and porbeagles (C,D). Numbers at the top of each boxplot in (A,C) indicate the number of samples analyzed δ13C for each age class; the same numbers were analyzed for δ15N. Gray vertical lines represent age at birth (0 years) and at maturity (5 and 13 years for blue sharks and porbeagles, respectively) and separate pre-birth (PB), juvenile (JUV), and adult (AD) life-history stages. Age classes are not plotted for samples in the PB stage as Von Bertalanffy growth curves are not applicable to back-calculate age during this stage.
In porbeagles, mean δ13Cn values increased in the juvenile stage (until an age of ∼7–8 years), then remained relatively constant until capture (Figure 2C). Pre-birth δ13Cn values were higher than post-partum values but generally lower than adult levels. Among-individual variance in δ13Cn values was markedly higher than in blue sharks, particularly in the pre-birth stage and early juvenile and subadult stages associated with shifts in mean δ15Nn values (see below). Mean values of δ15Nn showed two stepwise increases, a small one just after birth and a larger one in the subadult stage (at ∼11–12 years of age), whereas values in intermediate juvenile and adult periods remained relatively constant (Figure 2D). The stepwise pattern in the subadult stage was driven by a step increase in δ15Nn values in individuals from the Northwest Atlantic, and the plateau phase in the adult stage was also only seen in these sharks (Supplementary Figures 4M–O). Similar to δ13Cn values, pre-birth δ15Nn values were higher than values after birth but lower than values in the adult stage (Figures 2C,D). Among-individual variance in δ15Nn values was broadly consistent with that in δ13Cn values, peaking in the pre-birth stage and early and late juvenile stages.
Amino Acids
Carbon isotope compositions of individual amino acids were analyzed for 128 blue shark vertebral samples (n = 196 bulk collagen samples). For porbeagles, 80 samples were analyzed for carbon isotopes in amino acids (n = 133 bulk protein samples). Mean ± SD δ13C values for each amino acid in blue shark and porbeagle samples are presented in Supplementary Table 4. Individual isotope chronologies for δ13C values in single amino are presented in Supplementary Figures 5–13.
Values of δ13C of non-essential amino acids (δ13Cnon–EAA) were more positive than values of essential amino acids (Supplementary Figures 5–13), and the bulk protein δ13C value corresponded to the weighted average of δ13CEAA and δ13Cnon–EAA values. Co-variations between bulk protein and single amino acid δ13C values are shown in Figures 3, 4 for essential and non-essential amino acids, respectively. Bulk protein δ13C values were higher and spanned a smaller range in porbeagles. Individual blue sharks grouped by capture area, implying that spatially determined among-individual variation explained more of the variance than the within-individual term. Within individual sharks, amino acid δ13C values co-varied more with bulk protein δ13C values in blue sharks compared to porbeagles, implying a common mechanism influencing multiple amino acids in the same direction and therefore contributing to bulk collagen δ13C values. This was especially clear for the non-essential glycolytic amino acids alanine and glycine. In porbeagles, there was very weak co-variance between bulk protein δ13C values and δ13C values for any single amino acids, implying that mechanisms underpinning variation in bulk protein δ13C values varied among- and within-individuals, likely complicating efforts to interpret bulk collagen δ13C values in an ecological or behavioral context. Aspartate/aspartic acid and, to a lesser extent, glutamate/glutamic acid δ13C values separated blue shark and porbeagle individuals into two clusters but these clusters did not correspond to different capture areas.
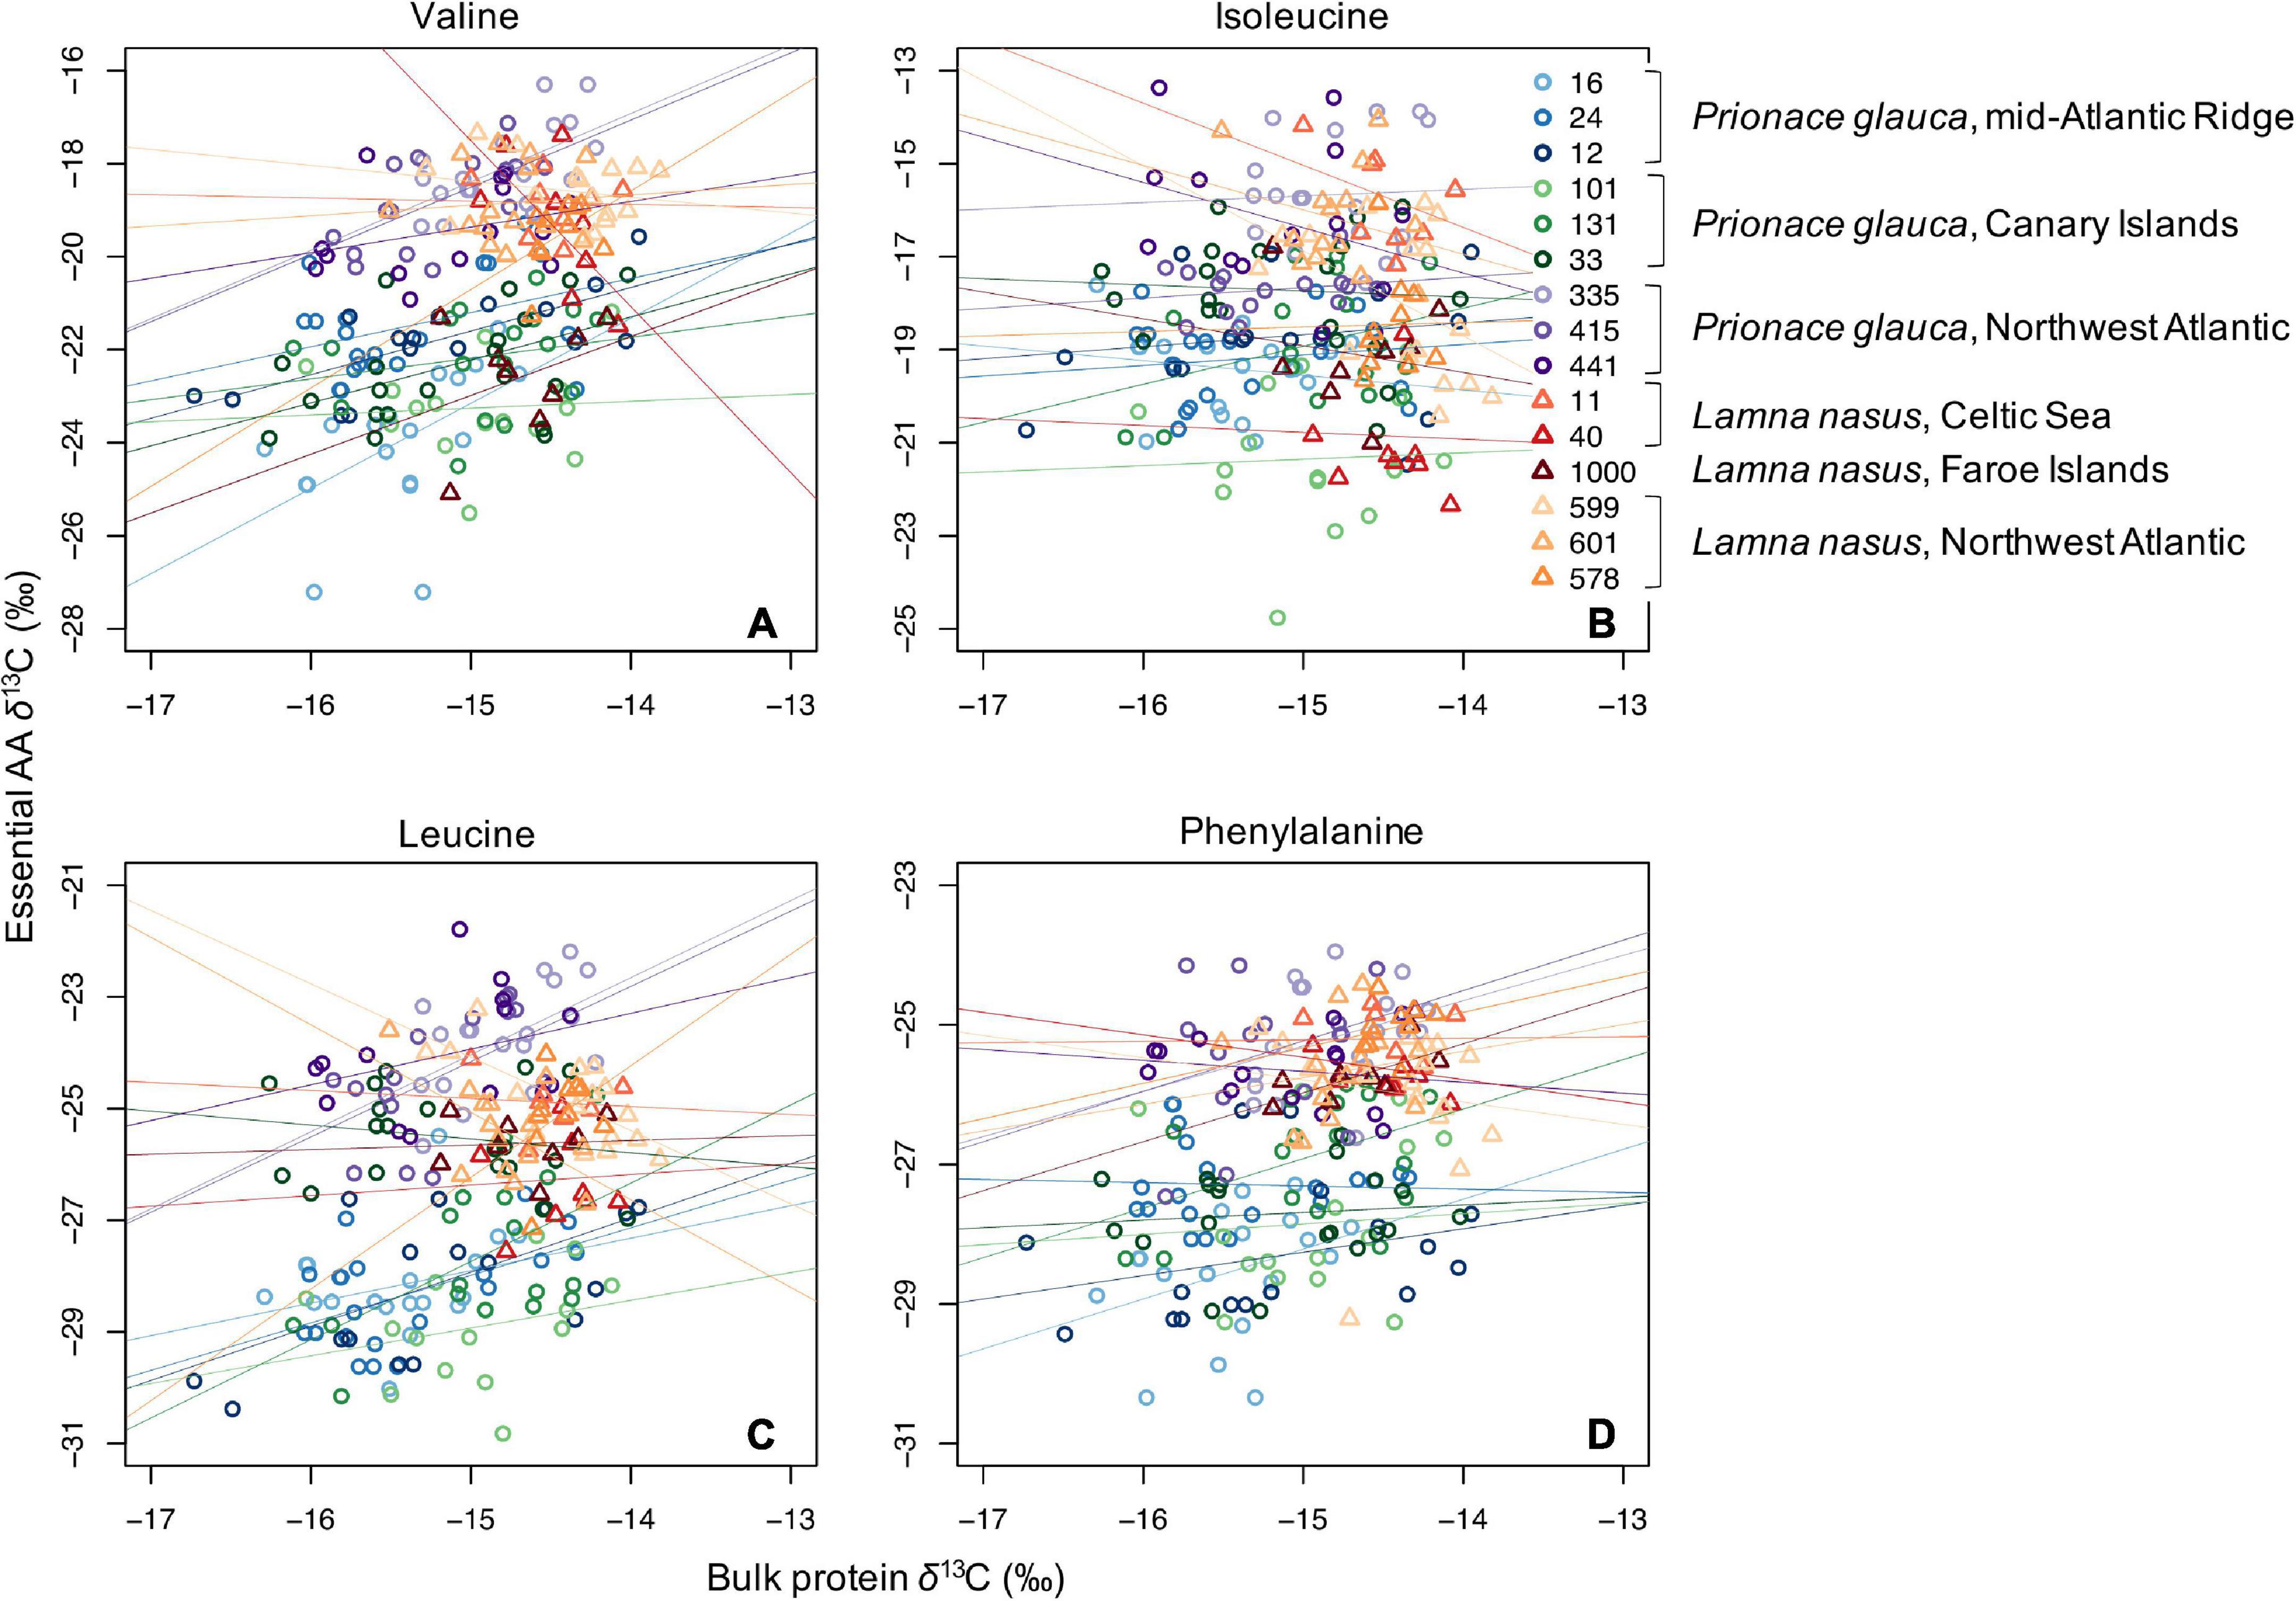
Figure 3. Scatterplots of raw δ13C values of bulk protein vs. single essential amino acids (A, valine; B, isoleucine; C, leucine; and D, phenylalanine) in comparable vertebral samples from individual blue sharks and porbeagles caught across the North Atlantic (as in figure legend).
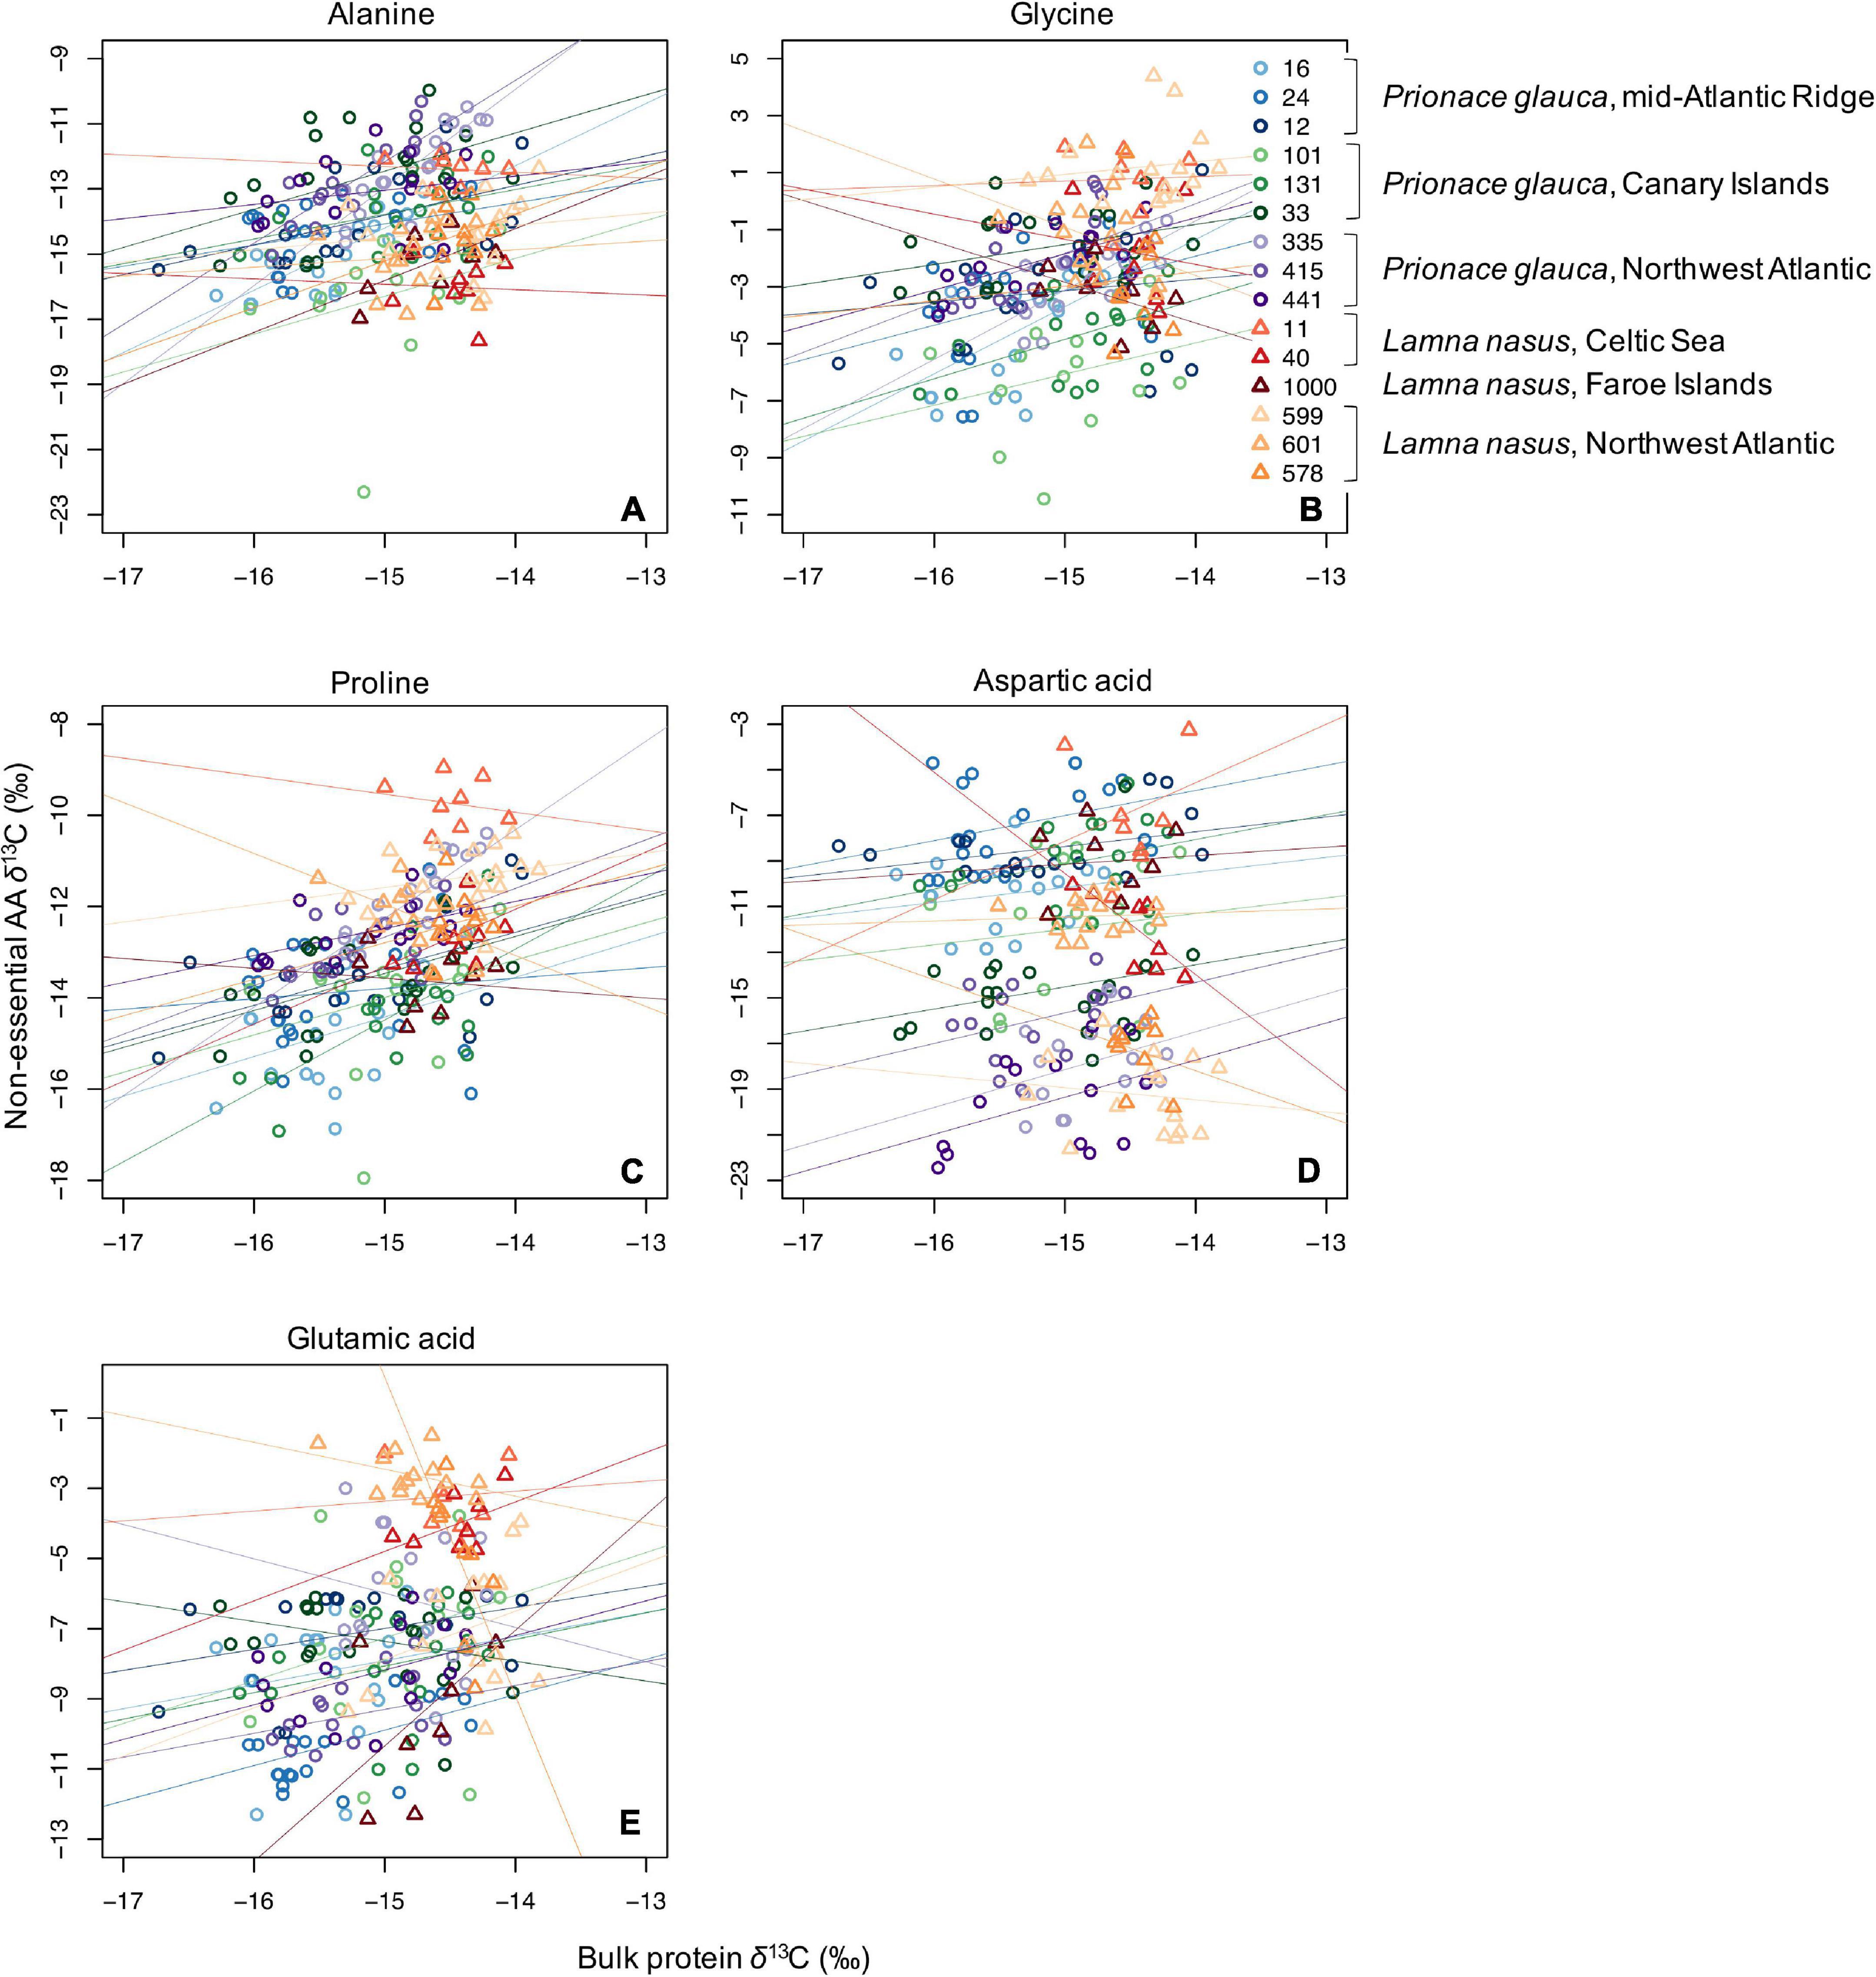
Figure 4. Scatterplots of raw δ13C values of bulk protein vs. single non-essential amino acids (A, alanine; B, glycine; C, proline; D, aspartic acid; and E, glutamic acid) in comparable vertebral samples from individual blue sharks and porbeagles caught across the North Atlantic (as in figure legend).
Essential Amino Acids
Principal components 1 and 2 explained 72% and 13% of the total variance in the δ13C values of essential amino acids (δ13CEAA), respectively (Supplementary Figures 14A,B). Most positive PC1 scores corresponded to most positive δ13C values of all essential amino acids. Shark samples laid along a gradient on the PC1 axis: central and eastern North Atlantic blue sharks had most negative PC1 (hence δ13CEAA) values, individuals from the Northwest Atlantic had most positive values (Supplementary Figure 14A). Porbeagles had intermediate PC1 scores and also separated, to a lesser extent, by area and individual (Supplementary Figure 14B).
Despite high variability in PC1 individual profiles (Supplementary Figure 15), broad, common patterns in life history-normalized PC1 scores for δ13C values of essential amino acids (PC1n–EAA) were observed across blue sharks and porbeagles (Figure 5). In blue sharks, PC1n–EAA (hence δ13CEAA) values were highest in the pre-birth stage, decreased sharply around birth and increased progressively during juvenile and early adult growth but did not show any clear trend in the late adult stage (Figure 5A). Adult PC1n–EAA values were generally comparable to pre-birth levels, except for some age classes. In porbeagles, PC1n–EAA scores decreased during juvenile growth until an age of ∼6–7 years, possibly increased back until 11–12 years of age, but showed no clear patterns in subadult and adult stages (Figure 5C). Scores of PC1n–EAA were highest in the pre-birth stage and decreased after birth.
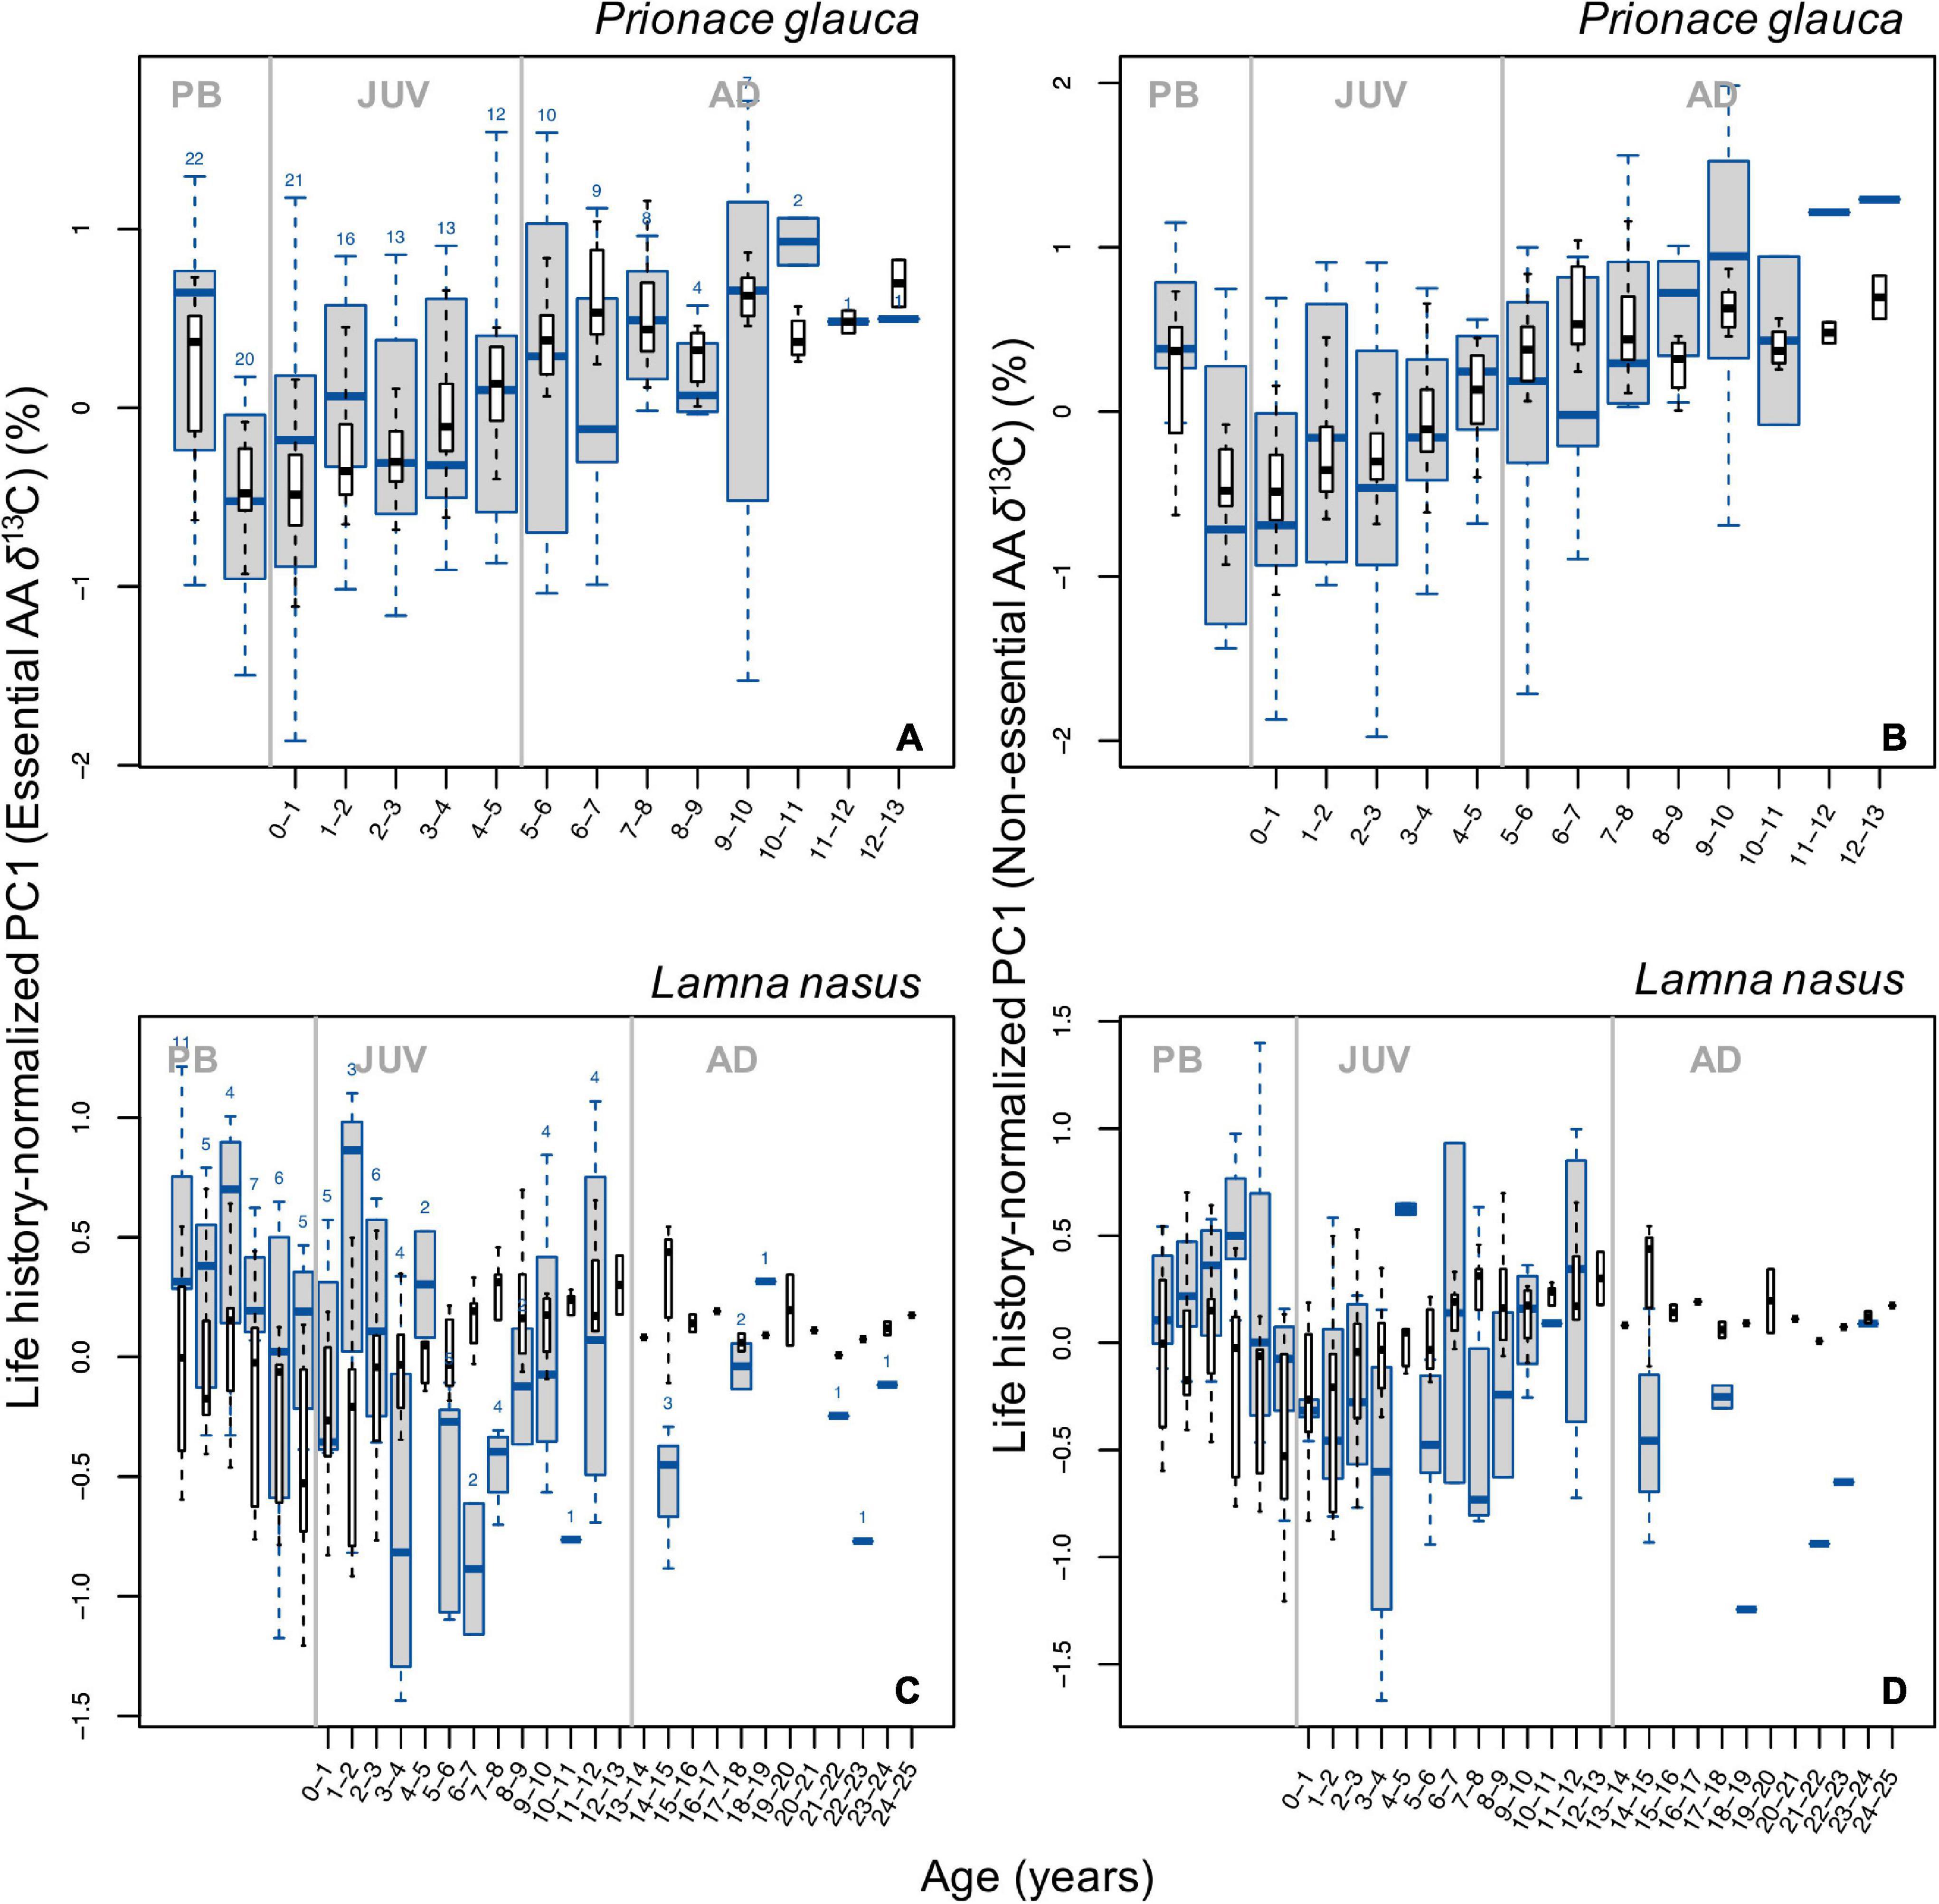
Figure 5. Boxplots (in blue) of life history-normalized PC1 values from PCAs with δ13C values of essential (A,C) and non-essential (B,D) amino acids by age class in blue sharks (A,B) and porbeagles (C,D). Boxplots (in black) of life history-normalized δ13C values of bulk protein are overlain for comparison. Figure description is the same as for Figure 2.
Non-essential Amino Acids
PC1 and PC2 explained 45% and 22% of the total variance in δ13Cnon–EAA values, respectively (Supplementary Figures 14C,D). Most positive PC1 scores corresponded to most positive δ13C values of all non-essential amino acids except aspartic acid; most positive PC2 were associated with most positive values of alanine and most negative values of glutamic acid and aspartic acid. Blue sharks had generally more negative PC1 scores for δ13Cnon–EAA values than porbeagles but more positive PC2 scores (except individual 1000; Supplementary Figures 14C,D). Individuals from the central and eastern North Atlantic had more negative PC1 and PC2 than Northwest Atlantic sharks in both species. Ontogenetic patterns in PC1 scores for δ13Cnon–EAA values were similar to patterns in δ13CEAA (Figures 5B–D and Supplementary Figure 15) with additional influences of aspartic acid (Supplementary Figures 14C,D; see also Figure 4D and Supplementary Figure 12).
Spacing Between Glycolytic and Krebs Cycle Amino Acids
In general, broad ontogenetic patterns in life history-normalized values of spacing in δ13C values between pairs of glycolytic and Krebs cycle amino acids (glycine and glutamic acid compared to alanine and proline, respectively) did not match those in bulk protein δ13C values (Figure 6). In blue sharks, spacing between both pairs of amino acids decreased slightly around birth and increased during juvenile growth, then remained relatively constant in late juvenile and adult stages (Figures 6A,B). In porbeagles, spacing between both amino acid pairs showed systematic patterns, with a sharp increase associated with birth and early juvenile stages, followed by broadly U-shaped profiles before declining in the most recent samples (Figures 6C,D). The precise timing of transitions in these profiles differed slightly between the two amino acid pairs. More or less pronounced excursions in spacing between glycolytic and Krebs cycle amino acids were observed through ontogeny in all sharks (Supplementary Figure 16). In general, excursions in spacing between independent pairs of amino acids showed relatively strong covariation, with a few exceptions. In many cases, excursions in spacing coincided with those in bulk protein δ13C and/or δ15N values.
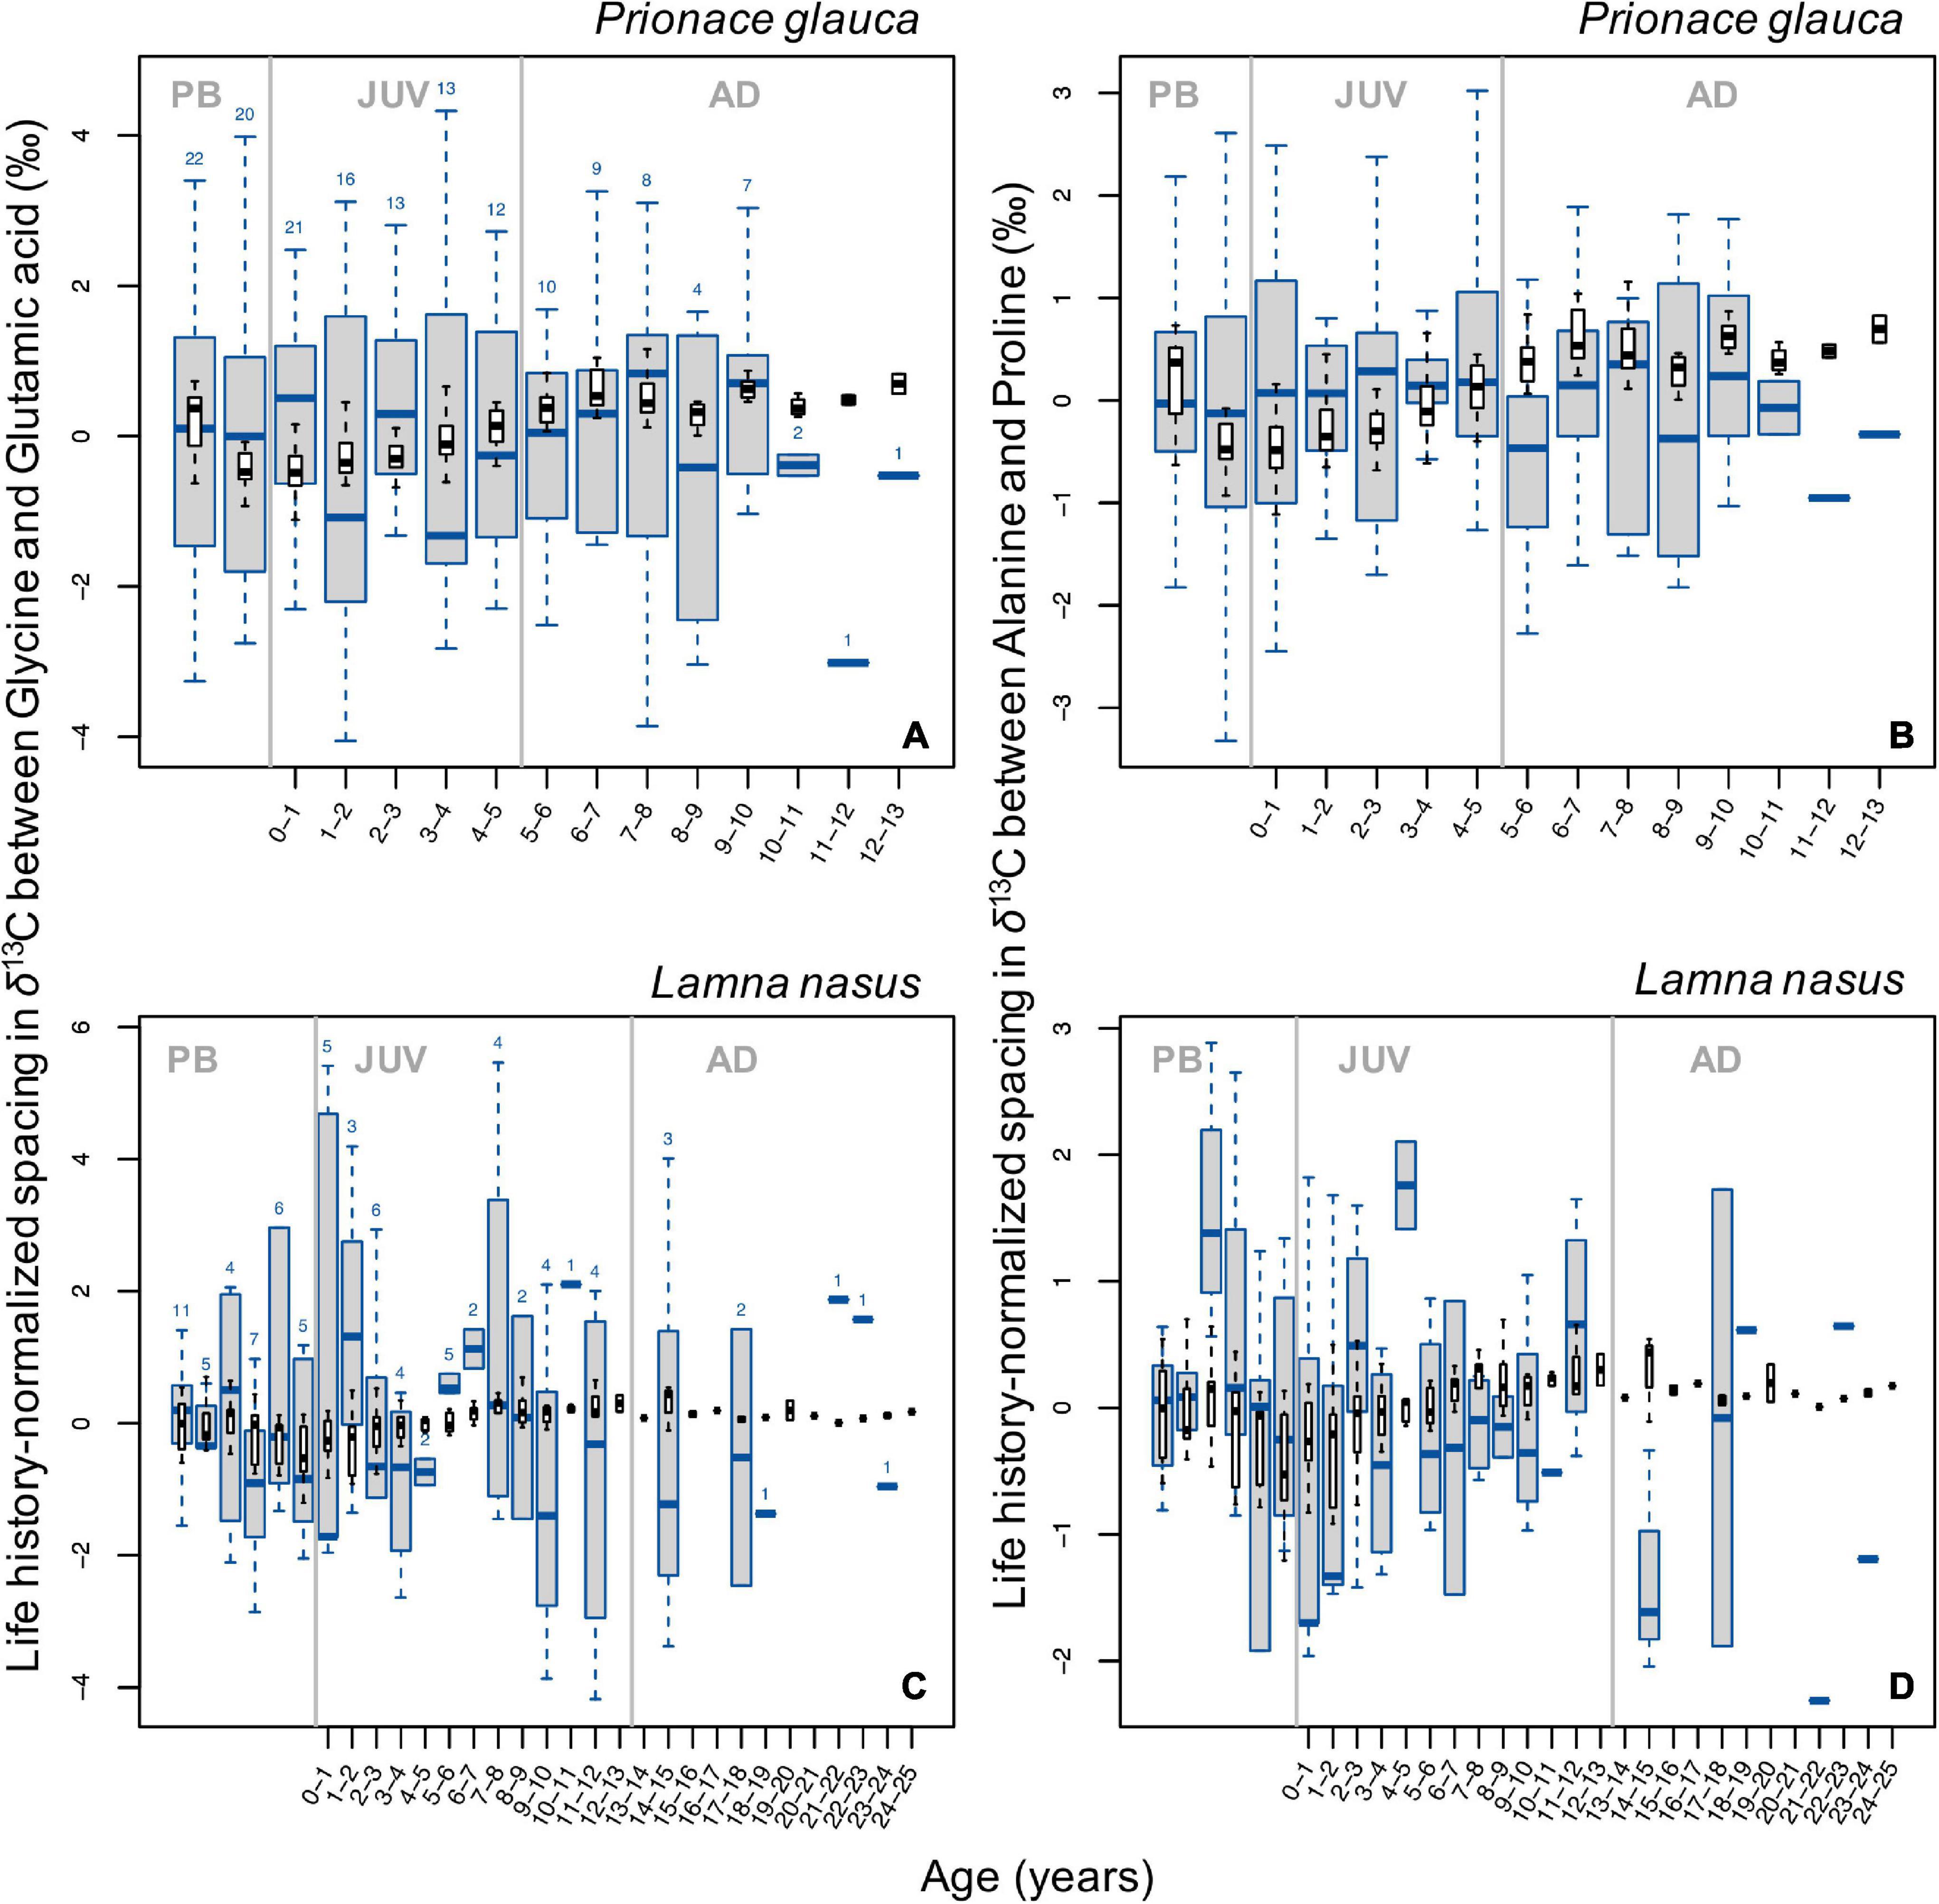
Figure 6. Boxplots (in blue) of life history-normalized spacing in δ13C values between independent pairs of glycolytic (lipid-derived) and Krebs cycle (lipid+protein-derived) amino acids (A,C, glycine and glutamic acid; B,D alanine and proline) by age class in blue sharks (A,B) and porbeagles (C,D). Boxplots (in black) of life history-normalized δ13C values of bulk protein are overlain for comparison. Figure description is the same as for Figure 2.
Discussion
This study aimed to test inferences about life-history movements drawn from ontogenetic patterns in bulk collagen δ13C and δ15N values in shark vertebrae using complementary data for single amino acid δ13C values. The study is based on a small number of individuals (nine blue sharks and six porbeagles) with highly variable isotope chronologies. We were therefore obviously unable to infer species- or population-level behavioral or ecological patterns from these data. Below we discuss possible interpretations of aspects of shark spatial and trophic ecology based on bulk protein isotopic life-histories and the extent to which these may be supported, contradicted or refined based on amino acid δ13C patterns.
Inferences Based on Patterns in Bulk Protein
Bulk protein δ13C and δ15N values in blue sharks, normalized by life-history, showed a common pattern of increasing values during juvenile growth (Figures 2A,B), despite relatively high variation in individual profiles (Supplementary Figures 4A–I). Increases in δ13C values in marine animals are commonly interpreted as baseline effects resulting from increased use of warmer waters closer to the equator (McMahon et al., 2013; Magozzi et al., 2017) and/or more coastal foodwebs with higher levels of primary production (O’Learly, 1981; Miller et al., 2008). Increases in δ13C values could also reflect increases in trophic position, however the lack of a corresponding trend in δ15N values in blue sharks implies that trophic level-change alone could not explain the δ13C pattern. In the eastern North Atlantic in particular, blue sharks are believed to be primarily oceanic sharks (Vandeperre et al., 2014, 2016; Coelho et al., 2018), therefore ontogenetic trends in bulk protein δ13C values in blue sharks are likely to be interpreted as reflecting a life-history migration resulting in increased use of resources from relatively warm southern locations through the juvenile and early adult life stages. In the Northwest Atlantic, juveniles are often observed near the shelf, particularly in summer, meaning that isotopic signals in the juvenile stages could as well be influenced by coastal processed. The increase in δ15N values during juvenile growth and subsequent decrease in the adult stage (Figure 2B) is also consistent with baseline effects associated with an increasing dependence on resources living in warmer waters (McMahon et al., 2013; Schmittner and Somes, 2016) rather than a strong ontogenetic trophic shift.
Ontogenetic profiles in bulk protein δ13C and δ15N values in porbeagles are considerably more challenging to interpret compared to blue sharks. Life history-normalized bulk protein δ13C values displayed a minor ontogenetic increase with approximately half of the range seen in blue sharks, and high among-individual variance in both early and late juvenile life stages (Figure 2C). Bulk protein δ15N values were relatively flat until the late juvenile stage, when a pronounced step increase was observed (Figure 2D). Similar to blue sharks, the ontogenetic profiles in bulk protein δ13C values in porbeagles may imply a gradual increase in reliance on resources with higher δ13C values (e.g., closer to the equator and/or more coastal resources) throughout juvenile growth but with a high degree of among-individual variance. The step increase in δ15N values in late juvenile stages may potentially be linked to a change in diet or trophic level as inferred for other lamnid sharks (Estrada et al., 2006; Kerr et al., 2006), as there is no clear association with δ13C values that might imply a habitat shift. Such a step increase in δ15N values was, however, only observed in individuals from the Northwest Atlantic (Supplementary Figures 4M–O), possibly suggesting a delay in trophic shift in the Northeast Atlantic population, movement across larger nitrogen isoscapes in the eastern part of the basin, and/or differences in age estimation models not accounted for here.
In summary, bulk protein profiles in blue sharks may be interpreted as suggesting common ontogenetic changes in space use, toward greater use of oceanic and warmer waters with increasing age. For porbeagle sharks, a lack of clear, consistent, isotopic patterns, and a relatively small increase in δ13C values, would likely imply no strong, common ontogenetic trend in space use, and potentially location- and population-specific variations in life-history movements.
Testing Inferences With Essential Amino Acids
Essential amino acids can only be synthesized by primary producers and bacteria, and must be acquired by consumers directly through the diet. Variations in bulk tissue isotope values reflecting horizontal movements should therefore be replicated consistently in the δ13C values of essential amino acids, without confounding influences from trophic discrimination and physiology (Reeds, 2000; McMahon et al., 2010).
In blue sharks, at least a component of the positive ontogenetic trend in bulk protein δ13C values was matched by a common ontogenetic pattern of increasing δ13C values of essential amino acids (Figure 5A). Inferences drawn from bulk protein δ13C values are therefore supported by patterns in δ13C values of essential amino acids. That is, the ontogenetic increase in bulk protein δ13C values observed in these sharks during juvenile and early adult growth can be explained by progressively increased dependence on resources from waters characterized by more positive δ13C baselines (e.g., warmer waters). The interpretation of a life-history migration to southern waters is consistent with results from satellite-tagging studies in the eastern North Atlantic, which indicate that juvenile and subadult blue sharks conduct seasonal movements between temperate and subtropical waters (Queiroz et al., 2010; Vandeperre et al., 2014; see also Campana et al., 2011), whereas adult sharks undertake a directional migration to tropical waters possibly associated with parturition and pupping (Vandeperre et al., 2014, 2016; Coelho et al., 2018).
Maternal δ13C values of essential amino acids were higher than post-partum values and comparable to adult levels (Figure 5A) as seen in bulk protein δ13C values, indicating that pupping might occur in isotopically distinct areas with more negative δ13C baselines than those used by the mothers while provisioning eggs and by adult sharks. Adult δ13C values of essential amino acids approached maternal levels by ∼5–6 years of age, which approximately corresponds to the onset of maturity in blue sharks (Pratt, 1979; Skomal and Natanson, 2003).
In stark contrast to observations in blue sharks and bulk collagen values, δ13C values of essential amino acids in porbeagles, expressed as life history-normalized PC1EAA scores, decreased during juvenile growth until an age of ∼6–7 years (Figure 5C). Assuming that essential amino acids reflect baseline conditions, this trend implies a common trend of increasing assimilation of carbon from prey with low δ13C values (e.g., resources from offshore and/or colder waters), as the sharks grow. The interpretation of porbeagle isotopic life-histories based on bulk protein and essential amino acid δ13C values are therefore difficult to reconcile. Porbeagles are believed to conduct an ontogenetic habitat shift from shelf to shelf-edge and oceanic environments (Bendall et al., 2013; Ellis and Bendall, 2015; Ellis et al., 2015; Biais et al., 2017), and have been shown to conduct extensive latitudinal migrations (Pade et al., 2009; Saunders et al., 2011; Biais et al., 2017). Contrasting patterns in bulk protein and essential amino acid δ13C values could be possibly reconciled by an increasing trophic level, if trophic level increased sufficiently to raise δ13C values to counteract the decrease in δ13C values of essential amino acids. However, this was not supported by the trend in bulk collagen δ15N values, which would be expected to be more sensitive to changes in trophic level. Satellite-tag data are therefore consistent with the interpretations based on patterns in essential amino acid δ13C values (Figure 5C), not with those based on bulk protein δ13C values.
Pre-partum δ13C values reflected carbon assimilation during maternal provision and represented the highest values that were found across life-history (Figure 5C). This pattern suggests that pregnant female porbeagles may exploit isotopically distinct (more positive) foraging grounds compared to those used by subadult and adult sharks and is consistent with the observation of a directional movement to subtropical waters by tagged mature (presumably pregnant) females in the Northwest Atlantic (Campana et al., 2010; see also Natanson et al., 2019).
Additional Inferences Drawn From Non-essential Amino Acids
Ontogenetic profiles in PC1 scores for δ13C values of non-essential amino acids in blue sharks also showed a common increase (Figure 5B), consistent with a baseline effect expressed in both essential and non-essential amino acids. As all non-essential amino acids are influenced by baseline effects, the isotopic spacing in δ13C values between glycolytic and Krebs cycle amino acids to some extent controls for the baseline influence (assuming that the rate of incorporation of newly ingested carbon is consistent between the two amino acids). For blue sharks, observed ontogenetic patterns in life history-normalized isotopic spacing varied among individuals resulting in no clear common trend (Figures 6A,B and Supplementary Figures 16A–I). This pattern also suggests that the common signal seen in bulk protein δ13C values in blue sharks is largely controlled by baseline spatial influences rather than dietary and/or physiological effects.
Ontogenetic trends in life history-normalized PC1 scores for δ13C values of non-essential amino acids in porbeagles are unclear (Figure 6D) but ontogenetic profiles of normalized spacing in δ13C values between glycolytic and Krebs cycle amino acids show consistent, systematic trends with a strong increase after birth, followed by U-shaped patterns throughout juvenile growth (Figures 6C,D and Supplementary Figures 16J–O). The biochemical or nutritional mechanisms underpinning differences in isotopic spacing between non-essential amino acids remain uncertain. However, the presence of systematic trends in isotopic spacing between amino acids assumed to be responsive to differences in macronutrient (lipid and protein) assimilation and use (Wolf et al., 2015; Wang et al., 2018, 2019) implies that amino acid isotope data hold information associated with individual nutrition, and that bulk protein δ13C values may be very difficult to interpret reliably.
Therefore, we suggest that in porbeagles relatively minor isotopic variability associated with ontogenetic transitions between juvenile foraging in more coastal, shelf waters and greater dependence on cooler, offshore and slope environments in adult stages are masked in bulk protein δ13C values by individual variation and by physiological influences potentially associated with differential use of lipid and protein macronutrients. In contrast, common ontogenetic movement transitions across latitudinal gradients in δ13C values in blue sharks are large enough to be clearly expressed in bulk protein δ13C values and overwhelm any shared ontogenetic trends in macronutrient use.
Conclusion
SIA can provide a useful complement to satellite archival tags to study the movements of pelagic sharks throughout their lives. However, bulk tissue isotopic signals are often confounded by mixed baseline, trophic and physiological effects. Compound-specific analyses of individual amino acids may be required to disentangle these effects, aiding interpretations of bulk tissue isotope data to infer migration histories.
In this study we analyzed an average of 22 samples from each shark. Assuming that the cost of bulk isotope analysis is $10 per sample, high-resolution analysis of an individual costs $160–280. The cost of compound-specific isotope analysis is approximately 10 times that of traditional bulk analysis, and resources and expertise associated with sample preparation and analysis are significantly greater. Additionally, compound-specific analysis requires more sample material, resulting in decreased temporal resolution for longitudinal ecological information. A cost- and time-effective combination of bulk and compound-specific SIA, whereby individual amino acid analyses are used to test hypotheses generated from high-resolution or multiple-individual studies of bulk tissue analyses, may represent an acceptable compromise to complement tag-derived movement information.
Despite the small number of individuals examined here, and large among-individual variability in isotopic profiles, we found evidence of common, broad ontogenetic isotope patterns in blue sharks. Such isotopic life-histories appeared to be somewhat associated with ontogenetic movement across isotopically distinct baselines, despite additional influences from trophic and physiological effects. Given the large intra- and inter-individual isotopic variability we observed, these findings should, of course, be tested by increasing the sample size but, if verified, could imply a shared vulnerability of each species across life-history to fishery capture. Furthermore, comparisons of maternal and post-partum δ13C values provided information on transgenerational movements and suggested that blue sharks and porbeagles might adopt different strategies for parturition and pupping, based on the analyzed individuals of each species.
Our study contributes to a growing body of work illustrating the biochemical complexity that can underpin variations in bulk tissue stable isotope compositions. Inferences drawn from bulk tissue isotope data may be relatively robust in situations where the behavior of the animal results in a consistent change in the isotopic composition of all or many macronutrients, such as a directed migration across large spatial isotopic gradients. In such cases, isotopic variation in ingested nutrients is pervasively expressed during metabolic processing, and is likely to overwhelm superimposed isotopic variation associated with more subtle changes in metabolic routing. However, where variance in bulk isotope compositions is more closely related to variations in macronutrient processing and associated biochemical routing of metabolites, high levels of among- and within-individual variation are likely to significantly complicate interpretation of bulk tissue δ13C values. In the case of porbeagles studied here, it is possible that apparent population-specific trends in bulk collagen δ13C values were spurious co-incidences. Attempts to interpret such trends to infer aspects of life-history ecology are therefore dangerous. We suggest that single amino acid analyses offers one of the few options to test such inferences independently.
Future research should explore how spatio-temporal variation in isotopic baselines, migration and tissue isotopic discrimination interact to influence tissue isotopic compositions in pelagic sharks. Such space-time isotope dynamics can be explored using a simulation modeling framework combining isoscape models, agent-based models of behavior and movement, and physiology-biochemistry models (e.g., Carpenter-Kling et al., 2019; Trueman et al., 2019; Magozzi et al., 2020). Furthermore, additional controlled-feeding experiments such as those by Wang et al. (2019) are required to better constrain trophic and physiological influences on δ13C values of non-essential amino acids.
Data Availability Statement
The original contributions presented in the study are included in the article/Supplementary Material, further inquiries can be directed to the corresponding author.
Ethics Statement
Ethical review and approval was not required for the animal study because the study examined vertebral samples from dead sharks that were bycaught by longline fisheries primarily targeting tuna and swordfish.
Author Contributions
SM led the research and wrote the manuscript. VB, SH, GM, LN, NQ, and MS provided the shark vertebral samples. LH provided advice on sample preparation and compound-specific isotope analysis. CT and ST advised on data analysis and interpretation. All authors contributed critically to the manuscript drafts and gave final approval for publication.
Funding
The internship of SM at the Woods Hole Oceanographic Institution was funded by the School of Ocean and Earth Science at University of Southampton. Stable isotope analyses were paid by CT and ST research budgets and SM Ph.D. and placement funding.
Conflict of Interest
The authors declare that the research was conducted in the absence of any commercial or financial relationships that could be construed as a potential conflict of interest.
Publisher’s Note
All claims expressed in this article are solely those of the authors and do not necessarily represent those of their affiliated organizations, or those of the publisher, the editors and the reviewers. Any product that may be evaluated in this article, or claim that may be made by its manufacturer, is not guaranteed or endorsed by the publisher.
Acknowledgments
We would like to thank the School of Ocean and Earth Science at University of Southampton for supporting the participation of SM to the Woods Hole Exchange Program; during such exchange program SM prepared and analyzed shark vertebral samples for isotopes in individual amino acids. We would also like to thank Greg Skomal for sharing knowledge on blue shark and porbeagle ecology and providing advice on sample collection.
Supplementary Material
The Supplementary Material for this article can be found online at: https://www.frontiersin.org/articles/10.3389/fmars.2021.673016/full#supplementary-material
References
Bendall, V. J., Ellis, J. R., Hetherington, S. J., McCully, S. R., Righton, D., and Silva, J. F. (2013). Preliminary observations on the biology and movements of porbeagle Lamna nasus around the British Isles. Collect. Vol. Sci. Pap. 69, 1702–1722.
Berg, J. M., Stryer, L., Tymoczko, J. L., and Gatto, G. J. (2015). Biochemistry, 8th Edn. New York, NY: W. H. Freeman and Company.
Best, P. B., and Schell, D. M. (1996). Stable isotopes in southern right whale (Eubalaena australis) baleen as indicators of seasonal movements, feeding and growth. Mar. Biol. 124, 483–494. doi: 10.1007/bf00351030
Biais, G., Coupeau, Y., Seret, B., Calmettes, B., Lopez, R., Hetherington, S., et al. (2017). Return migration of porbeagle shark (Lamna nasus) in the Northeast Atlantic: implications for stock range and structure. ICES J. Mar. Sci. 74, 1268–1276. doi: 10.1093/icesjms/fsw233
Bird, C. S., Verissimo, A., Magozzi, S., Abrantes, K. G., Aguilar, A., Al-Reasi, H., et al. (2018). A global perspective on the trophic geography of sharks. Nat. Ecol. Evol. 2, 299–305.
Boecklen, W. J., Yarnes, C. T., Cook, B. A., and James, A. C. (2011). On the use of stable isotopes in trophic ecology. Annu. Rev. Ecol. Evol. Syst. 42, 411–440.
Bowyer, J. N., Qin, J. G., and Stone, D. A. (2013). Protein, lipid and energy requirements of cultured marine fish in cold, temperate, and warm water. Rev. Aquacult. 5, 10–32. doi: 10.1111/j.1753-5131.2012.01078.x
Briscoe, D. K., Maxwell, S. M., Kudela, R., Crowder, L. B., and Croll, D. (2016). Are we missing important areas in pelagic marine conservation? Redefining conservation hotspots in the ocean. Endanger. Species Res. 29, 229–237. doi: 10.3354/esr00710
Campana, S. E., Dorey, A., Fowler, M., Joyce, W., Wang, Z., Wright, D., et al. (2011). Migration pathways, behavioural thermoregulation and overwintering grounds of blue sharks in the Northwest Atlantic. PLoS One 6:e16854. doi: 10.1371/journal.pone.0016854
Campana, S. E., Joyce, W. N., and Fowler, M. (2010). Subtropical pupping ground for a cold-water shark. Can. J. Fish. Aquat. Sci. 67, 769–773. doi: 10.1139/f10-020
Carlisle, A. B., Goldman, K. J., Litvin, S. Y., Madigan, D. J., Bigman, J. S., Switherbank, A. M., et al. (2015). Stable isotope analysis of vertebrae reveals ontogenetic changes in habitat in an endothermic pelagic shark. Proc. R. Soc. B Biol. Sci. 282:20141446. doi: 10.1098/rspb.2014.1446
Carpenter-Kling, T., Pistorius, P., Connan, M., Reisinger, R., Magozzi, S., and Trueman, C. N. (2019). Sensitivity of δ13C values of seabird tissues to combined spatial, temporal and ecological drivers: a simulation approach. J. Exp. Mar. Biol. Ecol. 512, 12–21. doi: 10.1016/j.jembe.2018.12.007
Cherel, Y., Kernaleguen, L., Richard, P., and Guinet, C. (2009). Whisker isotopic signature depicts migration patterns and multi-year intra- and inter-individual foraging strategies in fur seals. Biol. Lett. 5, 830–832. doi: 10.1098/rsbl.2009.0552
Chikaraishi, Y., Ogawa, N. O., Kashiyama, Y., Takano, Y., Suga, H., Tomitani, A., et al. (2009). Determination of aquatic food-web structure based on compound-specific nitrogen isotopic composition of amino acids. Limnol. Oceanogr. 7, 740–750. doi: 10.4319/lom.2009.7.740
Chikaraishi, Y., Steffan, S. A., Ogawa, N. O., Ishikawa, N. F., Sasaki, Y., Tsuchiya, M., et al. (2014). High-resolution food webs based on nitrogen isotopic composition of amino acids. Ecol. Evol. 4, 2423–2449. doi: 10.1002/ece3.1103
Choy, K., Smith, C. I., Fuller, B. T., and Richards, M. P. (2010). Investigation of amino acid δ13C signatures in bone collagen to reconstruct human palaeodiets using liquid chromatography-isotope ratio mass spectrometry. Geochim. Cosmochim. Acta 74, 6093–6111. doi: 10.1016/j.gca.2010.07.025
Christiansen, H. M., Hussey, N. E., Wintner, S. P., Cliff, G., Dudley, S. F. J., and Fisk, A. T. (2014). Effect of sample preparation techniques for carbon and nitrogen stable isotope analysis of hydroxyapatite structures in the form of elasmobranch vertebral centra. Rapid Commun. Mass Spectrom. 28, 448–456. doi: 10.1002/rcm.6801
Coelho, R., Macías, D., Ortiz De Urbina, J., Martins, A., Monteiro, C., Lino, P. G., et al. (2020). Local indicators for global species: pelagic sharks in the tropical northeast Atlantic, Cabo Verde islands region. Ecol. Indic. 110:105942. doi: 10.1016/j.ecolind.2019.105942
Coelho, R., Mejuto, J., Domingo, A., Yokawa, K., Kwang-Ming, L., Cortés, E., et al. (2018). Distribution patterns and population structure of blue shark (Prionace glauca) in the Atlantic and Indian Oceans. Fish Fish. 19, 90–106.
Costa, D. P., Breed, G. A., and Robinson, P. W. (2012). New insights into pelagic migrations: implications for ecology and conservation. Annu. Rev. Ecol. Evol. Syst. 43, 73–96. doi: 10.1146/annurev-ecolsys-102710-145045
DeNiro, M. J., and Epstein, S. (1978). Influence of diet on distribution of carbon isotopes in animals. Geochim. Cosmochim. Acta 42, 495–506. doi: 10.1016/0016-7037(78)90199-0
DeNiro, M. J., and Epstein, S. (1981). Influence of diet on the distribution of nitrogen isotopes in animals. Geochim. Cosmochim. Acta 45, 341–351. doi: 10.1016/0016-7037(81)90244-1
Ellis, J. R., and Bendall, V. A. (2015). Preliminary Estimates of Bycatch Rates of Porbeagle Shark Lamna Nasus in Gillnet Fisheries in the Celtic Sea (ICES Divisions VIIf-h) and Associated Biological Observations. Lisbon: WGEF.
Ellis, J. R., Bendall, V. J., Hetherington, S. J., Silva, J. F., and McCully Phillips, S. R. (2015). National Evaluation of Populations of Threatened and Uncertain Elasmobranchs (NEPTUNE). Lowestoft: CEFAS.
Estrada, J. A., Rice, A. N., Natanson, L. J., and Skomal, G. B. (2006). Use of isotopic analysis of vertebrae in reconstructing ontogenetic feeding ecology in white sharks. Ecology 87, 829–834. doi: 10.1890/0012-9658(2006)87[829:uoiaov]2.0.co;2
Fernandes, R., Nadeau, M.-J., and Grootes, P. M. (2012). Macronutrient-based model for dietary carbon routing in bone collagen and bioapatite. Archaeol. Anthropol. Sci. 4, 291–301. doi: 10.1007/s12520-012-0102-7
Graham, B. S., Koch, P. L., Newsome, S. D., McMahon, K. W., and Aurioles, D. (2010). “). Using isoscapes to trace the movements and foraging behavior of top predators in oceanic ecosystems,” in Isoscapes: Understanding Movement, Pattern, and Process on Earth through Isotope Mapping, eds J. B. West, G. J. Bowen, T. E. Dawson, and K. P. Tu (Berlin: Springer).
Hare, P. E., Fogel, M. L., Stafford, T. W., Mitchell, A. D., and Hoering, T. C. (1991). The isotopic composition of carbon and nitrogen in individual amino acids isolated from modern and fossil proteins. J. Archaeol. Sci. 18, 277–292. doi: 10.1016/0305-4403(91)90066-x
Hayes, J. M. (2001). Fractionation of carbon and hydrogen isotopes in biosynthetic processes. Rev. Mineral. Geochem. 43, 225–277. doi: 10.1515/9781501508745-006
Hobson, K. A. (1999). Tracing origins and migration of wildlife using stable isotopes: a review. Oecologia 120, 314–326. doi: 10.1007/s004420050865
Howland, M. R., Corr, L. T., Young, S. M. M., Jones, V., Jim, S., van der Merwe, N. J., et al. (2003). Expression of the dietary isotope signal in the compound-specific δ13C values of pig bone lipids and amino acids. Int. J. Osteoarchaeol. 13, 54–65. doi: 10.1002/oa.658
Hussey, N. E., MacNeil, M. A., Olin, J. A., McMeans, B. C., Kinney, M. J., Chapman, D. D., et al. (2012). Stable isotopes and elasmobranchs: tissue types, methods, applications and assumptions. J. Fish Biol. 80, 1449–1484. doi: 10.1111/j.1095-8649.2012.03251.x
Jim, S., Jones, V., Ambrose, S. H., and Evershed, R. P. (2006). Quantifying dietary macronutrient sources of carbon for bone collagen biosynthesis using natural abundance stable carbon isotope analysis. Br. J. Nutr. 95, 1055–1062. doi: 10.1079/bjn20051685
Kerr, L. A., Andrews, A. H., Cailliet, G. M., Brown, T. A., and Coale, K. H. (2006). Investigations of Δ14C, δ13C, and δ15N in vertebrae of white shark (Carcharodon carcharias) from the eastern North Pacific Ocean. Environ. Biol. Fishes 77, 337–353. doi: 10.1007/s10641-006-9125-1
Kim, S. L., and Koch, P. L. (2012). Methods to collect, preserve, and prepare elasmobranch tissues for stable isotope analysis. Environ. Biol. Fishes 95, 53–63. doi: 10.1007/s10641-011-9860-9
Larsen, T., Taylor, D. L., Leigh, M. B., and O’Brien, D. M. (2009). Stable isotope fingerprinting: a novel method for identifying plant, fungal, or bacterial origins of amino acids. Ecology 90, 3526–3535. doi: 10.1890/08-1695.1
Larsen, T., Ventura, M., Andersen, N., O’Brien, D. M., Piatkowski, U., and McCarthy, M. D. (2013). Tracing carbon sources through aquatic and terrestrial food webs using amino acid stable isotope fingerprinting. PLoS One 8:e73441. doi: 10.1371/journal.pone.0073441
Leigh, S. C., Papastamatiou, Y. P., and German, D. P. (2018). Seagrass digestion by a notorious ‘carnivore’. Proc. R. Soc. B Biol. Sci. 285:20181583. doi: 10.1098/rspb.2018.1583
Lorrain, A., Graham, B., Menard, F., Popp, B., Bouillon, S., van Breugel, P., et al. (2009). Nitrogen and carbon isotope values of individual amino acids: a tool to study foraging ecology of penguins in the Southern Ocean. Mar. Ecol. Prog. Ser. 391, 293–306. doi: 10.3354/meps08215
Lorrain, A., Pethybridge, H., Cassar, N., Receveur, A., Allain, V., Bodin, N., et al. (2020). Trends in tuna carbon isotopes suggest global changes in pelagic phytoplankton communities. Glob. Chang. Biol. 26, 458–470. doi: 10.1111/gcb.14858
MacNeill, M. A., Skomal, G. B., and Fisk, A. T. (2005). Stable isotopes from multiple tissues reveal diet switching in sharks. Mar. Ecol. Prog. Ser. 302, 199–206. doi: 10.3354/meps302199
Magozzi, S. (2017). Reconstructing Ontogenetic Movements in Pelagic Sharks Coupling Ocean Models and Stable Isotope Data in Incrementally Grown Tissues. Ph. D. thesis. Southampton: University of Southampton.
Magozzi, S., Vander Zanden, H. B., Wunder, M. B., and Trueman, C. N. (2017). Using ocean models to predict spatial and temporal variation in marine carbon isotopes. Ecosphere 8:e01763.
Magozzi, S., Vander Zanden, H. B., Wunder, M. B., Trueman, C. N., Pinney, K., Peers, D., et al. (2020). Combining models of environment, behavior and physiology to predict tissue hydrogen and oxygen isotope variance among individual terrestrial animals. Front. Ecol. Evol. 8:536109. doi: 10.3389/fevo.2020.536109
McCarthy, M. D., Lehman, J., and Kudela, R. (2013). Compound-specific amino acid δ15N patterns in marine algae: tracer potential for cyanobacterial vs. eukaryotic organic nitrogen sources in the ocean. Geochim. Cosmochim. Acta 103, 104–120. doi: 10.1016/j.gca.2012.10.037
McMahon, K. W., Berumen, M. L., Mateo, I., Elsdon, T. S., and Thorrold, S. R. (2011a). Carbon isotopes in otolith amino acids identify residency of juvenile snapper (Family: Lutjanidae) in coastal nurseries. Coral Reefs 30, 1135–1145. doi: 10.1007/s00338-011-0816-5
McMahon, K. W., Fogel, M. L., Elsdon, T. S., and Thorrold, S. R. (2010). Carbon isotope fractionation of amino acids in fish muscle reflects biosynthesis and isotopic routing from dietary protein. J. Anim. Ecol. 79, 1132–1141. doi: 10.1111/j.1365-2656.2010.01722.x
McMahon, K. W., Fogel, M. L., Johnson, B. J., Houghton, L. A., and Thorrold, S. R. (2011b). A new method to reconstruct fish diet and movement patterns from δ13C values in otolith amino acids. Can. J. Fish. Aquat. Sci. 68, 1330–1340. doi: 10.1139/f2011-070
McMahon, K. W., Hamady, L. L., and Thorrold, S. R. (2013). A review of ecogeochemistry approaches to estimating movements of marine animals. Limnol. Oceanogr. 58, 697–714. doi: 10.4319/lo.2013.58.2.0697
McMahon, K. W., McCarthy, M. D., Sherwood, O. A., Larsen, T., and Guilderson, T. P. (2015a). Millennial- scale plankton regime shifts in the subtropical North Pacific Ocean. Science 350, 1530–1533. doi: 10.1126/science.aaa9942
McMahon, K. W., Polito, M. J., Abel, S., McCarthy, M. D., and Thorrold, S. R. (2015b). Carbon and nitrogen isotope fractionation of amino acids in an avian marine predator, the gentoo penguin (Pygoscelis papua). Ecol. Evol. 5, 1278–1290. doi: 10.1002/ece3.1437
Miller, T. W., Brodeur, R. D., and Rau, G. H. (2008). Carbon stable isotopes reveal relative contribution of shelf-slope production to the Northern California Current pelagic community. Limnol. Oceanogr. 53, 1493–1503. doi: 10.4319/lo.2008.53.4.1493
Natanson, L. J., Deacy, B. M., Joyce, W., and Sulikowski, J. (2019). Presence of a resting population of female porbeagles (Lamna nasus), indicating a biennial reproductive cycle, in the western North Atlantic. Fish. Bull. 117, 70–77. doi: 10.7755/fb.117.1-2.8
Natanson, L. J., Mello, J. J., and Campana, S. E. (2002). Validated age and growth of the porbeagle shark, Lamna nasus, in the western North Atlantic Ocean. Collect. Vol. Sci. Pap. ICCAT 54, 1261–1279.
Newsome, S. D., Clementz, M. T., and Koch, P. L. (2010). Using stable isotope biogeochemistry to study marine mammal ecology. Mar. Mamm. Sci. 26, 509–572.
Newsome, S. D., Etnier, M. A., Monson, D. H., and Fogel, M. L. (2009). Retrospective characterization of ontogenetic shifts in killer whale diets via δ13C and δ15N analysis of teeth. Mar. Ecol. Prog. Ser. 374, 229–242. doi: 10.3354/meps07747
Newsome, S. D., Fogel, M. L., Kelly, L., and Martinez del Rio, C. (2011). Contribution of direct incorporation from diet and microbial amino acids to protein synthesis in Nile tilapia. Funct. Ecol. 25, 1051–1062. doi: 10.1111/j.1365-2435.2011.01866.x
Newsome, S. D., Wolf, N., Peters, J., and Fogel, M. L. (2014). Amino acid δ13C analysis shows flexibility in the routing of dietary protein and lipids to the tissue of an omnivore. Integr. Comp. Biol. 54, 890–902. doi: 10.1093/icb/icu106
O’Learly, M. H. (1981). Carbon isotope fractionation in plants. Phytochemistry 20, 553–567. doi: 10.1016/0031-9422(81)85134-5
Pacoureau, N., Rigby, C. L., Kyne, P. M., Sherley, R. B., Winker, H., Carlson, J. K., et al. (2021). Half a century of global decline in oceanic sharks and rays. Nature 598, 567–571. doi: 10.1038/s41586-020-03173-9
Pade, N. G., Queiroz, N., Humphries, N. E., Witt, M. J., Jones, C. S., Noble, L. R., et al. (2009). First results from satellite-linked archival tagging of porbeagle shark, Lamna nasus: area fidelity, wider-scale movements and plasticity in diel depth changes. J. Exp. Mar. Biol. Ecol. 370, 64–74. doi: 10.1016/j.jembe.2008.12.002
Pethybridge, H., Choy, C. A., Logan, J. M., Allain, V., Lorrain, A., Bodin, N., et al. (2018). A global meta-analysis of marine predator nitrogen stable isotopes: relationships between trophic structure and environmental conditions. Glob. Ecol. Biogeogr. 27, 1043–1055. doi: 10.1111/geb.12763
Pinheiro, J. C., and Bates, D. M. (2000). Mixed Effect Models in S and S-Plus. New York, NY: Springer.
Popp, B. N., Graham, B. S., Olson, R. J., Hannides, C. C. S., Lott, M. J., Lopez-Ibarra, G. A., et al. (2007). “Insight into the trophic ecology of yellowfin tuna, Thunnus albacares, from compound-specific nitrogen isotope analysis of proteinaceous amino acids,” in Stable Isotopes as Indicators of Ecological Change, eds T. Dawson and R. Siegwolf (Amsterdam: Elsevier).
Post, D. M. (2002). Using stable isotopes to estimate trophic position: models, methods, and assumptions. Ecology 83, 703–718. doi: 10.1890/0012-9658(2002)083[0703:usitet]2.0.co;2
Queiroz, N., Humphries, N. E., Couto, A., Vedor, M., da Costa, I., Sequeira, A. M. M., et al. (2019). Global spatial risk assessment of sharks under the footprint of fisheries. Nature 572, 461–466.
Queiroz, N., Humphries, N. E., Mucientes, G., Hammerschlag, N., Lima, F. P., Scales, K. L., et al. (2016). Ocean-wide tracking of pelagic sharks reveals extent of overlap with longline fishing hotspots. Proc. Natl. Acad. Sci. U.S.A. 113, 1582–1587. doi: 10.1073/pnas.1510090113
Queiroz, N., Humphries, N. E., Noble, L. R., Santos, A. M., and Sims, D. W. (2010). Short-term movements and diving behaviour of satellite-tracked blue sharks Prionace glauca in the northeastern Atlantic Ocean. Mar. Ecol. Prog. Ser. 406, 265–279. doi: 10.3354/meps08500
R Core Team (2019). R: A Language and Environment for Statistical Computing. Vienna: R Foundation for Statistical Computing.
Saunders, R. A., Royer, F., and Clarke, M. W. (2011). Winter migration and diving behaviour of porbeagle shark, Lamna nasus, in the North East Atlantic. ICES J. Mar. Sci. 68, 166–174. doi: 10.1093/icesjms/fsq145
Schmittner, A., and Somes, C. J. (2016). Complementary constraints from carbon (13C) and nitrogen (15N) isotopes on the Glacial Ocean’s soft-tissue biological pump. Paleoceanography 31, 625–913.
Seminoff, J. A., Benson, S. R., Arthur, K. E., Eguchi, T., Dutton, P. H., Tapilatu, R. F., et al. (2012). Stable isotope tracking of endangered sea turtles: validation with satellite telemetry and δ15N analysis of amino acids. PLoS One 7:e37403. doi: 10.1371/journal.pone.0037403
Skomal, G. B., and Natanson, L. J. (2003). Age and growth of the blue shark (Prionace glauca) in the North Atlantic Ocean. Fish. Bull. 101, 627–639.
Trueman, C. N., Jackson, A. L., Chadwick, K. S., Coombs, E. J., Freyer, L. J., Magozzi, S., et al. (2019). Combining simulation modeling and stable isotope analyses to reconstruct the last known movements of one of Nature’s giants. PeerJ 7:e7912. doi: 10.7717/peerj.7912
Trueman, C. N., MacKenzie, K. M., and Palmer, M. R. (2012). Identifying migrations in marine fishes through stable isotope analysis. J. Fish Biol. 81, 826–847. doi: 10.1111/j.1095-8649.2012.03361.x
Trueman, C. N., McGill, R. A. R., and Guyard, P. H. (2005). The effect of growth rate on tissue-diet isotopic spacing in rapidly growing animals. An experimental study with Atlantic salmon (Salmo salar). Rapid Commun. Mass Spectrom. 19, 3239–3247. doi: 10.1002/rcm.2199
Trueman, C. N., and St John Glew, K. (2019). “Isotopic tracking of marine animal movement,” in Tracking Animal Migration with Stable Isotopes, eds K. A. Hobson and L. I. Wassenaar (Cambridge: Academic Press).
Tuross, N., Fogel, M. L., and Hare, P. E. (1988). Variability in the preservation of the isotopic compositions of collagen from fossil bone. Geochim. Cosmochim. Acta 52, 929–935. doi: 10.1016/0016-7037(88)90364-x
Vandeperre, F., Aires-da-Silva, A., Fontes, J., Santos, M., Santos, R. S., and Afonso, P. (2014). Movements of blue sharks (Prionace glauca) across their life history. PLoS One 9:e103538. doi: 10.1371/journal.pone.0103538
Vandeperre, F., Aires-da-Silva, A., Lennert-Cody, C. E., Serrao Santos, R., and Afonso, P. (2016). Essential pelagic habitat of juvenile blue shark (Prionace glauca) inferred from telemetry data. Limnol. Oceanogr. 61, 1605–1625. doi: 10.1002/lno.10321
Wang, Y. V., Wan, A. H. L., Krogdahl, A., Johnson, M., and Larsen, T. (2019). 13C values of glycolytic amino acids as indicators of carbohydrate utilization in carnivorous fish. PeerJ 7:e7701. doi: 10.7717/peerj.7701
Wang, Y. V., Wan, A. H. L., Lock, E.-J., Andersen, N., Winter-Schuh, C., and Larsen, T. (2018). Know your fish: a novel compound-specific isotope approach for tracing wild and farmed salmon. Food Chem. 256, 380–389. doi: 10.1016/j.foodchem.2018.02.095
Whiteman, J. P., Kim, S. L., McMahon, K. W., Koch, P. L., and Newsome, S. D. (2018). Amino acid isotope discrimination factors for a carnivore: physiological insights from leopard sharks and their diet. Oecologia 188, 977–989. doi: 10.1007/s00442-018-4276-2
Wolf, N., Newsome, S. D., Peters, J., and Fogel, M. L. (2015). Variability in the routing of dietary proteins and lipids to consumer tissues influences tissue-specific isotopic discrimination. Rapid Commun. Mass Spectrom. 29, 1448–1456. doi: 10.1002/rcm.7239
Wood, S. N. (2006). Generalized Additive Models: An Introduction with R. Boca Raton, FL: Chapman and Hall/CRC Press.
Worm, B., Davis, B., Kettemer, L., Ward-Paige, C. A., Chapman, D., Heithaus, M. R., et al. (2013). Global catches, exploitation rates, and rebuilding options for sharks. Mar. Policy 40, 194–204. doi: 10.1016/j.marpol.2012.12.034
Keywords: carbon, essential amino acids, non-essential amino acids, migration, diet, routing, blue sharks (Prionace glauca), porbeagles (Lamna nasus)
Citation: Magozzi S, Thorrold SR, Houghton L, Bendall VA, Hetherington S, Mucientes G, Natanson LJ, Queiroz N, Santos MN and Trueman CN (2021) Compound-Specific Stable Isotope Analysis of Amino Acids in Pelagic Shark Vertebrae Reveals Baseline, Trophic, and Physiological Effects on Bulk Protein Isotope Records. Front. Mar. Sci. 8:673016. doi: 10.3389/fmars.2021.673016
Received: 26 February 2021; Accepted: 27 July 2021;
Published: 01 September 2021.
Edited by:
Charlie Huveneers, Flinders University, AustraliaReviewed by:
Lauren C. Meyer, Flinders University, AustraliaAaron Carlisle, University of Delaware, United States
Copyright © 2021 Magozzi, Thorrold, Houghton, Bendall, Hetherington, Mucientes, Natanson, Queiroz, Santos and Trueman. This is an open-access article distributed under the terms of the Creative Commons Attribution License (CC BY). The use, distribution or reproduction in other forums is permitted, provided the original author(s) and the copyright owner(s) are credited and that the original publication in this journal is cited, in accordance with accepted academic practice. No use, distribution or reproduction is permitted which does not comply with these terms.
*Correspondence: Sarah Magozzi, c2FyYWgubWFnb3p6aUBzem4uaXQ=