Abstract
Renewable energy, sustainable seafood, and a healthy marine ecosystem are integral elements of a sustainable blue economy. The rapid global advancement of offshore wind coupled with its potential to affect marine life compels an urgent need for robust methodologies to assess the impacts of this industry on fisheries resource species. Basic Before-After-Control-Impact (BACI) and Control-Impact (CI) designs are the most common experimental designs used to study the effects of offshore wind development on fisheries resources. These designs do not account for spatial heterogeneity which presents a challenge because empirical evidence shows that impact gradients occur at wind farms, with larger effect sizes close to turbine foundations that attenuate with increasing distance. Combining the before-after sampling design with distance-based methods could provide a powerful approach for characterizing both the spatial and temporal variance associated with wind development. Toward enhancing future monitoring designs for fisheries resource species at offshore wind farms, this paper aims to: (1) examine distance-based sampling methods that have been or could potentially be used to study impacts on fisheries resources at offshore wind farms including distance-stratified BACI, distance-stratified CI, Before-After-Gradient (BAG), and After-Gradient (AG) methods; (2) synthesize the methods and findings of studies conducted to date that have used distance-based methods to examine ecological impacts of offshore wind development for benthic macroinvertebrates, finfish, birds, and small mammals; (3) examine some of the central methodological elements and issues to consider in developing distance-based impact studies; and (4) offer recommendations for how to incorporate distance-based sampling methods into monitoring plans at offshore wind farms.
Introduction
Offshore wind is a rapidly advancing industry around the world. Along the Atlantic coast of the United States, there are currently 17 commercial leases (Figure 1), and additional areas on the Pacific coasts of California and Hawaii are being explored for possible development. The potential effects of wind development on marine fisheries resource species (i.e., finfish and shellfish including mollusks and crustaceans), and their habitats have gained major attention because of their ecological and economic importance and because of the implications that these effects may have for fishing communities (Gill et al., 2020; Methratta et al., 2020; Perry and Heyman, 2020). Effects on these taxa may occur through several impact producing factors (IPFs) that occur during each stage of development and that span multiple spatial and temporal scales (Figure 2; Degraer et al., 2019, 2020; Dannheim et al., 2020; Gill et al., 2020; Hutchison et al., 2020; Mooney et al., 2020). Robust methods to detect biological responses to these IPFs are needed in order to inform mitigation practices and fisheries management (Wilding et al., 2017).
FIGURE 1
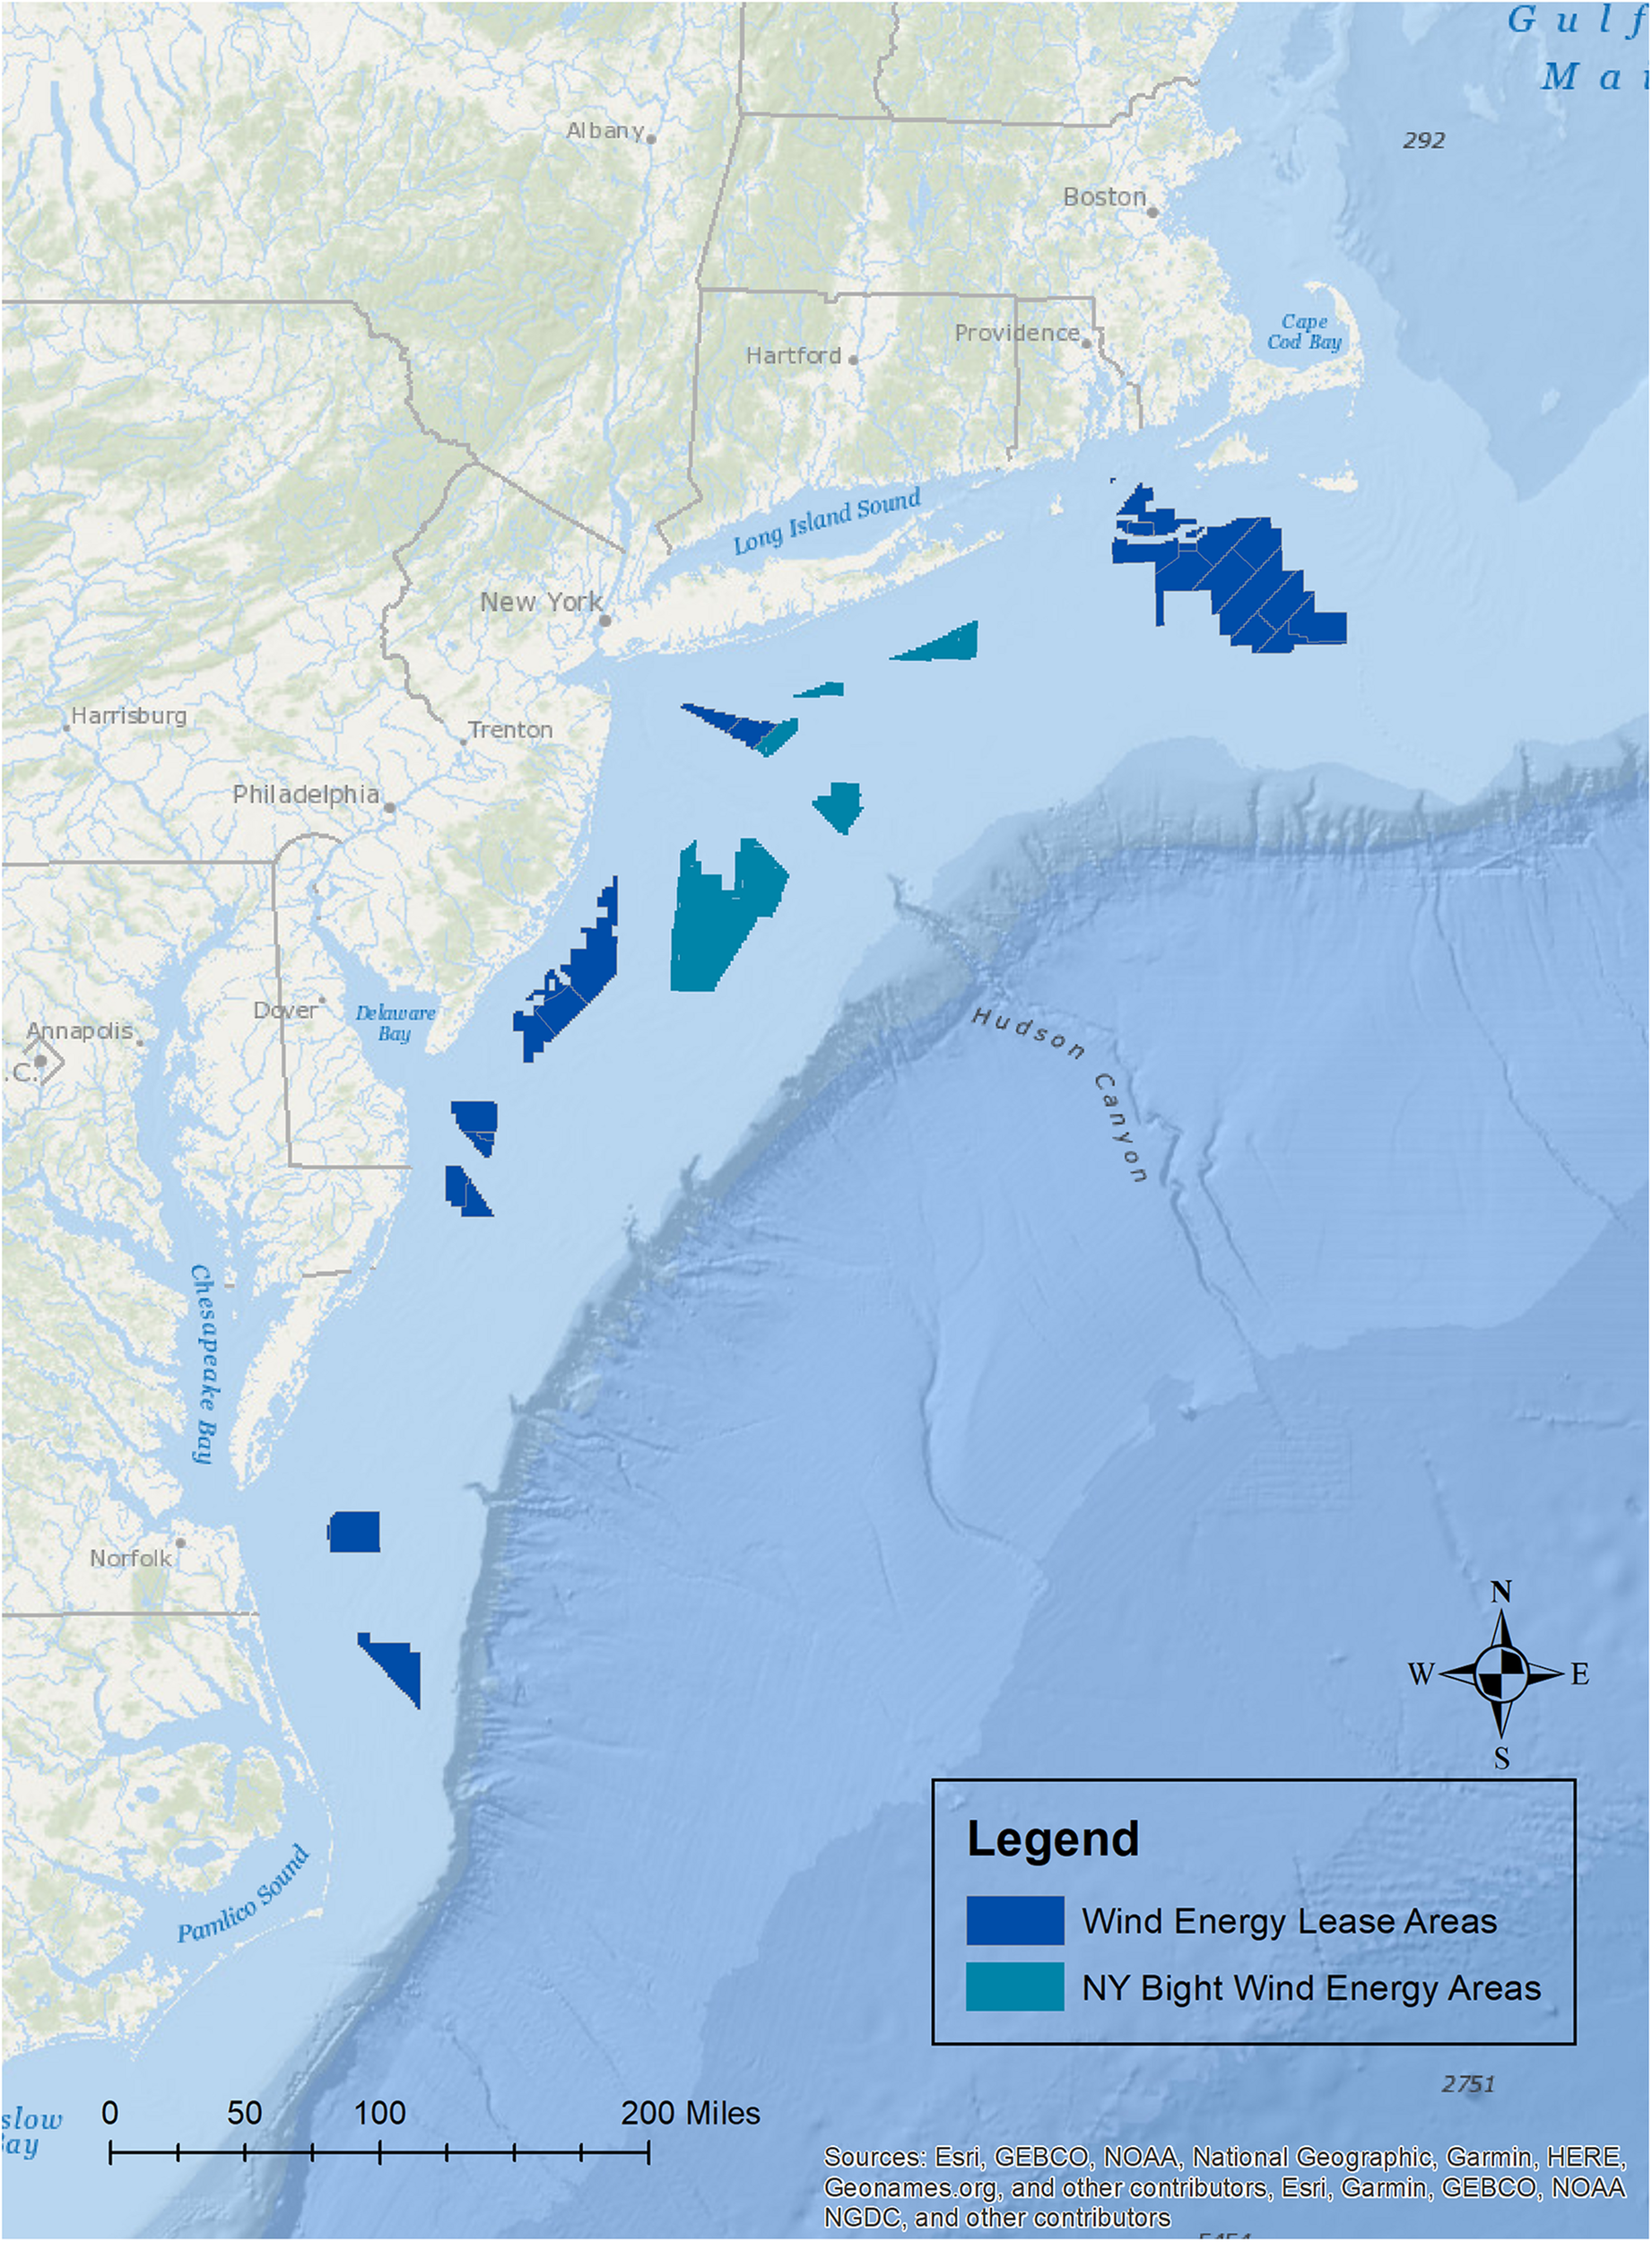
Map of the current offshore wind lease areas off of the Atlantic coast of the United States, and the New York Bight wind energy areas to be leased.
FIGURE 2
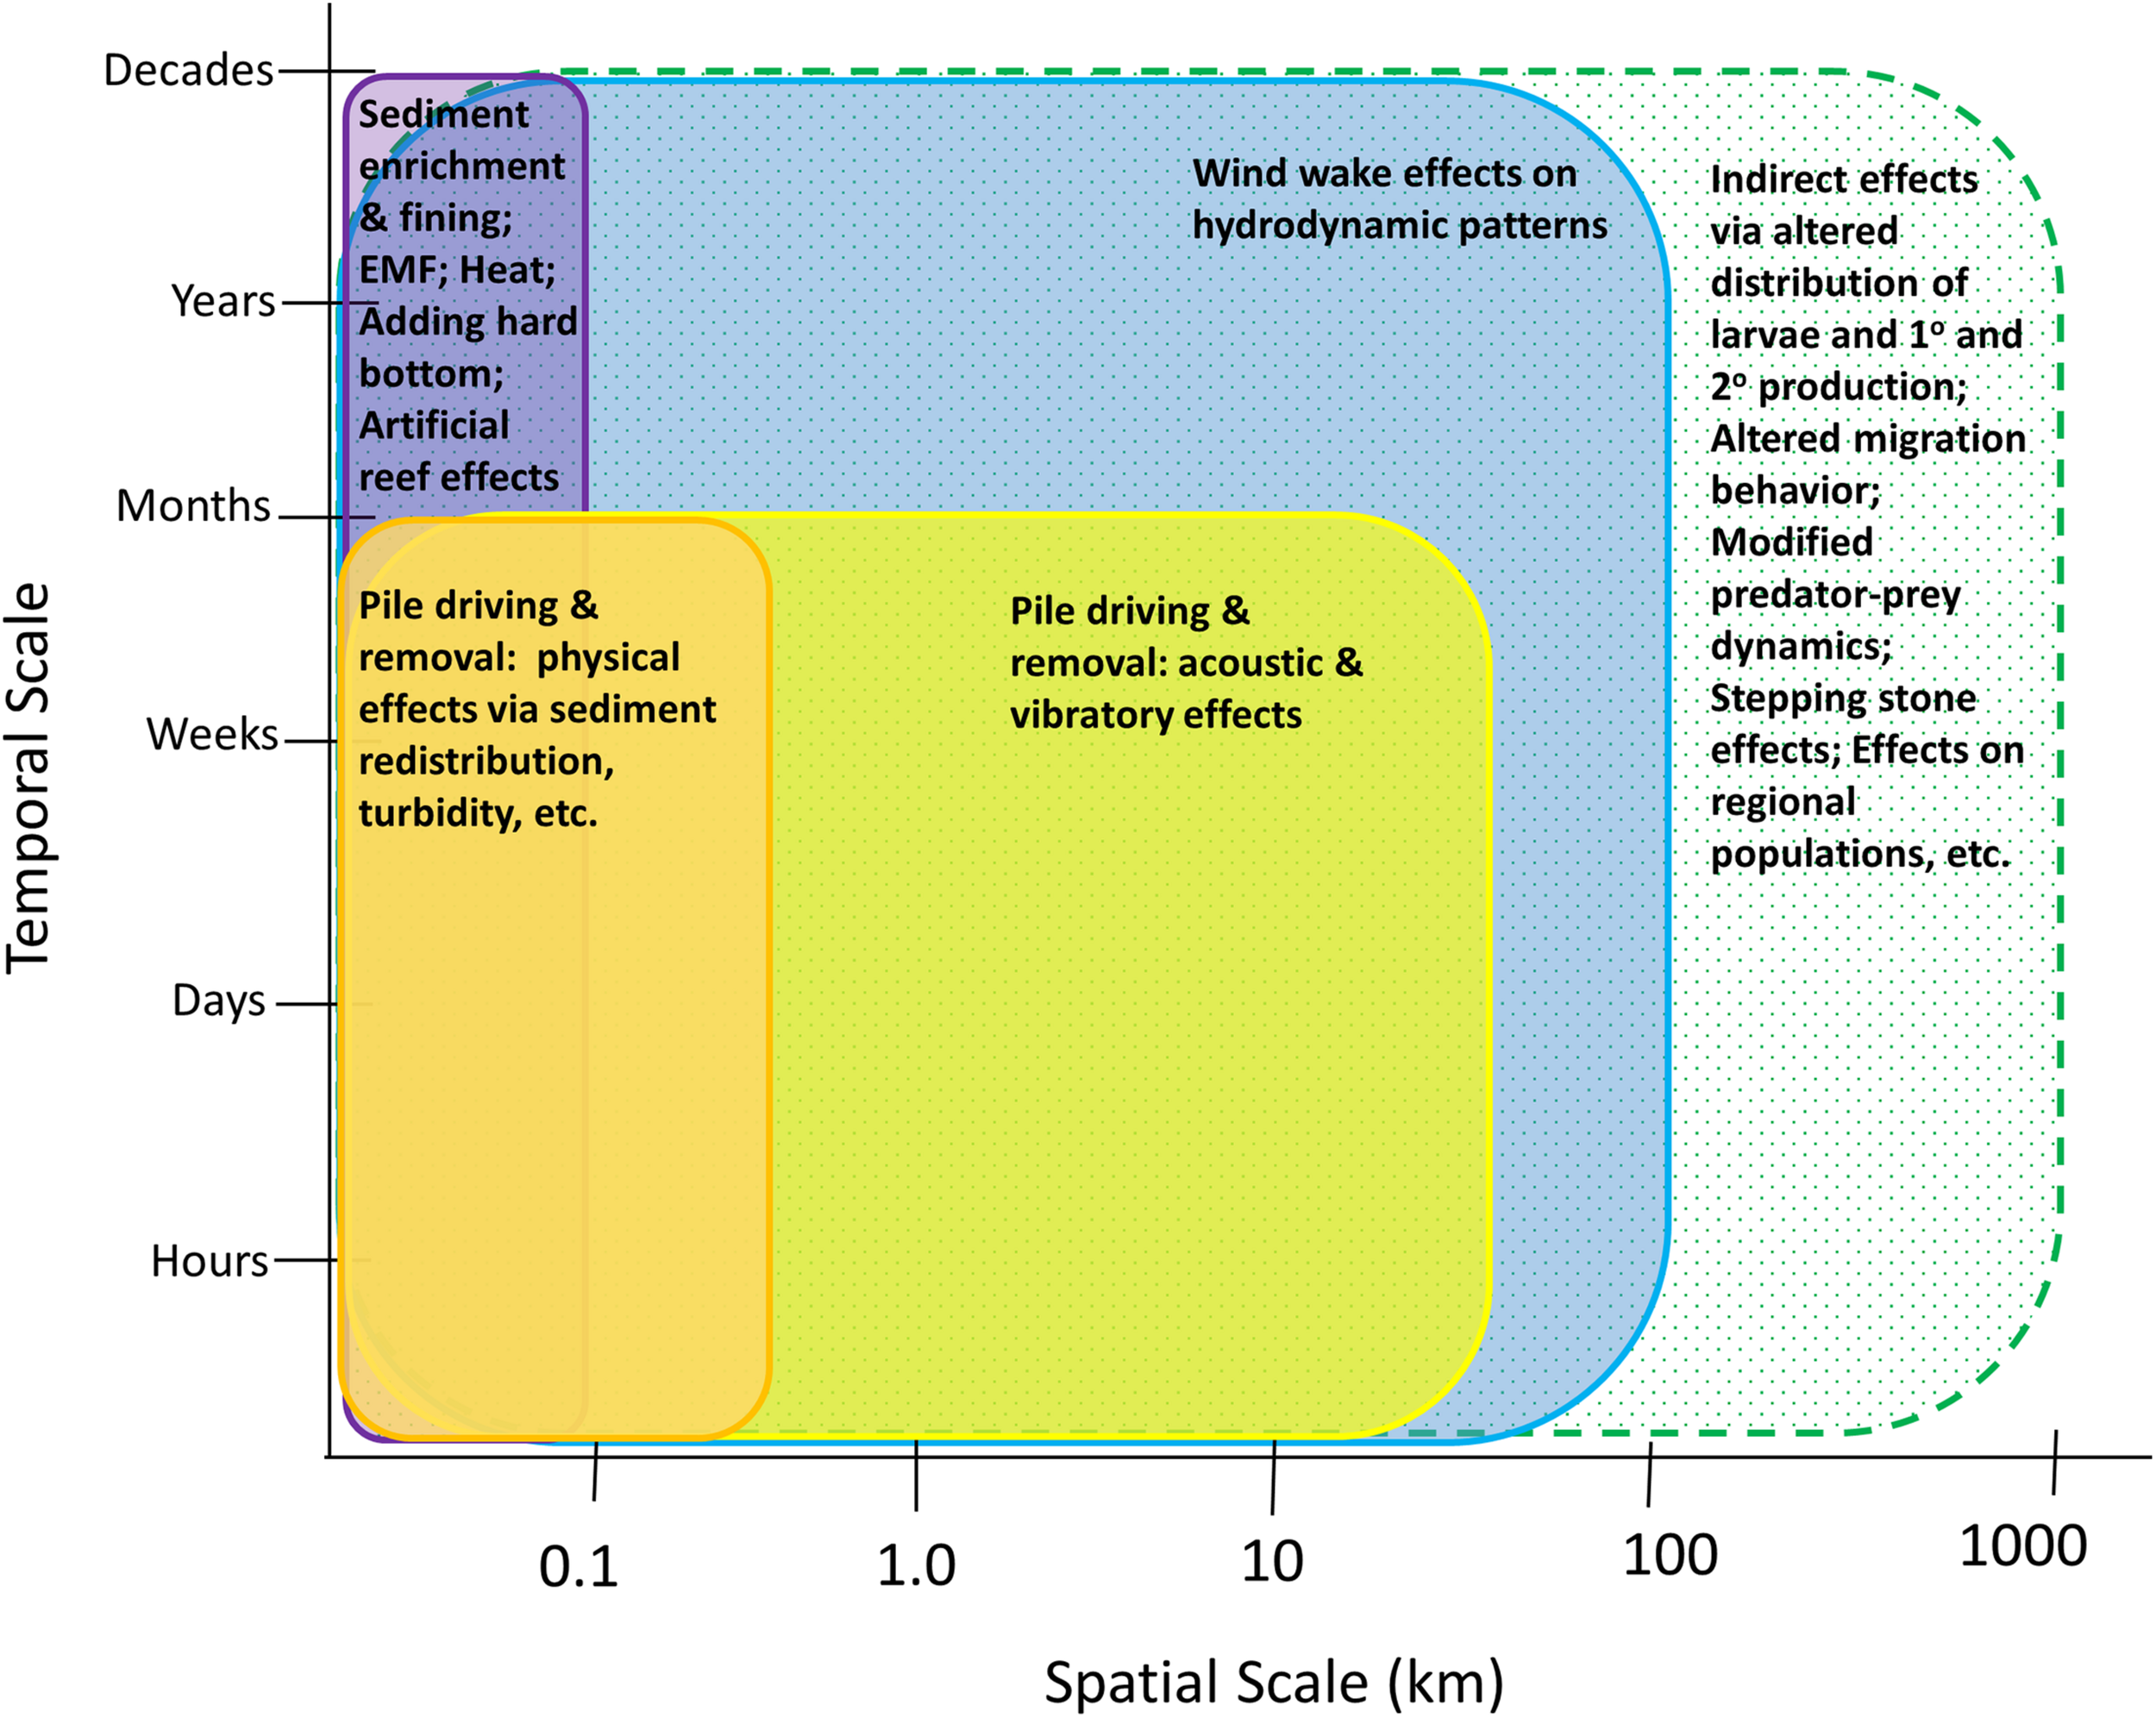
Hypothesized spatial and temporal scales of IPFs that may affect fisheries resource species during the construction and operation phases. Solid bars indicate IPFs and their effects; the hatched bar indicates the potential scales of indirect effects.
Statistically robust monitoring designs are essential for detecting the ecological impacts of anthropogenic development in marine ecosystems (Franco et al., 2015; Van Hoey et al., 2019; Christie et al., 2020). Perhaps the method that has received the most attention and application is the Before-After-Control-Impact or BACI design (Green, 1979) which samples a treatment and control site prior to and after the intervention and then identifies impacts through statistical comparisons of sampling locations and time periods. In marine ecosystems, BACI has proven to be a useful tool in demonstrating effects due to such anthropogenic interventions as sewage spills, aquaculture, and fisheries exclusion (Smith et al., 1999; Aguado-Giménez et al., 2012; Moland et al., 2013).
Basic BACI and Control-Impact (CI; similar to BACI but samples after the intervention only) are the most common experimental designs used to study effects on fisheries resource species at offshore wind farms (OWFs) (Methratta, 2020). Typically sites are selected through a simple random process within the impact and control locations; in some instances sampling stations are kept within a specific environmental envelope to reduce variability among sites (e.g., similar depths or distances from shore). A strength of BACI is its emphasis on baseline data collection which enables comparisons between pre and post-intervention patterns. Although common, BACI and CI studies have generally reported either weak or inconsistent effects of OWFs on fisheries resource species (e.g., Vandendriessche et al., 2015). The limitations of the BACI design in the OWF context (i.e., the assumption of spatial homogeneity, the uncertainly of the scale of OWF effects, and the difficulty in finding suitable controls) (Table 1; Methratta, 2020) have spurred an interest in enhancing or replacing the BACI experimental design (Lindeboom et al., 2015).
TABLE 1
| Methodological issue | Basic BACI | Distance-stratified BACI | Distance-stratified CI | After-gradient (AG) | Before-after-gradient (BAG) |
| Control site selection | − | − | − | + | + |
| Spatial heterogeneity | − | + | + | + | + |
| Spatial scale | − | + | + | + | + |
| Comparison of post-construction to baseline | + | + | − | − | + |
Comparison of pros and cons of the simple BACI design with enhanced sampling methods that include distanced-based sampling.
Plus sign indicates an advantage of the design and a negative sign indicates a challenge of the design.
Distance-based designs, in which samples are collected at relative distances from the OWF structures (Ellis and Schneider, 1997), offer several methodological advantages. Notably, they directly address issues of spatial heterogeneity and scale and can eliminate the need for a control (Table 1). The limited number of distance-based studies that have been conducted for fisheries resource species have revealed spatial gradients in the effects that OWFs have on these species following construction, with larger effect sizes near the structures that attenuate with increasing distance (e.g., Wilhelmsson et al., 2006; Methratta and Dardick, 2019). Lacking baseline information, these studies are unable to compare post-construction patterns with the reference condition, making it difficult to determine with certainty how the intervention interacted with the pre-construction ecosystem to drive the patterns observed. This highlights the need to collect robust baseline data to assess impacts at OWFs.
Impact assessment in aquatic and terrestrial ecosystems has long benefited from distance-based methods (e.g., Whittaker, 1967; Ellis and Schneider, 1997; Buckland et al., 2015). In coastal marine ecosystems, distance-based methods have demonstrated gradients around artificial reefs (e.g., Davis et al., 1982; Reeds et al., 2018), oil and gas platforms (Ellis and Schneider, 1997), and area closures (Harmelin-Vivien et al., 2008) in the distribution, abundance, and diversity of marine organisms. As with OWF investigations, these studies often collect data only after the intervention, focusing primarily on post-intervention spatial variation with less attention paid to pre vs. post intervention changes. Although in some instances post-intervention sampling is the only practicable option because structures are already in place at the time that a monitoring plan is conceived, the absence of “before” data limits the information that can be gained from the study. Combining the before-after sampling design with distance-based methods can provide a powerful approach for characterizing both the spatial and temporal variance associated with OWF development.
Toward enhancing future monitoring designs for fisheries resource species at offshore wind farms, the goals of this paper are to: (1) examine distance-based sampling methods that have been or could potentially be used to study impacts on fisheries resources at OWFs including distance-stratified BACI, distance-stratified CI, Before-After-Gradient (BAG), and After-Gradient (AG) methods; (2) synthesize the methods and findings of studies conducted to date that have used distance-based methods to examine ecological impacts for benthic macroinvertebrates, demersal finfish, birds, and small mammals; (3) examine some of the methodological elements and issues central to developing distance-based impact studies; and (4) offer recommendations for incorporating distance-based sampling methods into monitoring plans at OWFs.
Before-After-Control Impact Design: Overview and Application to Offshore Wind Studies
The Before-After-Control-Impact (BACI) design has been the cornerstone of experimental design in the field of ecological impact assessment for nearly four decades (e.g., Smokorowski and Randall, 2017). In that time, recommendations have been made for sample size selection, statistical analysis, and outcome interpretation (Underwood, 1992, 1994; Stewart-Oaten and Bence, 2001). Some of the central issues surrounding BACI discussed widely in the literature have included pseudoreplication (sensu Hurlbert, 1984), spatial autocorrelation, and temporal autocorrelation, with recommendations made for alternate designs such as paired control-impact sites (Stewart-Oaten et al., 1986), use of random time points (Underwood, 1991), and use of multiple controls (Underwood, 1991, 1992, 1993, 1994). Although no definitive consensus emerged from these papers on the best way to resolve the issues associated with BACI designs, these discussions have provided ecologists with a broader perspective of BACI issues and a larger suite of tools with which to modify the BACI design to answer specific questions in their systems. This is important because BACI remains one of the most popular methodologies in ecological impact assessment.
At OWFs, simple BACI and CI designs are the most common design used to study ecological impacts for fisheries resource species. In general, these studies have sought to examine how a single wind farm affects abundance, biomass, diversity, size, distribution, or community composition. Interactions with wind development, although typically studied as an overarching “wind farm effect,” are in reality an aggregate of multiple IPFs that may be operating in the system during each phase of development (Degraer et al., 2019; Dannheim et al., 2020; Gill et al., 2020; Hutchison et al., 2020; Mooney et al., 2020). Generally, studies using these designs have reported either weak or inconsistent effects for fish species (e.g., Vandendriessche et al., 2015). There are numerous reasons for this including that: the simple BACI design does not explicitly address spatial heterogeneity; the scales of IPFs and their direct and indirect ecological effects are often not known; and it is often difficult to find suitable control locations (Methratta, 2020). That our understanding of wind farm interactions with fisheries resource species remains limited despite more than two decades of offshore wind development worldwide suggests that the approaches used to study these effects need to be enhanced.
Distance-Based Sampling Methods at Offshore Wind Farms
Before-After Designs
Distance-Stratified BACI
A distance-stratified BACI design is similar to a simple BACI design except that the impact area would be spatially stratified with respect to distance from the turbines and sites then randomly selected within these strata. As a before-after design, BACI is able to compare post-construction patterns to baseline conditions and to potentially distinguish impacts from other dynamic factors (e.g., fishing pressure) when data on those factors are available (Christie et al., 2020). Enhancing BACI by creating distance strata would address spatial heterogeneity and allow for an exploration of the scale of effect (Table 1). However, this design retains the difficulties of finding suitable control locations and the reliance upon these controls to assess impacts. Although spatially stratified BACI is not a common approach for offshore wind studies, stratifying the BACI design by habitat has been reported. For example, Degraer et al. (2013) used a habitat-stratified BACI design to explore ecological responses in the two dominant habitats present within a wind farm (i.e., sand banks and gullies). In doing so, this study was able to partition out the variance attributable to habitat differences and demonstrate a significant positive wind farm effect on epibenthic biomass, sea star (Asterias rubens) density, and sole (Solea solea) density in sand bank habitats that did not occur in gully habitats (Degraer et al., 2013).
Before-After-Gradient (BAG)
A BAG design samples at relative distances from the turbines in both the pre and post construction time periods (Figure 3; Table 1; Ellis and Schneider, 1997). As a before-after design, BAG retains the advantage of spatially stratified BACI in being able to compare post-construction patterns to baseline conditions and has the potential to distinguish impacts from other dynamic factors operating in and around the project area when these data are also available (Christie et al., 2020). BAG also has the additional advantage of not requiring a control location. Holding sampling effort constant, BAG has the potential to have greater statistical power compared to the basic BACI design because the variance associated with both spatial and temporal heterogeneity can be included in the explanatory terms of statistical models rather than being relegated to the error term (Mackenzie et al., 2013). There are no published examples of a BAG design for fisheries resource species at OWFs; however, this design has emerged as a leading approach in studying how small mammals and birds are affected by wind development (e.g., Thompson et al., 2010; Joint Nature Conservation Committee [JNCC], 2015) and has also been proposed as a method to study sea turtles at wind farms (Kraus et al., 2019). A related method, the Before-During-Gradient (BDG) design, samples distances both before and during the impact and has been used to examine effects of pile driving on small mammals (Tougaard et al., 2009; Dähne et al., 2013).
FIGURE 3
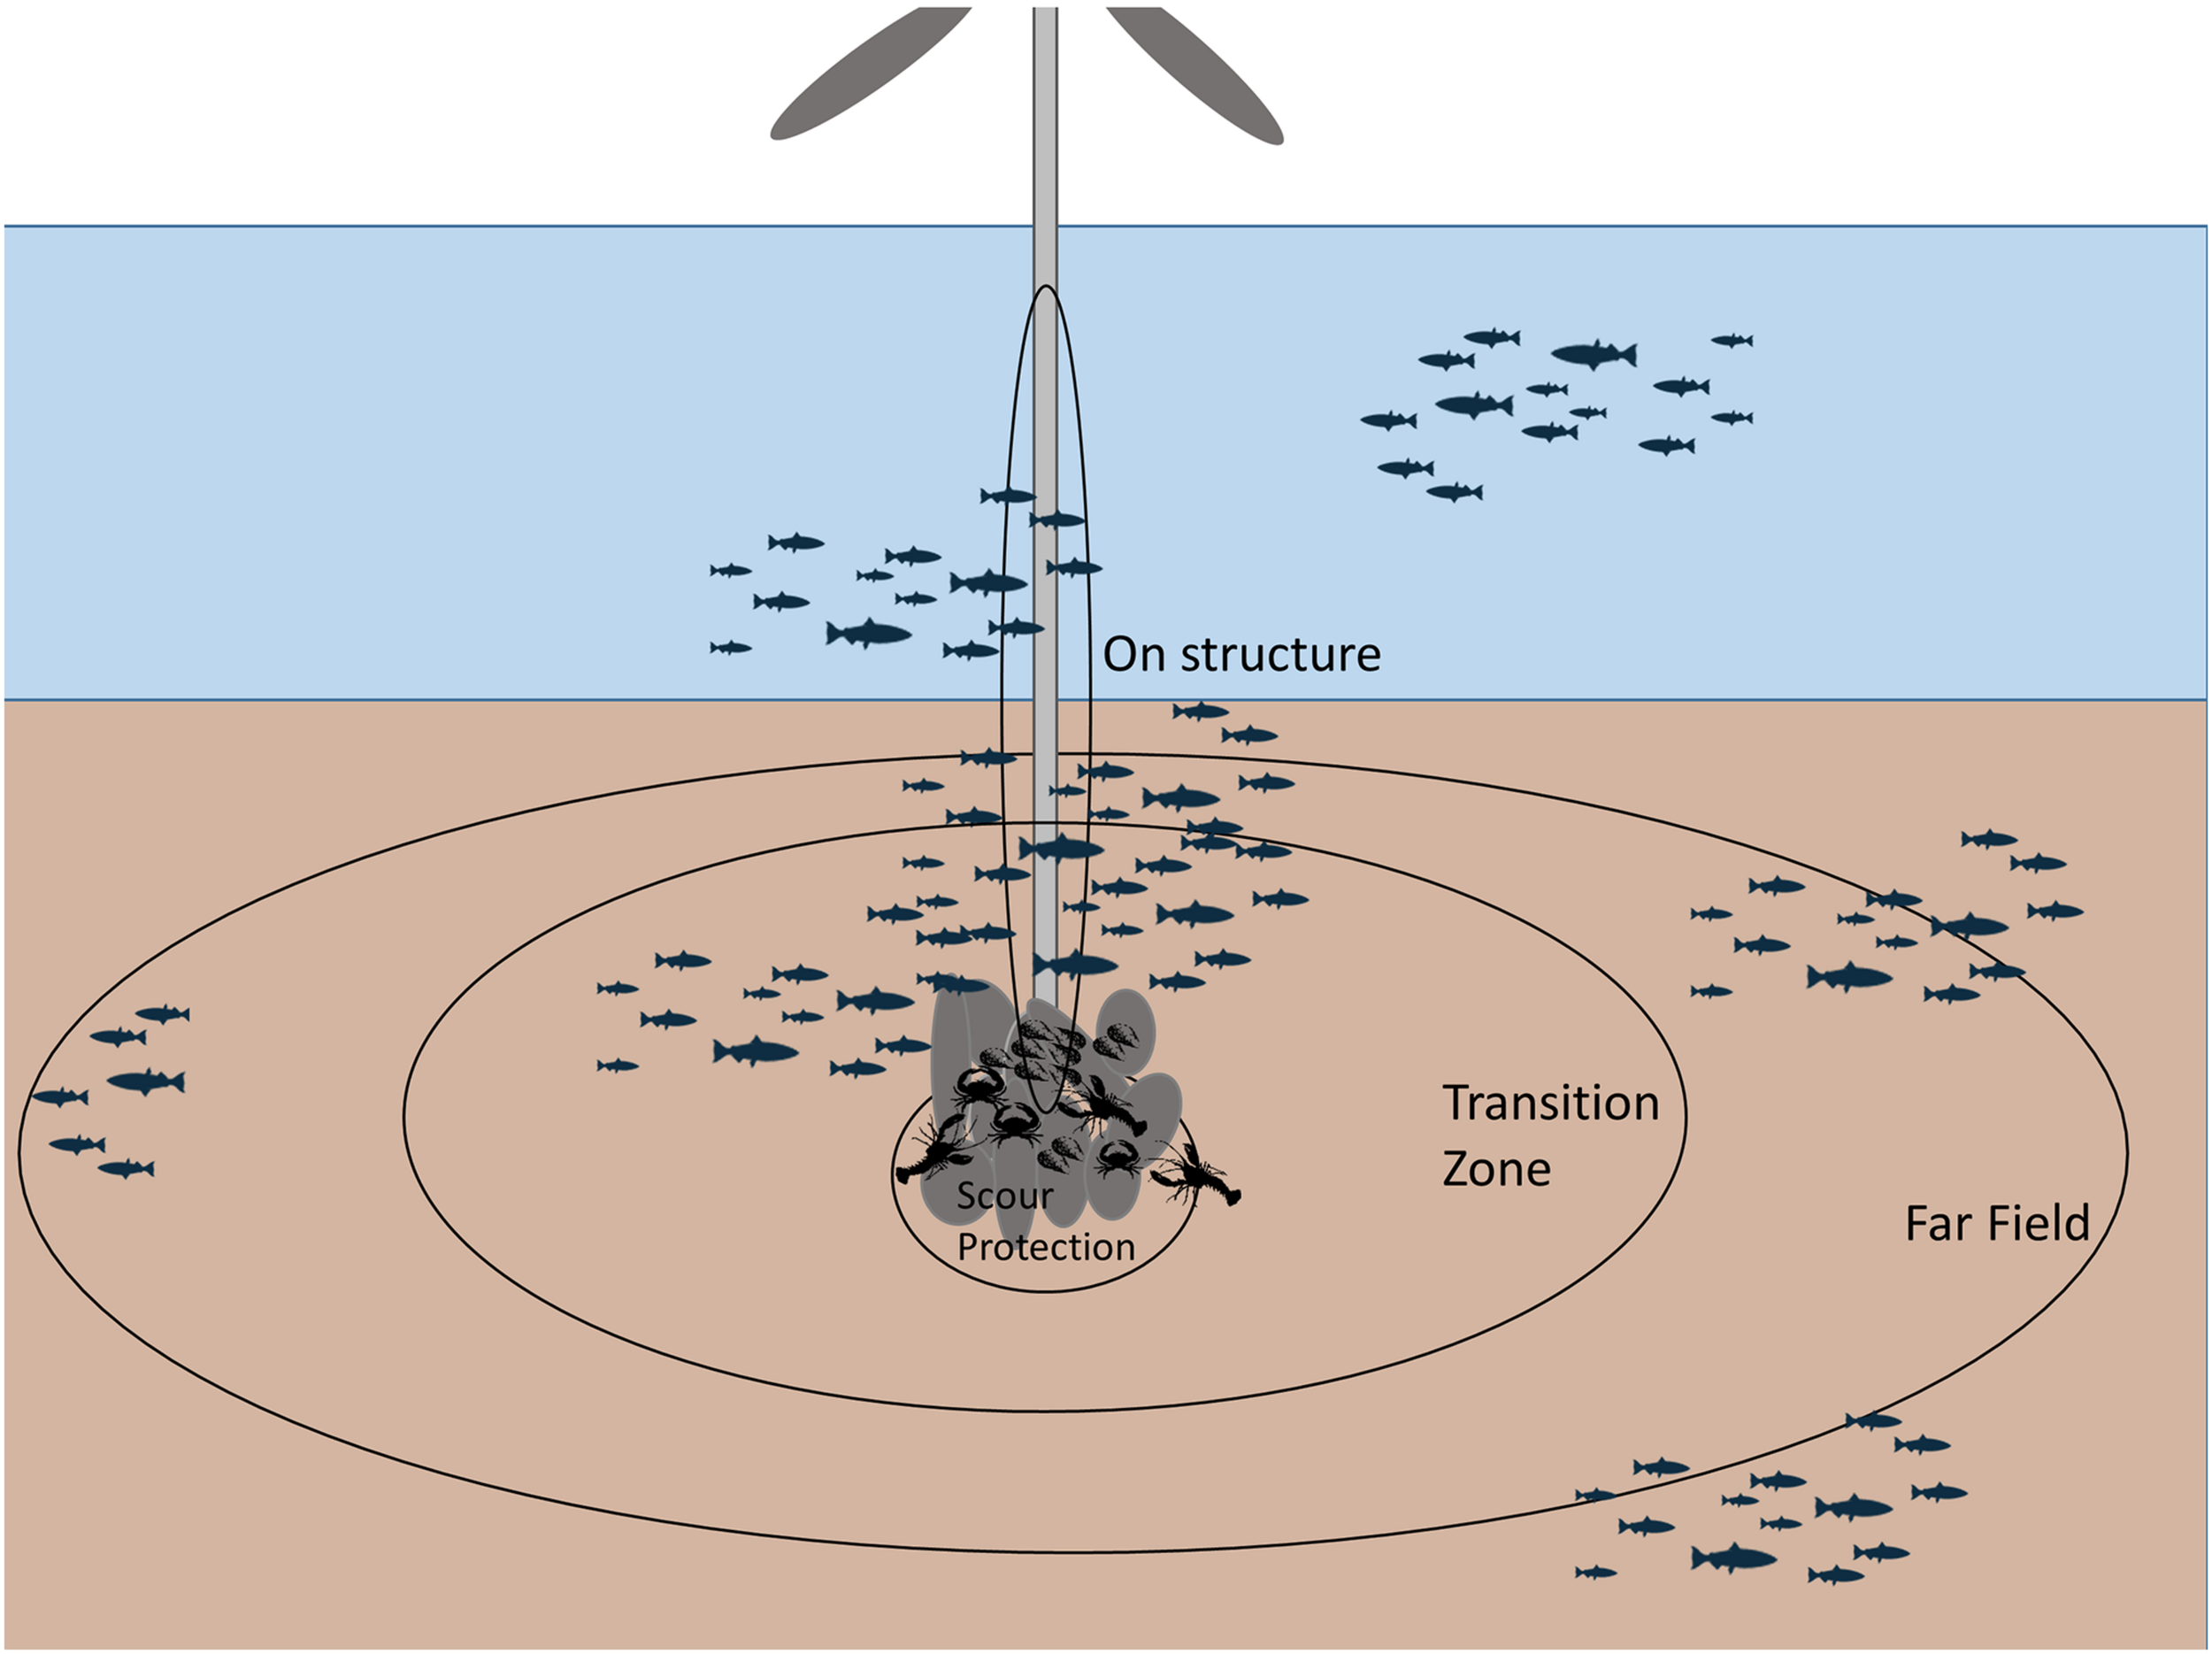
Diagram of gradient-based sampling design with data collected on-structure, within the scour protection, within a transition zone, and at a far-field distance.
After-Construction Only Designs
Distance-Stratified Control-Impact (CI)
Like distance-stratified BACI, distance-stratified CI would rely on a control to assess impacts. Because this design would sample only during the post-construction time period, baseline data are lacking, and thus pre and post construction patterns cannot be compared. Post-construction temporal variation could be explored if sampling were repeated through time. Nevertheless, in instances where the study design is conceived only after the turbines are installed, this approach could be useful for characterizing spatial patterns and effects. There are no reported examples of this design being used for fisheries resource studies at OWFs.
After-Gradient (AG)
As with BAG, an After-Gradient (AG) design (Ellis and Schneider, 1997) samples at relative distances from the turbines and does not require a control; however, samples are collected in the post-construction time period only (e.g., Petersen and Fox, 2007; Table 1; Figure 3). As with distance-stratified CI, this design lacks the ability to compare post-construction effects to baseline conditions; however, there are several reported examples of its utility for characterizing post-construction spatial patterns and effects (e.g., Bergström et al., 2013; Stenberg et al., 2015). Post-construction spatio-temporal changes can also be explored if multiple time points are sampled after the intervention. This design has been used in the study of finfish, benthic invertebrates, and birds at wind farms (e.g., Coates et al., 2014).
What Has Been Learned From Distance-Based Sampling at Offshore Wind Farms So Far?
The current state of knowledge of spatial patterns at OWFs learned through the application of distance-based methods is synthesized in this section for benthic invertebrates (Table 2), demersal finfish (Table 3), small marine mammals (Table 4), and birds (Table 5). Each study summarized in Tables 2–5 reported an analysis of data collected for discrete distance categories, along continuous transects, or of tagged animals or echolocation clicks at relative distances from the turbines. Across taxa, distance-based studies have found distinct patterns along spatial gradients.
TABLE 2
| Gradient design type | Groups studied | OWF factor studied | Distances from turbine (m) or (km) | Biological indices measured | Sampling modality | Analytical method | References |
| AG | Benthic community species; sediment enrichment | Physical presence of turbine foundations; habitat modification | 15, 25, 50, 100 and 200 m distance, starting from the edge of the scour protection boulders | Biomass or ash free dry weight by species; total abundance, total number of species, sediment grain size, organic matter content | Van Veen grab | Multivariate and univariate permutational ANOVA | Coates et al. (2014) |
| AG | Fish and macroinvertebrates including European lobster (Homarus gammarus), Norway lobster (Nephrops norvegicus) and edible crab (Cancer pagurus); motile crustaceans, large predatory fish, bottom dwellers | Physical presence of turbine foundations; addition of hard-bottom habitat | 0 m, 100 m, 4000 m | Species relative abundance (Nmax or maximum number of fish recorded at any one time), diversity, age structure | Stereo BRUV | ANOVA; Kruskal–Wallis ANOVA with Dunn’s comparisons | Griffin et al. (2016) |
| AG | Macrobenthic community including annelids, nematoda, crustaceans, and mollusks | Physical presence of turbine foundations; habitat modification | 30–49 m, 50–69 m, and 70–90 m | Sediment grain size and organic content; macrofaunal community composition, abundance, evenness, diversity, dominance | Smith McIntyre grab sampler; paired with seabed video to provide broader contextual information of the surrounding area | ANOVA; Kruskal–Wallis with Tukey–Kramer comparisons; ANOSIM and Permanova+; PERMDISP | HDR (2019, 2020) |
| AG | Macrobenthic community including amphipods, polychaetes, annelids, nemerteans | Physical presence of turbine foundations; habitat modification | 37.5 m (near) and 350–500 m (far) | Grain size distribution; total organic content; biomass; abundance; diversity; evenness | Van Veen grab | ANOVA; PERMANOVA; PERMDISP; PCO; SIMPER; CLUSTER; DistLM | Lefaible et al. (2018, 2019); Braeckman et al. (2020) |
| AG | Macroinvertebrates including annelids, mollusks, arthropods, echinoderms | Physical presence of turbine foundations; habitat modification | 15, 25, 50, 100, and 200 m. | Abundance, sediment grain size, organic matter content | Van Veen grab | PERMANOVA; BIOENV | Lu et al. (2020) |
| AG | Macrobenthic community including crustaceans and mollusks; both epibiota and motile invertebrates and algae | Physical presence of turbine foundations; addition of hard-bottom habitat; habitat modification | 0 m, 2 m, and 20 m | Biomass; assemblage structure | Diver collected samples using a quadrat and a putty knife | ANOSIM; SIMPER; Wilcoxon Matched Pairs Test, ANCOVA | Wilhelmsson and Malm (2008) |
| AG | Species included two-spotted goby (Gobiusculus flavescens) and sand goby (Pomatoschistus minutus); cottids; sessile attached inverts and algae | Physical presence of turbine foundations; addition of hard-bottom habitat | 0 m; 1–5 m; 20 m; controls = 500 m and 1000 m | Fish abundance; percent cover of dominant sessile species | Visual scuba | Wilcoxon’s Matched Pairs Test; ANOSIM and SIMPER | Wilhelmsson et al. (2006) |
Studies of benthic invertebrates that used a gradient design to examine the effects of OWF development.
TABLE 3
| Gradient design type | Groups studied | OWF factor studied | Distances from turbine (m) or (km) | Biological indices measured | Sampling modality | Analytical method | References |
| AG | Eel (Anguilla anguilla); cod (Gadus morhua); shorthorn sculpin (Myoxocephalus scorpius); gold-sinny wrasse (Ctenolabrus rupestris); eelpout (Zoarces viviparus); flounder (Platichthys flesus); black goby (Gobius niger); other less abundant species | Physical presence of turbine foundations; habitat modification | Transects running from 20 to 140 m from turbines; additional samples at 1350 m | Abundance | Fyke nets | GLM | Bergström et al. (2013) |
| AG | Fish and macroinvertebrates including European lobster (Homarus gammarus), Norway lobster (Nephrops norvegicus) and edible crab (Cancer pagurus); motile crustaceans, large predatory fish, bottom dwellers | Physical presence of turbine foundations; habitat modification | 0 m, 100 m, 4000 m | Species relative abundance, diversity, age structure | Stereo BRUV | ANOVA; Kruskal–Wallis ANOVA with Dunn’s comparisons | Griffin et al. (2016) |
| AG | Atlantic cod (Gadus morhua) | Physical presence of turbine foundations; | 20 distances: 5, 10, 15, 20, 25, 30, 35, 40, 45, 50, 60, 70, 80, 90, 100, 110, 120, 130, 140, 150 m | Average relative percentages of detections | Acoustic telemetry of tagged fish | Qualitative summary of detection data | Reubens et al. (2013) |
| AG | Demersals; rocky reef species; most common species were whiting Merlangius merlangus; dab Limanda limanda, and sandeels Ammodytidae spp. | Physical presence of turbine foundations; habitat modification | near (0 to 100 m), middle (120 to 220 m) and far (230 to 330 m) | Abundance | Demersal multi-mesh gillnets | GLMM | Stenberg et al. (2015) |
| AG | Multiple species including dab Limanda limanda; sole Solea solea; cod (G. morhua), edible crab (Cancer pagurus) | Physical presence of turbine foundations; habitat modification | 0–15 (scour); 15–25 m (transition zone); >25–589 m | Abundance per 10s | Dual-Frequency Identification Sonar (DIDSON) | Zero inflated negative binomial (ZINB) model | van Hal et al. (2017) |
| AG | Two-spotted goby (Gobiusculus flavescens) and sand goby (Pomatoschistus minutus); cottids; fish; sessile attached inverts and algae | Physical presence of turbine foundations; habitat modification | 0 m; 1–5 m; 20 m; controls = 500 m and 1000 m | Fish abundance; percent cover of dominant sessile species | Visual scuba | Wilcoxon’s Matched Pairs Test; ANOSIM and SIMPER | Wilhelmsson et al. (2006) |
Studies of finfish that used a gradient design to examine the effects of OWF development.
TABLE 4
| Gradient design type | Groups studied | OWF factor studied | Distances from turbine (m) or (km) | Biological indices measured | Sampling modality | Analytical method | References |
| BAG | Harbor porpoise Phocoena phocoena | Acoustic effects of pile driving | 2.5 km 3.2 km, 4.8 km, 10.1 km, 17.8 km, 21.2 km | Porpoise positive minutes per hour (PPM/h) | Passive acoustic monitoring | GAM | Brandt et al. (2011) |
| BAG | Harbor seals Phoca vitulina | Acoustic effects of pile driving | Data from satellite and GPS tags | Presence via telemetry | Satellite tags; GPS phone tags | CReSS | Russell et al. (2016) |
| BAG and BDG | Harbor porpoise Phocoena phocoena | Acoustic effects of pile driving and wind farm operation | <4 km, 7.5 km, 21 km | Interval between encounters | Passive acoustic monitoring | GLMM | Tougaard et al. (2009) |
| BDG | Harbor porpoise Phocoena phocoena | Acoustic effects of pile driving | 12 distances from 1 to 50 km away from pile driving; 8–10.8; 7.4–9.8; 2.3–4.6; 3.0–4.2; 0.5–2.5; 2.3–4.7; 4.5–7.0; 2.5–4.5; 7.2–9.2; 23–25; 25.2–26; 48.7–50.5 km | Detection-positive 10 min (10 min periods with at least one porpoise click train detection); waiting times (interval length of periods of more than 10 min without detections given in minutes) | Passive acoustic monitoring with 12 positions | GAM; GLMM; GAMM | Dähne et al. (2013) |
| BG | Harbor porpoise Phocoena phocoena | Parallel transects at 10 km intervals running across wind farm and outside wind farm | Animal density | Aerial visual survey | GLM; ANOVA; GAMM | Gilles et al. (2009) |
Studies of marine mammals that used a gradient design to examine the effects of OWF development.
TABLE 5
| Gradient design type | Groups studied | OWF factor studied | Distances from turbine (m) or (km) | Biological indices measured | Sampling modality | Analytical method | References |
| BAG | Waterbird species including cormorant Phalacrocorax carbo; geese Anserini; dabbling ducks Anas sp.; eider Somateria mollissima; other diving ducks such as red-breasted merganser Mergus serrator; gulls Laridae; passerines Passeriformes | Physical presence of turbines at an operating wind farm | Parallel transects at 0 m, 50 m, 100 m, 200 m, 300 m, 400 m, 500 m, 1000 m; 2000 m; 3000 m; 4000 m; 5000 m; 6000 m from the most easterly row of turbines | Flock size; orientation of migration routes; probability that waterbird passes through OWF | Stationary visual observers; ship-board radar | GLM | Kahlert et al. (2004) |
| BAG | Loons (Gavia spp.); red throated loon (Gavia stellata) and black-throated loons (G. arctica) | Physical presence of turbines at an operating wind farm | Transects running through wind farm; 3 km and 10 km radii out to 20 km away | Density | Aerial and ship-board visual survey | GAM; GAMM | Mendel et al. (2019) |
| BAG | Several species; Most abundant were common scoter Melanitta nigra and herring gull Larus argentatus | Physical presence of turbines at an operating wind farm | Parallel transects at 2 km intervals running across wind farm and outside wind farm | Density | Aerial visual survey | Chi-squared comparison of Jacobs selectivity index (D) | Petersen et al. (2004) |
| BAG | Several species including divers (Gavia spp.), common scoter (Melanitta nigra), long tailed duck (Clangula hyemalis), herring gull (Larus argentatus), little gull (Larus minutus), kittiwake (Laridae), terns (Sterna spp.), and auks (Alcidae) | Physical presence of turbines at an operating wind farm | Parallel transects at 2 km intervals running across wind farm and outside wind farm | Number of individuals and flocks | Aerial visual survey | Kolmogorov–Smirnov comparison of pre and post cumulative distribution functions over distance | Petersen et al. (2006) |
| BAG | Long tailed duck (Clangula hyemalis) | Physical presence of turbines at an operating wind farm | Parallel transects at 2 km intervals running across wind farm and outside wind farm | Density | Aerial visual survey | GAM | Petersen et al. (2011) |
| BAG | Common scoters Melanitta nigra; and red-throated diver/black-throated diver Gavia stellate and G. arctica | Physical presence of turbines at an operating wind farm | Parallel transects; at 2 km intervals running across wind farm and 4 km outside | Density | Aerial visual survey | CReSS | Petersen et al. (2014) |
| AG | Red- and black-throated diver Gavia stellate and G. arctica; guillemot Uria aalge; razorbill Alca torda and Arctic Sterna pardisaea; and common tern S. hirundo; distance analysis on common scoter Melanitta nigra | Physical presence of turbines at an operating wind farm | Parallel transects at 2 km intervals running across wind farm and outside wind farm | Number of individuals and flocks | Aerial visual survey | Kolmogorov–Smirnov test to compare several years of cumulative distribution functions constructed over distance | Petersen and Fox (2007) |
| AG | Lesser black-backed gulls Larus fuscus | Physical presence of turbines at an operating wind farm | GPS data gridded to 250 × 250 m spatial cells | Presence/absence via GPS fixes | Tracking of GPS-tagged birds | GAM | Vanermen et al. (2020) |
| AG | Divers; gannets (Morus bassanus); little gulls (Hydrocoloeus minutus); common gulls (Larus canus); lesser black-backed gulls (Larus fuscus); herring gulls (Larus argentatus); great black-backed gulls (Larus marinus); kittiwakes (Rissa tridactyla); terns; alcids | Physical presence of turbines at an operating wind farm | Parallel transects at 3 km intervals running across and through wind farm | Number of individuals and clusters | Ship-board visual survey | GAM | Welcker and Nehls (2016) |
Studies of avian species that used a gradient design to examine the effects of OWF development.
Benthic Invertebrates
The primary distance-based sampling method for benthic invertebrates has been the After-Gradient design (Table 2). For sediment macrofauna, these studies have generally shown that sediment grain size increases with increasing distance from turbine structures while species abundance, density, and richness as well as sediment organic content decreases with increasing distance (Wilhelmsson and Malm, 2008; Coates et al., 2014; Griffin et al., 2016; Lefaible et al., 2019; Braeckman et al., 2020; HDR, 2020; Hutchison et al., 2020; Lu et al., 2020). Changes in sediment characteristics and benthic community composition near the foundations are attributed to deposition of organic materials that fall from the structures (De Mesel et al., 2015). For epibenthic invertebrates, changes in communities along spatial gradients have also been observed with distance-based methods. Wilhelmsson et al. (2006) found an increased percent cover of mussels (Mytilus trossulus) and decreased percent cover of algae (Polysiphonia fucoides and Rhodomela confervoides) closer to turbines. Griffin et al. (2016) reported that communities shifted from species more characteristic of hard bottom environments at the turbines (e.g., European lobster, Homarus gammarus; Edible crab, Cancer pagurus) to those more characteristic of soft bottoms (e.g., Norwegian Lobster, Nephrops norvegicus) further away from turbines. Studies by Lefaible et al. (2018, 2019) and Braeckman et al. (2020) found higher macroinvertebrate abundances and distinct patterns of community structure nearer to the turbine structures for two wind farms that were approximately 16 km apart; however, the dominant species near the turbines differed between the two wind farms. At Block Island Wind Farm in the United States, dense aggregations of blue mussels (Mytilus edulis) were reported under and around the foundations compared to distances further away 4 years following construction (HDR, 2020; Hutchison et al., 2020).
Finfish
All distance-based studies of finfish at OWFs have used an After-Gradient design (Table 3). These studies have consistently demonstrated strong directional effects on demersal or reef-associated finfish. Reported effects have included higher levels of abundance and density at or very close to turbines (≤50 m) for species such as two-spotted goby (Gobiusculus flavescens), sand goby (Pomatoschistus Minutus), cod (Gadus morhua), eel (Anguilla anguilla), shorthorn sculpin (Myoxocephalus scorpius), goldsinny wrasse (Ctenolabrus rupestris), and Scyliorhinus species (Wilhelmsson et al., 2006; Bergström et al., 2013; Reubens et al., 2013; Griffin et al., 2016). Species richness, taxa richness, and species diversity were generally higher closer to turbine structures (Stenberg et al., 2015; Griffin et al., 2016), although Wilhelmsson et al. (2006) found lower species diversity closer to turbines due to the dominance of two-spotted goby (Gobiusculus flavescens) in the community. Concurrent with an AG study that collected samples at distances ranging from 20 to 140 m from the turbines, Bergström et al. (2013) also conducted a BACI study; the BACI study sampled randomly selected sites ranging from 130 to 1,350 m from turbine foundations and found no effects of offshore wind development on the fish community. The contrasting outcomes of these concurrent studies highlight the importance of the spatial scale of sampling and the possibility that important effects could be missed if the nearest sampling stations are >100+ m from turbine foundations.
Peer-reviewed field studies of pelagic finfish and invertebrates at offshore wind farms are scarce in the literature. Although pelagic fish have been reported to occur at turbines (e.g., Mavraki et al., 2019), studies that have included pelagic species have generally not employed distance-based methods and have not reported clear patterns in relation to OWF structures (Stenberg et al., 2015; Floeter et al., 2017; van Hal et al., 2017; Karama et al., 2021). In laboratory settings, the IPFs associated with OWF development have demonstrable effects on pelagic species (Jones et al., 2021; Klimely et al., 2021). Although rare in the OWF literature, pelagic species have been the frequent focus of research at other manmade offshore structures including oil and gas platforms and artificial reefs where clear evidence of an aggregation effect has been demonstrated (e.g., Munnelly et al., 2020). The spatial and temporal patterns of finfish including pelagic species at manmade structures other than wind turbines is the subject of many recent reviews (Bolser et al., 2020; Munnelly et al., 2020; Paxton et al., 2020; Snodgrass et al., 2020). Much more research is needed in order to understand the scope, scale, and magnitude of effect that OWF development has on pelagic fish and invertebrate species and distance-based methods could aid these efforts.
Marine Mammals
Distance-based approaches, including After-Gradient, Before-After-Gradient, and Before-During-Gradient designs, have demonstrated changes in activity patterns, spatial variation in recovery times, and spatial variability in relative density in response to pile driving activity primarily for harbor porpoise (Phocoena phocoena) at OWFs (Tougaard et al., 2009; Brandt et al., 2011; Dähne et al., 2013; Table 4). These studies placed passive acoustic monitoring devices at multiple distances from the source of impact and recorded echolocation clicks produced by passing animals before and then during (Dähne et al., 2013), after (Brandt et al., 2011), or both during and after (Tougaard et al., 2009) pile driving. In response to pile driving, porpoise activity was reduced by 100% for the first hour and remained below typical levels for 24–72 h out to a distance of 2.6 km from the pile driving site (Brandt et al., 2011). The period of inactivity decreased with increasing distance out to 17.8 km, and at 22 km and beyond, there was no measurable change in activity (Brandt et al., 2011). Dähne et al. (2013) reported a reduced detection rate within 10.8 km of pile driving and increased activity at 25 km and 50 km suggesting displacement of animals. Displacement was also reported by Tougaard et al. (2009) but there was no spatial gradient detected which the authors suggest is because the impact of pile driving on harbor porpoise extended beyond the 20 km extent of the study. Russell et al. (2016) used satellite and GPS phone tags to monitor the movement of harbor seals before and during pile driving and during operation, finding that animals were displaced as much as 25 km during pile driving but that there was no measureable displacement during operation. A pre-construction aerial gradient survey conducted by Gilles et al. (2009) identified spatial and seasonal gradients in porpoise density and potential foraging hotspots in areas where OWFs are currently licensed or planned.
Marine Birds
Displacement following wind farm construction is the most common response reported for distance-based studies (primarily AG and BAG studies) of avian species at OWFs with reductions in abundance up to 92% reported in some instances (Petersen et al., 2004, 2014; Welcker and Nehls, 2016; Mendel et al., 2019) although attraction has been reported for some species (Welcker and Nehls, 2016; Table 5). Utilizing aerial digital, aerial visual, or ship-based visual surveys, these studies have generally found that density increased with increasing distance from wind farms. A reduction in loon (Red throated loon Gavia stellate and Black-throated loon G. arctica) density out to 16 km was observed by Mendel et al. (2019) while Petersen et al. (2004, 2014) found a reduction in divers (i.e., loons) (Red-throated diver Gavia stellata and Black-throated Divers Gavia arctica) out to 14 km and in Common scoter (Melanitta nigra) out to 10 km. Conversely, some studies have demonstrated attraction to OWFs for some species including Herring Gull (Larus argentatus), Little Gull (Hydrocoloeus minutus), and Arctic/Common tern (Sterna paradisaea/Sterna hirundo) (Petersen et al., 2004) perhaps for foraging opportunities. Welcker and Nehls (2016) identified the distance at which there was an asymptote in bird densities for several groups including alcids, divers, and little gulls. In a study of migratory patterns of several species of waterbirds, Kahlert et al. (2004) reported that these species avoided the wind farm particularly at closer distances (Table 5). Spatial heterogeneity within a wind farm was demonstrated by Vanermen et al. (2020) for lesser black-backed gulls which tended to avoid flying or perching in the wind farm center, but commonly perched on turbines at the edge of the wind farm.
Methodological Elements to Consider in Designing a Distance-Based Study for Finfish and Invertebrates
There are numerous methodological elements to consider in designing a monitoring plan for finfish and shellfish at OWFs (ROSA, 2021). This section focuses on four elements that are specific to distance-based sampling, using existing studies as examples. Many other elements such as sample size determination, statistical power, temporal sampling interval, and selection of the biological indicators to be measured are also extremely important elements of experimental design and are covered elsewhere in detail (e.g., Buckland et al., 2015; Franco et al., 2015; Schweiger et al., 2016; Wilding et al., 2017; Van Hoey et al., 2019).
Selection of Distance Intervals
Matching both the spatial extent and resolution of sampling with that of ecological responses to OWF development is key to detecting impact gradients (Wiens, 1989). Previous studies that utilized distance-based sampling for fisheries resource species at OWFs have either taken continuous measures along transects (e.g., van Hal et al., 2017), taken samples at discrete distances along transects, or within spatial strata at increasing distances from turbines (e.g., Bergström et al., 2013; Coates et al., 2014; Tables 2–5). Selection of distance intervals for discrete sampling requires consideration of the mobility of the study animals, the spacing of turbines, the distribution of habitat within the wind farm prior to and after construction, and the assumptions made about how study animals associate with wind farm structures and natural habitats. To date, narrower distance bands that are closer to OWF structures have been used for species that have limited motility or are sessile in adult phases; wider distance bands that extend further from the foundations have been used for species with moderate motility (e.g., at the structure, within the scour protection, within a transition zone, and at a far-field distance) (Figure 3 and Tables 2–5). In developing a continuous transect monitoring approach, additional considerations include the distance between transects, the directionality of transects, and how close transects come to the foundations. For both discrete and continuous sampling, the directionality of sampling relative to the turbine is an important consideration as oceanographic and environmental conditions may vary locally and regionally around turbine foundations (Hasager et al., 2015; Boon et al., 2018; van Berkel et al., 2020).
Perhaps the most important consideration in choosing distance intervals at which to sample relative to turbine structures is the hypothesis being considered and the underlying mechanism(s) believed to be driving potential changes. This is needed for both basic monitoring aimed at assessing the aggregate “wind farm effect” and targeted research projects that focus on specific, mechanism-based research questions (Hutchison et al., 2020). For targeted research studies examining the effect of a specific IPF, the choice of distance-based sampling intervals can be informed by understanding how the IPF varies across the wind farm area and the relationship between the IPF and the biological indices to be measured (Gill et al., 2020). Figure 2 depicts hypothesized spatial and temporal scales for IPFs that may affect fisheries resources and highlights that while direct effects may occur at scales similar to the IPFs driving them, the scales of indirect effects may extend further.
Although the distance-from-turbine effect has emerged in the literature as a consistent pattern across wind farms for finfish, benthic invertebrates, and sediment composition, some OWF-related IPFs may occur over much larger spatial scales (10s of km) (e.g., Mooney et al., 2020; van Berkel et al., 2020; Figure 2) and may therefore require a distance-based sampling strategy with broader spatial extent, resolution, and sampling intervals. For instance, hydrodynamic changes due to the presence of a wind farm occur over both local and broad scales; Locally, downstream turbulence, surface wave energy, and upwelling patterns are modified as currents pass by structures (Bakoday-Paskyabi et al., 2018), while at broad scales wind wakes may affect regional patterns of vertical stratification (Carpenter et al., 2016) up to 10s of km from the wind farm with potential implications for nutrient distribution, primary, and secondary production. This underscores the importance of considering the scale at which underlying mechanism(s) are hypothesized to be acting. In the case of ecological impacts due to hydrodynamic changes, distance-based sampling relative to individual turbines, the wind farm itself, and to other wind farms in the region may be relevant.
Sampling Modalities
Choosing a sampling modality for fisheries resources that can be used in close proximity to turbine structures or in areas where sub-bottom cables occur presents logistical challenges. Traditional fisheries sampling methods such as bottom trawl or dredge are problematic because of the large areas over which they integrate data, potential interactions with structures, and the amount of physical disturbance that they would cause over the footprint of the wind farm to achieve the necessary level of sampling effort and precision. Sampling modalities that provide accurate and precise estimates of the abundance and distribution of the target species of interest while minimizing disturbance to the ecosystem are highly desirable. Another important consideration is choosing gear types that can be readily calibrated with gear used in regional long term monitoring programs so that data collected at OWFs can be integrated with those collected in wider regional surveys (e.g., Streich et al., 2018). Studies targeting benthic invertebrates have primarily sampled with grab samplers, diver collected samples, diver visual observation, or baited remote underwater video (BRUV) (Table 2). For finfish, some distance-based studies at OWFs have used traditional methods such as visual diver observation, fyke nets, and gillnets while others have employed more modern approaches such as BRUV, acoustic telemetry, and dual-frequency identification (DIDSON) sonar (Table 3). All of these sampling modalities were capable of sampling on or very near turbine foundations.
The development of wind energy in the offshore zone presents an opportunity to develop new and advance existing innovative technologies for research and monitoring. Examples of sampling technologies that have been used to study ecological patterns at and around manmade structures in the ocean and which could be useful for gradient studies at OWFs include hydroacoustics (Degraer et al., 2013; Reynolds et al., 2018) and remotely operated vehicles outfitted with cameras (Ajemian et al., 2015; Wetz et al., 2020). With advances in areas such as machine learning, meta-barcoding, and unmanned research vessels, new monitoring technologies are also emerging such as eDNA (Stoekle et al., 2020), autonomous vehicles combined with camera or passive acoustic technologies (Zemeckis et al., 2019; National Oceanic and Atmospheric Association [NOAA], 2020), and video systems that are integrated with motion-detection and computer vision (Sheehan et al., 2020). Regular monitoring of environmental variables that drive the distribution and abundance of natural resources at wind farms is also essential and could potentially be achieved in coordination with existing ocean observing platforms (Wilkin et al., 2017).
Statistical Approaches
A wide variety of statistical methods have been used to evaluate significant ecological impacts in distance-based studies at OWFs (Tables 2–5). Key considerations in selecting an analytical approach are the assumptions made regarding the relationships among dependent and independent variables and their continuous covariables. In instances where linear or non-linear relationships are assumed, Generalized Linear Models (GLMs; McCullagh and Nelder, 1989) can be used as in Bergström et al. (2013) who applied GLMs to demonstrate declining abundance with distance from the turbine for total fish, cod (G. morhua), eel (Anguilla anguilla), shorthorn sculpin (Myoxocephalus Scorpius), and gold-sinny wrasse (Ctenolabrus rupestris). Curved or non-linear relationships can also be accommodated by Generalized Additive Models (GAMs) (Hastie and Tibshirani, 1990; Wood, 2006). GAMs have been employed to analyze bird and mammal data collected in distance-based studies at OWFs where they have revealed distinct spatial patterns (Brandt et al., 2011; Petersen et al., 2011; Tables 4, 5). Mackenzie et al. (2013) pointed out that with GAMs, the p-values calculated assume that there is no spatial-temporal correlation among model residuals which can be problematic when there are unexplained patterns in the model. Generalized Additive Mixed Models (GAMMs), an extension of GAMs that incorporates random effects, allow for non-linear relationships with covariables as well as spatial-temporal correlation within sampling units (e.g., transects) (Zuur et al., 2009). GAMMs have also been employed to demonstrate spatial patterns of effect at OWFs for birds and small mammals (Dähne et al., 2013; Mendel et al., 2019). Winiarski et al. (2014) used a density surface model approach that estimated bird abundance over each section of a survey transect, and then employed GAM to model transect segment-level abundance as a function of environmental covariates. Another analytical approach, Complex Regional Spatial Smoother (CReSS), offers a further advantage of spatial adaptability, allowing for greater flexibility in the modeled relationship with covariables throughout the covariable range by focusing on the portions of the range where model residuals are greatest (Scott-Hayward et al., 2013). This method was used by Petersen et al. (2014) to demonstrate the reduction and displacement of divers at an OWF. Additionally, non-parametric and multivariate approaches such as PERMANOVA, ANOSIM, and SIMPER (Clarke and Gorley, 2006; Anderson et al., 2008) have been employed to uncover abundance and community level differences along gradients of impact at OWFs particularly for benthic invertebrates and finfish (Tables 2, 3; e.g., Wilhelmsson and Malm, 2008; Coates et al., 2014; Lu et al., 2020).
Collection of Data Along an Impact Gradient Prior to the Impact
A common reasoning for not selecting a before-after distance-based sampling design such as BAG is the difficulty in collecting data along a distance-from-turbine gradient prior to the construction of the turbines. This difficulty arises because often the specific locations of turbines and associated scour protection zones are not precisely known >2 years in advance of construction when baseline studies would occur. Changes in the turbine design or layout are often made by developers during the permitting process (e.g., engineering innovations that occur during the permitting process may lead to larger, more efficient turbines that are preferred by developers). Changes also occur because of conflicts among stakeholders regarding the spacing of turbines or placement of transit lanes (e.g., Baird and Associates, 2019; RODA, 2020). One solution is to resolve these conflicts and make a final selection about the turbine design and layout well in advance of the start of construction. Alternatively or perhaps additionally, data collection throughout the development area during 2+ years of baseline studies could be used to develop spatially explicit models that generate a predicted surface of the abundance and distribution of target species which could provide the “before” data in impact assessment models (Petersen et al., 2011, 2014; Winiarski et al., 2014).
Discussion
Offshore wind is becoming an integral component of the blue economy worldwide. Innovative and robust study methodologies are needed to develop a comprehensive and mechanism-based understanding of the interactions between OWFs and marine ecosystems (Wilding et al., 2017). In the United States, commercial scale offshore wind development is imminent and there is an opportunity, before large scale development commences, to develop methodologies that are able to measure ecological effects and distinguish them from natural variation and other concurrent factors that affect populations. Combining a before-after sampling design with distance-based methods could provide a powerful approach for characterizing both the spatial and temporal variance associated with wind development in the ocean.
Before-after designs offer the unique ability to make comparisons of post-construction patterns with the reference condition, enabling an examination of how the intervention may have driven the patterns observed. Understanding how the biological and physical environment changes following the intervention could provide the basis for the development of mechanistic hypotheses to be tested at OWFs. This is important for understanding not only changes from baseline due to the direct effects of wind development, but also those due to indirect effects that change in response to wind development (e.g., changes in the distribution of fishing effort) if those data are available. In instances when studies are only conceived after construction has occurred, AG and distanced-stratified CI could be useful in elucidating effects during the operational phase.
Of the designs explored here, BAG offers several methodological advantages: It can evaluate spatial heterogeneity and the spatial scale of effect, does not require a control, and compares pre-construction with post-construction patterns, making it arguably the most robust and most versatile of the distance-based methods. These advantages have elevated BAG to becoming a recommended design in the study of birds (Jackson and Whitfield, 2011; Joint Nature Conservation Committee [JNCC], 2015) and small mammals (Thompson et al., 2010; Bailey et al., 2014) at OWFs. Nevertheless, there remains no published examples of BAG studies for finfish or invertebrates. Several applications of the AG design at wind farms are reported in the literature, and these studies have yielded important information on demersal finfish and benthic invertebrates during OWF operation.
Distance-stratified BACI may be useful in answering research questions about effects that are expected to occur over a limited, well-defined spatial extent and when suitable controls can be identified. For example, hypotheses regarding the direct effects of adding hard bottom habitat on the abundance of slow moving or sessile species could be explored with this method because hard bottom habitat added (i.e., turbine foundations and scour protection) occurs in distinct areas that could be readily stratified with regard to distance and compared to a control. The difficulty of finding a suitable control in a busy multi-use coastal ocean remains, and this obstacle is made even more challenging by the shifting environmental baselines that oceans are facing (Kleisner et al., 2017). This challenge can be ameliorated by careful baseline sampling to ensure that controls are sufficiently similar to impact locations, and by the measurement of co-variables at both control and impact locations that may be important in driving patterns of abundance and distribution of target species.
Localized effects at the scale of a single wind farm may seem relatively small and inconsequential compared to the broader expanse of the ocean and ecosystem level processes. However, the potential for local-scale effects to have regional and/or ecosystem level implications could occur through a variety of processes including larval transport (Krone et al., 2013; Slavik et al., 2018), stepping stone effects (Coolen et al., 2020), consumption of reef-associated species by mobile predators (Reubens et al., 2014; Russell et al., 2016), and the translocation of carbon derived from reef-associated species beyond the footprint of the wind farm and into the regional ecosystem (Reubens et al., 2014; Carey et al., 2020; Degraer et al., 2020; Figure 2). The potential for such effects has been borne out by predictive models. For example, using a coupled hydrodynamic-ecosystem model, Slavik et al. (2018) found that OWF development in the southern North Sea may increase regional abundance of blue mussels (Mytilus edulis) and subsequently affect regional changes in primary production and water clarity. Barbut et al. (2020) used a coupled particle tracking-hydrodynamic model to demonstrate the potential for offshore wind development to overlap with flatfish spawning grounds in the North Sea, showing that this overlap could affect population dynamics. In a desktop analysis, Coolen et al. (2019) projected that having 5,000 turbines and associated scour structures in the Dutch North Sea by the year 2050 would have the potential to increase the Dutch edible crab population by 50 million individuals and the Atlantic cod population by hundreds of thousands. Satellite imagery shows that wind wakes (i.e., the effect of reduced wind speed on wave generation) can extend 10s of km from wind farms (Hasager et al., 2015). Changes in wave heights driven by wind wakes may impact the transport of suspended matter, affecting nutrient distribution with impacts extending to primary production and shellfish production (Carpenter et al., 2016; Boon et al., 2018). These studies suggest that offshore wind development has the potential to have non-trivial ecosystem level effects that extend far beyond the local scale of the footprint of an individual wind farm.
A regionally coordinated framework for research and monitoring could help to place local scale patterns within the context of the regional ocean through several pathways (Carey et al., 2020; Gill et al., 2020; Methratta et al., 2020; ROSA, 2021). First, using robust methodologies, a regional framework can inform our understanding of how local scale impacts on abundance, distribution, and vital population rates scale up to the regional level at which populations are managed (e.g., Barbut et al., 2020). Second, a regional framework is key to disentangling wind development impacts from effects caused by broader scale regional or ecosystem level scale phenomena such as changes in water temperature or primary production (e.g., Kleisner et al., 2017). Next, it could facilitate an integration of data collected at OWFs with those collected by long term regional scientific surveys (Methratta et al., 2020). Lastly, a regional framework could support the integration of accurate and precise estimates of biological indicators that can be used to inform the assessment of cross-sector tradeoffs within an integrated ecosystem assessment framework (Samhouri et al., 2014).
Conclusion and Recommendations
Coupling before-after methods with distance-based sampling could provide a powerful approach to studying OWF effects on fisheries resources. The sampling frameworks and statistical methods for such an approach are most advanced in the study of marine mammals and birds at OWFs. The rich knowledge base that exists for mammalian and avian research methods could provide a valuable resource for researchers studying effects on finfish and invertebrates at wind farm installations.
Toward the goal of enhancing the development and application of distance-based sampling of fisheries resources at OWFs, the following recommendations are made: (1) Select a sampling design such as BAG that has the ability to analyze spatial variability both before and after construction; (2) Define testable hypotheses based on specific IPFs; (3) Develop assumptions about the spatial scale of effects and the distance intervals to be studied based on the focal mechanism(s); (4) Collect baseline data to inform local-scale site selection, develop hypotheses, and enable pre vs. post construction comparisons. Baseline data collection should occur for a period of time that is long enough to characterize patterns of natural variation prior to construction; (5) In defining sampling distances for distance-based sampling designs, consider at minimum the ecology of the target species, the spatial patterns of the underlying mechanism(s) hypothesized to be playing a potential role, baseline data on habitat distribution and environmental variables, and turbine spacing; (6) Measure environmental co-variables along with biological responses and include these as covariates in statistical models; (7) Nest local scale distance-based studies into a regionally coordinated framework for research and monitoring that utilizes standardized approaches (e.g., sample size determination, experimental design, sampling gears, sampling protocol) across wind projects within a region. Conducted consistently across wind farms within a region, such an approach could provide an unparalleled ability to distinguish wind farm impacts from natural variation, synthesize results and draw valuable conclusions that can inform fisheries management and decisions; (8) Establish a standard set of analytical methodologies that integrate information from local to regional to ecosystem scales; (9) Continue to develop and advance innovative research, monitoring, and observing technologies and platforms that provide accurate and precise estimates of biological indices and environmental covariates while minimizing disturbance to the ecosystem; (10) Broaden opportunities for sharing ideas and methodological innovations across areas of ecological research.
Publisher’s Note
All claims expressed in this article are solely those of the authors and do not necessarily represent those of their affiliated organizations, or those of the publisher, the editors and the reviewers. Any product that may be evaluated in this article, or claim that may be made by its manufacturer, is not guaranteed or endorsed by the publisher.
Statements
Author contributions
EM conceived the idea for this work, conducted the review and synthesis of the literature, and wrote this manuscript.
Acknowledgments
I am grateful to the NOAA NMFS Offshore Wind Team and members of the International Council for the Exploration of the Sea, Working Group on Offshore Wind Development and Fisheries (ICES WGOWDF) for many thoughtful discussions on offshore wind and fisheries interactions. I am also grateful to Michael Fogarty, Andrew Lipsky, and the peer-reviewers assigned by the journal for providing constructive comments that improved this manuscript. The views expressed herein are those of the author and do not necessarily reflect the views of the Department of Commerce or its sub-agencies.
Conflict of interest
EM was employed by IBSS Corporation.
References
1
Aguado-Giménez F. Piedecausa M. A. Guitérrez J. M. García-Charton J. A. Belmonte A. García-García B. (2012). Benthic recovery after fish farming cessation: A “beyond-BACI” approach.Mar. Poll. Bull.64729–738. 10.1016/j.marpolbul.2012.02.012
2
Ajemian M. J. Wetz J. J. Shipley-Lozano B. Stunz G. W. (2015). Rapid assessment of fish communities on submerged oil and gas platform reefs using remotely operated vehicles.Fish. Res.167143–155. 10.1016/j.fishres.2015.02.011
3
Anderson M. J. Gorley R. N. Clarke K. R. (2008). PERMANOVA+ for PRIMER: Guide to Software and Statistical Methods.Plymouth: PRIMER-E.
4
Bailey H. Brookes K. L. Thompson P. M. (2014). Assessing environmental impacts of offshore wind farms: lessons learned and recommendations for the future.Aquat. Biosys.10:8. 10.1186/2046-9063-10-8
5
Baird W. F. Associates (2019). Letter to the US Coast Guard. Available online at: https://static1.squarespace.com/static/5a2eae32be42d64ed467f9d1/t/5dd3d3e476d4226b2a83db25/1574163438896/Proposed+1x1+layout+from+RI-MA+Leaseholders+1+Nov+19+%281%29.pdf. (Accessed date January 8, 2021).
6
Bakoday-Paskyabi M. Fer I. Reuder J. (2018). Current and turbulence measurements at the FINO1 offshore wind energy site: analysis using 5-beam ADCPs.Ocean Dyn.68109–130. 10.1007/s10236-017-1109-5
7
Barbut L. Vastenhoud B. Vigin L. Degraer S. Volckaert F. A. M. Lacroix G. (2020). The proportion of flatfish recruitment in the North Sea potentially affected by offshore wind farms.ICES J. Mar. Sci.771227–1237. 10.1093/icesjms/fsz050
8
Bergström L. Sundqvist F. Bergström U. (2013). Effects of an offshore wind farm on temporal and spatial patterns in the demersal fish community.Mar. Ecol. Prog. Ser.485199–210. 10.3354/meps10344
9
Bolser D. G. Egerton J. P. Grüss A. Loughran T. Beyea T. McCain K. et al (2020). Environmental and structural drivers of fish distributions among petroleum platforms across the U.S. Gulf of Mexico.Mar. Coast. Fish.12142–163. 10.1002/mcf2.10116
10
Boon A. R. Caires S. Wijnant I. L. Verzijlbergh R. Zijl F. Schouten J. J. Muis S. (2018). Assessment of system effects of large-scale implementation of offshore wind in the southern North Sea. (Delft: Deltares).
11
Braeckman U. Lefaible N. Bruns E. Moens T. (2020). “Turbine-related impacts on macrobenthic communities: An analysis of spatial and temporal variability,” in Environmental impacts of offshore wind farms in the Belgian Part of the North Sea: Empirical evidence inspiring priority monitoring research and management, edsDegraerS.BrabantR.RumesB.VirginL. (Brussels: Royal Belgian Institute of Natural Sciences, OD Natural Environment, Marine Ecology and Management Section), 61–78.
12
Brandt M. J. Diederichs A. Betke K. Nehls G. (2011). Responses of harbour porpoises to pile driving at the Horns Rev II offshore wind farm in the Danish North Sea.Mar. Ecol. Prog. Ser.421205–216. 10.3354/meps08888
13
Buckland S. T. Rexstad E. A. Marques T. A. Oedekoven C. S. (2015). Distance Sampling: Methods and Applications.New York, NY: Springer.
14
Carey D. A. Wilber D. H. Read L. B. Guarinello M. L. Griffin M. Sabo S. (2020). Effects of the Block Island Wind Farm on coastal resources lessons learned.Oceanography3370–81. 10.5670/oceanog.2020.407
15
Carpenter J. R. Merckelbach L. Callies U. Clark S. Gaslikova L. Baschek B. (2016). Potential impacts of offshore wind farms on North Sea stratification.PLoS One2016:160830. 10.1371/journal.pone.0160830
16
Christie A. P. Abecasis D. Adjeroud M. Alonso J. C. Amano T. Anton A. (2020). Quantifying and addressing the prevalence and bias of study designs in the environmental and social sciences.Nat. Comm.11:6377. 10.1038/s41467-020-20142-y
17
Clarke K. Gorley R. (2006). PRIMER V6: User Manual/Tutorial.Plymouth: PRIMER-E.
18
Coates D. A. Deschutter Y. Vincx M. Vanaverbeke J. (2014). Enrichment and shifts in macrobenthic assemblages in an offshore wind farm area in the Belgian part of the North Sea.Mar. Environ. Res.951–12. 10.1016/j.marenvres.2013.12.008
19
Coolen J. W. P. Boon A. R. Crooijmans R. Pelt H. Kleissen F. Gerla D. et al (2020). Marine stepping stones: Connectivity of Mytilus edulis populations between offshore energy installations.Molec. Ecol.29686–703. 10.1111/mec.15364
20
Coolen J. W. P. Lengkeek W. van der Have T. Bittner O. (2019). Upscaling positive effects of scour protection in offshore wind farms.Netherlands: Wageningen Marine Research, 10.18174/475354
21
Dähne M. Gilles A. Lucke K. Peschko V. Adler S. Krügel K. et al (2013). Effects of pile-driving on harbour porpoises (Phocoena phocoena) at the first offshore wind farm in Germany.Environ. Res. Lett.8:025002. 10.1088/1748-9326/8/2/025002
22
Dannheim J. Bergström L. Birchenough S. N. R. Brzana R. Boon A. R. Coolen J. W. P. et al (2020). Benthic effects of offshore renewables: identification of knowledge gaps and urgently needed research.ICES J. Mar. Sci.771092–1108. 10.1093/icesjms/fsz018
23
Davis N. VanBlaricom G. R. Dayton P. K. (1982). Man-made structures on marine sediments: effects on adjacent benthic communities.Mar. Biol.70295–303. 10.1007/bf00396848
24
De Mesel I. Kerckhof F. Norro A. Rumes B. Degraer S. (2015). Succession and seasonal dynamics of the epifauna community on offshore wind farm foundations and their role as stepping stones for non-indigenous species.Hydrobiologia75637–50. 10.1007/s10750-014-2157-1
25
Degraer S. Brabant R. Rumes B. (2013). Environmental impacts of offshore wind farms in the Belgian part of the North Sea: Learning from the past to optimise future monitoring programmes.Brussels: Royal Belgian Institute of Natural Sciences, Operational Directorate Natural Environment, Marine Ecology and Management Section, 239.
26
Degraer S. Brabant R. Rumes B. Vigin L. (2019). Environmental Impacts of Offshore Wind Farms in the Belgian Part of the North Sea: Marking a Decade of Monitoring, Research and Innovation.Brussels: Royal Belgian Institute of Natural Sciences, OD Natural Environment, Marine Ecology and Management, 134.
27
Degraer S. Carey D. A. Coolen J. W. P. Hutchison Z. L. Kerckhof F. Rumes B. et al (2020). Offshore wind farm artificial reefs affect ecosystem structure and functioning: A synthesis.Oceanography3348–57. 10.5670/oceanog.2020.405
28
Ellis J. I. Schneider D. C. (1997). Evaluation of a gradient sampling design for environmental impact assessment.Environ. Monitor. Assess.48157–172.
29
Floeter J. Beusekom V. Auch D. Callies U. Carpenter J. Dudeck T. et al (2017). Pelagic effects of offshore wind farm foundations in the stratified North Sea.Prog. Oceanogr.156154–173. 10.1016/j.pocean.2017.07.003
30
Franco A. Quintino V. Elliott M. (2015). Benthic monitoring and sampling design and effort to detect spatial changes.Ecol. Indic.57298–304. 10.1016/j.ecolind.2015.04.040
31
Gill A. B. Degraer S. Lipsky A. Mavraki N. Methratta E. Brabant R. (2020). Setting the context for offshore wind development effects on fish and fisheries.Oceanography33118–127. 10.5670/oceanog.2020.411
32
Gilles A. Scheidat M. Siebert U. (2009). Seasonal distribution of harbor porpoises and possible interference of offshore wind farms in the German North Sea.Mar. Ecol. Prog. Ser.383295–307. 10.3354/meps08020
33
Green R. H. (1979). Sampling design and statistical methods for environmental biologists.New York, NY: John Wiley and Sons.
34
Griffin R. A. Robinson G. J. West A. Gloyne-Phillips I. T. Richard K. Unsworth F. (2016). Assessing fish and motile fauna around offshore windfarms using stereo baited video.PLoS One11:e01. 10.1371/journal.pone.0149701
35
Harmelin-Vivien M. Le Diréach L. Bayle-Sempere J. Charbonnel E. García-Charton J. A. Ody D. (2008). Gradients of abundance and biomass across reserve boundaries in six Mediterranean marine protected areas: Evidence of fish spillover?Biol. Cons.1411829–1839. 10.1016/j.biocon.2008.04.029
36
Hasager C. B. Vincent P. Badger J. Badger M. Di Bella A. Peña A. et al (2015). Using satellite SAR to characterize the wind flow around offshore wind farms.Energies85413–s5439. 10.3390/en8065413
37
Hastie T. J. Tibshirani R. J. (1990). Generalized Additive Models.London: Chapman & Hall.
38
HDR (2019). Benthic Monitoring during Wind Turbine Installation and Operation at the Block Island Wind Farm, Rhode Island – Year 2. Final Report to the U.S. Department of the Interior, Bureau of Ocean Energy Management, Office of Renewable Energy Programs.OCS Study BOEM318:49701.
39
HDR (2020). Benthic and Epifaunal Monitoring During Wind Turbine Installation and Operation at the Block Island Wind Farm.Rhode Island: Final Report to the US Department of the Interior, Bureau of Ocean Energy Management, Office of Renewable Energy Programs.
40
Hurlbert S. H. (1984). Pseudoreplication and the design of ecological field experiments.Ecol. Monogr.54187–211. 10.2307/1942661
41
Hutchison Z. L. Gill A. B. Sigray P. Haibo H. King J. W. (2020). Anthropogenic electromagnetic fields (EMF) influence the behavior of bottom-dwelling marine species.Sci. Rep.10:4219. 10.1038/s41598-020-60793-x
42
Jackson D. Whitfield P. (2011). Guidance on survey and monitoring in relation to marine renewables deployments in Scotland.Scot. Nat. Herit. Mar. Scot.2011:4.
43
Joint Nature Conservation Committee [JNCC] (2015). Seabird Displacement Impacts from Offshore Wind Farms: report of the MROG Workshop.JNCC Report No 568, Scotland: JNCC Peterborough.
44
Jones I. T. Peyla J. F. Clark H. Song Z. Stanely J. A. Mooney T. A. (2021). Changes in feeding behavior of longfin squid (Doryteuthis pealeii) during laboratory exposure to pile driving noise.Mar. Env. Res.165:105250. 10.1016/j.marenvres.2020.105250
45
Kahlert J. Petersen I. K. Fox A. D. Desholm M. Clausager I. (2004). Investigations of birds during construction and operation of Nysted offshore wind farm at Rødsand.NERI Rep.20041–88. 10.1016/b978-0-12-410422-8.00001-7
46
Karama K. S. Matsushita Y. Inoue M. Kojima K. Tone K. Nakamura I. et al (2021). Movement pattern of red seabream Pagrus major and yellowtail Seriola quinqueradiata around offshore wind turbine and the neighboring habitats in the waters near Goto Islands, Japan.Aquacult. Fish.6300–308. 10.1016/j.aaf.2020.04.005
47
Kleisner K. M. Fogarty M. J. McGee S. Hare J. A. Moret S. Peretti C. T. et al (2017). Marine species distribution shifts on the U.S. Northeast Continental Shelf under continued ocean warming.Prog. Oceanogr.15324–36. 10.1016/j.pocean.2017.04.001
48
Klimely A. P. Putman N. F. Keller B. A. Noakes D. (2021). A call to assess the impacts of electromagnetic fields from subsea cables on the movement ecology of marine migrants.Conserv. Sci Pract.3:e436. 10.1111/csp2.436
49
Kraus S. D. Kenney R. D. Thomas L. (2019). A Framework for Studying the Effects of Offshore Wind Development on Marine Mammals and Turtles. Report for the Massachusetts Clean Energy Center, Boston, MA 02110, and the Bureau of Ocean Energy Management. May 2019, Vol. 20. Boston, MA: Bureau of Ocean Energy Management.
50
Krone R. Gutow L. Brey T. Dannheim J. Schroeder A. (2013). Mobile demersal megafauna at artificial structures in the German Bight – Likely effects of offshore wind farm development.Est. Coast. Shelf Sci.1251–9. 10.1016/j.ecss.2013.03.012
51
Lefaible N. Braeckman U. Moens T. (2018). “Effects of wind turbine foundations on surrounding macrobenthic communities,” in Environmental Impacts of Offshore Wind Farms in the Belgian Part of the North Sea: Assessing and Managing Effect Spheres of Influence, edsDegraerS.BrabantR.RumesB.VirginL. (Brussels: Royal Belgian Institute of Natural Sciences, OD Natural Environment, Marine Ecology and Management Section), 57–77.
52
Lefaible N. Colson L. Braeckman U. Moens T. (2019). Effects of turbine-related impacts on macrobenthic communities within two offshore wind farms during the operational phase. Brussels: Royal Belgian Institute of Natural Sciences. 47–63.
53
Lindeboom H. Degraer S. Dannheim J. Gill A. B. (2015). Offshore wind park monitoring programmes, lessons learned and recommendations for the future.Hydrobiologia756169–180. 10.1007/s10750-015-2267-4
54
Lu Z. Zhan X. Guo Y. Ma L. (2020). Small-scale effects of offshore wind-turbine foundations on macrobenthic assemblages in Pinghai Bay, China.J. Coast. Res.36139–147. 10.2112/jcoastres-d-19-00051.1
55
Mackenzie M. L. Scott-Hayward L. A. S. Oedekoven C. S. Skov H. Humphreys E. Rexstad E. (2013). Statistical Modelling of Seabird and Cetacean data: Guidance Document.Univ. Andr. Contr. Mar. Scot.2013:05.
56
Mavraki N. Degraer S. Moens T. Vanaverbeke J. (2019). Functional differences in trophic structure of offshore wind farm communities: a stable isotope study.Mar. Env. Res.157:104868. 10.1016/j.marenvres.2019.104868
57
McCullagh P. Nelder J. A. (1989). Generalized Linear Models, 2nd Edn. London: Chapman and Hall.
58
Mendel B. Schwemmer P. Peschko V. Muller S. Schwemmer H. Mercker M. et al (2019). Operational offshore wind farms and associated ship traffic cause profound changes in distribution patterns of Loons (Gavia spp.).J. Environ. Manage.231429–438. 10.1016/j.jenvman.2018.10.053
59
Methratta E. T. (2020). Monitoring fisheries resources at offshore wind farms: BACI vs. BAG designs.ICES J. Mar. Sci.2020:26. 10.1093/icesjms/fsaa026
60
Methratta E. T. Dardick W. R. (2019). Meta-analysis of finfish abundance at offshore wind farms.Rev. Fish. Sci. Aqua.27242–260. 10.1080/23308249.2019.1584601
61
Methratta E. T. Hawkins A. Hooker B. R. Lipsky A. Hare J. A. (2020). Offshore wind development in the Northeast US Shelf Large Marine Ecosystem: Ecological, human, and fishery management dimensions.Oceanography3316–27. 10.5670/oceanog.2020.402
62
Moland E. Olsen E. M. Knutsen H. Garrigou P. Espeland S. H. Kleiven A. R. et al (2013). Lobster and cod benefit from small-scale northern marine protected areas: inference from an empirical before-after control-impact study.Proc. Royal Soc. B.280:20122679. 10.1098/rspb.2012.2679
63
Mooney T. A. Andersson M. H. Stanley J. (2020). Acoustic impacts of offshore wind energy on fishery resources: An evolving source and varied effects across a wind farm’s lifetime.Oceanography3382–95. 10.5670/oceanog.2020.408
64
Munnelly R. T. Reeves D. B. Chesney E. J. Baltz D. M. (2020). Spatial and temporal influences of nearshore hydrography on fish assemblages associated with energy platforms in the Northern Gulf of Mexico.Estua. Coasts44269–285. 10.1007/s12237-020-00772-7
65
National Oceanic and Atmospheric Association [NOAA] (2020). Scientists collecting data on commercial fish species in wind energy lease areas. Available online at: www.fisheries.noaa.gov/feature-story/scientists-collecting-data-commercial-fish-species-wind-energy-lease-areas-0. (Accessed date July 1, 2021)
66
Paxton A. B. Shertzer K. W. Bacheler N. M. Kellison G. T. Riley K. L. Taylor J. C. (2020). Meta-analysis reveals artificial reefs can be effective tools for fish community enhancement but are not one-size-fits-all.Front. Mar. Sci.7:282. 10.3389/fmars.2020.00282
67
Perry R. L. Heyman W. D. (2020). Considerations for offshore wind energy development effects on fish and fisheries in the United States: A review of existing studies, new efforts, and opportunities for innovation.Oceanography3328–37. 10.5670/oceanog.2020.403
68
Petersen I. K. Christensen T. K. Kahlert J. Desholm M. Fox A. D. (2006). Final Results of Bird Studies at the Offshore Wind Farms at Nysted and Horns Rev, Denmark.Horns Rev: National Environmental Research Institute, Ministry of the Environment, 166.
69
Petersen I. K. Clausager I. Christensen T. J. (2004). “Bird numbers and distribution on the Horns Rev Offshore Wind Farm Area. Annual Status Report 2003,” in Report commissioned by Elsam Engineering A/S 2003, (Denmark: National Environmental Research Institute).
70
Petersen I. K. MacKenzie M. Rextad E. Wisz M. S. Fox A. D. (2011). Comparing Pre- and Post-Construction Distributions of Long-Tailed Ducks Clangula Hyemalis in and Around the Nysted Offshore Wind Farm, Denmark: A Quasi Designed Experiment Accounting for Imperfect Detection, Local Surface Features and Autocorrelation.17.
71
Petersen I. K. Nielsen R. D. Mackenzie M. L. (2014). Post-construction evaluation of bird abundances and distributions in the Horns Rev 2 offshore wind farm area, 2011 and 2012.Denmark: Aarhus University, DCE – Danish Centre for Environment and Energy, 51.
72
Petersen K. Fox A. D. (2007). Changes in bird habitat utilization around Horns Rev 1 offshore wind farm, with particular emphasis on Common Scoter.Nagpur: National Environmental Institute.
73
Reeds K. A. Smith J. A. Suthers I. M. Johnston E. L. (2018). An ecological halo surrounding a large offshore artificial reef: Sediments, infauna, and fish foraging.Mar. Environ. Res.14130–38. 10.1016/j.marenvres.2018.07.011
74
Reubens J. T. Degraer S. Vincx M. (2014). The ecology of benthopelagic fishes at offshore wind farms: A synthesis of 4 years of research.Hydrobiologia727121–136. 10.1007/s10750-013-1793-1
75
Reubens J. T. Pasotti F. Degraer S. Vincx M. (2013). Residency, site fidelity, and habitat use of Atlantic cod (Gadus morhua) at an offshore wind farm using acoustic telemetry.Mar. Environ. Res.90128–135. 10.1016/j.marenvres.2013.07.001
76
Reynolds E. M. Cowan J. H. Jr. Lewis K. A. Simosen K. A. (2018). Method for estimating relative abundance and species composition around oil and gas platforms in the northern Gulf of Mexico.U.S.A. Fish. Res.20144–55. 10.1016/j.fishres.2018.01.002
77
RODA (2020). Letter to NOAA Fisheries. Available online at: https://rodafisheries.org/wp-content/uploads/2020/01/200103-MA_RI-layout-proposal.pdf. (Accessed date January 8, 2021).
78
ROSA (2021). Available online at: https://www.rosascience.org/. (Accessed date January 11, 2021).
79
Russell D. J. Hastie G. D. Thompson D. Janik V. M. Hammond P. S. Scott-Hayward L. A. et al (2016). Avoidance of wind farms by harbour seals is limited to pile driving activities.J. Appl. Ecol.531642–1652. 10.1111/13652664.12678
80
Samhouri S. F. Haupt A. J. Levin P. S. Link J. S. Shuford R. (2014). Lessons learned from developing integrated ecosystem assessments to inform marine ecosystem-based management in the USA.ICES J. Mar. Sci.711205–1215. 10.1093/icesjms/fst141
81
Schweiger A. H. Severin D. H. I. Steinbauer M. J. Dengler J. Beierkuhnlein C. (2016). Optimizing sampling approaches along ecological gradients.Methods Ecol. Evo.7463–471. 10.1111/2041-210x.12495
82
Scott-Hayward L. Mackenzie M. L. Donovan C. R. Walker C. G. Ashe E. (2013). Complex Region Spatial Smoother (CReSS).J. Comp. Graph. Stat.2340–360. 10.1080/10618600.2012.762920
83
Sheehan E. V. Bridger D. Nancollas S. J. Pittman S. J. (2020). PelagiCam: a novel underwater imaging system with computer vision for semi-automated monitoring of mobile marine fauna at offshore structures.Environ. Mon. Assess.192:11. 10.1007/s10661-019-7980-4
84
Slavik K. Lemmen C. Zhang W. Kerimoglu O. Klingbeil K. Wirtz K. W. (2018). The large scale impact of offshore wind farm structures on pelagic primary production in the southern North Sea.Hydrobiologia84535–53. 10.1007/s10750-018-3653-5
85
Smith A. K. Ajani P. A. Roberts D. E. (1999). Spatial and temporal variation in fish assemblages exposed to sewage and implications for management.Mar. Environ. Res.47241–260. 10.1016/s0141-1136(98)00120-2
86
Smokorowski K. E. Randall R. G. (2017). Cautions on using the before-after-control-impact design in environmental effects monitoring programs.FACETS2212–232. 10.1139/facets-2016-0058
87
Snodgrass D. J. G. Orbesen E. S. Walter J. F. Hoolihan J. P. Brown C. A. (2020). Potential impacts of oil production platforms and their function as fish aggregating devices on the biology of highly migratory fish species.Rev. Fish. Biol. Fish.30405–422. 10.1007/s11160-020-09605-z
88
Stenberg C. Stottrup J. G. van Deurs M. Berg C. W. Dinesen G. E. Mosegaard H. et al (2015). Long-term effects of an offshore wind farm in the North Sea on fish communities.Mar. Ecol. Prog. Ser.528257–265. 10.3354/meps11261
89
Stewart-Oaten A. Bence J. R. (2001). Temporal and spatial variation in environmental impact assessment.Ecol. Monogr.71305–339. 10.1890/0012-9615(2001)071[0305:tasvie]2.0.co;2
90
Stewart-Oaten A. Murdoch W. W. Parker K. R. (1986). Environmental impact assessment: “Pseudoreplication” in time?Ecology67929–940. 10.2307/1939815
91
Stoekle M. Y. Adolf J. Charlop-Powers Z. Dunton K. J. Hinks G. VanMorter S. M. (2020). Trawl and eDNA assessment of marine fish diversity, seasonality, and relative abundance in coastal New Jersey, USA.ICES J. Mar. Sci.2020:225. 10.1093/icesjms/fsaa225
92
Streich M. K. Ajemian M. J. Wetz J. J. Stunz G. W. (2018). Habitat-specific performance of vertical line gear in the western Gulf of Mexico: a comparison between artificial and natural habitats using a paired-video approach.Fish. Res.20416–25. 10.1016/j.fishres.2018.01.018
93
Thompson P. M. Lusseau D. Barton T. Simmons D. Rusin J. Bailey H. (2010). Assessing the responses of coastal cetaceans to the construction of offshore wind turbines.Mar. Poll. Bull.601200–1208. 10.1016/j.marpolbul.2010.03.030
94
Tougaard J. Carstensen J. Teilmann J. Skov H. Rasmussen P. (2009). Pile driving zone of responsiveness extends beyond 20 km for harbor porpoises (Phocoena phocoena (L.).J. Acoust. Soc. Amer.12611–14.
95
Underwood A. J. (1991). Beyond BACI: experimental designs for detecting human environmental impacts on temporal variations in natural populations.Aust. J. Mar. Freshw. Res.42569–587. 10.1071/mf9910569
96
Underwood A. J. (1992). Beyond BACI: the detection of environmental impacts on populations in the real, but variable, world.J. Exp. Mar. Biol. Ecol.161145–178. 10.1016/0022-0981(92)90094-q
97
Underwood A. J. (1993). The mechanics of spatially replicated sampling programmes to detect environmental impacts in a variable world.Aust. J. Ecol.1899–116. 10.1111/j.1442-9993.1993.tb00437.x
98
Underwood A. J. (1994). On beyond BACI: sampling designs that might reliably detect environmental disturbances.Ecol. Appl.43–15. 10.2307/1942110
99
van Berkel J. Burchard H. Christensen A. Mortensen L. O. Svenstrup Petersen O. Thomsen F. (2020). The effects of offshore wind farms on hydrodynamics and implications for fishes.Oceanography33108–117. 10.5670/oceanog.2020.410
100
van Hal R. Griffioen A. B. van Keeken O. A. (2017). Changes in fish communities on a small spatial scale, an effect increased habitat complexity by an offshore wind farm.Mar. Environ. Res.12626–36. 10.1016/j.marenvres.2017.01.009
101
Van Hoey G. Wischnewski J. Craeymeersch J. Dannheim J. Enserink L. Guerin L. et al (2019). Methodological elements for optimizing the spatial monitoring design to support regional benthic ecosystem assessments.Environ. Monitor. Assess.191:423. 10.1007/s10661-019-7550-9
102
Vandendriessche S. Derweduwen J. Hostens K. (2015). Equivocal effects of offshore wind farms in Belgium on soft substrate epibenthos and fish assemblages.Hydrobiologia75619–35. 10.1007/s10750-014-1997-z
103
Vanermen N. Courtens W. Daelemans R. Lens L. Muler W. Van de Walle M. et al (2020). Attracted to the outside: a meso-scale response pattern of lesser black-backed bulls at an offshore wind farm revealed by GPS telemetry.ICES J. Mar. Sci.77701–710. 10.1093/icesjms/fsz199
104
Welcker J. Nehls G. (2016). Displacement of seabirds by an offshore wind farm in the North Sea.Mar. Ecol. Prog. Ser.554173–182. 10.3354/meps11812
105
Wetz J. J. Ajemian M. J. Shipley B. Stunz G. W. (2020). An assessment of two visual survey methods for documenting community structure on artificial platform reefs in the Gulf of Mexico.Fish. Res.225:105492. 10.1016/j.fishres.2020.105492
106
Whittaker R. H. (1967). Gradient analysis of vegetation.Biol. Rev.42207–264.
107
Wiens J. A. (1989). Spatial scaling in ecology.Funct. Ecol.3385–397. 10.2307/2389612
108
Wilding T. A. Gill A. B. Boon A. Sheehan E. Dauvin J. C. Pezy J. P. et al (2017). Turning off the DRIP (‘Data-rich, information-poor’) – rationalizing monitoring with a focus on marine renewable energy developments and the benthos.Renew. Sustain. Energy Rev.74848–859. 10.1016/j.rser.2017.03.013
109
Wilhelmsson D. Malm T. (2008). Fouling assemblages on offshore wind power plants and adjacent substrata.Estuar. Coast. Shelf Sci.79459–466. 10.1016/j.ecss.2008.04.020
110
Wilhelmsson D. Malm T. Öhman M. C. (2006). The influence of offshore windpower on demersal fish.ICES J. Mar. Sci.63775–784. 10.1016/j.icesjms.2006.02.001
111
Wilkin J. Rosenfeld L. Allen A. Baltes R. Baptista A. He R. et al (2017). Advancing coastal ocean modeling, analysis, and prediction for the US Integrated Ocean Observing System.J. Operat. Oceanogr.12115–126. 10.1080/1755876X.2017.1322026
112
Winiarski K. Burt M. L. Rexstad E. Miller D. L. Trocki C. L. Paton P. W. C. et al (2014). Integrating aerial and ship surveys of marine birds into a combined density surface model: A case study of wintering Common Loons.Condor.116149–161. 10.1650/CONDOR-13-085.1
113
Wood S. N. (2006). Generalized Additive Models: An Introduction with R.London: Chapman & Hall.
114
Zemeckis D. R. Dean M. J. DeAngelis A. I. Van Parijs S. M. Hoffman W. S. Baumgartner M. F. et al (2019). Identifying the distribution of Atlantic cod spawning using multiple fixed and glider-mounted acoustic technologies.ICES J. Mar. Sci.761610–1625. 10.1093/icesjms/fsz064
115
Zuur A. F. Ieno E. N. Walker N. J. Saveliev A. A. Smith G. M. (2009). Mixed Effect Models and Extensions in Ecology with R.Berlin: Springer Science & Business Media, LLC.
Summary
Keywords
BACI, gradient, BAG, marine renewable energy, methodology, sampling design
Citation
Methratta ET (2021) Distance-Based Sampling Methods for Assessing the Ecological Effects of Offshore Wind Farms: Synthesis and Application to Fisheries Resource Studies. Front. Mar. Sci. 8:674594. doi: 10.3389/fmars.2021.674594
Received
01 March 2021
Accepted
13 July 2021
Published
05 August 2021
Volume
8 - 2021
Edited by
Juan Jacobo Schmitter-Soto, The South Border College (ECOSUR), Mexico
Reviewed by
Stephen Buckland, University of St Andrews, United Kingdom; Mauro Sinopoli, Stazione Zoologica Anton Dohrn Napoli, Italy
Updates
Copyright
© 2021 Methratta.
This is an open-access article distributed under the terms of the Creative Commons Attribution License (CC BY). The use, distribution or reproduction in other forums is permitted, provided the original author(s) and the copyright owner(s) are credited and that the original publication in this journal is cited, in accordance with accepted academic practice. No use, distribution or reproduction is permitted which does not comply with these terms.
*Correspondence: Elizabeth T. Methratta, Elizabeth.Methratta@noaa.gov
This article was submitted to Marine Ecosystem Ecology, a section of the journal Frontiers in Marine Science
Disclaimer
All claims expressed in this article are solely those of the authors and do not necessarily represent those of their affiliated organizations, or those of the publisher, the editors and the reviewers. Any product that may be evaluated in this article or claim that may be made by its manufacturer is not guaranteed or endorsed by the publisher.