 Julia Grosse
 Eva-Maria Nöthig
 Sinhué Torres-Valdés
 Anja Engel
- 1Biological Oceanography, GEOMAR Helmholtz Centre for Ocean Research Kiel, Kiel, Germany
- 2Polar Biological Oceanography, Alfred Wegener Institute Helmholtz Center for Polar and Marine Research, Bremerhaven, Germany
- 3Marine Biogeoscience, Alfred Wegener Institute Helmholtz Center for Polar and Marine Research, Bremerhaven, Germany
Amino acids (AA) and carbohydrates (CHO) are important components of the marine organic carbon cycle. Produced mainly by phytoplankton as part of the particulate organic carbon (POC) fraction, these compounds can be released into the outer medium where they become part of the dissolved organic carbon (DOC) pool and are rapidly taken up by heterotrophs (e.g., bacteria). We investigated the quantity and quality of POC and DOC, AA and CHO composition in both pools in three different water masses in the Fram Strait (Arctic Ocean) in summer 2017. Polar Waters and Atlantic Waters showed similar concentrations of particulate and dissolved AA and CHO, despite Polar Waters showing the highest DOC concentrations. In Mixed Waters, where the two water masses mix with each other and with melting sea ice, the concentrations of particulate and dissolved AA and CHO were highest. AA and CHO composition differed substantially between the particulate and dissolved fractions. The particulate fraction (>0.7 μm) was enriched in essential AA and the CHO galactose, xylose/mannose, and muramic acid. In the dissolved fraction non-essential AA, several neutral CHO, and acidic and amino CHO were enriched. We further investigated different size fractions of the particulate matter using a separate size fractionation approach (0.2–0.7 μm, 0.7–10 μm and >10 μm). The chemical composition of the 0.2–0.7 μm size-fraction had a higher contribution of non-essential AA and acidic and amino sugars, setting them apart from the 0.7–10 μm and >10 μm fractions, which showed the same composition. We suggest that the relative differences observed between different size fractions and DOC with regards to AA and CHO composition can be used to evaluate the state of organic matter processing and evaluate the contribution of autotrophic phytoplankton or more heterotrophic biomass. In the future, changing conditions in the Central Arctic Ocean (Atlantification, warming, decreasing ice concentrations) may increase primary production and consequently degradation. The AA and CHO signatures left behind after production and/or degradation processes occurred, could be used as tracers after the fact to infer changes in microbial loop processes and food web interactions.
Introduction
Through photosynthesis phytoplankton cells (and also sea-ice algae in higher latitudes) take up inorganic carbon and incorporate it into numerous organic molecules. The four major biomolecules, amino acids (AA), carbohydrates (CHO), fatty acids, and DNA/RNA make up the bulk part of cell biomass (Geider and LaRoche, 2002). Their synthesis depends on availability of light, temperature and the overall physiological state of phytoplankton cells, however, intra-cellular proportions are also massively regulated by N and P availability, consequently affecting biomolecule synthesis rates, cellular C:N:P ratios and overall growth rates (Arrigo et al., 1999; Falkowski, 2000; Geider and LaRoche, 2002). Under nutrient limiting conditions the partitioning of C into C-rich storage compounds such as carbohydrates or triglycerides is increased and the partitioning between essential AA (EAA) and non-essential AA (NEAA) is affected (Grosse et al., 2017, 2018). Additionally, the contribution of individual AA and CHO to total AA and CHO concentrations in phytoplankton can depend on community composition (Markou et al., 2012 and references therein).
Phytoplankton cells can actively excrete organic matter (OM) (Baines and Pace, 1991; Thornton, 2014) hence AA and CHO become part of the dissolved organic matter pool (DOM) that small heterotrophic consumers (e.g., bacteria) depend on. Other pathways by which OM enters the dissolved pool include passive release through the cell membrane (Marañón et al., 2004), through cell destruction via viral lysis or grazing (Brussaard, 2004; Saba et al., 2011), or enzymatic degradation of particulate organic matter (Wetz et al., 2008). Overall, the released AA and CHO can contribute up to 20% to open ocean DOC pool and even more in shelf areas (Pakulski and Benner, 1992; Davis et al., 2009; Kaiser and Benner, 2009; Panagiotopoulos et al., 2014).
The accessibility of total dissolved AA and dissolved combined CHO (TDAA and DCCHO) for bacteria depends on the molecular complexity. For example, monosaccharides and single (free) AA are labile, taken up quickly by bacteria, and have short turnover times of minutes to days. In their study Luo et al. (2010) determined that labile compounds alone cannot support bacterial biomass in the ocean but that up to 40% of bacterial C-demand is satisfied by semi-labile OM. The semi-labile fraction has two major contributors: Oligo- and polysaccharides (combined CHO) and peptides (combined AA) (Søndergaard et al., 2000; Engel and Haendel, 2011). Because of their higher complexity, turnover times of the semi-labile fraction range from months to years (Hansell et al., 2009).
Individual AA and CHO are taken up preferentially based on their molecular structure and can be reworked into more degraded compounds (Dauwe and Middelburg, 1998; Veuger et al., 2012). For example, loss rates of the individual amino acids isoleucine, threonine, and valine were high during a long-term degradation experiment, while glycine showed low rates, and no loss was detected for lysine and proline (Veuger et al., 2012). As some molecules are precursors or breakdown products of others, the synthesis/degradation of one will lead to a relative accumulation of another. Using the molecular composition of the AA pool, a degradation index was developed to infer the relative age or “freshness” of a sample (Dauwe and Middelburg, 1998; Kaiser and Benner, 2009). Similarly, dissolved carbohydrates degradation alters neutral CHO composition, for example by a relative decrease in arabinose and galactose and a relative increase in glucose (Amon and Benner, 2003; Goldberg et al., 2009; Engel et al., 2012).
So far, studies have focused on either the dissolved or the particulate pool or on either AA or CHO (Borchard and Engel, 2015). But a concurrent assessment of the AA and CHO composition in different size fractions (e.g., phytoplankton, bacteria, DOC) would be necessary to characterize source-sink interactions.
Our study aims to determine the quantity and quality of individual biomolecules within the particulate and dissolved OM pools. To evaluate if the biomolecule composition of producers is mirrored by heterotrophic bacteria, we also investigated biomolecule composition of three different POC size fractions. The three studied fractions targeted larger primary producers such as Phaeocystis sp. colony stages and larger or chain-forming diatoms (>10μm), smaller primary producers and protozoa, i.e., Phaeocystis sp. single flagellates or other nano- and dinoflagellates (0.7–10 μm) and small auto- and heterotrophs including bacteria and archaea (consumers, 0.2–0.7 μm).
Our study took place in the Fram Strait, the only deep gateway to the central Arctic Ocean, an ocean heavily impacted by climate change. The eastern Fram Strait is influenced by warm and saline Atlantic Water (AW), which is transported north via the West Spitsbergen Current (WSC, e.g., Cottier et al., 2005; Beszczynska-Möller et al., 2012; Appen et al., 2016). In the west, the East Greenland Current (EGC) transports cold and fresher Polar Water (PW) along the Greenland continental shelf break toward the South (e.g., de Steur et al., 2009). Compared to the AW, the PW contains higher DOC concentrations that originate from terrigenous sources supplied by Arctic Rivers via the Transpolar Drift (Hansell et al., 2004). The East Greenland Polar Front System separates these two water masses (Paquette et al., 1985). However, substantial horizontal mixing and exchange by eddies can occur (Wekerle et al., 2017) and together with meltwater from drifting ice floes produce an Mixed Water (MW) body.
We hypothesize that water masses differ in the quantity and quality of their biomolecule composition. To address this hypothesis, we focus on two main questions: (1) to what extent do water masses affect the biomolecule composition of POC and DOC in terms of concentration and composition, (2) does the biomolecule composition differ between size fractions of particulate matter?
Materials and Methods
Study Area and Sample Collection
During the summer season of 2017 (23 July–19 August), a total of 15 stations were sampled within the LTER observatory HAUSGARTEN with the research vessel RV Polarstern (Figure 1). The sampling was carried out using 12L Niskin bottles attached to a CTD rosette (Sea-Bird Electronics Inc. SBE 991 plus probe), equipped with temperature and conductivity sensors, as well as a pressure sensor, altimeter, chlorophyll a (Chl a) fluorometer, and transmissometer. Hydrographic data, including temperature and salinity, was retrieved from PANGAEA (von Appen and Rohardt, 2018). Water samples were taken from 5 depths: Above Chl a maximum (10 m), at the Chl a maximum (according to the fluorescence sensor in 15–35 m), below Chl a maximum (20–45 m), at 50 and 100 m. Subsamples were taken as described below and stored for later analysis in the home laboratory.
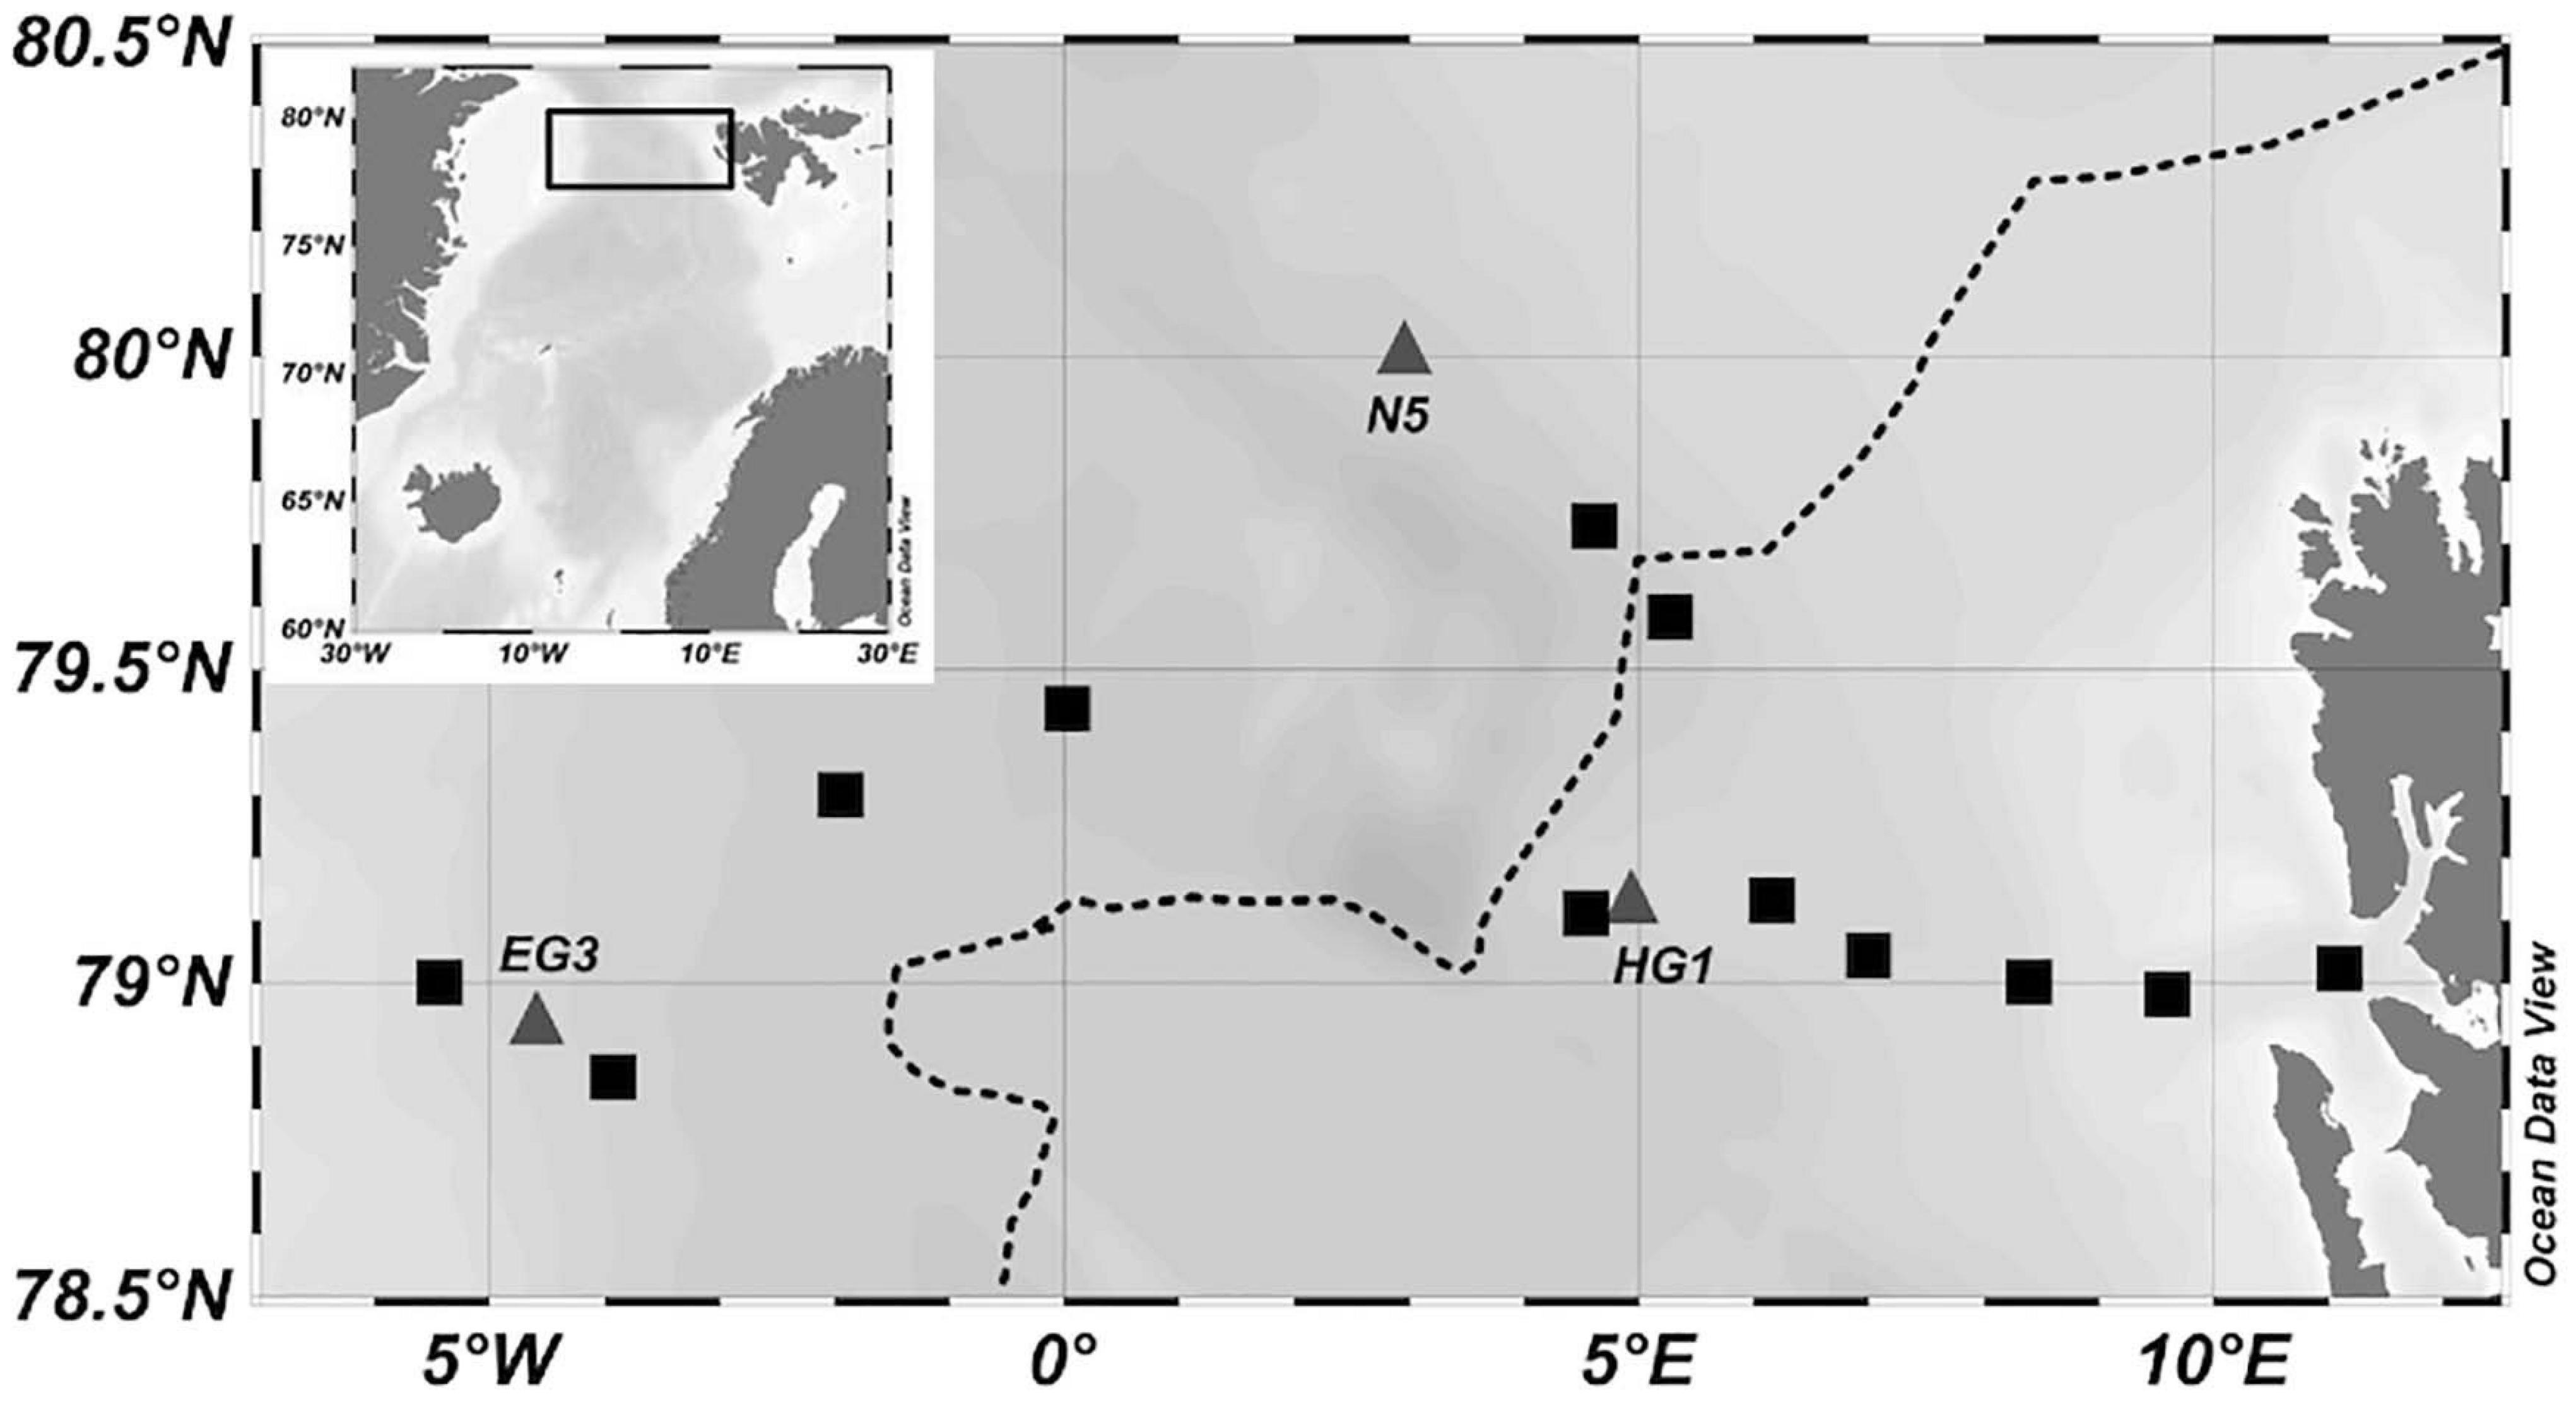
Figure 1. Map of stations sampled for dissolved and particulate compounds (black squares and gray triangles). Size fractionation was performed on stations EG3, HG1, and N5, depicted as gray triangles. The dotted black line indicates the sea ice monthly median edge retrieved from https://www.meereisportal.de (Spreen et al., 2008).
A size fractionation of PAA and PCHO was performed at stations HG1, EG3, and N5 (Figure 1). First, 600 ml of sample was filtered over a 10 μm gauze. Visible zooplankton individuals (e.g., copepods) were carefully removed using tweezers. Contents from the gauze were washed onto a pre-combusted GF/F filter (4 h, 500°C) using filtered seawater (0.2 μm) resulting in one replicate for >10 μm. The filtrate was again filtered over pre-combusted GF/F filters in duplicates of 300 ml and a cut-off at 0.7 μm. The filtrate was then filtered over Supor Filters (0.2 μm, Pall) to collect the size fraction 0.2–0.7 μm. All samples were stored in pre-combusted aluminum-foil packs (4 h, 500°C) at–20°C and analyzed as described below.
Dissolved and Particulate Organic Carbon (DOC, POC)
Samples for DOC were taken in duplicates by filtering 20 ml of seawater through GMF filters (0.45 μm) and collected in combusted glass ampoules (4 h, 500°C). Samples were acidified with 20 μl of 30% hydrochloric acid, flame sealed, and stored at 4°C in the dark until analysis. In the lab, DOC samples were analyzed by high-temperature catalytic oxidation (TOC -VCSH, Shimadzu, Sugimura and Suzuki, 1988) using the modified protocol after Engel and Galgani (2016).
POC samples were taken by filtering aliquots of 1–6 L of seawater onto combusted GF/F filters (4 h at 500°C). Filters were stored frozen (–20°C) until analysis. In the lab, filters were soaked in 0.1N HCl for removal of inorganic carbon and dried at 60°C. POC concentrations were determined with a Carlo Erba CHN elemental analyzer (Sharp, 1974).
Dissolved and Particulate Biomolecules (TDAA, PAA, DCCHO, PCHO)
TDAA samples were taken by filtering 4 ml of seawater through 0.45 μm Acrodisc syringe filters into pre-combusted glass vials (4 h, 500°C) and stored frozen at −20°C until analysis. TDAA samples contain free AA and combined AA from proteins. PAA samples were obtained by filtering 200 ml over pre-combusted GF/F filters (4 h, 500°C) and stored frozen (–20°C). The analysis was performed according to Lindroth and Mopper (1979) and Dittmar et al. (2009) with some modifications. 1 ml of TDAA sample or PAA-GF/F filter in 1 ml MilliQ were hydrolyzed with 1 ml of 30% hydrochloric acid (Merck, supra pure, 4.8 M final concentration) in sealed ampoules at 100°C for 20 h. The 2 ml TDAA hydrolyzate or 100 μl PAA hydrolyzate were dried in a microwave at 60°C under a nitrogen atmosphere and washed twice with 0.5 ml of MilliQ to remove any remaining acid. TDAA samples were re-dissolved in 1 ml MilliQ for analysis, PAA samples were re-dissolved in 2 ml MilliQ and mixed with 9:1 borate buffer (pH 9.5). A 1260 HPLC system (Agilent) with a C18 column (Phenomenex Kinetex, 2.6 μm, 150 × 4.6 mm) was used for analysis after separation of thirteen different amino acids and in-line derivatization with o-phtaldialdehyde and mercaptoethanol. A linear gradient was run with 100% Solvent A [5% Acetonitrile (LiChrosolv, Merck, HPLC gradient grade) in Sodiumdihydrogenphospate buffer (pH 7.0; Merck, suprapur)] to 22% solvent B (Acetonitrile) in 50 min. The following standards were used: Asparagine + aspartic acid (AsX), glutamine + glutamic acid (GlX), serine (Ser), glycine (Gly), threonine (Thr), arginine (Arg), alanine (Ala), tyrosine (Tyr), valine (Val), isoleucine (Ile), phenylalanine (Phe), leucine (Leu), and γ- aminobutyric acid (GABA). A summary of abbreviations can be found in Table 1.
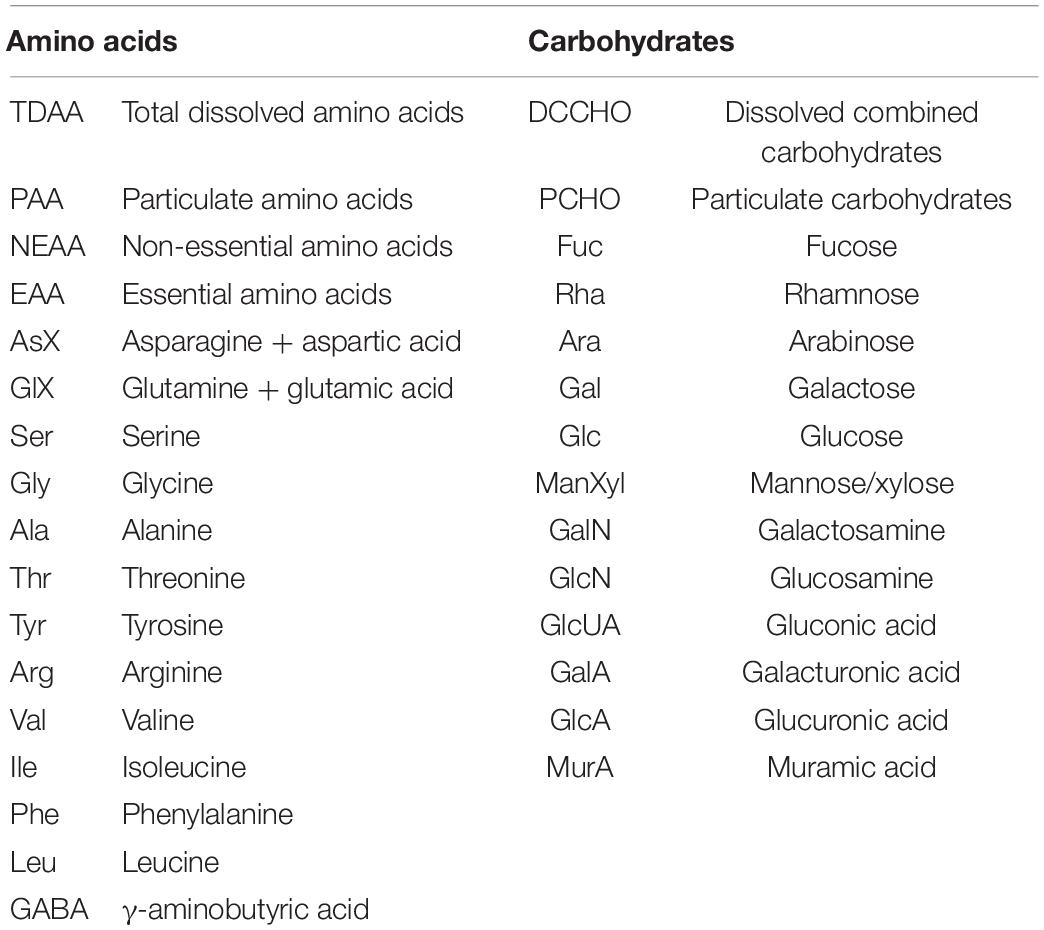
Table 1. Glossary of abbreviations of sub-classes and individual amino acids and carbohydrates.
Samples for DCCHO (>1 kDa) were taken by filtering 20 ml of seawater through 0.45 μm Acrodisc syringe filters into pre-combusted glass vials (4 h, 500°C) and stored frozen at −20°C until analysis. PCHO samples were obtained by filtering 200 ml over pre-combusted GF/F filters (4 h, 500°C) and stored frozen (–20°C). The analysis was conducted according to Engel and Haendel (2011). DCCHO samples were first desalinated by membrane dialysis (1 kDa MWCO, Spectra Por) for 5 h at 1°C. DCCHO and PCHO samples were hydrolyzed for 20 h at 100°C with 0.4 M HCl final concentration and then neutralized through acid evaporation under vacuum and nitrogen atmosphere (1 h, 60°C). Samples were analyzed using high-performance anion-exchange chromatography coupled with pulsed amperometric detection (HPAEC-PAD) on a Dionex ICS 3000. The system was calibrated with a mixed sugar standard solution including the neutral sugars: Fucose (Fuc), rhamnose (Rha), arabinose (Ara), galactose (Gal), xylose/mannose (Xyl/Man), and glucose (Glc), the amino sugars: Galactosamine (GalN), glucosamine (GlcN), and the acidic sugars: Galacturonic acid (GalA), gluconic acid (GluUA), glucuronic acid (GlcA) and muramic acid (MurA). A summary of abbreviations can be found in Table 1. Concentrations of GlcUA were below detection limits for PCHO and DCCHO samples and were only detected in very low concentrations in two size-fractions at HG1.
Nutrients, Chlorophyll a, TEP
Samples for the analysis of inorganic nutrients were collected directly from Niskin into sterile 50 ml Falcon tubes. The tubes were rinsed with sample water three times before the sample was drawn. Samples were then stored at –20°C for later analysis on land. Inorganic nutrients (nitrate + nitrite, nitrite, phosphate, silicate, and ammonium) were analyzed with a QuAAtro Seal Analytical continuous flow autoanalyzer following the manufacturers methods, which are based on common colorimetric techniques after Grasshoff et al. (2009). All measurements were calibrated using a set of five nutrient standards prepared with commercially available Merck solutions (traceable to SRM from NIST). These standards were prepared in an artificial seawater (ASW) matrix, which was also used as wash-water between the samples. The accuracy of the analysis was assessed via the measurement of KANSO Ltd. (Japan) Certified Reference Materials. Detection limits were: Nitrate + nitrite [NO3– + NO2–] 0.05 μM, nitrite [NO2–] 0.005 μM; phosphate [PO43–] 0.01 μM; silicate [Si(OH)4] 0.02 μM; ammonium [NH4+] 0.01 μM.
Chlorophyll a (Chl a) samples were taken by filtering 0.5–2 L seawater onto glass fiber filters (Whatman GF/F) under low vacuum (<200 mbar). All filters were stored at −20°C until pigments were extracted with 5–10 ml of 90% acetone. First, filters were sonicated in an ice bath for <1 min, and subsequently extracted at 4°C for 2 h. Before the measurement, samples were centrifuged for 10 min at 5,000 rpm at 0°C. Chl-a concentration was determined fluorometrically (Turner Designs), together with total pheophytin concentration after acidification (HCl, 1.0 N) slightly modified to the methods described in Edler (1979) and Evans et al. (1987), respectively. The standard deviation of replicate test samples was (<10%).
The acidic polysaccharide-containing transparent exopolymer particles (TEP) were analyzed by photometric analysis. Therefore, 60–150 ml samples were filtered onto 0.4 μm polycarbonate filters, stained with a calibrated Alcian Blue solution and rinsed with several milliliter of ultrapure water (Passow and Alldredge, 1995). The filters were stored at–20°C until spectrophotometric analysis in the home laboratory. The adsorption of Alcian Blue to the sample was detected colorimetrically. In order to dissolve particles, each filter was incubated for 3 h in 6 ml of H2SO4 (80%). Subsequently, the solution was measured at 787 nm with an UV-Vis spectrophotometer (Shimadzu UV-1700 PharmaSpec). Xanthan gum was used for calibration, and total TEP concentrations are given in mg xanthan gum equivalent (Xeq) L–1.
Statistical Analysis
Statistical comparison of water mass composition of OM constituents and nutrients was conducted using the Kruskal-Wallis ANOVA because datasets showed no normal distribution after Kolmogorov-Smirnov-test. Post hoc comparison of means (Wilcox test) was used to assess significant differences among water masses.
Principle component analysis (PCA) was performed to explore differences in individual AA and CHO composition between dissolved and particulate pools. Data for the relative contribution (%) of individual AA and CHO concentrations to total AA and CHO concentrations (nmol L–1) was used. The package CRAN:factoMineR in the open-source software R was used for the PCA analysis using a correlation matrix (Lê et al., 2008; R Development Core Team, 2014).
Results
Three different water masses were identified using temperature, salinity, and density data according to Cokelet et al. (2008, Figure 2). The main water mass in the eastern part of the Fram Strait was Atlantic Water (AW) defined by temperatures > 2°C and salinities > 34.9. Polar Water (PW) was encountered with temperatures < 0°C and salinity < 34.7, in the western Fram Strait. Stations, where the two water masses mix and the sea surface layer was impacted by sea-ice melt, were referred to as Mixed Water (MW). MW temperatures ranged between 0 and 7.2°C and MW salinities ranged between 29.6 and 34.9. Water mass specific differences in nutrient distribution occurred as well (Supplementary Figure 1). In general, PW was characterized by higher concentrations of PO43– and Si(OH)4. Significant differences in NO3– only occurred between AW and PW in sampling depths below the Chl a maximum. The upper two water depths (Chl a maximum and above) showed no significant differences. Average concentrations and concentration ranges for Chl a and TEP were similar for AW and PW and highest in MW (Table 2 and Supplementary Figure 2).
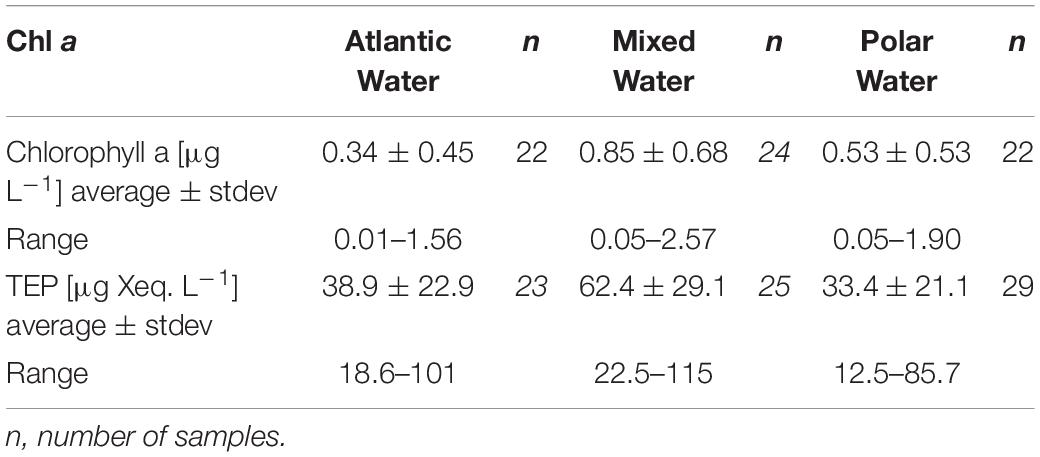
Table 2. Chlorophyll a and TEP distribution across the different water masses.
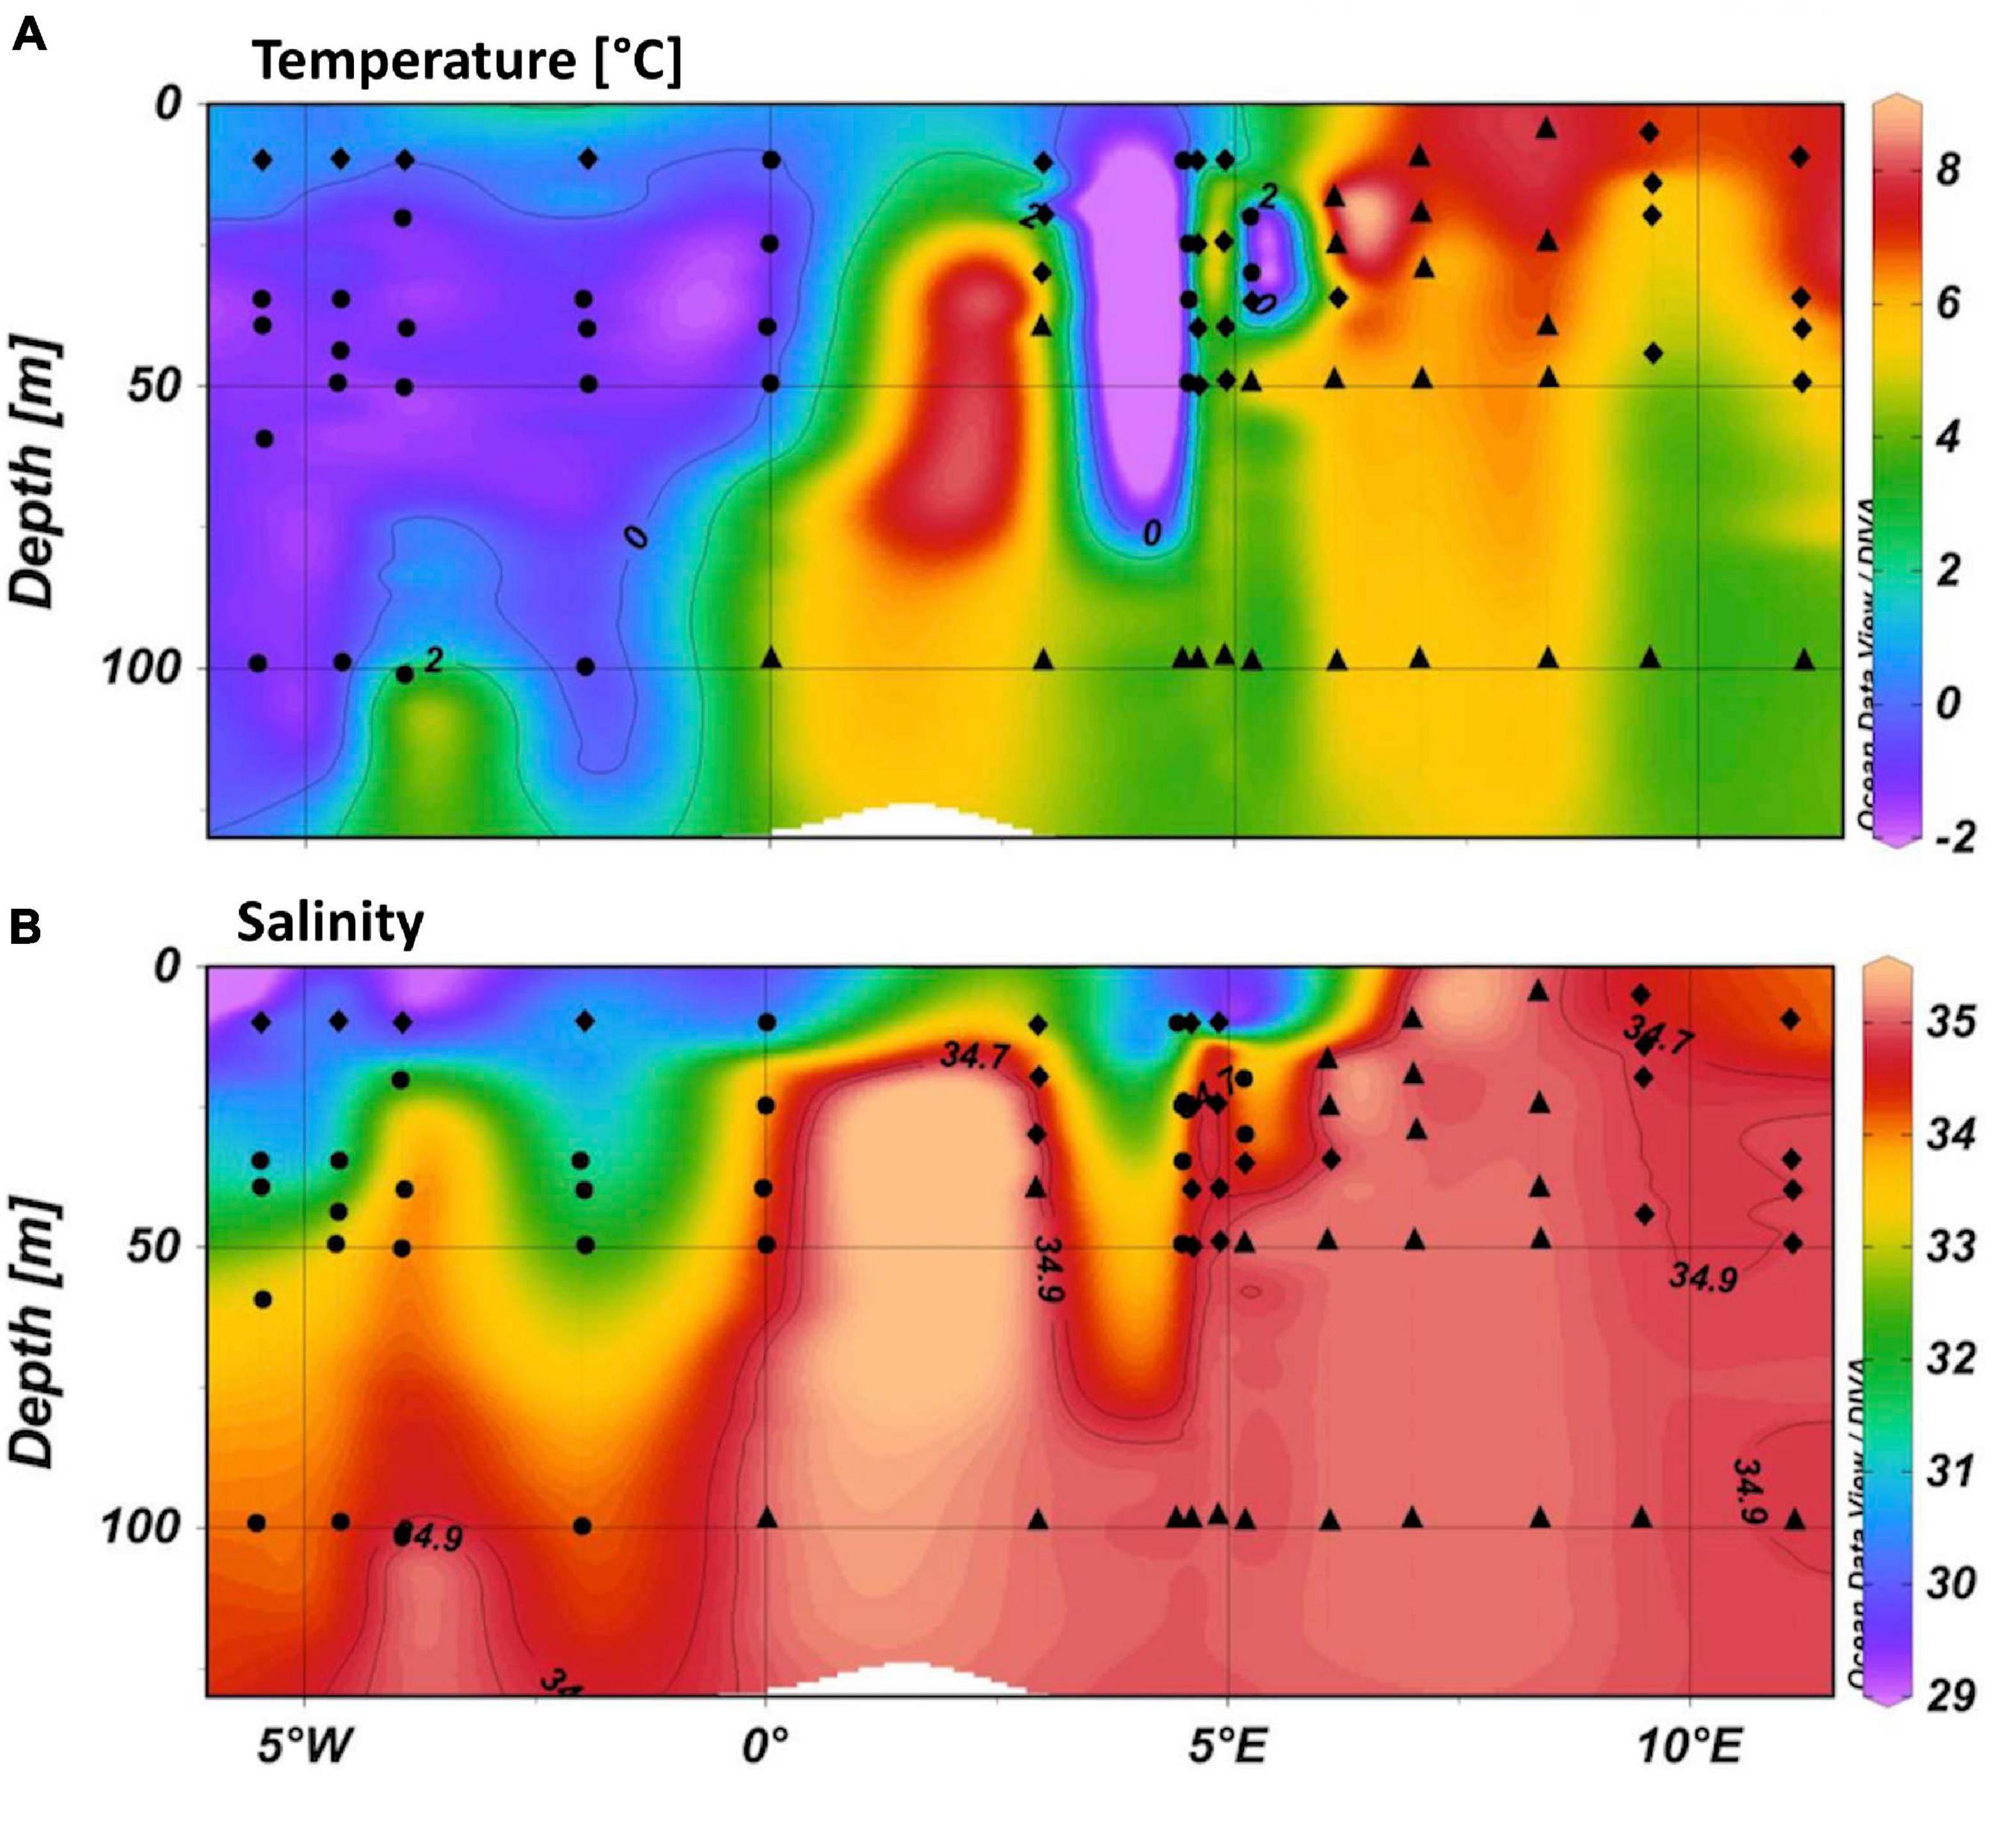
Figure 2. Temperature (A) and salinity (B) plotted along the cruise track using 1 m averaged CTD data. Water masses were identified after Cokelet et al. (2008). Circles identify Polar Water (PW), diamonds identify Mixed Water (MW), and triangles identify Atlantic Water (AW).
Distribution of Dissolved and Particulate Constituents
Highest POC, PAA, and PCHO concentrations were found in MW. Their respective concentrations ranged between 1.1 and 21 μmol L–1 for POC, 0.27–6.5 μmol C L–1 for PAA and 0.02–0.86 μmol C L–1 for PCHO (Figure 3 and Supplementary Figure 3). Contribution of PAA to POC was 28 ± 16% (n = 62), PCHO contributed 4.8 ± 2.7% to POC (n = 63, Supplementary Figure 4). Concentrations of DOC were highest in PW, decreased in MW and were lowest in AW ranging between 56 and 101 μmol C L–1 (Figure 3 and Supplementary Figure 3). TDAA concentrations ranged between 0.32 and 1.7 μmol C L–1 and DCCHO concentrations between 0.88 and 4.3 μmol C L–1, contributing an average of 0.9 ± 0.4% (n = 74) and 2.7 ± 1% (n = 73) to DOC concentration, respectively (Supplementary Figure 4). Both dissolved biomolecule fractions showed highest concentrations in the MW (Figure 3 and Supplementary Figure 3).
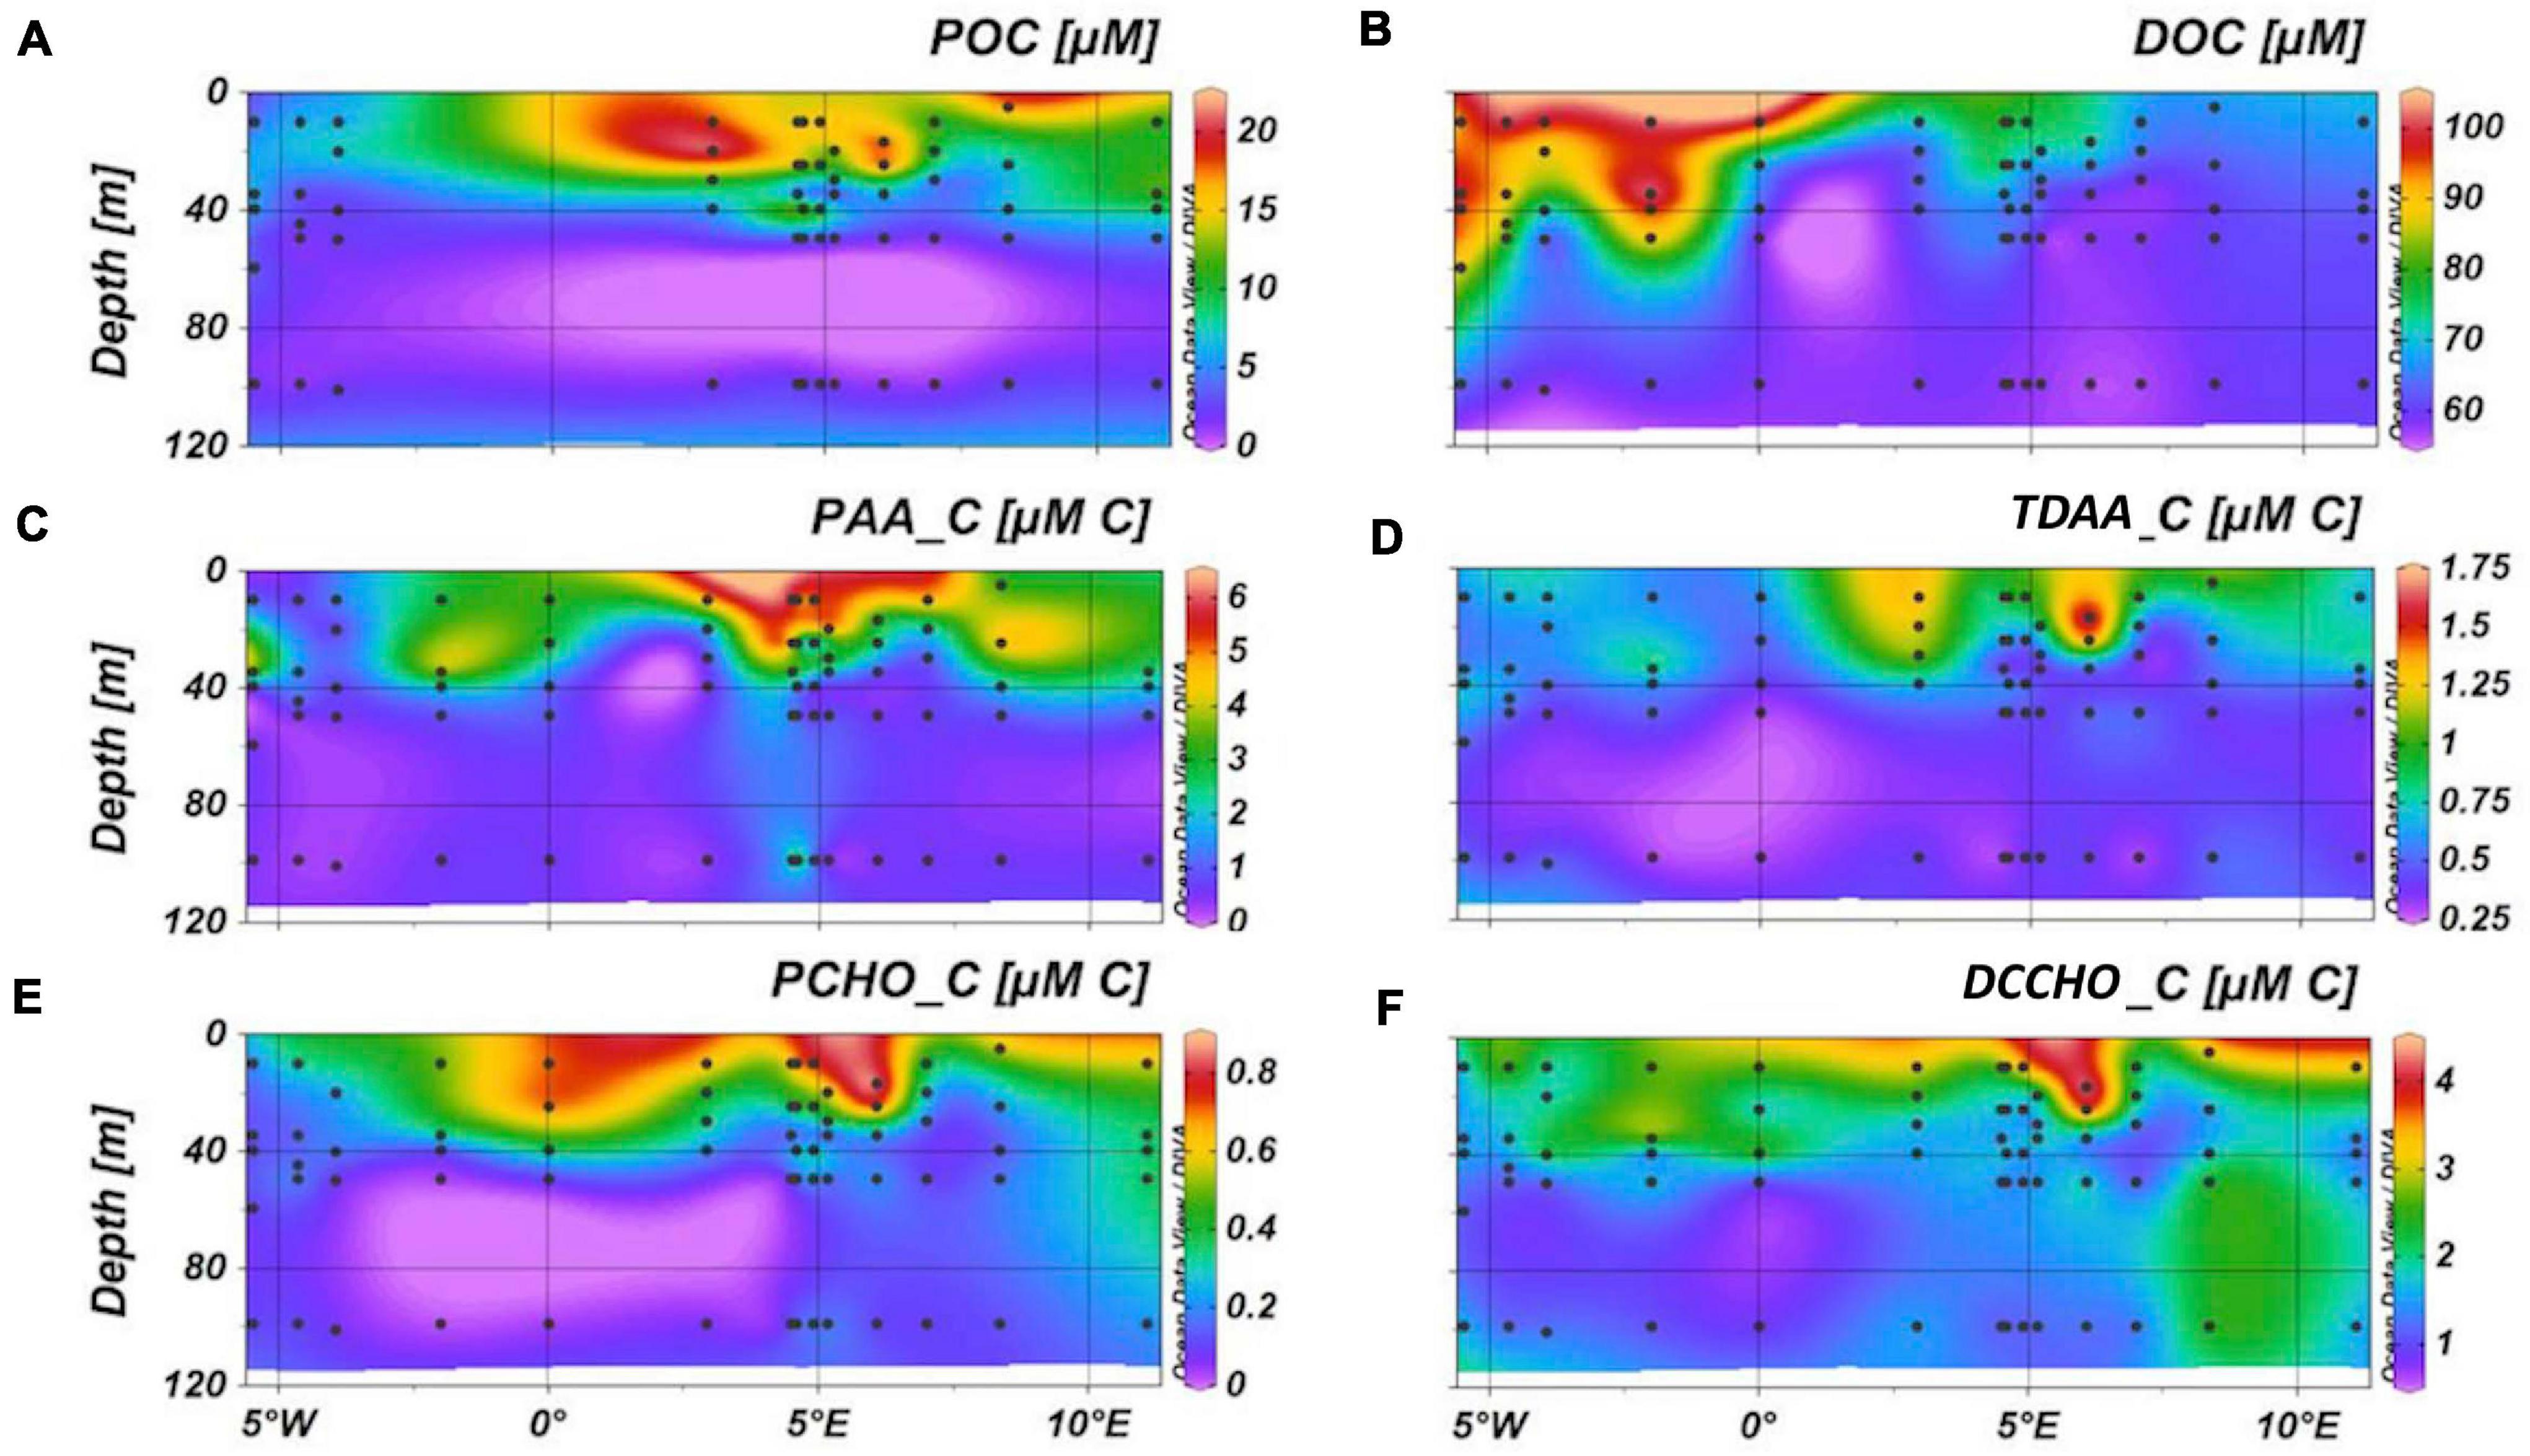
Figure 3. Distribution of particulate and dissolved organic carbon across Fram Strait (A,B) and contribution of amino acids (C,E) and carbohydrates (D,F) to carbon with these fractions.
Biomolecule Composition Within Different Pools and Size Fractions
PCA analysis of AA and CHO showed clear separation of dissolved and particulate pools. For AA, 78.3% of the variance was explained by the first two axes (Figure 4A). PAA showed increased contributions of the EAA Leu, Phe, Val, Ile, Arg, and Tyr, while TDAA had increased contributions of NEAA AsX, Gly, Thr, GABA, and Ala. Both groups spread along PC2 which showed the elevated contribution of GlX at positive PC2-values and elevated Ser contributions along negative PC2-values.
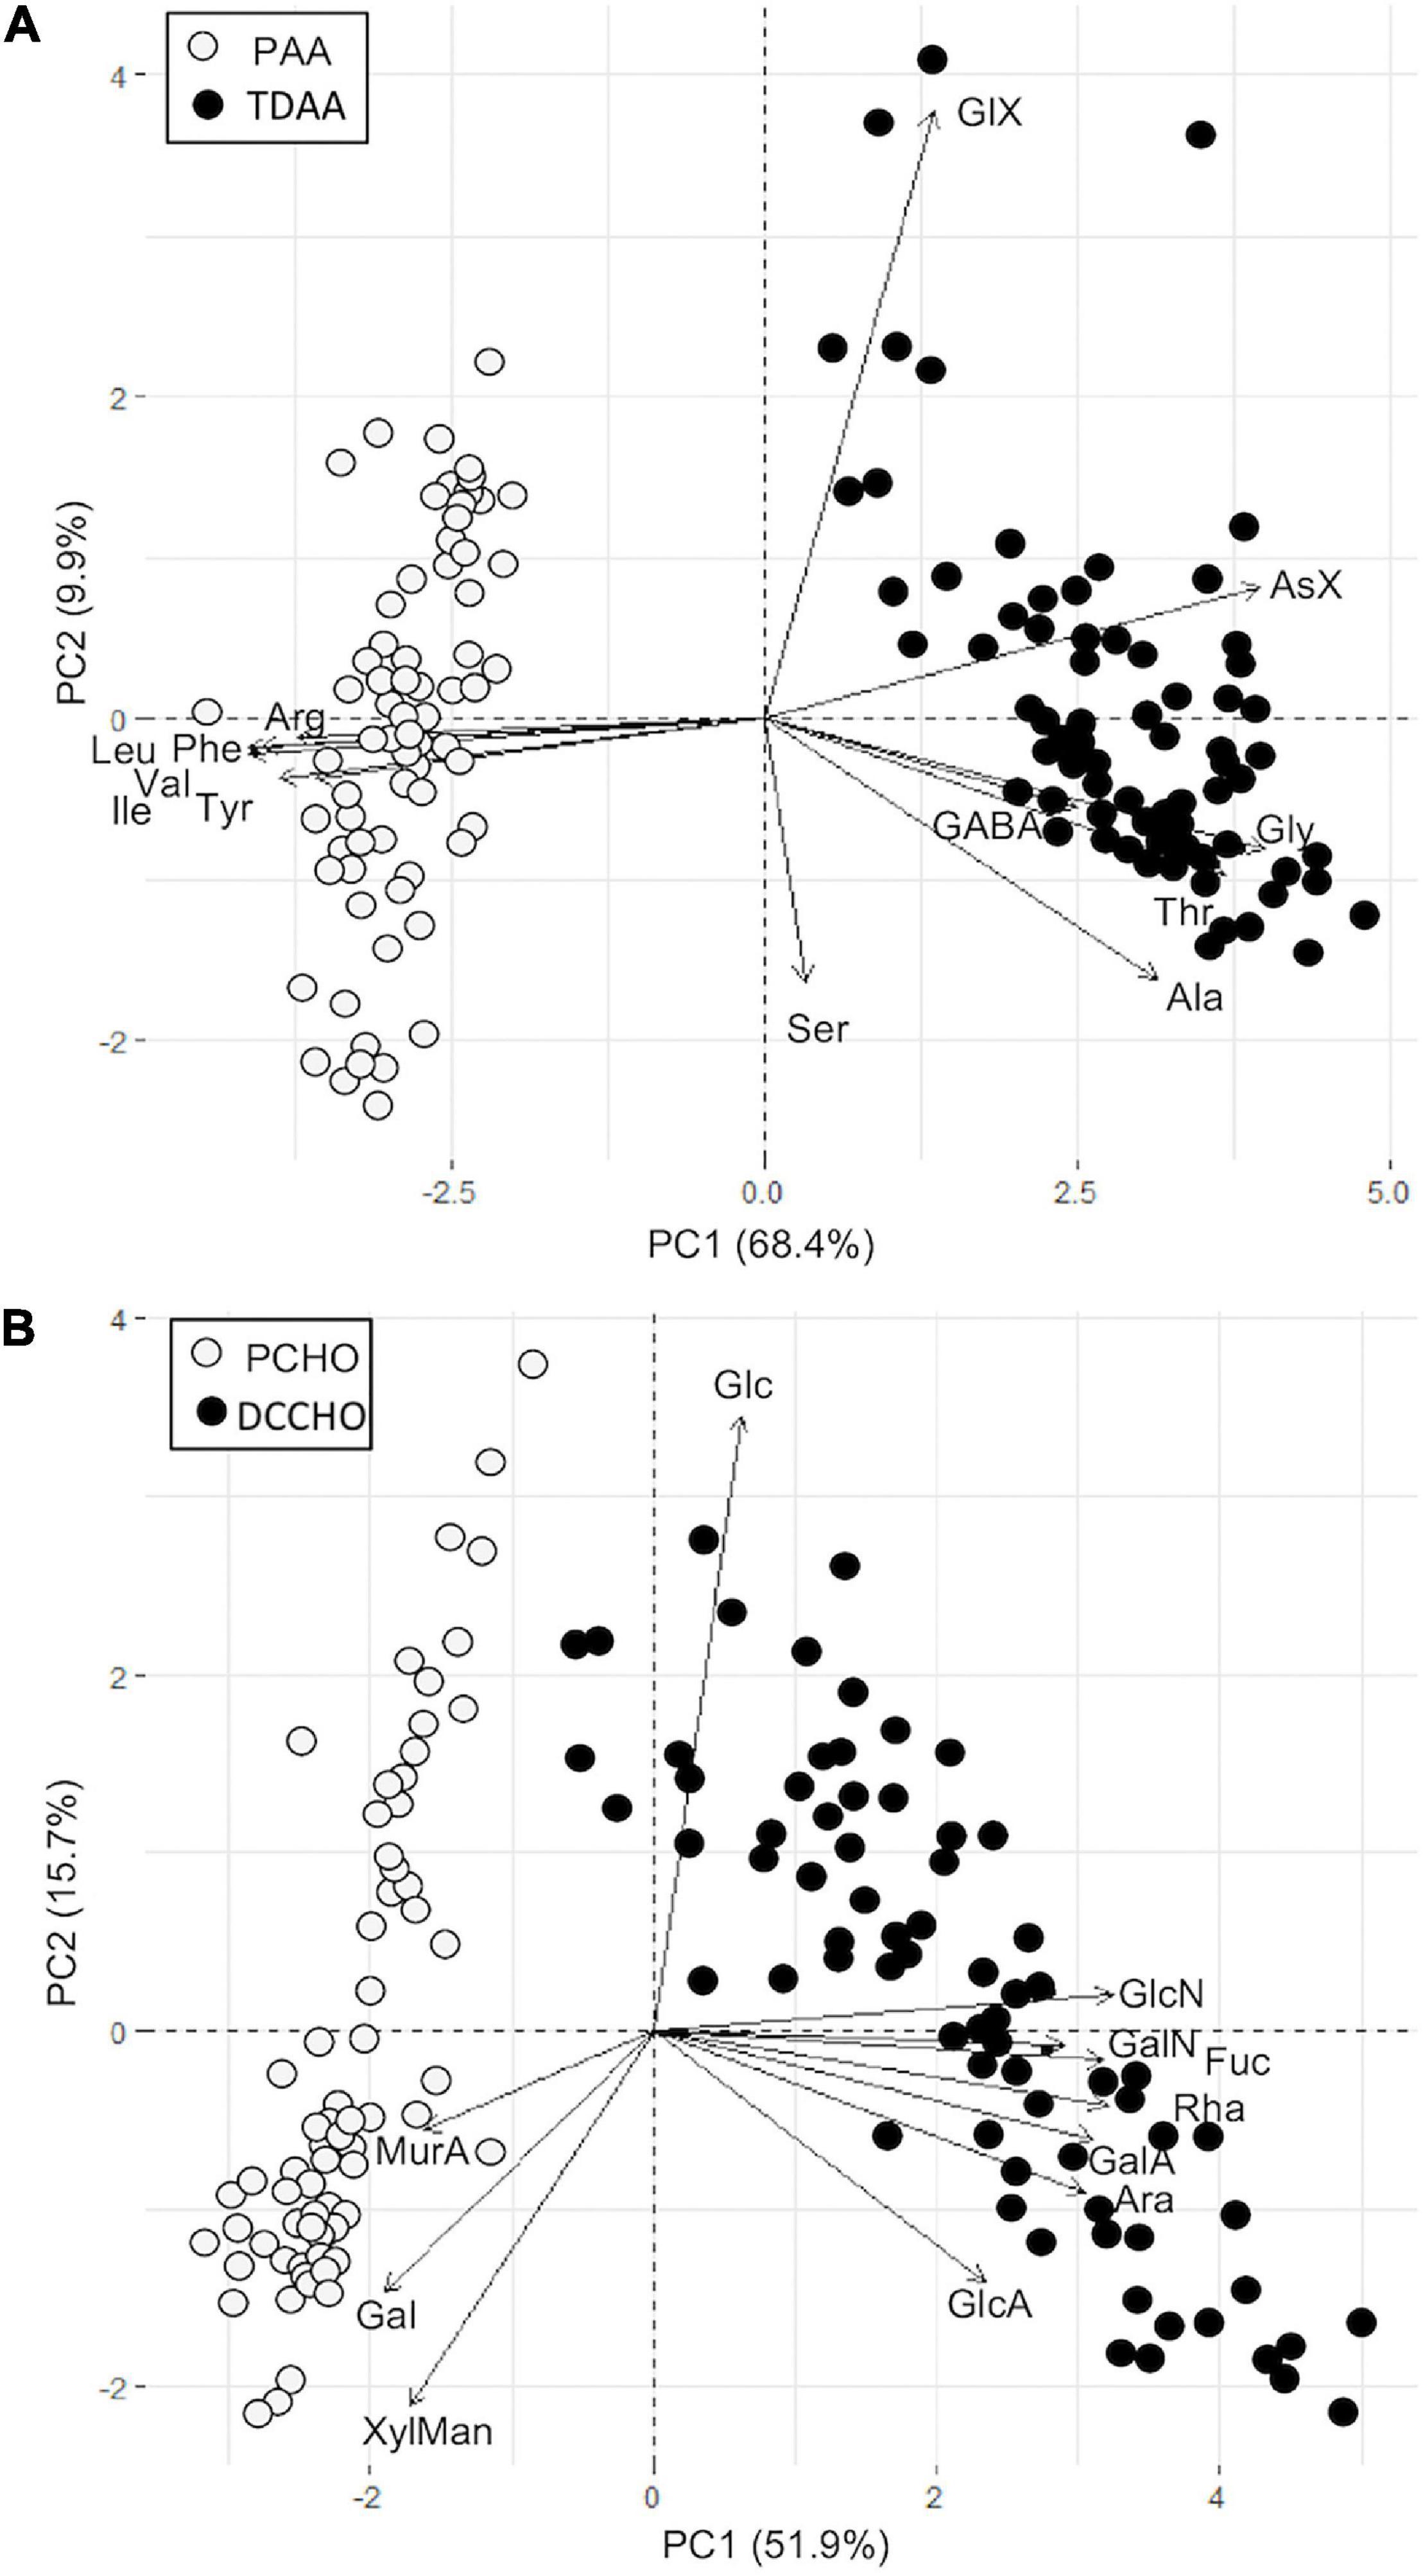
Figure 4. PCA biplot of distribution AA (A) and CHO (B) in dissolved and particulate fractions.
Similarly, 67.6% of the variance in CHO can be explained by PC1 and PC2 (Figure 4B). PCHO showed increased contributions of Gal, Xyl/Man, and MurA; Rha was not present in any of the samples. DCCHO had increased contributions of Ara, Rha, Fuc, of amino sugars (GlcN, GalN) and acidic sugars (GlcA, GalA). Furthermore, MurA was not detected in any DCCHO sample, and no GlcUA was detected in DCCHO and PCHO samples, with the exception of 2 sampling depths during size fractionation (see below). Glc was the main driver of PC2 and showed increased contributions in both DCCHO and PCHO.
Additional PCA analyses were performed separately for the dissolved and particulate pools to determine the effect of water masses and depth on biomolecule composition (Figure 5). An effect of water mass was observed in the TDAA composition (Figure 5A), where PW showed an association with GABA (green symbols). Additionally, a separation by sampling depth in the AW and MW was detected where samples from the Chl a maximum and above (blue and black triangles) were enriched in EAA (e.g., Tyr, Leu, Phe), and deeper samples were rather associated with higher contributions of NEAA Ala, Thr, Gly (circles). A less clear trend emerged in the PAA (Figure 5B), where PW samples from below the nutricline (green circles) associated with GABA and Arg and were slightly separated from many of the AW and MW surface samples (blue and black triangles), which associated closer to the EAA.
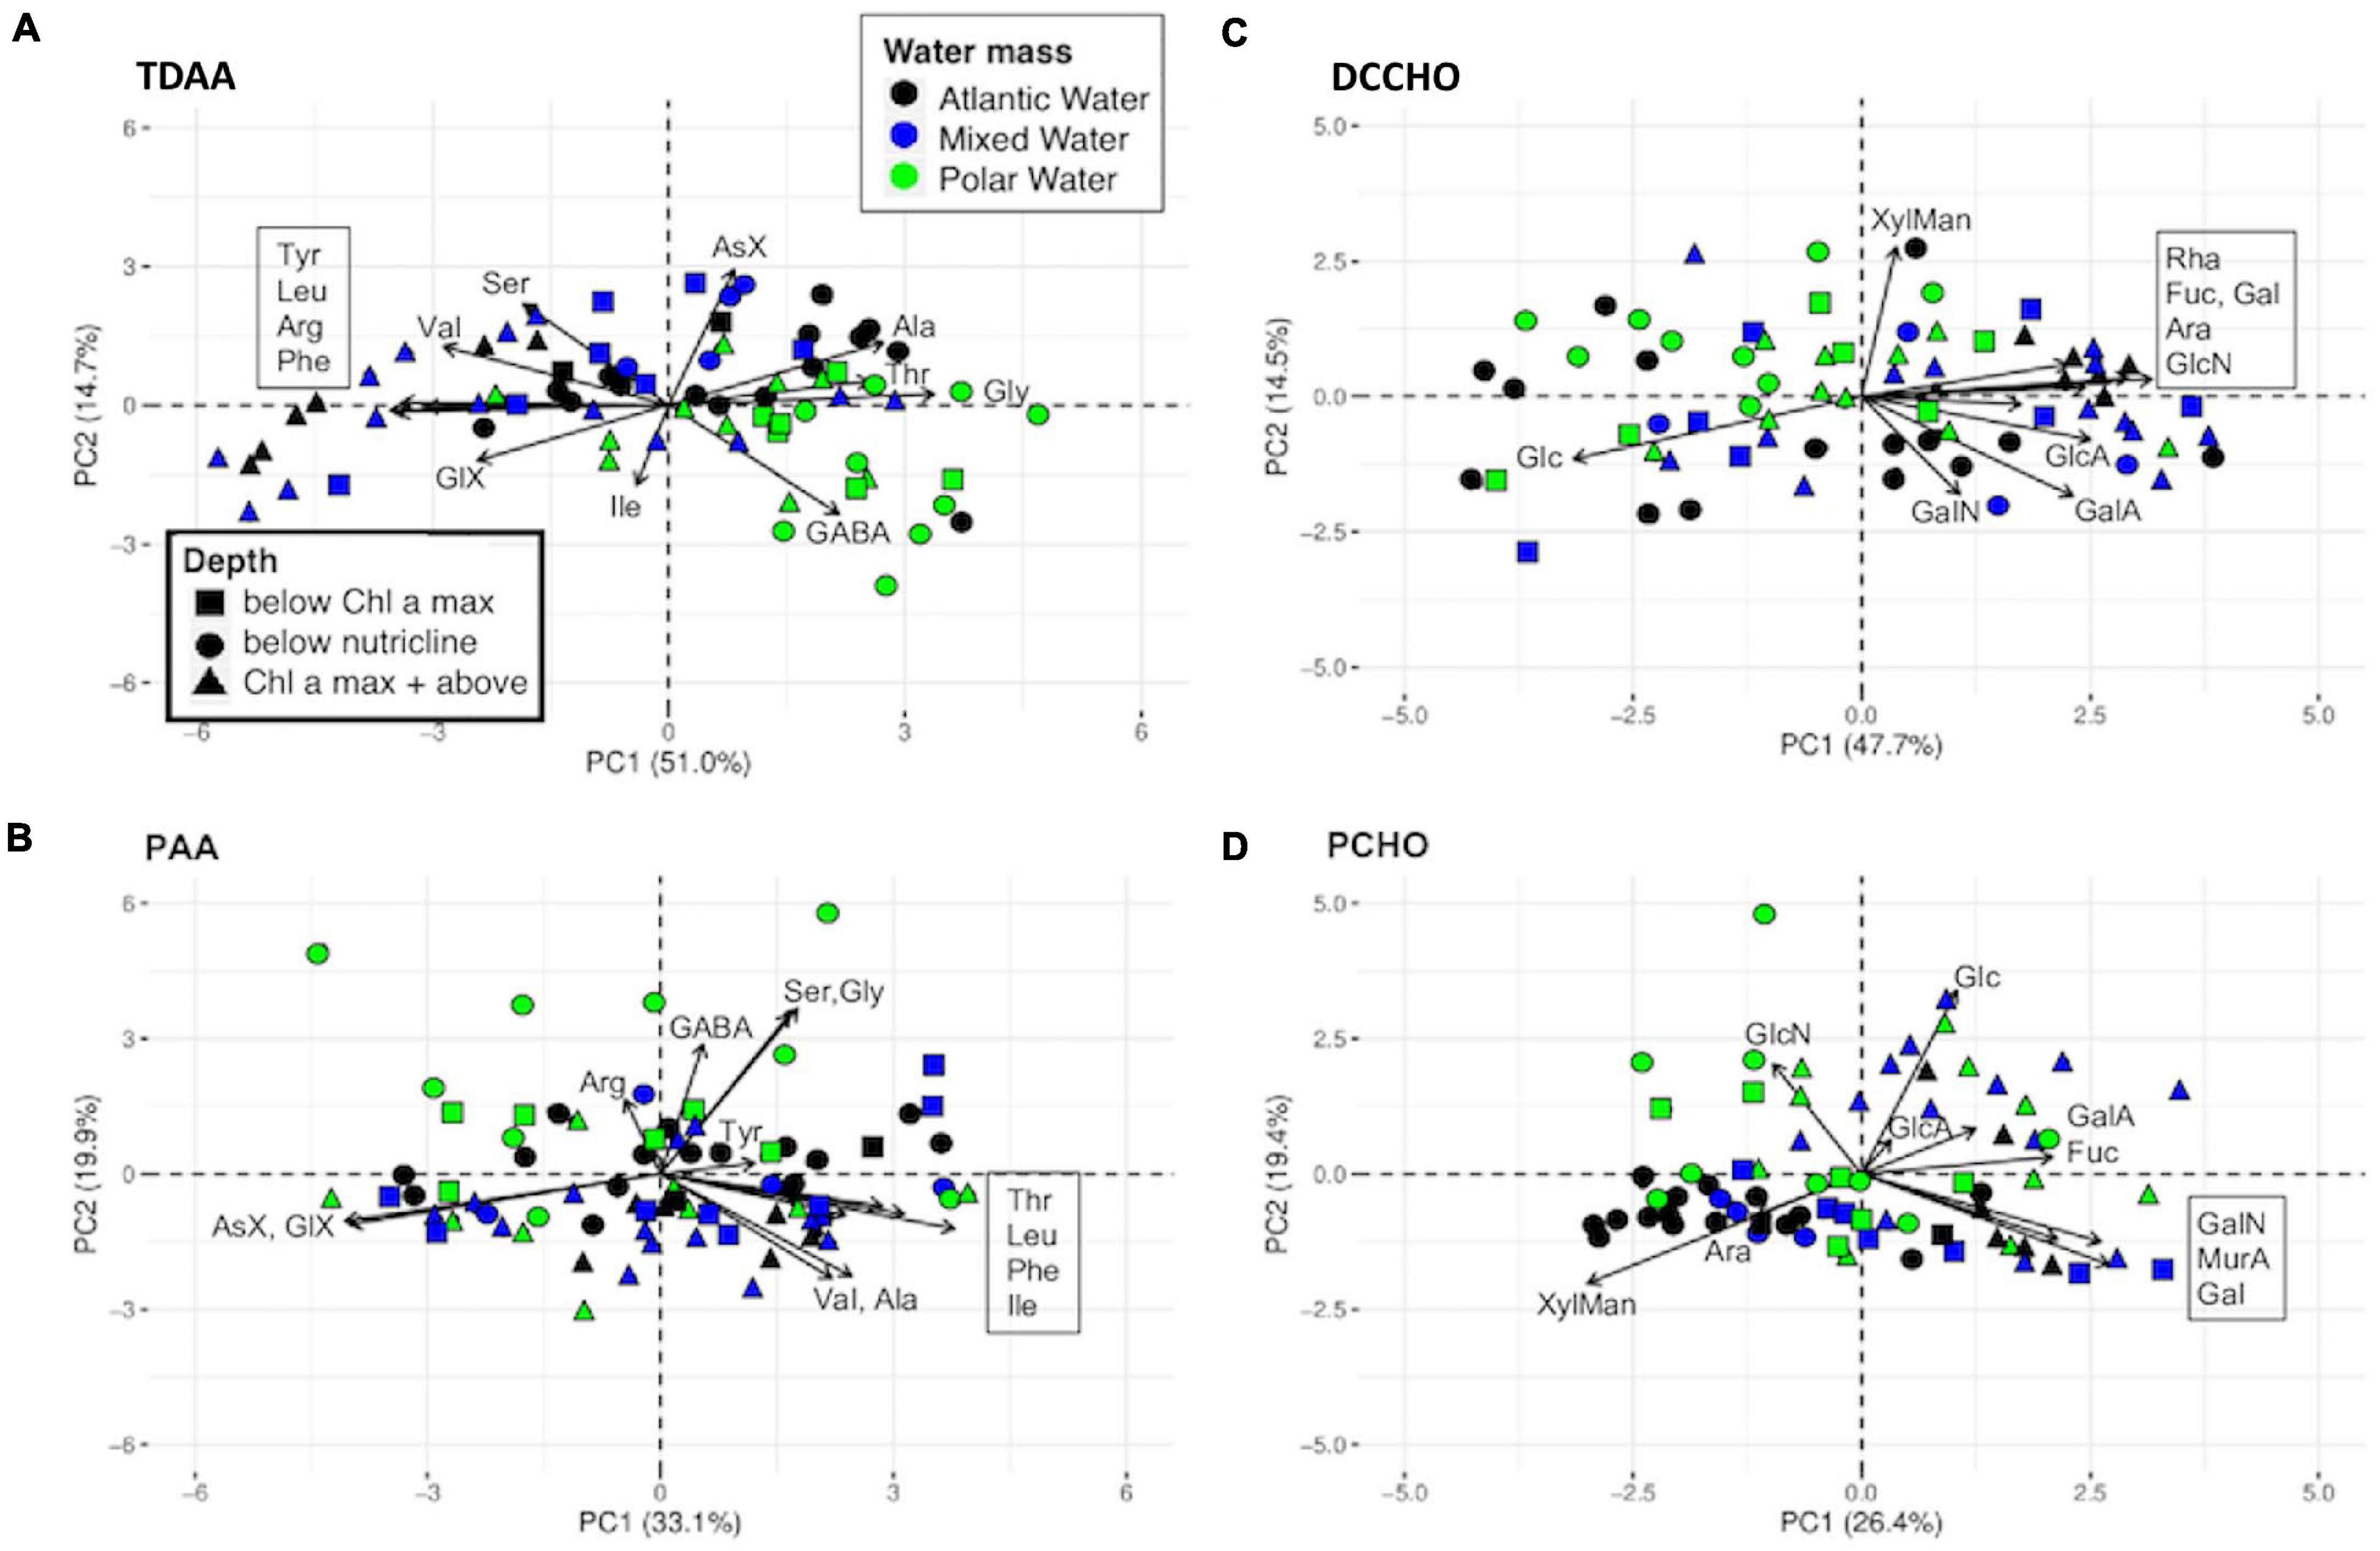
Figure 5. PCA biplot of AA and CHO composition in dissolved (A,C) and particulate (B,D) fractions. Boxed abbreviations of AA and CHO in each panel refer to the respective cluster of arrows where direct association of arrow and molecule name was not graphically possible. Color and symbols refer to water mass and depth, respectively.
CHO did not show water mass separation in either fraction, but some patterns emerged as well. Within the DCCHO (Figure 5C) Glc contribution seems to increase in deeper samples (circles and squares) while surface samples of AW and MW (black and blue triangles) are associated with all other investigated sugars, including amino and acidic sugars. Similarly, in the PCHO (Figure 5D), many deep-water samples (circles) were associated with Xyl/Man and Ara, and many surface samples were associated with Glc.
Differences in PAA and PCHO pool composition were evaluated in 3 size fractions. The size fraction 0.7–10 μm contributes the highest amounts to PAA with an average of 64 ± 7% (n = 15), the size fraction > 10 μm contributes amounts up to 35% at the upper 40 m. The 0.2–0.7 μm size fraction showed the lowest contribution with 14 ± 6% (n = 15). At the same time, the 0.2–0.7 μm size fraction contributed relatively high amounts of C to PCHO (42 ± 12%, n = 15). Similar contributions were made from the 0.7–10 μm fraction, while the > 10 μm fraction contributed the lowest amounts (45 ± 8% and 13 ± 7%, n = 15, respectively). This resulted in opposite C partitioning between PAA and PCHO in the fractions > 0.7 μm and 0.2–0.7 μm.
Phytoplankton most likely dominated in the size fractions >0.7 μm which contained 4.3 ± 2.4 times more C in PAA than in PCHO (n = 30). The size fraction < 0.7 μm was most likely dominated by bacteria and archaea and contained only 0.8 ± 0.4 times of C in PAA than PCHO (Figure 6 and Supplementary Table 1).
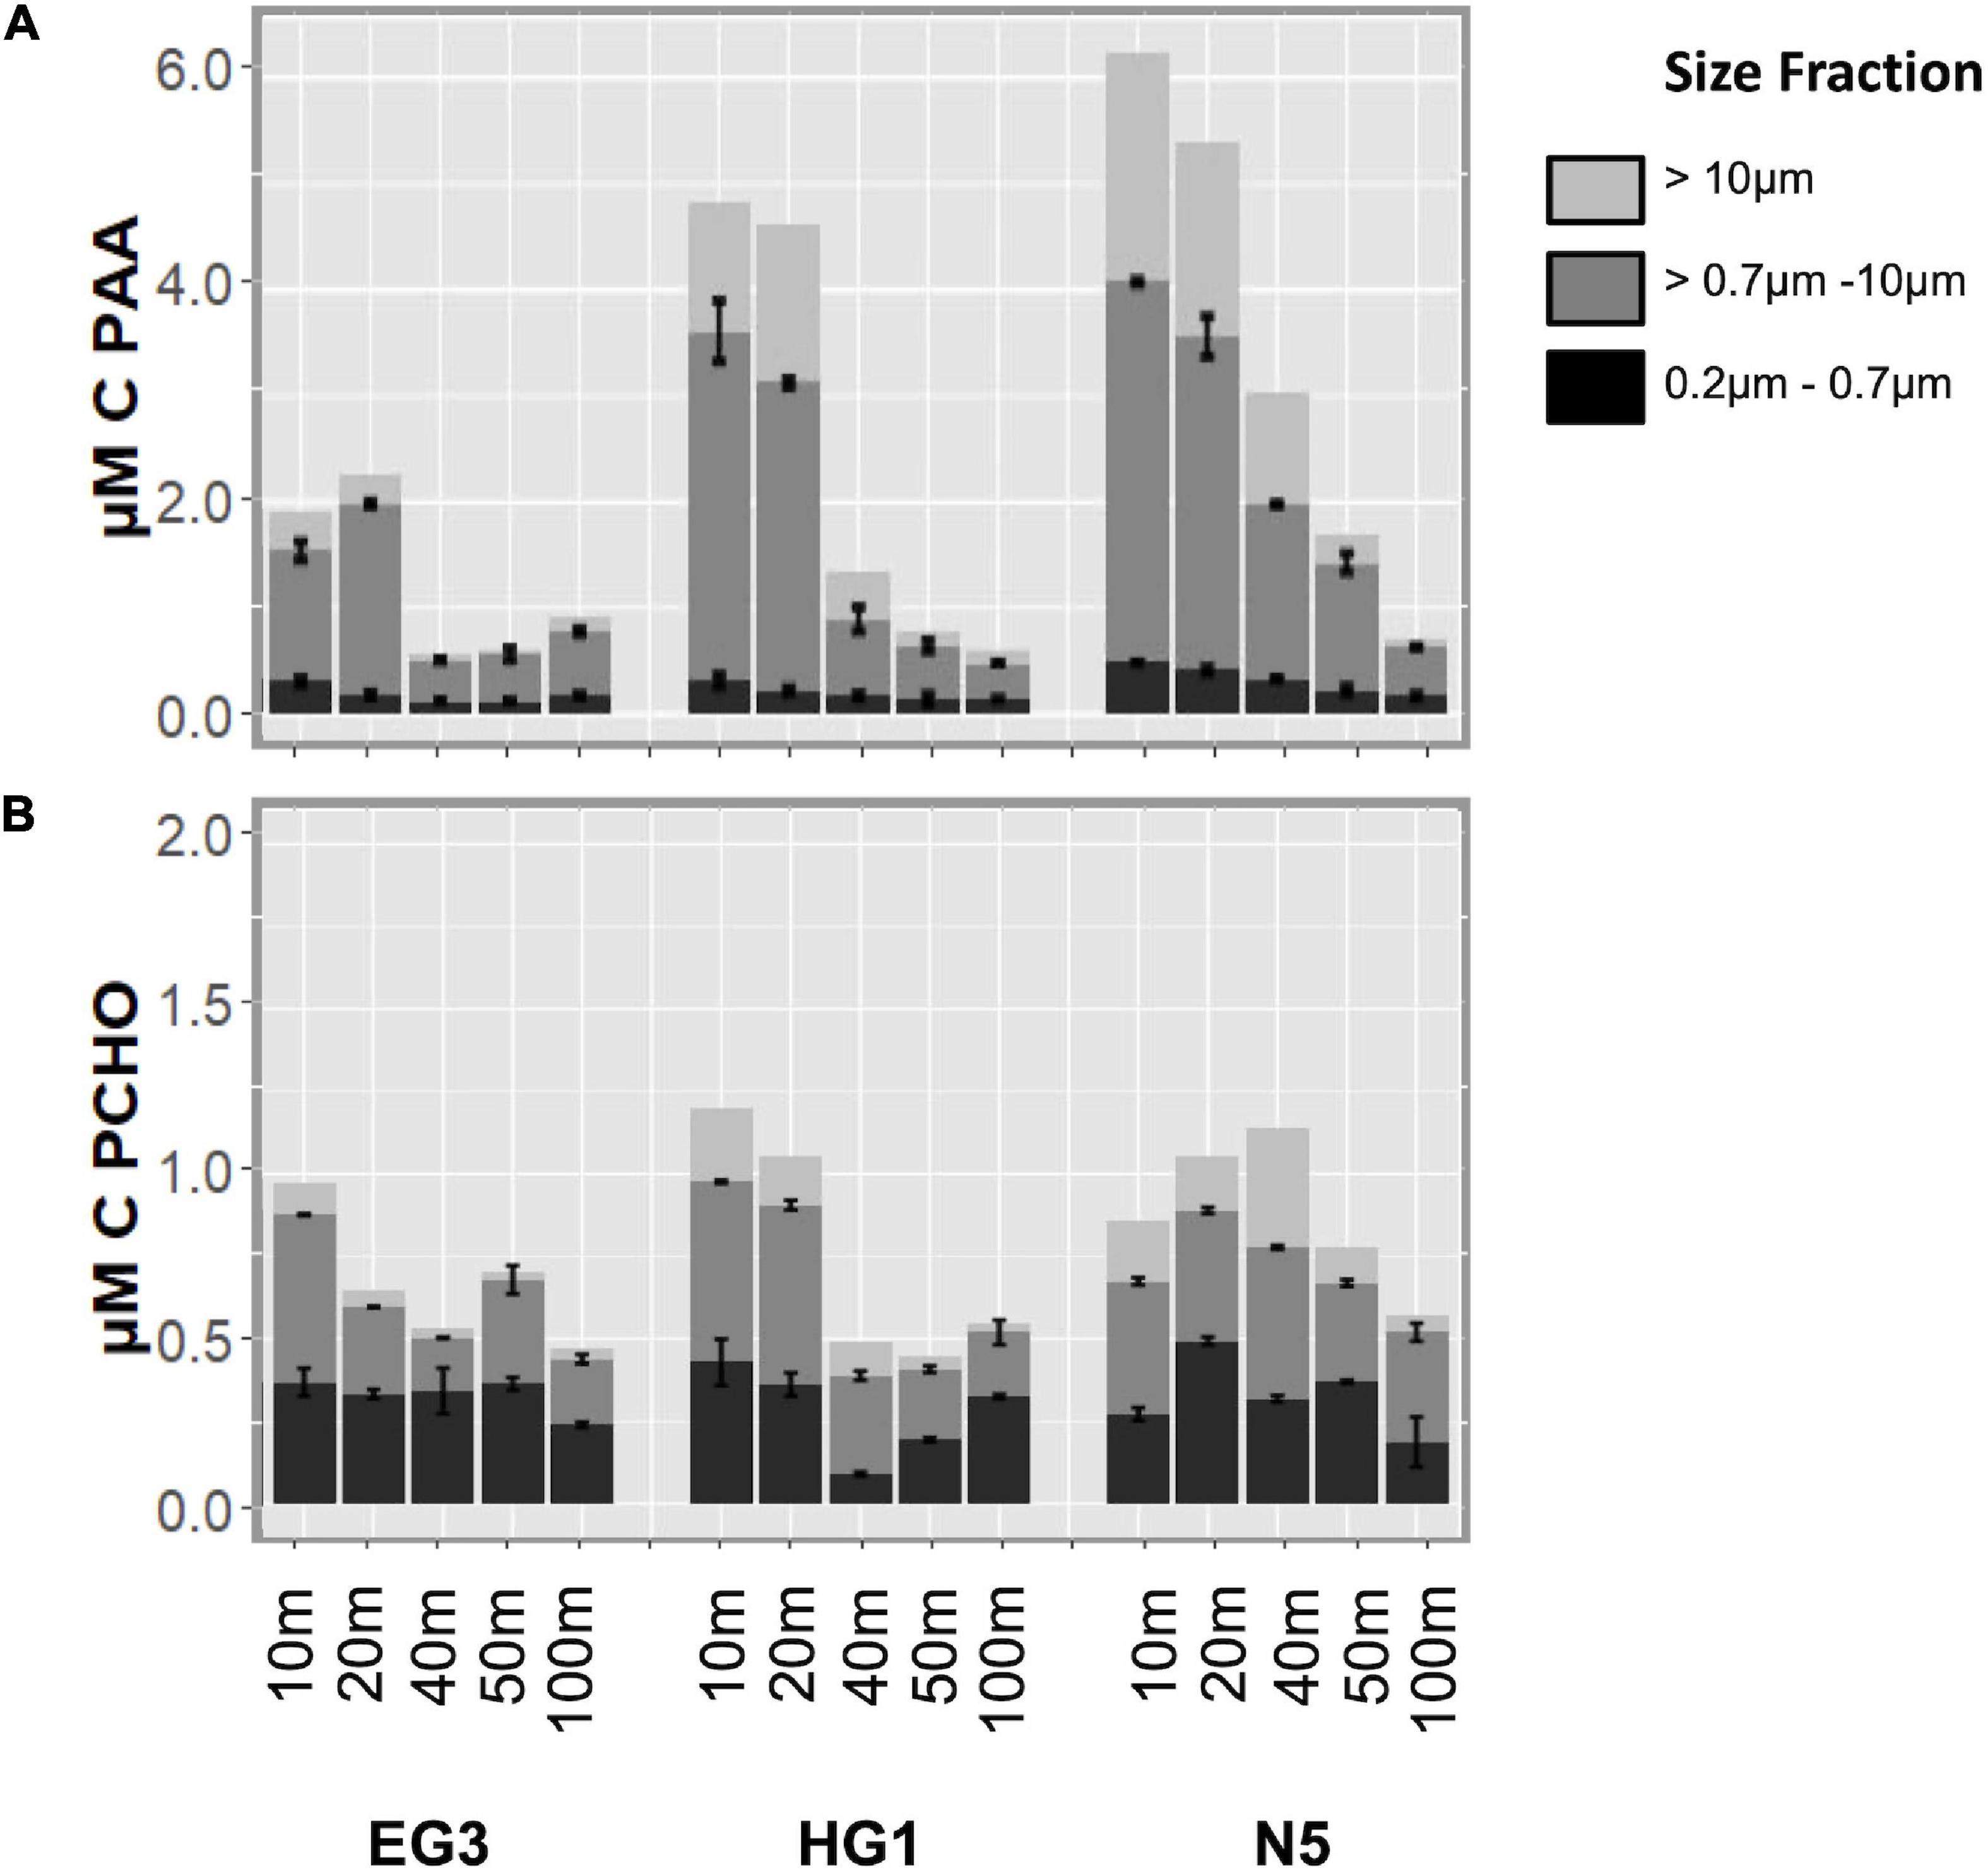
Figure 6. Contribution of different size fractions to concentrations of PAA (A) and PCHO (B). Note differences in scales between panels.
PCA analysis of mol% of individual PAA and PCHO between fractions showed a clear separation between fractions. While > 10 μm and 0.7–10 μm fractions clustered, the 0.2–0.7 μm fraction was separated (Figure 7). The 0.2–0.7 μm fraction was associated with higher contributions of AsX and GlX as well as acidic and amino sugars (GlcA, GalA, GlcN, GalN). GlcUA was detected only in 2 samples at HG1 (10 m/0.2–0.7 μm and 35 m/>10 μm). Within the PCHO, Xyl/Man also caused separation along PC2.
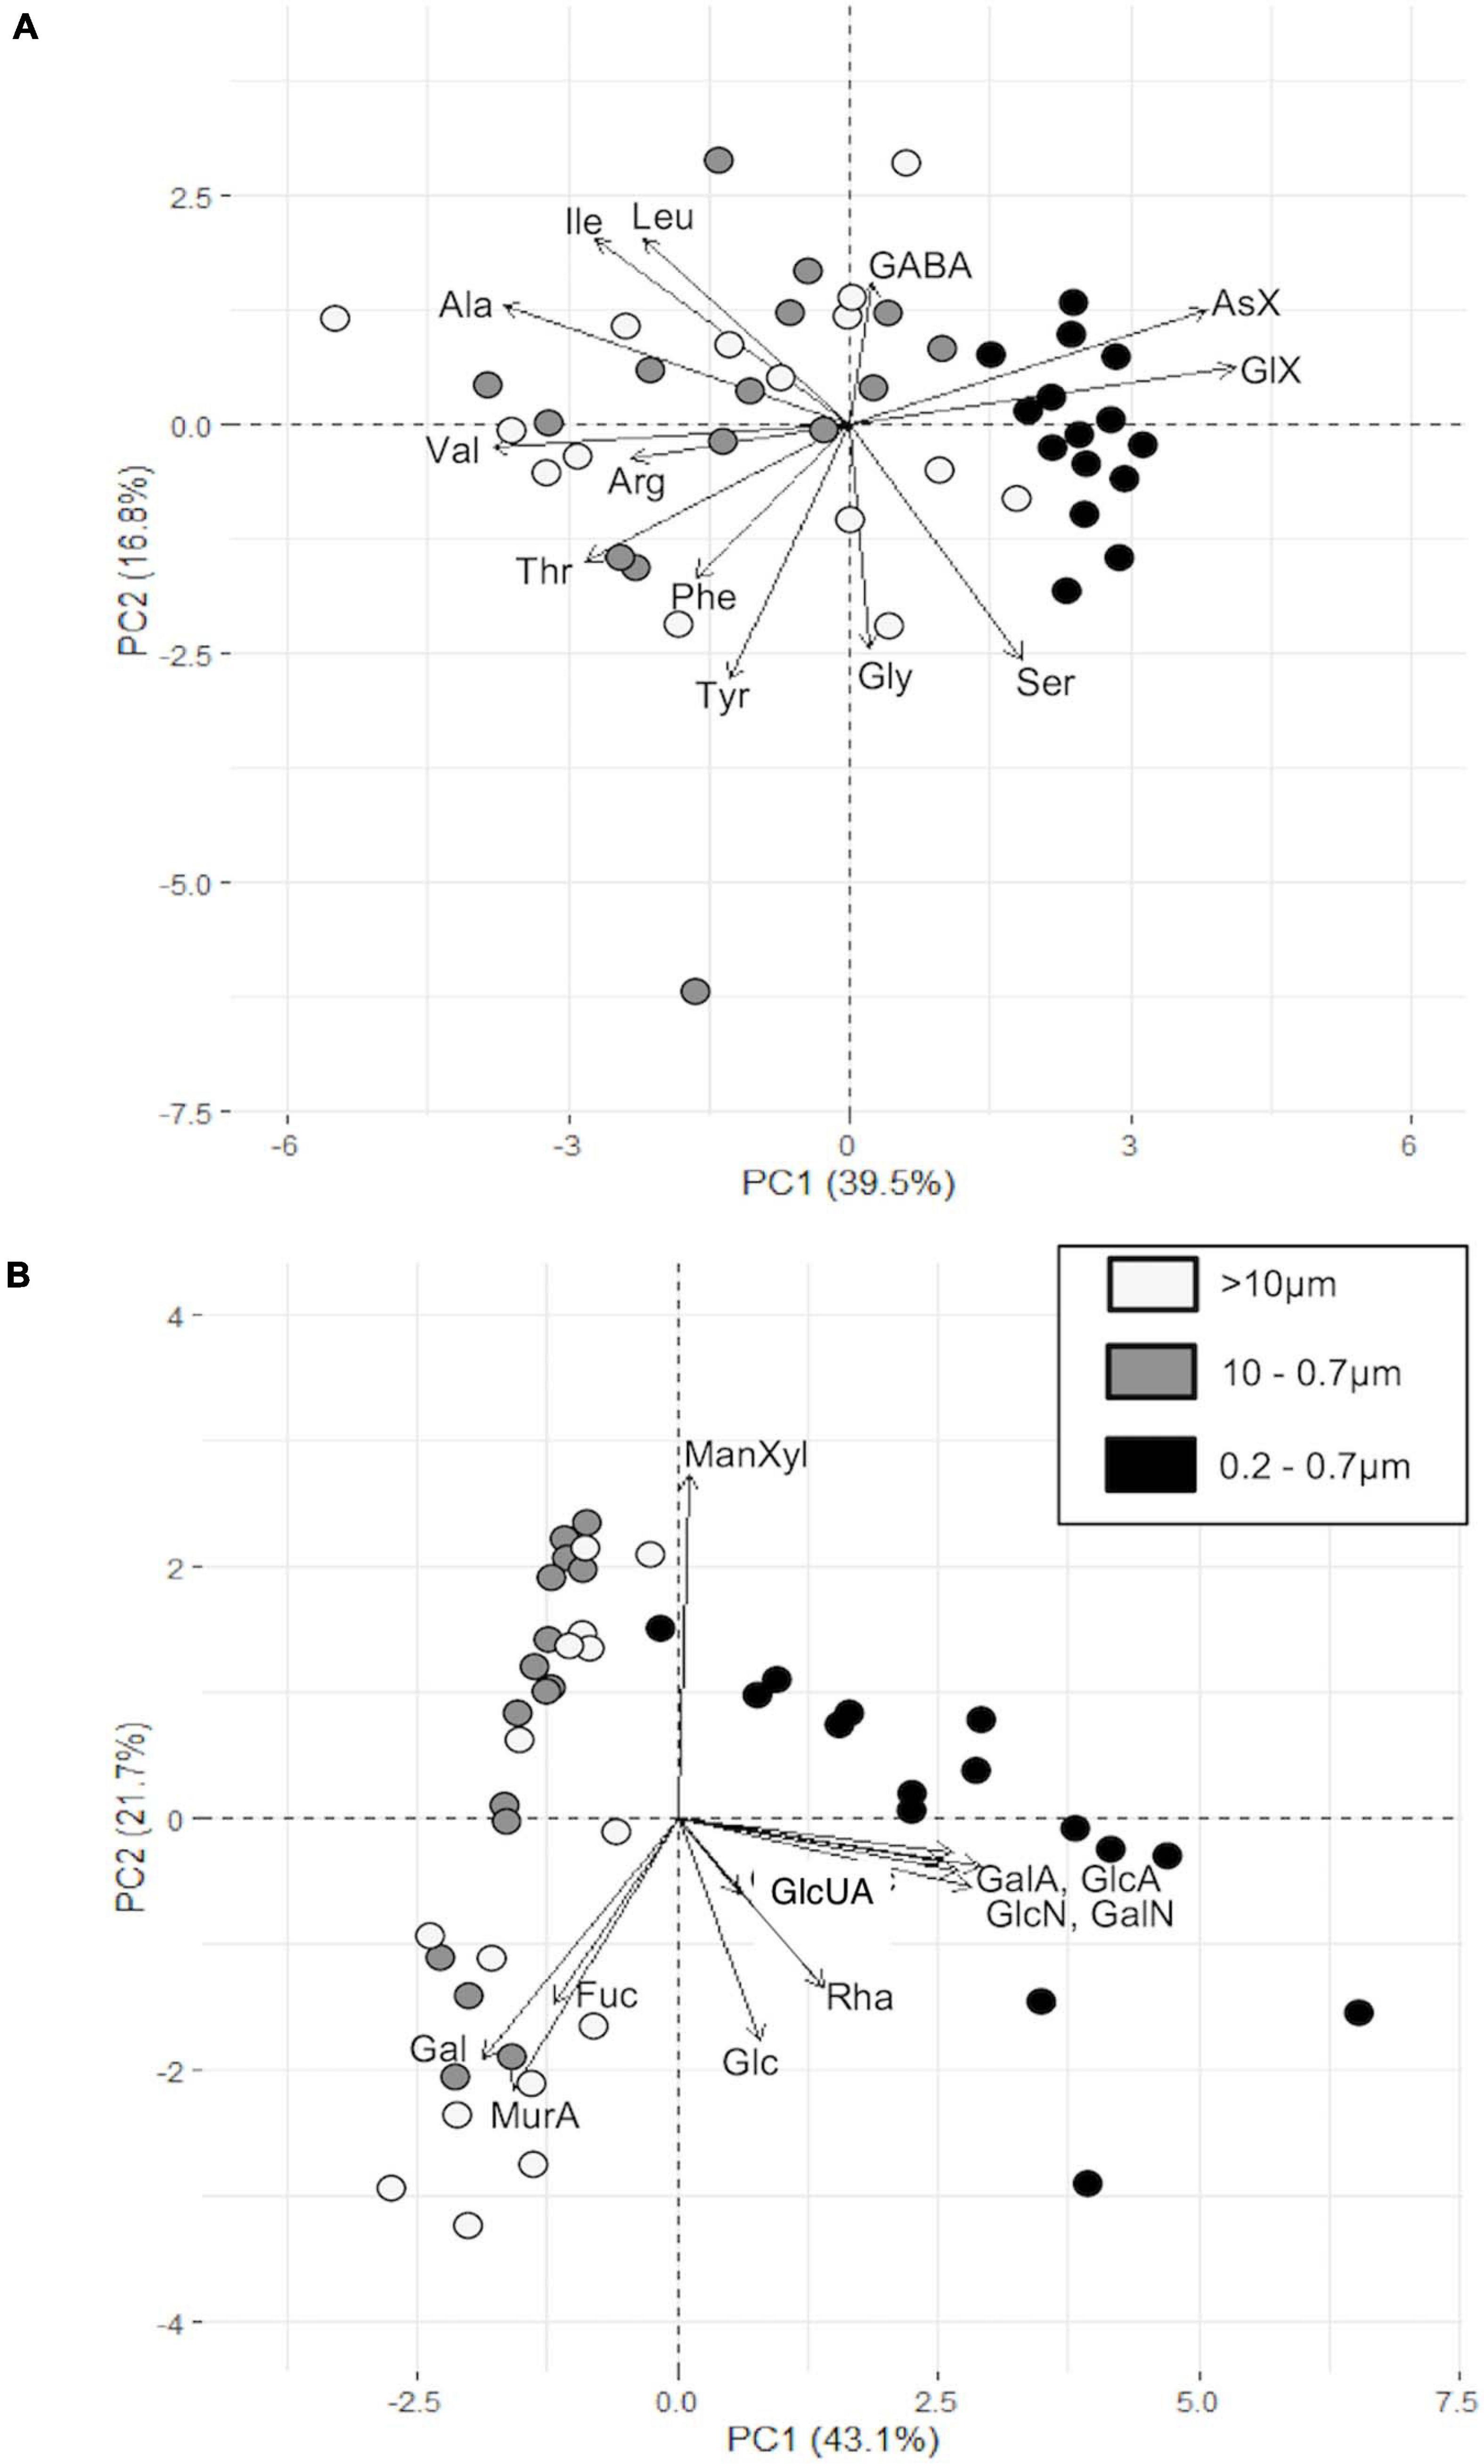
Figure 7. PCA plot of different size fractions in PAA (A) and PCHO (B).
Discussion
Where Water and Melting Ice Meet
The Fram Strait is the gateway to the Arctic Ocean where northward-flowing, warm and more saline AW in the east meets southward flowing, cold PW in the west. The two water masses meet and mix with each other and melting sea-ice in the marginal ice zone, forming MW. These mixing zones extend over several km and are characterized by higher biological productivity (Thomsen et al., 2016; Baltar and Arístegui, 2017; von Appen et al., 2018; Fadeev et al., 2020). Our research area encompassed all three water masses and the study supports earlier findings that MW is indeed more productive than either PW or AW (based on Chl a and POC concentrations). A detailed study of such a mixing event showed that upwelling on the outside of the filament brings nutrients to the surface, which enhances productivity and can eventually export POC in the filament center on timescales of days to weeks (von Appen et al., 2018). In the same filament, Fadeev et al. (2020) investigated the composition of bacteria and phytoplankton and found elevated densities of both diatoms and Phaeocystis sp. compared to outside-filament waters, and a bacterial community that is usually associated with a summer aging phytoplankton bloom. Blooming of fast-growing phytoplankton species, such as diatoms, were also observed in other low-latitude, submesoscale-frontal systems (Basterretxea Oyarzabal and Aristegui, 2000; Clayton et al., 2014; Allen et al., 2015). A similar mixing process and the concurrent injection of new nutrients was potentially responsible for increased biomass in MW in our study. The subsequent DOM release from new phytoplankton biomass and its degradation after nutrient depletion fuels the existing bacterioplankton community, emphasizing that this narrow streak of MW between AW and PW is important for primary and secondary production in the area. According to Nöthig et al. (2020) AW is more productive than PW in terms of both POC and Chl a concentration, opposite to us finding no statistical differences in POC concentration between the two. The reason for this could be two fold; (1) the sampling in 2017 took place in post-bloom conditions (Engel et al., 2019) and low overall biomass resulted in relatively similar concentrations between water masses. Secondly, Nöthig et al. (2020) only distinguish between PW and AW, using the 0° Meridian as a boundary, rather than physical settings, and therefore included MW as part of AW. However, they also emphasize that productive zones were found at the dynamic ice edge of the Fram Strait where warm and nutrient rich AW partly recirculates and comes into contact with the sea ice cover of the western Fram Strait allowing favorable growth conditions for phytoplankton.
MW were also characterized by increased contribution of PAA to POC in our study, indicating sufficient N availability for phytoplankton growth. Available N supports the synthesis of PAA (structural proteins and enzymes required for phytoplankton cells functioning and growth), while increased PCHO can indicate either an increased contribution of storage PCHO under nutrient limitation (Granum et al., 2002; Borsheim et al., 2005) or high amounts of excreted heteropolysaccharides such as transparent exopolymeric particles (TEP) (Passow, 2002; Engel et al., 2017). Based on the similarity seen in Chl a, POC and TEP concentrations, probably both mechanisms contributed. Nutrient distribution in the upper two water depths was patchy and ranged from concentrations below the detection limit to sufficient concentrations across all three WM, hence we probably encountered plankton communities at different physiological stages. While POC concentrations can be used to determine biomass distribution, DOC concentrations across Fram Strait are not appropriate to deduce the availability of labile and semi-labile organic substances. DOC concentrations in PW were much higher than in AW, but due to increased terrigenous contributions from large rivers such as Lena, Mackenzie, Ob, or Yukon (Kattner et al., 1999; Anderson and Amon, 2015). The terrigenous DOC contains numerous complex biomolecules (e.g., humic substances) that are resistant to bacterial degradation (Engel et al., 2019). Thus, evaluation of TDAA and DCCHO concentrations is a more appropriate approach. The freshness of DOC increased from PW < MW < AW with highest contributions per water mass of 4.3% < 6.1% < 8.2% of DOC, respectively. These values are low but in a similar range to other studies. In the Beaufort Sea the contribution ranged between 4 and 16% (Panagiotopoulos et al., 2014). Amon and Benner (2003) reported neutral sugar contributions to DOC ranging between 1.3 and 9.6% throughout the entire Arctic Ocean, and up to 22% in ice flow melt water.
Quality of AA and CHO Pools
Organic carbon production and degradation determine the quantity and quality of AA and CHO pools. PCA analysis of AA and CHO from all water masses showed clear separation of particulate (producers) and dissolved (degraded) pools, demonstrating fundamental differences in their compound composition. PAA were rich in the EAA supporting the hypothesis that they contain actively growing phytoplankton communities that synthesize all investigated AA. EAA are important to sustain growth in higher trophic levels as these have no capabilities to synthesize EAA. Several groups of bacteria have also lost synthesis pathways for individual AA and rely on scavenging them from the environment (auxotrophy, Tripp et al., 2009). The TDAA pool is enriched in AA, such as Gly, AsX, and Ala, emphasizing continuous degradation by heterotophic bacteria (Kaiser et al., 2017).
Hence, PC1 (Figure 4A) is a reflection of the degradation index established by Kaiser and Benner (2009). Interestingly, our data showed a separation between of GlX and Ser along PC2. A similar separation was found between Atlantic and Pacific Water (Kaiser and Benner, 2009) and could potentially be an indicator for differences in bacterial communities composition. For example, it is known that peptidoglycan, peptides in gram-negative bacteria, exclusively contain GlX, Ala and MurA (see below), while other peptides can additionally include AsX, Ser, and ornithine (Schleifer and Kandler, 1972). GlX is used by some Gram-positive Bacilli to form a capsular polypeptide (Hanby and Rydon, 1946; Troy, 1973) and Ser frequently appears in iron scavenging siderophores (Demange et al., 1990; Bernardini et al., 1996; Martinez et al., 2000) and lipo-peptides (Morikawa et al., 1993; Vater et al., 2002).
Distinguishing further between water masses and depths (Figures 5A,B) revealed a separation of TDAA and PAA associated with the degradation index (along PC1). Essential TDAA are associated with productive surface waters (Chl a maximum and above) especially in AW and MW. Deeper waters are associated with higher contributions of Ala, Thr and Gly. PW show the most degraded TDAA pool associated with Gly, Thr and especially GABA, indicating highly degraded TDAA pools in the entire PW water column. GABA is a non-protein AA produced by marine bacteria but also by fungi (Morse et al., 1980; Masuda et al., 2008). Differences in GABA, GlX and Ser distribution could again indicate compositional differences in microbial communities between ice-free AW and ice-covered PW as demonstrated by Fadeev et al. (2018) and others (Pernthaler et al., 1998; Crump et al., 1999).
Similarly, PCHO and DCCHO pools show differences in composition. Gal has increased contributions to the PCHO pool, which could be associated with diatoms (Markou et al., 2012). MurA was also found in PCHO. It is however only found in the unique cell wall biopolymer peptidoglycan, which is synthesized by Gram-negative and Gram-positive bacteria (Schleifer and Kandler, 1972). It consists of glycan strands of the disaccharide N-acetyl-glucosamine and N-acetyl muramic acid which are cross-linked by small peptides consisting of specific amino acids (Schleifer and Kandler, 1972). Muramic acid has been identified in DOM (Benner and Kaiser, 2003) and might be associated with bacteria colonized particles in our study. Therefore, the MurA signal in the PCHO fraction could signal the presence of gel-like particles, which can be colonized by bacteria. Transparent polymer particles (TEP) are one form of gel-like particles and contain large amounts CHO. Acidic sugars (GlcA, GalA, GalUA) in the DCCHO can be an indicator for freshly excreted DOM (Borchard and Engel, 2015) while in the PCHO fraction they are an additional indicator for the presence of TEP (Alldredge et al., 1993). The occurrence of MurA in the particulate fraction, e.g., as indicator for gel-like particles should be investigated further.
As seen in Figure 4B, PC1 shows qualitative differences between PCHO and DCCHO, while PC2 is driven by Glc. Glc contributions to PCHO are usually explained by nutrient limitation. When photosynthesis is limited by either N or P, the further synthesis of Glc into AA, structural lipids or DNA/RNA is limited, reducing community growth rates (Falkowski, 2000). Instead, Glc is then incorporated into storage products such as Glc-rich chrysolaminarin or processed further into storage lipids (Janse et al., 1996; Kroth et al., 2008). Alternatively, increased contributions of TEP could be reflected in the shifting relative composition of PCHO.
Looking closer into water mass and depth-related distribution (Figures 5C,D) confirm the special role of Glc, especially in the DCCHO fraction where it is associated foremost with waters below the Chl a maximum and the nutricline. Glc is increased in the PCHO pool in the surface (Chl a max and above), where when excreted Glc is taken up rapidly by bacteria and hardly accumulates (Kirchman et al., 2001). The relative increase of DCCHO-Glc at depth could be associated with the diagenesis of CHO and the uptake of more labile sugars from sinking OM (Amon and Benner, 2003). The melting ice might also release degradation products from ice algae together with ballast material, which causes particle sinking rates to increase 2–3-fold (Iversen and Robert, 2015), and would relocate degradation processes away from the surface and deeper into the water column.
Differences in Size Fractions
The three size fractions targeted larger primary producers such as Phaeocystis sp. colony stages and larger or chain-forming diatoms (>10 μm), smaller primary producers, i.e., Phaeocystis sp. single flagellates or other nano- and dinoflagellates (0.7–10 μm) and bacteria and archaea (0.2–0.7 μm). Comparing PAA and PCHO between these fractions shows the importance of smaller sized phytoplankton in the Arctic Ocean during post-bloom summer month as they contribute higher concentrations to both pools at all the investigated stations. Larger phytoplankton (>10 μm) had lowest contribution in PW. As to be expected, concentrations are highest at the surface and in the Chl a maximum (≤20 m) and based on PAA concentrations, smaller phytoplankton also contribute relatively more at greater depths. The contribution of PCHO (>0.7 μm) to POC in this study was low in comparison to the literature. Finkel et al. (2016) concluded from a meta-data analysis that CHO constitute approximately 15% to cell biomolecules under nutrient-sufficient, exponential growth conditions. They found the lowest values for Ochrophyta and Bacillariophyta (<10%), comparable to values in this study (4.8 ± 2.7%). These values are at a similar range as values found for our samples, suggesting that nutrients were still available throughout the study area. To increase accuracy in follow-up studies, volumes for PAA and PCHO filtration should be similar or higher than volume filtered for POC analysis, especially in low biomass areas. During our study we encountered post-bloom conditions with communities comprising of diatoms and Phaeocystis spp. as shown by Fadeev et al. (2020). While diatoms contain less PCHO because they have a silica shell instead of a cell wall, Phaeocystis is mucus-, hence PCHO-rich, especially when encountered as colonies (Alderkamp et al., 2007). Moreover, high concentration of TEP associate with blooms of Phaeocystis sp. have been reported for the Fram Strait (Engel et al., 2017). Exponentially growing as well as senescent cells, both have been shown to induce TEP formation (Passow and Wassmann, 1994; Reigstad and Wassmann, 2007). Lipids have to be considered as an alternative storage compound in phytoplankton and partitioning of storage C between CHO and lipids depends on the community composition and the experienced limitation (N, P, or light) (Granum et al., 2002; Borsheim et al., 2005; Grosse et al., 2017).
POC:PON ratio in the >0.7 μm size-fractions were close to the Redfield ratio (C:N = 6.6, Table 3, Redfield et al., 1963) in surface waters and increased with depth indicating degradation processes. C:N ratios of PCHO and PAA [(CAA + CCHO)/NAA] were lower (Table 3), suggesting additional C components (e.g., lipids, pigments, detritus) contribute to the larger fraction. In the 0.2–0.7 μm, the (CAA + CCHO)/NAA ratio is increased relative to the larger size-fractions and resembles the C:N ratios typically found in marine bacteria (C:N = 5–8), with coastal areas at the lower side of the range and open ocean bacteria at the higher side (Fagerbakke et al., 1996; Fukuda et al., 1998). The 0.2–0.7 μm fraction was therefore a mixture of bacteria and detritus (see also below). Consumers rework phytoplankton derived DOC to retain precious N resulting in DOC:DON ratios > 9 (Table 3, Eichinger et al., 2009).
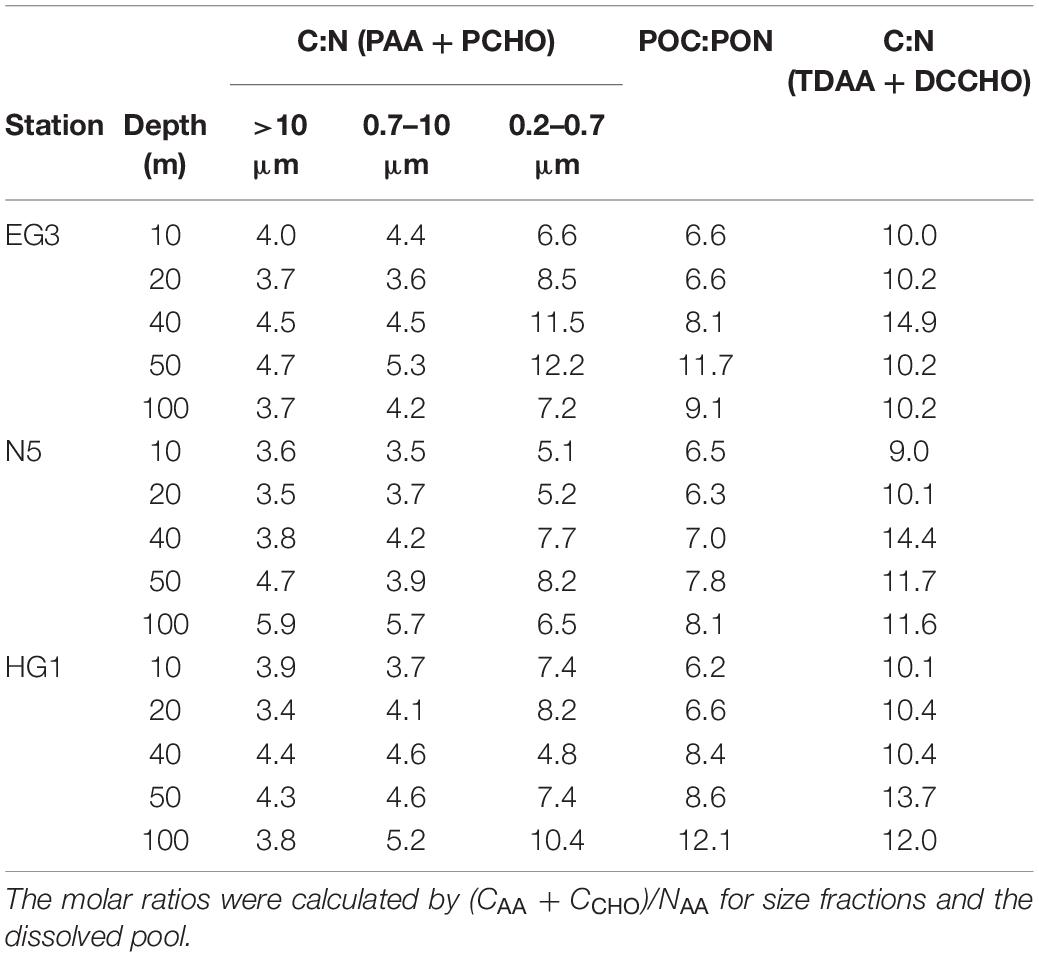
Table 3. C:N ratios of biomolecules in different size fractions, and in DOM (<0.45 μm) as well as POC:PON at stations EG3, N5 and HG1 for individual depths.
Labile compounds can be consumed very rapidly by heterotrophs who rework those compounds and excrete their own DOC characterized by a complex chemical composition (Ogawa et al., 2001). The amino sugars GlcN and GalN are commonly found in bacteria-derived DOC (Amelung, 2003; Benner and Kaiser, 2003). Both amino sugars can accumulate outside the cytoplasm, perhaps in membrane-bound components. They have been found in glycoproteins, extracellular polymers, antibiotics (Messner, 1997; Giroldo and Vieira, 2002; Kudo et al., 2005), and as part of lipopolysaccharides (Trefzer et al., 1999). They also have very low decay coefficients, making them resistant to decomposition (Kawasaki and Benner, 2006).
The concentrations of PAA in the 0.2–0.7 μm fraction can be used to estimate bacterial C concentrations. Overall, AA amount to half of the C in bacteria (Simon and Azam, 1989; Neidhardt, 1996; Kaiser and Benner, 2008) and the percentage of total cellular C as AA seems fairly constant (50–60%) in marine heterotrophic bacteria, independent of cell size (Simon and Azam, 1989; Kaiser and Benner, 2008). However, those numbers were mostly derived from culture studies and natural communities show lower values. Kawasaki et al. (2011) determined bacterial AA-C yields between 15.5 and 42.5% for the open ocean and 19.3–33.8% for the coastal ocean and concluded values are driven by the contribution of degraded particles. Assuming 9.1 fg C bacteria cell–1 (Buitenhuis et al., 2012), bacteria contributed 1.51–8.91 μM C resulting in AA-C yields of 3.2–10.6%. These very low AA-C yields indicate that our sampling stations were probably affected by high amounts of other C-rich material, such highly degraded detritus (Amy et al., 1983; Neidhardt, 1996) or TEP (Engel et al., 2017).
In the PCA, the two phytoplankton size fractions clustered and were enriched in most AA except for AsX and GlX, and in the CHO Gal, Fuc and MurA. Since we only investigated three stations with five depths each, the data is not sufficient to interpret if and where detritus might have played a significant role in any size fraction. Interestingly, Ser seems to be associated with samples taken from greater depths and potentially higher degraded particles, while GABA is associated with the Chl a maximum and above perhaps suggesting a bacterial presence on particles. Gal, Fuc, MurA were mainly associated with MW and AW, while Man/Xyl was mostly associated with PW and greater depths, and therefore probably associated with degradation. This agrees with findings in the PCA of unfractionated PAA.
The relative composition of the biomolecule pools can be used to determine the production and degradation state of the POC and DOC pools and even to distinguish between phytoplankton and bacterial biomass as well as different water masses. With Atlantification AW will carry their respective plankton communities farther North into the Central Arctic Ocean. Increased production in the central Arctic Ocean is expected in the future, and consequently enhance degradation processes in these currently oligotrophic areas. As a consequence, food web interactions and microbial loop processes will be affected. Since sampling campaigns in these areas are infrequent and logistically challenging the AA and CHO signatures left behind by these processes could be used to tracers after the fact.
Data Availability Statement
The datasets presented in this study can be found in online repositories. This data can be found here: the Pangea data repository https://doi.pangaea.de/10.1594/PANGAEA.932070 and https://doi.pangaea.de/10.1594/PANGAEA.932068.
Author Contributions
JG analyzed the data and wrote the manuscript with guidance from E-MN and AE. E-MN and ST-V provided POC and nutrient data. All authors contributed to the final version of the manuscript.
Funding
This is a contribution to the MicroARC project (03F0802A) within the Changing Arctic Ocean program, jointly funded by the UKRI Natural Environment Research Council (NERC) and the German Federal Ministry of Education and Research (BMBF). This research has also been supported by the Helmholtz Association. Ship time was provided under grant AWI_PS107_09.
Conflict of Interest
The authors declare that the research was conducted in the absence of any commercial or financial relationships that could be construed as a potential conflict of interest.
Acknowledgments
We thank the captain and crew of RV Polarstern expedition PS107, as well as the chief scientist Ingo Schewe. We thank Christiane Lorenzen, Sandra Murawski, and Nadine Knüppel for Chl a, POC and PON analyses, Jon Roa, Ruth Flerus, and Sandra Golde for DOC, TEP, amino acid and carbohydrate analyses and Laura Wischnewski for analysis of nutrients. We are very grateful for the valuable comments from both reviewers that improved the manuscript.
Supplementary Material
The Supplementary Material for this article can be found online at: https://www.frontiersin.org/articles/10.3389/fmars.2021.684675/full#supplementary-material
References
Alderkamp, A.-C., Buma, A. G. J., and van Rijssel, M. (2007). The carbohydrates of Phaeocystis and their degradation in the microbial food web. Biogeochemistry 83, 99–118. doi: 10.1007/s10533-007-9078-2
Alldredge, A. L., Passow, U., and Logan, B. E. (1993). The abundance and significance of a class of large, transparent organic particles in the ocean. Deep Sea Res. Part I Oceanogr. Res. Pap. 40, 1131–1140. doi: 10.1016/0967-0637(93)90129-Q
Allen, C. D., Robbins, M. N., Eguchi, T., Owens, D. W., Meylan, A. B., Meylan, P. A., et al. (2015). First assessment of the sex ratio for an east pacific green sea turtle foraging aggregation: validation and application of a testosterone ELISA. PLoS One 10:e0138861. doi: 10.1371/journal.pone.0138861
Amelung, W. (2003). Nitrogen biomarkers and their fate in soil. J. Plant Nutr. Soil Sci. 166, 677–686. doi: 10.1002/jpln.200321274
Amon, R. M. W., and Benner, R. (2003). Combined neutral sugars as indicators of the diagenetic state of dissolved organic matter in the Arctic Ocean. Deep Sea Res. Part I Oceanogr. Res. Pap. 50, 151–169. doi: 10.1016/S0967-0637(02)00130-9
Amy, P. S., Pauling, C., and Morita, R. Y. (1983). Starvation-survival processes of a marine Vibrio. Appl. Environ. Microbiol. 45, 1041–1048. doi: 10.1128/aem.45.3.1041-1048.1983
Anderson, L. G., and Amon, R. M. W. (2015). “DOM in the Arctic Ocean,” in Biogeochemistry of Marine Dissolved Organic Matter, 2nd Edn, eds D. A. Hansell and C. A. Carlson (Amsterdam: Elsevier), 609–633. doi: 10.1016/b978-0-12-405940-5.00014-5
Appen, W.-J., von, Schauer, U., Hattermann, T., and Beszczynska-Möller, A. (2016). Seasonal cycle of mesoscale instability of the West Spitsbergen Current. J. Phys. Oceanogr. 46, 1231–1254. doi: 10.1175/jpo-d-15-0184.1
Arrigo, K. R., Robinson, D. H., Worthen, D. L., Dunbar, R. B., DiTullio, G. R., VanWoert, M., et al. (1999). Phytoplankton community structure and the drawdown of nutrients and CO2 in the Southern Ocean. Science 283, 365–367. doi: 10.1126/science.283.5400.365
Baines, S. B., and Pace, M. L. (1991). The production of dissolved organic matter by phytoplankton and its importance to bacteria: patterns across marine and freshwater systems. Limnol. Oceanogr. 36, 1078–1090. doi: 10.4319/lo.1991.36.6.1078
Baltar, F., and Arístegui, J. (2017). Fronts at the surface ocean can shape distinct regions of microbial activity and community assemblages down to the bathypelagic zone: The Azores Front as a case study. Front. Mar. Sci. 4:252. doi: 10.3389/fmars.2017.0025
Basterretxea Oyarzabal, G., and Aristegui, J. (2000). Mesocale variability in phytoplakton biomass distribution and photosynthetic parameters in the Canary-NW African coestal transition zone. Mar. Ecol. Ser. 197, 27–40. doi: 10.3354/meps197027
Benner, R., and Kaiser, K. (2003). Abundance of amino sugars and peptidoglycan in marine particulate and dissolved organic matter. Limnol. Oceanogr. 48, 118–128. doi: 10.4319/lo.2003.48.1.0118
Bernardini, J.-J., Linget-Morice, C., Hoh, F., Collinson, S. K., Kyslík, P., Page, W. J., et al. (1996). Bacterial siderophores: structure elucidation, and 1 H, 13 C and 15 N two-dimensional NMR assignments of azoverdin and related siderophores synthesized by Azomonas macrocytogenes ATCC 12334. BioMetals 9, 107–120.
Beszczynska-Möller, A., Fahrbach, E., Schauer, U., and Hansen, E. (2012). Variability in Atlantic water temperature and transport at the entrance to the Arctic Ocean, 1997–2010. ICES J. Mar. Sci. 69, 852–863. doi: 10.1093/icesjms/fss056
Borchard, C., and Engel, A. (2015). Size-fractionated dissolved primary production and carbohydrate composition of the coccolithophore Emiliania huxleyi. Biogeosciences 12, 1271–1284. doi: 10.5194/bg-12-1271-2015
Borsheim, K. Y., Vadstein, O., Myklestad, S. M., Reinertsen, H., Kirkvold, S., and Olsen, Y. (2005). Photosynthetic algal production, accumulation and release of phytoplankton storage carbohydrates and bacterial production in a gradient in daily nutrient supply. J. Plankton Res. 27, 743–755. doi: 10.1093/plankt/fbi047
Brussaard, C. P. D. (2004). Viral control of phytoplankton populations—a review. J. Eukaryot. Microbiol. 51, 125–138. doi: 10.1111/j.1550-7408.2004.tb00537.x
Buitenhuis, E. T., Li, W. K. W., Lomas, M. W., Karl, D. M., Landry, M. R., and Jacquet, S. (2012). Picoheterotroph (Bacteria and Archaea) biomass distribution in the global ocean. Earth Syst. Sci. Data 4, 101–106. doi: 10.5194/essd-4-101-2012
Clayton, S., Nagai, T., and Follows, M. J. (2014). Fine scale phytoplankton community structure across the Kuroshio Front. J. Plankton Res. 36, 1017–1030. doi: 10.1093/plankt/fbu020
Cokelet, E. D., Tervalon, N., and Bellingham, J. G. (2008). Hydrography of the West Spitsbergen Current, Svalbard Branch: Autumn 2001. J. Geophys. Res. Ocean 113:C01006. doi: 10.1029/2007JC004150
Cottier, F., Tverberg, V., Inall, M., Svendsen, H., Nilsen, F., and Griffiths, C. (2005). Water mass modification in an Arctic fjord through cross-shelf exchange: the seasonal hydrography of Kongsfjorden, Svalbard. J. Geophys. Res. Ocean 110:C12005. doi: 10.1029/2004JC002757
Crump, B. C., Armbrust, E. V., and Baross, J. A. (1999). Phylogenetic analysis of particle-attached and free-living bacterial communities in the Columbia River, its estuary, and the adjacent coastal ocean. Appl. Environ. Microbiol. 65, 3192–3204. doi: 10.1128/aem.65.7.3192-3204.1999
Dauwe, B., and Middelburg, J. J. (1998). Amino acids and hexosamines as indicators of organic matter degradation state in North Sea sediments. Limnol. Oceanogr. 43, 782–798. doi: 10.4319/lo.1998.43.5.0782
Davis, J., Kaiser, K., and Benner, R. (2009). Amino acid and amino sugar yields and compositions as indicators of dissolved organic matter diagenesis. Organ. Geochem. 40, 343–352. doi: 10.1016/j.orggeochem.2008.12.003
de Steur, L., Hansen, E., Gerdes, R., Karcher, M., Fahrbach, E., and Holfort, J. (2009). Freshwater fluxes in the East Greenland current: a decade of observations. Geophys. Res. Lett 36:L23611. doi: 10.1029/2009GL041278
Demange, P., Bateman, A., Mertz, C., Dell, A., Piemont, Y., and Abdallah, M. A. (1990). Bacterial siderophores: structures of pyoverdins Pt, siderophores of Pseudomonas tolaasii NCPPB 2192, and pyoverdins Pf, siderophores of Pseudomonas fluorescens CCM 2798. Identification of an unusual natural amino acid. Biochemistry 29, 11041–11051. doi: 10.1021/bi00502a005
Dittmar, T., Cherrier, J., and Ludichowski, K. U. (2009). The analysis of amino acids in seawater. in Practical Guidelines for the Analysis of Seawater, ed. O. Wurl (Boca Raton, FL: CRC Press) 67–78.
Edler, L. (1979). Recommendations on Methods for Marine Biological Studies in the Baltic Sea. Phytoplankton and Chlorophyll. Sweden: University of Lund.
Eichinger, M., Kooijman, S., Sempéré, R., Lefèvre, D., Grégori, G., Charrière, B., et al. (2009). Consumption and release of dissolved organic carbon by marine bacteria in a pulsed-substrate environment: from experiments to modelling. Aquat. Microb. Ecol. 56, 41–54. doi: 10.3354/ame01312
Engel, A., Bracher, A., Dinter, T., Endres, S., Grosse, J., Metfies, K., et al. (2019). Inter-annual variability of organic carbon concentration in the Eastern Fram strait during summer (2009–2017). Front. Mar. Sci. 6:187. doi: 10.3389/fmars.2019.00187
Engel, A., and Galgani, L. (2016). The organic sea-surface microlayer in the upwelling region off the coast of Peru and potential implications for air–sea exchange processes. Biogeosciences (BG) 13, 989–1007. doi: 10.5194/bg-13-989-2016
Engel, A., and Haendel, N. (2011). A novel protocol for determining the concentration and composition of sugars in particulate and in high molecular weight dissolved organic matter (HMW-DOM) in seawater. Mar. Chem. 127, 180–191. doi: 10.1016/j.marchem.2011.09.004
Engel, A., Harlay, J., Piontek, J., and Chou, L. (2012). Contribution of combined carbohydrates to dissolved and particulate organic carbon after the spring bloom in the northern Bay of Biscay (North-Eastern Atlantic Ocean). Cont. Shelf Res. 45, 42–53. doi: 10.1016/j.csr.2012.05.016
Engel, A., Piontek, J., Metfies, K., Endres, S., Sprong, P., Peeken, I., et al. (2017). Inter-annual variability of transparent exopolymer particles in the Arctic Ocean reveals high sensitivity to ecosystem changes. Sci. Rep. 7, 1–9.
Evans, C. A., O’Reily, J. E., and Thomas, J. P. (1987). A Handbook for Measurement of Chlorophyll a and Primary Production. College Station, TX: Texas A&M University.
Fadeev, E., Salter, I., Schourup-Kristensen, V., Nöthig, E.-M., Metfies, K., Engel, A., et al. (2018). Microbial communities in the east and west fram strait during sea ice melting season. Front. Mar. Sci. 5:429. doi: 10.3389/fmars.2018.00429
Fadeev, E., Wietz, M., von Appen, W.-J., Nöthig, E.-M., Engel, A., Grosse, J., et al. (2020). Submesoscale dynamics directly shape bacterioplankton community structure in space and time. Biorxiv [Preprint]. doi: 10.1101/2020.09.02.279232
Fagerbakke, K. M., Heldal, M., and Norland, S. (1996). Content of carbon, nitrogen, oxygen, sulfur and phosphorus in native aquatic and cultured bacteria. Aquat. Microb. Ecol. 10, 15–27. doi: 10.3354/ame010015
Falkowski, P. G. (2000). Rationalizing elemental ratios in unicellular algae. J. Phycol. 36, 3–6. doi: 10.1046/j.1529-8817.2000.99161.x
Finkel, Z. V., Follows, M. J., Liefer, J. D., Brown, C. M., Benner, I., and Irwin, A. J. (2016). Phylogenetic diversity in the macromolecular composition of microalgae. PLoS One 11:e0155977. doi: 10.1371/journal.pone.0155977
Fukuda, R., Ogawa, H., Nagata, T., and Koike, I. (1998). Direct determination of carbon and nitrogen contents of natural bacterial assemblages in marine environments. Appl. Environ. Microbiol. 64, 3352–3358. doi: 10.1128/aem.64.9.3352-3358.1998
Geider, R. J., and LaRoche, J. (2002). Redfield revisited: variability of C:N:P in marine microalgae and its biochemical basis. Eur. J. Phycol 37, 1–17. doi: 10.1017/S0967026201003456
Giroldo, D., and Vieira, A. A. H. (2002). An extracellular sulfated fucose-rich polysaccharide produced by a tropical strain of Cryptomonas obovata (Cryptophyceae). J. Appl. Phycol. 14, 185–191.
Goldberg, S. J., Carlson, C. A., Hansell, D. A., Nelson, N. B., and Siegel, D. A. (2009). Temporal dynamics of dissolved combined neutral sugars and the quality of dissolved organic matter in the Northwestern Sargasso Sea. Deep. Res. Part I Oceanogr. Res. Pap. 56, 672–685. doi: 10.1016/j.dsr.2008.12.013
Granum, E., Kirkvold, S., and Myklestad, S. M. (2002). Cellular and extracellular production of carbohydrates and amino acids by the marine diatom Skeletonema costatum: diel variations and effects of N depletion. Mar. Ecol. Ser. 242, 83–94. doi: 10.3354/meps242083
Grasshoff, K., Kremling, K., and Ehrhardt, M. (2009). Methods of Seawater Analysis, 3th Edn. Hoboken, NJ: Wiley-VCH.
Grosse, J., Brussaard, C. P. D., and Boschker, H. T. S. (2018). Nutrient limitation driven dynamics of amino acids and fatty acids in coastal phytoplankton. Limnol. Oceanogr. 64, 302–316. doi: 10.1002/lno.11040
Grosse, J., van Breugel, P., Brussaard, C. P. D., and Boschker, H. T. S. (2017). A biosynthesis view on nutrient stress in coastal phytoplankton. Limnol. Oceanogr. 62, 490–506. doi: 10.1002/lno.10439
Hanby, W. E., and Rydon, H. N. (1946). The capsular substance of Bacillus anthracis: with an appendix by P. Bruce White. Biochem. J. 40, 297–309. doi: 10.1042/bj0400297
Hansell, D. A., Carlson, C. A., Repeta, D. J., and Schlitzer, R. (2009). Dissolved organic matter in the ocean: a controversy stimulates new insights. Oceanography 22, 202–211. doi: 10.5670/oceanog.2009.109
Hansell, D. A., Kadko, D., and Bates, N. R. (2004). Degradation of terrigenous dissolved organic carbon in the western Arctic Ocean. Science 304, 858–861. doi: 10.1126/science.1096175
Iversen, M. H., and Robert, M. L. (2015). Ballasting effects of smectite on aggregate formation and export from a natural plankton community. Mar. Chem. 175, 18–27. doi: 10.1016/j.marchem.2015.04.009
Janse, I., van Rijssel, M., van Hall, P. J., Gerwig, G. J., Gottschal, J. C., and Prins, R. A. (1996). The storage glucan of Phaeocystis globosa (prymnesiophyceae) cells. J. Phycol. 32, 382–387. doi: 10.1111/j.0022-3646.1996.00382.x
Kaiser, K., and Benner, R. (2008). Major bacterial contribution to the ocean reservoir of detrital organic carbon and nitrogen. Limnol. Oceanogr. 53, 99–112. doi: 10.4319/lo.2008.53.1.0099
Kaiser, K., and Benner, R. (2009). Biochemical composition and size distribution of organic matter at the Pacific and Atlantic time-series stations. Mar. Chem. 113, 63–77. doi: 10.1016/j.marchem.2008.12.004
Kaiser, K., Canedo-Oropeza, M., McMahon, R., and Amon, R. M. W. (2017). Origins and transformations of dissolved organic matter in large Arctic rivers. Sci. Rep. 7, 1–11.
Kattner, G., Lobbes, J. M., Fitznar, H. P., Engbrodt, R., Nöthig, E.-M., and Lara, R. J. (1999). Tracing dissolved organic substances and nutrients from the Lena River through Laptev Sea (Arctic). Mar. Chem. 65, 25–39. doi: 10.1016/s0304-4203(99)00008-0
Kawasaki, N., and Benner, R. (2006). Bacterial release of dissolved organic matter during cell growth and decline: molecular origin and composition. Limnol. Oceanogr. 51, 2170–2180. doi: 10.4319/lo.2006.51.5.2170
Kawasaki, N., Sohrin, R., Ogawa, H., Nagata, T., and Benner, R. (2011). Bacterial carbon content and the living and detrital bacterial contributions to suspended particulate organic carbon in the North Pacific Ocean. Aquat. Microb. Ecol. 62, 165–176. doi: 10.3354/ame01462
Kirchman, D. L., Meon, B., Ducklow, H. W., Carlson, C. A., Hansell, D. A., and Steward, G. F. (2001). Glucose fluxes and concentrations of dissolved combined neutral sugars (polysaccharides) in the Ross Sea and Polar Front Zone, Antarctica. Deep Sea Res. Part II Top. Stud. Oceanogr. 48, 4179–4197. doi: 10.1016/s0967-0645(01)00085-6
Kroth, P. G., Chiovitti, A., Gruber, A., Martin-Jezequel, V., Mock, T., Parker, M. S., et al. (2008). A model for carbohydrate metabolism in the diatom Phaeodactylum tricornutum deduced from comparative whole genome analysis. PLoS One 3:e1426. doi: 10.1371/journal.pone.0001426
Kudo, F., Kawabe, K., Kuriki, H., Eguchi, T., and Kakinuma, K. (2005). A new family of glucose-1-phosphate/glucosamine-1-phosphate nucleotidylyltransferase in the biosynthetic pathways for antibiotics. J. Am. Chem. Soc. 127, 1711–1718. doi: 10.1021/ja044921b
Lê, S., Josse, J., and Husson, F. (2008). FactoMineR: An r package for multivariate analysis. J. Stat. Softw. 25, 1–18.
Lindroth, P., and Mopper, K. (1979). High performance liquid chromatographic determination of subpicomole amounts of amino acids by precolumn fluorescence derivatization with o-phthaldialdehyde. Anal. Chem. 51, 1667–1674. doi: 10.1021/ac50047a019
Luo, Y. W., Friedrichs, M. A. M., Doney, S. C., Church, M. J., and Ducklow, H. W. (2010). Oceanic heterotrophic bacterial nutrition by semilabile DOM as revealed by data assimilative modeling. Aquat. Microb. Ecol. 60, 273–287. doi: 10.3354/ame01427
Marañón, E., Cermeño, P., Fernández, E., Rodríguez, J., and Zabala, L. (2004). Significance and mechanisms of photosynthetic production of dissolved organic carbon in a coastal eutrophic ecosystem. Limnol. Oceanogr. 49, 1652–1666. doi: 10.4319/lo.2004.49.5.1652
Markou, G., Angelidaki, I., and Georgakakis, D. (2012). Microalgal carbohydrates: an overview of the factors influencing carbohydrates production, and of main bioconversion technologies for production of biofuels. Appl. Microbiol. Biotechnol. 96, 631–645. doi: 10.1007/s00253-012-4398-0
Martinez, J. S., Zhang, G. P., Holt, P. D., Jung, H.-T., Carrano, C. J., Haygood, M. G., et al. (2000). Self-assembling amphiphilic siderophores from marine bacteria. Science 287, 1245–1247. doi: 10.1126/science.287.5456.1245
Masuda, K., Guo, X.-F., Uryu, N., Hagiwara, T., and Watabe, S. (2008). Isolation of marine yeasts collected from the Pacific Ocean showing a high production of $γ$-aminobutyric acid. Biosci. Biotechnol. Biochem 72, 3265–3272. doi: 10.1271/bbb.80544
Morikawa, M., Daido, H., Takao, T., Murata, S., Shimonishi, Y., and Imanaka, T. (1993). A new lipopeptide biosurfactant produced by Arthrobacter sp. strain MIS38. J. Bacteriol. 175, 6459–6466. doi: 10.1128/jb.175.20.6459-6466.1993
Morse, D. E., Duncan, H., Hooker, N., Baloun, A., and Young, G. (1980). GABA induces behavioral and developmental metamorphosis in planktonic molluscan larvae. Fed. Proc. 39, 3237–3241.
Nöthig, E.-M., Ramondenc, S., Haas, A., Hehemann, L., Walter, A., Bracher, A., et al. (2020). Summertime chlorophyll a and particulate organic carbon standing stocks in surface waters of the Fram Strait and the Arctic Ocean (1991–2015). Front. Mar. Sci 7:350. doi: 10.3389/fmars.2020.00350
Ogawa, H., Amagai, Y., Koike, I., Kaiser, K., and Benner, R. (2001). Production of refractory dissolved organic matter by bacteria. Science 292, 917L—-920. doi: 10.1126/science.1057627
Pakulski, J. D., and Benner, R. (1992). An improved method for the hydrolysis and MBTH analysis of dissolved and particulate carbohydrates in seawater. Mar. Chem. 40, 143–160. doi: 10.1016/0304-4203(92)90020-b
Panagiotopoulos, C., Sempéré, R., Jacq, V., and Charrière, B. (2014). Composition and distribution of dissolved carbohydrates in the Beaufort Sea Mackenzie margin (Arctic Ocean). Mar. Chem. 166, 92–102. doi: 10.1016/j.marchem.2014.09.004
Paquette, R. G., Bourke, R. H., Newton, J. F., and Perdue, W. F. (1985). The East Greenland polar front in autumn. J. Geophys. Res. Ocean. 90, 4866–4882. doi: 10.1029/jc090ic03p04866
Passow, U. (2002). Transparent exopolymer particles (TEP) in aquatic environments. Prog Oceanogr. 55, 287–333. doi: 10.1016/s0079-6611(02)00138-6
Passow, U., and Alldredge, A. L. (1995). A dye-binding assay for the spectrophotometric measurement of transparent exopolymer particles (TEP). Limnol. Oceanogr. 40, 1326–1335. doi: 10.4319/lo.1995.40.7.1326
Passow, U., and Wassmann, P. (1994). On the trophic fate of Phaeocystis pouchetii (Hariot): IV. The formation of marine snow by P. pouchetii. Mar. Ecol. Prog. Ser 104, 153–161. doi: 10.3354/meps104153
Pernthaler, J., Glöckner, F.-O., Unterholzner, S., Alfreider, A., Psenner, R., and Amann, R. (1998). Seasonal community and population dynamics of pelagic bacteria and archaea in a high mountain lake. Appl. Environ. Microbiol. 64, 4299–4306. doi: 10.1128/aem.64.11.4299-4306.1998
R Development Core Team (2014). R: A Language and Environment for Statistical Computing. Vienna: R Foundation Statistical Computing.
Redfield, A. C., Ketchum, B. A. H., and Richards, F. A. (1963). “The influence of organisms on the composition of sea-water,” in The Sea, ed. M. N. Hill (New York, NY: John Wiley), 26–77.
Reigstad, M., and Wassmann, P. (2007). “Does Phaeocystis spp. contribute significantly to vertical export of organic carbon?,” in Phaeocystis, Major Link in the Biogeochemical Cycling of Climate-Relevant Elements, eds M. A. van Leeuwe, J. Stefels, S. Belviso, C. Lancelot, P. G. Verity, and W. W. C. Gieskes (Dordrecht: Springer), 217–234. doi: 10.1007/s10533-007-9093-3
Saba, G. K., Steinberg, D. K., and Bronk, D. A. (2011). The relative importance of sloppy feeding, excretion, and fecal pellet leaching in the release of dissolved carbon and nitrogen by Acartia tonsa copepods. J. Exp. Mar. Biol.Ecol. 404, 47–56. doi: 10.1016/j.jembe.2011.04.013
Schleifer, K. H., and Kandler, O. (1972). Peptidoglycan types of bacterial cell walls and their taxonomic implications. Bacteriol. Rev. 36:407. doi: 10.1128/mmbr.36.4.407-477.1972
Sharp, J. H. (1974). Improved analysis for particulate organic carbon and nitrogen from seawater. Limnol. Oceanogr. 19, 984–989. doi: 10.4319/lo.1974.19.6.0984
Simon, M., and Azam, F. (1989). Protein-content and protein-synthesis rates of planktonic marine-bacteria. Mar. Ecol. Ser. 51, 201–213. doi: 10.3354/meps051201
Søndergaard, M., Williams, P. J., Le, B., Cauwet, G., Riemann, B., Robinson, C., et al. (2000). Net accumulation and flux of dissolved organic carbon and dissolved organic nitrogen in marine plankton communities. Limnol. Oceanogr 45, 1097–1111. doi: 10.4319/lo.2000.45.5.1097
Spreen, G., Kaleschke, L., and Heygster, G. (2008). Sea ice remote sensing using AMSR-E 89-GHz channels. J. Geophys. Res. Ocean 113. doi: 10.1029/2005JC003384
Sugimura, Y., and Suzuki, Y. (1988). A high-temperature catalytic oxidation method for the determination of non-volatile dissolved organic carbon in seawater by direct injection of a liquid sample. Mar. Chem. 24, 105–131. doi: 10.1016/0304-4203(88)90043-6
Thomsen, S., Kanzow, T., Colas, F., Echevin, V., Krahmann, G., and Engel, A. (2016). Do submesoscale frontal processes ventilate the oxygen minimum zone off Peru? Geophys. Res. Lett. 43, 8133–8142. doi: 10.1002/2016gl070548
Thornton, D. C. (2014). Dissolved organic matter (DOM) release by phytoplankton in the contemporary and future ocean. Eur. J. Phycol. 49, 20–46. doi: 10.1080/09670262.2013.875596
Trefzer, A., Bechthold, A., and Salas, J. A. (1999). Genes and enzymes involved in deoxysugar biosynthesis in bacteria. Nat. Prod. Rep. 16, 283–299. doi: 10.1039/a804431g
Tripp, H. J., Schwalbach, M. S., Meyer, M. M., Kitner, J. B., Breaker, R. R., and Giovannoni, S. J. (2009). Unique glycine-activated riboswitch linked to glycine–serine auxotrophy in SAR11. Environ. Microbiol. 11, 230–238. doi: 10.1111/j.1462-2920.2008.01758.x
Troy, F. A. (1973). Chemistry and Biosynthesis of the Poly (γ-d-glutamyl) Capsule in Bacillus licheniformis I. Properties of the membran-mediated biosynthetic reaction. J. Biol. Chem. 248, 305–315. doi: 10.1016/s0021-9258(19)44475-x
Vater, J., Kablitz, B., Wilde, C., Franke, P., Mehta, N., and Cameotra, S. S. (2002). Matrix-assisted laser desorption ionization-time of flight mass spectrometry of lipopeptide biosurfactants in whole cells and culture filtrates of Bacillus subtilis C-1 isolated from petroleum sludge. Appl. Environ. Microbiol. 68, 6210–6219. doi: 10.1128/aem.68.12.6210-6219.2002
Veuger, B., van Oevelen, D., and Middelburg, J. J. (2012). Fate of microbial nitrogen, carbon, hydrolysable amino acids, monosaccharides, and fatty acids in sediment. Geochim. Cosmochim. Acta 83, 217–233. doi: 10.1016/j.gca.2011.12.016
von Appen, W., Wekerle, C., Hehemann, L., Schourup-Kristensen, V., Konrad, C., and Iversen, M. H. (2018). Observations of a submesoscale cyclonic filament in the marginal ice zone. Geophys. Res. Lett 45, 6141–6149.
von Appen, W.-J., and Rohardt, G. (2018). Physical Oceanography During Polarstern Cruise PS99.2 (ARK-XXX/1.2). Bremerhaven: Alfred Wegener Institute, Helmholtz Centre for Polar and Marine Research PANGAEA. doi: 10.1594/PANGAEA.894189
Wekerle, C., Wang, Q., von Appen, W., Danilov, S., Schourup-Kristensen, V., and Jung, T. (2017). Eddy-resolving simulation of the Atlantic water circulation in the Fram Strait with focus on the seasonal cycle. J. Geophys. Res. Ocean 122, 8385–8405. doi: 10.1002/2017jc012974
Keywords: Arctic Ocean, organic matter cycling, microbial loop, organic carbon, essential amino acids, neutral sugars, particulate matter size fraction
Citation: Grosse J, Nöthig E-M, Torres-Valdés S and Engel A (2021) Summertime Amino Acid and Carbohydrate Patterns in Particulate and Dissolved Organic Carbon Across Fram Strait. Front. Mar. Sci. 8:684675. doi: 10.3389/fmars.2021.684675
Received: 23 March 2021; Accepted: 09 June 2021;
Published: 01 July 2021.
Edited by:
X. Antón Álvarez-Salgado, Consejo Superior de Investigaciones Científicas (CSIC), SpainReviewed by:
Christos Panagiotopoulos, Aix-Marseille Université, FranceDaniel Conrad Ogilvie Thornton, Texas A&M University, United States
Copyright © 2021 Grosse, Nöthig, Torres-Valdés and Engel. This is an open-access article distributed under the terms of the Creative Commons Attribution License (CC BY). The use, distribution or reproduction in other forums is permitted, provided the original author(s) and the copyright owner(s) are credited and that the original publication in this journal is cited, in accordance with accepted academic practice. No use, distribution or reproduction is permitted which does not comply with these terms.
*Correspondence: Anja Engel, YWVuZ2VsQGdlb21hci5kZQ==